


Languages
Pages
Legal


8/12/2019 ALSN Investor Relations Presentation - First Quarter 2014
http://slidepdf.com/reader/full/alsn-investor-relations-presentation-first-quarter-2014 1/37
Investor Relations PresentationFirst Quarter 2014 (Published May 2, 2014)

8/12/2019 ALSN Investor Relations Presentation - First Quarter 2014
http://slidepdf.com/reader/full/alsn-investor-relations-presentation-first-quarter-2014 2/37
2
Safe Harbor StatementThe following information contains, or may be deemed to contain, “forward-looking statements” (as defined in the U.S. PrivateSecurities Litigation Reform Act of 1995). The words “believe,” “expect,” “anticipate,” “intend,” “estimate” and other expressions that arepredictions of or indicate future events and trends and that do not relate to historical matters identify forward-looking statements. Youshould not place undue reliance on these forward-looking statements. Although forward-looking statements reflect management’s good faith beliefs, reliance should not be placed on forward-looking statements because they involve known and unknown risks,
uncertainties and other factors, which may cause the actual results, performance or achievements to differ materially from anticipatedfuture results, performance or achievements expressed or implied by such forward-looking statements. Forward-looking statementsspeak only as of the date the statements are made. We undertake no obligation to publicly update or revise any forward-lookingstatement, whether as a result of new information, future events, changed circumstances or otherwise. These forward-lookingstatements are subject to numerous risks and uncertainties, including, but not limited to: risks related to our substantial indebtedness;our participation in markets that are competitive; the highly cyclical industries in which certain of our end users operate; the failure ofmarkets outside North America to increase adoption of fully-automatic transmissions; the concentration of our net sales in our top fivecustomers and the loss of any one of these; future reductions or changes in government subsidies for hybrid vehicles; U.S. defensespending; general economic and industry conditions; the discovery of defects in our products, resulting in delays in new model
launches, recall campaigns and/or increased warranty costs and reduction in future sales or damage to our brand and reputation; ourability to prepare for, respond to and successfully achieve our objectives relating to technological and market developments andchanging customer needs; risks associated with our international operations; and labor strikes, work stoppages or similar labordisputes, which could significantly disrupt our operations or those of our principal customers.
Allison Transmission cannot assure you that the assumptions made in preparing any of the forward-looking statements will prove accurate or that any long-term financial goals will be realized. All forward-looking statements included inthis presentation speak only as of the date made, and Allison Transmission undertakes no obligation to update or revise publicly anysuch forward-looking statements, whether as a result of new information, future events, or otherwise. In particular, AllisonTransmission cautions you not to place undue weight on certain forward-looking statements pertaining to potential growth
opportunities, long-term financial goals or the value we currently ascribe to certain tax attributes set forth herein. Actual results mayvary significantly from these statements.
Allison Transmission’s business is subject to numerous risks and uncertainties, which may cause future results of operations to varysignificantly from those presented herein. Important factors that could cause actual results to differ materially are discussed in AllisonTransmission’s Annual Report on Form 10-K for the year ended December 31, 2013.

8/12/2019 ALSN Investor Relations Presentation - First Quarter 2014
http://slidepdf.com/reader/full/alsn-investor-relations-presentation-first-quarter-2014 3/37
Business Overview

8/12/2019 ALSN Investor Relations Presentation - First Quarter 2014
http://slidepdf.com/reader/full/alsn-investor-relations-presentation-first-quarter-2014 4/37

8/12/2019 ALSN Investor Relations Presentation - First Quarter 2014
http://slidepdf.com/reader/full/alsn-investor-relations-presentation-first-quarter-2014 5/37
Allison Key Financial Highlights
5
$544 $501
$617$712 $717
$633 $655
26.4%28.4%
32.0% 32.9% 33.5% 32.8% 33.4%
4.5% 2.8%
14.2% 14.1%17.6% 18.1% 19.2%
9.4% 8.0%
16.4% 17.2% 18.8% 20.0% 21.8%
2008 2009 2010 2011 2012 2013 LTM
Adj. EBITDA Adj. EBITDA Margin
Adj. NI Margin Adj. Free Cash Flow (% of Net Sales)
Strong Financial Profile
($ in millions)
Strong, sustainable operating margins
Low capital expenditure requirements
Minimal cash income taxes / valuable U.S. tax shield ($0.8-$0.9bn present value)
Positioned for long-term cash earnings growth
Note: See appendix for comments regarding the presentation of non-GAAP financial information.(1) Adjusted EBITDA and Adjusted EBITDA Margin excluding technology-related license expenses: 2012 of $12 million, 2013 of $6 million
and LTM 3/31/14 of $3 million.
(1) (1) (1)

8/12/2019 ALSN Investor Relations Presentation - First Quarter 2014
http://slidepdf.com/reader/full/alsn-investor-relations-presentation-first-quarter-2014 6/37
Allison Is a Premier Industrial Asset
6
Premier Brand and End User Value Proposition
Technology Leadership - The Allison Advantage
Diverse End Markets with Long-Standing OEM Customer Relationships
Strong Cash Flow Generation with Well-Defined Capital Allocation Policy
Experienced Management Team
Global Market Leader
Multiple Organic Growth Opportunities

8/12/2019 ALSN Investor Relations Presentation - First Quarter 2014
http://slidepdf.com/reader/full/alsn-investor-relations-presentation-first-quarter-2014 7/37
Global Market Leader
7
52% 56%
75%
8%
93%
68%
7%
44%32%
92%
25%
48%
100%
School Bus Motorhome Class 6-7 Truck Class 8Straight Truck
Hybrid Bus Class 8 Metro
Allison AMT, Manual, Other Automatics
Global On-Highway Fully-Automatic Share(1) North American Market Share(1)
The “de facto” standard in medium- and heavy-duty applications
– Well established as standard in North America
Increasing presence in emerging markets which today are predominantly manual
Virtually no exposure to more cyclical Class 8 line-haul tractors
Allison~61%
Other (2)
~39%
(1) 2013 Units. Source: Allison and ACT Research.(2) Majority of “Other” volume is in North American Class 4-5 truck and European bus.
Allison’s Core Addressable Market Expansion Market

8/12/2019 ALSN Investor Relations Presentation - First Quarter 2014
http://slidepdf.com/reader/full/alsn-investor-relations-presentation-first-quarter-2014 8/37
Allison Is a Recognized and Respected Brand
8
The Allison brand is associated with:
– High Quality
– Reliability
– Durability
– Vocational Value and Expertise
– Technological Leadership
– Superior Customer Service
– Attractive Total Lifecycle Value
95+ year history of providing high-
quality innovative products anddemonstrated value to end users
End Users Frequently Request Allison Transmissions by Name and Pay a Premium for Them
8/12/2019 ALSN Investor Relations Presentation - First Quarter 2014
http://slidepdf.com/reader/full/alsn-investor-relations-presentation-first-quarter-2014 9/37
End User Value Proposition
9
Allison Advantage
Productivity (acceleration)
Maintenance Savings (life cyclecosts)
Fuel Efficiency
Driver Skillset / Wages
Training (time, cost)
Shift Quality
Safety
Residual Value
Low
High
Included in Vehicle Price $3,000 - $7,000 $3,000 - $11,000
ManualTransmission
AutomatedManual
Transmission(AMT)
Allison
(Fully-Automatic)
End Users are Willing to Pay a Premium Price for Allison
RelativeCustomer
Value

8/12/2019 ALSN Investor Relations Presentation - First Quarter 2014
http://slidepdf.com/reader/full/alsn-investor-relations-presentation-first-quarter-2014 10/37
Technology Leadership – The Allison Advantage
10
GeneratingPull-Through
Demand
Lower Vehicle Life Cycle Costs
Superior Performance
Allison Advantage
Proprietary and patentedtechnology developed over many
decades and 6.0 million units
Technology Differentiators
Allison Advantage
Properly Matched to Selected Engine
Optimized for Intended Vocation
Al l ison transmiss ions employ c omp lex software algori thms that are indiv idual ly tai lored to maximize
end user performance in thousands o f vocat ional duty cycles
CustomerBenefits
Engine &Vocation
Optimized
SuperiorTechnology

8/12/2019 ALSN Investor Relations Presentation - First Quarter 2014
http://slidepdf.com/reader/full/alsn-investor-relations-presentation-first-quarter-2014 11/37
End Market & Vocation Overview
11
North America Hybrid Transit BusGlobal Off-Highway
Distribution
Emergency
Vehicle
Motorhome
Rugged Duty
School Bus /Shuttle Bus
Transit Bus
British Airport Authority
Beijing CityTransit
New DelhiTransit
Defense
Select End Users
Select End Users Select End Users
Parts, Support Equipment andOther
Global On-Highway
Sample Vocations Select End Users

8/12/2019 ALSN Investor Relations Presentation - First Quarter 2014
http://slidepdf.com/reader/full/alsn-investor-relations-presentation-first-quarter-2014 12/37
OEMs Rely on Allison for Fully-Automatic Transmissions
12
N o r t h A m e r i c a
O u
t s i d e N o r t h A m e r i c a
D e f e n s e
HybridTransit Bus
Off-Highway
On-Highway
Off-Highway
Medium- andHeavy-Tactical
On-Highway
U.S. Government
Over 45 Year Relationship with Many Industry-Leading OEMs

8/12/2019 ALSN Investor Relations Presentation - First Quarter 2014
http://slidepdf.com/reader/full/alsn-investor-relations-presentation-first-quarter-2014 13/37
2008
Today
2014 (1)
Net Sales
Adj. EBITDA
% Margin
Adj. Net Income
$2,061mm
$544mm
26.4%
$93mm
$1,963mm
$655mm
33.4%
$376mm
(4.8%)
+20.4%
+700bps
+304.3%
Despite 2009 cyclical low industryvolumes, significant improvement inEBITDA margin and Adjusted NetIncome
Employees
UAW Contract
UAW WageStructure
3,300
Part of GM
Single-Tier
2,700
Allison Only
Multi-Tier
(18.2%) 2009 Hourly buyout plan reducedheadcount by ~25%, positioning thecompany to replace Tier I with Multi-Tier workers and realize operatingleverage
Technology Focus Enhance ExistingProducts
New, More FuelEfficient Technologies
Investing in the development of nextgeneration technologies
Premier Industrial Asset Financial Profile
13
Net Debt Reduct ion of More Than $ 1.68 (2)
Bi l l ion Since Acquis i t ion in Aug ust 2007
Note: See appendix for comments regarding the presentation of non-GAAP financial information.(1) LTM 3/31/14 Adjusted EBITDA and Adjusted EBITDA Margin excluding technology-related license expenses of $3 million.(2) Represents Net Debt reduction through 3/31/2014.

8/12/2019 ALSN Investor Relations Presentation - First Quarter 2014
http://slidepdf.com/reader/full/alsn-investor-relations-presentation-first-quarter-2014 14/37
10%
15%
20%
25%
30%
35%
Gentex Roper Graco Sensata Pall Rockwell Donaldson ParkerHannifin
WABCO Cummins Eaton
Premier Industrial Asset
14
EBITDA Margin(1)
(2)
See appendix for comments regarding the presentation of non-GAAP financial information.
(1) The LTM period and LTM EBITDA, which excludes non-recurring or one-time items as designated by each entity, are based on information available in theentity’s most recent quarterly or annual report as of 3/31/2014. EBITDA included above may not be consistent with such entity’s reported EBITDA or AdjustedEBITDA, if available.
(2) Represents Adjusted LTM EBITDA excluding technology-related license expenses.

8/12/2019 ALSN Investor Relations Presentation - First Quarter 2014
http://slidepdf.com/reader/full/alsn-investor-relations-presentation-first-quarter-2014 15/37
Multiple Organic Growth Opportunities
15
Benefit from Developed Markets Recovery
Increase Penetration of Fully Automatic Transmissions
Accelerate Adoption in Emerging Markets
Capitalize on Rising Demand for Energy and Commodities
Continue New Technology and Product Development
Increase Share in Underserved Markets

8/12/2019 ALSN Investor Relations Presentation - First Quarter 2014
http://slidepdf.com/reader/full/alsn-investor-relations-presentation-first-quarter-2014 16/37
Allison Transmission at a Glance
16
319309
295
271264
235
178
151
337
262
427
M i n
( 2 0 0
8 ) A v
g .
M a x
( 2 0 0
6 ) 2 0
0 9 2 0
1 0 2 0
1 1 2 0
1 2 2 0
1 3
2 0 1 4
e
2 0 1 5
e
2 0 1 6
e
North America Production in Allison’s Core
Addressable Market (units in 000s)(2) Growth opportunity driven by continued
cyclical recovery in core North American
market (~44% of LTM(1) total sales)
Production has rebounded from cyclical
lows with further growth fueled by pick-
up in economic activity
— Housing recovery and increased construction
activity drives greater demand for medium
and heavy duty trucks
Allison’s growth is also supported by
— Pent up demand from deferred purchases
— Continued demand for fuel efficient vehicles
(1) LTM 3/31/14.(2) Source: ACT Research, April 2014. Includes: Class 4 thru 8 less Class 8 Line Haul & Class 8 Straight with Sleeper.
2014e: Total 508,055 less Class 8 Line Haul of 211,022 less Class 8 Straight with Sleeper of 2,206.
1999 – 2008
10 Yr Average

8/12/2019 ALSN Investor Relations Presentation - First Quarter 2014
http://slidepdf.com/reader/full/alsn-investor-relations-presentation-first-quarter-2014 17/37
Increased Penetration of Fully – Automatic Transmissions
17
77%
23%
Fully-
Automatic
Other
Global Penetration of Fully-Automatic Transmissions
Outside-North America(2)
North America(1)
Low penetration in markets
outside North Americapresents a significant growthopportunity
Ongoing need for productivityimprovements
― Better acceleration and trip times allowincreased miles and revenue
― Improved fuel efficiency as a function of workperformed
― More vehicle uptime
Focus on reducing life-cycle costs
― Lower maintenance expense
― Improved fuel efficiency
― Increased vehicle residual value
Micro / demographic trends
― Easier to operate – increases pool of qualified
drivers
― Less driver training and turnover
― Safety factors
5%
95%
Other
Fully-
Automatic
Since our first transmissionover 60yrs ago, we havedriven the trend towardsincreasing automaticity bytargeting a diverse range ofcommercial vehiclevocations
Source: Allison.(1) Includes Class 4-7 trucks, Class 8 straight trucks, buses (school, conventional transit, shuttle and coach) and motorhomes.(2) Includes medium- and heavy-duty commercial vehicles.

8/12/2019 ALSN Investor Relations Presentation - First Quarter 2014
http://slidepdf.com/reader/full/alsn-investor-relations-presentation-first-quarter-2014 18/37
Increasing Adoption in Emerging Markets – China Case Study
18
Allison’s China Truck Vocational Focus
Fire and Emergency
Oil Field Crane Carrier Construction / Dump
Airport Services
Refuse
Allison is the #1 supplier of fully-
automatic transmissions in China as a
result of targeting specific vocations
― Substantial installed base of over 54,000transmissions in China
― Secular growth due to low penetration
Allison’s existing bus presence serves as
entry point for incremental penetration
Significant growth opportunities by
targeting a wide range of vocational
applications
― Government emphasis on equipment
modernization for mining, rescue operations,school buses and other applications
― Construction and oil field sector
Terminal Tractor
2004 - 2006 2007 - 2009 2010+
106
17 22
53
92
72
2008 2009 2010 2011 2012 2013
Allison’s Cumulative China Truck OEM Releases(1)
(1) Source: Allison.

8/12/2019 ALSN Investor Relations Presentation - First Quarter 2014
http://slidepdf.com/reader/full/alsn-investor-relations-presentation-first-quarter-2014 19/37
Global Off-Highway Growth Opportunities
19
Mining and Construction
― NA, Europe, Middle East, Africa and China
― Increasing global demand for commodities
― Increasing urbanization in emerging markets
― 2% of LTM total sales(1)(2)
(1) LTM 3/31/14.(2) Excluding replacement parts and support equipment.
Energy Sectors
― Considerable end market cyclicality
― Multiple opportunities in exploration, fracturing andoil and gas support
― Currently at trough levels
― 5% of LTM total sales(1)(2)
LTM(1) Allison Global Off-Highway Sales
Outside-NA Energy25%
Outside-NA Hauling16%
NA Hauling1%
NA Energy19%
LTM(1) Global Off-Highway Sales: $214 million (11% of total sales)
Parts, Support
Equipment andOther39%
Hydraulic Fracturing Activity
Total Recoverable Shale Gas(3)Current Activity(2)
(2) Source: Spears & Associates, June 2012.(3) Source: U.S. Energy Information Administration, June 2013.
ROW13%
NA87%
ROW76%
NA24%

8/12/2019 ALSN Investor Relations Presentation - First Quarter 2014
http://slidepdf.com/reader/full/alsn-investor-relations-presentation-first-quarter-2014 20/37
New Product and Technology Development
20
Hybrid Commercial Vehicle TransmissionClass 8 Metro
Ten-speed fully-automatic transmission targeted atClass 8 tractors serving urban markets
– Addressable market size of ~60k units
– Historically a “manual” market underserved by Allison’s fully-automatic product portfolio
Available at Navistar; initial deliveries second quarter
2014
Leading development of first fully-automatic hybrid trucktransmission for the Class 6-7 market
Awarded $63 million U.S. Department of Energy cost-share grant for hybrid development
– Fuel economy improvements of ~25%-35%
– Target Vocations: Refuse, Pick-Up &Delivery/Distribution, Utility and Shuttle Bus
Average Annual Spend over $110 Million in Product-Related
Research and Development Since Acquisition in August 2007
2600 Horsepower Hydraulic Fracturing TransmissionFuelSense®
New on-highway product features that automaticallyadapt shift schedules and torque, maximizing
transmission efficiency based on load, grade and dutycycle, without sacrificing Allison advantages – superiorperformance and Continuous Power Technology™
Enabled by 5th Generation Electronic Controls: improvefuel economy in any application, accelerationmanagement, precision inclinometer, advanceddiagnostic and prognostic displays
New 9826 Oil Field Series (OFS) model based on sixdecades of industry expertise
Addresses global market demand for higherhorsepower, extended duty cycles, lower days-to-depth,higher recovery factors
Also announced enhancements to existing 9800 OFSmodels
8/12/2019 ALSN Investor Relations Presentation - First Quarter 2014
http://slidepdf.com/reader/full/alsn-investor-relations-presentation-first-quarter-2014 21/37
Allison Transmission at a Glance
21
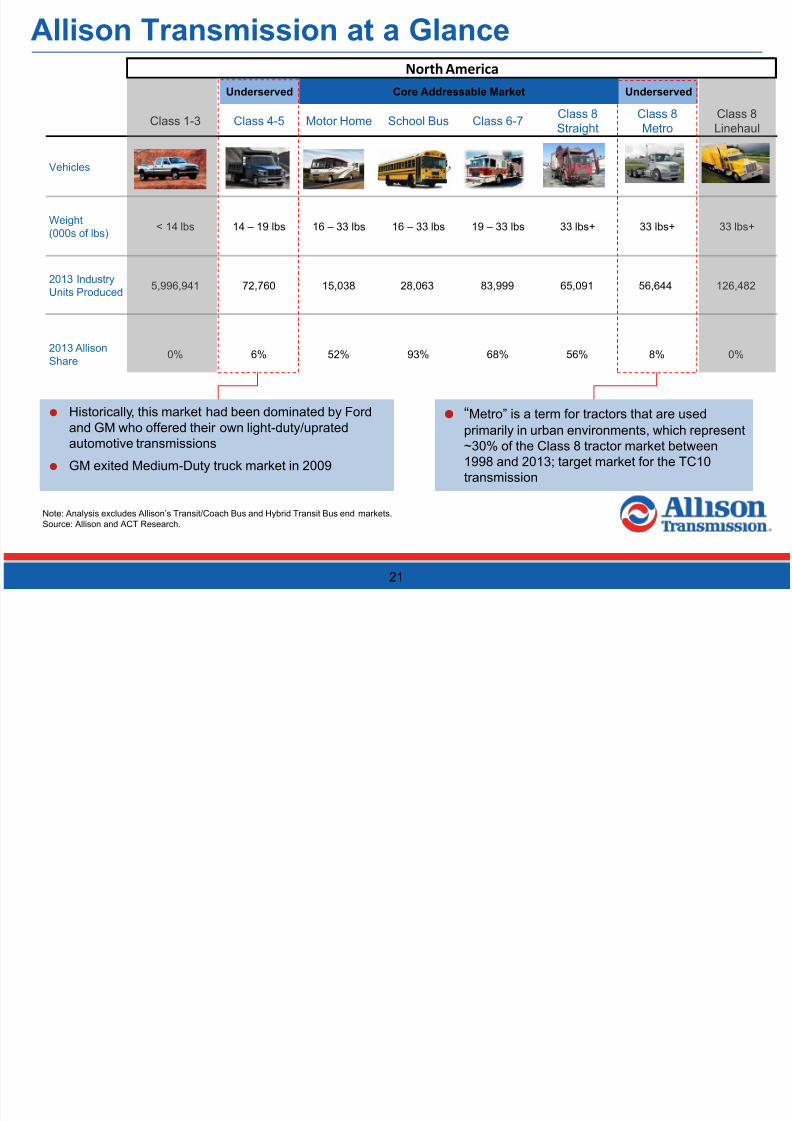
Class 1-3 Class 4-5 Motor Home School Bus Class 6-7Class 8Straight
Class 8Metro
Class 8Linehaul
Vehicles
Weight(000s of lbs)
< 14 lbs 14 – 19 lbs 16 – 33 lbs 16 – 33 lbs 19 – 33 lbs 33 lbs+ 33 lbs+ 33 lbs+
2013 IndustryUnits Produced
5,996,941 72,760 15,038 28,063 83,999 65,091 56,644 126,482
2013 AllisonShare
0% 6% 52% 93% 68% 56% 8% 0%
Underserved Core Addressable Market Underserved
North America
Historically, this market had been dominated by Fordand GM who offered their own light-duty/upratedautomotive transmissions
GM exited Medium-Duty truck market in 2009
“Metro” is a term for tractors that are usedprimarily in urban environments, which represent~30% of the Class 8 tractor market between1998 and 2013; target market for the TC10transmission
Note: Analysis excludes Allison’s Transit/Coach Bus and Hybrid Transit Bus end markets. Source: Allison and ACT Research.

8/12/2019 ALSN Investor Relations Presentation - First Quarter 2014
http://slidepdf.com/reader/full/alsn-investor-relations-presentation-first-quarter-2014 22/37
Financial Overview

8/12/2019 ALSN Investor Relations Presentation - First Quarter 2014
http://slidepdf.com/reader/full/alsn-investor-relations-presentation-first-quarter-2014 23/37
3.7%
33.4%
44.1%
19.2%
0.2%
21.8%
Cash IncomeTaxes (% of Net
Sales)
Capex (% of Net
Sales)
Adj Net IncomeMargin
Adj. Free CashFlow (% of Net
Sales)
Adj. EBITDAMargin
Gross Margin
Allison Financial Highlights
23
Sustainable operating margins with furtherenhancement opportunities
— End markets diversity
— Premium vocational pricing model
— Cost controls and productivity improvements
— Multi-Tier UAW wage and benefits structure
Low capital expenditure requirements
Minimal cash income taxes / valuable U.S. tax shield($0.8-$0.9bn present value)
Positioned for long-term cash earnings growth
— Multiple growth opportunities
— De-leveraging
Strong free cash flow supports $0.12 per sharequarterly dividend, up from $0.06 per share at timeof March 2012 IPO
LTM(1) Financial Metrics
Note: See appendix for comments regarding the presentation of non-GAAP financial information.(1) LTM 3/31/14.(2) Excluding technology-related license expenses of $3 million.(3) 3.3% excluding Outside-North America manufacturing expansion and new products related.
(2)
(3)

8/12/2019 ALSN Investor Relations Presentation - First Quarter 2014
http://slidepdf.com/reader/full/alsn-investor-relations-presentation-first-quarter-2014 24/37
24
Allison Quarterly Sales Summary
2014
Net Sales Q1 Q2 Q3 Q4 Q1 Q2 Q3 Q4 Q1
NA On-Highway $219 $217 $189 $188 $188 $216 $212 $210 $233
NA Hybrid Transit Bus 35 18 30 32 31 27 15 32 24
NA Off-Highway 74 44 22 17 8 8 9 14 12
Defense 77 80 74 74 57 58 52 35 34
ONA On-Highway 66 78 73 73 62 75 70 86 64
ONA Off-Highway 32 30 22 30 21 36 16 14 21
Parts, Support Equipment & Other 99 92 84 73 90 92 92 100 106
Total Net Sales $602 $559 $494 $487 $457 $512 $466 $491 $494
2014
Variance - Year over Year Q1 Q2 Q3 Q4 Q1 Q2 Q3 Q4 Q1
NA On-Highway $55 $28 ($10) $13 ($31) ($1) $23 $22 $45
NA Hybrid Transit Bus (4) (22) 2 5 (4) 9 (15) 0 (7)NA Off-Highway 10 (26) (54) (53) (66) (36) (13) (3) 4
Defense (7) 11 (7) 4 (20) (22) (22) (39) (23)
ONA On-Highway 9 1 0 3 (4) (3) (3) 13 2
ONA Off-Highway 9 9 (2) 11 (11) 6 (6) (16) 0
Parts, Support Equipment & Other 13 2 (9) (12) (9) 0 8 27 16
Total Net Sales $85 $3 ($80) ($29) ($145) ($47) ($28) $4 $37
2014
Variance - Sequential Q1 Q2 Q3 Q4 Q1 Q2 Q3 Q4 Q1
NA On-Highway $44 ($2) ($28) ($1) $0 $28 ($4) ($2) $23
NA Hybrid Transit Bus 8 ($17) $12 $2 ($1) ($4) ($12) $17 ($8)NA Off-Highway 4 ($30) ($22) ($5) ($9) $0 $1 $5 ($2)
Defense 7 $3 ($6) $0 ($17) $1 ($6) ($17) ($1)
ONA On-Highway (4) $12 ($5) $0 ($11) $13 ($5) $16 ($22)
ONA Off-Highway 13 ($2) ($8) $8 ($9) $15 ($20) ($2) $7
Parts, Support Equipment & Other 14 ($7) ($8) ($11) $17 $2 $0 $8 $6
Total Net Sales $86 ($43) ($65) ($7) ($30) $55 ($46) $25 $3
2012 2013
Quarterly Net Sales by End Market ($ millions)
2012 2013
2012 2013

8/12/2019 ALSN Investor Relations Presentation - First Quarter 2014
http://slidepdf.com/reader/full/alsn-investor-relations-presentation-first-quarter-2014 25/37
Strong Financial Profile
25
In $ millions Quarterly LTM(1)
2008 2009 2010 2011 2012 2013 1Q 2013 1Q 2014
Net Sales $2,061 $1,767 $1,926 $2,163 $2,142 $1,927 $457 $494 $1,963
% Growth (5.2%) (14.3%) 9.0% 12.3% ( 1.0%) (10.0%) (24.0%) 7.9% (1.7%)
Adjusted EBITDA (2) 544 501 617 712 717 633 147 169 655
% Margin 26.4% 28.4% 32.0% 32.9% 33.5% 32.8% 32.1% 34.3% 33.4%
Effective Cash Tax Rate
(3)
NM NM 2.7% 3.9% 4.9% 1.4% 2.7% 2.6% 1.6%
Adjusted Net Income 93 50 274 305 376 348 80 108 376
% of Net Sales 4.5% 2.8% 14.2% 14.1% 17.6% 18.1% 17.4% 21.9% 19.2%
Total CapEx 75 88 74 97 124 74 13 11 73
% of Net Sales (4) 3.7% 5.0% 3.8% 4.5% 5.8% 3.9% 2.8% 2.2% 3.7%
Adj. Free Cash Flow 193 142 315 372 402 385 48 91 428
% of Net Sales 9.4% 8.0% 16.4% 17.2% 18.8% 20.0% 10.5% 18.4% 21.8%
Annual Resiliency through the
2009 downturn,evidenced byincreasing EBITDAmargins and strongfree cash flowgeneration
Continuedinvestments in globalcommercial
capabilities, newproduct developmentand low-cost countrymanufacturing
Strong free cash flowdriven by highmargins, lowmaintenance capex,and de minimis cashincome taxes
Note: See appendix for comments regarding the presentation of non-GAAP financial information.(1) LTM 3/31/14.(2) Excluding technology-related license expenses: Q3 2012 $12 million, Q1 2013 $6 million and Q1 2014 of $3 million.(3) Effective cash tax rate defined as cash income taxes divided by income (loss) before taxes.(4) 2011 is 2.7%, 2012 is 2.8%, 2013 is 3.2% and LTM is 3.3% excluding Outside-North America manufacturing expansion and new products related.
Financial Summary

8/12/2019 ALSN Investor Relations Presentation - First Quarter 2014
http://slidepdf.com/reader/full/alsn-investor-relations-presentation-first-quarter-2014 26/37
Sustainable Margins with Further Enhancement Opportunities
26
International Manufacturing (1)Workforce Optimization (cost/employee) (1)
Manufacturing Efficiencies (hours/unit)Long-Term Customer Supply Agreements
~90% of 2013 N.A. On-Highway Unit Volum e was covered b y long -
term customer supply agreements
~90%
1000/2000 Series 3000 Series 4000 Series
2005 2013
Hours Per Uni t cont inue to decl ine
Tier I Multi-Tier
~30% of totalUAW workforce
Signif icant saving s driven by ret i rement of Tier I work ers; 750 hou rly
emplo yees are reti rement el igible (~50% of work force)
India (~$103mm total investment)
– New facility constructed to better serve Asia-Pacific
– Phase I: In-sourced component manufacturing (Q3 2010)
– Phase II: Assembly of 1000/2000 Series (Q3 2012)
Hungary (~$17mm total investment)
– Relocated assembly of 3000/4000 Series (Q2 2011)
Source: Allison.(1) As of 3/31/2014.

8/12/2019 ALSN Investor Relations Presentation - First Quarter 2014
http://slidepdf.com/reader/full/alsn-investor-relations-presentation-first-quarter-2014 27/37
Significant Cash Flow Generation
27
Free Cash Flow Generation(1) Net Debt(2)
$ 3
$379$374
$81
$425
$ 61
$ 6$ 28$385
$315
$142
$193
$372$402
$428
21.8%
18.8%17.2%
9.4%
20.0%
16.4%
8.0%
2008 2009 2010 2011 2012 2013 LTM
Free Cash Flow Certain Non-Recurring Activity
% of Sales
$4,204
$3,753 $3,721
$3,419
$3,065
$2,741$2,494 $2,516
6.9x 7.4x
5.5x
4.3x
3.9x
3.9x4.0x
At Acquisition
2008 2009 2010 2011 2012 2013 LTM
Net debt reduct ion of more than $1.68 bn since acquis i t ion (3 )
Note: See appendix for comments regarding the presentation of non-GAAP financial information.(1) Free Cash Flow defined as net cash provided by operating activities less CapEx.(2) Net debt defined as total debt minus cash and cash equivalents.(3) Represents net debt reduction through 3/31/2014 since acquisition in August 2007.(4) LTM 3/31/14.
($ in millions)($ in millions)
(4)(4)
C
8/12/2019 ALSN Investor Relations Presentation - First Quarter 2014
http://slidepdf.com/reader/full/alsn-investor-relations-presentation-first-quarter-2014 28/37
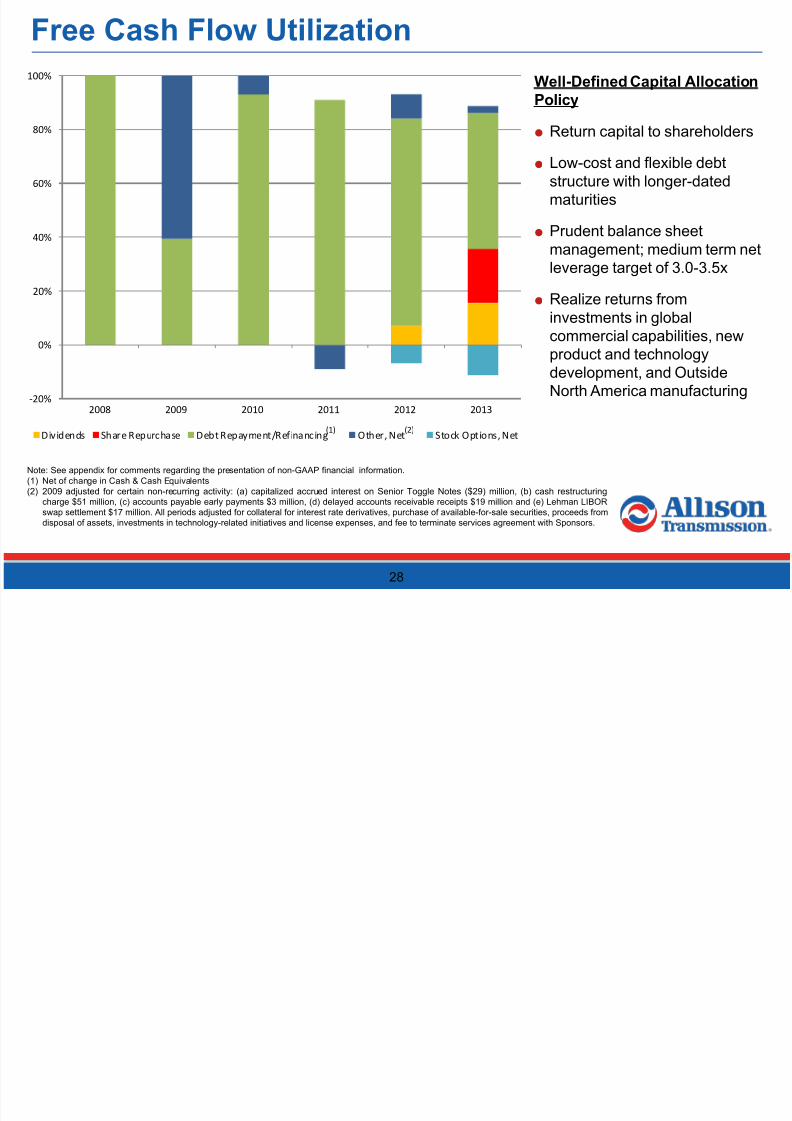
Free Cash Flow Utilization
28
-20%
0%
20%
40%
60%
80%
100%
2008 2009 2010 2011 2012 2013
Dividends Share Repurchase Debt Repayment/Refinancing (1) Other, Net (2) Stock Options, Net
Well-Defined Capital AllocationPolicy
Return capital to shareholders
Low-cost and flexible debtstructure with longer-datedmaturities
Prudent balance sheetmanagement; medium term netleverage target of 3.0-3.5x
Realize returns frominvestments in globalcommercial capabilities, newproduct and technologydevelopment, and OutsideNorth America manufacturing
Note: See appendix for comments regarding the presentation of non-GAAP financial information.(1) Net of change in Cash & Cash Equivalents(2) 2009 adjusted for certain non-recurring activity: (a) capitalized accrued interest on Senior Toggle Notes ($29) million, (b) cash restructuring
charge $51 million, (c) accounts payable early payments $3 million, (d) delayed accounts receivable receipts $19 million and (e) Lehman LIBORswap settlement $17 million. All periods adjusted for collateral for interest rate derivatives, purchase of available-for-sale securities, proceeds fromdisposal of assets, investments in technology-related initiatives and license expenses, and fee to terminate services agreement with Sponsors.
(1) (2)
I T Att ib t

8/12/2019 ALSN Investor Relations Presentation - First Quarter 2014
http://slidepdf.com/reader/full/alsn-investor-relations-presentation-first-quarter-2014 29/37
Income Tax Attributes
29
Income Tax Attributes Overview
Results in p resent value tax saving s of $785-$935mm (4 )
($ millions) Total 2014 2015 2016 2017 2018 2019 2020 2021 2022
Annual tax amortization $2,703 $315 $315 $315 $315 $315 $315 $315 $315 $183
Cash tax savings(1) 1,020 119 119 119 119 119 119 119 119 68
Cash tax savings of NOLs(2) (3) 121
Grand total $1,141
Carlyle and Onex acquired Allison from General Motors in August 2007
– Asset deal structure
– Step-up in basis for U.S. federal income tax purposes
As of 12/31/2013 Allison had $2.7bn of unamortized intangible assets
– Expect annual U.S. federal income tax deductions of $315mm through 2021 and$183mm in 2022
Net operating loss carry forward of $346mm as of 12/31/2013
(1) Assuming continued profitability and no limitations at an assumed 37.7% federal and state tax rate.(2) Calculated at a 35.0% federal tax rate on the $346mm of federal NOL carry forward balance as of 12/31/2013.(3) Recently two of the shareholders reduced their holdings resulting in an annual limitation on the utilization of the net operating losses. We do not
believe this limitation will impede our ability to fully benefit from the net operating losses.(4) Based on annual discount rate of 5-10%; includes both amortization of intangibles and federal NOL’s (contingent on timing of taxable income).
2008 2009 2010 2011 2012 2013
$4 $6 $2 $6 $11 $4
Cash Income Taxes Paid 2008-2013 ($ millions)

8/12/2019 ALSN Investor Relations Presentation - First Quarter 2014
http://slidepdf.com/reader/full/alsn-investor-relations-presentation-first-quarter-2014 30/37
Summary / Guidance
St t i P i iti

8/12/2019 ALSN Investor Relations Presentation - First Quarter 2014
http://slidepdf.com/reader/full/alsn-investor-relations-presentation-first-quarter-2014 31/37
Strategic Priorities
31
Expand global market leadership
– Capitalize on continued market recovery
– New vocational offerings
Emerging markets penetration
– Vocational ladder strategy
– Increase number of vehicle releases
Continued focus on new technologies and product development
– Address markets adjacent to core
– Advanced fuel efficient technologies
Deliver strong financial results
– Earnings growth and cash flow generation
– Focus on margin enhancement
– Well-defined capital allocation policy
2014 F ll Y G id (P bli h d A il 16 2014)

8/12/2019 ALSN Investor Relations Presentation - First Quarter 2014
http://slidepdf.com/reader/full/alsn-investor-relations-presentation-first-quarter-2014 32/37
2014 Full Year Guidance (Published April 16, 2014)
32
Note: See appendix for comments regarding the presentation of non-GAAP financial information.
Guidance Commentary
Net Sales Growth from 2013 3 to 6 percent
Consistent with our previous guidance we expect acontinued recovery in the North America On-Highway endmarket, lower demand in the North America Hybrid-
Propulsion Systems for Transit Bus end market due toengine emissions improvements and non-hybrid alternativetechnologies that generally require a fully-automatictransmission (e.g. xNG), a slowly emerging improvement indemand from the North America energy sector’s hydraulicfracturing market, previously considered reductions in U.S.defense spending to longer term averages experiencedduring periods without active conflicts, growth in theOutside North America On-Highway end market,moderately improved second half demand conditions in theOutside North America Off-Highway end market and higherdemand in the Service Parts, Support Equipment & Otherend market.
Adjusted EBITDA Margin excluding
technology-related license expenses 32 to 34 percent Principally driven by sales mix and volume timing
Adjusted Free Cash Flow ($ in millions) $375 to $425 $2.00 to $2.25 per diluted share
CapEx ($ in millions)
MaintenanceNew Product Programs
$55 to $60$5 to $10
Subject to timely completion of development and sourcingmilestones
Cash Income Taxes ($ in millions) $10 to $15 U.S. income tax shield and net operating loss utilization

8/12/2019 ALSN Investor Relations Presentation - First Quarter 2014
http://slidepdf.com/reader/full/alsn-investor-relations-presentation-first-quarter-2014 33/37
Appendix: Non-GAAP Financial Information
N GAAP Fi i l I f ti

8/12/2019 ALSN Investor Relations Presentation - First Quarter 2014
http://slidepdf.com/reader/full/alsn-investor-relations-presentation-first-quarter-2014 34/37
Non-GAAP Financial Information
34
We use Adjusted net income, Adjusted EBITDA, Adjusted EBITDA excluding technology-related license expenses, Adjusted EBITDAmargin, Adjusted EBITDA margin excluding technology-related license expenses, adjusted free cash flow and free cash flow to evaluate ourperformance relative to that of our peers. In addition, the Senior Secured Credit Facility has certain covenants that incorporate AdjustedEBITDA. However, Adjusted net income, Adjusted EBITDA, Adjusted EBITDA excluding technology-related license expenses, AdjustedEBITDA margin, Adjusted EBITDA margin excluding technology-related license expenses, adjusted free cash flow and free cash flow are not
measurements of financial performance under GAAP, and these metrics may not be comparable to similarly titled measures of othercompanies. Adjusted net income is calculated as the sum of net income (loss), interest expense, net, income tax expense (benefit), tradename impairment and amortization of intangible assets, less cash interest, net and cash income taxes, and adjusted for certain non-recurringitems. Adjusted EBITDA is calculated as the sum of Adjusted net income, cash interest, net, cash income taxes, depreciation of property,plant and equipment and other adjustments as defined by the Senior Secured Credit Facility and as further described below. AdjustedEBITDA excluding technology-related license expenses is calculated as Adjusted EBITDA less technology-related license expenses. Adjusted EBITDA margin is calculated as Adjusted EBITDA divided by net sales. Adjusted EBITDA margin excluding technology-relatedlicense expenses is calculated as Adjusted EBITDA excluding technology-related license expenses divided by net sales. Free cash flow iscalculated as net cash provided by operating activities less capital expenditures. Adjusted free cash flow is free cash flow adjusted for non-recurring items.
We use Adjusted net income to measure our overall profitability because it better reflects our cash flow generation by capturing the actualcash interest paid and cash taxes paid rather than our interest expense and tax expense as calculated under GAAP and excludes the impactof the non-cash annual amortization of certain intangible assets that were created at the time of the Acquisition Transaction. We use Adjusted EBITDA, Adjusted EBITDA excluding technology-related license expenses, Adjusted EBITDA margin and Adjusted EBITDA marginexcluding technology-related license expenses to evaluate and control our cash operating costs and to measure our operating profitability.We use adjusted free cash flow and free cash flow to evaluate the amount of cash generated by the business that, after the capitalinvestment needed to maintain and grow our business, can be used for strategic opportunities, including investing in our business andstrengthening our balance sheet. We believe the presentation of Adjusted net income, Adjusted EBITDA, Adjusted EBITDA excludingtechnology-related license expenses, Adjusted EBITDA margin, Adjusted EBITDA margin excluding technology-related license expenses
and adjusted free cash flow enhances our investors' overall understanding of the financial performance and cash flow of our business.
You should not consider Adjusted net income, Adjusted EBITDA, Adjusted EBITDA excluding technology-related license expenses, AdjustedEBITDA margin, Adjusted EBITDA margin excluding technology-related license expenses, adjusted free cash flow and free cash flow as analternative to net income (loss), determined in accordance with GAAP, as an indicator of operating performance, or as an alternative to netcash provided by operating activities, determined in accordance with GAAP, as an indicator of Allison’s cash flow.
N GAAP R ili ti

8/12/2019 ALSN Investor Relations Presentation - First Quarter 2014
http://slidepdf.com/reader/full/alsn-investor-relations-presentation-first-quarter-2014 35/37
$ in millions, Unaudited
Last twelve
months ended
March 31,
2009 2010 2011 2012 2013 2013 2014 2014
Net (loss) income ($323.9) $29.6 $103.0 $514.2 $165.4 $27.5 $52.1 $190.0
plus:
Interest expense, net 234.2 277.5 217.3 151.2 132.9 33.9 35.1 134.1
Cash interest expense (242.5) (239.1) (208.6) (167.3) (159.2) (30.0) (29.4) (158.6)
Income tax expense (benefit) 41.4 53.7 47.6 (298.0) 100.7 16.9 27.2 111.0
Cash income taxes (5.5) (2.2) (5.8) (10.7) (3.8) (1.2) (2.1) (4.7)
Fee to terminate services agreement with Sponso rs — — — 16.0 — — — —
Technology-related investment expenses — — — 14.4 5.0 2.5 — 2.5
Public offering expenses — — — 6.1 1.6 — 0.3 1.9
Trade name impairment 190.0 — — — — — — —
Amortization of intangible assets 155.9 154.2 151.9 150.0 105.3 29.9 24.7 100.1
Adjusted net income $49.6 $273.7 $305.4 $375.9 $347.9 $79.5 $107.9 $376.3
Cash interest expense 242.5 239.1 208.6 167.3 159.2 30.0 29.4 158.6
Cash income taxes 5.5 2.2 5.8 10.7 3.8 1.2 2.1 4.7
Depreciation of property, plant and equipment 105.9 99.6 103.8 102.5 98.7 24.7 23.3 97.3
(Gain)/loss on redemptions and repayments of long-term debt (8.9) (3.3) 16.0 22.1 0.8 — — 0.8
Dual power inverter module extended coverage 11.4 (1.9) — 9.4 (2.4) — — (2.4)
UAW Local 933 s igning bonus — — — 8.8 — — — —
Benefit plan re-measurement — — — 2.3 — — — —
Unrealized (gain) loss on commodity hedge contracts (5.8) 0.3 6.5 (1.0) 1.5 1.3 0.1 0.3
Unrealized (gain) loss on foreign exchange — (0.2) 0.3 0.1 2.3 0.6 (0.3) 1.4
Premiums and expenses on tender offer for long-term debt — — 56.9 — — — — —
Restructuring charges 47.9 — — — 1.0 — — 1.0
Reduction of supply contract liability —
(3.4) — — — — — —
Other, net(1)
53.2 10.9 8.6 7.0 13.8 3.4 3.3 13.7
Adjusted EBITDA $501.3 $617.0 $711.9 $705.1 $626.6 $140.7 $165.8 $651.7
Adjusted EBITDA excluding technology-related license expenses $501.3 $617.0 $711.9 $717.1 $632.6 $146.7 $169.1 $655.0
Net Sales $1,766.7 $1,926.3 $2,162.8 $2,141.8 $1,926.8 $457.4 $493.6 $1,963.0
Adjusted EBITDA margin 28.4% 32.0% 32.9% 32.9% 32.5% 30.8% 33.6% 33.2%
Adjusted EBITDA margin excl technology-related license expenses 28.4% 32.0% 32.9% 33.5% 32.8% 32.1% 34.3% 33.4%
Three months ended
March 31,For the year ended Decembe r 31,
Non-GAAP Reconciliations (1 of 2)
35
Adjusted Net Income and Adjusted EBITDA reconciliation
(1) Includes charges or income related to legacy employee benefits, shared income with General Motors, benefit plan adjustments, transitional costs to establish Allison as a stand-alone entity, pension curtailment adjustments, employee stock compensation expense, service fees paid to Allison’s Sponsors and anadjustment for the settlement of litigation which originated with the Predecessor but was assumed by the Company as part of the Acquisition Transaction.
Non GAAP Reconciliations

8/12/2019 ALSN Investor Relations Presentation - First Quarter 2014
http://slidepdf.com/reader/full/alsn-investor-relations-presentation-first-quarter-2014 36/37
Non-GAAP Reconciliations (2 of 2)
36
Adjusted Free Cash Flow reconciliation
$ in m illions, Unaudited
Last twelve
months ended
March 31,2009 2010 2011 2012 2013 2013 2014 2014
Net Cash Provided by Operating Activities $168.7 $388.9 $469.2 $497.5 $453.5 $54.7 $98.6 $497.4
(Deductions) or Additions:
Long-lived assets (88.2) (73.8) (96.9) (123.9) (74.4) (12.6) (11.1) (72.9)
Fee to terminate s ervices agreem ent with Sponsors — — — 16.0 — — — —
Technology-related license expenses — — — 12.0 6.0 6.0 3.3 3.3
2009 Non-Recurring Activity(1)
61.0 — — — — — — —
Adjusted Free Cash Flow $141.5 $315.1 $372.3 $401.6 $385.1 $48.1 $90.8 $427.8
Net Sales $1,766.7 $1,926.3 $2,162.8 $2,141.8 $1,926.8 $457.4 $493.6 $1,963.0
Adjusted Free Cash Flow (% to Net Sales) 8.0% 16.4% 17.2% 18.8% 20.0% 10.5% 18.4% 21.8%
Three m onths ended
March 31,For the year ended December 31,
(1) 2009 adjusted for certain non-recurring activity: (a) capitalized accrued interest on Senior Toggle Notes ($29) million, (b) cash restructuring charge$51 million, (c) accounts payable early payments $3 million, (d) delayed accounts receivable receipts $19 million and (e) Lehman LIBOR swapsettlement $17 million.
Certain Trademarks

8/12/2019 ALSN Investor Relations Presentation - First Quarter 2014
http://slidepdf.com/reader/full/alsn-investor-relations-presentation-first-quarter-2014 37/37
Certain Trademarks
This presentation contains trademarks, service marks, copyrights and trade names of other companies,which are the property of their respective owners. We do not intend our use or display of other
companies’ trademarks, service marks, copyrights or trade names to imply a relationship with, orendorsement or sponsorship of us by, any other companies.
Top Related