


Languages
Pages
Legal

Aligning Channel Marketing & SalesA Practical 5-Step Approach
2
PRESENTERS
John Ericksen
Partner / Co-Owner
Channel Impact
Steven Kellam
President
CCI | Global Channel Management
3
Step #1: Start with the Customer
Step #2: Define Your Strategic Options
Step #3: Take a Systems Approach to Sales Capacity
Step #4: Build Your Partner Success Formula
Step #5: Focus on Execution & Adoption
Key Lessons Learned
AGENDAA Practical 5-Step Approach

4
5
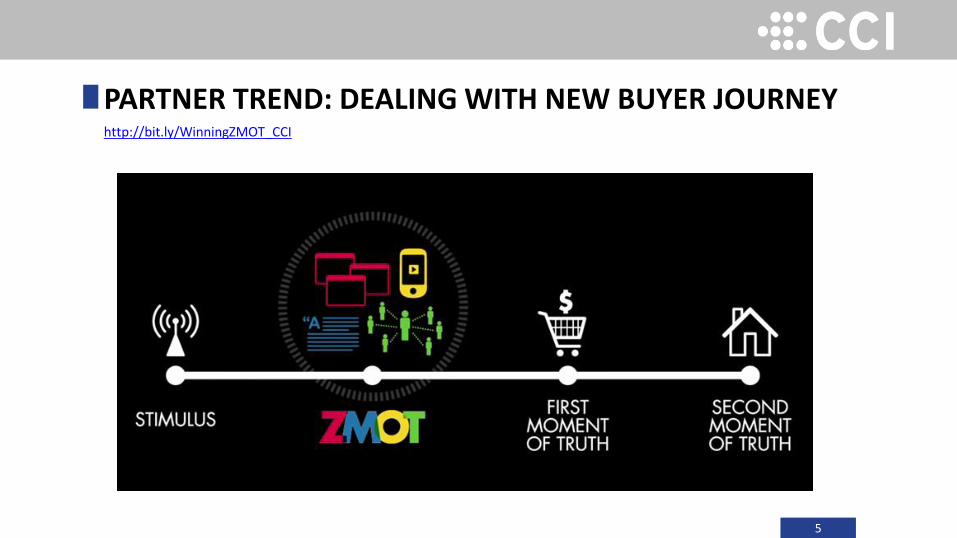
PARTNER TREND: DEALING WITH NEW BUYER JOURNEYhttp://bit.ly/WinningZMOT_CCI
6
Image
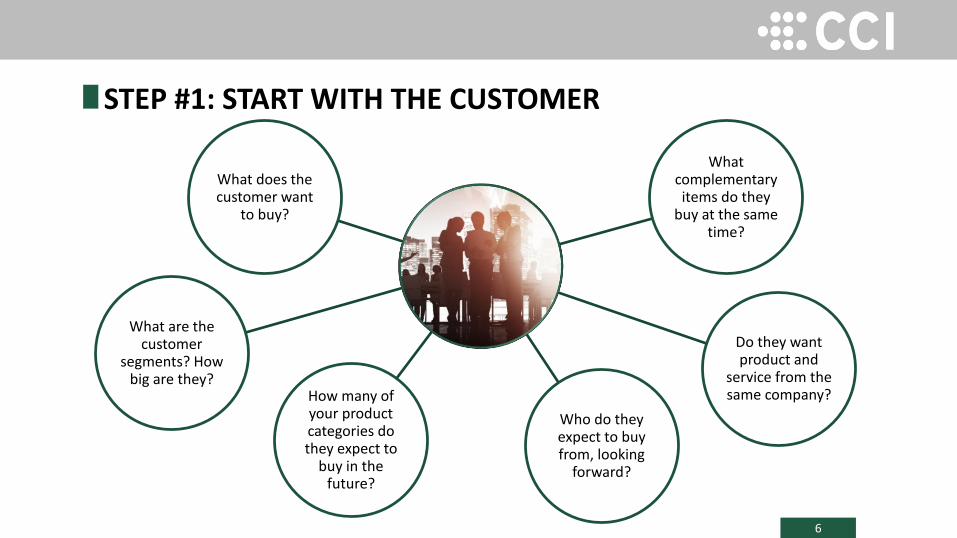
What does the customer want
to buy?
What complementary items do they
buy at the same time?
Do they want product and
service from the same company?
Who do they expect to buy from, looking
forward?
How many of your product categories do they expect to
buy in the future?
What are the customer
segments? How big are they?
STEP #1: START WITH THE CUSTOMER
7
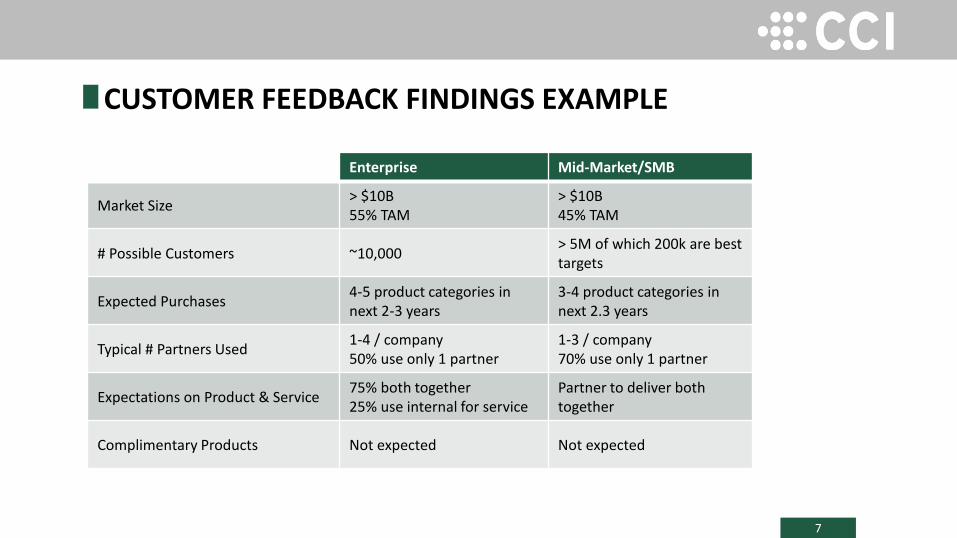
CUSTOMER FEEDBACK FINDINGS EXAMPLE
Enterprise Mid-Market/SMB
Market Size> $10B55% TAM
> $10B45% TAM
# Possible Customers ~10,000> 5M of which 200k are best targets
Expected Purchases4-5 product categories in next 2-3 years
3-4 product categories in next 2.3 years
Typical # Partners Used1-4 / company 50% use only 1 partner
1-3 / company70% use only 1 partner
Expectations on Product & Service75% both together25% use internal for service
Partner to deliver both together
Complimentary Products Not expected Not expected
8
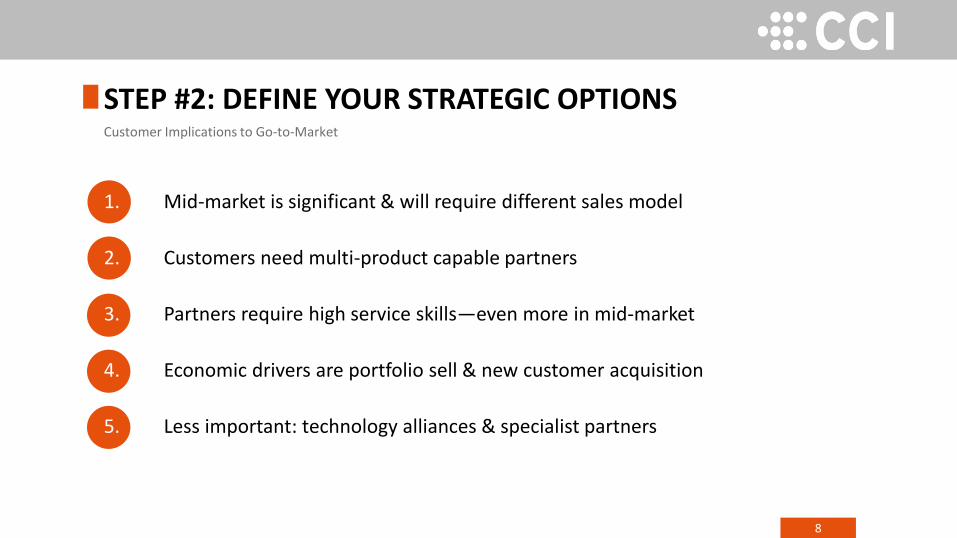
STEP #2: DEFINE YOUR STRATEGIC OPTIONSCustomer Implications to Go-to-Market
1. Mid-market is significant & will require different sales model
2. Customers need multi-product capable partners
3. Partners require high service skills—even more in mid-market
4. Economic drivers are portfolio sell & new customer acquisition
5. Less important: technology alliances & specialist partners
9
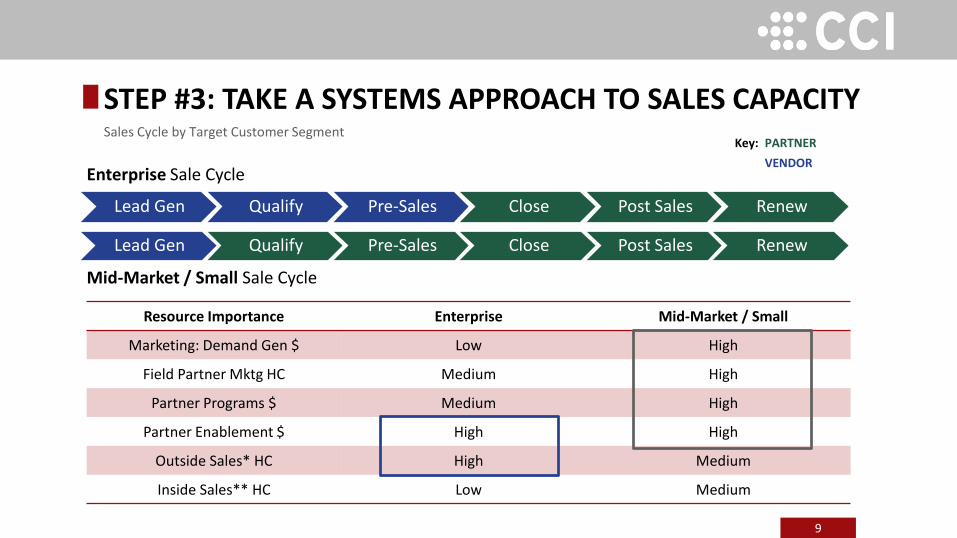
STEP #3: TAKE A SYSTEMS APPROACH TO SALES CAPACITYSales Cycle by Target Customer Segment
Enterprise Sale Cycle
Mid-Market / Small Sale Cycle
Lead Gen Qualify Pre-Sales Close Post Sales Renew
Lead Gen Qualify Pre-Sales Close Post Sales Renew
Key: PARTNER
VENDOR
Resource Importance Enterprise Mid-Market / Small
Marketing: Demand Gen $ Low High
Field Partner Mktg HC Medium High
Partner Programs $ Medium High
Partner Enablement $ High High
Outside Sales* HC High Medium
Inside Sales** HC Low Medium
10
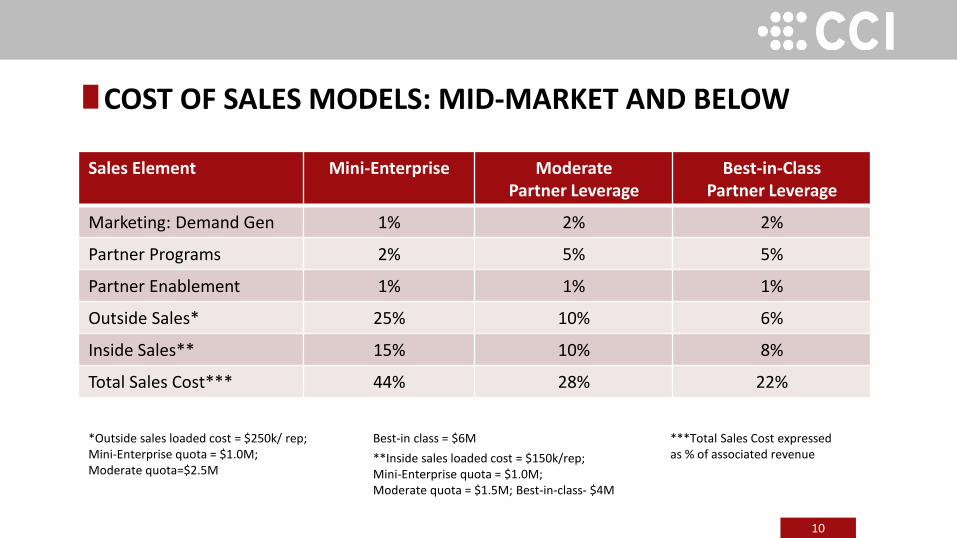
COST OF SALES MODELS: MID-MARKET AND BELOW
Sales Element Mini-Enterprise ModeratePartner Leverage
Best-in-ClassPartner Leverage
Marketing: Demand Gen 1% 2% 2%
Partner Programs 2% 5% 5%
Partner Enablement 1% 1% 1%
Outside Sales* 25% 10% 6%
Inside Sales** 15% 10% 8%
Total Sales Cost*** 44% 28% 22%
*Outside sales loaded cost = $250k/ rep; Mini-Enterprise quota = $1.0M; Moderate quota=$2.5M
Best-in class = $6M
**Inside sales loaded cost = $150k/rep; Mini-Enterprise quota = $1.0M; Moderate quota = $1.5M; Best-in-class- $4M
***Total Sales Cost expressed as % of associated revenue
11
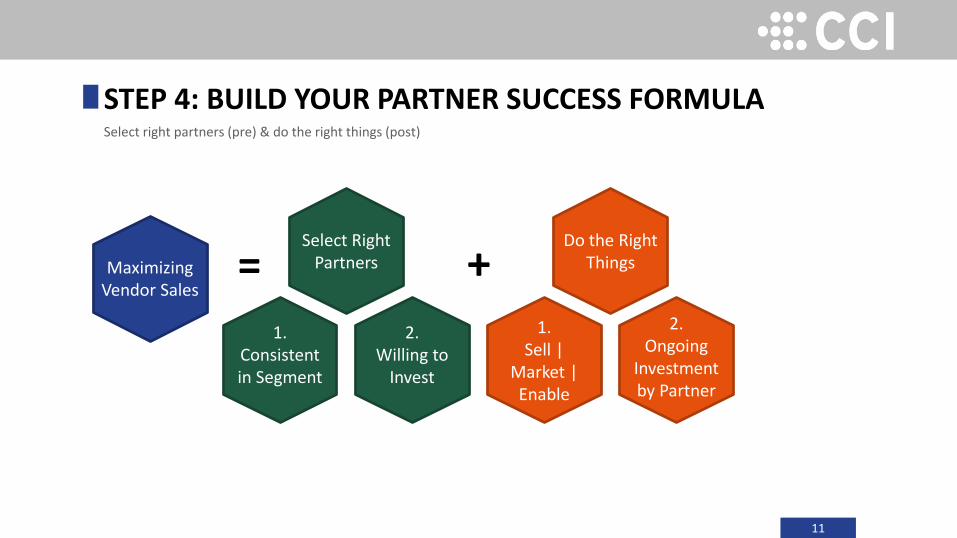
STEP 4: BUILD YOUR PARTNER SUCCESS FORMULASelect right partners (pre) & do the right things (post)
Maximizing Vendor Sales
=Select Right
Partners
1. Consistent in Segment
2. Willing to
Invest
+Do the Right
Things
1. Sell |
Market | Enable
2. Ongoing
Investment by Partner
12
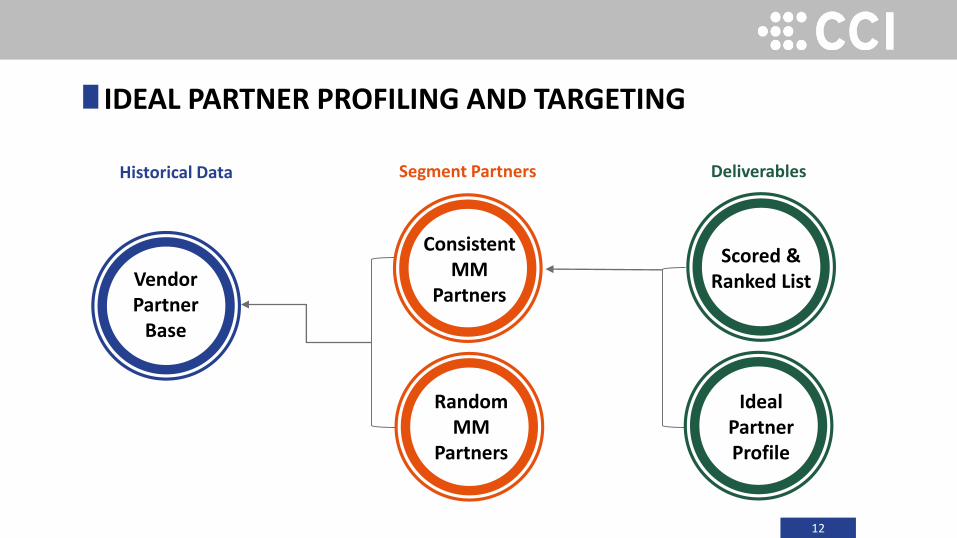
IDEAL PARTNER PROFILING AND TARGETING
Consistent MM
Partners
Random MM
Partners
Scored & Ranked List
IdealPartnerProfile
Vendor Partner
Base
Historical Data Segment Partners Deliverables
13
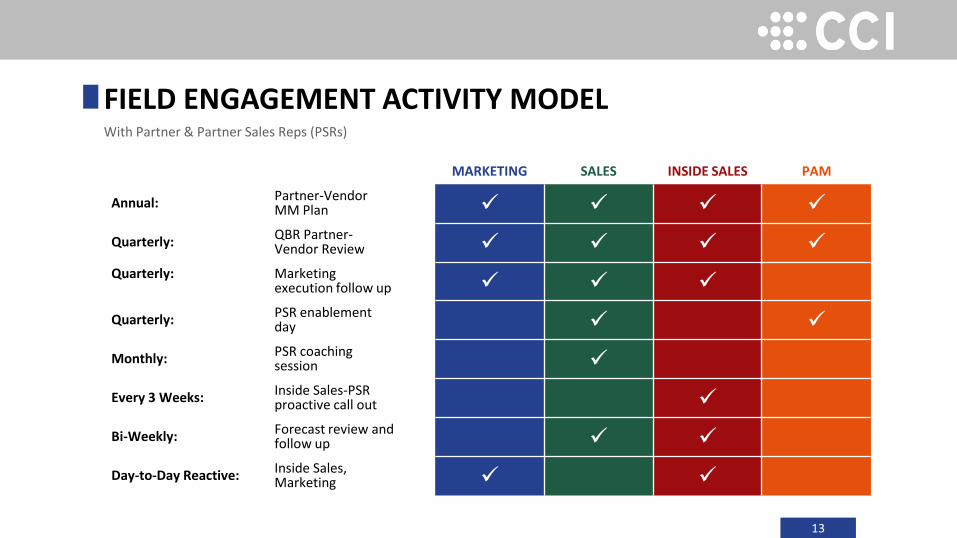
FIELD ENGAGEMENT ACTIVITY MODELWith Partner & Partner Sales Reps (PSRs)
MARKETING SALES INSIDE SALES PAM
Annual: Partner-Vendor MM Plan
Quarterly: QBR Partner-Vendor Review
Quarterly: Marketing execution follow up
Quarterly: PSR enablement day
Monthly: PSR coaching session
Every 3 Weeks: Inside Sales-PSR proactive call out
Bi-Weekly: Forecast review and follow up
Day-to-Day Reactive: Inside Sales, Marketing
14
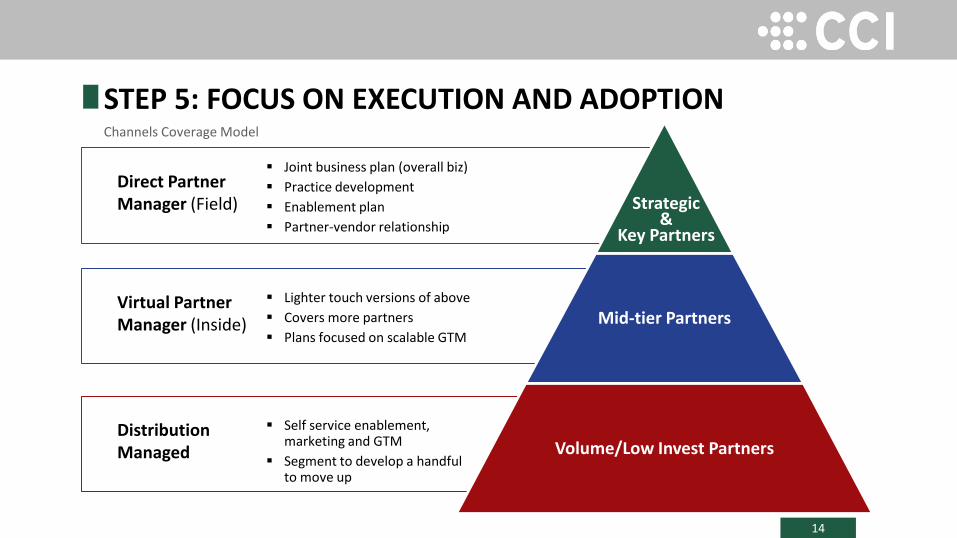
STEP 5: FOCUS ON EXECUTION AND ADOPTIONChannels Coverage Model
Mid-tier Partners
Volume/Low Invest Partners
Strategic &
Key Partners
Direct Partner Manager (Field)
Joint business plan (overall biz)
Practice development
Enablement plan
Partner-vendor relationship
Virtual Partner Manager (Inside)
Lighter touch versions of above
Covers more partners
Plans focused on scalable GTM
Distribution Managed
Self service enablement, marketing and GTM
Segment to develop a handful to move up
15
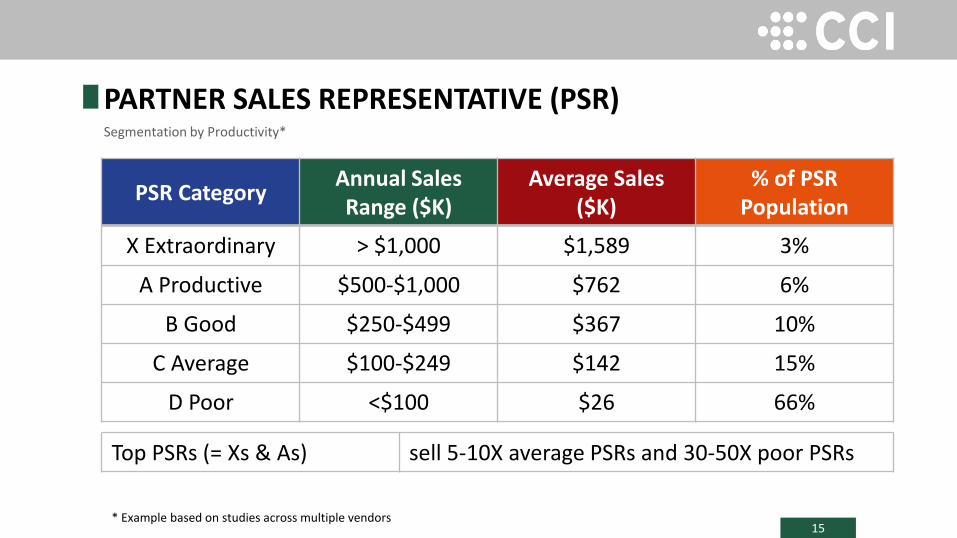
PARTNER SALES REPRESENTATIVE (PSR)Segmentation by Productivity*
PSR CategoryAnnual Sales Range ($K)
Average Sales ($K)
% of PSR Population
X Extraordinary > $1,000 $1,589 3%
A Productive $500-$1,000 $762 6%
B Good $250-$499 $367 10%
C Average $100-$249 $142 15%
D Poor <$100 $26 66%
Top PSRs (= Xs & As) sell 5-10X average PSRs and 30-50X poor PSRs
* Example based on studies across multiple vendors
16
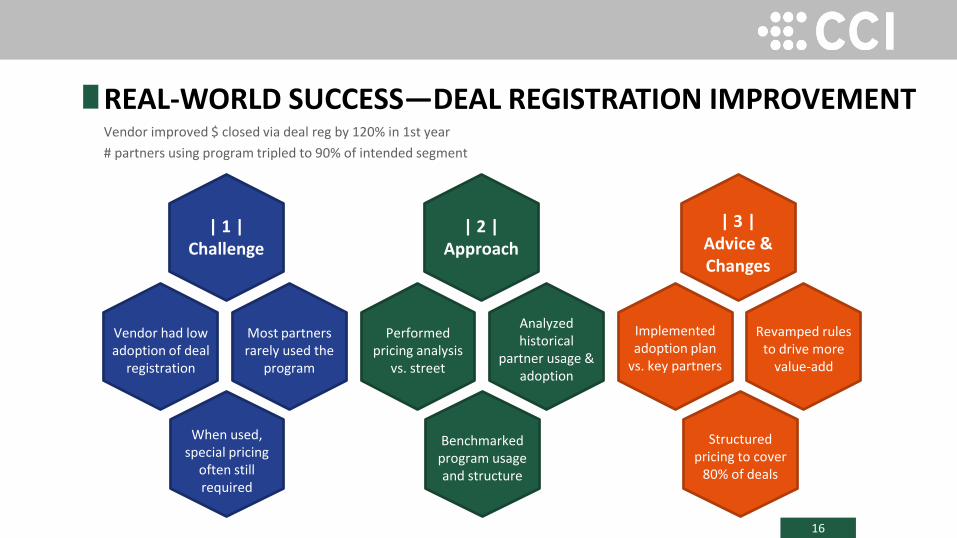
REAL-WORLD SUCCESS—DEAL REGISTRATION IMPROVEMENTVendor improved $ closed via deal reg by 120% in 1st year
# partners using program tripled to 90% of intended segment
| 1 | Challenge
Most partners rarely used the
program
Vendor had low adoption of deal
registration
Revamped rules to drive more
value-add
| 2 | Approach
Benchmarked program usage and structure
Performed pricing analysis
vs. street
Analyzed historical
partner usage & adoption
| 3 | Advice & Changes
Implemented adoption plan
vs. key partners
When used, special pricing
often still required
Structured pricing to cover
80% of deals
17
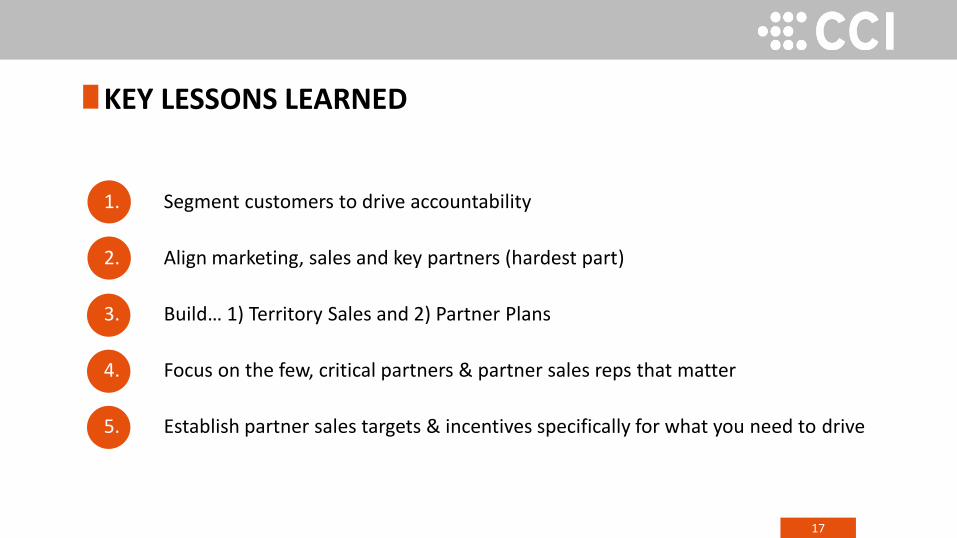
KEY LESSONS LEARNED
1. Segment customers to drive accountability
2. Align marketing, sales and key partners (hardest part)
3. Build… 1) Territory Sales and 2) Partner Plans
4. Focus on the few, critical partners & partner sales reps that matter
5. Establish partner sales targets & incentives specifically for what you need to drive
18
Q & A
John Ericksen
408.973.7847
www.channel-impact.com
Steven Kellam
415.526.3215
www.channelmanagement.com
Top Related