


Languages
Pages
Legal


International Journal of Communication 10(2016), 3758–3784 1932–8036/20160005
Copyright © 2016 (Alex Rosenblat & Luke Stark). Licensed under the Creative Commons Attribution Non-
commercial No Derivatives (by-nc-nd). Available at http://ijoc.org.
Algorithmic Labor and Information Asymmetries:
A Case Study of Uber’s Drivers
ALEX ROSENBLAT1
Data & Society Research Institute, USA
LUKE STARK
New York University, USA
Uber manages a large, disaggregated workforce through its ridehail platform, one that
delivers a relatively standardized experience to passengers while simultaneously
promoting its drivers as entrepreneurs whose work is characterized by freedom,
flexibility, and independence. Through a nine-month empirical study of Uber driver
experiences, we found that Uber does leverage significant indirect control over how
drivers do their jobs. Our conclusions are twofold: First, the information and power
asymmetries produced by the Uber application are fundamental to its ability to structure
control over its workers; second, the rhetorical invocations of digital technology and
algorithms are used to structure asymmetric corporate relationships to labor, which
favor the former. Our study of the Uber driver experience points to the need for greater
attention to the role of platform disintermediation in shaping power relations and
communications between employers and workers.
Keywords: on-demand economy, Uber, design, platform, ridesharing, ridehailing,
algorithm, data, labor, management, rating, surge pricing, entrepreneurship,
independent contractor, sharing economy
Uber is a San Francisco-based company founded in 2009 that owns and operates a smartphone
application for “ridesharing,” connecting drivers of privately held vehicles with riders who pay a fare set by
the company. Uber is reputedly valued at $62.5 billion in its latest funding rounds (Newcomer, 2015), and
is available in 195 cities in North America (Uber, 2016) and 68 countries worldwide (Uber Newsroom,
Alex Rosenblat: [email protected]
Luke Stark: [email protected]
Date submitted: 2015–10–22
1 This project was supported in part by a grant from Microsoft Research FUSE Labs. We are grateful for the
insights and assistance of danah boyd, Finn Brunton, Karen Levy, Patrick Davison, Tamara Kneese,
Winifred Poster, members of the Labor Tech Reading Group, Mary L. Gray, Harry Campbell, Stacy Abder,
Seth Young, Angie Waller, Monica Bulger, Sorelle Friedler, Surya Mattu, and Angèle Christin in the
production of this article, along with the insights of the many Uber drivers whose experiences have
contributed to this work.

International Journal of Communication 10(2016) A Case Study of Uber’s Drivers 3759
2016), although its operations continually expand (and occasionally contract via conflicts with local
regulators over the legality of its contested business practices).2 Uber is the most visible and controversial
of a category of businesses, such as Airbnb or TaskRabbit, which represent themselves as part of a
“sharing economy,” also known as the “on-demand” or “platform” economy.
Previous work on ridesharing in general has explored the phenomena in its ad hoc, not-for-profit,
or cooperative contexts (Anderson, 2014; Chan & Shaheen, 2012; Cohen & Kietzmann, 2014; Furuhata et
al., 2013). Lee, Kusbit, Metsky, and Dabbish (2015) provide the most granular independent look to date
at the driving habits and preferences of Uber drivers, coining the term algorithmic management to
describe the mechanisms through which Uber and Lyft drivers are directed. We extend that understanding
of algorithmic management to elucidate on the automated implementation of company policies on the
behaviors and practices of Uber drivers. A growing body of journalistic (Griswold, 2014; Hill, 2015;
Hockstein, 2015; Johnson, 2014; Porter, 2015; White, 2015) and academic research has begun to
examine the conditions of labor and work in online labor markets (Irani, 2015; Kingsley, Gray, & Suri,
2015) and the digital on-demand economy. Sociologists such as Zwick (2015) have critically assessed new
terms, such as prosumer (Ritzer & Jurgenson, 2010), that seek to reify the consumer’s role as a producer
and manager of goods and services. Scholz (2013) along with the contributors to the volume Digital
Labor: The Internet as Playground and Factory lay out a range and diversity of questions surrounding
digitally mediated labor and new models of production and consumption. As Scholz notes, “Web-based
work environments have emerged that are devoid of the worker protections of even the most precarious
working-class jobs” (p. 1). Gregg (2015) observes that the asymmetries between app designers, owners,
and the service providers—“those who offer the infrastructure for labor but no stability or benefits to
accompany it” (para. 6)—are a defining feature of many of these on-demand companies.
Our research extends these critiques of platform-based employers by examining how Uber drivers
experience labor under a specific regime of automated and algorithmic management. This work combines
a qualitative study of Uber drivers in both digital and physical spaces with a design critique of Uber’s
technical systems and a discursive critique of its corporate communications (advertisements, public
interviews, and written policies). We conclude that Uber’s rhetorical invocations of digital technology and
algorithms are used to structure unequal corporate relationships to labor that favor the former. Through
tools such as dynamic, algorithmic pricing and a number of other elements of the Uber application’s
design, Uber is empowered via information and power asymmetries to effect conditions of soft control,
affective labor, and gamified patterns of worker engagement on its drivers.
Study Method and Scope
For this case study, we performed archival and real-time analysis of posts by Uber drivers in
online forums between December 2014 and September 2015. Drivers use these forums to learn tricks and
tips for success on Uber’s platform; compare and share practices and screenshots; complain socially about
passengers and the company; and debate Uber’s practices, including discrepancies between the passenger
and driver apps (Clark, 2015; Rosenblat, 2015). Given that a driver’s in-person contact with Uber staff is
2 The number of cities and countries listed here will likely be out of date in the near future.

3760 Alex Rosenblat & Luke Stark International Journal of Communication 10(2016)
primarily limited to, if anything, the initial recruitment process (Uber communicates with its drivers almost
exclusively via e-mail and text), these unofficial communication networks can function as primary sites for
knowledge-building.
Data were collected from five dedicated forums (three larger and two smaller).3 Of these larger
forums, Forum “UberDrive” is a standalone website with 700–1,000 daily visitors.4 Forum “UberOps” is a
closed-membership forum hosted on a social media platform with approximately 5,100 members (the
numbers change marginally on a daily basis after increasing by hundreds over the nine-month period) and
administrators that impose standards of basic civility. Forum “UberCool” is another standalone website: It
has numerous participants and appears to be the largest, but the exact number of participants is
unavailable.5 Approximately 1,350 total archival items were collected from these forums, documenting the
activities and conversations of drivers through forum posts, interviews, and other personal contacts,
including e-mail correspondence with Uber community support representatives (CSRs). To contextualize
and build on the data gathered from forums, we also conducted in-depth, semi-structured interviews with
seven drivers.
The experiences reported on these forums and described by our interview subjects are not
necessarily representative of the Uber driver population as a whole. For instance, drivers who seek out
and participate in online forums may be more strongly opinionated than other drivers, or may have had
individual difficulties that drove them to seek help and information online. The ability to generalize from
reported driver experiences is also complicated by the range of Uber services,6 the differences between
drivers who rely on it for their primary income and have made significant financial and social investments
in it compared with those who are hobbyists and work fewer hours, and how long Uber has been in
operation in a driver’s market. Yet, although these accounts may not describe every driver’s experience,
the evidence we have collected nonetheless reveals structural features of the Uber system that could
potentially affect any driver using the application.
What Uber Promises Drivers
Uber recruits heavily, growing from 160,000 drivers in the United States in 2014 to 400,000
drivers a year later (Uber Newsroom, 2015). Retention rates are poor: Slightly more than half of drivers
on-boarded in 2013 remain active (having completed at least one trip in the previous six months) on the
platform a little over a year later, according to Uber’s own data (Hall & Krueger, 2015, p. 16). Once
approved, active drivers can log into Uber’s system via a smartphone app to indicate that they are
available to receive ride requests from passengers. Passengers pay a total fare for each ride via credit
card directly to Uber. Uber later passes the payment on to drivers after deducting a commission, which
generally ranges between 20% and 30% for uberX, a “safe rides fee” (now a “booking fee”), and any
3 For confidentiality reasons, we modified the names of these forums and driver identities and quotations. 4 These numbers are according to the forum operator. 5 Posters are required to enter minimal contact information to register and post on it; the majority of
forum participants identify as drivers in the United States. 6 UberX appears to be the most common: Drivers tend not to identify for which tier of service they drive.

International Journal of Communication 10(2016) A Case Study of Uber’s Drivers 3761
additional fees based on local jurisdiction. Uber’s policies require drivers to maintain a low cancellation
rate, such as 5% in San Francisco (as of July 2015), and a high acceptance rate, such as 80% or 90%.
One of Uber’s undoubted appeals for workers is its promise of “flexible employment” (O’Brien,
2015). Uber advertises to drivers that, “With Uber, you have total control. Work where you want, when
you want, and set your own schedule” and “Freedom pays weekly.” In a 2015 survey commissioned by
the company, 85% of respondents agreed that flexibility was a major motivator for driving for Uber (Hall
& Krueger, 2015, p. 11). The rhetorical markers of freedom, flexibility, and entrepreneurship enabled
through an app-based platform are further hallmarks of the on-demand economy, and, in the case of
Uber, they have proven broadly successful (Griffith, 2015). The promotion of entrepreneurship and
freedom permits employers, the public, and regulators to imagine that workers “work by un-coerced
choice” (Irani, 2015, p. 227). Yet, the labor that Uber drivers do is shaped by the company’s deployment
of a variety of design decisions and information asymmetries via the application to effect a “soft control”
over workers’ routines (Boltanski & Chiapello, 1999/2007; Deleuze, 1990).
Uber refers to drivers as “driver-partners,” thus disassociating the company from an employer–
employee relationship. Drivers in this study generally treated the language as either a formality or
hypocrisy, as irrelevant, or as a lever to press negotiations for more autonomy. The terms partner and
sharing economy and even rideshare suggest that Uber and its drivers possess a mutual commitment to
common goals (Gregg, 2011, p. 85), despite the significant information and power asymmetries between
the two. In Uber’s contract with its UK-based drivers, drivers are instead legally framed as consumers:
“Customer [driver] is authorized to provide Transportation Services . . .” (Uber B.V., 2015). The term
customers specifies that drivers are “end-users” of the application, similar to passengers, which potentially
obviates their role and rights as workers.
Uber, like other companies in the on-demand economy (Smith & Leberstein, 2015), uses its
identity as both a platform and a technology company to define its role (Gillespie, 2010) as a neutral
intermediary that facilitates access to underused and undercommoditized goods and services (Lobel,
2015, p. 1; Lowrey, 2015). Uber claims in its contract with drivers that it is “a technology services
provider that does not provide transportation service” (Uber Technologies, 2014). In response to multiple
lawsuits against Uber alleging that it discriminates against blind and disabled passengers, Uber has argued
that the Americans With Disabilities Act did not apply to it as it does to taxi companies because it is a
technology, and not a transportation, company (Strochlic, 2015).7
The most explicit legal tensions in which the company is embroiled are highlighted by a class
action lawsuit in California, which effectively contests the neutrality of Uber’s relationship to its drivers:
The plaintiffs (drivers) assert that they should be classified as employees, not independent contractors
(O’Connor, Colopy, Manahan, and Gurfinkel v. Uber Technologies, Inc., 2015b). Uber’s contract with its
American drivers states that Uber “provides lead generation to independent providers of rideshare or peer
to peer passenger transportation services” (Raiser, 2015, para. 9.2). In a legal brief Uber submitted in the
7 We observed communications from Uber to drivers warning them about their prospective obligations
under the Americans with Disabilities Act.

3762 Alex Rosenblat & Luke Stark International Journal of Communication 10(2016)
California employment misclassification lawsuit, Uber asserts that “We make our money from licensing
software. . . . And we happen to have a compensation model that, when they [drivers] use it successfully,
we get compensated” (O’Connor et al., 2015a, p. 16). This framing implies that any negative
consequences are features of software connectivity. Yet, Uber’s self-proclaimed role as a connective
intermediary belies the important employment structures and hierarchies that emerge through its
software and interface design.
Power Asymmetries and Pay Rates
Regardless of the language used by Uber to describe its legal and rhetorical relationship to its
drivers, an analysis of driver experiences with the company’s system reveals numerous manifestations of
algorithmic management. Most notable are the combination of blind passenger acceptance with low
minimum fares and the algorithmic determination of surge pricing. These two features of the Uber system
reveal, respectively, how little control Uber drivers have over critical aspects of their work and how much
control Uber has over the labor of its users (drivers).
Blind Passenger Acceptance and Minimum Fares
When active Uber drivers receive a ride request through the system, they have about 15 seconds
to accept it or reject it. When Uber drivers accept a ride request, they take on the risk that the ride’s fare
will not be profitable; yet, drivers are not shown destination or fare information before they accept a ride.
Jason from Raleigh, North Carolina, who had driven for about a year, said, “You’re driving around blind.
When it does ping, you might drive 15 minutes to drive someone half a mile. There’s no money in it in
that point, especially in my SUV.” Although hiding the destination before a driver chooses to accept or
decline a ride request can potentially prevent destination-based discrimination (Smart et al., 2015), it can
also foster reduced wages for drivers.
In addition, drivers risk “deactivation” (being suspended or removed permanently from the
system) for cancelling unprofitable fares. Ron, an interviewee who had been driving in New Jersey and
New York City for over a year, said,
Show the destination before. If we’re independent contractors, we should have the right
to refuse. If I look down and it’s 3:00 in the afternoon and the guy is going to JFK [NYC-
based airport], I’m not going to take it. When I get to the guy’s location and I get to
JFK, I’m not going to make $40 for 3 hours of work. . . . They tell us it’s our choice
whether to take a trip or not, so how can they penalize us for that?
Blind ride acceptance is made even more risky by Uber’s imposition of minimum fares. In Savannah,
Georgia, the minimum fare is $5 for uberX (as of September 2015). Uber takes a $1 safe rides fee off that
amount and a commission of at least 20% on the remaining $4. That leaves the driver with $3.20 at
Uber’s lowest commission, which does not account for any of the driver’s expenses.8
8 Uber’s rates and fees are subject to perennial change, and these amounts will vary accordingly.

International Journal of Communication 10(2016) A Case Study of Uber’s Drivers 3763
These structures of the Uber system contradict the rhetorical framing of drivers as entrepreneurs.
Uber advertises that a driver can “be your own boss” and has made attempts to induce drivers to protest
the regulation of ridesharing by sending them e-mails that say, for example, “State leaders need to hear
from entrepreneurs like you.” In Uber’s Newsroom (2014), Uber states, “Our powerful technology platform
delivers turnkey entrepreneurship to drivers across the country and around the world” (para. 4). None of
the interviewees we spoke with thought of themselves as entrepreneurs because of their work with Uber.
As Mike, an interviewee from Savannah who had driven for Uber for two to three months, said,
Entrepreneur is, I feel like a bit of a stretch. I mean, I feel like the definition of an
entrepreneur is, you know, having your own idea and taking off with that. I feel like
Uber is just like a side gig, not any kind of entrepreneur endeavor. . . . I don’t feel like
entrepreneur is a great classification for drivers, unless you’re running a business out of
your Uber car, I guess that’s something an entrepreneur could do.
Uber’s discourse of entrepreneurship may be tied to the legacy of a Silicon Valley environment where
highly skilled and mobile workers could take on risks and trade-offs to be part of the start-up technology
world (Neff, 2012, p. 24). However, this rhetoric of risk and reward has been retooled to suit a contingent
of lower-income workers who are recruited to perform service labor under working conditions controlled
by the design and affordances of Uber’s platform.9
The practices of blind rider acceptance and minimum fares are two manifestations of the larger
fact that Uber has full power to control and change the base rates its drivers charge.10 Uber’s agreement
with its “partners” (drivers) permits drivers to negotiate a lower fare, but not a higher one (Uber
Technologies, 2014).11 Base rates, as well as minimum fares, vary across cities. For instance, in New York
City, uberX services as of September 2015 were $0.40/minute and $2.15/mile, with a minimum fare of
$8. In Austin, Texas, the minimum fare was $2 and the rate was $0.18/minute and $1.10/mile.
When Uber sets low rates for routine work, incentive-based pay steers drivers into working under
much stricter and less flexible conditions in the hopes of higher earnings, such as hourly wage guarantees
which vary according to the terms of each guarantee, such as $22per hourh or $40 per hour, but these
are moot if drivers earn the equivalent or more in fares. Uber does not disclose the criteria by which
certain drivers are selected for hourly guarantees, but Uber Support CSRs explain, “Some guarantees are
only offered to a specific group of partners. We rotate these guarantees to make the guarantee structure
9 While we primarily examine how control takes shape through less visible mechanisms, it is worth noting
that (1) Uber maintains a list of eligible vehicles (make and year) in each city, which it sometimes
changes, and (2) that drivers are responsible for all the costs of operating their vehicles and running a
small business. 10 Uber also implements perennial rate cuts. In January 2016, Uber slashed rates in 100 cities in North
America. In New York City, rates for uberX were lowered by 20%; in Detroit, rates were set at $0.30/mile
(Campbell, 2016a). 11 Some drivers report strategically ending a trip early, thus lowering the fare for the passenger, in the
hopes of getting a higher rating.

3764 Alex Rosenblat & Luke Stark International Journal of Communication 10(2016)
as fair as possible.” .The conditions for receiving this guarantee follow this typical template: RSVP or “opt-
in” to the guarantee; accept 90% of ride requests, complete one trip per hour, be online for at least 50
minutes of every hour, and maintain a specified high rating during those trips. Additional requirements
could be that drivers are required to start eligible trips from a particular location, such as the core of Los
Angeles (Campbell, 2016b). Effectively, hourly guarantees function to schedule on-demand shift work, but
the language of opt-in or RSVP buffers the narrative of freedom and choice that Uber promotes to its
drivers, while simultaneously masking a hierarchy in which select drivers are invited to earn more based
on opaque criteria. Drivers have the freedom to drive at “flexible” hours at lower rates, but their flexibility
is tailored to and dependent on demand as well as on the viability of base rates.
When Uber implements lower rates, drivers express strong distrust of Uber’s system and
explanations. To promote rate cuts, Uber typically shows drivers graphs demonstrating that lower fare
rates lead to a “huge boost in demand, and partner earnings per hour increased by 25%—that’s a lot of
extra money!” Uber’s logic is that drivers will earn more through increased trip, and greater optimization
of their time online, from the “boost in demand.” In reactions that echo other driver responses to rate
decreases in other cities, including Austin, drivers in forums respond with incredulity, calling it “Uber
math,” “propaganda,” and Orwellian double-speak. Drivers contend that they have to work longer hours
and accrue additional expenses to earn what they made prior to rate cuts. The reactions drivers have to
Uber’s logic around rate cuts is echoed in other changes Uber makes to drivers’ compensation structure.
As interviewee Jason from Raleigh observed in 2015:
They keep bumping around with the rates and the different terms of service. . . . You
gotta log in and all of a sudden there’s new terms and conditions and you can’t drive
until you accept the new terms and conditions and if you’re on your phone you have to
really look try and read everything. I read it because originally they had the X and then
they had the XL platform here and then with the XL platform all of a sudden their
percentage went from 20% to 28%. I sent ’em an e-mail and said what’s going on?
You’re not doing anything different. Why do you get an extra 8%? And they said you’re
gonna make more money and I said no, you’re gonna make more money.
Uber’s position as a technology company that offers software to connect passengers with drivers
implies that any emergent (and negative) effects of its system are a natural feature of connectivity rather
than an enforced hierarchy or employment power structure. Yet, Uber has the power to carve out which
parts of “connected work” are taskified as paid or unpaid services. For example, Uber advertises that
passengers can retrieve items they leave behind in drivers’ cars because of that connectivity, and it
provides passengers with a masked phone number to contact drivers in such cases, but Uber does not
advertise that drivers are not paid for the time and energy they spend returning items passengers have
left behind. Uber even advises drivers that, “It is not acceptable to ask the rider for payment for returning
their lost item.” If a driver protests to Uber Support, a typical CSR response is, “I understand that it does
take you time to return items that passengers left behind in your car. On the Uber system, you are only
paid for the trips that are requested through the Uber app.” Some drivers say they might receive a fee of
$25 or $10, or simply a “thanks” from Uber, but like fare acceptance, they are prevented from setting or

International Journal of Communication 10(2016) A Case Study of Uber’s Drivers 3765
even knowing the rate for their work. In essence, Uber communicates that some services have prices and
some services do not, but the power for determining these distinctions resides with Uber alone.
Similarly, Uber claims that it has the data to adjudicate disputes between passengers and drivers,
such as for criminal matters such as assault claims (LaFrance, 2015) or smaller concerns such as
payment/wage disputes. Its claim to adjudication is rooted in the notion that its data on both passengers
and drivers are akin to an objective, third-party witness, and thus that its interpretation should be
conclusive. Some drivers appreciate the accountability created by Uber’s system of surveillance. As Sarah,
an interviewee from Seattle, said,
They actually log the exact route that you took. . . . Uber drivers pretty much knows
they can see whatever route they took, I think taxi drivers have done that forever,
they’ll just take you for a ride. . . . I like that Uber and Lyft has a little more of a specific
tally because they don’t want them doing that to customers.
In other cases, drivers perceive that Uber favors the passenger in adjudications, and even report
having to gather their own data to prevent wages from being retracted. One interviewee, Larry, who drove
near Austin, Texas, and had been working for Uber for 9–10 months, described one incident when he used
his dash-cam footage to prove his story to Uber:
Once I had driven some guy somewhere and as soon as I got home I had checked and
Uber had cut the pay in like half because the guy claimed I took him on an inefficient
route, so I sent Uber the footage of the entire trip and I explain to them that if you
watch the video he actually directs me turn by turn, you know, where to go, and it’s the
most drunk he’s ever been. They reversed them, and gave me back my money. . . .
Uber will always 100% go with the customer because that’s how they make business.
But I don’t think that should come out of the driver’s pay, because it’s just customer
satisfaction.
Drivers in forums and interviews, including Sarah, express how they resist Uber’s power of interpretation
by tracking their trips with manual or electronic logs and dash-cams. Even in cases of disputed fares,
drivers are only able to exert control on the wages paid for completed work after the fact. The power
imbalance is quite clear: Uber can hold drivers accountable to the “most efficient” routes, but drivers need
their own data to hold Uber accountable for the wages they are owed. On a larger scale, Uber’s ability to
set and change its rates and commissions unilaterally and without driver buy-in foments driver distrust
and dissatisfaction with Uber’s platform.
Surge Pricing and Algorithmic Logistics Management
Among drivers interviewed and posts collected from forums, the ambiguity and resistance
surrounding “surge pricing” surfaced as the most obvious intersection of data collection and information
asymmetry in everyday driver experience. Surge pricing is displayed to drivers through a type of heat

3766 Alex Rosenblat & Luke Stark International Journal of Communication 10(2016)
map visualization, where the algorithmic assessment of supply and demand will temporarily raise fares for
a particular geographic location (see Figure 1).
Visible to both riders and drivers, the creation of such surge pricing zones is billed by Uber as a
means to ensure positive customer experience by enticing new supply to an area of high demand
(Kedmey, 2014; Uber Technologies, 2015b). Uber’s surge pricing patent (Lin et al., 2014) and its
vernacular explanations contend that surge pricing prompts more drivers to get on the road (Uber, 2014)
when demand is high, but there is some evidence that surge primarily redistributes the existing supply of
drivers rather than adding to it (Diakopoulos, 2015).
Surge pricing is unreliable for drivers: Notably, pricing is based on the passenger’s geolocation,
not the driver’s. Drivers travel to surge pricing zones in search of fares advertised at a given rate, but
they can and do receive ride requests from passengers in other, adjacent areas. A driver may enter a zone
that is surging at 3.5, but receive ride requests at a lower surge rate, such as 1.5. Some drivers report
that passengers game the system by placing their pick-up location pin outside a surge zone, and then
calling drivers to redirect them to their actual pick-up location. Drivers also noted that they would
sometimes converge en masse at a surging area, find that supply was no longer too low, and the surge
would disappear. Some drivers reported experimenting with trying to game these algorithms themselves,
and many developed responses to surge pricing based on their experience with its duration, reliability, and
potential reward in their respective locations. It is unclear whether surge is designed equally to optimize
for satisfying passenger demand or for increasing driver earnings, but Uber’s stance against “surge
manipulation” by drivers suggests the former. In one e-mail exchange from September 2014, an Uber
CSR advised a driver against surge manipulation by writing, “A passenger let us know that they felt you
unfairly canceled their trip to wait for surge to kick in, or that you otherwise unfairly gave preference to
surge trips instead of their request.” The e-mail went on to advise that the driver risked deactivation if
Uber received more negative passenger feedback. In effect, drivers are penalized for rejecting lower paid
work in favor of higher paid work, which is illustrative of another constraint on their “freedom” as
independent entrepreneurs.
Uber claimed in 2014 that surge pricing “affects a tiny minority of all Uber rides, less than 10% of
all trips” (Gurley, 2014, para. 6), but surge (algorithmic) pricing recurs in driver discussions as a central
preoccupation, and it remains a popular incentive: Screenshots of surge rates and zones are often posted
to forums to display enthusiasm for a pay lottery. “Waking up dreamin’ of surge. Haha.” Others
commented that they check the app for surge as soon as they get up in the morning. Some drivers are
propelled into a similar emotional space as gambling or gaming (Cherry, 2012; Schüll, 2012) by
algorithmic pricing.
Through surge pricing’s appeal to the concept of algorithms and automated management, Uber
can generate and coordinate clusters of labor in response to dynamic market conditions (Aneesh, 2009, p.
356) without explaining the reliability of its cluster incentives or guaranteeing the validity, accuracy, or
error rates of its labor deployments. Many drivers express frustration and enthusiasm alike for surge
pricing because its very dynamism is characteristically fickle and opaque, a finding supported by Lee et al.
(2015, p. 1609). “Don’t chase the surge” is offered in forums as standard advice to new drivers. Uber’s

International Journal of Communication 10(2016) A Case Study of Uber’s Drivers 3767
rhetorical appeal to algorithmic certainty and authority (Gillespie, 2014) also appears in the effective
messaging that Uber sends to its drivers at key moments, such as when they are about to log off. Rather
than an appeal from Uber’s position as employer—“We’d like for you to keep working”—these messages
cite the (presumably algorithmically derived) idea that demand is high in that driver’s location at that
exact time.
Figure 1. Sample surge map. Red means that demand is surging,
orange indicates that rising demand, and yellow shows moderate demand.
3768 Alex Rosenblat & Luke Stark International Journal of Communication 10(2016)
Surge pricing thus exists as one example of Uber’s institutionalized nudging of the driver
workplace as a method for leveraging “soft control” over driver behavior, which also includes heat maps,
incentives, and frequent messaging. Messages urging drivers to stay online, or to go online, imply or state
explicitly that it will surge because there is high demand are often posted to forums.
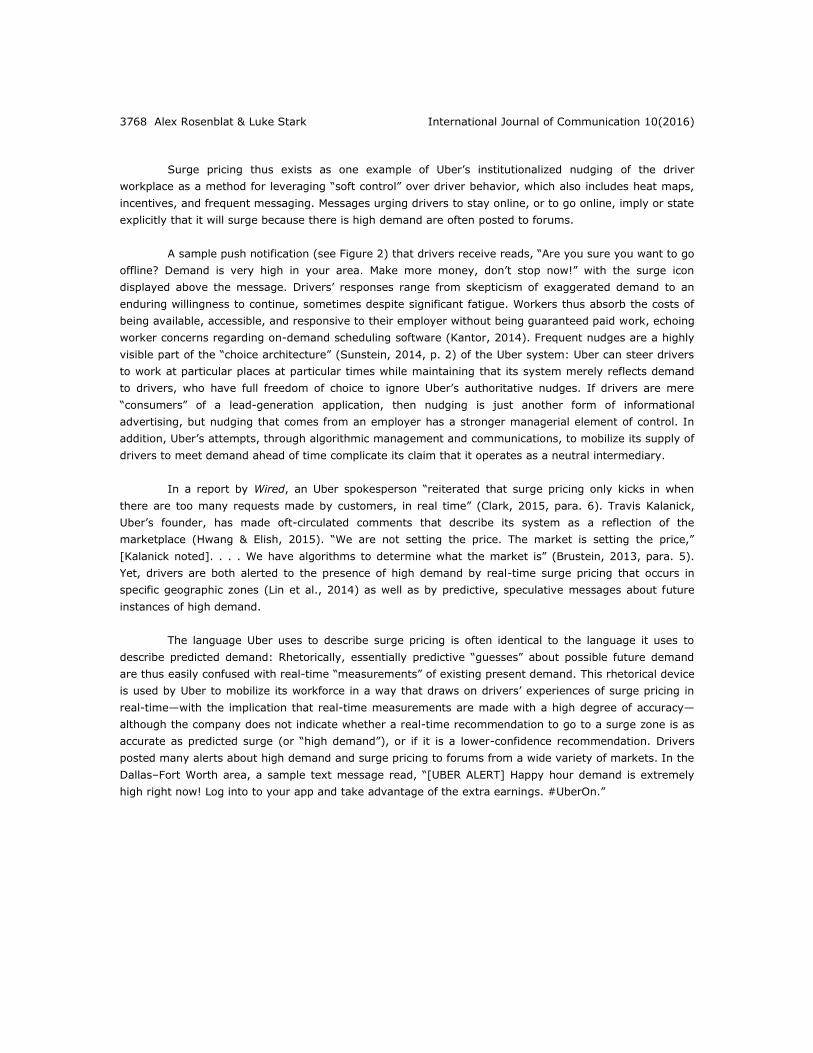
A sample push notification (see Figure 2) that drivers receive reads, “Are you sure you want to go
offline? Demand is very high in your area. Make more money, don’t stop now!” with the surge icon
displayed above the message. Drivers’ responses range from skepticism of exaggerated demand to an
enduring willingness to continue, sometimes despite significant fatigue. Workers thus absorb the costs of
being available, accessible, and responsive to their employer without being guaranteed paid work, echoing
worker concerns regarding on-demand scheduling software (Kantor, 2014). Frequent nudges are a highly
visible part of the “choice architecture” (Sunstein, 2014, p. 2) of the Uber system: Uber can steer drivers
to work at particular places at particular times while maintaining that its system merely reflects demand
to drivers, who have full freedom of choice to ignore Uber’s authoritative nudges. If drivers are mere
“consumers” of a lead-generation application, then nudging is just another form of informational
advertising, but nudging that comes from an employer has a stronger managerial element of control. In
addition, Uber’s attempts, through algorithmic management and communications, to mobilize its supply of
drivers to meet demand ahead of time complicate its claim that it operates as a neutral intermediary.
In a report by Wired, an Uber spokesperson “reiterated that surge pricing only kicks in when
there are too many requests made by customers, in real time” (Clark, 2015, para. 6). Travis Kalanick,
Uber’s founder, has made oft-circulated comments that describe its system as a reflection of the
marketplace (Hwang & Elish, 2015). “We are not setting the price. The market is setting the price,”
[Kalanick noted]. . . . We have algorithms to determine what the market is” (Brustein, 2013, para. 5).
Yet, drivers are both alerted to the presence of high demand by real-time surge pricing that occurs in
specific geographic zones (Lin et al., 2014) as well as by predictive, speculative messages about future
instances of high demand.
The language Uber uses to describe surge pricing is often identical to the language it uses to
describe predicted demand: Rhetorically, essentially predictive “guesses” about possible future demand
are thus easily confused with real-time “measurements” of existing present demand. This rhetorical device
is used by Uber to mobilize its workforce in a way that draws on drivers’ experiences of surge pricing in
real-time—with the implication that real-time measurements are made with a high degree of accuracy—
although the company does not indicate whether a real-time recommendation to go to a surge zone is as
accurate as predicted surge (or “high demand”), or if it is a lower-confidence recommendation. Drivers
posted many alerts about high demand and surge pricing to forums from a wide variety of markets. In the
Dallas–Fort Worth area, a sample text message read, “[UBER ALERT] Happy hour demand is extremely
high right now! Log into to your app and take advantage of the extra earnings. #UberOn.”
International Journal of Communication 10(2016) A Case Study of Uber’s Drivers 3769
Figure 2. An example of the type of nudge delivered
to a driver when logging off the Uber app.
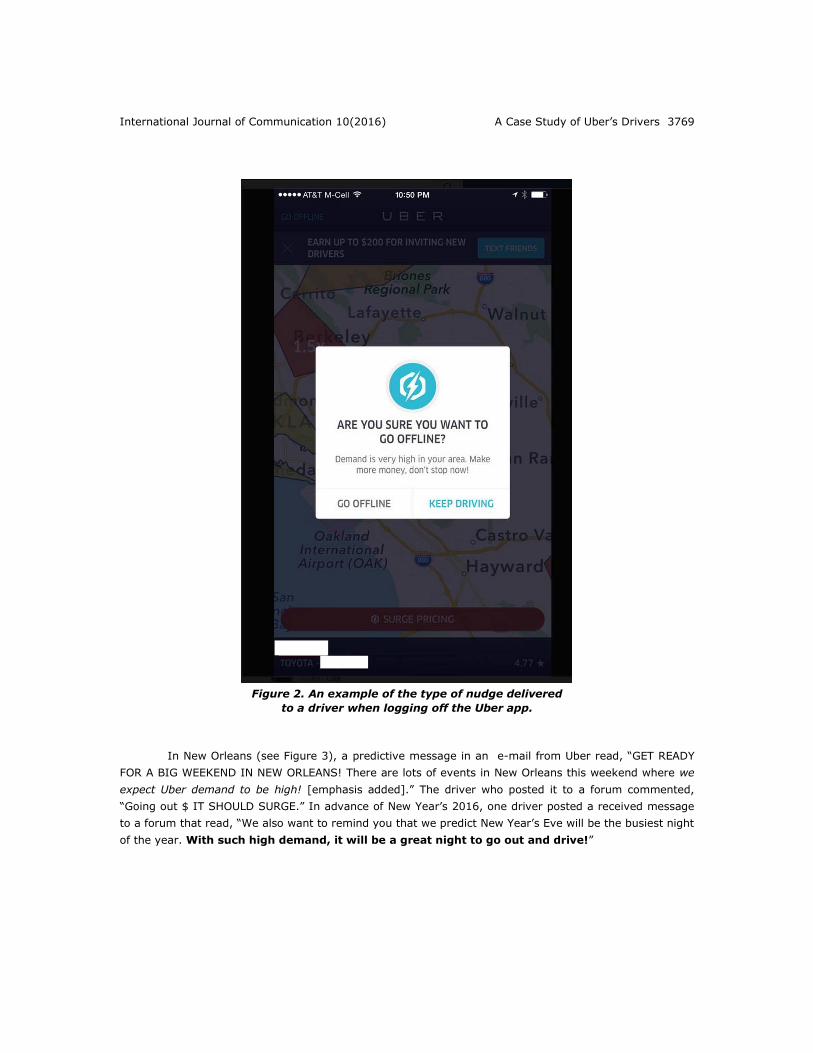
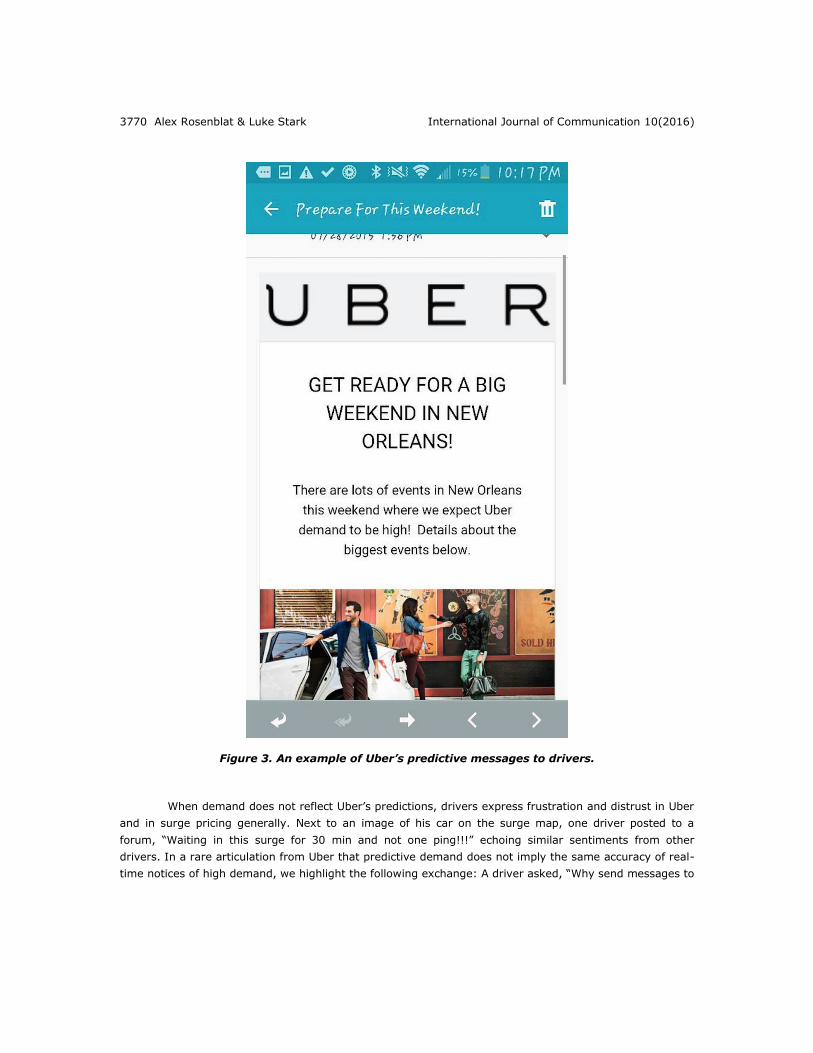
In New Orleans (see Figure 3), a predictive message in an e-mail from Uber read, “GET READY
FOR A BIG WEEKEND IN NEW ORLEANS! There are lots of events in New Orleans this weekend where we
expect Uber demand to be high! [emphasis added].” The driver who posted it to a forum commented,
“Going out $ IT SHOULD SURGE.” In advance of New Year’s 2016, one driver posted a received message
to a forum that read, “We also want to remind you that we predict New Year’s Eve will be the busiest night
of the year. With such high demand, it will be a great night to go out and drive!”
3770 Alex Rosenblat & Luke Stark International Journal of Communication 10(2016)
Figure 3. An example of Uber’s predictive messages to drivers.
When demand does not reflect Uber’s predictions, drivers express frustration and distrust in Uber
and in surge pricing generally. Next to an image of his car on the surge map, one driver posted to a
forum, “Waiting in this surge for 30 min and not one ping!!!” echoing similar sentiments from other
drivers. In a rare articulation from Uber that predictive demand does not imply the same accuracy of real-
time notices of high demand, we highlight the following exchange: A driver asked, “Why send messages to

International Journal of Communication 10(2016) A Case Study of Uber’s Drivers 3771
me saying it is the biggest night of the year when everything is dead?” The CSR replied, “We try to predict
how busy it is going to be based on the historical data from previous years. This is never going to be
100% accurate.” After building a system to nudge drivers, Uber’s disavowal of its own predictions is ironic,
but also underscores how much control both parties understand Uber to have over the rhythm of a driver’s
everyday labor.
The gamic elements of behavioral engagement tools, such as surge pricing, the conflation of real-
time and predictive demand, and blind passenger acceptance, illustrate the multifaceted ways that Uber
influences the relationship between supply and demand. These gamic elements also support the notion
that Uber is not responsible for inconsistencies in its system; rather, automated functions, such as
algorithmic pricing or blind passenger acceptance, are part of the interaction design. Yet, this system is
premised on denying drivers access to certain key pieces of information that would otherwise help them
make informed choices about their decisions.
Information Management and Rated Labor
The lines of communication between Uber and its drivers are based on a profound information
asymmetry. Whereas numerous channels filter data up from drivers and riders to the corporate system,
the paths for drivers to request information from Uber are limited and distributed through decentralized
support centers. Drivers can make inquiries and usually receive template responses, but they are not
empowered to negotiate the terms of their work by communicating to a representative of higher
management. Uber’s active voice is relegated to Uber Help or Uber Support through CSRs, who
communicate to drivers via e-mail. CSRs represent Uber in name, but some are outsourced abroad to the
Philippines (Horwitz, 2015); in the United States, some CSRs work ‘for Uber’ but are technically employed
by staffing agencies such as ZeroChaos (Anonymous, 2015; Bhuiyan, 2016; Horwitz, 2015). The
responses they deliver often lack a nuanced understanding of the context or challenges of the work, and
drivers have to be persistent to get the answers they seek to questions without a template response.
Some believe that software is creating initial responses based on the keywords in their text, and they refer
to CSRs as “Uber’s robots.” The responses drivers receive often resemble generic FAQs, and some drivers
write “escalate to manager” in the body of their text in the hopes of flagging a human supervisor more
quickly.
The role of the CSR more closely resembles customer service than management, an indication of
Uber’s larger trend of treating drivers not like employees or even contractors, but as the customers of a
“free” service. Although drivers primarily communicate with Uber by e-mail, there is no managerial
correspondent empowered with the role of “foreman” to mediate drivers’ frustrations with the company.
And because there are no formal managers to oversee the quality of individual drivers’ job performance,
Uber’s system recruits passengers to perform a type of managerial assessment through driver ratings. The
automation of many managerial functions in the Uber system does not obviate the drivers’ need for an
Uber representative who is empowered to mediate their concerns in ways that CSRs cannot. A
contextually aware manager able to explain what is happening to the software-based infrastructure of
such work would be one way to build trust in platform–worker relations, for Uber and other similar
companies.

3772 Alex Rosenblat & Luke Stark International Journal of Communication 10(2016)
Driver Ratings and Surveillance
In the driver rating system offered to riders, passengers are empowered to act as middle
managers over drivers, whose ratings directly impact their employment eligibility (Fuller & Smith, 1991;
Stark & Levy, 2015). This redistribution of managerial oversight and power away from formalized middle
management (Castells, 2000) and toward consumers is part of a broader trend in flexible labor:
Companies or platforms can create expectations about their service that workers must fulfill through the
mediating power of the rating system. This business model is rooted in Taylorist traditions of using worker
monitoring to identify and create new efficiencies in workflows (Beniger, 1989; Zureik, 2003). For laborers
whose work is primarily mediated electronically, worker monitoring is more passive and the prominence of
control is not as perceptible (Saval, 2014, p. 297). The loss of worker efficacy as power is transferred
from labor to capital (Braverman, 1974) is not new or unique to digitally mediated labor, but digital
spaces facilitate and scaffold new systems of monitoring and opportunities for remote control over
workers.
To achieve good ratings, drivers must modify their behavior to produce a homogenous Uber
experience for riders (Bruder, 2015; Girard & Stark, 2002). Instead of imposing disciplinary measures on
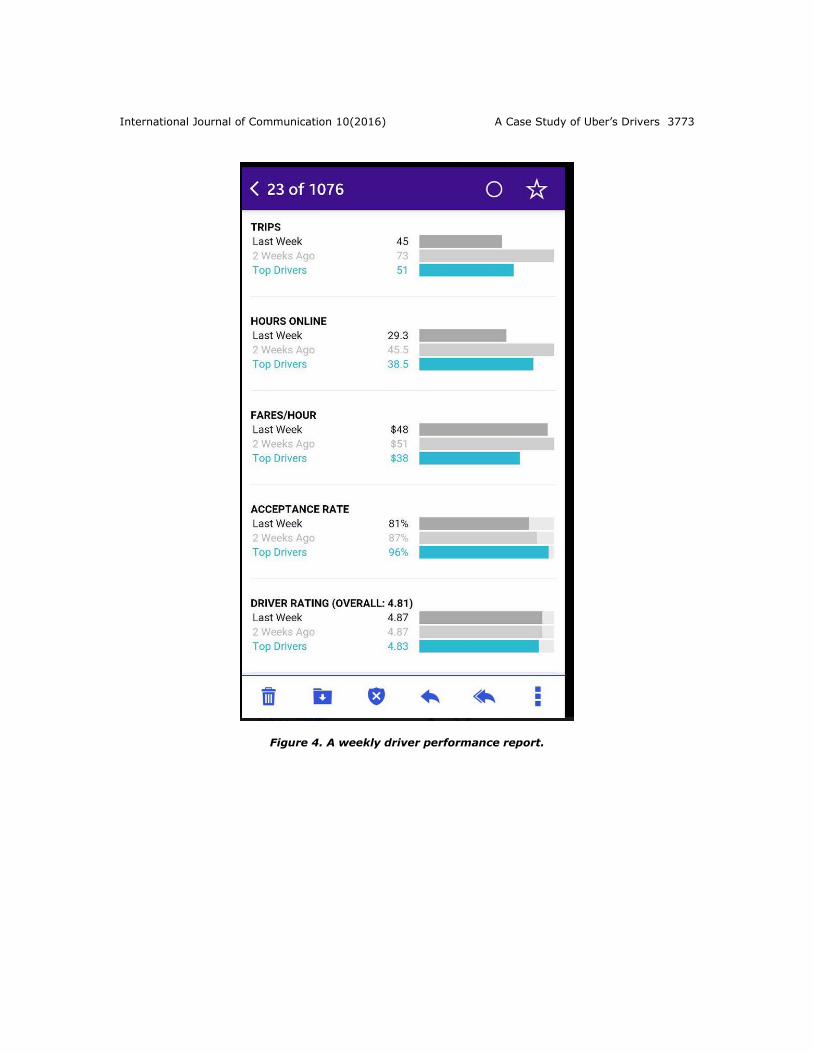
drivers, Uber controls how drivers behave through weekly performance metrics (see Figures 4 and 5)
delivered after the fact of their work. This homogenizing effect highlights another tension between Uber’s
claim that drivers are entrepreneurs: They must deliver a standardized service.
The ratings that passengers give drivers constitute the most significant performance metric
according to driver discussions. Individualized metrics also foster a “highly individualized sense of
responsibility for one’s own job stability” (Neff, 2012, p. 28), even though drivers have limited control
over how passengers interact with the rating system or how Uber assesses it. By design, systematic
accountability for the whole interactive process (Leidner, 1999, p. 83) is downloaded onto individual
drivers because passengers do not have the option to rate the Uber system in-app separately from their
drivers.
International Journal of Communication 10(2016) A Case Study of Uber’s Drivers 3773
Figure 4. A weekly driver performance report.

3774 Alex Rosenblat & Luke Stark International Journal of Communication 10(2016)
Figure 5. An e-mail assessing a driver’s rating in the Uber system.
Passengers have the ability to watch drivers as they approach, surveil their route, and even have
the ability to track them after they have departed. The passenger app extends their role as “the watcher”
(a stand-in for a traditional manager; Fuller & Smith, 1991; Stark & Levy, 2015). Passengers, who are
also rated by drivers (Price, 2015), have begun to learn that they are empowered in Uber’s system in part
because of this literal oversight of drivers. Drivers need to maintain a rating of around 4.6/5 to remain
active on the app, although this requirement can vary by city. Passengers rate drivers on a scale of one to
International Journal of Communication 10(2016) A Case Study of Uber’s Drivers 3775
five stars, and drivers’ ratings are averaged to reflect their last 500 rated trips, although some drivers
receive deactivation notices if their previous 25 or 50 trips receive low ratings.
Even though drivers know ratings are averaged and that one rating should not make a difference,
drivers express much care and dissatisfaction anytime their rating goes down. A typical comment is,
“What’s the formula to get these results??!” Drivers throughout the course of our study reflected that even
when their behavior was unchanged, they would invariably experience a drop in their ratings and were
unable to protest successfully to have low ratings (that they perceived they received unfairly) removed. A
common sentiment is that passenger education on the rating system is low. Some drivers try to educate
passengers, such as relaying that “4” is a failing grade through in-car signs or in conversation.
The result of these metrics’ effect on employment behavior can also be seen in the ways drivers
treat passengers. Once a passenger is in the car, drivers often provide them bottled water or offer
chargers for their smartphones. Drivers try to gauge whether customers want to speak or if they would
prefer to stare at their smartphones, using a combination of friendly conversational attempts with eye
contact and general demeanor to guess their passenger’s preferences. These behaviors on the part of
Uber drivers are classic examples of what sociologist Arlie Russell Hochschild (2003) has identified as
“emotional labor,” whereby service workers like taxi drivers (Facey, 2010, p. 1265) or flight attendants
suppress or contain their emergent emotions to present a placating or welcoming demeanor to customers,
regardless of that customer’s reciprocal emotional state. This behavior is partial compensation by drivers
for Uber’s overt lack of communication with passengers about the function of driver ratings. Drivers in the
Uber system perform emotional labor in exchange for ratings instead of tips. Uber strongly discourages
the cultural practice of tipping that historically underwrites taxi labor in the United States (Hansen &
Jesperson, 2013; Lynn, 2015). Some drivers, in response to rate cuts, discuss how they no longer go to
the expense of providing bottles of water and snacks, but they express concerns that their ratings will be
lower compared with their peers.
Although rating systems can be billed as a way to build and scale trust and accountability in
platforms, they have other impacts on employment opportunities. Uber’s driver rating feature dovetails
with another managerial technique meant to structure and control the etiquette and uniformity of drivers’
behavior. Uber will send routine messages, as demonstrated in Figure 6, to drivers that recommend that
passengers give low or high ratings to drivers who behave in particular ways. This feedback is carefully
designed to be indirect, presumably to avoid the appearance of a company policy—instead framed as the
results of empirical data. The advice Uber provides about how passengers rate may be valid, but the way
the advice is delivered has the effect of creating confusion between what Uber expects of its drivers (as
opposed to what it merely suggests). Uber denies that the rating system has the substantive effect of
mediating company policies. In its ongoing employment misclassification lawsuit, Uber describes how it
provides “suggestions that, if implemented, may (or may not) help them [drivers] raise their star rating. .
. . Yet, some drivers, like Plaintiffs, believe they are required to follow these suggestions” (Uber B.V.,
2015, p. 7). The power of a nudge directed by an employer at a worker, however, has a stronger element
of control than a suggestion directed at a customer.

3776 Alex Rosenblat & Luke Stark International Journal of Communication 10(2016)
Figure 6. E-mail from Uber explaining desirable driver behaviors.

International Journal of Communication 10(2016) A Case Study of Uber’s Drivers 3777
Conclusion
In this article, we have outlined how Uber’s claims regarding its labor model, which center on
freedom, flexibility, and entrepreneurship, are complicated and contradicted by the experience of its
drivers. Throughout our analysis, we have demonstrated how power and information asymmetries emerge
via Uber’s software-based platform through algorithmic labor logistics shaping driver behavior, electronic
surveillance, and policies for performance targets. Through the Uber app’s design and deployment, the
company produces the equivalent effects of what most reasonable observers would define as a managed
labor force. At the same time, the decentralized structure of Uber’s systems and their rhetorical invocation
of “platforms” and “algorithms” may render the impression that Uber has a limited managerial role over
driver behaviors. Policymakers should take note of the power of automated systems to incentivize,
homogenize, and generally control how workers behave within the system despite claims to systematic
freedom or flexibility.
The relevance of these power dynamics to drivers or those who aim to organize drivers, such as
union leaders, may be variable. The role of platform disintermediation in shaping power relations and
communications between employers and workers may be more relevant for drivers who rely on Uber as a
source of primary income than for hobbyist or part-time drivers. Prospective interventions into the labor
rights and protections of workers in the on-demand economy should note that a minority of drivers may
be doing the majority of the work (Hall & Krueger, 2015, p. 20; Zatz, 2016) and thus stand to be most
impacted by labor rights interventions. Any intervention into these labor considerations should account for
the structure and emergence of employment hierarchies through Uber’s platform, especially given that
many businesses are seeking to use Uber’s business model as a template going forward.
As a case study in the emerging digital economy of on-demand labor, our analysis of the Uber
driver experience signals the need for further study of how emergent technical systems are experienced
by users of all stripes, constructed and deployed by companies, and represented in public and policy
discourse. In particular, as labor laws and regulatory classifications develop in response to the
provocations posed by on-demand companies to existing regulations, it is important to recognize that
each of these companies will foster different experiences for workers, and these distinctions should be
examined before drawing broad conclusions about the applicability of existing laws to them. More work is
needed to translate these insights into deployable changes – including new regulations or modifications to
existing ones—and must involve the joint participation of regulators (such as the Federal Trade
Commission), policy makers, decision makers at Uber, and passengers and drivers themselves.
References
Anderson, D. N. (2014). “Not just a taxi”? For-profit ridesharing, driver strategies, and VMT.
Transportation, 41(5), 1099–1117. doi:10.1007/s11116-014-9531-8
Aneesh, A. (2009). Global labor: Algocratic modes of organization. Sociological Theory, 27(4), 347–370.
doi:10.1111/j.1467-9558.2009.01352.x

3778 Alex Rosenblat & Luke Stark International Journal of Communication 10(2016)
Anonymous. (2015, September 15). My nine months as an Uber customer service rep. The Billfold.
Retrieved from http://thebillfold.com/2015/09/my-nine-months-as-an-uber-customer-service-
rep/
Beniger, J. (1989). The control revolution: Technological and economic origins of the information society.
Cambridge, MA: Harvard University Press.
Bhuiyan, J. (2016, March 6). Contracts and chaos: Inside Uber’s customer service struggles. Buzzfeed.
Retrieved from https://www.buzzfeed.com/johanabhuiyan/contracts-and-chaos-inside-ubers-
customer-service-struggles?utm_term=.vhWO4ZkRoM#.cn11P9weRJ
Boltanski, L., & Chiapello, E. (2007). The new spirit of capitalism (G. Elliot, Trans.). New York, NY: Verso.
(Original work published 1999)
Braverman, H. (1974). Labor and monopoly capital: The degradation of work in the twentieth century.
New York, NY: New York University Press.
Bruder, J. (2015, May 27). These workers have a new demand: Stop watching us. The Nation. Retrieved
from http://www.thenation.com/article/these- workers-have-new-demand-stop-watching-us/
Brustein, J. (2013, December 17). Uber explains why $35 a mile was the right price. Bloomberg. Retrieved
from http://www.bloomberg.com/news/articles/2013-12-17/ubers-travis-kalanick-explains-the-
car-services-surge-pricing
Campbell, H. (2016a, January 8). Uber to cut rates in more than 100 cities. Retrieved from
http://therideshareguy.com/uber-to-cut-rates-in-more-than-100-cities/
Campbell, H. (2016b, March 23). Why is Uber giving away so much money right now? Retrieved from
http://therideshareguy.com/why-is-uber-giving-away-so-much-money-right-now/
Castells, M. (2000). The rise of the network society. Oxford, UK: Blackwell.
Chan, N. D., & Shaheen, S. A. (2012). Ridesharing in North America: Past, present, and future. Transport
Reviews, 32(1), 93–112. doi:10.1080/01441647.2011.621557
Cherry, M. A. (2012). The gamification of work. Hofstra Law Review, 40(4), 851–858.
Clark, L. (2015, July 28). Uber denies researchers “phantom cars” map claim. Wired. Retrieved from
http://www.wired.co.uk/news/archive/2015-07/28/uber-cars-always-in-real-time
Cohen, B., & Kietzmann, J. (2014). Ride on! Mobility business models for the sharing economy.
Organization & Environment, 27(3), 279–296. doi:10.1177/1086026614546199
International Journal of Communication 10(2016) A Case Study of Uber’s Drivers 3779
Deleuze, G. (1990). Postscript on control societies. In Negotiations, 1972–1990 (M. Joughin, Trans.; pp.
177–182). New York, NY: Columbia University Press.
Diakopoulos, N. (2015, April 7). How Uber surge pricing really works. Retrieved from
https://www.washingtonpost.com/news/wonk/wp/2015/04/17/how-uber-surge-pricing-really-
works/?tid=a_inl
Facey, M. (2010). “Maintaining talk” among taxi drivers: Accomplishing health-protective behaviour in
precarious workplaces. Health & Place, 16(6), 1259–1267.
doi:10.1016/j.healthplace.2010.08.014
Fuller, L., & Smith, V. (1991). Consumers’ reports: Management by customers in a changing economy.
Work, Employment and Society, 5(1), 1–16.
Furuhata, M., Dessouky, M., Ordóñez, F., Brunet, M.-E., Wang, X., & Koenig, S. (2013). Ridesharing: The
state-of-the-art and future directions. Transportation Research Part B, 57, 28–46.
doi:10.1016/j.trb.2013.08.012
Gillespie, T. (2010). The politics of “platforms.” New Media & Society, 12(3), 347–364.
doi:10.1177/1461444809342738
Gillespie, T. (2014). The relevance of algorithms. In T. Gillespie, P. Boczkowski, & K. Foot (Eds.), Media
technologies: Essays on communication, materiality, and society (pp. 167–194). Cambridge, MA:
MIT Press.
Girard, M., & Stark, D. (2002). Distributing intelligence and organizing diversity in new media projects.
Environment and Planning A, 34(11), 1927–1949.
Gregg, M. (2011). Work’s intimacy. Malden, MA: Polity.
Gregg, M. (2015, September 11). The doublespeak of the gig economy. The Atlantic. Retrieved from
http://www.theatlantic.com/business/archive/2015/09/gig-economy-doublespeak-new-
labor/404779/
Griffith, E. (2015, August 11). The problem with “Uber for X.” Fortune. Retrieved from
http://fortune.com/2015/08/11/uber-profitable-business-model/
Griswold, A. (2014, October 27). In search of Uber’s unicorn. Slate. Retrieved from
http://www.slate.com/articles/business/moneybox/2014/10/uber_driver_salary_the_ride_sharing
_company_says_its_drivers_make_great.html
Gurley, B. (2014, March 12). A deeper look at Uber’s dynamic pricing model. Retrieved from
https://newsroom.uber.com/guest-post-a-deeper-look-at-ubers-dynamic-pricing-model/

3780 Alex Rosenblat & Luke Stark International Journal of Communication 10(2016)
Hall, J., & Krueger, A. B. (2015, January 22). An analysis of the labor market for Uber’s driver-partners in
the United States. Retrieved from https://s3.amazonaws.com/uber-
static/comms/PDF/Uber_Driver-Partners_Hall_Kreuger_2015.pdf
Hansen, P. G., & Jespersen, A. M. (2013). Nudge and the manipulation of choice. European Journal of Risk
Regulation, 4(1), 3–28.
Hill, K. (2015, April 16). Meet the lawyer taking on Uber and the rest of the on-demand economy. Fusion.
Retrieved from http://fusion.net/story/118401/meet-the-lawyer-taking-on-uber-and-the-on-
demand-economy/?utm_source=nextdraft&utm_medium=email
Hochschild, A. R. (2003). The managed heart: Commercialization of human feeling (2nd ed.). Berkeley,
CA: University of California Press.
Hockstein, E. (2015, May 17). The gap at the app: Uber’s practices fall short of written policy. Al-Jazeera
America. Retrieved from http://america.aljazeera.com/blogs/scrutineer/2015/5/8/ ubers-
practices-fall-short-of-written-policy.html
Horwitz, J. (2015, July 30). Uber customer complaints from the U.S. are increasingly handled in the
Philippines. Quartz. Retrieved from http://qz.com/465613/uber-customer-complaints-from-the-
us-are-increasingly-handled-in-the-philippines/
Hwang, T., & Elish, M. C. (2015, July 27). The mirage of the marketplace. Slate. Retrieved from
http://www.slate.com/articles/technology/future_tense/2015/07/uber_s_algorithm_and_the_mir
age_of_the_marketplace.html
Irani, L. (2015, January). Difference and dependence among digital workers: The case of Amazon
Mechanical Turk. South Atlantic Quarterly, 114(1), 225–234.
Johnson, B. (2014, November 24). How to get away with Uber. Retrieved from
https://medium.com/matter/how-to-get-away-with-uber-75b406043733
Kantor, J. (2014, August 13). Working anything but 9 to 5. The New York Times. Retrieved from
http://www.nytimes.com/interactive/2014/08/13/us/starbucks-workers-scheduling-hours.html
Kedmey, D. (2014, December 15). This is how Uber’s “surge pricing” works. TIME. Retrieved from
http://time.com/3633469/uber-surge-pricing/
Kingsley, S., Gray, M. L., & Suri, S. (2015, November 15). Accounting for market frictions and power
asymmetries in online labor markets. Policy & Internet, 7(4), 383–400. Retrieved from
http://sidsuri.com/Publications_files/pi_mkt_power.pdf

International Journal of Communication 10(2016) A Case Study of Uber’s Drivers 3781
LaFrance, A. (2015, April 7). He said, she said: How Uber relied on data in an assault dispute. The
Atlantic. Retrieved from http://www.theatlantic.com/technology/archive/2015/04/he-said-she-
said-how-uber-relied-on-data-in-an-assault-dispute/389811/
Lee, M. K., Kusbit, D., Metsky, E., & Dabbish, L. (2015). Working with machines: The impact of
algorithmic, data-driven management on human workers. In Proceedings of the 33rd Annual ACM
SIGCHI Conference, Seoul, South Korea (pp. 1603–1612). New York, NY: ACM Press.
doi:10.1145/2702123.2702548
Leidner, R. (1999). Emotional labor in service work. Annals of the American Academy of Political and
Social Science, 561(1), 81–95.
Lin, H., Kalanick T., & Wang, E. (2014, January 9). System and method for providing dynamic supply
positioning for on-demand services. Retrieved from http://www.freshpatents.com/-
dt20140109ptan20140011522.php
Lobel, O. (2015, September 30). The law of the platform. Retrieved from
https://www.law.umich.edu/centersandprograms/lawandeconomics/workshops/Documents/Paper
%206.%20Lobel.%20The%20Law%20of%20the%20Platform.pdf
Lowrey, A. (2015, April 30). How one woman could destroy Uber’s business model—And take the entire
“on-demand” economy down with it. New York Magazine. Retrieved from
http://nymag.com/daily/intelligencer/2015/04/meet-the-lawyer-fighting-ubers-business-
model.html
Lynn, M. (2015). Service gratuities and tipping: A motivational framework. Journal of Economic
Psychology, 46, 74–88. doi:10.1016/j.joep.2014.12.002
Neff, G. (2012). Venture labor: Work and the burden of risk in innovative industries. Cambridge, MA: MIT
Press.
Newcomer, E. (2015, December 3). Uber raises funding at $62.5 billion valuation. Bloomberg. Retrieved
from http://www.bloomberg.com/news/articles/2015-12-03/uber-raises-funding-at-62-5-
valuation
O’Brien, C. (2015, January 22). Princeton economist explains why we should all stop worrying and learn to
love Uber. VentureBeat. Retrieved from http://venturebeat.com/2015/01/22/inside-ubers-
staggering-u-s-growth-40000-drivers-joined-in-december-and-average-19-per-hour/
O’Connor, Colopy, Manahan, and Gurfinkel v. Uber Technologies, Inc. (2015a, January 30). Transcript of
proceedings. Retrieved from http://uberlawsuit.com/Uber%20-
%20Transcript%20of%20hearing%20on%20summary%20judgment%20-%201-30-15.pdf
3782 Alex Rosenblat & Luke Stark International Journal of Communication 10(2016)
O’Connor, Colopy, Manahan, and Gurfinkel v. Uber Technologies, Inc. (2015b, August 6), CV 13-03826-
EMC. Brief for Defendant Uber Technologies, Inc.’s Opposition to Plaintiffs’ Motion for Class
Certification. Retrieved from http://www.scribd.com/doc/271072643/BRIEF-Uber-Opposition-to-
Motion-for-Class-Certification-1
Porter, E. (2015, January 27). Job licenses in spotlight as Uber rises. The New York Times. Retrieved from
http://www.nytimes.com/2015/01/28/business/economy/ubers-success-casts-doubt-on-many-
job-licenses.html?_r=0
Price, R. (2015, February 11). The incredibly simple way to find your “secret” Uber passenger rating.
Business Insider. Retrieved from http://www.businessinsider.com/uber-passenger-rating-how-to-
customer-stars-how-do-i-2015-2
Raiser, LLC. (2015, December 11). Technology services agreement. Retrieved from
https://s3.amazonaws.com/uber-regulatory-documents/country/united_states/
RASIER%20Technology%20Services%20Agreement%20Decmeber%2010%202015.pdf
Ritzer, G., & Jurgenson, N. (2010). Production, consumption, prosumption: The nature of capitalism in the
age of the digital “prosumer.” Journal of Consumer Culture, 10(1), 13–36.
doi:10.1177/1469540509354673
Rosenblat, A. (2015, July 27). Uber’s phantom cabs. Vice. Retrieved from
http://motherboard.vice.com/read/ubers-phantom-cabs
Saval, N. (2014). Cubed: A secret history of the workplace. New York, NY: Doubleday.
Scholz, T. (Ed.). (2013). Digital labor: The Internet as playground and factory. New York, NY: Routledge.
Schüll, N. (2012). Addiction by design: Machine gambling in Vegas. Princeton, NJ: Princeton University
Press.
Smart, R., Rowe, B., Hawken, A., Kleiman, M., Mladenovic, N., Gehred, P., & Manning, C. (2015, July).
Faster and cheaper: How ride-sourcing fills a gap in low-income Los Angeles neighborhoods. Los
Angeles, CA: BOTEC Analysis Corporation. Retrieved from http://botecanalysis.com/wp-
content/uploads/2015/07/LATS-Final-Report.pdf
Smith, R., & Leberstein, S. (2015, September). Rights on demand: Ensuring workplace standards and
worker security in the on-demand economy. Retrieved from
http://www.nelp.org/content/uploads/Rights-On-Demand-Report.pdf
International Journal of Communication 10(2016) A Case Study of Uber’s Drivers 3783
Stark, L., & Levy, K.C. (2015, June). The consumer as surveillor. Paper presented at the 2015 Privacy Law
Scholars Conference, Berkeley, CA.
Strochlic, N. (2015, May 21). Uber: Disability laws don’t apply to us. The Daily Beast. Retrieved from
http://www.thedailybeast.com/articles/2015/05/21/uber-disability-laws-don-t-apply-to-us.html
Sunstein, C. R. (2014). Nudging: A very short guide. Journal of Consumer Policy, 37(4), 583–588.
doi:10.1007/s10603-014-9273-1
Uber. (2014, December 29). Dynamic pricing 101. Retrieved from
https://www.youtube.com/watch?v=76q7PDnxWuE
Uber. (2016, February 2). Find a city. Retrieved from https://www.uber.com/cities/
Uber B.V. (2015, October 15). Services agreement. Retrieved from https://s3.amazonaws.com/uber-
regulatory-documents/country/united_kingdom/Uber+BV+Driver+Terms+-+UK+Preview.pdf
Uber Newsroom. (2015, December 7). New survey: Drivers choose Uber for its flexibility and convenience.
Retrieved from https://newsroom.uber.com/driver-partner-survey/
Uber Newsroom. (2016, February 2). Celebrating cities: A new look and feel for Uber. Retrieved from
https://newsroom.uber.com/celebrating-cities-a-new-look-and-feel-for-uber/
Uber Technologies. (2014, November 10). Uber partner agreement. Retrieved from
http://www.dropbox.com/s/rlp3o4oylh0zt4n/Partner Agreement November 10 2014.pdf
Uber Technologies. (2015a, April 8). Legal. Retrieved from https://www.uber.com/legal/usa/terms
Uber Technologies (2015b, September 17). The effects of Uber’s surge pricing. Retrieved from
http://newsroom.uber.com/2015/09/the-effects-of-ubers-surge-pricing/
Uber Technologies. (2015c, October 13). Introducing an all-new app for partners. Retrieved from
https://newsroom.uber.com/2015/10/new-partner-app/
White, G. (2015, June 8). In the sharing economy, no one’s an employee. The Atlantic. Retrieved from
http://www.theatlantic.com/business/archive/2015/06/in-the-sharing-economy-no-ones-an-
employee/395027/
Zatz, N. (2016, February 1). Is Uber wagging the dog with its moonlighting drivers? on labor. Retrieved
from http://onlabor.org/2016/02/01/is-uber-wagging-the-dog-with-its-moonlighting-drivers/

3784 Alex Rosenblat & Luke Stark International Journal of Communication 10(2016)
Zureik, E. (2003). Theorizing surveillance: The case of the workplace. In D. Lyon (Ed.), Surveillance as
social sorting: Privacy, risk and digital discrimination (pp. 31–56). London, UK: Routledge.
Zwick, D. (2015). Defending the right lines of division: Ritzer’s prosumer capitalism in the age of
commercial customer surveillance and big data. The Sociological Quarterly, 56(3), 484–498.
doi:10.1111/tsq.12101
Top Related