


Languages
Pages
Legal


Arkansas Water Resources Center
ALGAL GROWTH POTENTIALS AND HEAVY METAL CONCENTRATIONS OF THE PRIMARY
STREAMS TO UPPER BEAVER LAKE
By
Richard L. Meyer and W. Reed Green, Department of Botany & Microbiology and Kenneth F. Steele and Diana Wickliff, Department of Geology,
University of Arkansas, Fayetteville, Arkansas 72701
1986
Publication No. PUB-122
Arkansas Water Resources Center 112 Ozark Hall
University of Arkansas Fayetteville, Arkansas 72701
Prepared for : United States Department of the Interior

~~-- ~--
).1
'IALGAL GROWTH POTENTIALS AND HEAVY METAL CONCENTRATIONS
II OF THE PRIr~ARY STREAMS TO UPPER BEAVER LAKE
II Richard L. Meyer and W. Reed GreenDepartment of Botany & Microbiology
andII Kenneth F. Steele and Diana Wickliff
Department of GeologyUniversity of Arkansas
I Fayetteville, AR 72701,
I Research Project Technical Completion Report
II Project G-1004-02
The research on which this report is based was financed in part by theUnited States Department of the Interior as authorized by the Water
I Research and Development Act of 1978, (P. L. 95-467).
Arkansas Water Resources Research CenterI University of Arkansas
223 Ozark Hall
Fayetteville, AR 72701
II Publication No. 122
II June, 1986
I Contents of this publication do not necessarily reflect the views andpolicies of the U. S. Department of the Interior, nor does mention oftrade names or commercial products constitute their endorsement orrecommendation for use by the U. S. Government.
II The University of Arkansas, in compliance with federal and state laws
and regulations governing affirmative action and nondiscrimination,I does not discriminate in the recruitment, admission and employment of
students, faculty and staff in the operation of any of its educationalprograms and activities as defined by law. Accordingly, nothing in
I this publication should be viewed as directly or indirectly expressingany limitation, specification or discrimination as to race, religion,color or national origin; or to handicap, age, sex, or status as a dis-abled Vietnam-era veteran, except as provided by law. Inquiries con-
I cerning this policy may be directed to the Affirmative Action Officer.
III
I""'"""'"

I ABSTRACT
ALGAL GROWTH POTENTIALS AND HEAVY METAL CONCENTRATIONS
II OF THE PRIMARY STREAMS TO UPPER BEAVER LAKE
II Meyer and Green (1984) demonstrated the probable inhibition ofalgal growth potential by heavy metals in upper Beaver Lake. Upper
I Beaver Lake receives water from three tributaries. One contains asmall reservoir and the combined streams receive sewage input. Col-lections were made approximately monthly at eight sites for the Algal
II Assay Bottle Test (AABT) and heavy metal analysis.
In general, AABT results indicated that the collections abovethe sewage lnput were phosphorus limited while those below were nitro-
I gen or combined nitrogen and phosphorus limited. Growth inhibitionI occurred during summer and early fall at various sites with greater
inhibition at the confluence of the streams. No inhibitions occurred~,II at the site below the sewage input.
i",~ Heavy metal concentrations had an overall tendency to increase down-;,1" 1 stream. Values within the small reservoir were 50-100% higher than
~, in the feeder stream. Highest values of Pb were observed below thereservoir. SO ,Cl, Mg, Ca, Na and K had high values during lowflow in August10ctober. The low values were independent of high
"' I flow. Pb followed an independent pattern. Storm event results~" showed that the Ca maximum was before the hydrographic peak while Fe,
Mn, Pb, In, Co, Ni, Cu and Cd attained their maximum just after theI peak. Maximum values were 4-10 times backgr~un~ values. Mn, Pb and, .Fe exceeded EPA recommended standards for drlnklng water.['
Richard L. Meyer, W. Reed Green, Kenneth F. Steele and Diana Wickliff
I"'::.
l~:11 Completion Report to the u. S. Department of the Interior, Geological~;:; Survey, Reston, VA, June 1986c1i 1:
II Keywords --Algal Assay/Nutrients/Heavy Metals/Toxicity
Ic".I i, ,
...

TABLE OF CONTENTS
I Page
I Abstract. iList of Figures. iii
II List of Appendix Tables. v
Acknowl edgements vi
I Introduction. 1
II A. Purpose and Objectives. 4
B. Related Research or Activities. 5
;'.1 Methods and Procedures. 6'""
Ifr~,; Principal Findings and Significance. 11
.J Conclusions. 54rII L itera~ure Cited. 57
m Appendlx Tables. 59}W:
~I,'-
I::;~~IIi";~ Ii~,,."
I'j;~ I .
~
I
~I~I(
1.1t .."I\ I
I iic '" -.., c, """','

c ,~
I '
II LIST OF FIGURES
Page
Figure 1. Location of Sampling Sites. All Samples wereI Collected Upstream of Bridges Except for OM
which was Collected at the Dam on Lake Sequoyah. .7
I Figure 2. Downstream Variation in Manganese Concentration,August 21, 1985. """" 13
I Figure 3. Plot of Calcium Concentration, Specific Conduc-tivity and Stream Flow versus Hours AfterInitiation of Rain for the First Rain Event. ...16
I Figure 4. Plot of Sodium and Magnesium Concentrations,and Stream Flow versus Hours After Initiationof Rain for the First Rain Event. .." 18
I Figure 5. Plot of Nitrate, Ammonium and OrthophosphateConcentrations versus Hours After Initiation
If of Rain for the First Rain Event. 19
Figure 6. Plot of Iron Concentration and Stream FlowI versus Hours After Initiation of Rain for the
FirstRainEvent""' 21
Figure 7. Plot of Manganese, Lead and Zinc ConcentrationsI versus Hours After Initiation of Rain for the
FirstRainEvent""' 22
I Figure 8. Plot of Calcium Concentration, Specific Conduc-tivity and Stream Flow versus Hours After Initia-tion of Rain for the Second Rain Event. 25
I Figure 9. Plot of Sulfate Concentration and Stream Flowversus Hours After Initiation of Rain for theFirstRainEvent""""" 26
II Figure 10. Plot of Sulfate Concentration and Stream Flowversus Hours After Initiation of Rain for the
II Second Rain Event. ""' 27
Figure 11. Plot of Nitrate, Ammonium and OrthophosphateI Concentrations versus Hours After Initiation ofRain for the Second Rain Event. 28
Figure 12. Plot of Manganese, Lead and Zinc ConcentrationsI versus Hours After Initiation of Rain for the
Second Rain Event. "" 30
II iii

';"
I'
ILIST OF FIGURES (Cont.)
PI ageFigure 13. West Fork Baptist Ford Summer and Early Fall
Maximum Standing Crop. 33
II Figure 14. West Fork Baptist Ford Late Fall and WinterMaximum Standi ng Corp. 34
II Figure 15. Middle Fork Highway 16 Summer and Early Fall~"~ Maximum Standi ng Crop. 35:;.;,
:;11 Figure 16. Mid~le Fork H~ghway 16 Late Fall and Winter,." Max1mum Stand1ng Crop. 36,j ,
",;
~~I Figure 17. Eas~ Fork Hig~way 74 Summer and Early Fall~~ Max1mum Stand1 ng Crop. 37~;~:(Ir'~1 Fi gure 18. Eas~ Fork Hi g~way 74 Late Fall and Wi nter~, MaX1mum Stand1ng Crop. 38;&ii~;CI" Figure 19. Lak: Sequoyah.Dam Summer and Early Fall
': Max1mum Stand1 ng Crop. 39~;;:i'::';: Fi gure 20. Lake Sequoyah Dam Late Fall and Wi nter
,I Maximum Standi ng Crop. 40
i~\ic. Figure 21. White River Iron Bridge Summer and Early Fallfi ll Maximum Standing Crop. 41'"'~~; Figure 22. White River Iron Bridge Late Fall and Winter'II Maximum Standing Crop. 42
~i Figure 23. Whi~e River W~man Bridge Summer and Early Fall~" Max1mum Stand1 ng Crop. 43
{,I Figure 24. White River Wyman Bridge Late Fall and Winter":~" Maximum Standi ng Crop. 44..
,II Figure 25. White River Highway 45 Bridge Summer and Early Fall';' Maximum Standi ng Crop. 45,
f\1I Figure 26. Whi~e River H~ghway 45 Bridge Late Fall and Winter>, Max1mum Stand1 ng Crop. 46
~
~' I Figure 27. Whi~e River H~ghway 68 Bridge Summer and Early Fall.j Max1mum Stand1 ng Crop. 47
.I Figure 28. Whi~e River H~ghway 68 Bridge Late Fall and WinterMax1mum Stand1 ng Crop. 48
i'"' I,,' , ,c.f,1;
fJ iv
~~l:1

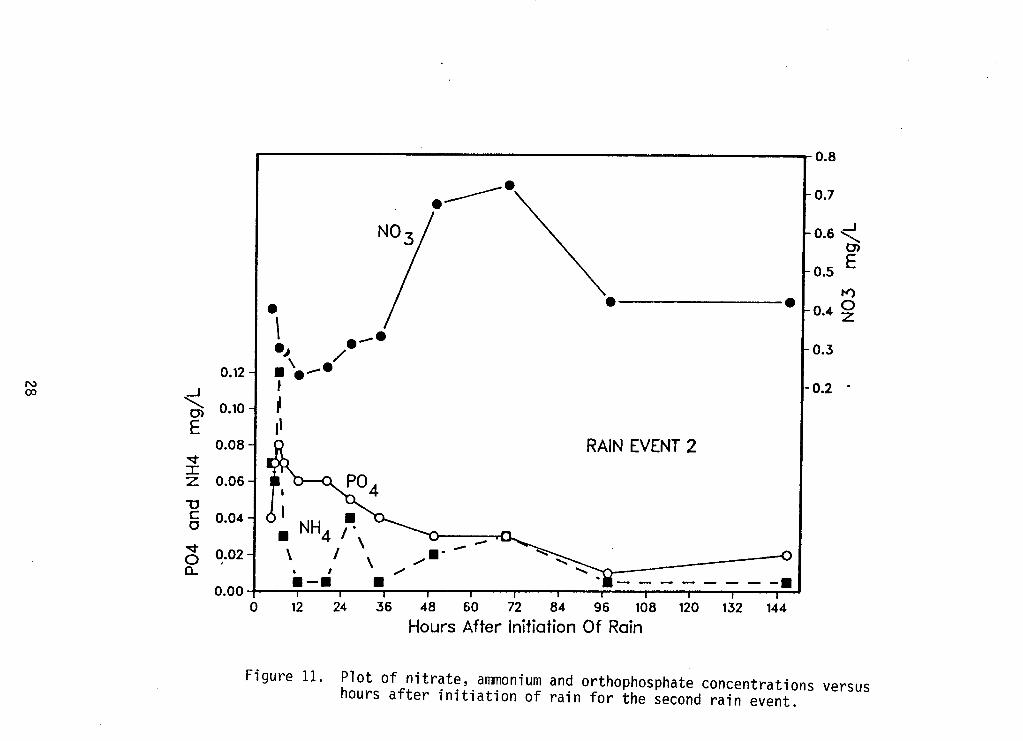
I LIST OF APPENDIX TABLESPageI Table 1. Summary of Analytical Methods and Precision. 60
Table 2. Field and Selected Laboratory Analysis for WhiteRiver Samples. 61
II Table 3. Seasonal Heavy r~etal Analysis for All Sites andStream Flow Data for Site IB 66
II Table 4. Strea~ Flow,.Field Measurements and Cation Analysis;f for Flrst Raln Event. 70
1"1 Table 5. Anion and Ammonium-N Analysis for First Rain Event. 71
~,' Table 6. Heavy Metal Analysis for First Rain Event. 72',-,.'C.
:;,1 Table 7. Comparison of the Effect of Different Pore-Sized~,~ Membranes on the Heavy Metal Concentrations of~Ji.;; Fi 1 tered Stream Samples. 73
""'1 Table 8. Stream Flow, Field Measurements and Cation Analysisfor Second Ra in Event. 74
Table 9. Anion, Ammonium-N and Silica Analyses for SecondRain Event. 75
; Table 10. Heavy Metal Analyses for Second Rain Event. 76~!I:,~..,
'.r~~t~. Table 11. Maximum Standing Crop. 77;~',.~:II Table 12. Chemical Characteristics and Calculated Productionif... Yields for Predicted Phosphorus Limited Samples. ..81~:;;:::~
~-I.' .Table 13. Chemical Characteristics and Calculated Production
!.. Yields for Predicted Nitrogen Limited Samples. ...84
:I;::'I~; Tabl e 14. C~emi ca 1 Charac~eri sti~~ and Ca 1 cul ated Production
; Ylelds for Predlcted Nltrogen and Phosphorus
,T.:. Co-l imi ted Samples. 84
II Table 15. Assay Derived Limiting Nutrient Influence. 85
I~ Table 16. Algal Growth Inhibition of Samples with Gre~ter Than',\.,,'1 50% Inhibition of NP vs. NPE and Correspondlng.'. Sample Test. 86
",;,;.:i", Table 17. Bioavailable Nutrients With and Without the,-:1 I nfl uence of EDT A 87.;::',. Table 18. Percent Inhibition Indicated by the Test Treatments
Wi th and Wi thout EDTA 91
v

III ACKNOWLEDGEMENTS
I I ~he assistance ~f the u.S. .GeO1Og~C~1 Survey, espeCiallY.JOhn
Cott1ngham and Chr1s O'Dell, 1n obta1n1ng stream flow data 1S
I acknowledged.
The support of the u.S. Department of the Interior, Geological
II Survey, who provided the funds, and Dr. Leslie E. Mack, Director,
I Arkansas Water Resources Research Center, is greatly acknowledged.
A special appreciation is extended to Gloria Wood, Dorothy Wit-
II torff, Pauline Mueller and Mark Adams for their assistance in the
preparation of the manuscript.
IIII :"
.I
III
:";I" ...
II vi

III INTRODUCTION
The Selenastrum capricornutum Printz Algal Assay Bottle Test
II (AABT), (Miller et al., 1978a) has been developed: (1) to determine
the nutrient status of a natural body of water and its sensitivity to
II changes in nitrogen and phosphorus loadings; (2) to evaluate the
I introduction of waste materials or products and determine their
potential stimulatory or inhibitory effects on algal growth; and (3)
II to define the impact and the effects of introduced complex wastes
originating from industrial, municipal, and agricultural point and
II non-point sources. It is intended to be used: (1) to identify algal
I growth-limiting nutrients; (2) to determine biologically the avail-
ability of algal growth-limiting constituents; and (3) to quantify
II the biological response to changes in concentrations of algal growth-
limiting constituents.
I The test procedure is based upon a modification of "Liebig's Law
I of the Minimum", which in theory states that the maximum growth yield
produced by an organism is proportional to the amount of a nutrient
I or combination of nutrients which are present and biologically avail-
able in minimum quantity in respect to the growth requirements of the
II organism involved (Miller et al., 1978a).
II The AABT is a familiar tool used by water management and related
institutions for the assessment of multiple use bodies of water.
II Research involved with this test is primarily directed towards prob-
lematic and stressed aquatic ecosystems. Numerous laboratory and
II field studies have been conducted in association with the development
I.1 1

~f r
J:'c
and application of this procedure and protocol. A detailed bibliog- r
raphy of thi s research up to 1978 i s presented by Lei schman et a 1 .,;
(1979). ~
Nutrient requirements for the algal test organism (~. capri cornu-
~) has been conducted by Shiroyma et al. (1973). When essential
nutrients are present at sufficient levels, the growth of~. capri-
cornutum will define the amount of nitrogen and phosphorus biologi-
cally available within the test water.
In addition, the AABT procedure can define the biological reac-
tive status and influence of heavy metals that might inhibit algal
growth (Miller et al., 1978a, 1978b). Rai et al. (1981) discuss the
function of heavy metals as essential trace elements necessary for
algal growth and the influence of high concentrations of these chemi-
cals upon growth inhibition and toxicity. High concentrations of
heavy metals not only inhibit algal growth, but also reduces indige-
nous alga1 diversity. This reduction results in the economically and
environmentally dominance of the most tolerant forms, most of which
are undesirable greens and b1ue-greens.
However, the application of the AABT and the inhibited growth
response of~. capricornutum may not necessarily reflect the growth
potential of the indigenous algae which have adapted to these condi-
tions through long-term exposure of such (Miller et al., 1978b).
Greene et al. (1978) found strong correlations between the EDTA
treatments with the combination of nitrogen and phosphorus, and that
of the indigenous standing crop measured by chlorophyll-a. Eloranta
2
"C""", "'" "",,'

I.III and Halttumem-Keyrilainen (1984) determined that the results of the
AABT are more sensitive to heavy metal influence than assays con-
II ducted with inoculations from natural phytoplankton samples.
Quantitative determinations of heavy metal inhibitory effects
I upon the growth of~. capricornutum have been reported by Greene et
II al. (1975); Christensen and Scherfig (1979); and Michnowicz and Weaks
(1984). Specific conductance and pH function in the regulation of
II biologically reactive heavy metal concentrations. Synergistic and
antagonistic interactions can occur with the combination of high
II concentrations of these chemicals. The presence of high concentra-
I tions of heavy metals as determined by chemical analysis, mayor may
not influence cell growth. Only biological response analysis can
I determine the influence of heavy metal concentrations (Miller et al.,
1978b).
II Miller et al. (1974) used the AABT to determine the limiting
I nutrient in a number of waters. They found that phosphorus limita-
tion decreased as the trophic status of the test water increased. As
I the phosphorus concentrations increased, the test water became more
likely to be nitrogen limited. Davis and DeCosta (1980) found that
II all waters in their study were phosphorus limited and that toxic
II factors such as heavy metals were not important factors controlling
algal important factors controlling algal growth. The AABT procedure
I was used by Ram and Plotkin (1983) to assess the influence of munici-
pal and industrial waste discharges and the removal of phosphorus
II along a heavily used river system. These test waters were nitrogen
II 3

Ep r
l~limited below the discharge sites. It was determined that the
r"
removal of phosphorus would not change the nutrient status of these
waters. T"
A. Purpose and Objectives
The protocol of this study was designed to determine the source
of the heavy metals causing the algal growth inhibition discovered by
Meyer and Green (1984) in upper Beaver lake. Specifically, the
research focused upon the distinct differences in the three primary
streams feeding into the upper lake. The eastern stream is bordered
by forest and farm land. The middle stream includes an impoundment
which may effect heavy metal concentrations. The western stream
receives the urban runoff from the villages of West Fork and Green-
land and the moderate-sized city of Fayetteville. All three streams
drain areas with exposed shales with known concentrations of iron
(and other heavy metals) and sulfide ions. The combined streams
receive the effluent from the city. The industry located along the
streams and the industry within the city may be sources of heavy
metals.
The research protocol was structured to permit the determination
of the background level of heavy metals from natural origins and the
contribution by each tributary. The inclusion of lake Sequoyah pro-
vides some insight into the influence of a small impoundment on heavy
metal distribution. The post sewage outfall results indi-cate the
influence of urban runoff and domestic/industrial wastes. Two reser-
voir sampling stations are used to estimate the total input influence
4

,
and assimilation within the lake.
B. Related Research or Activities
Meyer and Green (1984) conducted an AABT study within the body of
water of the present research. It was found that nitrogen was the
limiting nutrient directly below the municipal waste discharge site.
The test water gradually became phosphorus limited further down-
stream. Storm events accelerated water flow which influenced
nutrient limitation downstream. The presence of heavy metal inhibi-
tion of algal growth was determined in a number of samples during
different seasons and associated with a storm event.
The results of the past study (Meyer and Green, 1984), led to
the development and application of the present study. One of the
objectives of the present study is to better resolve the influence of
industrial and municipal wastes discharged from the City of Fayettev-
ille's sewage treatment plant. This plant is located in the upper
reaches of Beaver Lake Reservoir. Upstream from the treatment plant
are the confluences of the three tributaries of the White River and a
small impoundment (Lake Sequoyah). Objectives also include the
determination of nutrient and heavy metal influence upon algal
growth, contributed by these bodies of water.
The White River, along which the sewage treatment plant is
located, and the three forks of the White River make up over 80% of
the drainage basin of Beaver Lake. Beaver Lake is a multi-use reser-
voir and supplies the drinking water to the majority of the popula-
tion and institutions in northwest Arkansas. Quantitative and quali-
5

II
tative determinations of nutrient limitation, growth potential and
Igrowth inhibition within this system will provide water management
basic data to determine future strategies. I
METHODS AND PROCEDURES
Physical and Chemical Procedures and Parameters I
Samples were collected approximately monthly from May, 1985 II
through April, 1986 from eight sites on the White River at least
three days after a major rain. The west, middle and main stream of II
the White River were sampled above lake Sequoyah at the bridges at
Baptist Ford (BF), Highway 16 (16) and Highway 74 (74), respectively. II
Samples also were collected at lake Sequoyah Dam (OM) and Iron Bridge II
(IB) near Baldwin, Wymann Bridge (WB) near Wymann, the bridge on
Highway 45 (45) near Goshen and at the bridge on Highway 68 (68) near I
Pleasant Valley on the White River (Figure 1). Samples also were
collected at IB during two rain storm events in September and Octo- II
ber, 1985. Temperature, pH, conductivity and total alkalinity were II
determined in the field on raw water samples (Table 1).
Collections were divided into "heavy metal" and "algal" subsets. I
Two 500 ml "heavy metal II samples were filtered through a 0.40
micrometer pore-size membrane using a freon-pressurized unit and II
stored in plastic bottles that had been prewashed with nitric acid. II
One sample was acidified with 1.5 ml of 1:1 nitric acid for cation
analyses in the laboratory. The other 500 ml sample was refrigerated II
for anion, ammonia and silica analyses at the laboratory. The
"algal" subset samples were placed on ice and filtered in the labora- I
I6 I

IIII.I
III
I"I::r;'f'.,]/ 1'~ ~~..",',
~,c.£'1,\"[
I~/
I.,:~
"
" Figure 1. Location of sampling sites. All samples were collected;;~'I upstream of bridges except for OM which was collected
:;" at the dam on Lake Sequoyah.
::,:"t';1..,\ '..~~
I. 7

~
,-
, .,
~;
tory through Schleicher & Schuell #30 filters prior to nutrient ana-
lysis and inoculation.
U. S. Environmental Protection Agency (EPA, 1983), American
Public Health Association (APHA, 1985) and Hach Chemical Company
(1984) methods were used for analyses of the "heavy metal" subset
samples. However, the chelation-extraction method of Nix and Goodwin
(1974) was used for heavy metal analyses. See Table 2 for specific
methods and precision for each analysis.
Chemical analysis for the "algal" subset included determinations
of nitrate-nitrogen, nitrite-nitrogen, ammonia-nitrogen and ortho-
phosphorus concentrations. Nitrate-nitrogen was determined by the UV
method (Standard Methods, APHA, 1975) using a Perkin-Elmer model 202
spectrophotometer. Nitrite-nitrogen, ammonia-nitrogen and ortho-
phosphorus were determined using a Bausch & Lomb Spectronic 70 spec-
trophotometer. Nitrite-nitrogen was determined by Method 354.1 (EPA,
1979). Ammonia-nitrogen was determined by the Chaney and Marboch
method (Chaney and Marboch, 1962). Orthophosphorus was determined
using the stannous chloride method (Standard Methods, APHA, 1975)
using 10 cm cuvettes. Nutrient standards were prepared from stock
solutions purchased from Hach Chemical Company, except for the nitri-
te-nitrogen standards which were prepared in the laboratory.
Nutrient analysis was conducted within 24-48 hours after collection.
Algal Assay Bottle Test Procedure
The experimental design and protocol used for this research pro-
ject was that prepared by Miller et al. (1978) for the EPA entitled
8
~-

III "The Selenastrum capricornutum Printz Algal Assay Bottle Test."
The test water samples were initially filtered through Schleicher
II & Schuell (S&S) #30 glass fiber filters. Following filtration the
samples were divided into 50 ml aliquots in 125 ml test flasks and
I then autoclaved. Control and nutrient additions were added to tri-
II plicate test flasks. Nutrient additions to the triplicate test
flasks were as follows.
I 1. Control (C) (test water without nutrient additions)
2. Control + 1.00 mg Na2EOTA/l (E)
II 3. Control + 1.00 mg Nil as NaN03 (N)
II 4. Control + 1.00 mg Nil + 1.00 mg EOTA/l (NE)
5. Control + 0.05 mg Pil as K2HPO4 (P)
I 6. Control + 0.05 mg Pil + 1.00 mg EOTA/l (PE)
7. Control + 1.00 mg Nil + 0.05 mg Pil (NP)
I 8. Control + 1.00 mg Nil + 0.05 mg Pil
II + 1.00 mg EOTA/l (NPE)
The test alga Selenastrum capricornutum Printz was obtained
II through the Carolina Biological Supply Co. (cat. #15-2520). The
test organism was grown as stock cultures maintained in log growth
I using Synthetic Algal Nutrient Medium (Miller et al., 1978). Weekly
I transfers were made in order to maintain log growth. An inoculum
equivalent to 1,000 cells per ml were added to each test flask.
II The test flasks were maintained under constant temperature (24 !
0.50 C) and continuous 400 ft-c fluorescent light. The test flasks
II were shaken at least once daily for a period of fourteen days.
II 9

r, ,
..,p
Cell growth production was determined by gravimetric biomass.
The cells were harvested by filtration through S&S #30 glass fiber
filters on day fourteen. The filters were dried using a Thelco
vacuum oven and a vacuum desiccator. Weights were determined using
a Mettler H-18 analytical balance. Triplicate tests were averaged
together and factored by 20 to determine the maximum standing crop
produced as mg dry-weight biomass per liter.
Data Analysis
Experimental results were determined using the maximum standing
crop (M$C) weights of each test. The nitrogen yield coefficient (38)
and the phosphorus yield coefficient (430) (Miller et al., 1978) were
used to determine the expected yields produced by ambient nutrient
concentrations and nutrient additions. Potential maximum standing
crop production was calculated by multiplying the orthophosphorus
concentration of a sample by 430 or by multiplying the TS1N concen-
tration by 38. Biologically available phosphorus concentrations were
calculated by dividing the MSC produced by nitrogen treatments by
430. Biologically available nitrogen concentrations were determined
by dividing the MSC produced by the phosphorus treatments by 38. The
percent algal growth inhibition after fourteen days (%114) was deter-
mined using corresponding nutrient tests with and without the addi-
tion of EDTA. The control MSC was subtracted from the control + EDTA
MSC and then divided by the EDTA MSC and multiplied by 100. Similar
calculations were us~d with the N-NE, P-PE and the NP-NPE tests to
determine percent inhibition associated with nutrient limitation.
10
.'

III PRINCIPAL FINDINGS AND SIGNIFICANCE
General Parameters and Heavy Metals
I Seasonal Variation in Water Chemistry
Although there are some differences among sites, generally it can
I be stated that the period July through September had the highest
I values for specific conductivity, alkalinity, pH, sulfate, chloride,
ammonia, magnesium, calcium, sodium and potassium (Tables 2 and 3).
I This observation is consistent with the higher amounts of evaporation
and the lack of surface water recharge to the streams during this
I period. Although a few of the heavy metals exhibit high values dur-
ing this period, the lack of a specific period of high heavy metal
II concentrations (Table 3) requires additional explanation. During
I periods of surface water recharge, higher loads of suspended sedi-
ments and/or colloids with absorbed heavy metals could affect heavy
II metal concentrations if some of these particles passed through the
0.40 micrometer pore-size filter. Thus, the conditions during the
II periods of low recharge which lead to sluggish, stagnant conditions
II could allow more of the suspended sediment to settle out of the water
resulting in low heavy metal concentrations. The possibility of
II suspended sediments and/or colloids passing through the 0.40 microme-
ter pore-size will be discussed in more detail in the section on
II Variation in Water Chemistry During Storm Events/First Storm Event.
I Chemistry During Storm Events
Because the IB site was used as the site for storm event samp-
I ling, it is impor~ant to note the seasonal variation in water chemis-
II 11

~>,:);,
~ I
I~ '~ ~::
try at this site. Generally, August and September sampling dates ~
give the highest values except for the heavy metals. The explanation
for this period giving high values is the same as for the entire ~
stream, i.e., higher evaporation rates and lack of surface water
recharge. Variation in amount and type of suspended sediment load at
IB could explain the lack of a period of consistently high heavy ,--
metal concentrations.
Variation of Water Chemistry Among Sites
The water chemistry of the White River generally shows a trend
downstream toward Beaver Lake for the heavy metals. The upper
stream sites (BF, 74 and 16) generally have the lowest heavy metal
concentrations for any sampling date. There is an increase in con-
centration downstream to WB, which is located below Sequoyah Dam. It
is somewhat surprising that the site at the dam on Lake Sequoyah
follows this trend since the lake had been expected to effect the
water chemistry. Apparently, the lake behaves much as a large pool
on the river in terms of water chemistry, especially since the water
overflows the top of the dam. The higher nutrient concentration at
this site may be due to the outflow from Fayetteville waste water
treatment plant and/or agricultural activities. Site 45 is either
slightly higher or lower in concentration than WB. However, site 68
always has low concentration values (e.g., Figure 2). These differ-
ences in heavy metal concentrations at the sites are attributable to
the geology and geohydrology of the areas in the vicinity of the
stream. The rock type plays an important role in the water chemistry
12
F':'
i', c"
,,~cli" :,-
:;\,1~
c,".: Ij"
.;
-I.()::;I
(X)
,. ,
" ..-,.:\~"
..k
-'~
;J IN
c,'
.f-)!!~
I/)
i,sc ~01~
I =
~0'r-.f-)
I ~
" ~
Ic 0
uQ)
I/)Q)
I ~
m
~I
~
o~0or-.f-)
IIc or-S
-IC>E
I ~.f-)I/)c
I3
" C
O~
&I.
g-ro..m
.c
N
.I ~01
'r-LI..I
0 0
0 0
0 0
00
~
0 ~
0
W)
~
N
N 1/6n
u W
IIII 13

~
.~ iI
, r~f."
due to both dissolved and suspended load. The Fayetteville Shale is ~
exposed near all of the sites, except site 68. Thus, the shale could
contribute heavy metals as suspended sediment directly to the river r~
or via tributaries, and also could contribute dissolved ions by means
of soil or ground water. The topography of the areas with shale
present may be the controlling factor for most of the sites. High
relief areas would probably contribute more suspended sediment due to
erosion, and more soil and ground water due to better drainage than
low relief areas. Thus, the upstream sites have low concentrations
of heavy metals due to the low relief of the shale, and the concen-
tration of the heavy metals increases downstream due to an increase
in relief. The heavy metal concentrations decrease dramatically at
site 68 due to lack of shale in the vicinity of this site and because
of the 'Ipool" nature of this site, which would allow suspended sedi-
ments to settle out. However, during storm events, this site might
receive considerable suspended sediment from upstream and thus cause
elevation of the heavy metal concentrations.
Variation of Water Chemistry During Storm Events
It is often thought that the critical period for pollution in
streams is the period of lowest flow (as exemplified by the seasonal
behavior of many of the White River parameters); however, this is not
necessarily the situation. Nutrients have the potential to be washed
into streams during storm runoff from surface sources, and because
heavy metals are often adsorbed onto the suspended sediment it would
be expected that a higher metal content would occur during high flow
14
-~

IIII conditions when suspended sediment load also would be high.
Thus, the purpose of this portion of the study was to determine
I the effects of storm events on the water chemistry of a portion of
the White River. An effort was made to eliminate the effect of the
I suspended sediment load by filtering the samples through 0.40 micro-
II meter pore-size membranes. The 1B site on the West Fork of the White
River was chosen for this part of the study. The monitoring site is
II located about four miles east of Fayetteville near Baldwin, Arkansas.
The West Fork drains a basin of about 110 sq. mi., which is composed
II of limestone, shale and sandstone. The landuse in the area is pre-
II dominantly pasture and forest. However, the river does flow nearby
several small towns and along the outskirts of Fayetteville adjacent
I to an industrial park.
The river was sampled following a 1.5 inch rain in September and
II a 2.0 inch rain in October, 1985. Samples were collected approxi-
II mately every hour or two immediately following the rain, with the
sampling intervals becoming progressively longer after the peak of
II the stream hydrograph (Table 2).
First Rain Event
.II During the first storm event, the highest flow rate of 120 cfs
II (cubic feet per second) occurred approximately eight hours after
initiation of rain. Some parameters increase in concentration as the
II stream hydrograph peaks; whereas, others decrease (Tables 4-6). Spe-
cific conductivity, calcium (Figure 3) and total alkalinity exhibited
I initial increases in concentration which peak about three,hours after
II 15

,-i~
,
, i"i
..~
.r.j..)
°4wn
puoJ dS
~>I/)
0 I/)
0E
Q)
I/) '"'"
N
-I/) to
~N
N
N
N
~
Q
)CS
- or-
+JtO
V1
S-
.r
CO
-';:'.j..)
0 C
V1
-tOS
-O
r-
~4-
.j..)'r-
Q)
IID
>
..c -
m
or- +
J.j..)U
S-
~O
-';:'4-I
..g C
'"'" U
or-
..-CO
to
C
U~
0- or-
Z
0 4-4-
.Wr
~
°r-0>
N
- ~
CW
""'0
0.0V
1 or-~
C
..~
« I
0 C
'r-
~~
-.;: O
.j..) 0
0 or- or-
ID
0- .j..)
C
..-=
to or-
"::C
S
- -.j..)~
{I co2
~~
'"'"- C
to«
8V1
!U
) ~
.L
E~
\ID
:J o~
~I")
0 U
I r--V
1,
to ~
UV
1
Y.)
~
6~u
3:' .j..)3;
0./
~~
-0..4-
.~~
'
';:! M
.-.oc::.-: o---
Q)
0;01
0 or-U
-'"'"
N
0 C
O
0 0
0 0
0 0
I") I")
I") N
0
CO
ID
'"'"
N.-
l/5w
OJ
S~
:> M
O\j
16

II
the hydrograph peak and then exhibit decreases in concentration.
II These parameters reached a minimum 28 hours after the rain began and
I returned to background values as flow returned to base flow (Figure
3). The initial increase in values can be attributed to flushing of
I readily available surface sources which are rapidly depleted by the
I storm runoff. The later decrease in values represents a dilution
effect caused by the influx of rain water as runoff.
II Magnesium, sodium (Figure 4), potassium and chloride reached
maximum concentrations slightly after the peak of the hydrograph.
II Although these cations reached maximum concentration values at the
II same time as specific conductivity, total alkalinity and calcium,
these ions did not exhibit a dilution effect. Thus, there was a
I flushing effect of readily available material that increased the
concentration of the ions slightly above background, and then a
II return to background values following the hydrograph, because the
II source of the ions was not depleted. The behavior of nitrate, ammo-
nia and orthophosphate (Figure 5) is similar to the ions discussed
I above with the main difference being the lag time for these ions to
reach maxima and the fact that the concentration peaks versus time
I are broader for these ions. Note that nitrate was still returning to
I background concentration at the end of the sampling period. There
are two possible explanations for the behavior of these three
II nutrients. One is that the source for these nutrients was some dis-
tance from the sampling site, and the other is that the source mate-
I rial for these ions required a "wetting" time before the ions could
I.I 17

r..
, ,~itt
I/):JI/) .,~
1/6w UO!~DJ~Ua:)UoJ ~, co In ..pi) N 3:
0ro-l+-. I a) E~ ItSC
OJ OJ~ >o\-'OJI/)
I C"0 or-CItsIts~
"0\-'1/)1/)
I C ~~ 0 or-a) or- I+-
-0\-'L- C Its OJr-- .-~ ..c
Z a 0\-'0\-'.\ ~ r N~ ~~W , 0 UC
CI+-Z C 8c~ 1.2 Eo::;;~ ~ 0 a o~ ~
\O~ 1/)4-..-OJ 0\ c: C -C)C I '- ItSC
I a)~ E~
~- "0 Its
< C'r-1tS0\-'I (/) or- .'- EC\ :J:J or- ID 0 or-
pI)~ "O~-L. OOJ
I 1/)0\-'4-. / 6 Its/ ..I/) N o\-'~ 3:' O:J
a .Q / '0::.2:z .~ ~..o
0- ---~.d-.~~. 0-:::-:-- --0-- -~
, O:Je. C)
0 ~
0 0 0 0 0 0 0N 0 a) \0 ..N
SJ:) MO\j
lR

111 '
I ~(/) >
s:: (1)
01
or- s::
CO
+
>
or-0
tOtO
.-~
~+
>s::+>
(1) (/)
Iu~
C
O
s:: 'r-
01 ot!-U
(1)(1)..s:::
.+>
+
>I
.-to I-
~
..s:::~
ZC
O
0..0(/)t!-
W
C
0>
s::: s::
I.w
.~
g- '::;
z/
N-
:5~
"<
""'0 ~
t!-~
00
Ic-os::
.2 s::
0
-+-
to 'r-0
0 +
>co.-
E to
.==
::3
'r-1
/c
or- +
>
-s:: 'r-
~
os::Q
)E
or-
co E
~-:::
to~I
<(
.,2
.~
2~
/co:J
~(/)
I"):r:o
+>
~or-
::3I
s::o.oo:t
8 t!-o-:
/:r:
° Z
/ ~
+
>~
1o~
/
..-(1)
0->.8- --.
--:.
-N
Lnt't")
.-
I0
~Z
~°,-
0 LL-
Ico,
co I/)
I") N
'":
0°
0 .
0 0
0 0
0 0
0 0
I l/B
w U
O!tD
.JtUa~
UoJ
1II. 19

~
,.,
be dissolved in significant concentrations. Sulfate concentration
initially peaked with the hydrograph and also exhibited a second
broad peak. The nature of the sulfate peaks may be related to sul-
fate being made available from shale by oxidation of pyrite in the
form of sediments (i.e., first peak) and as dissolved ions from
ground water (i.e., second peak). The explanations for the behavior
of these parameters discussed above are similar to that used by
Steele et al. (1985) to explain the variation in water chemistry in
spring water following storm events and Wickliff and Steele (1986) in
their investigation of heavy metals in stream water. Miller and
Drever (1977) found similar trends (specific conductivity, bicarbo-
nate [total alkalinity], calcium and potassium) for the North Fork of
Shoshone River, Wyoming with the exception of a dilution trend for
sodium.
Of the heavy metals, iron had the highest concentrations rising
from a background of about 200 ug/l to a maximum of 1100 ug/l seven
hours after the peak of the hydrograph (Figure 6). Manganese, lead
and zinc (Figure 7) exhibited similar trends. Note that iron, manga-
nese and lead (Table 6) concentrations all exceed the EPA (1976)
drinking water standards of 300, 50 and 50 ug/l, respectively.
Although much lower in c.oncentrations, cobalt, nickel, copper and
cadmium also reach maximum concentrations following the peak of the
hydrograph. Whipple and Hunter (1977) found the highest concentra-
tions of heavy metals in storm runoff from urban areas to occur
within the first 30 minutes of storm runoff. Under natural stream
20
I

II. IIIS
t:) /1101.:1
I00
0 0
0 0
~N
~
~
aJ
...0 <
lJ01-.>4-C
O
.I .?
~I
~
:E:
I ~
~<
lJt-
I >
.
IQ
!03:~
>
10
~~
W
.c: 4-<
lJZ
0-
E
cI
-I
C
CO
or-«
Q:
<lJC
OQ
: '4-
b~aJO
V
') 01-.>
I V
')I
'1
'otc: "O
~
0 C
or- 0-
CO
4-
-C
C<
lJ0-
o..c:..=
=
or- 01-.>
/c:
01-.>I
-co~
IO\-
~o
rt)<1)
01-.>4-
-CI
'4- <
lJC«
U
or-I
JC
CO
(/)
o~
.\- U
:J 4-
, 0
C
0...0
/N
I ~
C
Ior-o~4-01-.>
, 0
CO
or-d'
01-.>01-.>
.0
or-
I~
.--C
~
if ~
c..°r-
;.>-~
.
or:::.:. 0.-
1.0
I ~
-~
---o ~
~
01or-
0 L1-
I0
0 0
0 0
0 0
0 0
0 0
0 a
N
0 aJ
10 'ot
N
I l/6n
UO
!tD.JtU
o:)UO
~
oj
III 21

---
~i-
t r.i,,--
"V
)S
-~0..c:
.<:.
V)
~\
N
V)
I"- s-
QJ
°>
~t:
, V
) QJ
t: >
OQ
J'r-~
t:~
0
ItS
"r-ID
S
-1tSI-
,~
s-Zw
..' c
~ ~
I.-u
V)
>
0 t:S
-
W
~
0 or-
Z
I -U
4--«
rtJo U
QJ
t:..c:~
"'t
C
or- ~0
N.-S
-
,-0
1:1 0
t:4-°
.-/0
..,.-=
t:\
C
1:1 'r--/0/0
ID\-
QJS
-,
I") Q
) r--
1-4- -"0 «
QJ
V)t:
cn Q
JO...\-
t: 'r-
/:J
/O~
"'t.$
~,~
N-1-
1tS~
dE
'r- ..c
t:
a.. 4-
or-
..0~
S-
C
~Q
J
.-~
-- '
.'-- N
,9. ~
"'"~'
, ,.. N
C
- /0
."'P"-
--;: '
I °
~
0-- ..~
:r- .r--~
I Q
J."'"
.S-
~C1
or-0
u-
0 0
0 0
0 0
0 0
0\0
..N
0 IX
) ID
"'t
N
l/6n U
O!~
DJ~
ue:>U
o:)
22

,
conditions, manganese is precipitated from solution more readily than
iron because of the autocatalytic effect on manganese precipitation.
Thus, the dissolved concentration of these two metals should not
correlate well. Figures 6 and 7 show a good correlation between
these two elements indicating that the source for these two metals is
nearby, or that particulate material is passing through the filter.
Kennedy et al. (1974) found that fine-grained particulate material
can pass through 0.45 micrometer pore-size membrane filters and cause
large percentage errors in analyses of iron, manganese, aluminum and
titanium that are enriched in the particulates relative to the water.
In order to evaluate the possible importance of particulate material
in this study, a water sample was collected at IB during a rain event
in March, 1986. The results indicate that significant amounts of
some heavy metals (especially iron) pass through 0.40 micrometer
pores and that most are collected on 0.30 micrometer pores or smaller
(Table 7). Thus, it appears that a significant amount of some heavy
metals could have been leached from suspended material by the acid
used to stabilize the White River water samples. Williams et al.
(1973) found no correlation between stream flow and the soluble heavy
metals in the Black Warrior River at Tuscaloosa, Alabama. However,
they did find a strong positive correlation of heavy metals and the
resuspended bottom sediments present in the water column following
increased flow and scour from heavy rain runoff.
Comparison of the Two Rain Events
Sampling began just before the peak of the hydrograph during the
:;1'".1.

II
second rain storm event in October~ The parameters exhibited trends II
similar to those of the first rain events (Tables 8-10). The flow
rate was approximately five times greater in the second rain storm II
event than in the first; thus, it is not surprising that the dilution
effects are greater (about 2x) than those for the first rain event, II
and that it required twice as long to return to background values II
(Tables 8 and 9 and Figure 8). Although the heavy metal concentra-
tions, with the exception of iron, were higher in the second rain II
event, the ranges in concentrations were similar. Thus, iron, manga-
nese and lead concentrations again exceeded the EPA (1976) standards II
for drinking water (Table 10). Some other differences between the II
two rain storm events are:
(1) sulfate exhibits a dilution effect in the second rain II
event after exhibiting an increase that corresponds
with the peak of the hydrograph (Figures 9 and 10) II
(2) ammonia and orthophosphate both reach a maximum that II
closely follows the peak of the hydrograph (rather than
the later peak exhibited during the first rain event) II
(3) nitrate exhibits a second peak in concentration during
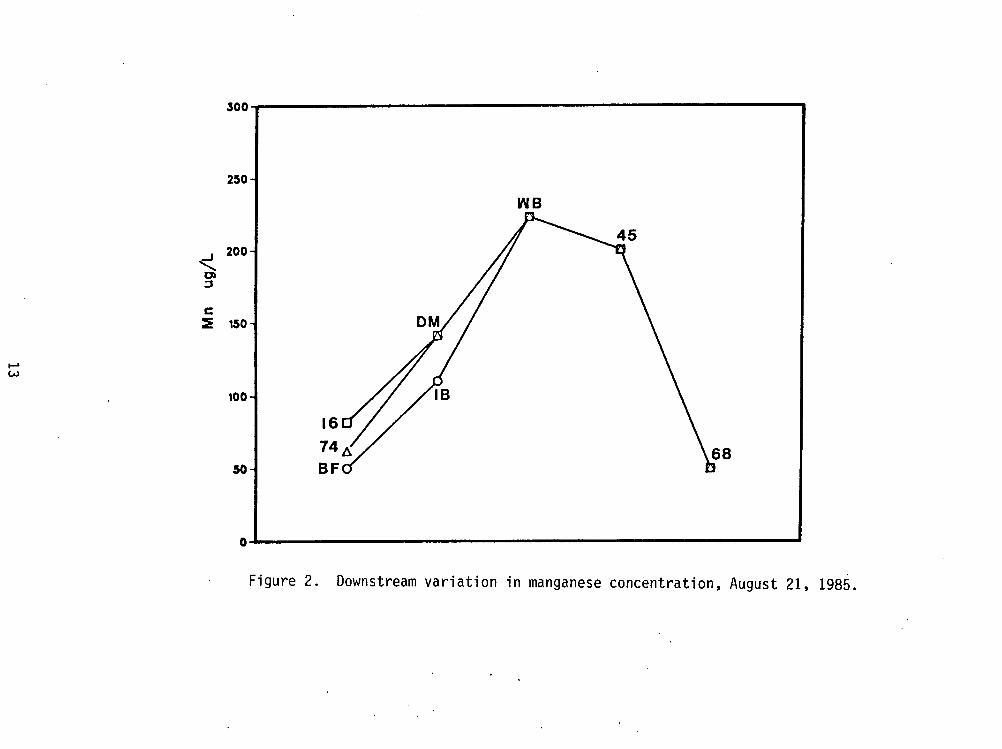
the second rain event (Figure 11) II
(4) maximum values for the heavy metals occurred at the peak ..
of the hydrograph during the second rain event rather
than after the peak II
(5) Manganese, copper, lead, ~obalt ~nd nickel reache~ a
Isecond peak in concentratlon durlng the second raln
I24 I
""' ~'Oc. ,

I
II ...;c
Q)
°Llwn pu°:J dS E ~I roc 0 In 0 In 0 Q) or-
In NO,... In ~tON N N ---IJ~
VI"0
I . ? "!t "OC..,. CO-~U
Q)I >,vII -IJ N or- Q)
rt') >~I -:;:;-IJI U ~I =s 0 N 0"04-
~ cI- OCI z u O;;W> I 0) u~
1 0 or-W -.~ 4- 4-
C or- 0
I .~ IDQ: ~§c'::1?: I 0)0 VI:;:;
I ..~ C C or-
I ~ .2 o~ ~--IJC
I C ~ Or-J :.-= ~ .--IJ ~I NC CQ).1"-- Q)-IJ
\- U4-I Q) C ~
-0
"'C I o~ UvI .-ID ~
'- E=s
0 (/) =soI U L or- ~00):3 U
D- / "!to r--VII :I: ~r4-Q)ID 0>J rt') -IJ3: 3: 00
I ~ "!t 'a:: '4:La-" N
--.if .CX)
I r- ~ ~cQ:..Q o~
0 ll-
t ..,.NOO)ID"!t 0 0 0 0 0 0pt')pt')rt')NNN 00000In ..,. rt') N -
1/6w o:J s~:) MolJ
IIII 25

-, ,
1/6w e~Dtlns ~...,N 0 ~ CO "t N 0 4-,.., ,.., N N N N N to
tnS-::3.r ~ ~
, S-W>3:0 0
,, 4- C
~ W.-E> C tOW..-0- t' cz a ..., or-
.w r ~ IntO> N- S-f W "'O-g..., Z tOtn
-C s-<{ ,0 C or-
0- 0 4-~ ~ 0 -'r- a ...,w
(0-.;: to-c.0- s ,\ c...,I, ~ ~ ~~
~- oc<{ U or-
to. ! (/) ws-~ (0 '5 ~4-,..,04-0
:I:';cI tn 00 . ) 4-~ V> Oto
I ~ or- N ...,...,
3:' 0 or-
.~ ~./ 0:: ,;:
./ ~ ~ ~---~.~---o--- t'° ---~::3.--v rn
0 ;:
0 0 0 0 0 0 0N 0 ~ co ~ N
Sf:) MOIJ
26

f
S-
l/6w e~Dtlns ~4-
0 10 N CO '-t taIt') N N V1
s...
.Q '-t gI ~ ..cI V1I N ~
It') S-
...QJ >I 3: 0
, 0 0 "*-'"" N r-- c::
...4-QJI- >Z EQJW I CO CSc::> 1 <2 c s W 0- "*-' ta
Z 0 V1S-
-IO~ "0"0<! I m- c::c::~ 0 taOI u C C::QJ
~ 0 o~ V1
(X):.:: "*-,QJ.I 0 ta..c
\ J :-E.b"*-'NC C::S-
.r'-.- QJOL g4-\ I Q) oc::I 0':: u '~
100<{ QJS-"*-'
(/) ta4-L
.0 (X):J ~O\ / ~O ~C:: I V10or-
4-"*-'10 ota. J It') 'r-
"*-'"*-'
\ 3: ~ 'c.0 Coo or-
\ -~LI-" N
..q-~. 00~ a0 r-I
V>. 0--00 ~ QJ.-.rD.g 5.--v-.o 01
or-0 u-
0 0 0 0 0 0 00 0 0 0 0 010 I/') ~ It') N ...
Sf:) Mol.:J
?7
III
IIV
)~
1/6w
£ON
.~
I~
,...
CD
It)
~
N
>0
0 0
0 0
0 0
V)
t::0
0
."'" ~
~I
to Q
)~
>
oI.JQ)
t::Q
Jt::I
U "-
t::tOO
~U
-CN
.Q
)t::oI.JO
I..-tO
UZ
..c:Q
)W
~
V)
>O
Q)
C
..c:..c:W
.-c..
oI.JI
0 0
.z
~
..c:~-10«
01- oI.JO
~
0 ~
4-t::I
c -c
0'-0
t:: to
,~
0-
to ~
-+-
0 E
4-:.::
~O
.
.-"-I
NC
t::t::
r-.- 00
.'- E
"-\
(J.) E
oI.J -+
- tO
tO
0 -',-
I\C
o<{
ftol.JQ
) 0.-(/1
oI.Jt::'-
to "-.
'~"'"
~"5
t ~I'i')
:r: ° ~ ;f:
10
CD
6tO
z. ~
V
)\
oI.J~I
o~ 0
c c:
" N
.°\ ~
I.~
Q
)~
/ ~
-.8---=-
~.0)
0 i.:
IN
0
~
CD
N
0
-: -:
0 0
0 0
00
0 0
0 0
0- 0
1/6w
-rHN
PU
D -rO
d III
28 I

---
, f
t.
event (e.g., Figure 12). Lead, cobalt, nickel and cad-
mium also exhibited this bimodal character during the
first rain event.
The bimodal nature of the heavy metal peaks suggest that there
are two sources of heavy metals, perhaps one at a greater distance
from the monitoring site. The difference in behavior of the other
ions between the two storm events probably is due to different
amounts of readily available ions, variation in suspended sediment
load, variation in soil moisture and variation in ground water chem-
istry. In turn, these variations can be attributed to time between
rains, and amount and intensity of rain.
Algal Assay
Ambient nitrogen and phosphorus concentrations and the propor-
tionality of these nutrients provides the basis for determining
nutrient limitation. It has been determined (Miller et al., 1978)
that the growth of Selenastrum capricornutum becomes phosphorus
limited in waters containing N:P ratios greater than 11:1 and
nitrogen limited in those less than 11:1. Background nutrient data
can be used to place a sample in a limiting category; however, to do
so without assay analysis is discouraged according to the previous
author. Assay response can verify nutrient limitation with better
resolution and determine the biological availability of these
nutrients within the test water in question. Nutrient additions with
and without the chelator (EDTA) addition can determine if growth
inhibition occurs due to heavy metal toxicity and the extent of the
'1n

I
III~
I
~0..~
..c:
~
IS
- °
aJoj..)
->a3
IV
»~
aJ0'r-
~-oj..)
or-njltS
IS
-S-
N
~
~"O
I- ~
C
aJ~Z
.-U
0C
~U
W
OaJ
I>
.IO
~
UV
>W
01-
UaJ
0 ~
..c:Z
Cor-
oj..)-N«
-"'0 S
-I
~
~~
"OO
C
~C
+-
.-ItS-~
N.C
"0
or-.C
. f"" ~
:!l ~I
\'/
Q)
C+
- -"0
0- aJ
10« V
>~
I ~
~...:;
I/8
/-;.~
5 [:Z//,/
j :I:
E or-
C
./
'. ~
6 °:
I~
-~~
~---
/ oj..) aJ
---~~
~
,p / '
/ ~
~
~ ~
I
."""""'
a.. .P
..,
\ N
.~
.~.-I
I°
~
aJ
~
-.:.;::::0 _8
S-
8--==
.88 ocQ
.--8~.
~010
or-0
0 0
0 0
0 LJ-
I0
(D
N
~
-.,.N
--
1/6n UO
!tD.JtU
e~U
o~
I
1 .II
30 I

inhibition if it does occur
Background Data
Nutrient ratios and calculated production (MSC) yields based on
ambient nutrient concentrations of the test water were used to pre-
Based on these results, the testdict growth limiting nutrients.
water samples can be separated into three categories of potential
phosphorus, nitrogen and nitrogen-phosphorusnutrient limitation:
co-limitation
Table
11).
Those samples which were expected to be phosphorus limited are
In all cases, the N:P ratio is greater thanpresented in Table 12.
11:1, and the calculated MSC based on ambient phosphorus concentra-
tions are less than those based on the ambient nitrogen con centra-
The calc!Jlated production yields further clarify the expectedtions.
results based on the N:P ratios
The majority of the test water samples collected were predicted
to be phosphorus limited (Table 12). In general, all three tributar-
ies of the White River and the sites after the confluence of the
tributaries upstream from the sewage discharge site were expected to
be phosphorus limited throughout the sampling period.
Below the sewage discharge site, phosphorus levels were great
All samples taken directlyenough to expect nitrogen limitation.
below the sewage discharge (45) were classified to be nitrogen
During the late autumn and winter collectionslimited (Table 13).
this nutrient influence continued downriver, as seen in the 68 site
During the summer and early fall collection dates, phosphorusdata.
31

levels declined between 45 and 68, enough to categorize 68 as being
phosphorus limited. At one instance (68, 1/11/86), the N:P ratio and
the calculated production yields were such that neither nitrogen or
phosphorus could be expected to imit growth more than the other.
IThis sample was placed into the category of nitrogen and phosphorus
co-limitation Table 14).
The effluent from the sewage discharge dramatically changed the
expected growth limiting nutrient status and the calculated cell
growth potential of this aquatic system. Upstream from the sewage
discharge site, in the three tributaries and the post-confluent
sites, phosphorus levels remain extremely low throughout the year
Associated with these low levels is the low potential for algal pro-
duction. Under these conditions, the calculated growth yields never
exceed the level of 10.0 mg/l. However, below the sewage discharge
Isite where phosphorus levels are extreme enough to indicate nitrogen
limitation, the potential algal growth yields are roughly an order of Imagnitude higher
Maximum Standing Crop Production
The maximum standing crop produced by the test water assays are
presented graphically in Figures 13-28, and the corresponding concen-
trations are found in Table 11. The test water collections above the
sewer treatment plant generally produce low maximum standing crop
values as expected. In many of the control treatments, ambient
nutrient concentrations were at such levels that cell growth could
..
not be detected. using the present experimental technique. This also
I. 32


-
I 9£
II (L/5w JSW) "do..tJ 5U~pUE:j.S
WnW~XEW ..ta:j.u~M PUE LLE~ a:j.El 91 AEM45~H ~..to~ aLPp~w "91 a..tn5~~
III ~1S11
I
.I 9~/~I
I I98/8/£ I':,.
I 8 "IL"
8Z "
I 8J III 11'111"11' II/1111 I8~ / "I /' II /1 I"
I ,I I " I80 / I' / / I0 ,I ,/ I' ,I
I'1/'
88T 1/1, ,I
8Z1 ' "/~III 8;1 /I891 I
dOH) ~IaNijlS NnwIX~ H!INIK aN~ 11ijJ ]1U1 ~1JW
IIII

L£
(L/5w JSW) °do~J 5u~pu~+SWnWLX~W LL~~ AL~~3 pu~ ~awwns vL A~M45~H ~~o~ +s~3 °Ll a~n5~~
Sl~l
~8
~8/LZ
8
8,
8i
89
88 I , .' "/I " I
, 88T I II/I ,II
I ..
8ZJ 1,.11 ,1
8i J 1/'" ...89J ...
dOHJ 'NI«N~lS WnwIXijW '1ij~ ~1H~J i H1WWn~ ~L!J
j

!
I 8£
-I
I .(l/5w JS~~) 8 do~J 5u ~pU~+S
wnwLx~I.1 ~a+uLM pU~ ll~~ a+~l vL A~M45~H ~~O~ +S~3 881 a~n5~~ I .n .
II Sl~l
II 98/9
I 98/8/£I 8 It"
8,.I 8v " /1 IIII "...1 / I
" I I "" / , 89.' "" I ,.' I .",
I11..."1/ 88./ ,I I'" 1"/"I /
1 I I IIoaTI /" , ..1
00 ..1 I ..
Ien 1/"/II"i/.." I , ..
iT ,/,"
I89TdOHJ ~IaNijlS WnwIXijW KiLNI" , 1'~1 ]!ij1 pLl!
IIII

(L/5w :)SW) "doJ:)5u~pue~s wnw~xew LLe~ ALJe3 pue JaWwns wea 4eAOnbas a~el "61 aJn5~~
j

I Ov
I.
I (L/5wJSW) °do..{J5u~pu~+S wnw~x~W ..{a+u~M pu~ LLe~ a+~l wea 4eAonbas a~~l °02 a..{n5~~
III ~1~1
I
I
I 98/8
I 8
I :I 89 ,I ,/ / I
as,° I ,/ ,/ / v/' ..." /
IIJI ,/ / ,/ ..,/ /".."/ '
8~J 'I' /I 8fT ,,/
8~1 ,/I dOH' ~I~ijIS NrtlIXIJW H]~I" i "~A II'll W«S'I
IIII

Tv
(L/5w JSW) "do~J 5u~pu~~Swnw~x~w LL~~ ~L~~3 pu~ ~awwns a5p~~8 UO~I ~aA~~ a~~4M "T2 a~n5~~
~
~8
s8lu'
8
8~
ev'j' ..." , "
110 ,/, / ,,/ ,,/ ../ "1 ' .." , "--//' / ,/ /
, "
AR ..1 I !' ../ --/ /I..
111111 ,IFV'I --j I A ~ T j ...,,1
8V1
891'dOHJ ~I«NijIS W~IX~ TIijj h'I'd'd'I i :i1WWns aIm
;


169
.149
12Q
.188
~ 89
.69
40
29
Q.
lW27/85
I
/f
.....
/,I
I.1
1I
,I
-...' -...,~...'-"]
.c..." ..,.~
, ."-
I"
rESr~
White River Highway 68 Bridge Summer and Early Fall
Maximum Standi ng Crop. (~1SC mg/l)Figure 27.
47


f
occurred in many of the nitrogen and phosphorus additions. With the
addition of both nitrogen and phosphorus the maximum standing crops
increased as was expected
The influence from the sewage effluent can be seen in those sites
The maximum standing crops of thebelow the sewage treatment plant.
control tests from 45 are much greater than those above the sewage
This nutrient influence continues downstream during theplant.
During the summer andwinter collections, as seen in the 68 data.
fall collections, the results from 68 resemble those of the up
stream sample sites.
Nutrient Limitation
imitation of the test water is better resolved throughNutrient
the analysis of assay results. From the results of this experiment,
a number of nutrient limiting situations occur. If the test water
was phosphorus limited, for example, the addition of phosphorus (0.05
mg/l} to the test water would increase the maximum standing crop.
Similar results could occur under nitrogen limitation with the addi-
1.00 mg/l If the non-limiting nutrient (nitrogention of nitrogen
in the case of phosphorus limitation} functions in a secondary way
then the addition of both nitrogen and phosphorus would produce a MSC
This wouldgreater than that of the limiting nutrient added singly.
be the case under phosphorus limitation if the addition of phosphorus
changed the N:P ratio to a ratio below that of 11:1, resulting in
Under these conditions, the combined nutrientnitrogen limitation.
additions would produce a MSC similar to those calculated for the
49

ambient nitrogen yields with the addition of nitrogen
Conditions can occur in which neither nitrogen or phosphorus are
Istrongly limiting growth over the other and resulting in co-
limitation. Neither the addition of nitrogen or phosphorus produces
increased growth, but the combination of both does. It can be deter-
mined which nutrient influences growth in a primary sense by compar-
Iing the assay produced maximum standing crops with those expected to
occur. If the actual combined yield is more similar to the expected
phosphorus addition yield, then phosphorus is the primarily nutrient
Iinfluencing growth. The same would be true for nitrogen if the
expected nitrogen addition yield was similar to the MSC produced by
the combination or both nutrients.
Synergistic growth effects from the combination of both nutrients
can be determined if the addition of both nitrogen and phosphorus
produce a MSC greater than the single nutrient additions, as well as
those expected to occur. Again, nitrogen or phosphorus may be the
primary limiting nutrient, or they may be co-limiting.
ICategories of nutrient limitation and influence can be classified
based on the results of this research as follows: phosphorus limita-
Ition, nitrogen limitation, nitrogen and phosphorus co-limitation,
nitrogen and phosphorus co-limitation with primary phosphorus influ-
Ience, nitrogen and phosphorus co-limitation with primary nitrogen
influence, nitrogen imitation with nitrogen and phosphorus synergis-
tic influence, phosphorus limitation with nitrogen and phosphorus
Isynergistic influence, and nitrogen and phosphorus co-limitation with
. 50

synergistic influence. Categorized assay results are found in Table
15
Relationships exist between the assay results and the seasonal
Spatial continuity exists withand spatial test water collections.
those sites above the sewage treatment plant and those below the
Temporal continuity exists between the summer and early falplant.
October) collections and the late fall and winter collections
(November -March).
In general, the results from the sample sites above the sewage
treatment plant during the late fall and winter collections indicate
Table
15a). These spa-phosphorus limitation of growth production
samples may also be phosphorus limited with nitrogen and phos-
Table 159). The upstream sites duringphorus synergistic influence
the summer and early fall collections have varied nutrient limiting
Many are phosphorus limited, with or without synergisticinfluences.
influence in combination with nitrogen additions. Others are
nitrogen and phosphorus co-limited with synergistic influence (Table
,h).
Below the sewage treatment plant, assay results indicate nitrogen
All collections from 45 are nitrogen limited except onelimitation.
collection occurring in February, which is nitrogen limited but with
synergistic influence from the combination of both nitrogen and phos-
Results from the collections at 68 vary inTables 15b & f).phorus
Nitrogen plays a role in influencing growthnutrient influence.
production in all collections except on the November collection date,
51

I
which indicates strong phosphorus imitation. Three collections are
I
nitrogen limited, and the other six are either co-limited by nitrogen
Iand phosphorus or indicate synergistic influence with the addition of
both nutrients
Biologically Available Nutrients
Another result of the Algal Assay Bottle Test ;s also used to
determine biologically available concentrations of nitrogen and phos-
phorus. INutrient concentrations are determined by the maximum stand-
ing crop produced by the additions of nitrogen or phosphorus with or
Iwithout the addition of EOTA. This procedure can be used to verify
chemical analysis and should theoretically correlate with such. How-I
ever, according to Miller et al. (1978), failure of nutrient analysis
to correlate wi.th the biologically available nutrient determinations
may be the result of the presence of biologically available organic
nutrients, effects of other growth-limiting nutrients, the presence
of inhibitory constituents, sediment and/or unreliable chemical ana-
Ilysis.
Calculated biologically available nutrients based on assay
results are found in Table 16. These data are determined with both
Ithe presence and absence of EDTA. Correlations between nutrient
analysis and biologically available nutrient determinations vary.
Many measured and calculated biologically available nutrients corre-
late well; whereas, others indicate that the biologically available
nutrients are much higher than measured and still others are much
Ilower. There are no general trends among these data, and the signif-
. 52

,
icance of these findings is unknown. The lack of correlations
between the measured nutrient levels and the biologically determined
nutrient levels is probably due to a number of reasons, those men-
tioned above and those unknown. Since a number of test water samples
suggest co-limitation, secondary limitation and synergistic influ-
ence, the biologically determined available nutrients would not be
expected to correlate well with the analytically determined inorganic
nutrient concentrations. Ambient phosphorus levels must be greater
than 0.010 mg/l in order to accurately determine biologically avail-
able nutrient levels (Miller et al., 1978b). Chemical analysis shows
that many samples are below this limit (Table 12).
Algal Growth Inhibition
Another purpose of the Algal Assay Bottle Test is to determine
the extent of heavy metal toxicity and its interactions with nutrient
regulation. If the presence of heavy metals inhibits the growth of
the algae, it can be determined with the application of EDTA to the
control and nutrient additions. EDTA combines with the heavy metals
in solution, removing them from biological activity. Any increase in
production, with the addition of EDTA over that of the treatment
without EDTA, indicates that production may be inhibited by heavy
metals.
Indications of growth inhibition during the summer and early fall
can be seen graphically in Figures 13-28, and actual assay results
are presented in Table 17. These data are expressed in percent inhi-
bition (%I) in Table 18. To better resolve and analyze the greatest
53

cases of inhibition, those samples which had greater than 50% inhibi-
Ition between the nitrogen and phosphorus combinations with and with-
out EDTA were analyzed (Table 16). Analysis of variance between the
two tests for each sample, along with the controls and the single
Inutrient additions with and without EDTA, was conducted to determine
A 11if the mean triplicate samples were significantly different.
reported data in Table 16 is significant at the p <0.01 or greater
than 99% significant.
Growth inhibition under these conditions occurs only during the
Isummer and early fall collections, except on the August collection
date. All three tributaries of the White River contain growth ;nhi-
bition on one or more of these sample dates. The sample collections
Ibelow the triblJtary confluences and above the sewage treatment plant
also contain growth inhibition during June, July and September. No
growth inhibit'ion occurred at 45 any time during this study. This
suggests that 1:he heavy metals may already be complexed with the
organics relea~;ed in the sewage effluent, removing them from biologi-
cal activity.
CONCLUSIONS
IThe concen1:rations of heavy metals in the White River vary sig-
nificantly with location along the river, season and storm events
The local geology (especially presence of shale and relief, which
will effect the suspended sediment load) and ground water hydrology
(contribution of dissolved ions) probably are the major factors con-
trolling the heavy metal concentrations for the sites. The sluggish
I-
54

and stagnant conditions of the river during periods of low recharge
cause increases in most parameters due to concentration by evapora-
tion and the lack of dilution by storm runoff. These types of condi-
tions can be used to explain the seasonal chemical variations of most
parameters. However, the heavy metal seasonal and storm event var;a-
tions appear to be controlled by the amount (and perhaps type) of
fine suspended sediment load. For example, during the period of low
recharge, the suspended sediment load would be low due to the lack of
runoff and suspended sediments would tend to settle out of the water.
During storm events, parameter values exhibit variations that are
significant and about the same magnitude as the seasonal variations.
The heavy metals increase in concentration as flow increases, appar-
ently because the suspended load also is increasing, and a portion of
suspended sediments and/or colloids are passing through the 0.40
micrometer pore-size membranes used for filtration of the water
The other parameters exhibit increases because of flushing effects
potassium) or dilution effects (e.g., calcium) due to rain
runoff
Nutrient analysis of the collections predicts that most of the
samples from the three tributaries and above the sewage treatment
input are phosphorus limited. Below the sewage input the phosphorus
concentration is great enough to cause nitrogen limitation to Highway
68.
During low flow, phosphorus is processed between Highways 45 and
68 so that the 68 site may become phosphorus limited or nitrogen-
phosphorus co-limited.
55

The MSC's are near detection limits above the sewage flow. In
most instances, both nitrogen and phosphorus are necessary for signif-
;cant growth. The r~sc at the Highway 45 site tend to be greater than
al other sites, including the Highway 68 site.
IInhibition of algal production by heavy metals was present at
various times in all branches of the White River. The correlation of
reduced production of biomass (MSC) with specific heavy metal toxic-
ity was limited by the low MSC values. The lack of growth inhibition
at the Highway 45 site may be associated with the organic input com-
plexing with the metals and/or sedimentation, thereby removing them
from biological activity. The variance between this study and that Iof Meyer and Green (1984) requires further investigation.
II
I
I
I
I
56

LITERATURE CITED
APHA. 1985. Standard Methods for the Examination of Water andWaste Water. 16th ed. American Public Health Association.New York. 1268 p.
Chaney, A.L. and Marboch, E.P. 1962. Modified reagents for deter-mination of urea and ammonia. Clinical Chemistry 8:130-132.
Christensen, E.R., Scherfig, J. and Dixon, P.S. 1979. Effects ofmanganese, copper and lead on Selenastrum capricornutum andChlorella stigmatophora. Water Res. 13:79-92.
Davis, J. and DeCosta, J. 1980. The use algal assays and chlorophyllconcentrations to determine fertility of water in small impound-ments in vJest Virginia. Hydrobiologia 71:19-34.I
Eloranta, V.A. and Halttunen-Keyrilainen, L. 1984. A comparison ofthe Selenastrum bottle test and the natural phytoplankton assayin algal toxicity tests. Arch. Hydrobiol. Suppl. 67, (AlgologicalStudies 37):447-459.
EPA. 1976. Quality Criteria for Water:Agency, Wclshington, D.C., 256 p.
u.s. Environmental Protection
I EPA. 1979. Methods for Chemical Analysis of Water and Wastes. EPA-600/4-79-020. Environmental Monitoring and Support Lab. Cin-cinnati, OH.
EPA. u.s.1983. Methods for Chemical Analysis of Water and Wastes:Environmental Protection Agency, Cincinnati, Ohio, 430.2-5 p.
Greene, J.C., Miller, W..E., Shiroyama, T. and Merwin, E. 1975. Toxicityof zinc to the green algae Selenastrum capricornutum as a functionof phosphorus or ionic strength. In Proc. Biostim. t4utr. Assess.Workshop, 16-17 October 1973. U.S~Environmental Protection Agency,Corvallis, Oregon. EPA-600j3-75-034. p.28-43.
Greene, J.G., Miller, W.E., Shiroyama, T.H., Soltero, R.A. and Putnam, K.1978. Use of laboratory cultures of Selenastrum, Anabaena, and theindigenous isolate Sphaerocystis to predict effects of nutrient andzinc interactions upon phytoplankton growth in Long Lake, Washington.Mitt. Int. Ver. Limnol. 21:372-384.
I Ha.ch Chemica.l Company. 1984. Procedures for Water and WastewaterAnalysis: Hach Chemical Company, Loveland, Co., 125 p.
Kennedy, V.C., Zellweger, G.W. and Jones, B.F. 1974. Filter pore-sizeeffects on the analysisofAl, Fe, Mn, and Ti in water. Water Re-sources Research, 10:785-790.
57

Meyer, R.L. and Green, W.R. 1984. The application of the algalassay bottle test to define potential algal production throughtime and space in Beaver Lake. In Water Quality ManagementStrategies for Beaver Lake Reservo-ir. Part I. Arkansas WaterResources Research Center. Fayetteville, AR. 41 p.
Michnowicz, C.J. and Weaks, T.E. 1984. Effects of pH on toxicityof As, Cr, Cu, Ni, and Zn to Selenastrum capricornutum Printz.
Hydrobiologia 118:299-305.
Miller, W.E., Maloney, T.E. and Greene, J.C. 1974.ivity in 49 lake waters as determined by algalRes. 8:667-679.
Algal product-assays. Water
Miller, W.E., Greene, J.C. and Shiroyama, T. 1978 a. The SelenastrumS~ericornutum Printz Algal Assay Bottle Test. U.S. EPA, EPA-600/9-78-018, U.S. EPA, Corvallis, OR.
Miller, W.E., Greene, J.C., Merwin, E.A. and Shiroyama, T.1978 b.Algal bioassay techniques for pollution evaluation, p. 9-16. ~Toxic materials in the aquatic environment. Seminar Oregon StUniv., Water Res. Res. Inst., Spring 1978, Corvallis,SEMIN WR024-78.
Miller, W.R. and J.I. Drever. 1977. Water chemistry of a streamfollowing a storm, Absaroka Mountains, Wyoming: Geol. Soc. Am.Bull., 88:286-290.
Nix, J. and T. Goodwin. 1970. The simultaneous extraction of Fe,Mn, Cu, Co, Ni, Cr, Pb, and Zn from natural water for determin-ation by atomic absorption: At. Absorpt. Newsl., 9:119-122.
Steele, K.F., Widmann, R.K., Wickliff, D.S. and Parr, D.L. 1986.The effect of rainstorm events on spring water chemistry in lime-stone terrane: Proc. of the Assoc. of Ground Water Scientistsand Engineers, South. Reg. Ground Water Conference, Nat. WaterWell Assoc., 50-66.
Whipple, W., Jr. and J.V. Hunter. 1977.planning for water pollution control:Fed., 49:15-23.
Nonpo;nt sources andJour. Water Poll. Control
Wickliff, D.S. and K.F. Steele. 1986. The effect of storm events onthe <0.4 micron size heavy metal content of a river: Abstractswith Program, Geol. Soc. Amer., 18:272.
Williams, L.G., J.C. Joyce and J.T. t~onk. 1973. Stream-velocityeffects on the heavy metal concentrations: J. of the AmericanWater Works Assoc., 65:275-279.
58


Top Related