


Languages
Pages
Legal


Albuquerque, NM
Black band lives here!
Team Members RoleMatt Turner Architectural & Foundations EngineerMatt Moore Structural EngineerStu Burgess Fluid Systems EngineerAndy Birkel Building Thermal Systems EngineerDoug Hemink Solar Thermal Systems Engineer

Agenda
Black band lives here!
1. Architectural2. Foundations3. Structural4. Hydronic System5. Building Thermal6. Solar Thermal
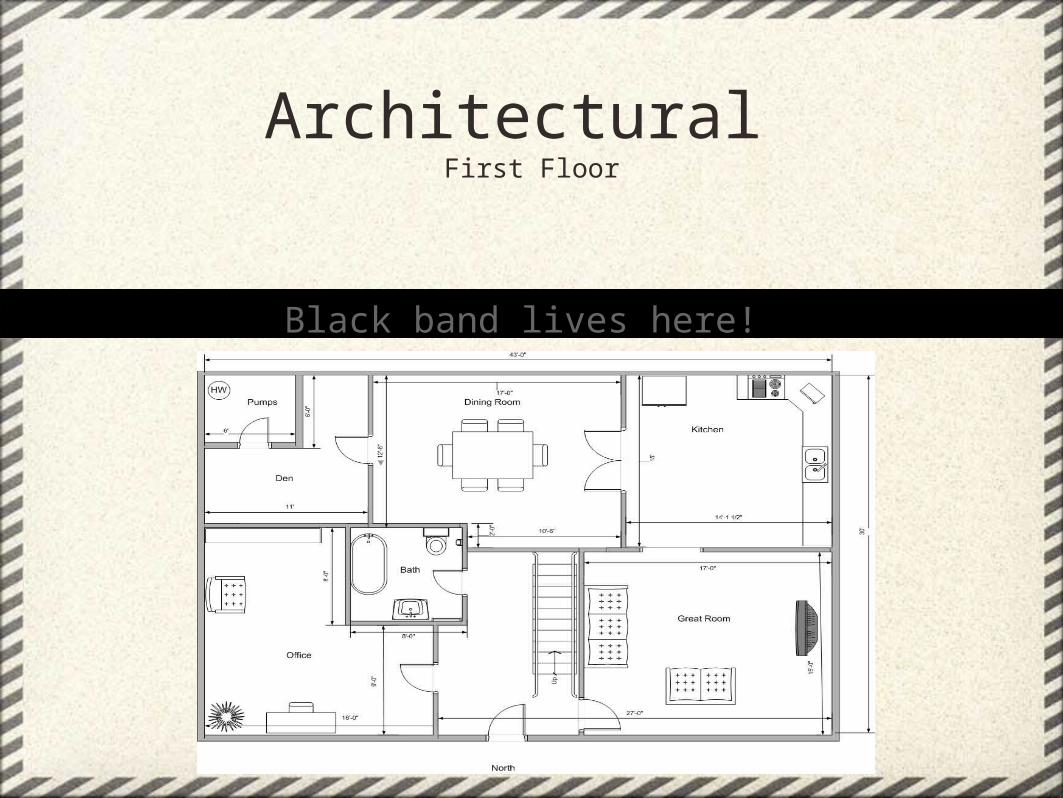
Architectural First Floor
Black band lives here!

Architectural Second Floor
Black band lives here!

Architectural Basement?
•Initial research showed that few houses in New Mexico are built with basements, due to poor soil conditions
•Further research into the soil conditions, using www.websoilsurvey.nrcs.usda.gov, has shown that almost half of the soil in the Albuquerque area would not be a limiting factor as far as basements are concerned
•Thus, further consideration shall have to be taken as far as the basement situation is concerned
•Additionally, both floors need windows added to them
Black band lives here!

FoundationCompression due to House
•According to the International Residential Code, the live load varies from about 20 to about 60 pounds per square foot ≈ 40psf•First Floor: 40 psf •Second Floor: 30 psf •Roof: 30 - 50+ psf ≈ 40psf•All units then converted to metric, for consistency•Produced the following table:
Black band lives here!

FoundationCompression due to House
Black band lives here! Foundation Material Foundation Thickness (m) Foundation Length (m) Foundation Width (m) Foundation Area (sq m) House Area (sq m) House Weight (kg) House Stress (kg/ sq m) FoS
Cinder Blocks 0.2032 13.1064 9.144 8.8774016 203.55 82258.9763 9266.109612 166.9331Poured Concrete 0.2032 13.1064 9.144 8.8774016 203.55 82258.9763 9266.109612 265.5753
0.254 13.1064 9.144 11.0451392 203.55 82258.9763 7447.527352 330.42510.3048 13.1064 9.144 13.19223168 203.55 82258.9763 6235.410224 394.6573
Pre- Formed Concrete 0.2032 13.1064 9.144 8.8774016 203.55 82258.9763 9266.109612 265.5753
•For concrete : 3,500 psi = 2460850 kg/m2 •For cinder blocks : 2,200 psi = 1546820 kg/ m2

FoundationForce Caused by Soil
•Frost line Depth = 9’’ = .2286 m•Minimum Footing Depth = 6’’ Below Frost line = 15’’ = .381 m•If a basement is feasible, depth = 8’ = 2.44 m•Had difficulty finding a specific soil density, instead just found a large range of densities•Created the following table, displaying the force caused by the soil, as a function of soil depth and soil density
Black band lives here!

FoundationForce caused by Soil
Black band lives here! D epth (m ) 0.381 0.4 0.6 0.8 1 1.2 1.4 1.6 1.8 2 2.2 2.4 2.6
S oil D ensity(kg/m ^ 3)1200 2.28E + 03 4.79E + 03 2.26E + 04 1.89E + 05 2.48E + 06 4.69E + 07 1.20E + 09 4.04E + 10 1.72E + 12 8.99E + 13 5.71E + 15 4.31E + 17 3.82E + 191300 2.47E + 03 5.19E + 03 2.45E + 04 2.05E + 05 2.69E + 06 5.08E + 07 1.30E + 09 4.38E + 10 1.86E + 12 9.74E + 13 6.18E + 15 4.67E + 17 4.13E + 191400 2.66E + 03 5.59E + 03 2.64E + 04 2.21E + 05 2.90E + 06 5.47E + 07 1.40E + 09 4.71E + 10 2.00E + 12 1.05E + 14 6.66E + 15 5.02E + 17 4.45E + 191500 2.85E + 03 5.98E + 03 2.82E + 04 2.37E + 05 3.10E + 06 5.86E + 07 1.51E + 09 5.05E + 10 2.14E + 12 1.12E + 14 7.13E + 15 5.38E + 17 4.77E + 191600 3.04E + 03 6.38E + 03 3.01E + 04 2.53E + 05 3.31E + 06 6.25E + 07 1.61E + 09 5.39E + 10 2.29E + 12 1.20E + 14 7.61E + 15 5.74E + 17 5.09E + 191700 3.23E + 03 6.78E + 03 3.20E + 04 2.68E + 05 3.52E + 06 6.64E + 07 1.71E + 09 5.72E + 10 2.43E + 12 1.27E + 14 8.08E + 15 6.10E + 17 5.41E + 191800 3.42E + 03 7.18E + 03 3.39E + 04 2.84E + 05 3.73E + 06 7.03E + 07 1.81E + 09 6.06E + 10 2.57E + 12 1.35E + 14 8.56E + 15 6.46E + 17 5.72E + 191900 3.61E + 03 7.58E + 03 3.58E + 04 3.00E + 05 3.93E + 06 7.42E + 07 1.91E + 09 6.40E + 10 2.72E + 12 1.42E + 14 9.03E + 15 6.82E + 17 6.04E + 192000 3.81E + 03 7.98E + 03 3.76E + 04 3.16E + 05 4.14E + 06 7.81E + 07 2.01E + 09 6.73E + 10 2.86E + 12 1.50E + 14 9.51E + 15 7.18E + 17 6.36E + 192100 4.00E + 03 8.38E + 03 3.95E + 04 3.32E + 05 4.35E + 06 8.20E + 07 2.11E + 09 7.07E + 10 3.00E + 12 1.57E + 14 9.98E + 15 7.54E + 17 6.68E + 192200 4.19E + 03 8.78E + 03 4.14E + 04 3.47E + 05 4.55E + 06 8.59E + 07 2.21E + 09 7.41E + 10 3.15E + 12 1.65E + 14 1.05E + 16 7.90E + 17 7.00E + 192300 4.38E + 03 9.18E + 03 4.33E + 04 3.63E + 05 4.76E + 06 8.98E + 07 2.31E + 09 7.74E + 10 3.29E + 12 1.72E + 14 1.09E + 16 8.25E + 17 7.31E + 192400 4.57E + 03 9.58E + 03 4.52E + 04 3.79E + 05 4.97E + 06 9.37E + 07 2.41E + 09 8.08E + 10 3.43E + 12 1.80E + 14 1.14E + 16 8.61E + 17 7.63E + 192500 4.76E + 03 9.97E + 03 4.71E + 04 3.95E + 05 5.17E + 06 9.76E + 07 2.51E + 09 8.42E + 10 3.57E + 12 1.87E + 14 1.19E + 16 8.97E + 17 7.95E + 192600 4.95E + 03 1.04E + 04 4.89E + 04 4.11E + 05 5.38E + 06 1.02E + 08 2.61E + 09 8.75E + 10 3.72E + 12 1.95E + 14 1.24E + 16 9.33E + 17 8.27E + 192700 5.14E + 03 1.08E + 04 5.08E + 04 4.26E + 05 5.59E + 06 1.05E + 08 2.71E + 09 9.09E + 10 3.86E + 12 2.02E + 14 1.28E + 16 9.69E + 17 8.59E + 192800 5.33E + 03 1.12E + 04 5.27E + 04 4.42E + 05 5.79E + 06 1.09E + 08 2.81E + 09 9.43E + 10 4.00E + 12 2.10E + 14 1.33E + 16 1.00E + 18 8.90E + 192900 5.52E + 03 1.16E + 04 5.46E + 04 4.58E + 05 6.00E + 06 1.13E + 08 2.91E + 09 9.76E + 10 4.15E + 12 2.17E + 14 1.38E + 16 1.04E + 18 9.22E + 193000 5.71E + 03 1.20E + 04 5.65E + 04 4.74E + 05 6.21E + 06 1.17E + 08 3.01E + 09 1.01E + 11 4.29E + 12 2.25E + 14 1.43E + 16 1.08E + 18 9.54E + 19
Force D ue to S oil, as a Function of S oil D ensity and S oil D epth (kg)

FoundationBending stress Caused By Soil
•Columns in yellow: minimum depth and “basement” depth•From here moments and bending stresses caused by these forces can be determined•Based on prior knowledge, it is already known that rebar will be necessary•For now .2302 m is used as a thickness
Black band lives here!
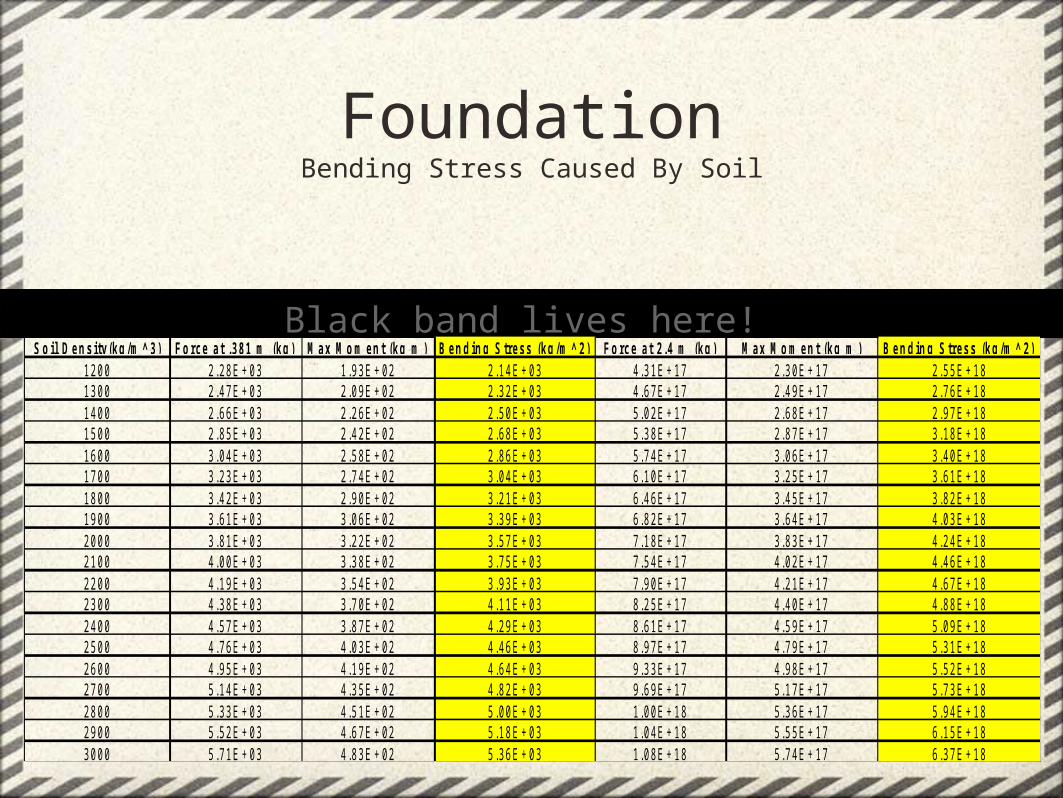
FoundationBending Stress Caused By Soil
Black band lives here! S oil D ensity(kg/m ^ 3) Force at .381 m (kg) M ax M om ent (kg m ) B ending S tress (kg/m ^ 2) Force at 2.4 m (kg) M ax M om ent (kg m ) B ending S tress (kg/m ^ 2)
1200 2.28E + 03 1.93E + 02 2.14E + 03 4.31E + 17 2.30E + 17 2.55E + 181300 2.47E + 03 2.09E + 02 2.32E + 03 4.67E + 17 2.49E + 17 2.76E + 181400 2.66E + 03 2.26E + 02 2.50E + 03 5.02E + 17 2.68E + 17 2.97E + 181500 2.85E + 03 2.42E + 02 2.68E + 03 5.38E + 17 2.87E + 17 3.18E + 181600 3.04E + 03 2.58E + 02 2.86E + 03 5.74E + 17 3.06E + 17 3.40E + 181700 3.23E + 03 2.74E + 02 3.04E + 03 6.10E + 17 3.25E + 17 3.61E + 181800 3.42E + 03 2.90E + 02 3.21E + 03 6.46E + 17 3.45E + 17 3.82E + 181900 3.61E + 03 3.06E + 02 3.39E + 03 6.82E + 17 3.64E + 17 4.03E + 182000 3.81E + 03 3.22E + 02 3.57E + 03 7.18E + 17 3.83E + 17 4.24E + 182100 4.00E + 03 3.38E + 02 3.75E + 03 7.54E + 17 4.02E + 17 4.46E + 182200 4.19E + 03 3.54E + 02 3.93E + 03 7.90E + 17 4.21E + 17 4.67E + 182300 4.38E + 03 3.70E + 02 4.11E + 03 8.25E + 17 4.40E + 17 4.88E + 182400 4.57E + 03 3.87E + 02 4.29E + 03 8.61E + 17 4.59E + 17 5.09E + 182500 4.76E + 03 4.03E + 02 4.46E + 03 8.97E + 17 4.79E + 17 5.31E + 182600 4.95E + 03 4.19E + 02 4.64E + 03 9.33E + 17 4.98E + 17 5.52E + 182700 5.14E + 03 4.35E + 02 4.82E + 03 9.69E + 17 5.17E + 17 5.73E + 182800 5.33E + 03 4.51E + 02 5.00E + 03 1.00E + 18 5.36E + 17 5.94E + 182900 5.52E + 03 4.67E + 02 5.18E + 03 1.04E + 18 5.55E + 17 6.15E + 183000 5.71E + 03 4.83E + 02 5.36E + 03 1.08E + 18 5.74E + 17 6.37E + 18

FoundationWhat's Next
•From here I need to determine if any of these will give the desired factor of safety•Assuming they won't, I'll need to determine amount of rebar required
–Can also determine if the thickness can simply be increased
•A cost comparison should also take place•Check to see if any pros/cons from one type significantly outweigh others
Black band lives here!

Structural Engineer
•Support roof materials
•Support FPC system
•Factor of Safety = 4 to 6
•Overhang
Black band lives here!
Roof Truss Design
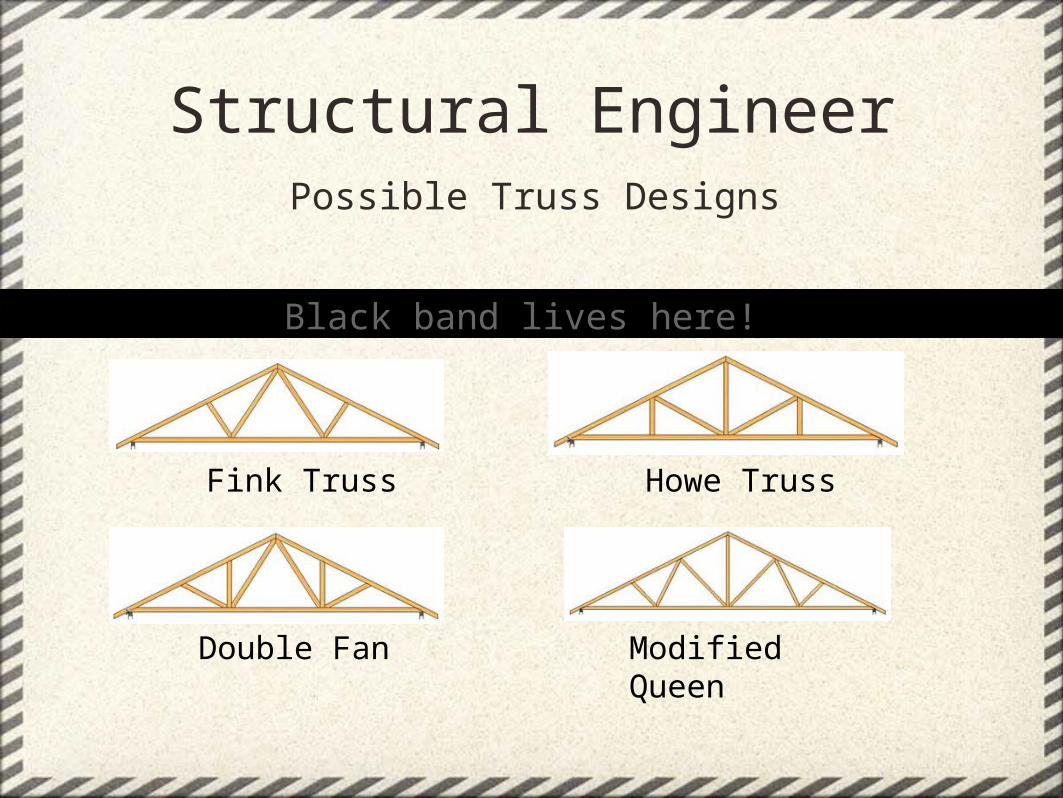
Structural EngineerPossible Truss Designs
Black band lives here!
Fink Truss Howe Truss
Double Fan Modified Queen
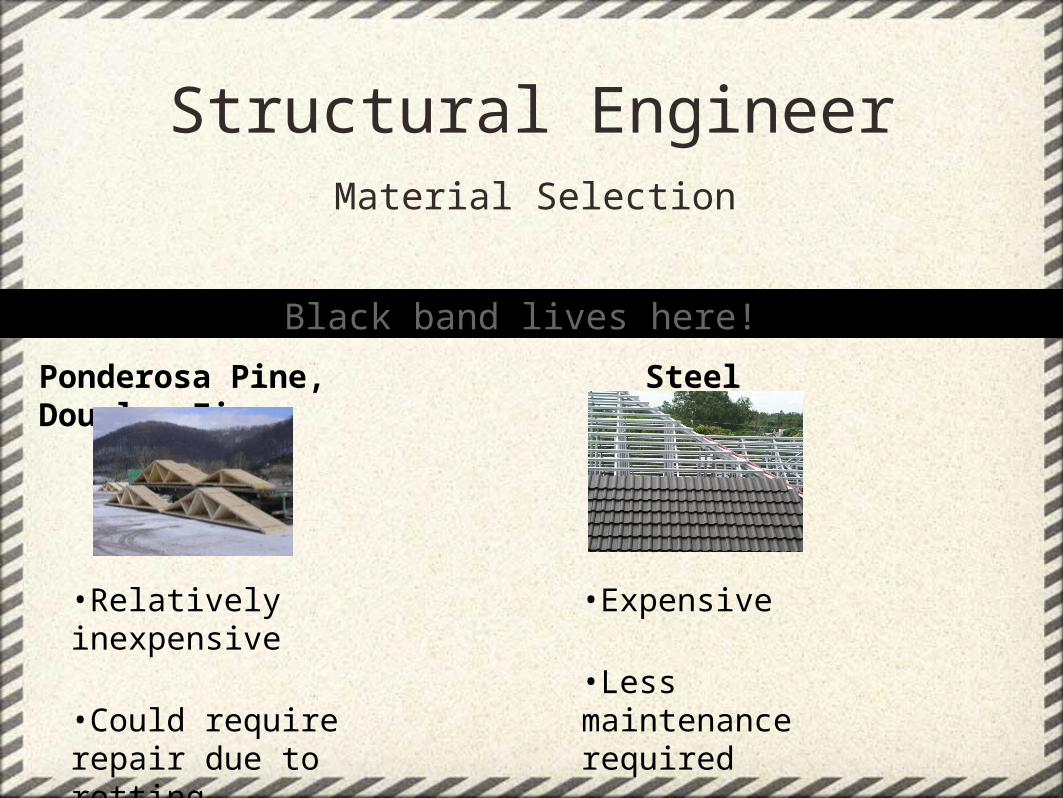
Structural EngineerMaterial Selection
Black band lives here!
Ponderosa Pine, Douglas Fir Steel
•Relatively inexpensive
•Could require repair due to rotting
•Expensive
•Less maintenance required
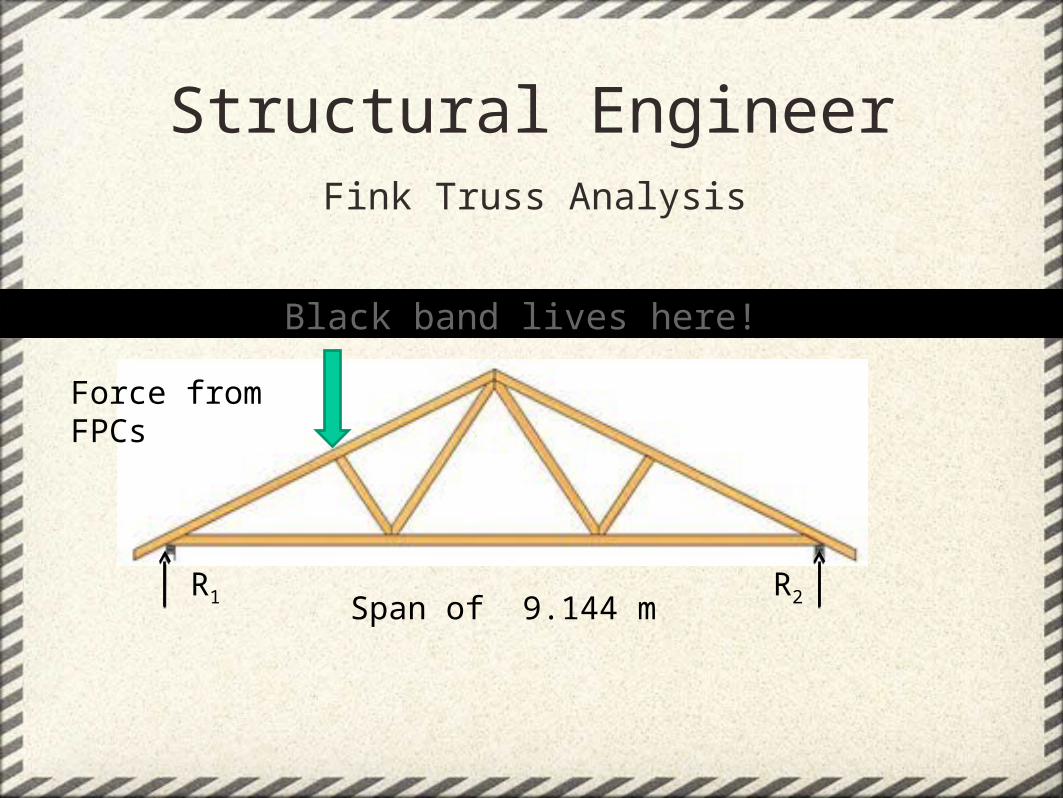
Structural EngineerFink Truss Analysis
Black band lives here!
R1 R2
Force from FPCs
Span of 9.144 m
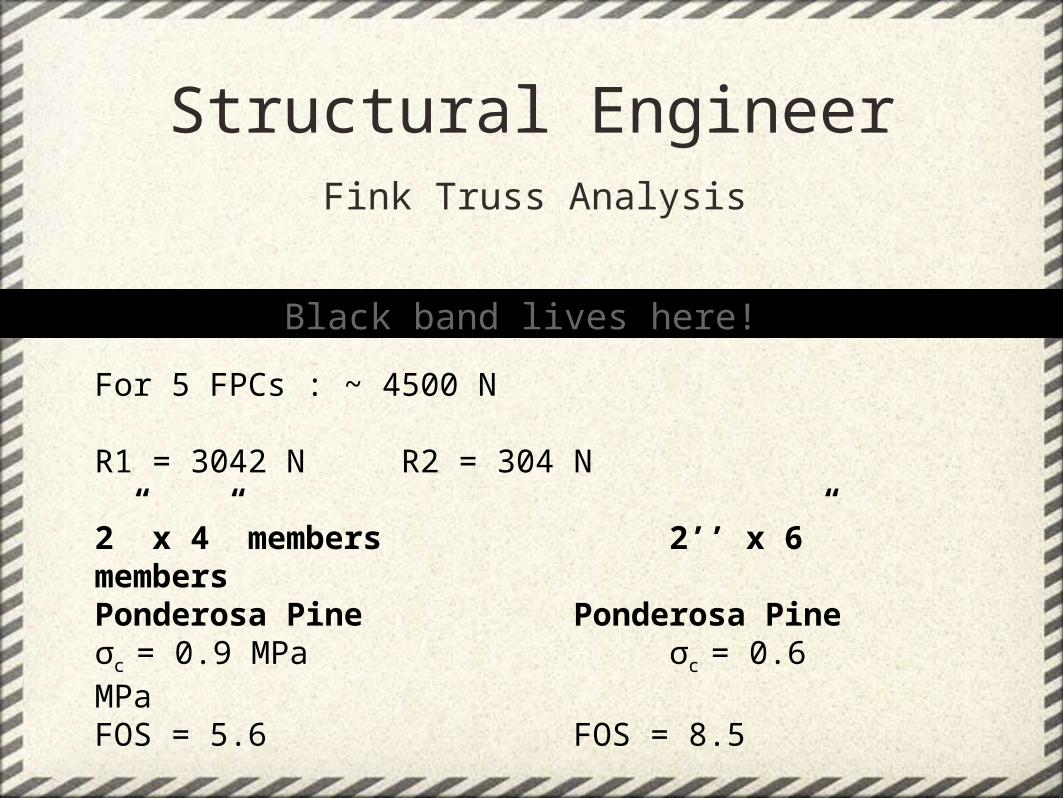
Structural EngineerFink Truss Analysis
Black band lives here!
For 5 FPCs : ~ 4500 N
R1 = 3042 N R2 = 304 N
2” x 4” members 2’’ x 6” membersPonderosa Pine Ponderosa Pineσc = 0.9 MPa σc = 0.6 MPaFOS = 5.6 FOS = 8.5
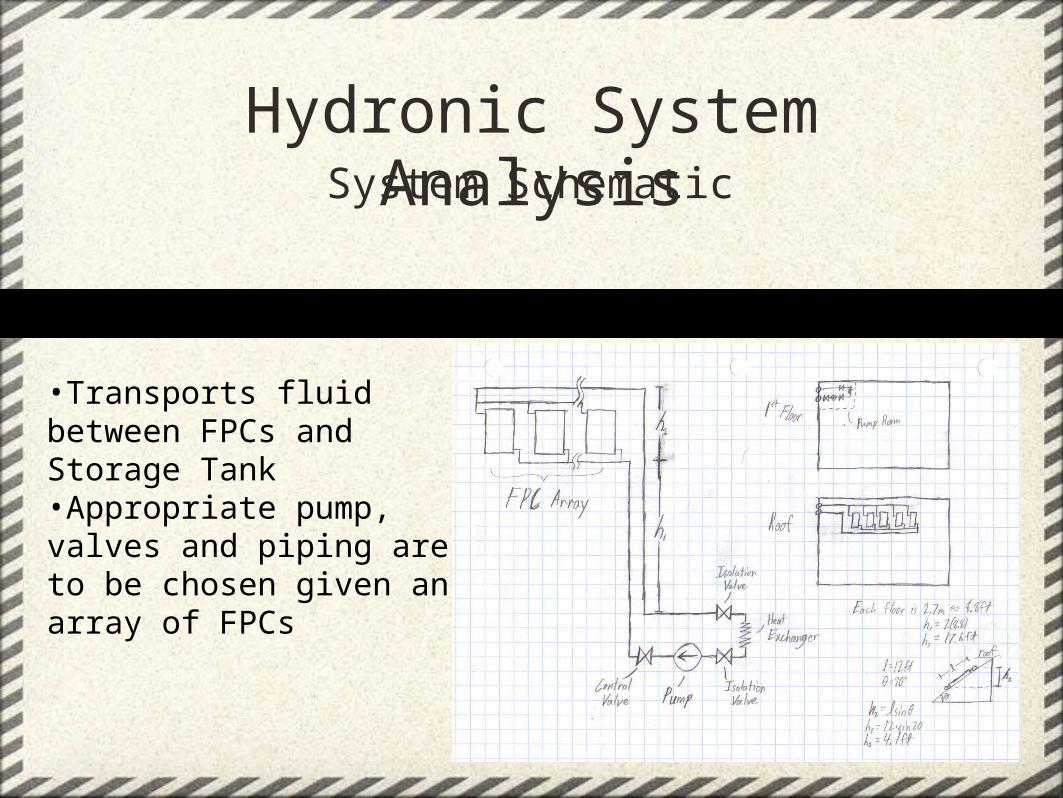
Hydronic System AnalysisSystem Schematic
•Transports fluid between FPCs and Storage Tank•Appropriate pump, valves and piping are to be chosen given an array of FPCs
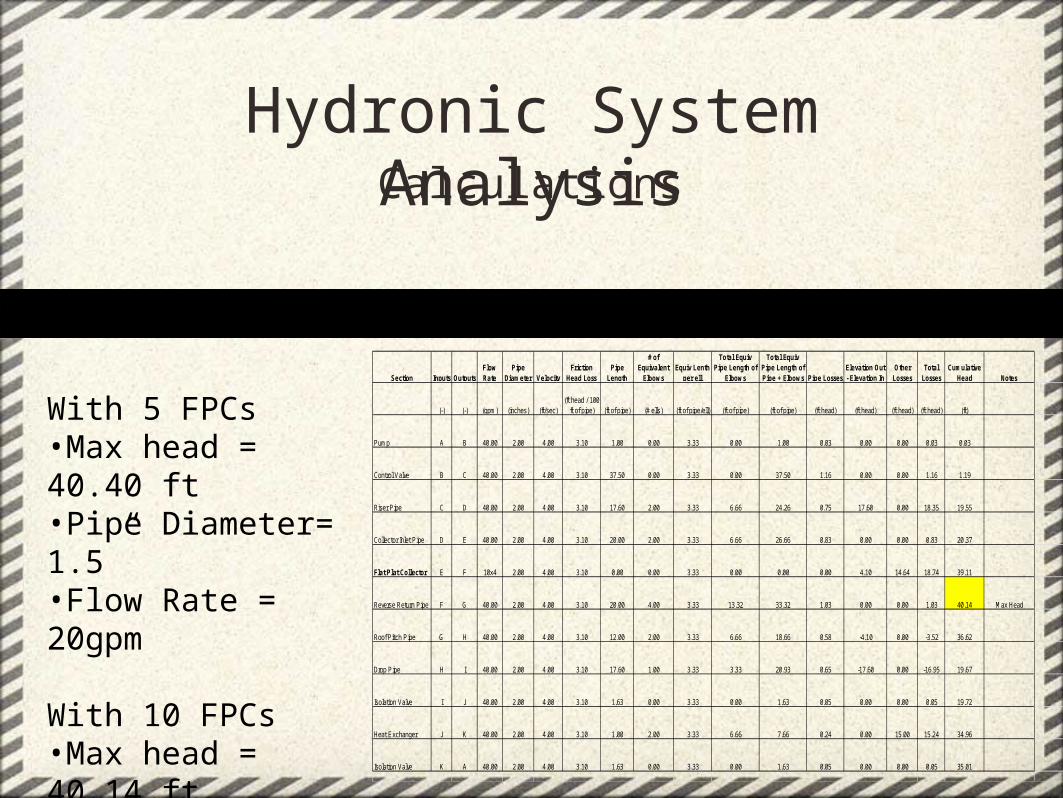
Hydronic System AnalysisCalculations
With 5 FPCs•Max head = 40.40 ft•Pipe Diameter= 1.5”•Flow Rate = 20gpm
With 10 FPCs•Max head = 40.14 ft•Pipe Diameter= 2.0”•Flow Rate = 40gpm
Section Inputs OutputsFlow Rate
Pipe Diameter Velocity
Friction Head Loss
Pipe Length
# of Equivalent
ElbowsEquiv Lenth
per ell
Total Equiv Pipe Length of
Elbows
Total Equiv Pipe Length of Pipe + Elbows Pipe Losses
Elevation Out - Elevation In
Other Losses
Total Losses
Cumulative Head Notes
(-) (-) (gpm) (inches) (ft/sec)(ft head / 100
ft of pipe) (ft of pipe) (# ells) (ft of pipe/ell) (ft of pipe) (ft of pipe) (ft head) (ft head) (ft head) (ft head) (ft)
Pump A B 40.00 2.00 4.00 3.10 1.00 0.00 3.33 0.00 1.00 0.03 0.00 0.00 0.03 0.03
Control Valve B C 40.00 2.00 4.00 3.10 37.50 0.00 3.33 0.00 37.50 1.16 0.00 0.00 1.16 1.19
Riser Pipe C D 40.00 2.00 4.00 3.10 17.60 2.00 3.33 6.66 24.26 0.75 17.60 0.00 18.35 19.55
Collector Inlet Pipe D E 40.00 2.00 4.00 3.10 20.00 2.00 3.33 6.66 26.66 0.83 0.00 0.00 0.83 20.37
Flat Plat Collector E F 10x4 2.00 4.00 3.10 0.00 0.00 3.33 0.00 0.00 0.00 4.10 14.64 18.74 39.11
Reverse Return Pipe F G 40.00 2.00 4.00 3.10 20.00 4.00 3.33 13.32 33.32 1.03 0.00 0.00 1.03 40.14 Max Head
Roof Pitch Pipe G H 40.00 2.00 4.00 3.10 12.00 2.00 3.33 6.66 18.66 0.58 -4.10 0.00 -3.52 36.62
Drop Pipe H I 40.00 2.00 4.00 3.10 17.60 1.00 3.33 3.33 20.93 0.65 -17.60 0.00 -16.95 19.67
Isolation Valve I J 40.00 2.00 4.00 3.10 1.63 0.00 3.33 0.00 1.63 0.05 0.00 0.00 0.05 19.72
Heat Exchanger J K 40.00 2.00 4.00 3.10 1.00 2.00 3.33 6.66 7.66 0.24 0.00 15.00 15.24 34.96
Isolation Valve K A 40.00 2.00 4.00 3.10 1.63 0.00 3.33 0.00 1.63 0.05 0.00 0.00 0.05 35.01

Hydronic System AnalysisPump Selection
Cost with 5 FPCs•$513.35
Cost with 10 FPCs•$737.84
• Both cases require similar head• 10 FPCs requires a greater flow rate

Hydronic System AnalysisValve Selection
Gate and Ball valves•Minimal pressure drop•Good for on/off applications
Globe Valve•Creates some pressure drop•Good for regulating flow

Hydronic System AnalysisPiping materials
CPVC•Cheap•Self-insulated•Lightweight•Easy to work with•Can become brittle and discolored when exposed to UV rays
PVC•Shares many of the upsides of CPVC•Not suitable for hot water usage
Copper•Proven durability•Fire resistant•Requires skilled labor to install/repair
Galvanized Steel•High durability•Expensive•Very difficult to repair

Hydronic System AnalysisPiping Costs
Copper1.5” Diameter•$94.76 per 10 ft
2.0” Diameter•$149.46 per 10 ft
CPVC1.5” Diameter•$42.45 per 10 ft
2.0” Diameter•$58.76 per 10 ft
Building Thermal Systems
Andy Birkel

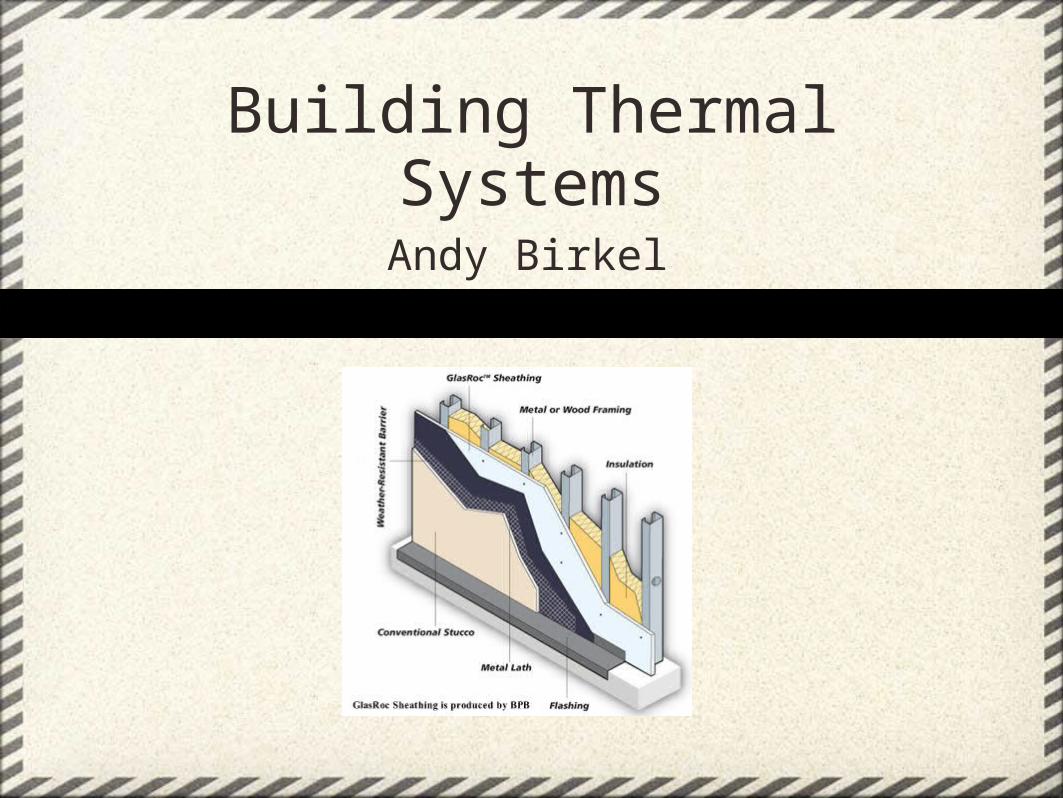
Wall Construction
• Drywall• Stud• Insulation• Plywood• Stucco

Insulation
• Polyurethane Foam• K value
– 0.023 W/mK
• Density– 28 kg/m3
• Price– Roughly $7.43 per cubic ft
• Fiber Glass Batt• K value
– 0.046 to 0.035
• Density– 16 to 40 kg/m3
• Price– Average $7.37 per cubic ft

Wall Construction
Drywall
Length 0.0095m
K Value 0.1600W/mK
R Value 0.0595m2K/W
StudLength 0.0889mWidth 0.0381mO.C. 0.4064mK Value 0.1000W/mKR Value 0.8890m2K/W
Poly Insulation
Length 0.0889m
Width 0.3683m
K Value 0.0240W/mK
R Value 3.7041m2K/W
Plywood
R Value 0.1200m2K/W
Stucco
Length 0.0222m
K Value 0.8100W/mK
R Value 0.0274m2K/W

Ceiling Construction
Drywall
Length 0.0095m
K Value 0.1600W/mK
R value 0.0595m2K/W
Stud
Length 0.2286m
Width 0.0381m
O.C. 0.6096m
K Value 0.1000W/mK
R value 2.2860m2K/W
Poly Insulation
Length 0.2286m
Width 0.5715m
O.C. 0.6096m
K Value 0.0240W/mK
R value 9.525m2K/W

R Percentages
Wall Materials
RvalueBetween Studs At Studs
Drywall 0.0595 0.0595
Stud --- 0.8890
Poly Insulation 3.8652 ---
Plywood 0.1200 0.1200
Stucco 0.0274 0.0274
Total R 4.0722 1.0960
Percentage of Wall 90.625 9.375
Ceiling Materials
RvalueBetween Studs At Studs
Drywall 0.0595 0.0595
Stud --- 2.2860
Poly Insulation 9.9391---
Plywood 0.1200 0.1200
Total R 10.1187 2.4655Percentage of Wall 93.75 6.25
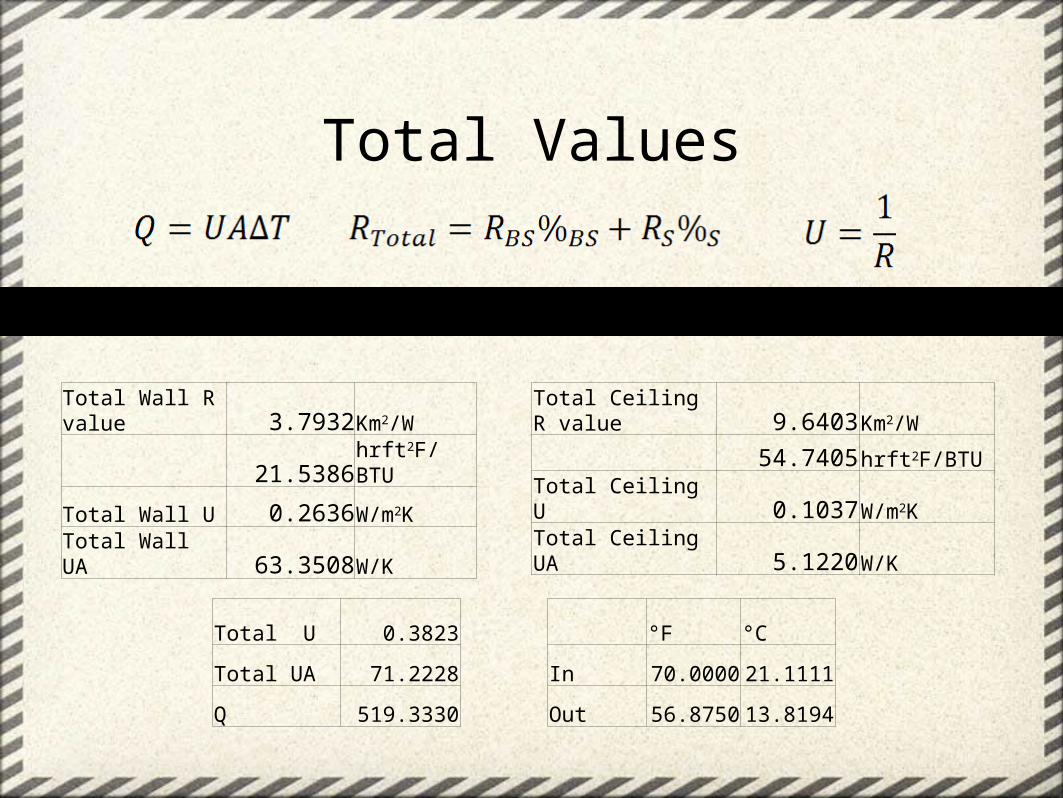
Total Values
Total Wall R value 3.7932Km2/W
21.5386hrft2F/BTU
Total Wall U 0.2636W/m2K
Total Wall UA 63.3508W/K
Total Ceiling R value 9.6403Km2/W
54.7405hrft2F/BTU
Total Ceiling U 0.1037W/m2KTotal Ceiling UA 5.1220W/K
Total U 0.3823
Total UA 71.2228
Q 519.3330
°F °C
In 70.0000 21.1111
Out 56.8750 13.8194

Solar Thermal SystemObjectives
•Provide Domestic Hot Water and/or Space Heating
•Minimize Life Cycle Cost
•Maximize Solar Fraction
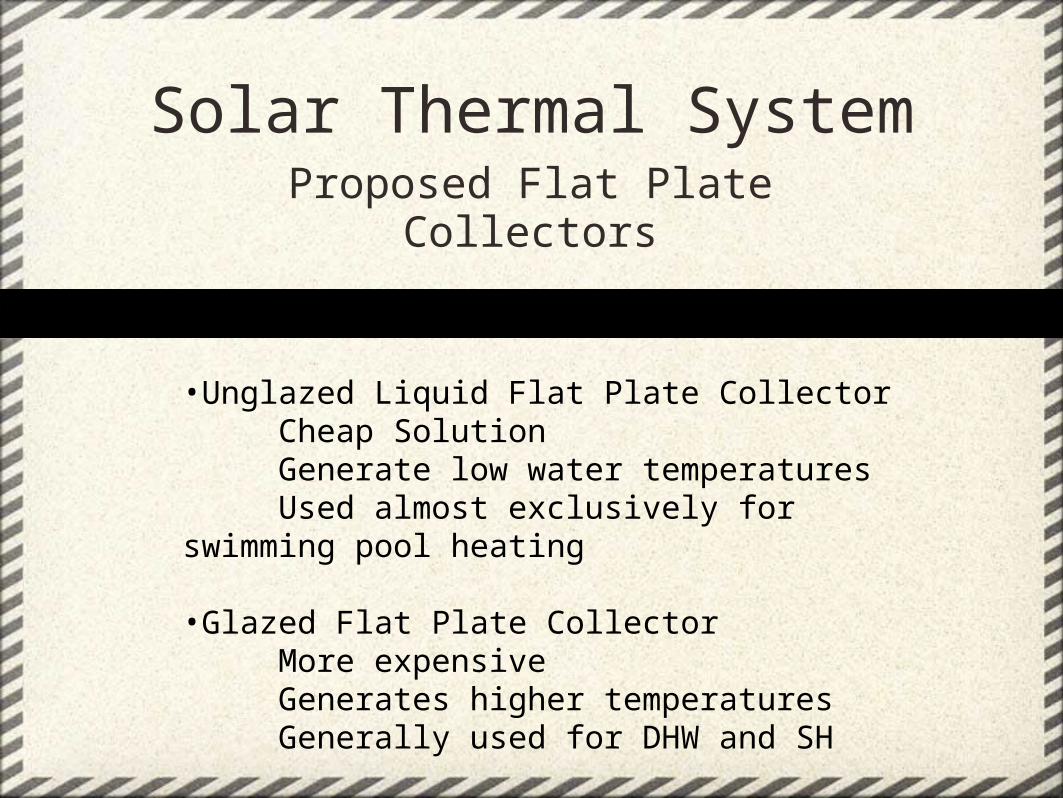
Solar Thermal SystemProposed Flat Plate Collectors
•Unglazed Liquid Flat Plate CollectorCheap SolutionGenerate low water temperaturesUsed almost exclusively for swimming pool heating
•Glazed Flat Plate CollectorMore expensiveGenerates higher temperaturesGenerally used for DHW and SH
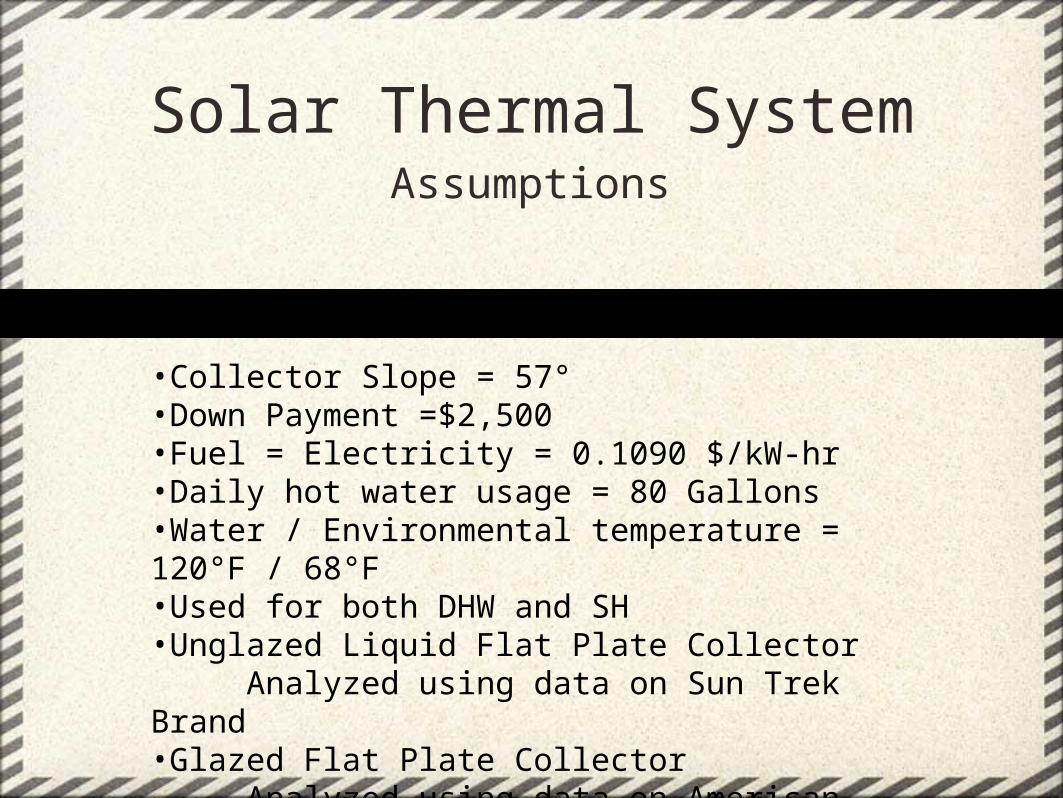
Solar Thermal SystemAssumptions
•Collector Slope = 57°•Down Payment =$2,500•Fuel = Electricity = 0.1090 $/kW-hr•Daily hot water usage = 80 Gallons•Water / Environmental temperature = 120°F / 68°F•Used for both DHW and SH•Unglazed Liquid Flat Plate Collector
Analyzed using data on Sun Trek Brand•Glazed Flat Plate Collector
Analyzed using data on American Energy AE-40E
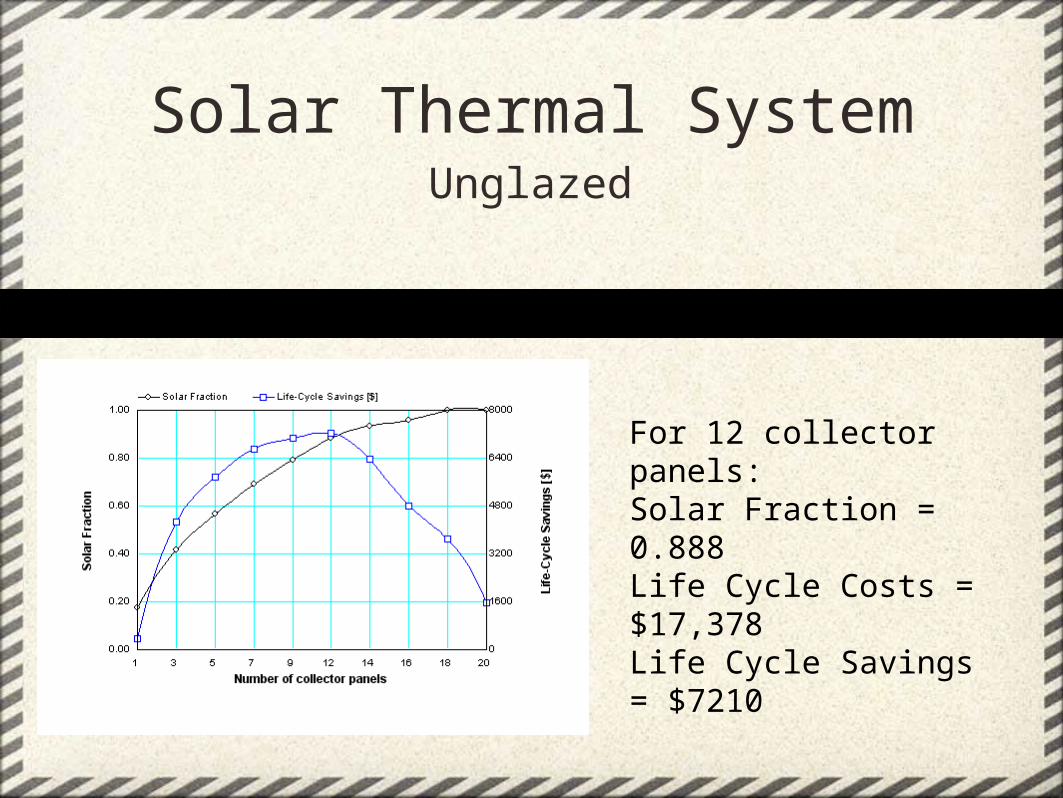
Solar Thermal SystemUnglazed
For 12 collector panels:Solar Fraction = 0.888Life Cycle Costs = $17,378Life Cycle Savings = $7210

Solar Thermal SystemGlazed
For 5 collector panels:Solar Fraction = 0.817Life Cycle Costs = $10,675Life Cycle Savings = $6,318
Top Related