


Languages
Pages
Legal

Asian J. Energy Environ., Vol. 3, Issues 3-4, (2002), pp. 185-213
Copyright © 2004 by the Joint Graduate School of Energy and Environment 185
Air Pollution and Traffic
Measurements in Bangkok Streets
S. T. Leong *, S. Muttamara and
P. Laortanakul
Urban Environmental Engineering and Management Program,
School of Environment, Resource and Development, Asian
Institute of Technology, G.P.O. Box 4, Klong Luang, Pathumthani
12120, Thailand.
* Corresponding author: [email protected]
(Received : 16 October 2001 – Accepted : 30 April 2003)
Abstract: Ambient air quality and traffic density measurements
were conducted during January to December 2001 at four air
monitoring sites in Bangkok Metropolitan Region (BMR). The
ambient air pollutants included carbon monoxide (CO), particulate
matter (PM10), nitrogen dioxide (NO2), sulfur dioxide (SO2),
ozone (O3) and benzene. The diurnal variations of air pollutant
levels were generally identical to the corresponding traffic
volume patterns during rush/non rush hours and day/night times.
Average air pollutant concentration during weekday was found to
be higher than during weekend. The air pollutant concentration
was related to the traffic flow pattern and human activities. The
test result showed vide variations between air pollutant
concentrations and with traffic characteristic, street geometries
Shing Tet Leong, S. Muttamara and P. Laortanakul
186 Asian J. Energy Environ., Vol. 3, Issues 3-4, (2002), pp. 185-213
and meteorological parameters. Most of the air pollutant
concentrations showed indicative correlation with traffic density.
However, there was a relatively smaller correlation between
average hourly concentrations of sulfur dioxide and ozone and
traffic densities.
The finding shows that the average air pollutant
concentrations for the three urban sites are noticeably higher
than the suburban site. Similarly, the traffic speeds were very
well correlated with traffic densities. Lower traffic speeds were
observed among station with slow moving traffic (high traffic
density) while higher traffic speeds were found among station
with fast traffic movement. Our analysis revealed that an
obvious way to reduce the build-up of pollutant concentration on
Bangkok streets would be to speed up the flow of traffic and
prevent long periods of idling in congested streets.
Keywords: Bangkok, Benzene, Carbon monoxide, Nitrogen
Dioxide, ozone, Particulate matter, Sulphur dioxide.
Introduction The Bangkok metropolitan area (1,569 km2) with a total
population of about 6.2 million and registered vehicles of more
than 4.2 million (1999), is experiencing progressively
intensified air pollution problems associated with high levels of
vehicular exhaust emission. Vehicle ownership in Bangkok is
estimated at approximately 400 vehicles per 1,000 residents.
Air Pollution and Traffic Measurements in Bangkok Streets
Asian J. Energy Environ., Vol. 3, Issues 3-4, (2002), pp. 185-213 187
Rapid growth of the motor vehicle population, coupled with
poor engine maintenance, no requirement to fit catalytic
converters and continued utilization of unleaded gasoline emits
a significant quantity of air pollutants such as hydrocarbons,
particulate matter (PM10), carbon monoxide, sulphur dioxide,
nitrogen oxides, benzene and black smoke from diesel vehicles
(Muttamara, et. al, 2000).
The Pollution Control Department, Thailand
(Wangwongwatana, 1999) reported that dirty air severely
aggravates the symptoms of many kinds of asthma in Bangkok
Metropolis. Inhalation of particulate matter (PM10) poses a range
of health risks, including increased respiratory problems and
disease, breathing disorders and premature death. Elevated levels
of carbon monoxide can impair human health causing harm to the
cardiovascular and nervous systems. Benzene represents a special
case due to its toxicity and its carcinogenic effect. Long-term
benzene inhalation exposure as low as 0.0003 ppm (1 µg/m3) can
result in the development of acute leukemia (WHO, 1996).
In view of the importance and complexity of the problem,
current understanding of vehicular air pollution and its impact
on the environment is extensively studied by many European
and North American countries (Elsom et. al, 1996). However,
many recent models of roadside air pollution are designed for
American and European cities and are clearly inappropriate for
application to Asian cities (Okamato et. al., 1990). In addition,

Shing Tet Leong, S. Muttamara and P. Laortanakul
188 Asian J. Energy Environ., Vol. 3, Issues 3-4, (2002), pp. 185-213
lack of suitable monitoring data has further hindered the use of
these models. Consequently, there is considerable interest in
estimating roadside air pollutant emissions and their fate in the
environment (Jones et al., 2000). Although many studies on the
air pollution have been investigated in Bangkok, only few so far
have focused on the relationship between traffic density and air
pollutants in ambient air quality. Hence, this present study
delineates the apparent trends of traffic density, with the aim to
improve our present knowledge of the levels of various air
pollutants from vehicular emissions, which might prove useful
in the management of air quality in Bangkok Metropolis.
Materials and Methods
1. Ambient Air Quality Measurement
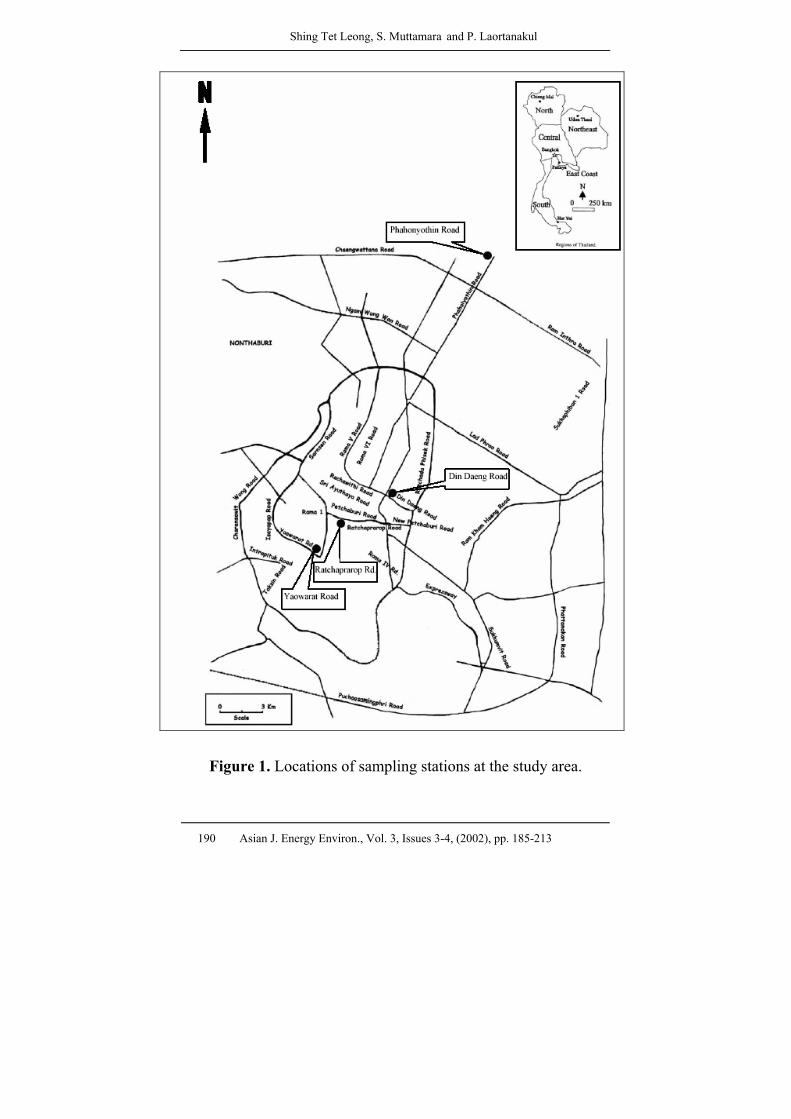
Four street sampling stations in the Bangkok Metropolitan
Region (BMR) were chosen based on traffic density, flow
conditions and wind speed. Individual locations of sampling
stations are described in Figure 1. At all of these sites, the
measured air pollutants were particulate matter (PM10), carbon
monoxide (CO), nitrogen dioxide (NO2), sulphur dioxide (SO2),
ozone (O3) and benzene. Field measurements of air pollutant
levels in Bangkok streets were spread over the period from
January to December, 2001. In each monitoring station, on-line
analyzers were used to monitor continuously various air
pollutants and the data recorded for sessions of hourly, daily
(weekday), weekend and monthly. The system provides four
Air Pollution and Traffic Measurements in Bangkok Streets
Asian J. Energy Environ., Vol. 3, Issues 3-4, (2002), pp. 185-213 189
types of selectable data: momentary values, integrated values,
moving averages and simple averages. Automatic compensation
for ambient pressure assures reliable data regardless of the
weather or the monitoring location. The influence from
interference components is minimal and results are very stable
over long periods of measurement. In addition, both ambient air
monitoring and traffic flow counting were determined
simultaneously over 24-hour periods and was used to identify the
rush and non-rush periods.
1.1 Particulate Matter (PM10)
Particulate matter was analysed by an Ambient PM10
Monitor (Graseby-FH621-N1). The system uses beta ray-
absorption to measure particulate matter under 10 µm in size. A
glass-fibre filter tape collects the particulate matter. Oversize
particles are filtered out by cyclone filtration. The intensity of
beta rays are detected by a plastic scintillator. The instrument
has an accuracy of + 10 µg/m3 or + 10% of reading.
Shing Tet Leong, S. Muttamara and P. Laortanakul
190 Asian J. Energy Environ., Vol. 3, Issues 3-4, (2002), pp. 185-213
Figure 1. Locations of sampling stations at the study area.
Air Pollution and Traffic Measurements in Bangkok Streets
Asian J. Energy Environ., Vol. 3, Issues 3-4, (2002), pp. 185-213 191
1.2 Carbon Monoxide (CO)
Carbon monoxide was analysed by an Ambient CO
Monitor (Horiba Model APMA-350E). Cross-flow modulation,
non-dispersive infrared absorption technology (NDIR) is the
recommended method of continuous analysis for carbon
monoxide content in the atmosphere. This instrument has a lower
detectable limit of 0.05 ppm. Repeatability is + 1.0 %. The zero
drift is + 0.1 ppm/day or + 0.2 ppm/week.
1.3 Nitrogen Dioxide (NO2)
NO2 monitor (Horiba-API-200A) measures hourly average
NO2 concentrations. This instrument is based on the principle of
chemi-luminescence, whereby NO in the sample air reacts with
ozone. The energy with a wavelength in the range 600 nm to
3000 nm passes through the reaction chamber and an optical
filter. The intensity is detected by a photo-multiplier tube and
recorded as nitric oxide, NO. The concentration of oxides of
nitrogen is measured in a separate stream undergoing similar
processes whereby NO2 is converted to NO and together with the
original NO, it is detected as NOX. The difference between the
NOX and NO is reported as nitrogen dioxide. The instrument
operates continuously with a data logger. Calibration of NO is
carried out using certified gas mixtures. Nitrogen dioxide
calibration is accomplished by use of NO2 permeation tubes. All
calibration gases are of chromatographic-grade quality and were
purchased from the Thai Industrial Gas Company. The working
Shing Tet Leong, S. Muttamara and P. Laortanakul
192 Asian J. Energy Environ., Vol. 3, Issues 3-4, (2002), pp. 185-213
range of the instrument is 0.1-10 ppm with a minimum detectable
limit of 0.15 ppb. The working temperature range is from 10-35 oC.
1.4 Sulphur Dioxide (SO2)
Sulphur dioxide was analysed by an Ambient SO2 Monitor
(Horiba-API-100). UV-Fluorescence is the recommended method
for continuous analysis of atmospheric sulphur dioxide. The UV
fluorescence method operates on the principle that when the SO2
molecules in the gaseous sample are excited by UV in the range
220-240 nm, they emit a characteristic fluorescence. The SO2
concentration is obtained from changes in the intensity of the
fluorescence. The instrument is designed for a lower detectable
limit of 0.5 ppb and repeatability of + 1.0 %.
1.5 Ozone (O3)
The analyses for ozone was performed using an Ambient
O3 Monitor (Horiba-API-400) based on ultra-violet-absorption
method (NDUV). The instrument works on the principle that
ozone absorbs UV rays (254 nm) in conjunction with the
comparative calculation method. This permits continuous
measurement with a lower detectable limit of 0.5 ppb and high
sensitivity (0.1 ppm).
1.6 Benzene (C6H6)
Charcoal tubes (SKC Cat. N0. 226-09) installed in a
portable air-sampling pump (SKC Model 224-PCXR8) were used
to collect ambient benzene samples. This procedure is strictly
Air Pollution and Traffic Measurements in Bangkok Streets
Asian J. Energy Environ., Vol. 3, Issues 3-4, (2002), pp. 185-213 193
followed the NIOSH method (P&CAM127). The flow rate of air
sampler was adjusted to be 2.0 l/min approximately. Benzene
was captured in the coconut-based charcoal tubes (6 mm OD x 70
mm length) packed with activated carbon (about 150g). After
sampling, the trapped benzene in the charcoal tube was desorbed
in 3 ml of carbon disulphide, shaken for 30 min in ultrasonic bath
and analyzed by gas chromatography. In this study, the gas
chromatograph was Shimadzu 14A fitted with a 1/8in. x 6ft.
stainless steel column with packing material, 10% 1,2,3 tris (2
cyanoethoxy) propane, (Chromosorb PAW-DMCS, 80/100 mesh)
and a flame ionisation detector (FID). The column temperature
was 80oC, injector and detector temperature at 110oC, with a
nitrogen flow rate of 35 ml/min. Benzene peak was eluted after 1.8
minutes. The linearity of the system was calibrated by injecting a
series of benzene standard solutions in the range of 10 to 1000
ppbv. The detection limit of benzene by considering S/N > 3 is
0.05 mg/l. All analytical measurements were performed in
triplicate to obtain mean values. Results of replicated analyses
were used for testing significance of benzene concentration in
ambient air.
2. Traffic Data Collection
Throughout the monitoring period, traffic volumes at all the
study sites were continuously measured over 24-hour periods
using a photographic technique through video cameras. For this
study, the vehicles were classified into 4 types: (1) Passenger car,
(2) Pick-up & Van, (3) Truck & Bus and (4) Motorcycle. In this
Shing Tet Leong, S. Muttamara and P. Laortanakul
194 Asian J. Energy Environ., Vol. 3, Issues 3-4, (2002), pp. 185-213
traffic analysis, volumes and travel speeds were observed for all
vehicles, both from inbound and outbound directions. Average
traffic speed was determined on an hourly basis by randomly
selecting 30 to 50 vehicles in the hour and measuring the time it
took each to travel through a fixed distance (1 km) marked on the
kerb. Average traffic density for each hour of the air sampling
period could then be obtained from the traffic volume and
average speed.
3. Wind and Rainfall Measurements
Wind velocity and direction at a height of 3 m above street
level were measured continuously using an automatic wind gauge
attached to a recorder, model TV 112P manufactured by Texas
Electronic Inc. Hourly average wind speed values were
determined from the records. Raw wind and rainfall data were
also obtained from the Meteorological Department of Thailand.
Results and Discussion
1. Ambient Air Quality Analysis
1.1 Particulate Matter (PM10)
In this study, noticeably higher measured particulate matter
concentrations were frequently found in busy urban areas. These
locations accumulated pollutants due to heavy traffic, tall
Air Pollution and Traffic Measurements in Bangkok Streets
Asian J. Energy Environ., Vol. 3, Issues 3-4, (2002), pp. 185-213 195
buildings on both sides and narrow streets. Throughout the
monitoring period, a higher average particulate matter (PM10)
concentration of 157.18 ug/m3 was observed for the urban site at
Yaowarat Road while a lower average PM10 concentration of
78.53 ug/m3 was exhibited for the suburban site at Phahonyothin
Road. The ambient air quality standard for particulate matter
(PM10) in Thailand is 120 ug/m3 (24hr average). The elevated
concentration of PM10 in Bangkok air quality poses a range of
health risks, including reduced lung capacity, respiratory disease,
breathing disorders and premature death. Similarly, higher
concentration of particulate matter in Bangkok can serve as
health indicators, which indicates that frequencies of respiratory
symptoms and hospital admission for respiratory and
cardiovascular illness are higher when PM10 concentrations are
higher.
1.2 Carbon Monoxide (CO)
The hourly average CO concentrations at the monitoring
sites varied between 9.6 – 20.6 mg/m3 which was within the
ambient air quality standard of 34.20 mg/m3. However, elevated
concentrations of carbon monoxide were often experienced from
time to time at busy roads, especially during rush hours. During
this period, frequent traffic jams and low speed were exhibited
and air pollution emissions were beyond maximum allowable
levels. Elevated levels of carbon monoxide warrant serious
concern due to their likely role in human health causing harm to
the cardiovascular and nervous systems. Carbon monoxide

Shing Tet Leong, S. Muttamara and P. Laortanakul
196 Asian J. Energy Environ., Vol. 3, Issues 3-4, (2002), pp. 185-213
affects the transport of oxygen around the body by the blood. At
very high levels, this can lead to a significant reduction in the
supply of oxygen to the heart. Those who die or become ill are
usually old or suffering from cardiovascular disease and therefore
were unable to cope with the added stress caused by the heavily
polluted air.
1.3 Nitrogen Dioxide (NO2)
Like particulate matter (PM10), average nitrogen dioxide
concentrations were highest close to busy roads, particularly in
large urban areas. The hourly mean concentrations of nitrogen
dioxide (NO2) measured at the four monitoring stations in
Bangkok did not fluctuate over a wide range and were found to
be between 19.6 – 96.9 ug/m3, well below the ambient air
standard of 320 ug/m3. Exposure to nitrogen dioxide can
decrease lung function and increase airway responsiveness in
wheezing, coughing, colds, influenza and bronchitis. At very
high concentrations, nitrogen dioxide gas irritates and inflames
the airways of the lungs. This irritation causes a worsening of
symptoms of those with lung or respiratory disease. In addition,
nitrogen dioxide is a major component of photochemical smog
in the summer months.
1.4 Sulphur Dioxide (SO2)
The measured hourly average sulphur dioxide at the four
monitoring stations in Bangkok were found to be between 4.6 –
17.4 ug/m3, well below the ambient air standard (780 ug/m3).
Air Pollution and Traffic Measurements in Bangkok Streets
Asian J. Energy Environ., Vol. 3, Issues 3-4, (2002), pp. 185-213 197
Short-term exposure to high levels of sulphur dioxide may cause
coughing, tightening of the chest and irritation of the lungs.
1.5 Ozone (O3)
The hourly average concentration of ozone determined by
the study ranged from 2.8 to 30.2 ug/m3. The intensity and
strength of ozone begins with low values in the early morning.
As the solar intensity increases, ozone begins to accumulate,
reaching the recorded maximum at its midday peak. As solar
energy decreases, ozone begins to decline and reaches its
minimum at late evening. Like nitrogen dioxide, high
concentrations of ozone can irritate and inflame the lungs. It can
also cause eye irritation and coughing. It is also a strong
oxidizing agent and can catalyze the reaction of red blood cells
(RBC) causing the destruction of chromosomes.
1.6 Benzene (C6H6)
Results of the ambient air quality study revealed that
current benzene concentrations in all the study areas ranged from
15.1 to 42.4 ug/m3 which were comparable relative to other
countries such as 3-12 ug/m3 on the Hertfordshire motorway,
U.K (Brown et al., 1998) and 11.7-20.2 ug/m3 in urban areas of
Central Seoul, South Korea (Jo and Choi, 1996). Due to the
influence of higher traffic density, the diurnal pattern of benzene
showed some marked divergences from urban (Yaowarat Road)
to suburban (Phahonyothin Road) sites. WHO (1996) indicates
that long-term benzene inhalation exposure as low as 0.0003 ppm
Shing Tet Leong, S. Muttamara and P. Laortanakul
198 Asian J. Energy Environ., Vol. 3, Issues 3-4, (2002), pp. 185-213
(1 ug/m3) can result in the development of acute leukemia. In
some cases, pollutant mixtures containing a low concentration of
benzene, NO2, SO2 and O3 have been reported to be more
detrimental to plants, animals, materials, etc. than benzene alone.
1.7 Diurnal Variations
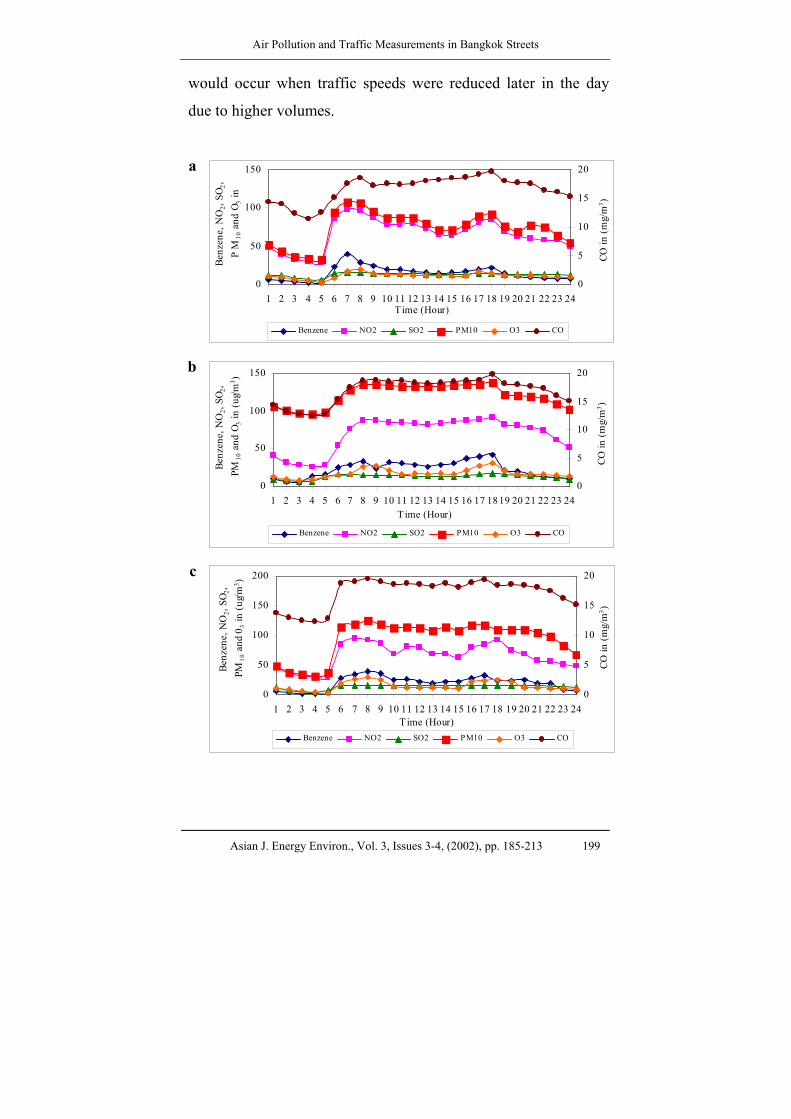
Figure 2 shows the diurnal pattern of air pollutant levels
in four Bangkok air monitoring stations, during rush and non-
rush hours. Generally, most of the pollutants such as PM10, CO,
NO2 and benzene for each of the four roads gave almost the same
diurnal patterns. The concentration of air pollutants at all
monitoring stations showed a minimum level over the period
0.00-05.00. There was higher value for the pollutant
concentrations at morning rush hour (07.00 - 09.00). A slight
decrease in pollutant concentration occurred at non-rush hour
(11.00-15.00) and a rising level of pollutants was experienced in
the evening rush hour (16.00-18.00). The levels then tended to
reduce reaching a minimum at night time (19.00-24.00). These
observations could be explained by the morning and evening
traffic rush hours, as determined from the traffic survey data. It
was revealed that during rush hours a comparably higher traffic
volume occurred for all the monitoring stations. During this time,
traffic moved more slowly, particularly the number of passenger
cars and buses resulting in high smoke, particulate and carbon
monoxide emissions. During non-rush hours, higher vehicle
speeds could be expected to give a higher degree of street
turbulence and cause greater movement of air pollution than
Air Pollution and Traffic Measurements in Bangkok Streets
Asian J. Energy Environ., Vol. 3, Issues 3-4, (2002), pp. 185-213 199
would occur when traffic speeds were reduced later in the day
due to higher volumes.
a
0
50
100
150
1 2 3 4 5 6 7 8 9 10 11 12 13 14 15 16 17 18 19 20 21 22 23 24Time (Hour)
Benz
ene,
NO
2, SO
2, P
M10
and
O3 i
n
0
5
10
15
20
CO in
(mg/
m3 )
Benzene NO2 SO2 PM10 O3 CO
b
0
50
100
150
1 2 3 4 5 6 7 8 9 10 11 12 13 14 15 16 17 18 19 20 21 22 23 24Time (Hour)
Benz
ene,
NO
2, SO
2, PM
10 a
nd O
3 in
(ug/m
3 )
0
5
10
15
20
CO in
(mg/
m3 )
Benzene NO2 SO2 PM10 O3 CO
c
0
50
100
150
200
1 2 3 4 5 6 7 8 9 10 11 12 13 14 15 16 17 18 19 20 21 22 23 24Time (Hour)
Benz
ene,
NO
2, SO
2, PM
10 a
nd 0
3 in
(ug/m
3 )
0
5
10
15
20
CO in
(mg/
m3 )
Benzene NO2 SO2 PM10 O3 CO
Shing Tet Leong, S. Muttamara and P. Laortanakul
200 Asian J. Energy Environ., Vol. 3, Issues 3-4, (2002), pp. 185-213
d
0
50
100
150
0 1 2 3 4 5 6 7 8 9 10 11 12 13 14 15 16 17 18 19 20 21 22 23 24Time (Hour)
Benz
ene,
NO
2, SO
2, PM
10 a
nd O
3 in
(ug/m
3 )
0
5
10
15
20
COin
(mg/
m3 )
Benzene NO2 SO2 PM10 O3 CO
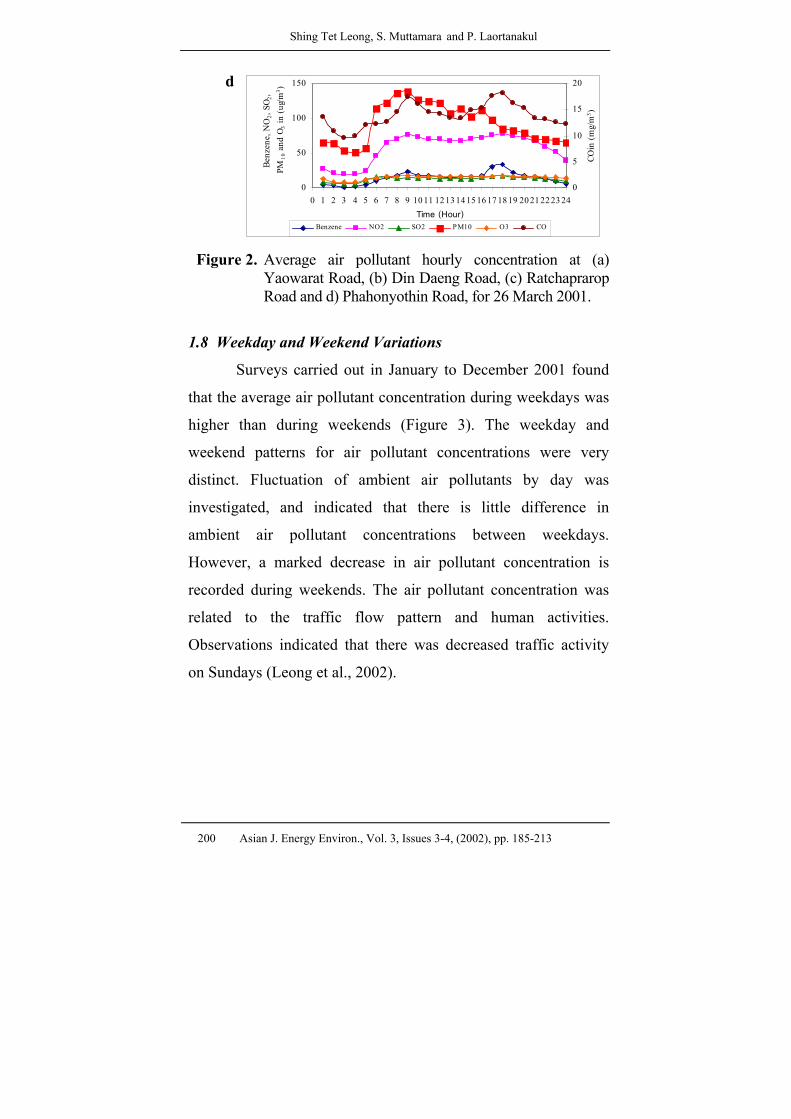
Figure 2. Average air pollutant hourly concentration at (a) Yaowarat Road, (b) Din Daeng Road, (c) Ratchaprarop Road and d) Phahonyothin Road, for 26 March 2001.
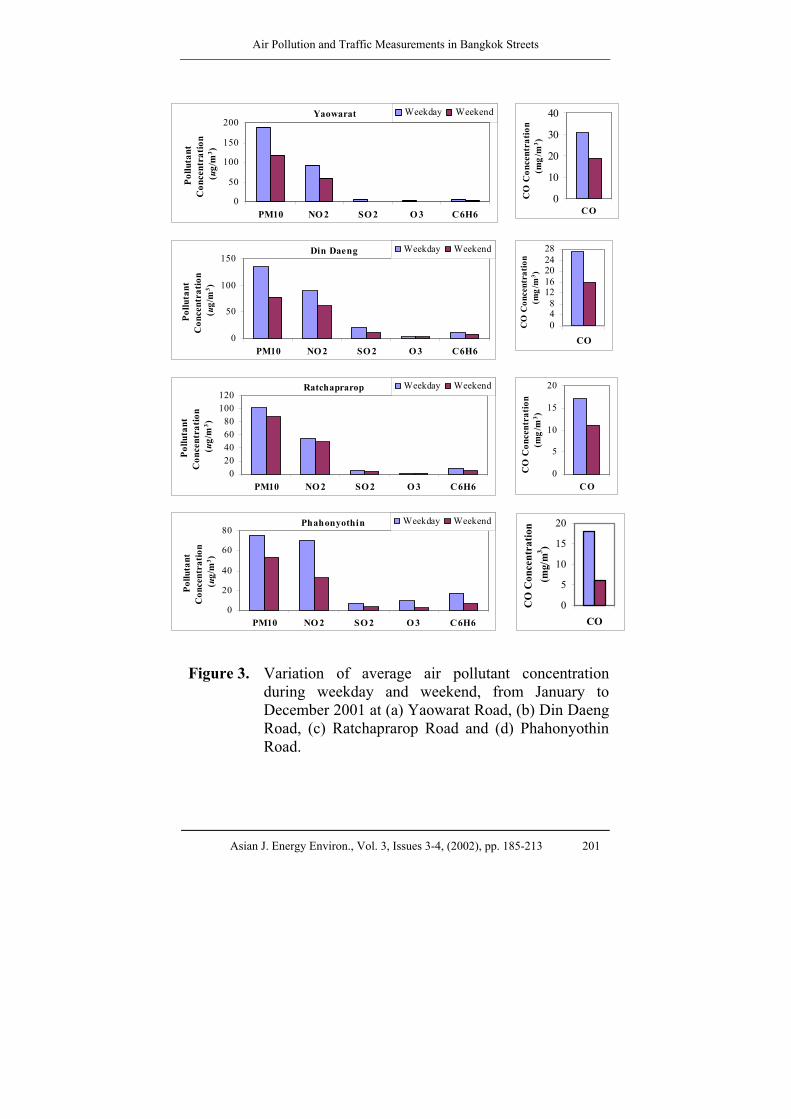
1.8 Weekday and Weekend Variations
Surveys carried out in January to December 2001 found
that the average air pollutant concentration during weekdays was
higher than during weekends (Figure 3). The weekday and
weekend patterns for air pollutant concentrations were very
distinct. Fluctuation of ambient air pollutants by day was
investigated, and indicated that there is little difference in
ambient air pollutant concentrations between weekdays.
However, a marked decrease in air pollutant concentration is
recorded during weekends. The air pollutant concentration was
related to the traffic flow pattern and human activities.
Observations indicated that there was decreased traffic activity
on Sundays (Leong et al., 2002).
Air Pollution and Traffic Measurements in Bangkok Streets
Asian J. Energy Environ., Vol. 3, Issues 3-4, (2002), pp. 185-213 201
Yaowarat
0
50
100
150
200
PM10 NO 2 SO 2 O 3 C6H6
Pollu
tant
C
once
ntra
tion
(ug/
m3 )
Weekday Weekend
0
10
20
30
40
CO
CO
Con
cent
ratio
n (m
g/m
3 )
Din Daeng
0
50
100
150
PM10 NO 2 SO 2 O 3 C6H6
Pollu
tant
C
once
ntra
tion
(ug/
m3 )
Weekday Weekend
048
1216202428
CO
CO
Con
cent
ratio
n (m
g/m
3 )
Ratchaprarop
020406080
100120
PM10 NO 2 SO 2 O 3 C6H6
Pollu
tant
C
once
ntra
tion
(ug/
m3 )
Weekday Weekend
0
5
10
15
20
CO
CO
Con
cent
ratio
n (m
g/m
3 )
Phahonyothin
0
20
40
60
80
PM10 NO 2 SO 2 O 3 C6H6
Pollu
tant
C
once
ntra
tion
(ug/
m3 )
Weekday Weekend
0
5
10
15
20
CO
CO
Con
cent
ratio
n (m
g/m
3 )
Figure 3. Variation of average air pollutant concentration
during weekday and weekend, from January to December 2001 at (a) Yaowarat Road, (b) Din Daeng Road, (c) Ratchaprarop Road and (d) Phahonyothin Road.
Shing Tet Leong, S. Muttamara and P. Laortanakul
202 Asian J. Energy Environ., Vol. 3, Issues 3-4, (2002), pp. 185-213
1.9 Influence of Human Activities
The concentration of air pollutants at all monitoring
stations were also affected by human activities During the
months of March-May and August-October, most of the schools
in Bangkok were closed, being the holiday season for students.
This affects the traffic flow and hence, upsets the usual
concentration of ambient air pollutants
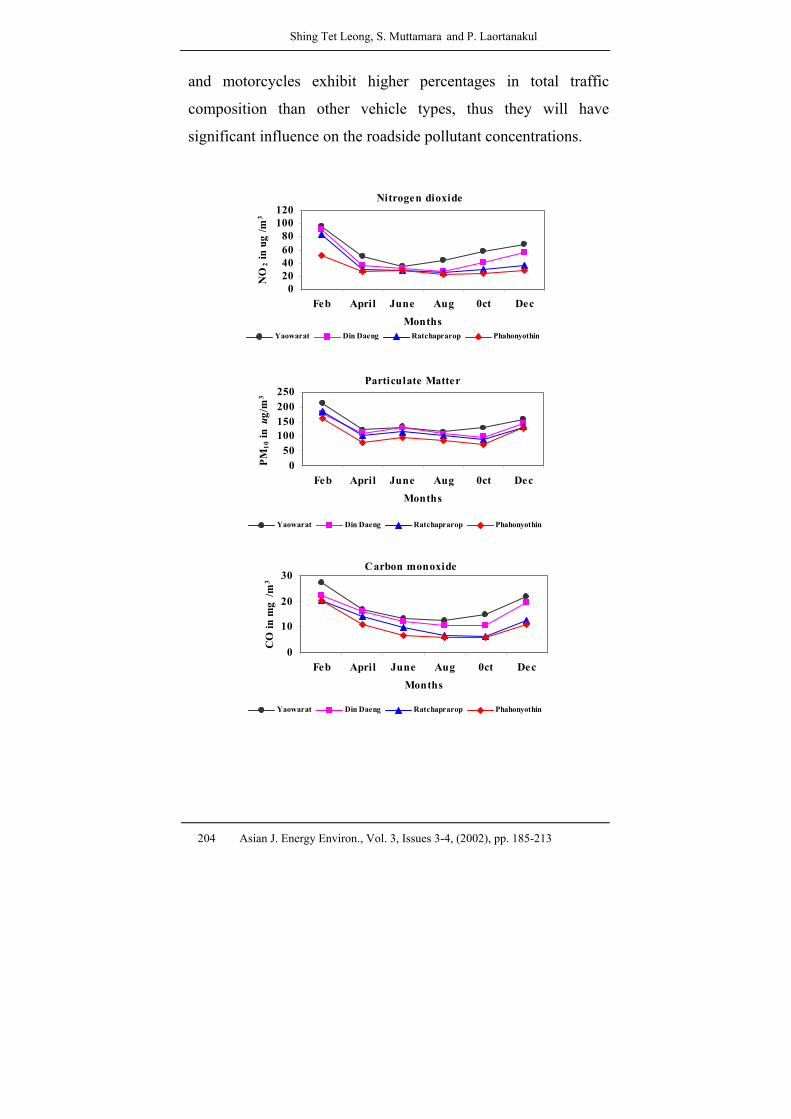
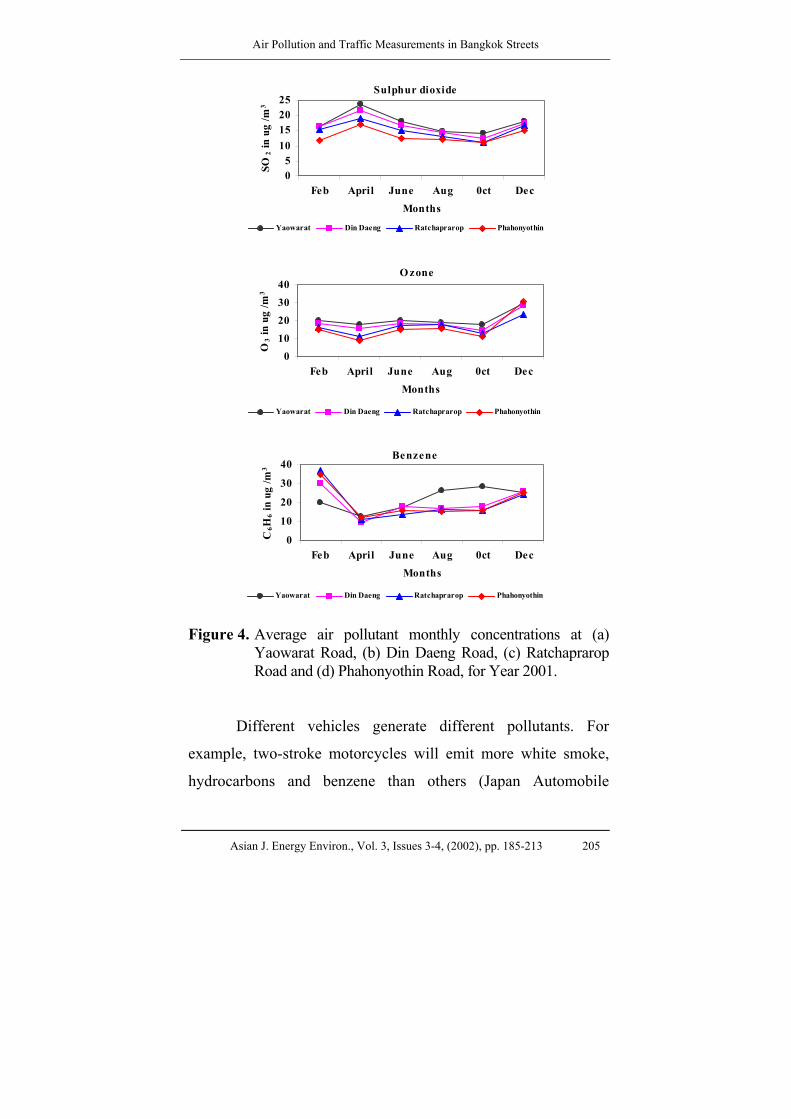
1.10 Relationship with Meteorological Parameters
Weather variables play a major role in dispersing air
pollutants and thus the determination of the level of their
concentration. Bangkok has three seasons: the “cold season”
(December to January), “ dry season” (February to May) and
“rainy season” (June to October). Normally, high pollution can
be observed during the cold season at the beginning and at the
end, due to a high pressure system creating a more stable
atmosphere brought about by inversion layer phenomenon, thus,
more accumulation of pollutants in the air. Generally, during the
dry season, pollution is low due to high atmospheric dispersion
attributed to the existence of a less stable atmospheric system.
However, the graphs (Figure 4) indicate that almost the same
ambient air pollutant concentrations were recorded during rainy
and dry seasons. The findings revealed that seasonal variation
coupled with school term breaks and national holidays
contributed toward a lower air pollutant concentration during
both seasons. However, seasonal variation of sulphur dioxide
and ozone concentrations was not observed at each of the four
Air Pollution and Traffic Measurements in Bangkok Streets
Asian J. Energy Environ., Vol. 3, Issues 3-4, (2002), pp. 185-213 203
locations. This is probably due to the low sulphur content in the
gasoline. Present sulphur content in Thai gasoline is 0.01 %wt.
Sulphur dioxide emission was usually varied with sulphur
content in gasoline. Likewise, ozone emission is dependable
entirely on sunlight.
Attempts had been carried out to determine if any
correlation exists between the air pollutant concentrations and the
meteorological parameters at the various sites. However, negative
correlation was established between air pollutant concentration
and the meteorological factors. No significant temperature effects
on ambient pollutant concentrations were found, as ambient
temperature during the sampling period is rather stable. Average
temperatures during the monitoring period were reported to be
between 25oC to 33oC.
2. Traffic Analysis
2.1 Traffic Composition
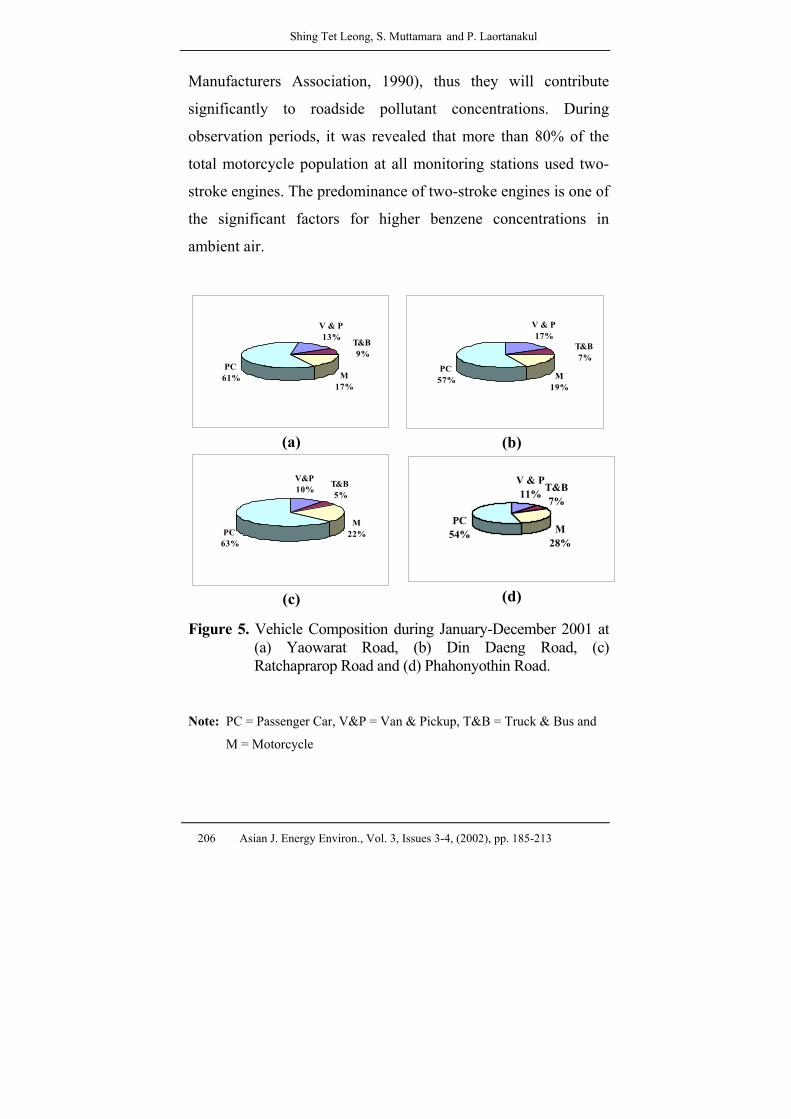
As it can be clearly seen from Figure 5 that the most
dominant type of traffic was passenger cars, which represented
the highest percentages (54-63%) of the total traffic volume at all
monitoring stations. Motorcycles represent the second largest
group, ranging between 17-28% of total traffic at most
observation stations. On the contrary, trucks and buses
represented the smallest group of vehicles representing only
about 10% of the total traffic. It is observed that passenger cars
Shing Tet Leong, S. Muttamara and P. Laortanakul
204 Asian J. Energy Environ., Vol. 3, Issues 3-4, (2002), pp. 185-213
and motorcycles exhibit higher percentages in total traffic
composition than other vehicle types, thus they will have
significant influence on the roadside pollutant concentrations.
Nitrogen dioxide
020406080
100120
Feb April June Aug 0ct DecMonths
NO
2 in
ug/m
3
Yaowarat Din Daeng Ratchaprarop Phahonyothin
Particulate Matter
050
100150200250
Feb April June Aug 0ct DecMonths
PM10
in u
g/m
3
Yaowarat Din Daeng Ratchaprarop Phahonyothin
Carbon monoxide
0
10
20
30
Feb April June Aug 0ct DecMonths
CO
in m
g/m
3
Yaowarat Din Daeng Ratchaprarop Phahonyothin
Air Pollution and Traffic Measurements in Bangkok Streets
Asian J. Energy Environ., Vol. 3, Issues 3-4, (2002), pp. 185-213 205
Sulphur dioxide
05
10152025
Feb April June Aug 0ct DecMonths
SO2 i
n ug
/m3
Yaowarat Din Daeng Ratchaprarop Phahonyothin
O zone
010203040
Feb April June Aug 0ct DecMonths
O3 i
n ug
/m3
Yaowarat Din Daeng Ratchaprarop Phahonyothin
Benzene
0
10
20
30
40
Feb April June Aug 0ct DecMonths
C6H
6 in
ug/m
3
Yaowarat Din Daeng Ratchaprarop Phahonyothin
Figure 4. Average air pollutant monthly concentrations at (a) Yaowarat Road, (b) Din Daeng Road, (c) Ratchaprarop Road and (d) Phahonyothin Road, for Year 2001.
Different vehicles generate different pollutants. For
example, two-stroke motorcycles will emit more white smoke,
hydrocarbons and benzene than others (Japan Automobile
Shing Tet Leong, S. Muttamara and P. Laortanakul
206 Asian J. Energy Environ., Vol. 3, Issues 3-4, (2002), pp. 185-213
Manufacturers Association, 1990), thus they will contribute
significantly to roadside pollutant concentrations. During
observation periods, it was revealed that more than 80% of the
total motorcycle population at all monitoring stations used two-
stroke engines. The predominance of two-stroke engines is one of
the significant factors for higher benzene concentrations in
ambient air.
T&B9%
PC61% M
17%
V & P13%
(a)
T&B7%
PC57% M
19%
V & P17%
(b)
PC63%
T&B5%
V&P10%
M22%
(c)
M28%
V & P11%
PC54%
T&B7%
(d)
Figure 5. Vehicle Composition during January-December 2001 at (a) Yaowarat Road, (b) Din Daeng Road, (c) Ratchaprarop Road and (d) Phahonyothin Road.
Note: PC = Passenger Car, V&P = Van & Pickup, T&B = Truck & Bus and
M = Motorcycle
Air Pollution and Traffic Measurements in Bangkok Streets
Asian J. Energy Environ., Vol. 3, Issues 3-4, (2002), pp. 185-213 207
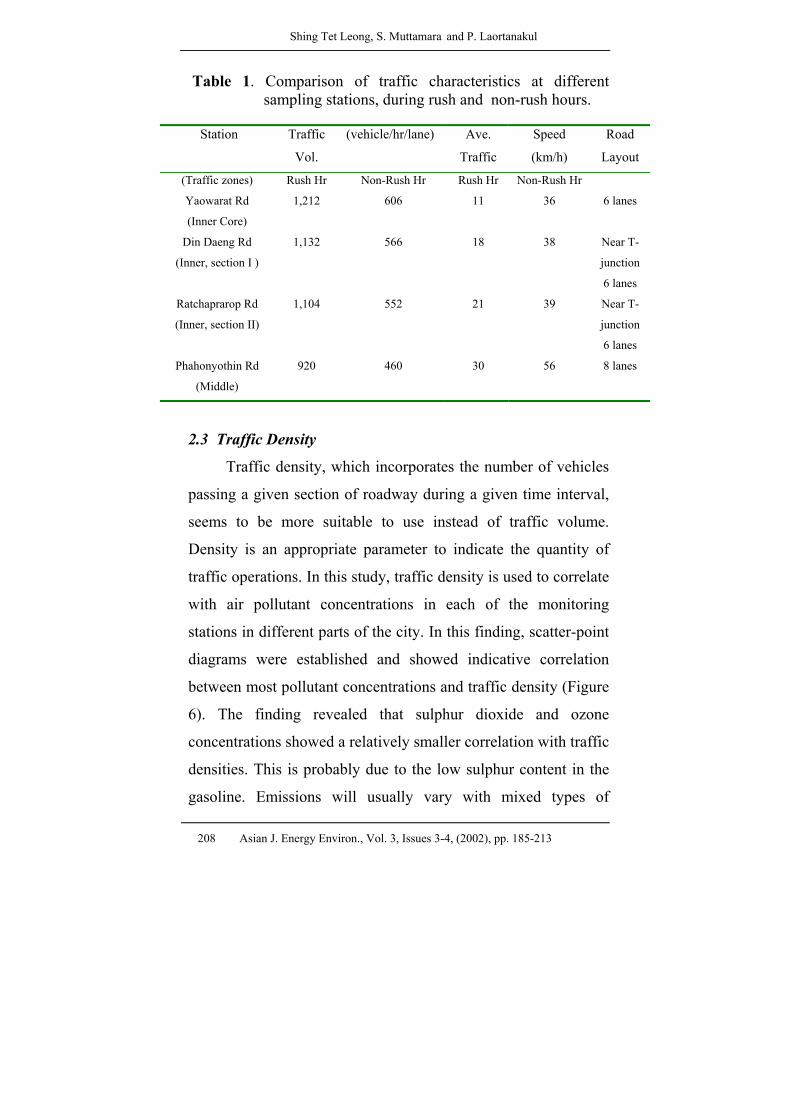
2.2 Traffic and Street Characteristics
A comparison of traffic characteristics between the rush
hour and the non-rush hour was performed at different
monitoring stations (Table 1). The observed travel speeds at
Yaowarat and Din Daeng stations were found to be slower than at
other locations and corresponded to higher air pollutant
concentrations relative to traffic. Where traffic flows are slow,
more pollutants will be emitted by vehicles, especially diesel-
engined buses, many of which are old and inefficient. In addition,
the finding also revealed that air pollution from traffic emissions
depends on the physical conditions in narrow streets enclosed by
tall buildings which govern the ability of atmosphere to disperse
the pollutants. The street geometry of Yaowarat station is flanked
by tall buildings and shows characteristics of a canyon street with
frequent traffic jams. Similarly, traffic at Din Daeng and
Ratchaprarop sites moves more slowly with the approach of
major junctions and this appears to increase the air pollutant
level. In contrast, a lower air pollutant concentration was
observed at Phahonyothin station, having lower traffic volume
and more stable traffic flow. Thus, marked differences for street
level pollutants in Bangkok have been found between canyon
streets with slow-moving traffic and more open radial streets with
fast-moving traffic. An obvious way to reduce the build-up of
pollutant concentration on Bangkok streets would be to speed up
the flow of vehicles and prevent long periods of idling in
congested traffic.
Shing Tet Leong, S. Muttamara and P. Laortanakul
208 Asian J. Energy Environ., Vol. 3, Issues 3-4, (2002), pp. 185-213
Table 1. Comparison of traffic characteristics at different sampling stations, during rush and non-rush hours.
Station Traffic
Vol.
(vehicle/hr/lane) Ave.
Traffic
Speed
(km/h)
Road
Layout
(Traffic zones) Rush Hr Non-Rush Hr Rush Hr Non-Rush Hr
Yaowarat Rd
(Inner Core)
1,212 606 11 36 6 lanes
Din Daeng Rd
(Inner, section I )
1,132 566 18 38 Near T-
junction
6 lanes
Ratchaprarop Rd
(Inner, section II)
1,104 552 21 39 Near T-
junction
6 lanes
Phahonyothin Rd
(Middle)
920 460 30 56 8 lanes
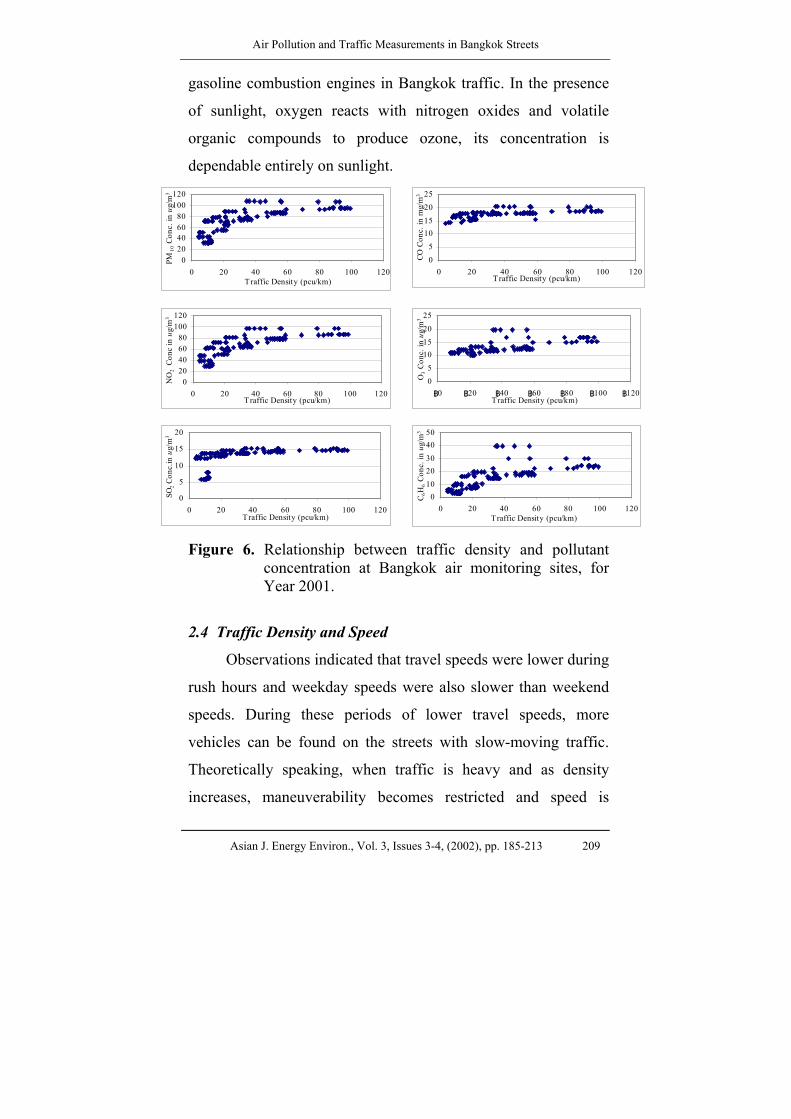
2.3 Traffic Density
Traffic density, which incorporates the number of vehicles
passing a given section of roadway during a given time interval,
seems to be more suitable to use instead of traffic volume.
Density is an appropriate parameter to indicate the quantity of
traffic operations. In this study, traffic density is used to correlate
with air pollutant concentrations in each of the monitoring
stations in different parts of the city. In this finding, scatter-point
diagrams were established and showed indicative correlation
between most pollutant concentrations and traffic density (Figure
6). The finding revealed that sulphur dioxide and ozone
concentrations showed a relatively smaller correlation with traffic
densities. This is probably due to the low sulphur content in the
gasoline. Emissions will usually vary with mixed types of
Air Pollution and Traffic Measurements in Bangkok Streets
Asian J. Energy Environ., Vol. 3, Issues 3-4, (2002), pp. 185-213 209
gasoline combustion engines in Bangkok traffic. In the presence
of sunlight, oxygen reacts with nitrogen oxides and volatile
organic compounds to produce ozone, its concentration is
dependable entirely on sunlight.
020406080
100120
0 20 40 60 80 100 120Traffic Density (pcu/km)
PM10
Con
c. in
ug/
m3
05
10152025
0 20 40 60 80 100 120Traffic Density (pcu/km)
CO C
onc.
in m
g/m
3
020406080
100120
0 20 40 60 80 100 120Traffic Density (pcu/km)
NO
2 C
onc
in u
g/m
3
0
5
101520
25
฿0 ฿20 ฿40 ฿60 ฿80 ฿100 ฿120Traffic Density (pcu/km)
O3 C
onc.
in u
g/m
3
0
5
10
15
20
0 20 40 60 80 100 120Traffic Density (pcu/km)
SO2
Conc
.in u
g/m
3
01020304050
0 20 40 60 80 100 120Traffic Density (pcu/km)
C 6H
6 Con
c. in
ug/
m3
Figure 6. Relationship between traffic density and pollutant
concentration at Bangkok air monitoring sites, for Year 2001.
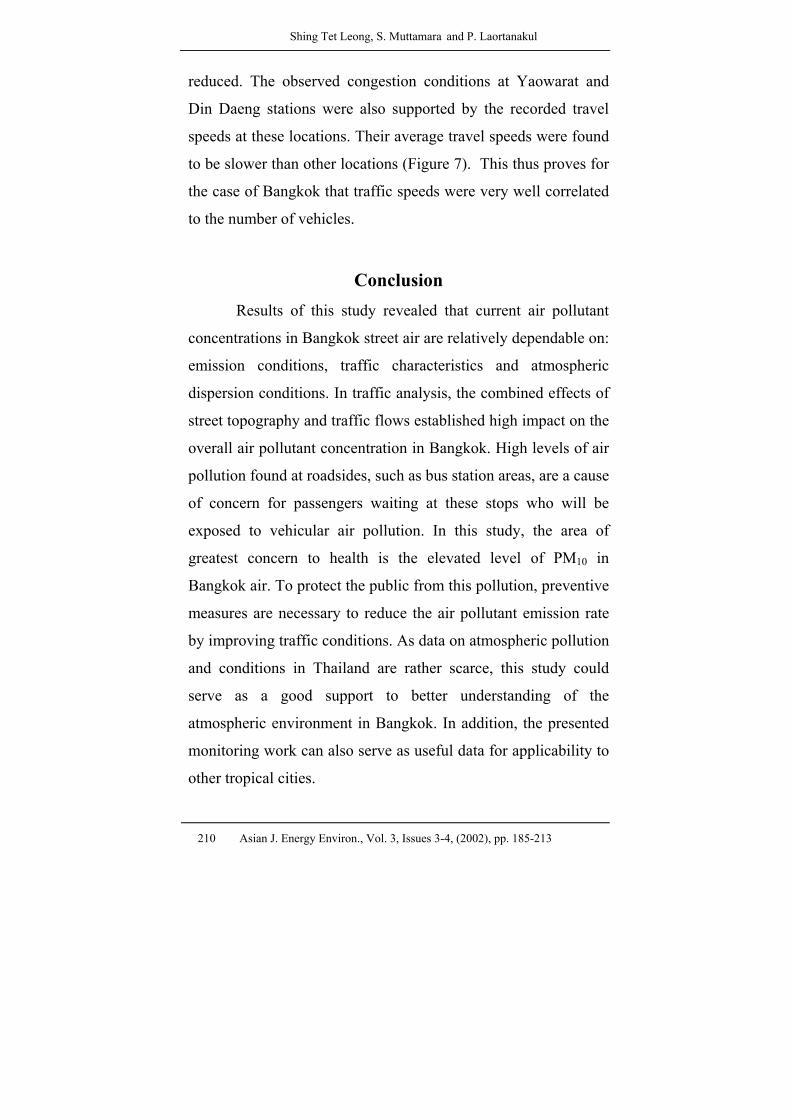
2.4 Traffic Density and Speed
Observations indicated that travel speeds were lower during
rush hours and weekday speeds were also slower than weekend
speeds. During these periods of lower travel speeds, more
vehicles can be found on the streets with slow-moving traffic.
Theoretically speaking, when traffic is heavy and as density
increases, maneuverability becomes restricted and speed is
Shing Tet Leong, S. Muttamara and P. Laortanakul
210 Asian J. Energy Environ., Vol. 3, Issues 3-4, (2002), pp. 185-213
reduced. The observed congestion conditions at Yaowarat and
Din Daeng stations were also supported by the recorded travel
speeds at these locations. Their average travel speeds were found
to be slower than other locations (Figure 7). This thus proves for
the case of Bangkok that traffic speeds were very well correlated
to the number of vehicles.
Conclusion Results of this study revealed that current air pollutant
concentrations in Bangkok street air are relatively dependable on:
emission conditions, traffic characteristics and atmospheric
dispersion conditions. In traffic analysis, the combined effects of
street topography and traffic flows established high impact on the
overall air pollutant concentration in Bangkok. High levels of air
pollution found at roadsides, such as bus station areas, are a cause
of concern for passengers waiting at these stops who will be
exposed to vehicular air pollution. In this study, the area of
greatest concern to health is the elevated level of PM10 in
Bangkok air. To protect the public from this pollution, preventive
measures are necessary to reduce the air pollutant emission rate
by improving traffic conditions. As data on atmospheric pollution
and conditions in Thailand are rather scarce, this study could
serve as a good support to better understanding of the
atmospheric environment in Bangkok. In addition, the presented
monitoring work can also serve as useful data for applicability to
other tropical cities.
Air Pollution and Traffic Measurements in Bangkok Streets
Asian J. Energy Environ., Vol. 3, Issues 3-4, (2002), pp. 185-213 211
Yaowarat
0
50
100
150
0 20 40 60 80 100Density (vehicle/km/lane)
Spee
d (k
m/h
)
Din Daeng
0
50
100
150
0 20 40 60 80 100Density (vehicle/km/lane)
Spee
d (k
m/h
)
Ratchaprarop
0
50
100
150
0 50 100 150Density (vehicle/km/lane)
Spee
d (k
m/h
)
Phahonyothin
0
50
100
150
0 20 40 60 80 100Density (vehicle/km/lane)
Spee
d (k
m/h
)
Figure 7. Speed-density relationship, from January to December 2001 at (a) Yaowarat Road, (b) Din Daeng Road, (c) Ratchaprarop Road and (d) Phahonyothin Road.
Shing Tet Leong, S. Muttamara and P. Laortanakul
212 Asian J. Energy Environ., Vol. 3, Issues 3-4, (2002), pp. 185-213
References
[1] Brown, V.M. and Crump, D. R. (1998) Diffusive Sampling of Volatile Organic Compounds in Ambient Air, Environmental Monitoring and Assessment, 52, 43-55.
[2] Elsom, D.M. and Crabbe, H. (1996) Implementing the National Air Quality Strategy in the United Kingdom. In Caussade, B. Power, H. and Brebbia, C.A. (Eds) Air Pollution IV, Monitoring, Simulation and Control, Computation Mechanics Publications, Southampton, pp. 823-836.
[3] Japan Automobile Manufacturers Association Inc. (1990) Motorcycles Emission Regulation and Control Technologies, Japan Automobile Manufacturers Association Inc.
[4] Jo, W.K. and Choi, S.J. (1996) Vehicle Occupants’ Exposure to Aromatic Volatile Organic Compounds While Commuting on an Urban-Suburban Route in Korea. Journal of Air and Waste Management Association, 46, 749-754.
[5] Jones, S.G., Fisher, B.E., Gonzalez-flesca and Sokhi R. (2000) The Use of Measurement Programmes and Models to Assess Concentrations Next to Major Roads in Urban Areas. Env. Monitoring and Assessment, 64, 531-547.
[6] Land Transportation Department (1999) Annual Report: Statistics Number of Registered Vehicles in Thailand for 1999, Land Transportation Department, Bangkok.
[7] Leong, S.T., Muttamara, S. and Laortanakul, P. (2002) Influence of Benzene Emission from Motorcycles on Bangkok Air Quality, Atmospheric Environment, 36, 651-661.
[8] Muttamara, S. and Leong, S.T. (2000) Monitoring and Assessment of Exhaust Emission in Bangkok Street Air. Environmental Monitoring and Assessment, 60, 163-180.
[9] NIOSH (1977) NIOSH Manual of Analytical Method (P&CAM127). US National Institute for Occupation Safety and Health, Cincinnati, USA.
[10] Okamato, S., Kobayashi, K. and Ono, N. (1990) Comparative Study of Estimation Methods for NOX Emission from a Roadway, Atmospheric Environment, 24(A)(6), 1535-1544.
Air Pollution and Traffic Measurements in Bangkok Streets
Asian J. Energy Environ., Vol. 3, Issues 3-4, (2002), pp. 185-213 213
[11] Pollution Control Department (1995) Guidelines On The Laws and Standards On Pollution Control In Thailand, Pollution Control Department, Ministry of Science Technology and Environment, Thailand.
[12] Wangwongwattana, S. (1999) Thailand’s Automotive Air Pollution Control Strategies, Air Quality and Noise Management Division, Pollution Control Department, Ministry of Science, Technology and Environment, Bangkok, Thailand.
[13] WHO (1996) Guideline, on Ambient Air Quality, EURO Reports on WHO meeting, World Health Organization, Regional Office for Europe, Copenhagen.
Top Related