


Languages
Pages
Legal


NBER WORKING PAPER SERIES
AIDING CONFLICT:THE IMPACT OF U.S. FOOD AID ON CIVIL WAR
Nathan NunnNancy Qian
Working Paper 17794http://www.nber.org/papers/w17794
NATIONAL BUREAU OF ECONOMIC RESEARCH1050 Massachusetts Avenue
Cambridge, MA 02138January 2012
We acknowledge financial support from the NBER Africa Project. The views expressed herein arethose of the authors and do not necessarily reflect the views of the National Bureau of Economic Research.
NBER working papers are circulated for discussion and comment purposes. They have not been peer-reviewed or been subject to the review by the NBER Board of Directors that accompanies officialNBER publications.
© 2012 by Nathan Nunn and Nancy Qian. All rights reserved. Short sections of text, not to exceedtwo paragraphs, may be quoted without explicit permission provided that full credit, including © notice,is given to the source.

Aiding Conflict: The Impact of U.S. Food Aid on Civil WarNathan Nunn and Nancy QianNBER Working Paper No. 17794January 2012JEL No. D74,F35,H84
ABSTRACT
This paper examines the effect of U.S. food aid on conflict in recipient countries. To establish a causalrelationship, we exploit time variation in food aid caused by fluctuations in U.S. wheat productiontogether with cross-sectional variation in a country's tendency to receive any food aid from the UnitedStates. Our estimates show that an increase in U.S. food aid increases the incidence, onset and durationof civil conflicts in recipient countries. Our results suggest that the effects are larger for smaller scalecivil conflicts. No effect is found on interstate warfare.
Nathan NunnDepartment of EconomicsHarvard University1805 Cambridge StCambridge, Ma 02138and [email protected]
Nancy QianDepartment of EconomicsYale University27 Hillhouse AvenueNew Haven, CT 06520-8269and [email protected]

“We are unable to determine whether our aid helps or hinders one or more par-ties to the conflict... However, it is clear that the losses – particularly lootedassets – constitutes a serious barrier to the efficient and effective provision ofassistance, and can contribute to the war economy. This raises a serious chal-lenge for the humanitarian community: can humanitarians be accused of fuelingor prolonging the conflict in these two countries? ” — Humanitarian Affairs Ad-visors for Medecins Sans Frontiers (MSF) Amsterdam writing about Chad andDarfur (Polman and Waters, 2010, p. 105).
1 Introduction
Humanitarian aid in general, and food aid in particular, is one of the key policy tools usedby the international community to help alleviate hunger and suffering in the developingworld.1 However, the efficacy of humanitarian aid, and food aid in particular, has receivedincreasing criticism, especially in the context of conflict-prone regions. Aid workers, humanrights observers and journalists have accused humanitarian aid of being not only ineffective,but of actually promoting conflict (e.g., Anderson, 1999; de Waal, 1997 and Polman andWaters, 2010). LeRiche (2004) argues that “despite being widely known, the utilizationof the humanitarian aid system as a logistical support system for war is one of the mostoverlooked constituent tactics of modern warfare. As such, it has not received adequateresearch or public attention”.
The qualitative evidence points to aid stealing as an important mechanism. Humanitar-ian aid is particularly easy for armed factions and opposition groups to appropriate since itis physically transported over long distances, often through territories only weakly controlledby the recipient government. Reports indicate that up to eighty percent of aid can be stolenen route (Polman and Waters, 2010, p. 121). Even when aid reaches its intended recipients,it can still be appropriated or “taxed” by armed groups, against whom the recipients are typi-cally powerless. This misappropriated aid is then used to fund conflict. Much to the concernof aid watchers, such accounts are not isolated but have been documented in numerous con-texts: e.g., Afghanistan (2001 - present), Western Sahara (1950s), the Democratic Republicof Congo (1971 - present), Ethiopia (1974-91), Eritrea (1972-74, 80-81), Israel (1950s), Iraq(1992), Liberia (1993-2003), Rwanda (1994-2008), Sierra Leone (1991-2002), Somalia (1991-present), Sri Lanka (1983-2009), Sudan (1983-2005) and the former Yugoslavia (1992-95)(Polman and Waters, 2010).
1Food aid is the main component of humanitarian aid and is also an important part of economic aidgenerally. For example, according to data from USAID, among the countries and years in our sample(non-OECD countries between 1972 and 2006), 29.5 percent of U.S. economic aid was food aid.
1

Although the grave nature of these accounts warrant the immediate attention of aiddonors, it is difficult to redesign aid policy without systematic evidence of the impact ofexisting policies. In particular, a question of first-order importance is whether the qualitativeaccounts are representative of the average effect of humanitarian aid or whether they capturethe effect within a set of extreme cases. Unfortunately, our current understanding remainslimited (Pillai, 2000, p. 197). Our study attempts to fill this gap by providing a rigorousestimate of the causal impact of food aid, the most important component of humanitarianaid, on conflicts in recipient countries. It aims to answer several important questions: Whatis the average effect of food aid on conflict? What types of conflicts are affected? Are theeffects more or less prominent in certain contexts?
The main difficulty in empirically estimating the impact of food aid on conflict arisesfrom reverse causality and joint determination. Furthermore, the direction of the bias isdifficult to predict ex ante. On the one hand, the fact that food aid and conflict are morelikely to be present during times of political and economic crises suggests that the OLSestimates of the impact of food aid on conflict may be biased upwards. On the other hand,the possibility that donor countries condition food aid on characteristics correlated with lowlevels of conflict may cause OLS estimates to be biased downwards.2
To overcome these issues, we develop a novel identification strategy for estimating theimpact of U.S. food aid on conflict. Our analysis exploits two sources of variation. First, weexploit plausibly exogenous time-variation in U.S. wheat production, which is mainly drivenby weather shocks.3 Due to U.S. price support policies for American wheat producers, theU.S. government accumulates reserves during high production years. In the following year,much of the surplus is then shipped to developing countries as food aid. In the data, weobserve that U.S. wheat production is positively correlated with U.S. food aid shipments inthe following year. Second, we exploit cross-sectional variation in a country’s likelihood ofbeing a U.S. food aid recipient, which we measure as the proportion of years that a countryreceives a positive amount of U.S. food aid during the 35 years of our study, 1972-2006. Byalso using this cross-sectional variation, we are able to control for time-varying factors withthe inclusion of region-year fixed effects. Thus, we instrument for the amount of food aidreceived by a country in a year with the interaction of last year’s U.S. wheat productionand the likelihood that a country was a U.S. food aid recipient. Our baseline estimates
2In addition, it is possible that conflict and food aid receipts are both outcomes of a third omittedfactor such as the strategic objectives of the aid donor. For example, during the 1960s and 1970s, theU.S. government supported South Vietnam’s war against North Vietnam by giving the South Vietnamesegovernment enormous amounts of food aid, which could be monetized and used to fund the war (Kodras,1993). In this case, the positive correlation between U.S. food aid receipts and conflict in South Vietnamwould confound the effect of food aid with the effect of U.S. strategic objectives.
3In a previous version of the paper, we use weather conditions in wheat producing regions of the U.S.directly to instrument for U.S. food aid. In this version, we use U.S. production as an instrument because itis easier to interpret the first stage and reduced form coefficients. The resulting 2SLS estimates for the twomethods are very similar. For brevity, we do not report the earlier estimates in this version of the paper.They are available upon request.
2

also include country fixed effects, which control for all time-invariant differences betweencountries, including the main effect of the likelihood that a country was a U.S. food aidrecipient; as well as region-year fixed effects, which control for changes over time that affectcountries within each region similarly. Our identification strategy relies on the interactionterm being exogenous conditional on these fixed effects (and the set of additional baselinecontrols that we describe below).
Our strategy follows the same logic as a difference-in-differences estimator. For example,the reduced form estimate compares the difference in conflict between years following highU.S. wheat production and years following low U.S. wheat production between countriesthat regularly receive U.S. food aid and countries that rarely receive U.S. food aid.
There are a few potential concerns related to the excludability of our instrument. First,the main driving force of the time variation in U.S. wheat production, U.S. weather con-ditions, may be correlated with weather conditions in aid-recipient countries, and therebyinfluence conflict through channels other than U.S. food aid. To address this, we directlycontrol for the weather conditions of recipient countries. Second, U.S. production shocksare potentially correlated with global wheat prices, which may affect conflict in recipientcountries. In practice, this is not a serious problem because U.S. government price stabi-lization policies cause U.S. wheat prices to be very stable over time. The data show thatglobal wheat prices are essentially uncorrelated with U.S. wheat production in the time-series. Nevertheless, we cautiously control for region-specific time fixed effects to captureregion-specific changes in wheat prices over time. We also control for the possibility thatchanges in global wheat prices may affect recipient countries differently depending on theextent to which they are producers or importers of cereals.
Our main outcomes of interest are measures of the incidence of conflict with more than 25combat deaths in a country and year. We separately examine the incidence of all conflicts,civil conflicts and inter-state conflicts. The analysis uses an annual panel of non-OECDcountries between 1972 and 2006. The OLS estimates of the impact of U.S. food aid onconflict are negative, small in magnitude and statistically insignificant for all forms of con-flict. By contrast, the 2SLS estimates identify a large, positive and statistically significantimpact of U.S. food aid provision on the incidence of civil conflict, but no effect on theincidence of inter-state conflict. The estimates imply that increasing U.S. food aid by 1,000metric tons (MT) increases the incidence of civil conflict by 0.38 percentage-points. For ahypothetical country that receives the sample mean of U.S. food aid - approximately 27,600MT - and experiences the mean incidence of conflict - 17.6 percent, the estimates imply thatincreasing food aid by ten percent increases the incidence of conflict by approximately 1.14percentage-points. This increase is equal to six percent of the mean of conflict.
To better understand how food aid can affect conflict, we undertake two additionaltests. First, we examine which types of conflict are most impacted by U.S. food aid by alsoestimating the impact of food aid on the incidence of large-scale armed conflicts, defined as
3

conflicts involving 1,000 or more combat deaths. We find that the effect of U.S. food aidis much smaller for large-scale conflicts than for the baseline measure, which includes allforms of civil conflict, both small and large. This finding is is consistent with descriptiveaccounts of humanitarian aid being appropriated by small-scale rebel groups or refugeewarriors to fund their military activities. Second, we decompose the incidence estimates byseparately examining civil conflict onset and duration. We find that U.S. food aid increasesthe incidence of civil conflicts by increasing both the probability of their onset as well astheir duration.
A potential caveat for interpretation comes from the possibility that U.S. food aid maycrowd out food aid from other countries or other forms of aid. Hence, U.S. food aid couldincrease conflict due to a reduction in these other forms of aid, rather than an increase inU.S. food aid. We explore this alternative interpretation, which has drastically differentpolicy implications, by directly examining the effects of U.S. food aid on: (i) other formsof aid from the United States, (ii) food aid from other countries, and (iii) total officialdevelopment assistance (ODA) from all countries. We find no evidence that these othertypes of foreign aid respond to U.S. food aid and therefore conclude that it is unlikely thatour results are due to aid crowd-out.
Having provided estimates of the average impact of U.S. food aid on conflict, we then turnto an examination of whether the impacts are more or less prominent in certain contexts.We find suggestive evidence that food aid causes fewer conflicts in countries with low levelsof ethnic fractionalization and with well-developed transportation infrastructure, measuredby road density. The latter result is particularly interesting because it is consistent withnumerous accounts of food aid being stolen by armed factions during transit. The results areconsistent with it being easier for aid deliveries to circumvent road blocks and other attemptsat theft when there are more alternative routes for reaching the targeted population.
Our findings contribute to several literatures. First, they add to the debate about thegeneral impacts of foreign aid.4 Studies in this literature face similar identification challengesas our study.5 Our use of donor-country shocks to instrument for aid provision follows asimilar logic as Werker, Ahmed and Cohen (2009) and Ahmed (2010), who exploit oil priceshocks and the fact that wealthy oil-rich donors tended to favor muslim nations to estimate
4See for example, Burnside and Dollar (2000), Easterly (2003), and Svensson (1999). For studies focusingspecifically on the impacts of food aid, see Lavy (1992), Pedersen (1996), Kirwan and McMillan (2007),Levinsohn and McMillan (2007), Quisumbing (2003) and Yamano, Alderman and Christiaensen (2005).
5The benefits of foreign aid for recipient countries is a much studied and controversial subject. Prominenteconomists, such as Jeffrey Sachs (2006), present many case studies of the success of aid, and Stern (1974)argues that rich countries are morally obligated to provide aid to assist in the development of poor ones.However, critics such as Bauer (1975) argue that foreign aid not only does not help, but hurts development.Recent academic studies are more nuanced and focus on the question of whether foreign aid can be effectivein good policy environments. On one hand, studies such as Burnside and Dollar (2000) and Svensson (1999)find that aid can be effective in good policy environments. On the other hand, others, such as Easterly(2003), argue that there is no evidence for the effectiveness of foreign aid. Other studies that question theeffectiveness of aid include Boone (1996) and Easterly, Levine and Roodman (2004). The main challenge forthese studies has been in estimating a causal impact of aid.
4

the impact of foreign aid on various macro-economic outcomes. Although they do notexamine conflict as an outcome, our finding that aid can have adverse effects is broadlyconsistent with their finding that aid has no effect on economic growth (Werker, Ahmedand Cohen, 2009) or that aid reduces institutional quality (Ahmed, 2010). Our finding thataid is partly determined by changes in U.S. domestic production links our study to existingstudies that find that aid is often determined by the strategic or economic needs of donorcountries (e.g., Ball and Johnson, 1996; Alesina and Dollar, 2000; Kuziemko and Werker,2006; and Nunn and Qian, 2010).
A small number of papers examine the impact of foreign aid receipts on civil conflict.Our finding that aid can increase conflict is consistent with the recent study by Besley andPersson (2011), which finds that increased official development assistance (ODA) associatedwith UN Security Council membership during the Cold War increases the incidence of civilwars in recipient countries. It is also consistent with Crost, Felter and Johnston (2011),which finds that across municipalities within the Philipinees, eligibility for a large WorldBank funded foreign aid program is positively correlated with conflict causalities. Ourstudy differs from these works in its focus on food aid, which may have different effects onconflict relative to foreign aid generally.6 In our focus on a specific form of aid, our study issimilar to the recent study by Dube and Naidu (2010), which finds a positive relationshipbetween U.S. military aid and paramilitary violence across regions within Columbia.
Finally, our study is closely related to a large empirical literature examining the deter-minants of conflict, which is reviewed by Blattman and Miguel (2010). In particular, inestablishing causality, our study is similar to recent studies such as Miguel, Satyanath andSergenti (2004), Dube and Vargas (2009), and Bruckner and Ciccone (2010) that developclever strategies to identify the causal impact of income shocks on civil conflict. Our re-sults complement these studies by providing additional evidence on the determinants of civilconflict.7
The paper is organized as follows. Section 2 discusses U.S. food aid policy and howfood aid can affect conflict. Section 3 describes our identification strategy and estimatingequations. Section 4 describes the data. Section 5 presents our 2SLS estimates. Section 6offers concluding remarks.
6Not all studies of the impacts of foreign aid find that aid increases conflict. (Collier and Hoeffler, 2002)find that total ODA has no effect on conflict globally, while (de Ree and Nillesen, 2009) find that withintotal ODA reduces conflict. The difference in findings across all studies examining foreign aid and conflict ismost likely due to different empirical strategies. In addition, the findings in our study may also differ fromthe findings of (Collier and Hoeffler, 2002) and (de Ree and Nillesen, 2009) because we examine a specifictype of aid rather than total ODA.
7The literature has thus far tended to focus on determinants such as ethnic divisions (e.g., Alberto Alesinaand Easterly, 1999; Fearon and Laitin, 2003; Montalvo and Reynal-Querol, 2005), income (e.g., Dube andVargas, 2009; Miguel, Satyanath and Sergenti, 2004), institutions (e.g., Ahmed, 2010; Besley and Persson,2011), propaganda (e.g., Yanagizawa-Drott, 2010), foreign aid (e.g., de Ree and Nillesen, 2009; Dube andNaidu, 2010), trade (e.g. Martin, Mayer and Thoenig, 2008) and commodity prices (e.g., Collier and Hoeffler,2004; Ross, 2004; Guidolin and Ferrara, 2007; Bruckner and Ciccone, 2010; Bazzi and Blattman, 2011).
5

2 Background
2.1 Food Aid and Conflict
U.S. food aid is delivered to recipient countries in the form of food that is typically trans-ported to needy populations through semi-permanent food-aid centers or refugee camps.Aid watchers most frequently point to theft by armed factions on the ground as the primarymechanism through which food aid and other types of humanitarian aid promote conflict.
Food aid is regularly appropriated by militia groups or other armed factions duringits distribution. Unlike many other types of foreign aid, food aid and humanitarian aidneed to be transported across territories that the recipient country government often haslittle control over. This makes food aid a particularly attractive target for armed factions,especially in countries where the ruling government has limited control outside of the capital.Armed factions can set up road blocks and “tax” aid agencies for safe passage. For example,accounts from Somalia in the early 1990s indicate that as much as eighty percent of foodaid shipments were either looted, stolen or used as protection money. Stolen aid was thentraded for arms in neighboring Ethiopia (Perlez, 1992). In Afghanistan, aid organizationsin the province of Uruzgan gave over one-third of their food aid and agricultural support tothe Taliban. In Sri Lanka, up to 25 percent of the total value of aid was paid to the TamilTigers by Dutch aid workers. In the former Yugoslavia, the UNHCR gave thirty percentof the total value of aid to Serbian armed forces, and then more bribes to Croatian forcesto pass the respective road blocks in order to reach Bosnia (Polman and Waters, 2010, pp.96-104).
The amount of theft can even exceed the value of the food, since convoy vehicles andother equipment are also stolen. In 2008, MSF Holland, an international aid organizationworking in Chad and Darfur, noted the strategic importance of these goods, writing thatthese “vehicles and communications equipment have a value beyond their monetary worthfor armed actors, increasing their capacity to wage war” (Polman and Waters, 2010, p. 105).
One of the most well-established cases of humanitarian aid strengthening rebel groupswithin a country occurred in Nigeria during the Nigeria-Biafra civil conflict of the late 1960s.The rebel leader Odumegwu Ojukwu only allowed aid to enter the rebel controlled region ofBiafra if it was shipped on his planes. He charged aid agencies for the use of his airplanesand filled the remaining space with arms and other military equipment. The shipments ofhumanitarian aid allowed Ojukwu to circumvent the siege that had been placed on Biafraby the Nigerian government. The food aid also allowed Ojukwu to feed his army, themembers of which officially qualified for international humanitarian relief because togetherwith the rest of the population, they were malnourished. Many suggest that the shipmentof humanitarian aid resulted in the Biafran civil conflict lasting years longer than it wouldhave otherwise (Polman and Waters, 2010, pp. 115-119).
Aid is not only stolen by rebel militia, but is also appropriated by the government, its
6
military and government supporters. In Rwanda, in the early 1990s, government stealing offood aid was so problematic that aid shipments were cancelled on several occasions (Uvin,1998, p. 90). Governments that receive aid often target it to specific populations, excludingopposition groups or populations in potentially rebellious regions. This has been noted toincrease hostilities and promote conflict. In Zimbabwe in 2003, the U.S.-based organization,Human Rights Watch, released a report documenting examples of residents being forced todisplay ZANU-PF Party membership cards before being given government food aid (Thurowand Kilman, 2009, p. 206). In eastern Zaire, the leaders of the Hema ethnic group permittedthe arrival of international aid organizations only if they agreed to give nothing to theirenemies, the Lendu.8 Polman and Waters (2010) describe this phenomenon as common,writing that “Aid has become a permanent feature of military strategy. Belligerents see toit that the enemy is given as little as possible while they themselves get hold of as much asthey can” (Polman and Waters, 2010, p. 10).
Humanitarian aid workers are aware of the threat of aid theft and have developed anumber of strategies for minimizing the amount of theft en route.9 However, aid can stillfuel conflict even if it is successfully delivered to the intended populations. This commonlyoccurs because the recipient populations either include members of rebel or militia groups,or the recipients are “taxed” after receiving the aid. The most well-known example of thisoccurred in the Hutu refugee camps near Goma following the Rwandan Genocide in 1994.Hutu extremist leaders taxed Hutu civilians in the camps, and transferred the appropriatedaid to their militia. The aid (and physical protection) provided by refugee camps allowedthe Hutu extremists to regroup and rebuild their army. The Hutu militia were then able tocarry out raids into Rwanda, which contributed to both the First and Second Congo Wars(Terry, 2002, ch. 5; Lischer, 2005, ch. 4).
For completeness, we discuss two additional channels through which food aid can, intheory, affect conflict. First, because food aid is fungible, it can increase government rev-enues, which can promote political competition and conflict through the mechanisms ofmany standard conflict models.10 In practice, this is unlikely since the value of food aid isvery small relative to total government revenues. For example, the average ratio of the valueof U.S. food aid relative to total GDP among observations in our sample ranges from 0.0016to 0.0033, with the difference depending on whether transportation costs are included inthe food aid figures.11 Even among the observations with greater than median U.S. foodaid recipients, the average ratio only ranges from 0.0011 to 0.0066. Second, one may be
8In 2001, six aid workers who gave aid to the Lendu were murdered (Polman, 2009, p. 98).9See Anderson (1999) for a summary of strategies used by aid workers to minimize aid theft and diversion.
10For example, see the works of Haavelmo (1954), Hirschleifer (1989), Garfinkel (1990), Grossman (1991),Skaperdas (1992), Grossman (1999), Collier and Hoeffler (2002) and Besley and Persson (2011).
11The figure are constructed by calculating for each observation in the sample (i.e., non-OECD countriesform 1972 to 2006) the total value of U.S. food aid received divided by total GDP (both measured in nominalU.S. dollars). We then calculate the average among the observations. The lower estimate assumes that 47percent of the reported value of aid is the actual value of the commodities (see the discussion at the end ofSection 2.2). The higher estimate assumes that the full value consists of the value of the commodities.
7
concerned that food aid causes conflict by increasing the supply of food, therefore reducingthe price of food in recipient countries (Pedersen, 1996; Kirwan and McMillan, 2007). Theeffect this has on conflict is a priori unclear. On the one hand, the price change decreasesagricultural incomes, which may reduce the opportunity cost of fighting and increase conflict(Miguel, Satyanath and Sergenti, 2004). On the other hand, the decline in prices increasesthe real income of citizens that are net consumers of these foods, i.e. non-agricultural work-ers. Through the same mechanism, this may increase their opportunity cost of fighting anddecrease the incidence of civil conflict. The net impact of these two contradicting forces isambiguous and depends on the relative importance and size of both groups, as well as otherfactors determining whether the decline in agricultural incomes has a more adverse impactthan the increase in non-agricultural incomes.
Our discussion has focused on channels through which humanitarian aid can increaseconflict. It is important to recognize that there are many channels through which aid canalso decrease conflict. The most obvious channel is through increased economic development.Alternatively, if conflict arises because of resource constraints, aid could reduce conflict byreducing those constraints. Our study, which estimates the average causal effect of food aidon conflict, captures the net effect of the positive and negative effects of food aid on conflict.
2.2 The Determinants of U.S. Food Aid
International institutional arrangements for food aid were first established during the 1950s.By the 1970s, food aid represented approximately a quarter of Official Development Assis-tance (ODA). The main goal was to convert surplus food production from rich countries intoa useful resource in poor countries. The United States is the largest donor of food aid in theworld, accounting for approximately 58 percent of global food aid in 1990 and 64 percent in2000 (Barrett and Maxwell, 2005, p. 12).12
U.S. food aid flows to poor countries through several mechanisms, the most importantbeing Public Law 480 (PL 480), which was established under the Eisenhower administrationin 1954 and was later renamed the Food for Peace Program in 1962 by President John F.Kennedy. All forms of food aid are procured by the United States Department of Agricul-ture (USDA) and administered by either the USDA or the U.S. Agency for InternationalDevelopment (USAID).13
12It is followed by the European Union countries, which in 2000, together accounted for approximatelyseventeen percent of food aid flows. The other major donors are Japan (six percent), Australia (threepercent) and Canada (three percent) (Barrett and Maxwell, 2005, pp. 10-13).
13U.S. food aid falls into four broad categories: Type I, Type II, Type III and other. Type I is administeredby the USDA and consists primarily of concessional loans with some grants for commodity exports. TitlesII and III programs are administered by USAID. Title II programs provide donations to meet humanitarianand development needs. These are typically channeled through either recipient governments, NGOs ormultilateral organizations like the World Food Programme (WFP). Title III aid is sold to developing countrieswhich is then typically monetized to generate funds for development objectives. The final category includes anumber of smaller programs including Food for Progress, Section 416(b), Bill Emerson Humanitarian Trust,and International Food for Education and Child Nutrition, all administered by the USDA (Barrett and
8

Although U.S. food aid is comprised of many different types of food, wheat constitutes thelargest proportion of aid. During the period of our study, 1972-2006, 63 percent (measuredby weight) of all cereal food aid shipments were wheat, and 58 percent of all food aidshipments (cereals and non-cereals) was wheat. Given the quantitative importance of wheatas a source of U.S. food aid, our study focuses on this crop. The advantage of focusing ona specific crop, rather than examining aggregate aid, is that we are better able to identifythe relationship between production shocks and aid shipments.
Food aid is broadly determined by need since fewer developed countries are the primaryrecipients of aid. However, on a year-to-year basis, food aid is, to a large extent, determinedby U.S. production (see e.g., Nunn and Qian, 2010). The USDA accumulates wheat in highproduction years to stabilize prices for American farmers. This accumulated wheat is storedand then shipped as food aid to poor countries. Given the time lag between harvest, storage,and shipment, wheat harvested in year t, tends to arrive in recipient countries in the nextcalendar year, t+ 1. Therefore, in the empirical analysis, we characterize food aid receivedin year t as a function of U.S. production in year t− 1.
The authorization and administration of food aid programs under PL 480, which decidesthe amount of food aid shipments to countries each year, is the outcome of a complicated setof decisions made by a large number of government agencies (Ball and Johnson, 1996). Inthe House of Representatives, food aid legislation is determined by the House AgriculturalCommittee, the Foreign Affairs Committee, and the Select Committee on Hunger. TheUSDA determines what commodities are available and in what quantities. The TreasuryDepartment sets the terms of loans, the Office of Management and Budget determines iffunding is available, the Department of State assesses the political consequences, and USAIDimplements the programs in the field. Any inter-agency disagreements that may occurare mediated by the Food Aid Subcommittee of the Developing Coordinating Committee(Ruttan, 1993, p. 2). Our empirical analysis assumes that the decision making process resultsin accumulated wheat reserves being regularly drawn down through increased shipments offood aid that tend to be disproportionately greater for regular food aid recipients than forirregular recipients. We will verify this assumption with the data.
A significant proportion of the reported value of food aid consists of transportation costs.Using data from 1999-2000, Barrett and Maxwell (2005, pp. 166-168) estimate that only 47percent of the total value of food aid is the actual value of the commodity itself. The other53 percent is accounted for by transportation costs. Part of the reason for the high shippingcosts is that U.S. legislation requires that at least 75 percent of food aid be shipped on U.S.flagged cargo ships that charge inflated rates.14 Because we are interested in measuring theshipment of food aid to recipient countries exclusive of shipping costs, our analysis uses the
Maxwell, 2005, pp. 20-26). Note that our data on aid receipts only report total U.S. food aid. Therefore,our analysis does not decompose food aid into different categories.
14Barrett and Maxwell (2005, pp. 166-168) estimate that forty percent of the shipping costs is explainedby this shipping premium.
9

quantity of food aid rather than its reported value. The former does not include the costsof shipment while the latter does.
3 Empirical Strategy
Our main analysis examines the relationship between the incidence of conflict and food aidreceipts from the United States, which we characterize with the following equation:
Cirt = βF irt + XirtΓ + ϕrt + δi + εirt, (1)
where i denotes countries, r denotes geographic regions and t denotes years. The sample isa panel of 134 non-OECD countries for the years 1972-2006. The sample period is limitedby the availability of food aid and conflict data.15 The dependent variable, Cirt, is anindicator variable that equals one if there is conflict in country i and year t. The mainexplanatory variable is the amount of U.S. food aid a country receives, denoted Firt. Thespecification includes country fixed effects, δi, that control for time-invariant differencesacross countries, and region-year fixed effects, ϕrt, that control for changes over time thataffect countries within a region similarly. The region classification that we use is taken fromthe World Bank and consists of the following groups: South Asia, East Asia and Pacific,Europe and Central Asia, Latin America and Caribbean, Middle East and North Africa,and Sub-Saharan Africa. Xirt is a vector of country-year covariates that we motivate anddiscuss in detail as we present the results.
Note that following several studies on conflict, such as Miguel, Satyanath and Sergenti(2004), our main estimates do not control for a lagged dependent variable to avoid the Nickell(1981) bias. However, as we show in Section 5.4, we obtain qualitatively similar estimateswhen we control for a one-year lag of the dependent variable.
Assuming casual identification, β is the effect of an additional unit of U.S. food aid onthe incidence of conflict. A positive coefficient, β̂ > 0, indicates that, on average, an increasein the provision of U.S. food aid increases the incidence of conflict in the recipient country.
Interpreting the OLS estimates of the effect of U.S. food aid on conflict faces the dif-ficulties of reverse causality and joint determination, discussed in the introduction of thepaper. To address these difficulties, we exploit two sources of variation. First, we use timevariation in U.S. food aid shipments arising from changes in U.S. wheat production. WhenU.S. production is high, USDA price support policies generate an accumulation of reserves,which increases the amount of food aid shipped to recipient countries in the subsequentyear. We argue that this source of variation is exogenous to factors that influence conflictin recipient countries beyond U.S. food aid (conditional on the baseline controls that aredescribed below). We also exploit a second source of cross-sectional variation from a coun-
15The panel is not balanced as the number of countries in the world increase over time. The results aresimilar if we restrict the sample to a balanced panel.
10

try’s tendency to receive food aid from the U.S., measured by the fraction of years between1972 and 2006 that a country is a recipient of U.S. food aid. This is motivated by the fact,documented in Section 4, that regular aid recipients experienced greater increases in foodaid shipments following U.S. production booms.
The instrument for U.S. food aid is therefore the interaction between lagged U.S. produc-tion and the tendency for a country to receive any U.S. food aid. All of our estimates controlfor country fixed effects and region-year fixed effects. Our instrument, which is constructedby interacting an arguably exogenous term (lagged U.S. wheat production) with one thatis potentially endogenous (the likelihood of a country to be a U.S. food aid recipient), canbe interpreted as exogenous since we directly control for the main effect of the endogenousvariable (i.e., it is absorbed by the region-year fixed effects).16
An alternative strategy is to use (uninteracted) lagged U.S. wheat production to instru-ment for U.S. wheat aid. The drawback of this strategy is that we are then unable to alsocontrol for region-year fixed effects (or even year fixed effects). Given the potential impor-tance of shifting U.S. foreign policies across regions, ex ante this is a significant drawback.Ex post , we find that it makes little difference whether we instrument using only time vari-ation from U.S. wheat production (and control for country-specific linear time trends) orusing the interacted instrument (and control for region-year fixed effects). For the sake ofrigor, our main results use the interacted instrument. The estimate with the uninteractedinstrument is reported in section 5.4.
The first stage (and reduced form) of our 2SLS strategy is similar in spirit to a difference-in-differences (DD) estimation strategy, where we compare U.S. food aid receipts (and con-flict) between countries that frequently receive U.S. food aid to countries that rarely receiveU.S. food aid, in years after the U.S. experiences high levels of wheat production relativeto years following lower production levels. The main difference between our strategy and aDD strategy is that the treatment in our study is continuous, allowing us to use all of thevariation in the treatment variable for our estimates.
Our first-stage equation is as follows:
Firt = α(P t−1 ×Dir
)+ XirtΓ + ϕrt + δi + εirt, (2)
where the amount of U.S. food aid received by country i, in region r, during year t is denotedas F irt. P t−1 is the amount of U.S. wheat production from the previous year. The variableDir = 1
35
∑2006t=1972Dirt , where Dirt is an indicator variable that takes a value of one if
country i receives any U.S. food aid in year t. Thus, the amount of U.S. food aid receiptis a function of the interaction of lag U.S wheat production and the tendency for a countryto be a U.S. food aid recipient during the period of our study, as well as all of the control
16The identifying assumption is that the “endogenous” variable and the outcome of interest are jointlyindependent of the “exogenous” variable. For a more technical discussion, see section 2.3.4 of Angrist andKrueger (1999).
11

variables from the second-stage equation (1).Recall that the causal interpretation of the 2SLS estimates assumes that conditional
on the controls, the interaction between lagged U.S. wheat production and a country’stendency to receive U.S. food aid only affects conflict through the provision of U.S. food aid.In principle, the excludability of our instrument could be violated if U.S. wheat productionimpacts foreign conflict by affecting the world price of wheat or other crops that substitutefor or are complements to wheat.17
In practice, this is not a serious problem for our estimates for several reasons. First, theregion-year fixed effects in our baseline equation flexibly control for all year-to-year region-specific changes and therefore account for any global or even regions-specific price changes.For U.S. production-induced world price changes to violate the exclusion restriction, theywould need to have systematically different within-region effects on the outcome of interestin a manner that is correlated with a country’s tendency to be a U.S. food aid recipient.Nevertheless, to be cautious, our analysis addresses this possibility with additional controlsthat capture differential responses of countries to global price changes. We discuss thesecontrols in detail in Section 5.
Second, during the period of our analysis, the data suggest that U.S. price stabilizationpolicies, which include the government’s accumulation of reserves, were quite effective inbreaking the link between U.S. production shocks and price changes. Examining the rela-tionship between total production and average wheat prices measured in real U.S. dollarsannually between 1972 and 2006, one finds a negative and marginally significant relationship(the correlation coefficient is -0.30 with a p-value of 0.08).18 However, further examinationreveals that this is completely driven by two outlying observations, 1973 and 1974, two yearsthat experienced low wheat production and happened to coincide with the initial OPEC oilshock (October 1973 to March 1974) that drastically increased oil and commodity prices.Excluding 1973 and 1974, we find no correlation between U.S. wheat production and wheatprices. The correlation coefficient is -0.07 with a p-value of 0.70. The lack of a relation-ship between U.S. production and global wheat prices is also partly explained by the factthat even though the U.S. is among the largest producers of wheat globally, it by no meansdominates global supply. For example, in 2000, the U.S. was the third largest producer ofwheat, after China and India, and it accounted for 10.3% of global production.
Another concern is that the estimated relationship between food aid and conflict maybe confounded by region-specific shifts in U.S. foreign policy during the time horizon of ourstudy.19 Most of these policy shifts should be absorbed by the region-year fixed effects.
17For recent evidence on the relationship between commodity prices and civil conflict see Angrist andKugler (2008), Dube and Vargas (2009), Bruckner and Ciccone (2010) and Bazzi and Blattman (2011).
18Data on U.S. wheat prices are from the FAO PriceSTAT (1991-2006) and FAO Price Archive (1973-1990). The figures are the producer price per ton, measure in nominal U.S. dollars. The nominal prices wereconverted to real prices using the U.S. CPI.
19For example, during the 1960s and 70s, food aid was primarily used to support South Vietnam (Saylor,1977). During the Carter administration (1977-81), the focus shifted to alleviating hunger worldwide, causing
12

However, to be cautious, we also include additional controls that are described in Section 3.
4 Descriptive Statistics
We now provide an overview of the data and their sources. Our primary outcome of interest,the incidence of conflict, is constructed using data from the UCDP/PRIO Armed ConflictDataset, where a conflict is defined as the use of armed force between two parties that resultsin at least 25 battle deaths in a year. We examine the occurrence of intra-state conflicts (i.e.civil conflicts), inter-state conflicts and conflicts of all types. An intra-state conflict is definedas a conflict between a government and one or more internal opposition groups, withoutintervention from other states. An inter-state conflict is defined as a conflict occurringbetween two or more states. The measure of all conflicts includes intra- and inter-stateconflicts, and also a small number of conflicts labelled by UCDP/PRIO as “extra-systemic”or “internationalized” conflicts.20
Our measure of U.S. food aid is the amount of wheat aid, measured in thousands of metrictons (MT), shipped to a recipient country in a year from the United States. The data arefrom the Food and Agriculture Organization’s (FAO) FAOSTAT database. By measuringaid in terms of volume, we avoid the difficulty in aid valuation described in section 2.2.Data on U.S. wheat production, which is used to construct our instrument, is reported bythe U.S. Department of Agriculture (USDA). Production is also measured in thousands ofmetric tons.
Table 1 presents descriptive statistics for the main variables used in our analysis. Thereare many conflicts in our sample, which includes all non-OECD countries and all years from1972 to 2006. Approximately 23 percent of observations, which are at the country and yearlevel, experience some type of conflict. Most of these are civil conflicts, and most periodsof conflict are periods of continued conflict (i.e., there is conflict in the preceding year).Only eighteen percent of conflict incidences are new conflicts (i.e., there is no conflict in thepreceding year).
Although U.S. wheat aid is a small part of total U.S. wheat production (5.9% on averageover the sample period), it can be large from the recipient’s point of view. The average ratio
food aid to be much more broadly disseminated than in the previous decade (O’Loughlin and Grant, 1990).At the same time, political needs in the Middle East caused the administration to shift large amounts offood aid to countries in that region (Cathie, 1989). The Reagan administration (1981-89) sought to confrontthe Soviet Union in the Third World during what is often called the “Second Cold War” (Halliday, 1986).As a result, massive amounts of military assistance and food aid were shifted to Central America and theHorn of Africa (Coneth-Morgan, 1990). After the Cold War ended, food aid again became more widespread.In particular, Eastern European countries which used to be within the Soviet sphere of influence began toreceive U.S. food assistance. More recently, since 2000, countries in the Middle East have received more U.S.food assistance, presumably because of U.S. political and military involvement in that region.
20Extra-systemic conflicts are conflicts between a state and non-state group that occurs outside of thegovernment’s territory. Internationalized conflicts are conflicts between a state and a non-state group withintervention from another state. There are very few incidences of these two types of conflicts. Our estimatesare qualitatively identical if we exclude these conflicts from our measure of the incidence of any conflict.
13

of wheat aid received from the United States relative to domestic wheat production amongobservations in the sample is 2.05 and the average ratio of U.S. wheat aid to domestic cerealproduction is 0.93.
The average country in our sample receives some food aid from the United States in 35percent of the years between 1972 and 2006. Countries range from having never receivedany food aid from the United States, such as Argentina, Venezuela and South Africa, tocountries that received some food aid from the United States every year, such as Honduras,Haiti and Bangladesh.
Our instrumental variables strategy exploits the relationship between wheat productionin the U.S. and subsequent supplies of wheat aid to foreign countries. To illustrate this, wereport the bivariate relationships between wheat production, accumulated wheat reservesand wheat aid shipments in Figures 1 and 2. Figure 1 shows a strong positive relationshipover time between the total production of wheat within the United States and the stockof wheat reserves held by the government at the end of the same year (i.e., at beginningof the following year). Higher wheat production is followed by higher reserves at the endof the year. Figure 2 shows the relationship between the beginning-of-year wheat reservesand the amount of wheat shipped as food aid in that year. We observe a remarkably strongpositive relationship. When there is a greater store of reserves at the beginning of the year,more wheat is subsequently shipped as food aid. Together, Figures 1 and 2 show that moreproduction leads to greater reserves, which leads to more food aid being shipped overseas.
Note that we do not use U.S. wheat reserves to construct our instrument because reservesare potentially endogenous to expectations of future aid shipments and to U.S. foreign policy.Instead, we use U.S. wheat production, which we assume to be determined by exogenousweather conditions in wheat producing regions of the United States, and is, therefore, theexogenous component of wheat reserves that determines food aid.21
Our identification strategy recognizes that the impact of increased U.S. wheat productionon food aid shipments differs across recipient countries. Specifically, we allow for the factthat countries that are frequent U.S. food aid recipients receive a disproportionate amountof the surplus wheat following an increase in U.S. wheat production. To visualize this fact,we divide the countries in our sample into two groups according to whether the frequencywith which a country receives any U.S. food aid during the sample period is greater orless than the median value: Dir ≶ 0.29. The group of countries below the sample mediancomprises the “irregular” aid recipients and the group above the sample median comprises the“regular” recipients. For the two groups, we calculate, for each year, the average quantityof U.S. wheat aid received by each country. We then plot the relationship between thisvariable and the one-year lag of total U.S. wheat production over time. Figures 3 and 4
21We validated this assumption by directly using U.S. weather conditions as instruments for U.S. wheataid. The 2SLS results are very similar to those presented in this paper, but the first stage and reduced formcoefficients are more difficult to interpret. For brevity, they are not reported in this paper, but are availableupon request.
14

show that, over time, there is no correlation between lagged U.S. wheat production and foodaid shipments among the irregular recipients. In contrast, Figure 5 shows that there is astrong positive relationship over time for regular recipients. To compare the magnitudes ofthe slopes between the two groups, the y-axes in Figures 3 and 5 are constructed to havethe same scale. In Figure 4, we display the relationship for irregular recipients with a y-axisthat covers a smaller range than in Figure 5. The fact that we see no relationship with themagnified y-axis means that the smaller slope shown for the irregular recipients is not anartifact of the lower average quantity of aid received by infrequent recipients.
The patterns shown in Figures 3-5 are consistent with our conjecture that when the U.S.government allocates surplus wheat production across recipients, it ships a disproportionateamount of the surplus to its regular aid recipients.22 The figures also help understand thevariation driving our first stage estimates. Conceptually, the estimated coefficient of theinstrument, the interaction between lagged U.S. wheat production and a country’s tendencyto receive any U.S. food aid, P t−1 ×Dir, is similar to the difference between the slopes ofthe lines shown in Figures 3 and 4 relative to Figure 5. Thus, one can easily see that thefirst stage estimate of the effect of the instrument on U.S. wheat aid will likely be positive,i.e. α̂ from equation (2) is greater than zero.
Figures 6 and 7 illustrate the variation underlying our reduced-form estimates of theeffect of lagged wheat production on conflict for regular and irregular U.S. aid recipients.Again, there is a stark difference between the two groups. Figure 6 shows that there isno relationship between lagged U.S. wheat production and conflict among infrequent aidrecipients, whereas Figure 7 shows that the relationship is positive for regular recipients.The reduced form estimate of the effect of the instrument on conflict is the difference in theslopes shown in these two figures. Thus, Figures 6-7 show that the reduced-form estimatewill likely be positive.
Conceptually, the 2SLS estimates are the quotient of the reduced-form and first-stageestimates. Therefore, Figures 3-7 show that the instrumented effect of U.S food aid onconflict will most likely be positive. In the next section, we examine whether this is the casein a regression framework where we introduce our baseline set of controls, which also allowsus to examine the statistical precision of the estimates.23
22We also observe similar relationships when we measure aid receipts and lagged U.S. production inlogs. This is also illustrated later in the paper when we test the robustness of our estimates to alternativespecifications and measure U.S. production and wheat aid receipts in logs. This means that the samepercentage increase in lagged U.S. wheat production results in a larger percentage increase in wheat aidreceipts for regular aid recipients relative to irregular recipients.
23Note that the estimated coefficient in the regression analysis also differs from the illustrated difference inslopes in that it uses all of the variation in Dir instead of the difference between the two arbitrarily definedgroups of countries.
15

5 Results
5.1 OLS Estimates
We begin the analysis by first reporting the OLS estimates of equation (1), which are pre-sented in panel A of Table 2. Column (1) reports estimates of the correlation between U.S.food aid and the incidence of any conflict for a specification that only includes recipient-country fixed effects and region-year fixed effects. The OLS estimate of the impact of U.S.food aid on conflict is very close to zero and statistically insignificant. In the remainingcolumns of the table, we include additional covariates to control for factors that may be cor-related with conflict, food aid shipments or U.S. wheat production. Since our 2SLS strategyrelies on weather-induced year-to-year variation in U.S. production, a potential concern isthat weather conditions in the wheat growing regions of the United States may be correlatedwith weather conditions in recipient countries, which can have a direct effect on conflict.24
To address this, in column (2), we control for twelve variables that measure the averagetemperature in each month of year t and twelve variables that measure total precipitationin each month of the same year. By controlling separately for weather in different months,we account for the fact that different parts of the world have different crops with differentgrowing seasons, and hence, different sensitivities to temperature and precipitation.25
A second concern is that variation in U.S. wheat production can affect overseas con-flict through a channel other than food aid if U.S. production affects international wheatprices, which may, in turn, affect conflict. The weak times-series relationship between U.S.production and world prices discussed in Section 3, and the inclusion of region-year fixedeffects in our estimates suggest that this concern is unwarranted. Nevertheless, to be ascautious as possible, we also control for the possibility that year-to-year price changes mayhave differential effects on countries within regions. For example, a country’s sensitivityto changes in world prices may depend on the extent to which it imports, exports and/orproduces wheat or other cereals. Thus, we control for a country’s: (i) per capita net importsof cereals and (ii) per capita production of cereals for each country, each interacted withyear fixed effects.26 To address the possibility that cereal import and production can beoutcomes of aid, we do not control for time-varying measures of each variable. Instead, wecalculate country averages for each variable and control for the interaction of the country-
24This is a particular concern given that past studies have found that weather shocks can affect conflict(e.g., Miguel, Satyanath and Sergenti, 2004).
25The measures are constructed using country boundaries and monthly weather data measured acrossgrid-cells from the Terrestrial Air Temperature and Precipitation: 1900-2006 Gridded Monthly Time Series,Version 1.10. The data reports daily mean temperature (measured in degrees Celsius) and daily meanprecipitation (measured in millimeters) with 0.5 degree by 0.5 degree (approximately 56 km by 56 km)grid-cells globally for each month from 1900 to 2006. For documentation see Matsuura and Willmott (2007)and Dell, Jones and Olken (2008) for a recent application.
26Cereal production and cereal imports and exports are from the FAO’s ProdSTAT and TradeSTATdatabases. Both are measured in thousands of metric tons. Population data are from the World Bank’sWorld Development Indicators.
16

specific measure with year fixed effects.27 These controls allow the impact of global wheatprices, (which are absorbed by the year fixed effects), to differ across countries dependingon the extent to which they produce or import cereals. Estimates after including the twoadditional controls are reported in column (3).
An additional concern is that regular recipients of U.S. food aid (i.e., countries with ahigh value of Dir) may be systematically different from irregular recipients (with a low valueof Dir) in other ways that influence conflict. For example, regular recipients may also bemore likely to also receive U.S. military aid or other forms of U.S. economic aid (besides foodaid). If these differences vary systematically over time and across countries within a region,then they will not be captured by our country and region-year fixed effects. We addressthis possibility by controlling for year fixed effects interacted with: (i) the average annualamount of per capita U.S. military aid received by a country during the sample period and(ii) the average annual per capita amount of other forms of U.S. economic aid (net of foodaid).28 Column (4) reports estimates that also include these additional controls.
It is also possible that the regularity in which a country receives U.S. food aid, Dir,affects the extent to which weather shocks experience by a country affects the incidence ofconflict within the country. Specifically, it is possible that the impact of adverse weathershocks on conflict are weaker if a country regularly receives U.S. food aid. To control for thispossibility, we include the interaction of each of our twelve monthly temperature variablesand twelve monthly precipitation variables with the frequency in which a country to receivefood aid from the United States, Dir. The results with these additional controls are reportedin column (5) of the table.
The estimates of columns (2)-(5) show that the OLS correlation between U.S. food aidand the incidence of conflict are always negative in sign, small in magnitude and statisticallyinsignificant. They are unaffected by the addition of controls. In columns (6) and (7), weseparately investigate the effects on the incidence of civil and international conflicts. Wefind similarly small and statistically insignificant estimates.
5.2 First-Stage and Reduced-Form Estimates
The first-stage estimates of equation (2) are shown in panel D of Table 2. These estimatesshow that there is a strong positive correlation between the instrument and food aid ship-ments. The first stage F -statistics for the excluded instrument range from 13.8 to 20.1.Thus, it is unlikely that our estimates are biased by weak instruments. In terms of magni-tude, the estimated coefficient in column (5) suggests that for a country that receives someamount of food aid from the U.S. in every year of the sample period (i.e., Dir = 1), a 1,000
27Estimates from using contemporaneous or one-year lagged time-varying measures of production andimports, each interacted with year fixed effects are virtually identical to the estimates reported in the paper.They are available upon request.
28Aid data are from the USAID and population data are from the World Bank’s World DevelopmentIndicators. The figures are measured in 2007 U.S. dollars per person.
17

MT increase in total U.S. wheat production increases the amount of food aid received in thefollowing year by 2.44 MT. As reported in Table 1, the average value of Dir in our sample is0.35. Therefore, evaluated at the sample mean, a 1,000 MT increase in U.S. wheat produc-tion is predicted to increase U.S. food aid shipments by 0.35× 2.44 = 0.85 MT. Multiplyingthis by the number of countries, 134, gives 114.4 MT, which is an approximate measure ofthe predicted increase in total U.S. food aid shipments to the world that result from a 1,000MT increase in U.S. wheat production.
To check that our first-stage estimates are not confounded by spurious positive trends be-tween U.S. wheat production and food aid shipments to U.S. food aid recipients, we conducta falsification exercise and estimate alternative first-stage equations where the instrumentis used to predict past food aid rather than future food aid. Columns (2) and (3) of Table3 report estimates of two alternative specifications where the dependent variable is wheataid shipments one and two years before the year of the production shock. We find no re-lationship between our instrument and past U.S. food aid. The relationship is statisticallyinsignificant, negative, and very small in magnitude. These results support our identificationassumptions.
As a check that our instrument does not violate the exclusion restriction by also af-fecting recipient-country cereal production, we also examine the relationship between theinstrument and a recipient country’s per capita cereal production. The estimate, reported incolumn (4) of Table 3, shows that the instrument is uncorrelated with foreign-country cerealproduction. This finding is consistent with the existing empirical evidence, which generallyfails to find a link between food aid and production (FAO, 2006, pp. 40-41, Abdulai, Barrettand Hoddinott, 2005).
We report the reduced-form effects of our instrument on the outcome variables of interestin panel B of Table 2. For these regressions, we have multiplied the dependent variable by1,000 for presentation purposes. The impact of the instrument on the incidence of allconflicts and intra-state conflicts are positive and statistically significant at the one percentlevel. However, there is no impact on inter-state conflict. In addition, the estimates are alsovery stable across the specifications reported in columns (1)-(5).
5.3 2SLS Estimates
Table 2 panel C reports 2SLS estimates of equation (1). Like the reduced form, the 2SLSestimates remain stable as we introduce the baseline controls in columns (1)-(5). Accordingto the estimates using the full set of baseline controls reported in column (5), a 1,000 MTincrease in U.S. wheat aid increases the incidence of conflict by 0.47 percentage-points, aneffect that is statistically significant at the one percent level. Columns (6) and (7) showthat the impact on overall conflict is driven by an increase in intra-state conflicts and notby inter-state conflicts.
The finding that food aid only affects intra-state conflicts is consistent with the qualita-
18

tive accounts that emphasize the impact of food aid on fueling local conflicts between rebelgroups and the government. Given the focus of the descriptive literature and our findings,the remainder of our analysis focuses on intra-state conflicts.
To assess the magnitude of the implied effect of aid on civil conflict, consider that thesample mean of the incidence of civil conflict is 17.6 percentage-points (i.e., 0.176) and ofU.S. wheat aid is 27.6 thousand MT. Therefore, for a country at the mean level of U.S. wheataid, the estimate from column (6) implies that a ten percent increase (i.e., 2.76 thousandMT) in U.S. food aid is associated with a 1.11 percentage-point increase in the incidenceof civil conflict, which is approximately six percent of the mean. Expressed in terms ofstandard deviations, our estimates imply that a one-standard-deviation increase in food aidwill increase the incidence of civil conflict by 1.25 standard deviations.
Note that in addition to the 2SLS estimates, panel C also reports the Limited Infor-mation Maximum Likelihood (LIML) estimates and their corresponding p-values, as well asConditional Likelihood Ratio (CLR) 95% confidence intervals. The fact that the LIML esti-mates and the mid-point of the CLR intervals are similar or higher than the 2SLS estimatesis consistent with our instruments being strong and the 2SLS estimates not suffering fromweak instruments bias.29
5.4 Robustness
We now check the robustness and sensitivity of the estimated impacts of U.S. food aid oncivil conflict. First, we examine the robustness of the findings to the inclusion of additionalcontrols that may affect conflict and be correlated with food aid. These are shown inTable 4. In column (1), we first reproduce our baseline estimates, but with the smallersample size that results from the inclusion of additional control variables. The smallersample produces an estimate that is qualitatively identical to the estimate with the largersample.30 In columns (2) and (3), we control for GDP per capita, which has been foundto be an important determinant of civil conflict (Miguel, Satyanath and Sergenti, 2004).Since contemporaneous GDP is potentially endogenous to U.S. food aid, we either controlfor lagged per capita GDP (reported in column (2)) or control for a country’s average realper capita GDP over the sample period interacted with year fixed effects (in column (3)).31
In column (4), we address the possibility that a country’s level of democracy may affectboth the extent to which it receives U.S. food aid and civil conflict by controlling for theinteraction of a country’s average “polity2” score (from the Polity IV database) during thesample period and with year fixed effects.
29See Moreira (2003) for a discussion of how LIML estimates are less vulnerable to weak instruments biasrelative to 2SLS estimates and of how CLR intervals address the weak instruments problem in the case withone endogenous regressor.
30All specifications reported in Table 4 use the same sample for which data for all control variables areavailable. Allowing the number of observations to vary across the specifications yields qualitatively identicalresults.
31The results are also robust to controlling for contemporaneous per capita GDP.
19
In column (5), we consider the fact that the Cold War ended during the middle of oursample and how this can influence our estimates. The region-specific year fixed effects absorbthe impacts of the Cold War and its conclusion if the impact of these changes were similaracross countries within a region. However, there remains the concern that the events mayhave had differential effects across countries within regions. Specifically, there is concernthat Soviet Cold War allies, which tend to be irregular recipients of U.S. food aid (e.g.a low value of Dir), may have experienced a greater decline in conflict after the end ofthe Cold War. In this case, a spurious decline of U.S. wheat production in the post-ColdWar era would bias our estimates towards finding that greater U.S. production increasesconflicts among regular U.S. food aid recipients relative to irregular recipients. This seemsunlikely because the data show no decline in U.S. production after the end of the Cold War.However, to be as careful as possible, we address this concern explicitly by controlling forthe interaction of a post-Cold War indicator variable and Dir.
Finally, in column (6), we include all of the robustness controls simultaneously. Theestimated impact of U.S. food aid on civil conflict remains robust across all specifications:the coefficients for U.S. food aid remain positive, statistically significant, and roughly thesame magnitude as the baseline estimate.
Next, we check the robustness of our findings to the use of alternative estimating equa-tions. We begin by estimating an alternative specification taken from Miguel, Satyanathand Sergenti (2004). The specification is the same as equation (1), but with country-specifictime trends rather than region-year fixed effects:
Cirt = βFirt + XirtΓ + ϕiY eart + δi + εirt. (3)
The vector of controls, Xirt, now includes the time invariant country controls (i.e., averagecereal production, cereal imports, U.S. military aid and U.S. economic aid), each interactedwith a time trend rather than time-period fixed effects. Column (1) of Table 5 reproducesthe baseline estimate for comparison, while columns (2) and (3) report estimates of equation(3). Column (2) controls for a time trend that is the same for all countries, while column(3) controls for country-specific time trends. In both cases, the estimated impact of U.S.food aid on conflict remains positive, highly significant, and roughly the same magnitude asour baseline estimate.
We next check the robustness of our estimates to the use of an alternative instrument.Since the exogenous source of the variation we exploit comes from time variation in U.S.wheat production, we check that we find similar estimates using only this source of variation,i.e. using Pt−1 instead of Pt−1 × Dir as an instrument. Equation (3) allows us to do thissince it imposes a functional form on unobserved time-varying factors rather than allowingthem to vary flexibly over time. The 2SLS estimate of equation (3), using lagged U.S.wheat production (only) as an instrument, is reported in column (4) of Table 5. Thepoint estimate is positive, statistically significant and similar in magnitude to the baseline
20

estimate. This finding shows that our main results are not biased by interacting lagged U.S.wheat production with the regularity that a country receives U.S. food aid.32
In column (5), we alter our baseline equation (1) by including a one-year lag of the depen-dent variable as a control to account for the potential persistence of conflict. This estimateshould be interpreted cautiously since it suffers from the Nickell (1981) bias. Nevertheless,the fact that the estimate is robustly positive and statistically significant is reassuring.
In columns (6) and (7), we show that we obtain qualitatively identical results if we nor-malize U.S. food aid shipments by the recipient’s population or if we measure U.S. foodaid and U.S. production in natural logs rather than raw values. In both cases, the resultsremain robust, and the magnitudes of the estimated impact of food aid, assessed by com-paring standardized beta coefficients, are similar. Thus, our results are not specific to ourchoice of functional form.
5.5 Mechanisms
Thus far, our analysis has focused on estimating a causal relationship between U.S. food aidand the incidence of civil conflict. We next explore potential mechanisms underlying theseresults.
5.5.1 Onset and Duration
Our main outcome of interest, the incidence of civil conflict, reflects both the onset of newconflicts and the continuation of existing conflicts. Anecdotally, there are many accountsof food aid affecting both onset and duration. For example, it has been argued that hu-manitarian aid during the Nigeria-Biafran civil conflict (1967-1970) strengthened the rebelleader Odumegwu Ojukwu, causing the conflict to last twelve to sixteen months longer thanit otherwise would have (Polman and Waters, 2010, pp. 114-122). More recently, observershave argued that the aid given to Hutu extremists in refugee camps allowed Hutu leaders toregroup, regain resources, and launch raids and attacks into Rwanda, leading to the Firstand Second Congo Wars (Polman and Waters, 2010, pp. 13-34). To investigate the individ-ual contributions of onset and duration to our findings, we separately estimate the impact
32One may also be concerned that our measure of a country’s average tendency to receive food aid includeswhether a country received any U.S. food aid in year t, which is related to the dependent variable in thefirst stage, the amount of U.S. food aid a country receives. We obtain virtually identical results if we usealternative instruments where we interact lagged U.S. production with different lagged moving averages of thetendency to receive U.S. food aid, or with the average tendency of receiving U.S. food aid for all years exceptfor year t. In addition, we have also checked that our estimates are robust to using the interaction of thetendency for a country to receive U.S. food aid and the lag of predicted U.S. wheat production, constructedusing county level data on U.S. wheat production and grid-cell level data on monthly temperature andprecipitation. Alternatively, we also instrumented for U.S. wheat aid directly with U.S. weather shocks.Since, a priori, the probability that U.S. producers base production decisions on factors that affect conflictin poor aid-recipient countries is very low, it is not surprising that estimates when using the instrumentsbased on predicted production are very similar to our baseline estimates. For brevity, we do not describethose estimates in detail or report them in the paper. They are available upon request.
21

of food aid on the two outcomes.To examine the impact on civil conflict onset, we rely on specifications from existing
studies that examine the determinants of the onset of civil conflict, defined as the first yearof a conflict episode or, equivalently, a conflict that occurs in a year following a year withno conflict. We examine the determinants of the onset of civil conflict by first using themethodology from Collier and Hoeffler (2004), which removes observations that are periodsof continued conflict. Therefore, the sample only includes periods of no conflict and periodsof conflict onset.33 The 2SLS estimate of the impact of U.S. food aid on the onset of civilconflict is reported in column (1) of Table 6. We find a positive, but statistically insignificantimpact of U.S. food aid on civil conflict onset.
Column (2) reports estimates using an alternative specification from Fearon and Laitin(2003). Rather than excluding periods of continued conflict from the sample, the authorsinclude all observations and control for the incidence of civil conflict in the previous period,which captures the mechanical relationship between the onset of civil conflict and the pres-ence of conflict in the previous period. This alternative estimation strategy generates a pointestimate that is nearly identical to the estimate reported in column (1), but is much moreprecisely estimated and statistically significant. We interpret the findings from columns (1)and (2) as evidence that U.S. food aid has a positive effect on the onset of civil conflict.
Next, we examine the effect of U.S. food aid on the duration of civil conflict. This followsexisting studies examining the duration of civil conflict, including Collier et al. (2004) andFearon (2004). The event of interest is the end of civil conflict.34 Let t index time, i indexcivil conflicts and Ti ≥ 0 denote the length, in years, of the civil conflict (i.e., the duration).The sample includes all country-years that are “at risk” for transition out of conflict, i.e. allof the observations for which there was a civil conflict in the previous period. The estimationuses the discrete hazard hit = Pr(Ti = t | Ti ≥ t), where it is assumed that hit follows alogistic distribution.35
Estimates of the impact of U.S. food aid on a country’s transition out of civil conflictare reported in columns (3)-(5) of Table 6. Column (3) reports estimates only controllingfor the duration of the conflict up until period t−1. We allow the impact of duration on thehazard rate to vary in a flexible manner by including a third degree polynomial of duration.In column (4), we also control for the time-invariant country characteristics from our set of
33Our specification includes all baseline control variables.34In this context, what one commonly refers to as “survival” in hazard models is continued conflict.35In practice, the estimation relies on the insight from Allison (1984) and Jenkins (1995) regarding the
equality of the log likelihood function of discrete time hazard models and the standard likelihood functionfor a binary regression model in which yit (an indicator that equals one if the country transitions out ofconflict at time t) is the dependent variable. The data are structured so that there is an observation for eachperiod that the country is at risk of transitioning out of the current state. The insight that the logit of thediscrete-time hazard model can be estimated using a logistic regression model is particularly useful since ourindependent variable of interest, U.S. food aid, is instrumented with the interaction term using lagged U.S.wheat production. We are thus able to estimate the impact of U.S. food aid on the hazard rate by applyinga control function approach that uses the two-step approach from Rivers and Vuong (1988). The two-stepapproach is implemented by controlling for the first-stage residuals in the second-stage logit regression.
22

baseline control variables: a country’s average receipt of U.S. military aid over the period,its receipt of U.S. economic aid net of food aid, its average import of cereals and its averageproduction of cereals. Column (5) reports estimates from a specification that also controlsfor region fixed effects. The estimates show that U.S. food aid increases the duration of civilconflict, i.e. it reduces the probability that a civil conflict ends. In all three specifications,the coefficients for U.S. food aid are significant at the one-percent level. The magnitude ofthe estimates (marginal effects evaluated at means) suggests that a 1,000 MT increase infood aid shipments decreases the probability of the civil conflict ending in a year by between0.48 and 0.61 percentage-points, a large effect given that the sample mean for the probabilitythat a civil conflict ends is 0.188.
Overall, the results reported in Table 6 show that food aid increases both the onsetand the duration of civil conflicts. These findings are consistent with accounts of food aidproviding resources that can be used to both start civil conflicts and to prolong existingconflicts.36
5.5.2 The Scale of Conflict
Descriptive accounts of humanitarian aid being an important source of funds for small-scalerebel groups and “refugee warriors” suggest that aid may have a particularly large impacton the incidence of smaller-scale conflicts. Our main conflict measures, which define conflictincidence to be the presence of an armed conflict that causes 25 or more combat deathswithin a year, include both small and large conflicts. To investigate the extent to which ourmain results are driven by small-scale conflict, we compare our main estimates to estimateswhen using data from the Correlates of War (COW) Database, which only includes conflictsthat incur a higher threshold of 1,000 or more combat-related deaths in a year.
For comparison, columns (1)-(3) of Table 7 restate the baseline estimates for all con-flicts, intra-state conflicts and inter-state conflicts using the UDCP/PRIO. Columns (4)-(6)presents estimates of the same specifications, but using the higher threshold COW data. Wecontinue to find a positive impact of food aid on all conflicts and intra-state conflicts, andno impact on interstate conflicts. The magnitudes of the positive impacts of food aid on allconflicts and intra-state conflicts are significantly smaller than the baseline estimates usingthe lower conflict threshold UCDP/PRIO data.
36We have also examined the lag structure of our estimates. Our baseline specification estimates theeffect of contemporaneous U.S. food aid on conflict. However, wheat aid in the previous years may alsoaffect conflict. This could occur if food aid is stored and then fought over by the opposing factions within acountry in the following year. Alternatively, food aid expropriated by rebel groups in a year may strengthenthem and increase their ability to fight in the following year. We have investigated this by estimatingthe effect of one-year and two-year lagged U.S. food aid on the incidence of civil conflict. We find that,conditioning on food aid in the current period, food aid from previous years has no effect on conflict. Thecoefficients are small in magnitude and are statistically insignificant. This suggests that the impact of foodaid on conflict is immediate, a result that is consistent with accounts of food aid generating resources formilitias that allow them to continue fighting. For the sake of brevity, these results are not reported in thepaper. They are available upon request.
23

Part of the difference between the coefficients in columns (1)-(2) versus (4)-(5) is amechanical result of the fact that larger conflicts are less prevalent than small conflicts. (Seethe descriptive statistics in Table 1.) However, even if we compare the estimated coefficientsto the sample means, the impact of food aid on conflict continues to be smaller for larger-scale conflicts. Similarly, if one also compares standardized beta coefficients, which arereported in Table 7 below the estimated coefficients, the same conclusion is reached. Forexample, while a one-standard-deviation increase in U.S. food aid increases the incidenceof small-scale intra-state conflicts by 1.25 standard deviations (column 2), it increases theincidence of large-scale conflicts by only 0.74 standard deviations (column 5). Overall, thesefindings are consistent with descriptive accounts that emphasize the theft of humanitarianaid by small-scale militants and other similar armed groups.
5.5.3 Crowding-Out of Other Aid
Our interpretation of the main results is that U.S. food aid has a direct causal impact onconflict in recipient countries. However, a possible alternative explanation is that food aidaffects conflict indirectly by crowding out other types of aid. For example, other donorcountries or multilateral agencies may respond to an increase in U.S. food aid by reducingtheir own aid provisions. If these other forms of aid reduce conflict, then this form of “crowd-out” can explain why U.S. food aid increases conflict. Similarly, if the reduction in food aidis large enough, then an increase in U.S. food aid could actually cause total foreign aid todecline. Our results could, again, be explained by aid crowd-out if total foreign aid reducesconflict. It is important to keep in mind that this does not undermine the validity of ourestimates of the causal effect of U.S. food aid on conflict, but the mechanism of crowd-outis very different from the ones that motivated our study, and they have very different policyimplications.
We explore this important alternative explanation by re-estimating equation (1) butwith other forms of aid provision as dependent variables. We first examine the effect ofU.S. wheat aid on total wheat aid provision (from all countries). If U.S. aid is crowding outwheat aid from other countries, then we would expect to find that a one-unit (i.e., 1,000 MT)increase in U.S. wheat aid increases total food aid by less than 1,000 MT. Table 8 column (1)reports this point estimate, which is 1.13 and statistically significant. The point estimate,which is very close to one, suggests that U.S. aid does not crowd out the provision of wheataid from other countries. Column (2) estimates the same regression but with cereals aidfrom all countries, rather than wheat aid as the dependent variable. The point estimateagain shows that U.S. wheat aid does not crowd out food aid from other countries. Thefinding that there is no crowding out of either wheat or cereals aid is also confirmed by theestimates reported in columns (3) and (4), which show that U.S. wheat aid has no impacton the provision of wheat aid and cereal aid from non-U.S. donor countries.
We next turn to the possibility that U.S. food aid crowds out the provision of other
24

types of aid by the U.S., such as economic aid or military aid. Columns (5) and (6) reportestimates of the effect of U.S. wheat aid on U.S. military aid and U.S. economic aid (exclusiveof food aid). We find that food aid has no effect on these other types of aid and that thereis no evidence for this form of crowd out. To help assess the magnitude of coefficients, themean of each dependent variable is reported in the first row of the table. The estimatedcoefficients are small in magnitude (relative to the means), and statistically insignificant.Columns (7) and (8) test whether U.S. food aid crowds out total foreign aid provision byother countries. The columns report estimates of the impact of U.S. food aid on two measuresof total net Official Development Assistance (ODA) from non-U.S. donors, both taken fromthe Roodman’s (2007) Net Aid Transfers Dataset. The measure of ODA used in column(7) includes loans and grants net of principal and interest payment on existing loans. Themeasure used in column (8) is also net of cancelled “Other Official Finance” (OOF) loans,which are typically included as ODA (see Roodman, 2007 for further details). We find noevidence of aid crowd-out using either measure. The coefficients in both specifications aresmall in magnitude and not statistically different from zero.
From these results, we conclude that our main results are not driven by the crowdingout of other types of food aid or foreign aid.
5.5.4 Crowding-Out of Domestic Production
We next turn to the question of whether U.S. food aid crowds out domestic production,which could result in lower incomes and thereby increase conflict. A priori, we find itunlikely that our estimates are explained by this mechanism because our estimates areidentified from the short-term impacts of year-to-year variation in U.S. food aid provision.For changes in domestic production to explain our findings, production decisions would needto be made in anticipation of U.S. food aid shipments. This seems unlikely to be true inpractice since planting decisions are made months before the crops are harvested. Thus,it seems unlikely that rural farmers in poor countries, often far from the national capital,forecast changes in food aid receipts in the following year and then make plans based onthese forecasts. Nevertheless, to be cautious, we investigate this possibility in columns(9) and (10) of Table 8, where we report estimates of the impact of U.S. food aid on therecipient’s wheat and cereal production. The estimated impact is small in magnitude andstatistically insignificant. There is no evidence that U.S. wheat aid crowds out recipientcountries’ domestic food production.
5.5.5 Heterogenous Treatment Effects
Our findings have shown that food aid, on average, increases the incidence, onset and du-ration of civil conflict. We now explore whether there are certain environments in whichfood aid does not have such adverse effects by testing for heterogeneous impacts of food aid.
25

The factors we examine are motivated by descriptive accounts and existing studies on aidor conflict.
We begin by examining a country’s level of overall economic development, measured byreal GDP per capita. It is possible that because more-developed countries are generallymore stable and less prone to conflict, food aid has a weaker impact on conflict within thisgroup. We calculate each country’s average annual real per capita income between 1972 and2006, construct an indicator variable for countries below the median level of average income,and interact this with the measure of U.S. food aid, Firt. This allows the impact of food aidon conflict to differ for countries below and above the median value of average per capitaincome. This second stage equation can be written as the following.
Cirt = β (F irt × Iir) + XirtΓ + ϕrt + δi + εirt, (4)
where Iir is an indicator variable that equals one if country i of region r has an averagevalue of real per capita income between 1972 and 2006 that is below the median value in thesample. The other variables are the same as in equation (1). Since the direct effect of theindicator variable Iir is absorbed by the country fixed effects, the only difference betweenequations (1) and (4) is the interaction term Firt × Iir.
To establish causality, the main effect of U.S. wheat aid, Firt, and the interaction term,Firt× Iir, are instrumented with the original instrument, Pt−1× D̄ir, and the interaction ofthe original instrument with the indicator variable, Pt−1 × D̄ir × Iir. The controls includethe baseline covariates and the full set of double interaction terms. The first stage equationfor Firt is:
Firt = π1(P t−1 ×Dir × Iir
)+π2
(P t−1 ×Dir
)+π3 (P t−1 × Iir)+XirtΓ+ϕrt+δi+εirt. (5)
Note that the direct effects of Dir and Iir, as well as their double interaction, Dir × Iir, areabsorbed by the country fixed effects. As before, the direct effect of Pt−1 is absorbed bythe region-year fixed effects. The first-stage equation for the interaction term is identical toequation (5) but with Firt × Iir as the dependent variable.
The instrumented second-stage results reported in column (2) of Table 9 show that theimpact of food aid on conflict is statistically similar for low and high income countries. Theestimated coefficient for the interaction term is negative but statistically insignificant.37
We next examine political institutions, dividing countries in our sample according towhether they have an average polity2 score over the period that is above or below thesample median.38 This addresses the hypothesis that more democratic governments (i.e.,those with a high polity2 score) are more accountable to citizens and therefore more likely
37We do not report the first stage estimates for brevity. They are available upon request.38The polity2 measure is taken from the Polity IV Database.
26

to distribute aid in a way that does not promote conflict.39 For similar reasons, we alsodistinguish between countries with civilian and non-civilian governments, again using themedian of the average measure over the sample period as a threshold.40 The results reportedin columns (3) and (4) show that the effect of U.S. food aid is statistically similar acrosscountries with different levels of democratization and countries with civilian vs. militarygovernments.
Given that internal conflict is often tied to within-country ethnic differences, we examinewhether the impact of food aid differs depending on the ethnic diversity and ethnic polar-ization of a country. We create interaction terms for countries with below median-levels ofethnic diversity and below-median levels of ethnic polarization.41 The estimates reported incolumns (5) and (6) show that food aid has similar impacts across countries with differentlevels of ethnic polarization, but has a weaker impact on conflicts in countries with lowerlevels of ethnic diversity The latter estimate is negative in sign and large in magnitude,although it is only statistically significant at the 15% level.
Next, we investigate the plausibility of first-hand accounts that armed factions stealaid during transit, often by setting up road blocks, and then use the appropriated aid tofeed soldiers and fund the fighting. To do this, we hypothesize that road-blocks erectedby armed factions, as well as other similar forms of theft, are more successful in countrieswhere transportation networks are less developed. The effectiveness of roadblocks for armedfactions decreases with the number of routes between the original location of aid and thedestination where aid is to be delivered. This is based on the logic that it is easier for aiddeliveries to circumvent road blocks if there are more alternative routes. Our measure oftransportation networks is the annual average kilometers of roads per capita over the sampleperiod.42 The estimates reported in column (7) show that food aid has a smaller impact onconflict in countries with a more developed road network. The estimated interaction effectis negative and large in magnitude, although it is only statistically significant at the 15%level.
The last factor we examine is not a country characteristic, but a change in the globalpolitical environment that occurred during the sample period. Motivated by studies thatfind evidence of differing motives behind U.S. aid provision during the Cold War, relative
39See Besley and Persson (2008) for a theoretical discussion.40The classification of whether a country has a civilian government is taken from the “RegimeType” variable
from the Banks’ Cross-National Time-Series Data Archive, which reports if a government is wholly civilian,mixed, military, or other. We create a dummy variable that equals one if the government is entirely civilianand then calculate the average of this variable for each country over time. Note that the Banks dataset isavailable up to 1999. Thus, we assume that the country mean for 1972-1999 is similar to the country meanfor the period of our study, 1972-2006.
41The measure of ethnic diversity is from Alesina et al. (2003) and the measure of polarization is fromMontalvo and Reynal-Querol (2005). These measures are only available for one year for each country andthe year varies. See Alesina et al. (2003) and Montalvo and Reynal-Querol (2005) for detailed discussions.
42The measure is constructed as the average for the years 1990-2003 using data reported by the WorldDevelopment Indicators. Our estimates assume that the average for 1990-2003 is broadly similar to theaverage for the period of our study, 1972-2006.
27

to after the Cold War (e.g., Meernik, Krueger and Poe, 1998), we examine whether foodaid affected conflict differently during the Cold War. The results, reported in column (8),provide no evidence of a differential impact during the Cold War. The estimated coefficientfor the Cold War interaction is small in magnitude and statistically insignificant.
Finally, in column (9), we include all interaction terms in the same regression, whichaddresses the fact that many of the factors we have examined may be correlated. The esti-mates confirm the previous findings that food aid has similar effects on conflict on countrieswith different levels of: income, democratization, civilian rule, ethnic polarization; and thatit has similar effects during the Cold War and post-Cold War periods.
The differential effect for low ethnic diversity countries remains statistically significant,although its magnitude is half as large as its estimated magnitude without the other inter-actions also included (reported in column (6)). The estimated interaction effect for roaddensity remains robust. The magnitude of the coefficient is similar to the magnitude re-ported in column (7), and it is now statistically significant at the 1% level. The sum of thecoefficients for U.S. food aid and the interaction of U.S. food aid and the high road densityindicator variable (reported at the bottom of Table 9) is small and close to zero, whichimplies that U.S. food aid has little effect on conflict in countries with high road density andour main results are primarily driven by countries with low road density. This is consistentwith the observation that food aid if often stolen in transit and used by armed factions tofeed troops and finance rebel activities.
6 Conclusion
Humanitarian aid is one of the key international policy tools for helping needy populationsin times of crises or for aiding those suffering from endemic poverty. In recent years, human-itarian aid and, in particular, its main component, food aid, have increasingly come undercriticism. Observers argue that humanitarian aid not only fails to achieve its main goal ofimproving the well-being of the target population, but it can actually harm the intendedbeneficiaries by promoting conflict. This controversial topic has already sparked much dis-cussion amongst aid watchers. However, to undertake systematic reform of food aid policy,one requires rigorous empirical evidence on the average effect of existing policies.
Our findings show that the concerns of critics are very real. By exploiting year-to-yearvariation in wheat production in the United States, along with cross-country variation in acountry’s propensity to receive food aid from the United States, we show that, on average,food aid promotes civil conflict. An increase in U.S. food aid increases the incidence, onsetand duration of armed civil conflicts in recipient countries. We show that our results arenot a result of U.S. food aid crowding out aid from other countries. We also find that foodaid has a more adverse effect on small-scale armed conflicts and in countries with a lessdeveloped transportation network. These findings support qualitative accounts of food aid
28

either being stolen during transport or being taken from target populations by small armedgroups that use the resources to fund conflict.
Our study is a small first step towards the larger goal of understanding the tradeoffsthat exist for food aid and humanitarian aid policies. Ideally, one would like to examinea broad range of outcomes that capture both the potential benefits as well as the costs offood aid. One set of important outcomes to study are those related to health, such as infantand child mortality. Unfortunately, given existing data constraints, we are unable to do thisusing our empirical strategy, which relies on year-to-year variation across a broad sample ofdeveloping countries. For example, much of the the data currently reported by the WorldHealth Organization or the World Bank are constructed by interpolating between years forwhich actual data are available. The real variation in the data generally is not year-to-yearand consequently it cannot be used with our empirical strategy.43
One would also like to better understand the specific mechanisms that cause the adverseimpact of food aid identified here. We attempt to do this to the extent possible given theavailable data. But our measures are admittedly coarse, with the variation remaining atthe country-year level. We believe that collecting finer-grained (e.g., subnational or project-level) data is essential for future research on understanding the effects of food aid.44
In interpreting our results, it is important to note that we only study the effects ofone particular type of aid, food aid. This form of aid is very different from other types offoreign aid in that it (and many other forms of humanitarian aid) is delivered in-kind and istherefore particularly vulnerable to being appropriated by armed factions during transport.In contrast, much of foreign aid is transferred as money from the donor government to therecipient government. Whether such types of foreign aid affect conflict is beyond the scopeof our study and our results should not be extrapolated as evidence of the impacts of foreignaid in general.
43In the future, one may be able to apply our strategy to a panel of health outcomes constructed fromthe Demographic Health Surveys. The surveys began too recently to allow the construction of a sufficientlylong panel for analysis today. Most of the Demographic Health Surveys (DHS) began in the mid-1990s.These surveys record the completed fertility history of women age 15-49. Using this data for our analysisfaces two challenges. First, there are very few births from the 1970s and 80s, which means that currentlythe resulting panel is too short for our statistical analysis. This can be addressed in the future when theconstructed panels will naturally be longer, assuming that U.S. food aid policy does not change and ourempirical strategy remains valid at that time. Second, the DHS samples are conditional on women beingalive during the year of the survey. Since conflict causes mortality, this raises the concern that DHS samplesare affected by the incidence of past conflict.
44Two examples of recent studies taking a more micro-oriented approach (although not examining foodaid per se) are Crost, Felter and Johnston (2011) and Dube and Naidu (2010).
29

References
Abdulai, Awudu, Christopher B. Barrett, and John Hoddinott. 2005. “Does FoodAid Really Have Disincentive Effects? New Evidence From Sub-Saharan Africa.” WorldDevelopment, 30(10): 1689–1704.
Ahmed, Faisal. 2010. “The Repression Effect.” Mimeo, University of Chicago.
Alberto Alesina, Reza Baqir, and William Easterly. 1999. “Public Goods and EthnicDivisions.” Quarterly Journal of Economics, 114(4): 1243–1284.
Alesina, Alberto, and David Dollar. 2000. “Who Gives Aid to Whom and Why?”Journal of Economic Growth, 5(1): 33–63.
Alesina, Alberto, Arnaud Devleeschauwer, William Easterly, Sergio Kurlat, andRomain Wacziarg. 2003. “Fractionalization.” Journal of Economic Growth, 8(2): 155–194.
Allison, Paul D. 1984. Event History Analysis: Regression for Longitudinal Event Data.London:Sage Publications.
Anderson, Mary B. 1999. Do No Harm: How Aid Can Support Peace–or War. Boulder,CO:Lynne Rienner Publishers.
Angrist, Joshua D., and Adriana D. Kugler. 2008. “Rural Windfall or a New Re-source Curse? Coca, Income, and Civil Conflict in Colombia.” Review of Economics andStatistics, 90(2): 191–215.
Angrist, Joshua D., and Alan B. Krueger. 1999. “Empirical Strategies in Labor Eco-nomics.” In Handbook of Labor Economics. , ed. Orley Ashenfelter and David Card, 1277–1366. Elsevier.
Ball, Richard, and Christopher Johnson. 1996. “Political, Economic, and HumanitarianMotivations for PL 480 Food Aid: Evidence from Africa.” Economic Development andCultural Change, 44(4): 515–537.
Barrett, Christopher B., and Daniel G. Maxwell. 2005. Food Aid After Fifty Years:Recasting Its Role. London:Routledge.
Bauer, Peter T. 1975. “N.H. Stern on Substance and Method in Development Economics.”Journal of Development Economics, 2(4): 387–405.
Bazzi, Samuel, and Christopher Blattman. 2011. “Economic Shocks and Conflict: The(Absence of?) Evidence from Commodity Prices.” Mimeo, Yale University.
30

Besley, Timothy J., and Torsten Persson. 2008. “The Incidence of Civil War: Theoryand Evidence.” NBER Working Paper 14585.
Besley, Timothy J., and Torsten Persson. 2011. “The Logic of Political Violence.”Quarterly Journal of Economics, 126(3): 1411–1445.
Blattman, Christopher, and Edward Miguel. 2010. “Civil War.” Journal of EconomicLiterature, 48(1): 3–57.
Boone, Peter. 1996. “Politics and the Effectiveness of Foreign Aid.” European EconomicReview, 40(2): 289–329.
Bruckner, Markus, and Antonio Ciccone. 2010. “International Commodity Prices,Growth and the Outbreak of Civil War in Sub-Saharan Africa.” Economic Journal,120(544): 519–534.
Burnside, Craig, and David Dollar. 2000. “Aid, Policies, and Growth.” American Eco-nomic Review, 90(4): 847–868.
Cathie, John. 1989. Food Aid and lndustrialization: The Development of the South KoreanEconomy. Hong Kong:Avebury.
Collier, Paul, and Anke Hoeffler. 2002. “Aid, Policy and Peace: Reducing the Risk ofCivil Conflict.” Defence and Peace Economics, 13(6): 435–450.
Collier, Paul, and Anke Hoeffler. 2004. “Greed and Grievance in Civil War.” OxfordEconomic Papers, 56(4): 563–95.
Collier, Paul, , Anke Hoeffler, and Mans Soderbom. 2004. “On the Duration of CivilWar.” Journal of Peace Research, 41(3): 253–273.
Coneth-Morgan, Earl. 1990. American Foreign Aid and Global Power Projection: TheGeopolitics of Resource Allocation. Brookfield, VT:Gower.
Crost, Benjamin, Joseph Felter, and Patrick B. Johnston. 2011. “Aid Under Fire:Development Projects and Civil Conflict.” Mimeo, UC Berkeley.
Dell, Melissa, Benjamin F. Jones, and Benjamin A. Olken. 2008. “Climate Shocksand Economic Growth: Evidence from the Last Half Century.” Mimeo, MIT.
de Ree, Joppe, and Eleonora Nillesen. 2009. “Aiding Violence or Peace? The Impact ofForeign Aid on the Risk of Civil Conflict in Sub-Saharan Africa.” Journal of DevelopmentEconomics, 88(2): 301–313.
de Waal, Alex. 1997. Famine Crimes: Politics and the Disaster Relief Industry in Africa.Bloomington:Indiana University Press.
31

Dube, Oeindrila, and Suresh Naidu. 2010. “Bases, Bullets, and Ballots: The Effectof U.S. Military Aid on Political Conflict in Colombia.” Center for Global DevelopmentWorking Paper 197.
Dube, Oendrila, and Juan F. Vargas. 2009. “Commodity Price Shocks and Civil Con-flict: Evidence from Colombia.” Mimeo, NYU.
Easterly, William. 2003. “Can Foreign Aid Buy Growth?” Journal of Economic Perspec-tives, 17(3): 23–48.
Easterly, William, Ross Levine, and David Roodman. 2004. “New Data, New Doubts:A Comment on Burnside and Dollar’s ‘Aid, Policies, and Growth’ (2000).” AmericanEconomic Review, 94(3): 774–780.
FAO. 2006. “The State of Food and Agriculture: Food Aid for Food Security.” FAO Agri-cultural Series No. 37.
Fearon, James D. 2004. “Why Do Some Civil Wars Last so Much Longer than Others?”Journal of Peace Research, 41(3): 275–301.
Fearon, James D., and David D. Laitin. 2003. “Ethnicity, Insurgency, and Civil War.”American Political Science Review, 97(1): 75–90.
Garfinkel, Michelle R. 1990. “Arming as a Strategic Investment in a Cooperative Equi-librium.” American Economic Review, 80(1): 50–68.
Grossman, Herschel I. 1991. “A General Equilibrium Model of Insurrection.” AmericanEconomic Review, 81(4): 912–921.
Grossman, Herschel I. 1999. “Kleptocracy and Revolutions.” Oxford Economic Papers,51(2): 267–283.
Guidolin, Massimo, and Eliana La Ferrara. 2007. “Diamonds Are Forever, Wars AreNot: Is Conflict Bad for Private Firms?” American Economic Review, 97(5): 1978–1993.
Haavelmo, Trygve. 1954. A Study in the Theory of Economic Evolution.Amsterdam:North-Holland.
Halliday, Fred. 1986. The Making of the Second Cold War. London:Verso.
Hirschleifer, Jack. 1989. “Conflict and Rent-Seeking Success Functions: Ratio vs. Differ-ence Models of Relative Success.” Public Choice, 63(2): 101–112.
Jenkins, Stephen P. 1995. “Easy Estimation Methods for Discrete-Time Duration Model.”Oxford Bulletin of Economics and Statistics, 57(1): 129–138.
32

Kirwan, Barret, and Margaret McMillan. 2007. “Food Aid and Poverty.” AmericanJournal of Agricultural Economics, 89(5): 1152–1160.
Kodras, Janet. 1993. “Shifting Global Strategies of U.S. Foreign Food Aid, 1955–1990.”Political Geography, 12(3): 232–246.
Kuziemko, Ilyana, and Eric Werker. 2006. “How Much is a Seat on the Security CouncilWorth? Foreign Aid and Bribery at the United Nations.” Journal of Political Economy,114(5): 905–930.
Lavy, Victor. 1992. “Alleviating Transitory Food Crises in Sub-Saharan Africa: Interna-tional Altruism and Trade.” World Bank Economic Review, 6(1): 125–138.
LeRiche, Matthew. 2004. “Unintended Alliance: The Co-option of Humanitarian Aid inConflicts.” Parameters, 34(2): 109–12.
Levinsohn, James, and Margaret McMillan. 2007. “Does Food Aid Harm the Poor?Household Evidence from Ethiopia.” In Globalization and Poverty. , ed. Anne Harrison,561–598. University of Chicago Press.
Lischer, Sarah Kenyon. 2005. Dangerous Sanctuaries: Refugee Camps, Civil War, andthe Dilemmas of Humanitarian Aid. Ithaca, NY:Cornell University Press.
Martin, Philippe, Thierry Mayer, and Mathias Thoenig. 2008. “Make Trade NotWar?” Review of Economic Studies, 75(3): 865–900.
Matsuura, Kenji, and Cort Willmott. 2007. “Terrestrial Air Temperature and Precip-itation: 1900-2006 Gridded Monthly Time Series, Version 1.01.” University of Delaware.http://climate.geog.udel.edu/climate/.
Meernik, James, Eric L. Krueger, and Steven C. Poe. 1998. “Testing Models ofU.S. Foreign Policy: Foreign Aid During and After the Cold War.” Journal of Politics,60(1): 63–85.
Miguel, Edward, Shanker Satyanath, and Ernest Sergenti. 2004. “Economic Shocksand Civil Conflict: An Instrumental Variables Approach.” Journal of Political Economy,112(4): 725–753.
Montalvo, José G., and Marta Reynal-Querol. 2005. “Ethnic Polarization, PotentialConflict, and Civil Wars.” American Economic Review, 95(3): 796–816.
Moreira, Marcelo J. 2003. “A Conditional Likelihood Ratio Test for Structural Models.”Econometrica, 71(4): 1027–1048.
Nickell, Stephen J. 1981. “Biases in Dynamic Models with Fixed Effects.” Econometrica,49(6): 1417–26.
33

Nunn, Nathan, and Nancy Qian. 2010. “The Determinants of Food Aid Provisions toAfrica and the Developing World.” NBER Working Paper 16610.
O’Loughlin, John, and Richard Grant. 1990. “The Political Geography of PresidentialSpeeches, 1946-87.” Annals of the Association of American Geographers, 80(4): 504–530.
Pedersen, Karl. 1996. “Aid, Investment and Incentives.” Scandinavian Journal of Eco-nomics, 98(3): 423–437.
Perlez, Jane. 1992. “Somalia Aid Workers Split on Troops.” New York Times, A14.
Pillai, Nita. 2000. “Food Aid for Development? A Review of the Evidence.” In Food Aidand Human Security. , ed. Edward Clay and Olav Schram Stokke, 196–220. London:FrankCass.
Polman, Linda, and Liz Waters. 2010. The Crisis Caravan: What’s Wrong with Hu-manitarian Aid? New York:Henry Holt and Co.
Quisumbing, Agnes R. 2003. “Food Aid and Child Nutrition in Rural Ethiopia.” IFPRIFCND Discussion Paper 158.
Rivers, Douglas, and Quang H. Vuong. 1988. “Limited Information Estimators andExogeneity Tests for Simultaneous Probit Models.” Journal of Econometrics, 39(3): 347–366.
Roodman, David. 2007. “An Index of Donor Performance.” Center for Global DevelopmentWorking Paper No. 67.
Ross, Michael L. 2004. “What Do We Know about Natural Resources and Civil War?”Journal of Peace Research, 41(3): 337–456.
Ruttan, Vernon W. 1993. “The Politics of U.S. Food Aid Policy: A Historical Review.”In Why Food Aid?. , ed. Vernon W. Ruttan, 1–70. Baltimore:Johns Hopkins UniversityPress.
Sachs, Jeffrey. 2006. The End of Poverty: Economic Possibilities of Our Time. NewYork:Penguin Books.
Saylor, Thomas Reese. 1977. “A New Legislative Mandate for American Food Aid.” InFood Policy: The Responsibility of the United States for the Life and Death Choice. , ed.Peter G. Brown and Henry Shue, 199–211. New York:The Free Press.
Skaperdas, Stergios. 1992. “Cooperation, Conflict, and Power in the Absence of PropertyRights.” American Economic Review, 82(4): 720–739.
Stern, Nicholas H. 1974. “Professor Bauer on Development : A Review Article.” Journalof Development Economics, 1(3): 191–211.
34

Svensson, J. 1999. “Aid, Growth and Democracy.” Economics and Politics, 11(3): 275–297.
Terry, Fiona. 2002. Condemned to Repeat: The Paradox of Humanitarian Action. Ithaca,NY:Cornell University Press.
Thurow, Roger, and Scott Kilman. 2009. Enough: Why the World’s Poorest Starve inan Age of Plenty. New York:Public Affairs.
Uvin, Peter. 1998. Aiding Violence: The Development Enterprise in Rwanda. West Hart-ford, CT:Kumarian Press.
Werker, Eric, Faisal Ahmed, and Charles Cohen. 2009. “How is Foreign Aid Spent?Evidence from a Natural Experiment.” American Economic Journal: Macroeconomics,1(2): 225–244.
Yamano, Takashi, Harold Alderman, and Luc Christiaensen. 2005. “Child Growth,Shocks, and Food Aid in Rural Ethiopia.” American Journal of Agricultural Economics,2(5): 273–288.
Yanagizawa-Drott, David. 2010. “Propaganda and Conflict: Theory and Evidence fromthe Rwandan Genocide.” Working Paper, Harvard University.
35
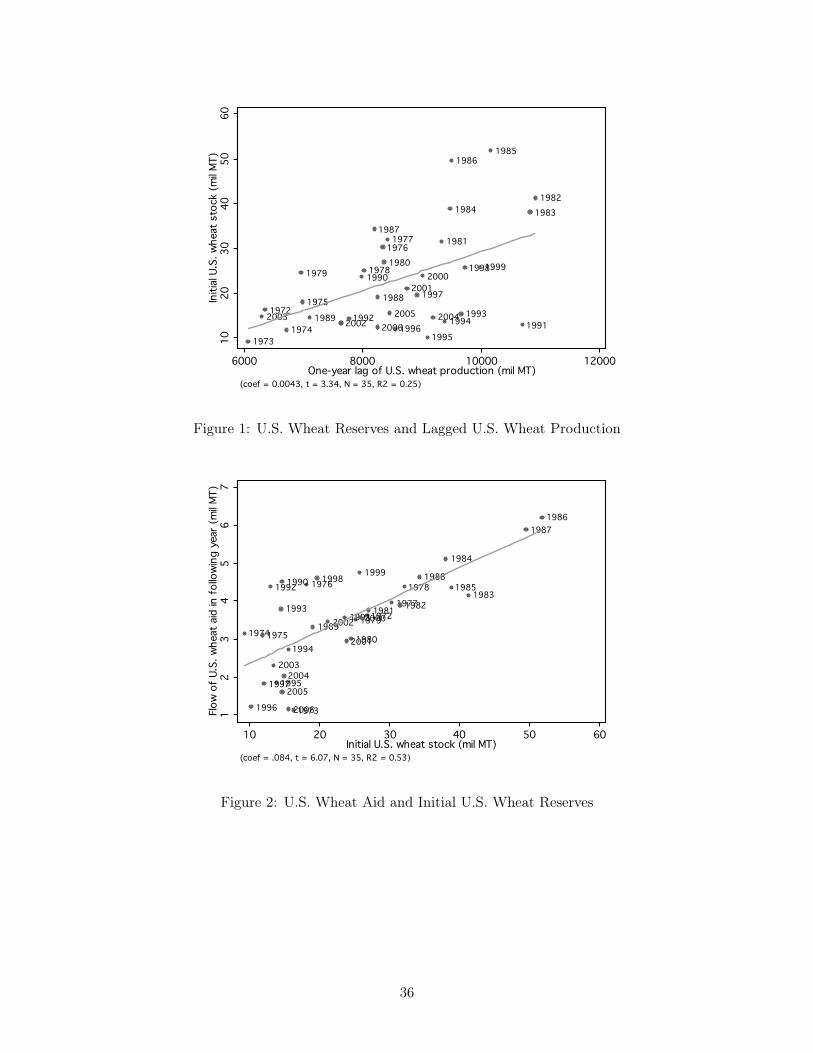
1972
19731974
1975
19761977
197819791980
1981
198219831984
19851986
1987
1988
1989
1990
19911992 1993
1994
19951996
1997
199819992000
2001
20022003 20042005
2006
1020
3040
5060
Initi
al U.
S. w
heat
sto
ck (m
il MT)
6000 8000 10000 12000One-year lag of U.S. wheat production (mil MT)
(coef = 0.0043, t = 3.34, N = 35, R2 = 0.25)
Figure 1: U.S. Wheat Reserves and Lagged U.S. Wheat Production
1972
1973
19741975
1976
1977
1978
1979
1980
1981 19821983
1984
1985
19861987
1988
1989
1990
1991
1992
1993
1994
1995
1996
1997
19981999
2000
2001
2002
20032004
2005
200612
34
56
7Flo
w of
U.S
. whe
at a
id in
follo
wing
yea
r (m
il MT)
10 20 30 40 50 60Initial U.S. wheat stock (mil MT)
(coef = .084, t = 6.07, N = 35, R2 = 0.53)
Figure 2: U.S. Wheat Aid and Initial U.S. Wheat Reserves
36

19721973 19741975 1976197719781979 1980 1981 198219831984 19851986198719881989 1990 1991
19921993
199419951996 1997
1998199920002001
20022003
2004200520060.0
2.0
4.0
6.0
8.1
Aver
age
U.S.
whe
at a
id re
ceive
d (m
il MT)
40 50 60 70 80One-year lag of U.S. wheat production (mil MT)
(coef = 0.000017, t = 0.24, N = 35, R2 = 0.00)
Figure 3: Average U.S. Wheat Aid and Lagged U.S. Wheat Production– Irregular Recipients: Dir < 0.29
1972
1973
19741975
1976197719781979
1980 1981 1982198319841985
1986198719881989 1990
1991
1992
1993
19941995
1996
1997
1998
1999
20002001
2002
2003
2004200520060
.003
.006
.009
.012
Aver
age
U.S.
whe
at a
id re
ceive
d (m
il MT)
40 50 60 70 80One-year lag of U.S. wheat production (mil MT)
(coef = 0.000017, t = 0.24, N = 35, R2 = 0.00)
Figure 4: Average U.S. Wheat Aid and Lagged U.S. Wheat Production – Unscaled Y -Axis– Irregular Recipients: Dir < 0.29
37

1972
1973
19741975
19761977
1978
19791980
19811982
1983
1984
1985
19861987
1988
1989
1990
1991
1992
1993
1994
1995
1996
1997
19981999
2000
20012002
2003 20042005
2006
0.0
2.0
4.0
6.0
8.1
Aver
age
U.S.
whe
at a
id re
ceive
d (m
il MT)
40 50 60 70 80One-year lag of U.S. wheat production (mil MT)
(coef = 0.000759, t = 2.05, N = 35, R2 = 0.11)
Figure 5: Average U.S. Wheat Aid and Lagged U.S. Wheat Production– Regular Recipients: Dir ≥ 0.29
38
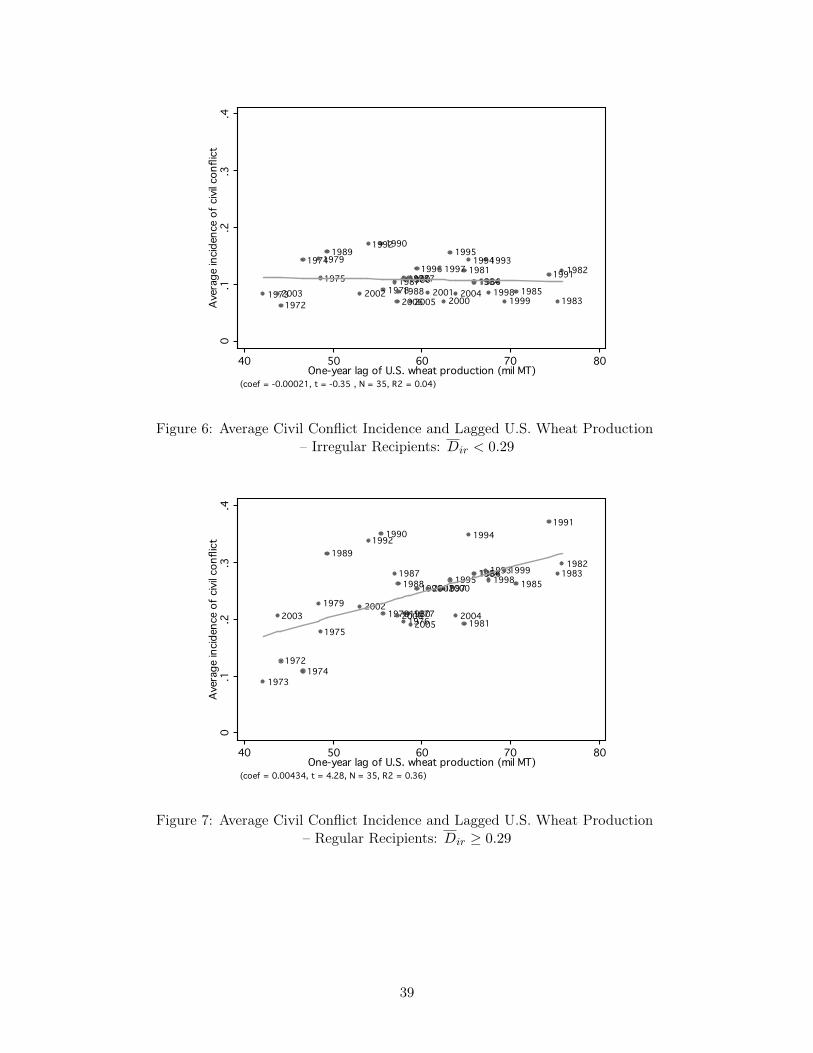
19721973
1974
1975 197619771978
1979
19801981 1982
1983
19841985
198619871988
19891990
1991
1992
199319941995
1996 1997
199819992000
200120022003 200420052006
0.1
.2.3
.4Av
erag
e in
ciden
ce o
f civi
l con
flict
40 50 60 70 80One-year lag of U.S. wheat production (mil MT)
(coef = -0.00021, t = -0.35 , N = 35, R2 = 0.04)
Figure 6: Average Civil Conflict Incidence and Lagged U.S. Wheat Production– Irregular Recipients: Dir < 0.29
1972
19731974
1975197619771978
19791980
1981
198219831984
198519861987
1988
1989
19901991
1992
1993
1994
19951996 1997
19981999
20002001
20022003 2004
20052006
0.1
.2.3
.4Av
erag
e in
ciden
ce o
f civi
l con
flict
40 50 60 70 80One-year lag of U.S. wheat production (mil MT)
(coef = 0.00434, t = 4.28, N = 35, R2 = 0.36)
Figure 7: Average Civil Conflict Incidence and Lagged U.S. Wheat Production– Regular Recipients: Dir ≥ 0.29
39

Table 1: Descriptive Statistics
Variable Obs Mean Std. Dev.
Conflicts with 25+ battle deaths (from UCDP/PRIO):Any Conflict 4240 0.219 0.413Intra State Conflict 4240 0.176 0.381Inter State Conflict 4240 0.028 0.165Onset of Intra State Conflict (all observations) 4210 0.033 0.178Onset of Intra State Conflict (observations that follow no-conflict only) 3509 0.039 0.195Offset of Intra State Conflict (observations that follow conflict only) 707 0.188 0.391
Conflicts with 1000+ battle deaths (from COW):Any Conflict 4240 0.155 0.362Intra State Conflict 4240 0.142 0.350Inter State Conflict 4240 0.022 0.146
U.S. Wheat Aid (1000 MT) 4240 27.63 116.38Frequency of Receiving Any U.S Food Aid 4240 0.351 0.301Lagged U.S. Wheat Production (1000 MT) 4240 59650 8610Recipient Cereal Production (1000 MT) 4240 8500 37577
TABLE 1. Summary Statistics
Notes: An observation is a country and year. The sample includes 134 non-OECD countries for theyears 1972-2006.
40

Tab
le2:
The
Effe
ctof
Food
Aid
onCon
flict
(1)
(2)
(3)
(4)
(5)
(6)
(7)
Dep
ende
nt V
aria
ble
(Pan
els
A, B
and
C):
Any
Con
flict
Any
Con
flict
Any
Con
flict
Any
Con
flict
Any
Con
flict
Intra
Sta
teIn
ter S
tate
U.S
. Whe
at A
id (1
000
MT)
-0.0
0009
-0.0
0009
-0.0
0013
-0.0
0015
-0.0
0014
-0.0
0005
-0.0
0013
(0.0
0016
)(0
.000
16)
(0.0
0016
)(0
.000
16)
(0.0
0015
)(0
.000
15)
(0.0
0004
)
R-s
quar
ed0.
521
0.52
30.
538
0.54
30.
549
0.52
60.
383
0.00
924
0.00
945
0.00
895
0.01
067
0.01
106
0.01
004
-0.0
0079
(0.0
0256
)(0
.002
55)
(0.0
0265
)(0
.003
14)
(0.0
0301
)(0
.002
96)
(0.0
0087
)
R-s
quar
ed0.
523
0.52
50.
540
0.54
60.
551
0.52
90.
379
U.S
. Whe
at A
id (1
000
MT)
0.00
399
0.00
403
0.00
391
0.00
474
0.00
465
0.00
411
-0.0
0032
(0.0
0143
)(0
.001
35)
(0.0
0134
)(0
.001
59)
(0.0
0156
)(0
.001
60)
(0.0
0036
)
LIM
L po
int e
stim
ate
0.00
373
0.00
385
0.00
364
0.00
475
0.00
453
0.00
411
-0.0
0032
p-va
lue
0.00
00.
001
0.00
30.
000
0.00
00.
001
0.42
7
CLR
95%
Inte
rval
[Low
er b
ound
,[0
.001
97,
[0.0
0205
,[0
.001
87,
[0.0
0246
, [0
.002
41,
[0.0
0216
,[-0
.001
30,
Upp
er b
ound
]0.
0073
0]0.
0075
8]0.
0073
1]0.
0108
0]0.
0096
2]0.
0087
1]0.
0005
36]
Dep
ende
nt V
aria
ble
(Pan
el D
):
0.00
248
0.00
245
0.00
246
0.00
224
0.00
244
0.00
244
0.00
244
(0.0
0074
)(0
.000
72)
(0.0
0073
)(0
.000
66)
(0.0
0082
)(0
.000
82)
(0.0
0082
)
Firs
t Sta
ge F
-Sta
tistic
20.1
119
.61
13.8
415
.94
15.9
415
.94
15.9
4
Cou
ntry
FE
YY
YY
YY
YR
egio
n-Ye
ar F
EY
YY
YY
YY
Mon
thly
Rec
ipie
nt T
empe
ratu
re a
nd P
reci
pita
tion
NY
YY
YY
YAv
g R
ecip
ient
Cer
eal I
mpo
rts x
Yea
r FE
NN
YY
YY
YAv
g R
ecip
ient
Cer
eal P
rodu
ctio
n x
Year
FE
NN
YY
YY
YAv
g U
.S. M
ilita
ry A
id x
Yea
r FE
NN
NY
YY
YAv
g U
.S. E
cono
mic
Aid
(Net
of F
ood
Aid
) x Y
ear F
EN
NN
YY
YY
Rec
ipie
nt W
eath
er V
aria
bles
x A
vg P
rob
of A
ny U
.S. F
ood
Aid
NN
NN
YY
Y
Obs
erva
tions
(for
all
pane
ls)
4240
4240
4240
4240
4240
4240
4240
Bas
elin
e S
peci
ficat
ion
Par
sim
onio
us S
peci
ficat
ions
Lag
U.S
. Whe
at P
rodu
ctio
n (1
000
MT)
x A
vg P
rob
of A
ny U
.S.
Food
Aid
Lag
U.S
. Whe
at P
rodu
ctio
n (1
000
MT)
x A
vg P
rob
of A
ny U
.S.
Food
Aid
Not
es:A
nob
serv
atio
nis
aco
untry
and
aye
ar.T
hesa
mpl
ein
clud
es13
4no
n-O
EC
Dco
untri
esfo
rthe
year
s19
72-2
006.
The
cont
rols
incl
uded
are
indi
cate
din
the
tabl
eby
Y(y
es)o
rN(n
o).S
tand
ard
erro
rsar
ecl
uste
red
atth
eco
untry
leve
l.**
Inpa
nelB
,the
poin
test
imat
esan
dst
anda
rder
rors
are
mul
tiplie
dby
1000
forp
rese
ntat
ion
purp
oses
.In
Pan
elC
,we
also
repo
rtth
eLI
ML
estim
ates
,p-v
aues
,and
Con
ditio
nalL
ikel
ikho
odR
atio
(CLR
)95
%co
nfid
ence
inte
rval
s.In
pane
lD,w
eal
sore
port
first
-sta
geC
ragg
-Don
ald
F-st
atis
tics.
The
Sto
ck-
Yogo
crit
ical
val
ues
(with
a 5
% s
igni
fican
ce le
vel)
are
8.96
and
16.
38 fo
r 15
and
10%
max
imum
bia
s in
siz
e, re
spec
tivel
y.
A. O
LS E
stim
ates
B. R
educ
ed F
orm
Est
imat
es (x
100
0)**
C. 2
SLS
Est
imat
es
D. F
irst S
tage
Est
imat
esU
.S. W
heat
Aid
(100
0 M
T)
Con
trols
(for
all
pane
ls):
41

Tab
le3:
The
Effe
ctof
U.S.W
heat
Produ
ctionon
PastW
heat
Aid
andRecipient
CerealP
rodu
ction
U.S
. Whe
at A
id
(100
0 M
T)
U.S
. Whe
at A
id
(100
0 M
T),
Per
iod
t-2
U.S
. Whe
at A
id
(100
0 M
T),
Per
iod
t-3
Rec
ipie
nt C
erea
l P
rodu
ctio
n (1
000
MT)
(1)
(2)
(3)
(4)
0.00
244
-0.0
0036
-0.0
0057
-0.0
610
(0.0
0082
)(0
.000
76)
(0.0
0095
)(0
.080
9)
Obs
erva
tions
4240
3972
3838
4240
R-s
quar
ed0.
528
0.54
60.
556
0.95
5
Lag
U.S
. Whe
at P
rodu
ctio
n (1
000
MT)
x
Avg
Pro
b of
Any
U.S
. Foo
d A
id
Dep
ende
nt V
aria
ble:
TAB
LE 3
. Firs
t-Sta
ge P
lace
bo R
egre
ssio
ns
Not
es:O
LSes
timat
esar
ere
porte
d.Th
eun
itof
obse
rvat
ion
isa
coun
tryin
aye
ar.T
hesa
mpl
ein
clud
es13
4no
n-O
EC
Dco
untri
esfo
rth
eye
ars
1972
-200
6.A
llre
gres
sion
sin
clud
eth
efu
llse
tof
base
line
cont
rols
-se
eTa
ble
2co
lum
ns (5
)-(7
) for
a fu
ll lis
t. C
oeffi
cien
ts a
re re
porte
d, w
ith s
tand
ard
erro
rs c
lust
ered
at t
he c
ount
ry le
vel.
42

Tab
le4:
The
Effe
ctof
Food
Aid
–Rob
ustnessto
Add
itiona
lCon
trols
Bas
elin
e(1
)(2
)(3
)(4
)(5
)(6
)
U.S
. Whe
at A
id (1
000
MT)
0.00
312
0.00
325
0.00
269
0.00
311
0.00
264
0.00
247
(0.0
0122
)(0
.001
32)
(0.0
0109
)(0
.001
17)
(0.0
0102
)(0
.000
93)
Con
trols
:A
ll B
asel
ine
cont
rols
YY
YY
YY
Lagg
ed ln
real
per
cap
ita G
DP
NY
NN
NY
Avg
ln re
al p
er c
apita
GD
P x
Year
FE
NN
YN
NY
Avg
Pol
ity S
core
x Y
ear F
EN
NN
YN
YC
old
War
x A
vg U
.S. F
ood
Aid
NN
NN
YY
LIM
L po
int e
stim
ate
0.00
312
0.00
325
0.00
269
0.00
311
0.00
264
0.00
247
p-va
lue
0.00
00.
000
0.00
10.
000
0.00
00.
000
CLR
95%
Inte
rval
[Low
er b
ound
,[0
.001
39,
[0.0
0144
,[0
.001
06,
[0.0
0140
,[0
.001
34,
[0.0
0123
,
U
pper
bou
nd]
0.00
692]
0.00
744]
0.00
603]
0.00
679]
0.00
478]
0.00
447]
Firs
t Sta
ge F
-Sta
tistic
15.9
214
.85
16.5
516
.44
28.8
730
.71
Obs
erva
tions
3482
3482
3482
3482
3482
3482
R-s
quar
ed0.
384
0.39
00.
037
0.10
30.
071
0.70
2N
otes
:2S
LSes
timat
esar
ere
porte
d.Th
esa
mpl
ein
clud
es11
3no
n-O
EC
Dco
untri
esfo
rth
eye
ars
1972
-200
6.Th
esm
alle
rnum
bero
fcou
ntrie
s(fr
om13
4)is
due
tom
issi
ngda
tafo
rthe
addi
tiona
lcon
trolv
aria
bles
.U.S
.Whe
atA
idin
year
tis
inst
rum
ente
dby
U.S
.whe
atpr
oduc
tion
inye
art-1
xth
efre
quen
cyof
rece
ivin
gan
yU
.S.f
ood
aid
durin
g19
72-2
006.
All
regr
essi
ons
incl
ude
the
full
seto
fbas
elin
eco
ntro
ls-s
eeTa
ble
2co
lum
ns(5
)-(7
)for
the
list.
Y(y
es)o
rN(n
o)in
dica
teth
ein
clus
ion
orex
clus
ion
ofad
ditio
nalc
ontro
ls.S
tand
ard
erro
rsar
ecl
uste
red
atth
eco
untry
leve
l.Th
eta
ble
also
repo
rtsLI
ML
poin
tes
timat
es(a
ndp-
valu
es),
asw
ella
sC
ondi
tiona
lLik
elik
hood
Rat
io95
%co
nfid
ence
inte
rval
s.Th
eC
ragg
-D
onal
dfir
stst
age
F-st
atis
tics
are
also
repo
rted
atth
ebo
ttom
ofth
eta
ble.
The
Sto
ck-Y
ogo
criti
calv
alue
s(w
itha
5%si
gnifi
canc
e le
vel)
are
8.96
and
16.
38 fo
r 15
and
10%
max
imum
bia
s in
siz
e, re
spec
tivel
y.
Dep
ende
nt V
aria
ble:
Inci
denc
e of
Civ
il C
onfli
ct
TAB
LE 4
. Rob
ustn
ess
of 2
SLS
Est
imat
es to
Alte
rnat
ive
Con
trols
Rob
ustn
ess
and
Sen
sitiv
ity S
peci
ficat
ions
43

Tab
le5:
The
Effe
ctof
Food
Aid
–Rob
ustnessto
Alterna
tive
Specification
s
Bas
elin
e IV
: us
ing
lagg
ed
U.S
. Whe
at
Pro
d x
Avg
Food
Aid
Pro
bM
SS
(200
4):
time
trend
s
MS
S (2
004)
: co
untry
-sp
ecifi
c tim
e tre
nds
IV u
sing
la
gged
U.S
. w
heat
pr
oduc
tion
only
(u
nint
erac
ted)
Con
trolli
ng fo
r la
gged
con
flict
Nor
mal
izin
g ai
d by
po
pula
tion
Taki
ng n
atur
al
logs
of a
id a
nd
prod
uctio
n(1
)(2
)(3
)(4
)(5
)(6
)(7
)
U.S
. Whe
at A
id (1
,000
MT)
0.00
411
0.00
399
0.00
325
0.00
362
0.00
278
0.06
000.
256
(0.0
0160
)(0
.001
71)
(0.0
0137
)(0
.001
96)
(0.0
0106
)(0
.023
6)(0
.078
5)
Sta
ndar
dize
d be
ta c
oeffi
cien
t1.
254
1.05
80.
899
1.12
40.
848
1.15
91.
185
Con
trols
:C
ount
ry F
EY
YY
YY
YY
Reg
ion-
Year
FE
YN
NN
YY
YLa
g D
epen
dent
Var
iabl
eN
NN
NY
NN
Tim
e Tr
end
NY
NN
NN
NC
ount
ry-S
peci
fic T
ime
Tren
dsN
NY
YN
NN
Obs
erva
tions
4240
4240
4240
4240
4205
4208
4240
Dep
ende
nt V
aria
ble:
Inci
denc
e of
Civ
il C
onfli
ct
Not
es:2
SLS
estim
ates
are
repo
rted.
The
sam
ple
incl
udes
134
non-
OE
CD
coun
tries
for
the
year
s19
72-2
006.
Inco
lum
ns(1
)-(3
)an
d(5
)-(7
),U
.S.W
heat
Aid
inye
arti
sin
stru
men
ted
byU
.S.w
heat
prod
uctio
nin
year
t-1x
the
frequ
ency
ofre
ceiv
ing
any
U.S
.foo
dai
ddu
ring
1972
-200
6.In
colu
mn
(4),
U.S
.Whe
atA
idis
inst
rum
ente
dby
U.S
.whe
atpr
oduc
tion
inye
art-1
.The
regr
essi
ons
inco
lum
ns(1
)and
(5)-
(7)i
nclu
deth
efu
llse
tofb
asel
ine
cont
rols
.See
Tabl
e2,
colu
mns
(5)-
(7)
for
alis
t.Th
ere
gres
sion
sin
colu
mns
(2)-
(4)
incl
ude
the
sam
eco
ntro
ls,b
utw
ithea
chco
untry
-leve
lcha
ract
eris
ticin
tera
cted
with
alin
ear
time
trend
inst
ead
ofye
arFE
s.Y
(yes
)or
N(n
o)in
dica
teth
ein
clus
ion
orex
clus
ion
ofth
edi
ffere
ntco
ntro
lvar
iabl
es.
Coe
ffici
ents
are
repo
rted
with
stan
dard
erro
rscl
uste
red
atth
eco
untry
leve
l.Th
eta
ble
also
repo
rtsst
anda
rdiz
ed`b
eta
coef
ficie
nts'
.
44

Tab
le6:
The
Effe
ctof
Food
Aid
onCon
flict
Onset
andDuration
Col
lier a
nd
Hoe
fler (
2004
)Fe
aron
and
La
itin
(200
3)(1
)(2
)(3
)(4
)(5
)
U.S
. Whe
at A
id (1
,000
MT)
0.00
231
0.00
183
-0.0
0483
-0.0
0614
-0.0
0501
(0.0
0148
)(0
.000
80)
(0.0
0199
)(0
.002
03)
(0.0
0213
)C
ontro
ls:
Lagg
ed c
ivil
conf
lict i
ncid
ence
NY
n/a
n/a
n/a
Third
-ord
er p
oly
of d
urat
ion
n/a
n/a
YY
YTi
me-
inva
riant
con
trols
n/a
n/a
NY
YR
egio
n fix
ed e
ffect
sn/
an/
aN
NY
Obs
erva
tions
3,50
94,
210
560
558
707
Not
es:I
nal
lspe
cific
atio
ns,U
.S.W
heat
Aid
inye
arti
sin
stru
men
ted
byU
.S.w
heat
prod
uctio
nin
year
t-1x
the
prob
abili
tyof
rece
ivin
gan
yU
.S.f
ood
aid
betw
een
1972
and
2006
.In
colu
mns
(1)a
nd(2
),th
ede
pend
entv
aria
ble
isan
indi
cato
rtha
teq
uals
one
fort
heon
seto
faci
vilw
ar.B
oth
spec
ifica
tions
incl
ude
the
full
seto
fbas
elin
eco
varia
tes.
See
colu
mns
(5)-
(7)
ofTa
ble
2fo
ralis
toft
hese
varia
bles
.In
colu
mn
(1),
obse
rvat
ions
that
are
perio
dsof
cont
inue
dco
nflic
tare
omitt
edfro
mth
esa
mpl
e.Th
ere
gres
sion
inco
lum
n(2
)inc
lude
sa
one-
year
lag
inth
ein
cide
nce
ofci
vilc
onfli
ctas
anad
ditio
nalc
ontro
lva
riabl
ean
dus
esth
efu
llsa
mpl
e.C
olum
ns(3
)-(5
)es
timat
ea
disc
rete
time
haza
rdm
odel
for
the
inci
denc
eof
civi
lwar
offs
et.I
nth
isse
tting
,sur
viva
lis
cont
inue
dco
nflic
t.Th
eco
effic
ient
sre
porte
dar
em
argi
nale
ffect
sev
alua
ted
atm
eans
.The
cont
rol f
unct
ion
appr
oach
is u
sed
to g
ener
ate
IV e
stim
ates
for t
he h
azar
d m
odel
s.
Dep
ende
nt v
aria
ble:
Civ
il w
ar o
nset
Civ
il w
ar o
ffset
Logi
stic
Dis
cret
e Ti
me
Haz
ard
Mod
el
45
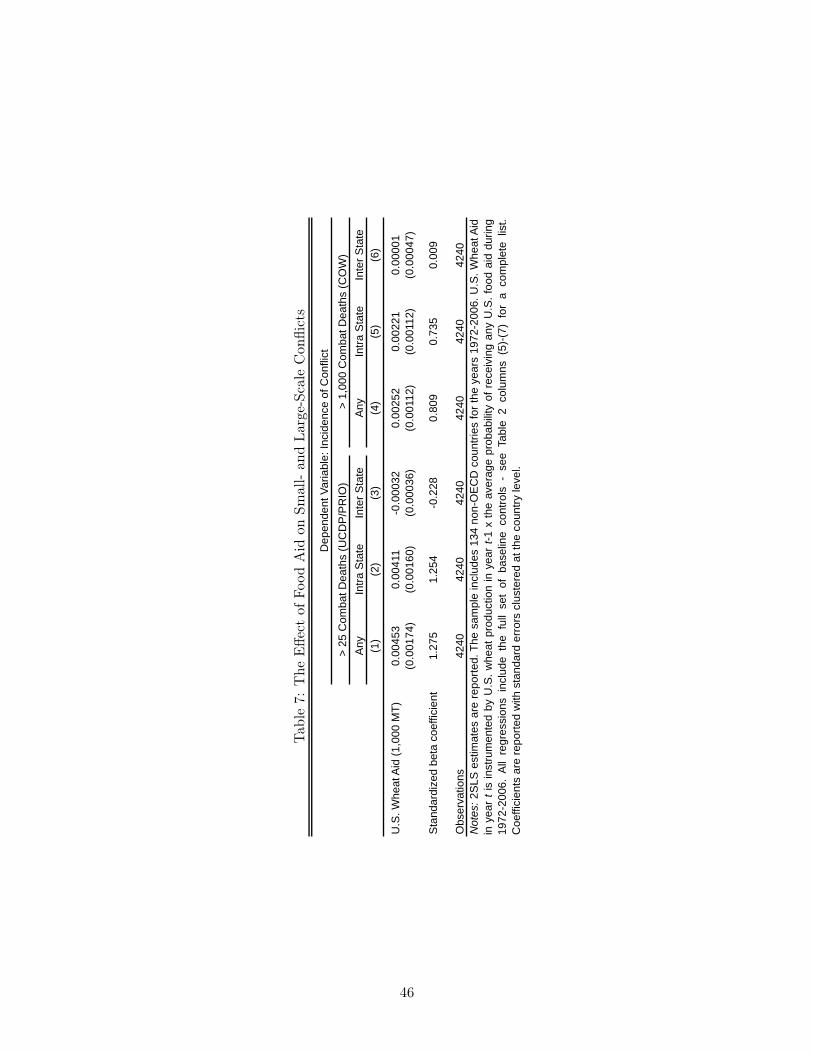
Tab
le7:
The
Effe
ctof
Food
Aid
onSm
all-an
dLa
rge-ScaleCon
flicts
Any
Intra
Sta
teIn
ter S
tate
Any
Intra
Sta
teIn
ter S
tate
(1)
(2)
(3)
(4)
(5)
(6)
U.S
. Whe
at A
id (1
,000
MT)
0.00
453
0.00
411
-0.0
0032
0.00
252
0.00
221
0.00
001
(0.0
0174
)(0
.001
60)
(0.0
0036
)(0
.001
12)
(0.0
0112
)(0
.000
47)
Sta
ndar
dize
d be
ta c
oeffi
cien
t1.
275
1.25
4-0
.228
0.80
90.
735
0.00
9
Obs
erva
tions
4240
4240
4240
4240
4240
4240
> 25
Com
bat D
eath
s (U
CD
P/P
RIO
)>
1,00
0 C
omba
t Dea
ths
(CO
W)
Not
es:2
SLS
estim
ates
are
repo
rted.
The
sam
ple
incl
udes
134
non-
OE
CD
coun
tries
fort
heye
ars
1972
-200
6.U
.S.W
heat
Aid
inye
arti
sin
stru
men
ted
byU
.S.w
heat
prod
uctio
nin
year
t-1x
the
aver
age
prob
abili
tyof
rece
ivin
gan
yU
.S.f
ood
aid
durin
g19
72-2
006.
All
regr
essi
ons
incl
ude
the
full
set
ofba
selin
eco
ntro
ls-
see
Tabl
e2
colu
mns
(5)-
(7)
for
aco
mpl
ete
list.
Coe
ffici
ents
are
repo
rted
with
sta
ndar
d er
rors
clu
ster
ed a
t the
cou
ntry
leve
l.
Dep
ende
nt V
aria
ble:
Inci
denc
e of
Con
flict
46
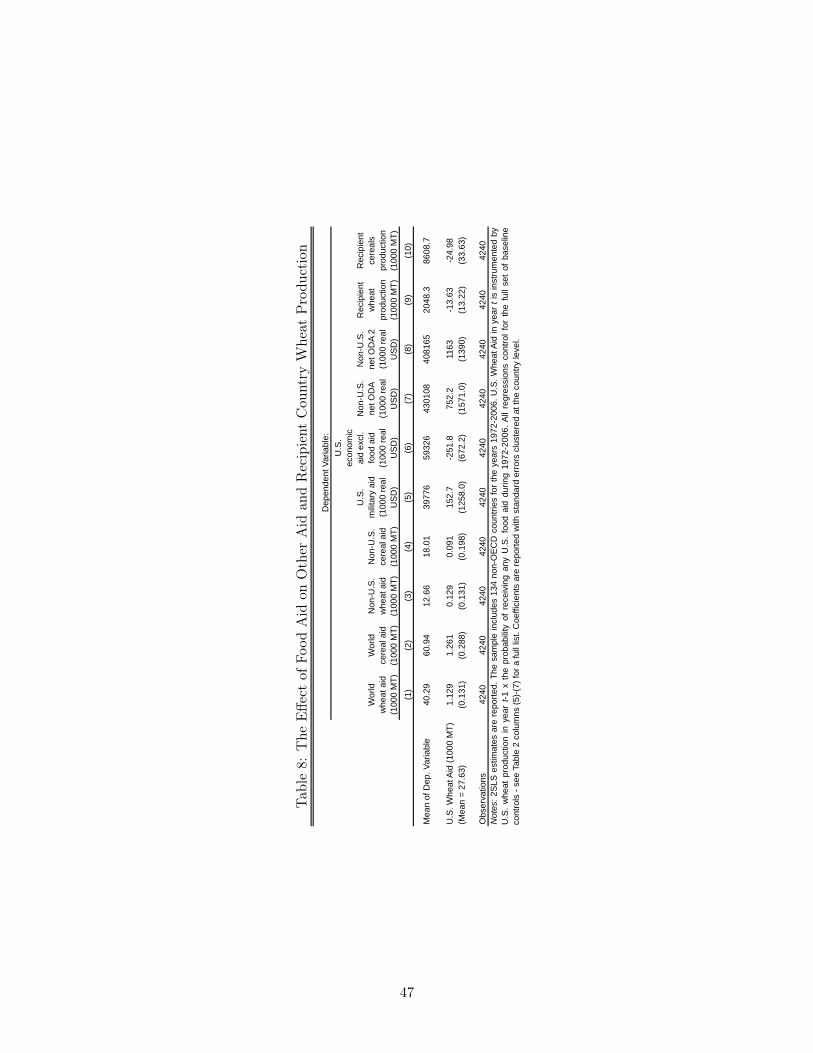
Tab
le8:
The
Effe
ctof
Food
Aid
onOther
Aid
andRecipient
Cou
ntry
Wheat
Produ
ction
Wor
ld
whe
at a
id
(100
0 M
T)
Wor
ld
cere
al a
id
(100
0 M
T)
Non
-U.S
. w
heat
aid
(1
000
MT)
Non
-U.S
. ce
real
aid
(1
000
MT)
U.S
. m
ilita
ry a
id
(100
0 re
al
US
D)
U.S
. ec
onom
ic
aid
excl
. fo
od a
id
(100
0 re
al
US
D)
Non
-U.S
. ne
t OD
A (1
000
real
U
SD
)
Non
-U.S
. ne
t OD
A 2
(100
0 re
al
US
D)
Rec
ipie
nt
whe
at
prod
uctio
n (1
000
MT)
Rec
ipie
nt
cere
als
prod
uctio
n (1
000
MT)
(1)
(2)
(3)
(4)
(5)
(6)
(7)
(8)
(9)
(10)
Mea
n of
Dep
. Var
iabl
e40
.29
60.9
412
.66
18.0
139
776
5932
643
0108
4081
6520
48.3
8608
.7
U.S
. Whe
at A
id (1
000
MT)
1.12
91.
261
0.12
90.
091
152.
7-2
51.8
752.
211
63-1
3.63
-24.
98(M
ean
= 27
.63)
(0.1
31)
(0.2
88)
(0.1
31)
(0.1
98)
(125
8.0)
(672
.2)
(157
1.0)
(139
0)(1
3.22
)(3
3.63
)
Obs
erva
tions
4240
4240
4240
4240
4240
4240
4240
4240
4240
4240
Dep
ende
nt V
aria
ble:
Not
es:2
SLS
estim
ates
are
repo
rted.
The
sam
ple
incl
udes
134
non-
OE
CD
coun
tries
fort
heye
ars
1972
-200
6.U
.S.W
heat
Aid
inye
arti
sin
stru
men
ted
byU
.S.
whe
atpr
oduc
tion
inye
art-1
xth
epr
obab
ility
ofre
ceiv
ing
any
U.S
.fo
odai
ddu
ring
1972
-200
6.A
llre
gres
sion
sco
ntro
lfor
the
full
set
ofba
selin
eco
ntro
ls -
see
Tabl
e 2
colu
mns
(5)-
(7) f
or a
full
list.
Coe
ffici
ents
are
repo
rted
with
sta
ndar
d er
rors
clu
ster
ed a
t the
cou
ntry
leve
l.
47

Tab
le9:
The
Heterogeneous
Effe
ctsof
Food
Aid
onCon
flict
(1)
(2)
(3)
(4)
(5)
(6)
(7)
(8)
(9)
U.S
. Whe
at A
id (1
000
MT)
0.00
411
0.00
514
0.00
277
0.00
427
0.00
404
0.00
628
0.00
445
0.00
507
0.00
372
(0.0
0160
)(0
.002
90)
(0.0
0161
)(0
.002
80)
(0.0
0241
)(0
.002
57)
(0.0
0186
)(0
.001
81)
(0.0
0283
)U
.S. W
heat
Aid
x In
dica
tor f
or:
Low
Inco
me
-0.0
0272
0.00
153
(0.0
0321
)(0
.004
06)
Dem
ocra
tic (H
igh
Pol
ity)
0.00
085
0.00
026
(0.0
0239
)(0
.001
35)
Civ
ilian
Gov
ernm
ent
-0.0
0140
-0.0
0102
(0.0
0323
)(0
.001
43)
Low
Pol
ariz
atio
n-0
.000
56-0
.001
06(0
.003
21)
(0.0
0241
)
Low
Eth
nic
Frac
tiona
lizat
ion
-0.0
0480
-0.0
0208
(0.0
0285
)(0
.001
96)
Hig
h R
oad
Den
sity
-0.0
0322
-0.0
0275
(0.0
0234
)(0
.001
32)
Col
d W
ar Y
ears
-0.0
0220
-0.0
0048
(0.0
0155
)(0
.001
55)
Obs
erva
tions
4240
4085
3664
4240
2917
3358
3437
4240
2499
U.S
. Whe
at A
id +
(U.S
. Whe
at A
id x
Indi
cato
r)0.
0024
20.
0036
20.
0028
70.
0034
80.
0014
80.
0012
30.
0028
70.
0009
7**
p-va
lue
0.11
50.
079
0.04
30.
112
0.08
70.
504
0.01
70.
750
Dep
ende
nt V
aria
ble:
Inci
denc
e of
Civ
il C
onfli
ct
Not
es:2
SLS
estim
ates
are
repo
rted.
The
base
line
sam
ple
inco
lum
n(1
)inc
lude
s13
4no
n-O
EC
Dco
untri
esfo
rthe
year
s19
72-2
006.
The
sam
ple
size
inco
lum
ns(2
)-(9
)va
ries
acco
rdin
gto
data
avai
labi
lity.
U.S
.Whe
atA
idin
year
tand
the
inte
ract
ion
ofw
heat
aid
and
the
indi
cato
rva
riabl
ear
ein
stru
men
ted
with
U.S
.whe
atpr
oduc
tion
inye
art-1
xth
epr
obab
ility
ofre
ceiv
ing
any
U.S
.foo
dai
ddu
ring
1972
-200
6,an
dth
etri
ple
inte
ract
ion
ofth
ein
dica
torx
U.S
.whe
atpr
oduc
tion
inye
art-1
xth
epr
obab
ility
ofre
ceiv
ing
any
U.S
.fo
odai
ddu
ring
1972
-200
6.Th
ere
gres
sion
sal
soin
clud
eth
ere
leva
ntdo
uble
inte
ract
ion
term
s.A
llre
gres
sion
sco
ntro
lfor
the
full
set
ofba
selin
eco
ntro
ls-s
eeTa
ble
2co
lum
ns(5
)-(7
)for
the
full
list.
Coe
ffici
ents
are
repo
rted
with
stan
dard
erro
rscl
uste
red
atth
eco
untry
leve
l.Th
ejo
inte
stim
ate
forU
.S.w
heat
aid
+U
.S.w
heat
aid
xin
dica
tor
vara
ible
,and
thei
rp-v
alue
s,ar
ere
porte
din
the
final
row
ofth
eta
ble.
**In
colu
mn
(9),
the
join
test
imat
ere
fers
toth
ees
timat
efo
rU
.S.w
heat
aid
+ U
.S. w
heat
aid
x h
igh
road
den
sity
.
48
Top Related