


Languages
Pages
Legal


After CopenhagenAfter Copenhagen
Jeffrey FrankelJeffrey Frankel Harpel Professor, Harvard Kennedy SchoolHarpel Professor, Harvard Kennedy School
HUCE, March 2, 2010HUCE, March 2, 2010

22
2 Questions2 Questions
1. Copenhagen Accord = Progress?
2. Proposal for a Global Climate Agreement: How to Set Emission Targets by Formula
3. Appendix: Country Emission Targets
33
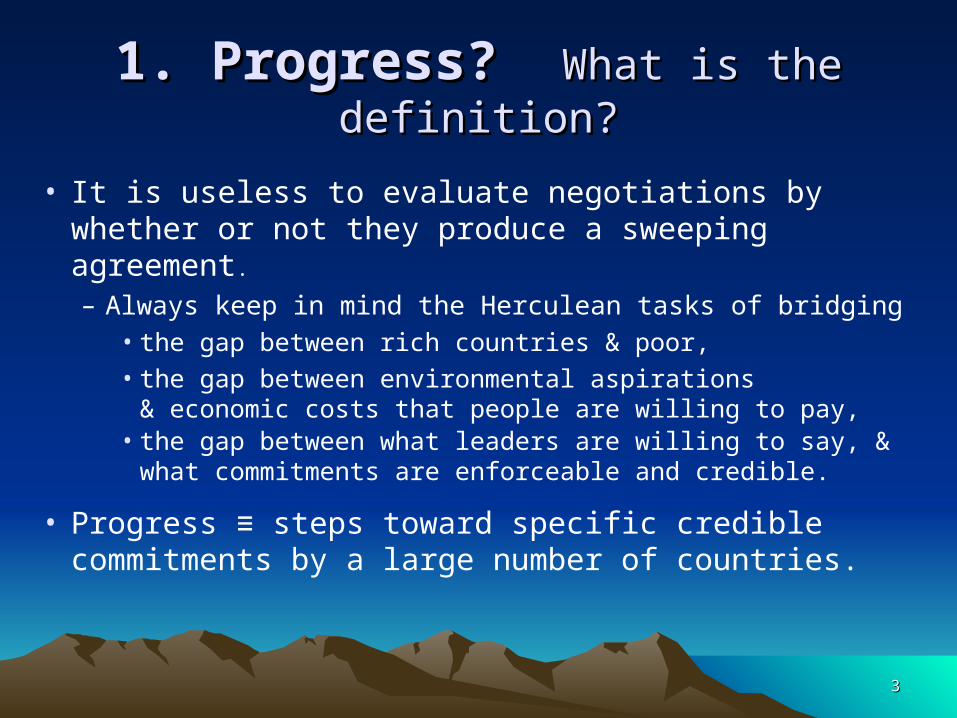
1. Progress?1. Progress? What is the definition?What is the definition?
• It is useless to evaluate negotiations by whether or not they produce a sweeping agreement.– Always keep in mind the Herculean tasks of bridging
• the gap between rich countries & poor,
• the gap between environmental aspirations & economic costs that people are willing to pay,
• the gap between what leaders are willing to say, &what commitments are enforceable and credible.
• Progress ≡ steps toward specific credible commitments by a large number of countries.

44
The best recent newsThe best recent news
• 102 countries (81% of global emissions), responded to the Jan.31, 2010, deadline of the Copenhagen Accord by submitting plans for reducing emissions.
• Six big non-Annex I countries named quantitative targets– They didn’t have to.– Of course many, like China, are vague
• about base year and seriousness of commitment• India & China’s 2020 target ≈ BAU.
– But that is not a problem. (It is what I had proposed.)
• It is an important step forward,– suggesting that Pres. Obama’s in-person breakthrough
on the last day of COP15 may indeed lead somewhere.

555
Emissions targets taken on under Emissions targets taken on under Copenhagen AccordCopenhagen Accord (Jan 31, 2010 deadline)(Jan 31, 2010 deadline) . Country
Reduction by 2020
Reduction Base Year
Reduction Type
Share of World GHGs1
CO2 Emissions per capita (tCO2eq)1
Australia 5 to 25% 2000 . 1.30% 27.4
Canada 17% 2005 1.86% 24.9
China 40 to
45% N/A 16.64% 5.5
EU27 20% /
30% 1990 11.69% 10.3
India 20% to 25%
2005 4.32% 1.7
Indonesia 26% N/A 4.73% 9.3
Emission Reductions. A target which reduces a country's overall greenhouse gas emissions.
Business As Usual (BAU). A commitment to reduce emissions from the projection of the future if actions were not taken.
Carbon intensity. How much fossil fuels you have to burn to produce an economic unit. Reducing carbon intensity means a country's GDP will continue to rise without carbon emissions rising at the same rate due to greater energy efficiency.

666
. Country Reduction by 2020
Reduction Base Year
Reduction Type
Share of World GHGs
Emissions per capita (tCO2eq)
Japan 25% 1990 3.14% 10.6
Mexico 30% N/A 1.58% 6.6
Russia 15 to
25% 1990 4.64% 14.0
South Africa
34% N/A 0.98% 9.0
South Korea
30% N/A 1.3% 11.8
US 17% 2005 . 15.78% 23.1
Emissions targets taken on under Emissions targets taken on under
Copenhagen AccordCopenhagen Accord (Jan 31, 2010 deadline)(Jan 31, 2010 deadline)

77
Lessons from CopenhagenLessons from Copenhagen
• Progress is not possible in the UN Framework– Small member countries will obstruct.
• Delays due to walkout;• 6 trouble-maker countries blocked
adoption of “Copenhagen Accord.”
– The UNFCCC Secretariat is not up to it:– Leaving 38,000-44,000 registrees
out in the cold is unforgivable incompetence.
• The important decisions can only be made by a small steering group, like the old G-7.
88
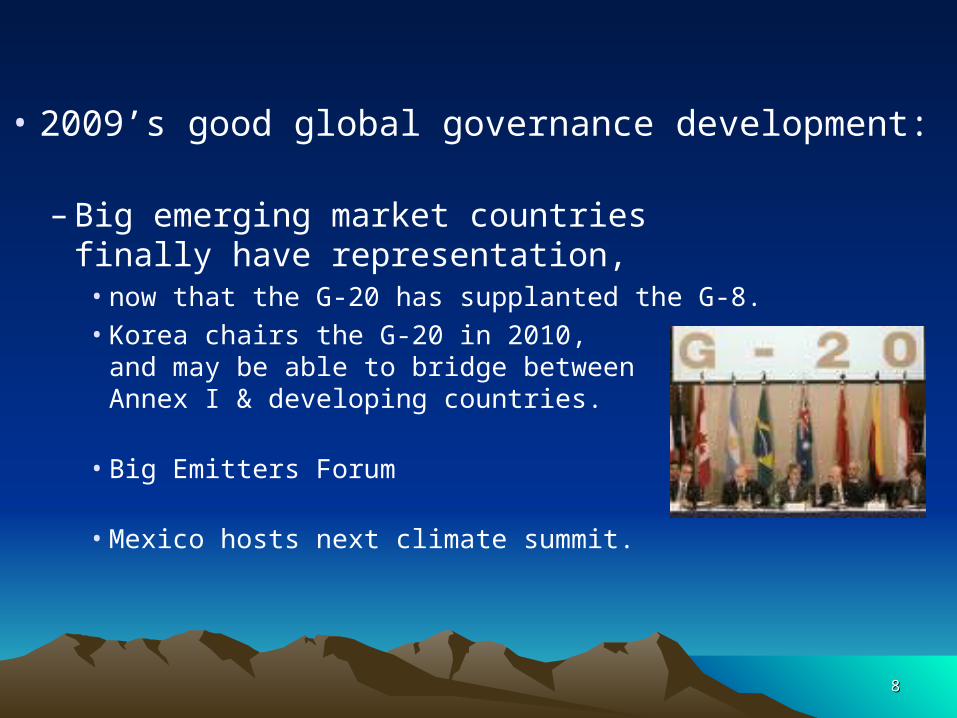
• 2009’s good global governance development:
– Big emerging market countries finally have representation,
• now that the G-20 has supplanted the G-8.• Korea chairs the G-20 in 2010,
and may be able to bridge between Annex I & developing countries.
• Big Emitters Forum
• Mexico hosts next climate summit.

99
• unlike other approaches based purely on:
– Science (concentration goals),
– Ethics (equal emission rights per capita),
– or Economics (cost-benefit optimization).
• Why the political approach? – Countries will not accept burdens that they view as unfair.– Above certain thresholds for economic costs, they will drop out.
2. Proposal: formulas for pragmatic targets, based on what emission paths are possible politically:

1010
• Stage 2:Stage 2: When the time comes for developing country cuts, When the time comes for developing country cuts, targets are determined by a formula incorporating targets are determined by a formula incorporating 3 elements, designed so each is asked only to take 3 elements, designed so each is asked only to take actions analogous to those already taken by others:actions analogous to those already taken by others:
– a Progressive Reduction Factor,– a Latecomer Catch-up Factor, and
– a Gradual Equalization Factor.
• Stage 1: • Annex I countries commit to the post-2012 targets that their leaders have already announced.• Others commit immediately not to exceed BAU.
Proposal

1111
World Industrial Carbon Emissions
0
5
10
15
20
25
GtC
bau
SimulatedEmissions
Global peak Global peak date ≈ 2035date ≈ 2035
◙ ◙ Constraints are satisfied:Constraints are satisfied: -- No country in any one period suffers -- No country in any one period suffers a loss as large as 5% of GDP by participating.a loss as large as 5% of GDP by participating. -- Present Discounted Value of loss < 1% GDP. -- Present Discounted Value of loss < 1% GDP.
◙ ◙ In one version, concentrations level off at 500 ppm In one version, concentrations level off at 500 ppm
in the latter part of the century.in the latter part of the century.
Co-author: V.Bosetti

Paper:Paper: http://ksghome.harvard.edu/~jfrankel/SpecificTargetsHPICA2009.dochttp://ksghome.harvard.edu/~jfrankel/SpecificTargetsHPICA2009.docAvailable at: http://ksghome.harvard.edu/~jfrankel/currentpubsspeeches.htm#On%20Climate%20ChangeAvailable at: http://ksghome.harvard.edu/~jfrankel/currentpubsspeeches.htm#On%20Climate%20Change

1313
AppendicesAppendices
The targeted reductions The targeted reductions from BAUfrom BAU agreed to at Kyoto agreed to at Kyoto
in 1997 were progressive with respect to income.in 1997 were progressive with respect to income.
-30%
-20%
-10%
0%
10%
20%
30%
40%
50%
2.699 3.699 4.699
Per
cen
t re
du
ctio
n f
rom
2010 b
usi
nes
s-as-
usu
al
.
500 1,000 2,000 5,000 10,000 20,000 50,000
1996 GDP per capita (1987 US dollars, ratio scale)
Cuts ↑
Incomes →This is how we set the parameter in the Progressive Reductions Factor

1414
The numbers submitted by countries, The numbers submitted by countries, Jan. 31, 2010,Jan. 31, 2010, under the Copenhagen Accord,under the Copenhagen Accord,
were also progressivewere also progressive
0%
20%
40%
60%
80%
100%
120%
0 5000 10000 15000 20000 25000 30000 35000 40000 45000 50000
Series1
Linear (Series1)
USA
Canada
S. KoreaMexico
India
China
Russia
Australia
EU
Japan
Income per capita
Emissions targets for 2020expressed
vs. BAU(WITCH model)
Cuts ↓

1515
OECD Emissions
0
1
2
3
4
5
6
7
GtC
BAU
Simulated Emissions
CAP
Emissions path for rich countriesEmissions path for rich countries Fig. 2bFig. 2b
Predicted actual Predicted actual emissions exceed emissions exceed caps, by permit caps, by permit purchases.purchases.
1616
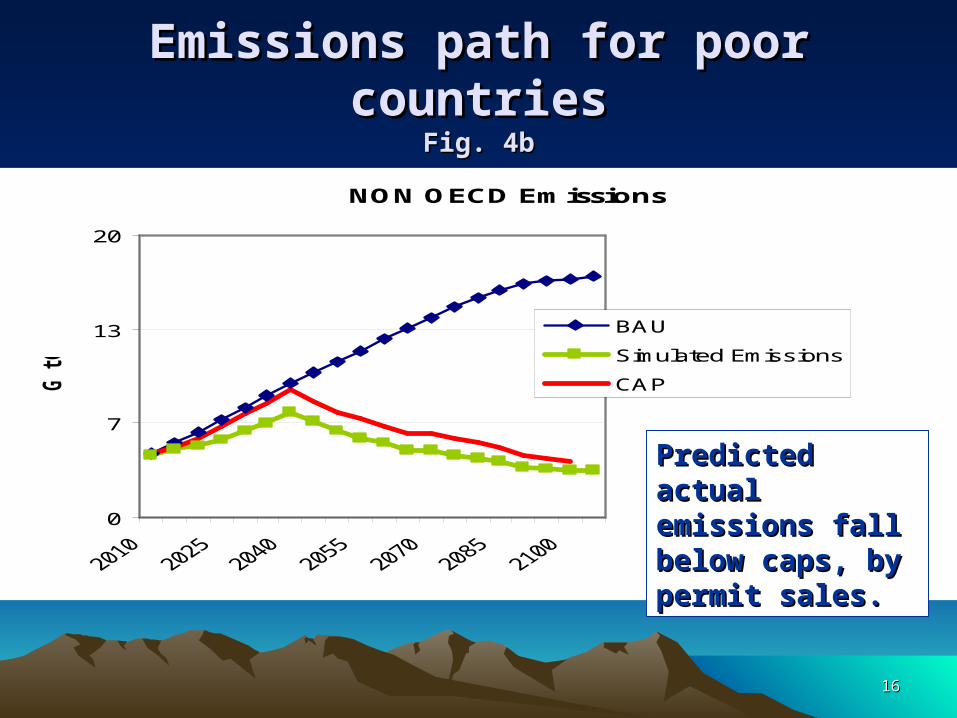
NON OECD Emissions
0
7
13
20
GtC
BAU
Simulated Emissions
CAP
Emissions path for poor countriesEmissions path for poor countriesFig. 4bFig. 4b
Predicted actual Predicted actual emissions fall emissions fall below caps, by below caps, by permit sales.permit sales.

1717
Price of Carbon Dioxide Price of Carbon Dioxide
Fig. 6bFig. 6b Price of Carbon Permits
0
200
400
600
800
1000
2005 2020 2035 2050 2065 2080 2095
$/tC
O2
e
FRANKELArchitecture
Zoom on Price of Carbon Permits
020406080
100120140160180
2005 2015 2025 2035 2045
$/tC
O2e
FRANKELArchitecture
rises slowly over 50 rises slowly over 50 years, then rapidly.years, then rapidly.

1818
Concentrations stay below 500 ppm goalConcentrations stay below 500 ppm goalFig. 7bFig. 7b
Carbon Concentrations (CO2 only)
300
350
400
450
500
550
600
650
700
750
800
pp
mv
bau
FRANKELArchitecture
Top Related