


Languages
Pages
Legal

ISSN: 0971-1023 | NMIMS Management ReviewVolume XXIX April-May 2016
Abstract
Should a design manager invest more in improving
aesthetics (hedonic benefit) or function (utilitarian
benefit)? The answer depends upon the relative
consumer preference for hedonic attributes over
utilitarian attributes, or vice versa. Therefore, it is
important for designers to understand how customers
choose between competing products with different
levels of hedonic and utilitarian benefits. Choosing a
product from a choice set requires customers to make
tradeoffs between design attributes such as aesthetics
and functionality that make up the product
alternatives. This article introduces an experimental
design methodology to estimate tradeoff exchange
rate between any two product attributes. The
proposed method uses a discrete choice experiment,
combined with point allocation across the alternatives
in the choice set, to measure the preferences of the
respondents. This approach combined with Fieller's
theorem allows us to obtain information on the
respondent's most preferred product alternative as
well as information on his or her relative attribute
preferences.
Keywords: Conjoint analysis; Fieller's theorem;
Hedonic attributes; Utilitarian attributes; Pareto
optimal choice sets.
Aesthetics versus Function:Assessing Relative Customer Preference
Ravindra ChitturiPallavi Chitturi
Aesthetics versus Function: Assessing Relative Customer Preference
Dr. Gurumurthy Kalyanaram: Editor, Professor, and former Dean, Research, NMIMS University.
Dr. Gurumurthy Kalyanaram is currently advising MIT's Asia School of Business. He is a Research Professor at Tata
Institute of Social Sciences, and a practice professor at City University of New York. He is a distinguished academic who
has served as Dean, Director, Advisor and Professor globally including in The University of Texas, International
University of Japan, American University, and Amrita University. Additionally, he has lectured, taught and given
presentations at many universities and conferences all over the world, including Boston University, Jiang Xi University
of Finance, KIMEP, London School of Economics, Massachusetts Institute of Technology, St. Petersburgh State
University, and Vanderbilt University.
Dr. Kalyanaram is a highly-cited scholar, whose research covers management science, education and public policy,
economics and innovation. He serves as a management and policy consultant to many organizations.
Dr. Kalyanaram has been a distinguished scholar at the prestigious Woodrow Wilson Center for International Scholars,
and the East-European and Russian Research Center. He has served on several policy boards, including the Texas
Strategic Economic Development Commission.
Dr. Kalyanaram got his doctoral degree from Massachusetts Institute of Technology, and he has been recognized by
MIT with Harold Lobdell Award. He has also been recognized by several professional organizations for his contributions
to research. Currently, he serves as the President of global MIT South Asian Alumni Association.
Editorial from Dr. Gurumurthy KalyanaramISSN: 0971-1023 | NMIMS Management ReviewVolume XXIX April-May 201610 11
Changes
cities of India, and therefore street
Contents
mall farmers. Majority of the
farmers (82%) borrow less than
Rs 5 lakhs, and 18% borrow
between Rs 5 – 10 lakhs on a
per annum basis. Most farmers
(65.79%) ar
** p < .01 + Reliability coefficie
** p < .01 + Reliability coefficie
References
Table 23: The Results of Mann-Whitney U Test for DOWJONES Index Daily ReturnsDr. Rosy Kalra
Mr. Piyuesh Pandey
ISSN: 0971-1023 | NMIMS Management ReviewVolume XXIX April-May 2016
ISSN: 0971-1023 | NMIMS Management ReviewVolume XXIX April-May 2016
Aesthetics versus Function: Assessing Relative Customer PreferenceAesthetics versus Function: Assessing Relative Customer Preference
INTRODUCTION
Does aesthetics follow function—as is generally
accepted, or does function follow aesthetics? The
answer is not one or the other—it depends upon the
context. Customers struggle with this question every
day. Consumers purchase products to serve a useful
purpose (i.e., solve a problem or alleviate pain) as well
as to enhance experiential pleasure. Often the goals of
serving a useful purpose and increasing pleasure
conflict with each other. A diner may struggle between
fruit or a delicious chocolate cake that comes with
negative health consequences. Sometimes the choice
is between aesthetics and functionality—aesthetics
for pleasure and functionality to serve a useful
purpose. For example, car buyers often have to choose
between an optional safety feature such as 4- wheel
drive (serving a useful purpose) and a panoramic
sunroof (enhancing experiential pleasure). Prior work
involving tradeoffs between hedonic attributes that
increase positive feelings and utilitarian attributes that
reduce negative feelings has shown that depending on
the context, the relative value of hedonic versus
utilitarian attributes can be significantly higher or
lower. Dhar and Wertenbroch (2000) show that
consumers value utilitarian attributes relatively more
in acquisition decisions (buying) and value hedonic
attributes relatively more in forfeiture decisions
(selling). Chitturi (2015a) and Chitturi et al., (2007)
show that relative consumer preference changes as
per the principles of functional and hedonic
dominance in the context of consumer wants and
needs. Therefore, in order to enhance sales, it is
important for designers and marketers to be able to
assess relative consumer preference between any two
determinant attributes requiring tradeoffs at the time
of purchase; for example, assessing relative customer
preference between hedonic (aesthetics) and
utilitarian (function) attributes. In this research, we
develop an experimental design methodology to
collect data and apply Fieller's theorem to estimate
relative customer preference between product
aesthetics and product functionality. In the next
section, we review the literature on relative
preference assessment. This is followed by a
d i s c u s s i o n o f t h e p ro p o s e d m et h o d o l o g y,
experimental design, and conceptual model. The
paper concludes with data collection, data analysis,
discussion of results, and managerial implications.
Literature Review
Product design benefits can be broadly categorized
along hedonic and utilitarian dimensions (Batra and
Ahtola 1990; Dhar and Wertenbroch 2000; Okada
2005). In recent years, there has been an emphasis on
creating products that look aesthetically pleasing in
addition to being functionally satisfactory. Luce,
B ett m a n , a n d Pay n e ( 2 0 0 1 ) , a n d C h i tt u r i ,
Raghunathan, and Mahajan (2007) demonstrate how
product attribute tradeoffs in general, and those
involving hedonic and utilitarian attributes in
particular, influence consumer choice. However, prior
research does not help designers and marketers in
estimating which incremental investment would lead
to greater customer preference i .e. , would
improvement in hedonic attributes or improvement in
utilitarian attributes lead to greater customer
preference? Answering this research question is
critical to improving Return-on-Investment (ROI).
Therefore, there is a need to develop a methodology
that could help with the estimation of the tradeoff
exchange rate between hedonic and utilitarian
attributes.
Due to budget and time constraints, designers and
managers are often compelled to choose among
various attributes and associated benefits. If there is
no budget or time constraint, then perhaps the best
solution is to maximize on both hedonic and utilitarian
dimensions. However, more often than not, product
designers and managers are forced to make a choice
between selecting one attribute versus the other for a
variety of reasons. In such situations, we believe that
designers and marketing managers would make better
decisions if they are able to estimate the tradeoff
exchange rate between attributes based on relative
customer preference. In the following sections, we
show how Fieller's theorem can be used to find a
confidence interval for the tradeoff exchange rate c.
Conjoint analysis and discrete choice experiments are
among the most widely used methodologies in both
academia and industry for measuring and analyzing
the preferences or choices of respondents. The
contribution by Luce and Tukey (1964) is viewed as the
origin of conjoint analysis. In a conjoint task,
respondents sort, rank or rate a set of profiles. These
profiles are experimentally designed and are
described by multiple factors (attributes) and levels.
The results from conjoint analysis provide insights into
how respondents perceive and evaluate certain
attributes of interest.
Discrete choice experiments are a method related to
conjoint analysis and are often called choice based
conjoint. This method involves the design of profiles
on the basis of attributes specified at certain levels.
However, instead of ranking or rating all profiles, as is
usually done in classic conjoint studies, respondents
are asked to repeatedly choose one alternative from
different sets of profiles offered to them. Probabilistic
choice models such as multinomial logit or probit
models are applied to the choice data arising from such
experiments. An early article describing the
advantages of this approach for conjoint analysis was
by Louviere and Woodworth (1983).
Choice modeling and preference regression are
popular approaches used by researchers to
understand consumer preference formation (Ghose
and Lowengart 2012). Choice models are widely used
when internal and external cues can be identified by
consumers to choose between different types of
brands (Richardson et al., 1994). The preference
regression approach would indicate what internal cues
must be improved to enhance consumer preference
(Olson and Jacoby 1973). In this research, we propose
a method that identifies if the intrinsic attributes of a
product such as aesthetics and functionality
significantly influence consumer preference.
Furthermore, we use perato- optimal design of choice
options with points allocation instead of simple
ranking combined with Fieller's theorem to assess the
most preferred option as well as relative attribute
preference.
The advantage of discrete choice experiments over
classic conjoint analysis is that data collection involves
simulated decisions (or hypothetical choices)
providing a more realistic and simpler task for
respondents than rankings or ratings. In recent years,
this method has become increasingly popular as a way
to more directly study choice behavior (Batsell and
Louviere 1991). Examples of areas in which choice
experiments have been used include environmental
science (Adamowicz, Boxall, and Williams 1998),
health (Propper 1995), marketing (Kamakura and
Srivastava 1984; Johnson and Olberts 1991), tourism
(Haider and Ewing 1990), and design (Chitturi 2015a;
Chitturi 2009). A disadvantage of choice experiments is
that choices are less informative than corresponding
ratings and therefore require large numbers of
observations to obtain reliable estimates. However, if a
12 13
Changes
cities of India, and therefore street
Contents
mall farmers. Majority of the
farmers (82%) borrow less than
Rs 5 lakhs, and 18% borrow
between Rs 5 – 10 lakhs on a
per annum basis. Most farmers
(65.79%) ar
** p < .01 + Reliability coefficie
** p < .01 + Reliability coefficie
References
Table 23: The Results of Mann-Whitney U Test for DOWJONES Index Daily ReturnsDr. Rosy Kalra
Mr. Piyuesh Pandey

ISSN: 0971-1023 | NMIMS Management ReviewVolume XXIX April-May 2016
ISSN: 0971-1023 | NMIMS Management ReviewVolume XXIX April-May 2016
Aesthetics versus Function: Assessing Relative Customer PreferenceAesthetics versus Function: Assessing Relative Customer Preference
INTRODUCTION
Does aesthetics follow function—as is generally
accepted, or does function follow aesthetics? The
answer is not one or the other—it depends upon the
context. Customers struggle with this question every
day. Consumers purchase products to serve a useful
purpose (i.e., solve a problem or alleviate pain) as well
as to enhance experiential pleasure. Often the goals of
serving a useful purpose and increasing pleasure
conflict with each other. A diner may struggle between
fruit or a delicious chocolate cake that comes with
negative health consequences. Sometimes the choice
is between aesthetics and functionality—aesthetics
for pleasure and functionality to serve a useful
purpose. For example, car buyers often have to choose
between an optional safety feature such as 4- wheel
drive (serving a useful purpose) and a panoramic
sunroof (enhancing experiential pleasure). Prior work
involving tradeoffs between hedonic attributes that
increase positive feelings and utilitarian attributes that
reduce negative feelings has shown that depending on
the context, the relative value of hedonic versus
utilitarian attributes can be significantly higher or
lower. Dhar and Wertenbroch (2000) show that
consumers value utilitarian attributes relatively more
in acquisition decisions (buying) and value hedonic
attributes relatively more in forfeiture decisions
(selling). Chitturi (2015a) and Chitturi et al., (2007)
show that relative consumer preference changes as
per the principles of functional and hedonic
dominance in the context of consumer wants and
needs. Therefore, in order to enhance sales, it is
important for designers and marketers to be able to
assess relative consumer preference between any two
determinant attributes requiring tradeoffs at the time
of purchase; for example, assessing relative customer
preference between hedonic (aesthetics) and
utilitarian (function) attributes. In this research, we
develop an experimental design methodology to
collect data and apply Fieller's theorem to estimate
relative customer preference between product
aesthetics and product functionality. In the next
section, we review the literature on relative
preference assessment. This is followed by a
d i s c u s s i o n o f t h e p ro p o s e d m et h o d o l o g y,
experimental design, and conceptual model. The
paper concludes with data collection, data analysis,
discussion of results, and managerial implications.
Literature Review
Product design benefits can be broadly categorized
along hedonic and utilitarian dimensions (Batra and
Ahtola 1990; Dhar and Wertenbroch 2000; Okada
2005). In recent years, there has been an emphasis on
creating products that look aesthetically pleasing in
addition to being functionally satisfactory. Luce,
B ett m a n , a n d Pay n e ( 2 0 0 1 ) , a n d C h i tt u r i ,
Raghunathan, and Mahajan (2007) demonstrate how
product attribute tradeoffs in general, and those
involving hedonic and utilitarian attributes in
particular, influence consumer choice. However, prior
research does not help designers and marketers in
estimating which incremental investment would lead
to greater customer preference i .e. , would
improvement in hedonic attributes or improvement in
utilitarian attributes lead to greater customer
preference? Answering this research question is
critical to improving Return-on-Investment (ROI).
Therefore, there is a need to develop a methodology
that could help with the estimation of the tradeoff
exchange rate between hedonic and utilitarian
attributes.
Due to budget and time constraints, designers and
managers are often compelled to choose among
various attributes and associated benefits. If there is
no budget or time constraint, then perhaps the best
solution is to maximize on both hedonic and utilitarian
dimensions. However, more often than not, product
designers and managers are forced to make a choice
between selecting one attribute versus the other for a
variety of reasons. In such situations, we believe that
designers and marketing managers would make better
decisions if they are able to estimate the tradeoff
exchange rate between attributes based on relative
customer preference. In the following sections, we
show how Fieller's theorem can be used to find a
confidence interval for the tradeoff exchange rate c.
Conjoint analysis and discrete choice experiments are
among the most widely used methodologies in both
academia and industry for measuring and analyzing
the preferences or choices of respondents. The
contribution by Luce and Tukey (1964) is viewed as the
origin of conjoint analysis. In a conjoint task,
respondents sort, rank or rate a set of profiles. These
profiles are experimentally designed and are
described by multiple factors (attributes) and levels.
The results from conjoint analysis provide insights into
how respondents perceive and evaluate certain
attributes of interest.
Discrete choice experiments are a method related to
conjoint analysis and are often called choice based
conjoint. This method involves the design of profiles
on the basis of attributes specified at certain levels.
However, instead of ranking or rating all profiles, as is
usually done in classic conjoint studies, respondents
are asked to repeatedly choose one alternative from
different sets of profiles offered to them. Probabilistic
choice models such as multinomial logit or probit
models are applied to the choice data arising from such
experiments. An early article describing the
advantages of this approach for conjoint analysis was
by Louviere and Woodworth (1983).
Choice modeling and preference regression are
popular approaches used by researchers to
understand consumer preference formation (Ghose
and Lowengart 2012). Choice models are widely used
when internal and external cues can be identified by
consumers to choose between different types of
brands (Richardson et al., 1994). The preference
regression approach would indicate what internal cues
must be improved to enhance consumer preference
(Olson and Jacoby 1973). In this research, we propose
a method that identifies if the intrinsic attributes of a
product such as aesthetics and functionality
significantly influence consumer preference.
Furthermore, we use perato- optimal design of choice
options with points allocation instead of simple
ranking combined with Fieller's theorem to assess the
most preferred option as well as relative attribute
preference.
The advantage of discrete choice experiments over
classic conjoint analysis is that data collection involves
simulated decisions (or hypothetical choices)
providing a more realistic and simpler task for
respondents than rankings or ratings. In recent years,
this method has become increasingly popular as a way
to more directly study choice behavior (Batsell and
Louviere 1991). Examples of areas in which choice
experiments have been used include environmental
science (Adamowicz, Boxall, and Williams 1998),
health (Propper 1995), marketing (Kamakura and
Srivastava 1984; Johnson and Olberts 1991), tourism
(Haider and Ewing 1990), and design (Chitturi 2015a;
Chitturi 2009). A disadvantage of choice experiments is
that choices are less informative than corresponding
ratings and therefore require large numbers of
observations to obtain reliable estimates. However, if a
12 13
Changes
cities of India, and therefore street
Contents
mall farmers. Majority of the
farmers (82%) borrow less than
Rs 5 lakhs, and 18% borrow
between Rs 5 – 10 lakhs on a
per annum basis. Most farmers
(65.79%) ar
** p < .01 + Reliability coefficie
** p < .01 + Reliability coefficie
References
Table 23: The Results of Mann-Whitney U Test for DOWJONES Index Daily ReturnsDr. Rosy Kalra
Mr. Piyuesh Pandey
subject is asked to allocate (say) 100 points across the
alternatives in a choice set so as to reflect their
preferences, we can obtain information on his or her
most preferred alternative as well as information on
his or her relative preferences. Using this approach, we
combine the benefits of the discrete choice method
and the classical conjoint method to estimate the
tradeoff exchange rate between hedonic and
utilitarian design attributes.
Proposed Methodology: Pareto-optimal
Design
To study consumers' relative preference for the
hedonic and utilitarian attributes of a product, we
consider three levels of both the hedonic and
utilitarian dimension: low (-1), medium (0) and high
(1). If we present a choice set with the profiles {11, 10,
01}, the first profile dominates the others and the
respondent's choice is trivially made. Similarly, if we
present a choice set with the profiles {00, 10, 01}, the
first profile is dominated and will not be selected. For
this reason, choice sets given to a respondent should
have no dominating or dominated profiles. Choice sets
with no dominating or dominated profiles are called
Pareto optimal subsets. Wiley (1978) recognized the
need for Pareto optimal choice sets in choice
experiments. Raghavarao and Wiley (1998) and
Raghavarao and Zhang (2002) gave further results on
Pareto optimal sets in choice experiments.
Although experiments with choice sets of the same
size are more common, studies involving choice sets of
varying sizes have also been applied to study choice
behavior with pareto-optimal designs (Koelemeijer
and Oppewal 1999). Two Pareto optimal choice sets 2 for estimating the main effects of a 3 design are {-11,
00, 1-1} and {01, 10}. Selected respondents are
randomly divided into two groups. Each group is then
presented with one of the above two choice sets and
respondents are asked to allocate points across the
alternatives so as to reflect their preferences. Since the
above two choice sets have no dominating or
dominated profiles, different respondents will make
different allocations and we can gain an insight into the
importance of hedonic and utilitarian attributes.
This approach to decision making assumes that
consumers are able to determine which alternative in
a choice set provides the highest overall value. The
assumption of “preference ordering” implies that
consumers have a clear preference ranking between
any set of options such that it allows them to know
whether one alternative is at least as good as another.
In practice, subjects may arrive at decisions not with
clearly ranked preferences, but rather, as a result of
being forced to choose. Also, if a respondent does not
have a “most preferred” alternative, it may result in
indecision and a tendency to avoid commitment.
Therefore, respondents are also presented with a 'no-
choice' option within each choice set. Respondents
may choose the 'no-choice' option when none of the
alternatives appears attractive, or when the decision
maker expects to find better alternatives by continuing
to search (Dhar 1997). This leads to two Pareto-
optimal choice sets used in this research: (-11, 00, 1-1,
No-choice), and (01, 10, No-choice).
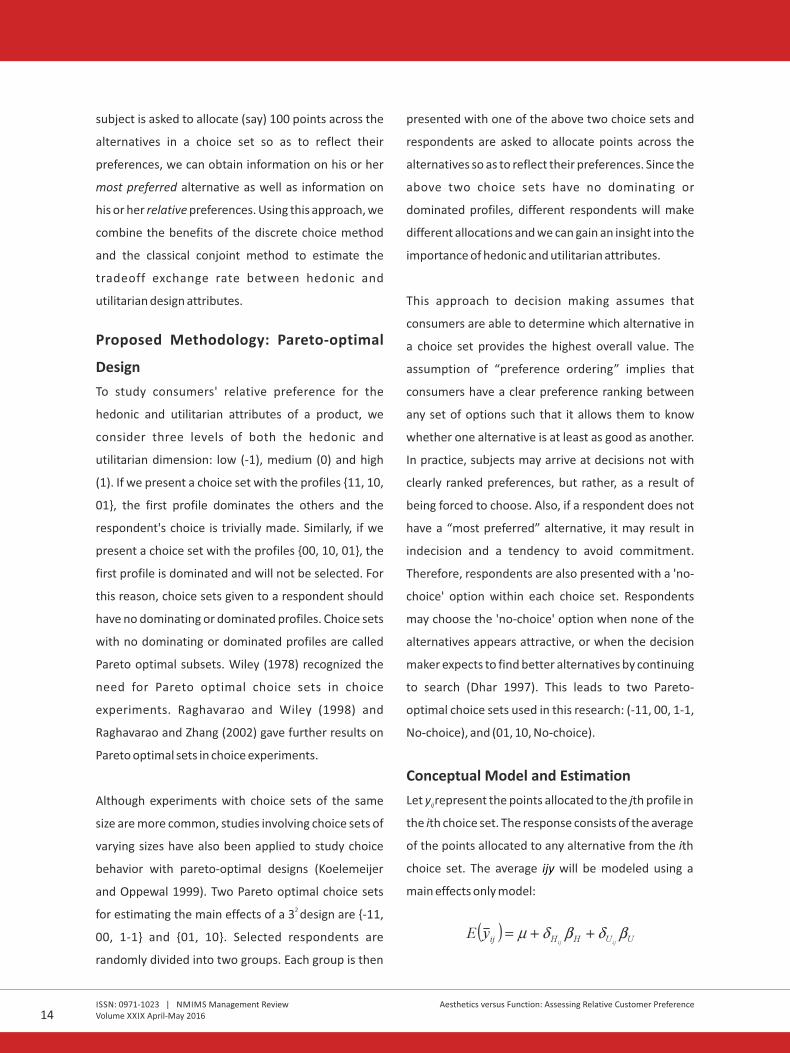
Conceptual Model and Estimation
Let y represent the points allocated to the jth profile in ij
the ith choice set. The response consists of the average
of the points allocated to any alternative from the ith
choice set. The average will be modeled using a ijy
main effects only model:
where is the general mean; , are unknown parameters, and , are defined as follows: Hb Ub ijHd ijUd
dH ij = 1, if the hedonic attribute is at its high level in the jth profile of the ith choice set
= 0, if the hedonic attribute is at its medium level in the jth profile of the ith choice set
= -1, if the hedonic attribute is at its low level in the jth profile of the ith choice set
dUij = 1, if the utilitarian attribute is at its high level in the jth profile of the ith choice set
= 0, if the utilitarian attribute is at its medium level in the jth profile of the ith choice set
= -1, if the utilitarian attribute is at its low level in the jth profile of the ith choice set
ISSN: 0971-1023 | NMIMS Management ReviewVolume XXIX April-May 2016
ISSN: 0971-1023 | NMIMS Management ReviewVolume XXIX April-May 2016
Aesthetics versus Function: Assessing Relative Customer PreferenceAesthetics versus Function: Assessing Relative Customer Preference
14 15
Changes
cities of India, and therefore street
Contents
mall farmers. Majority of the
farmers (82%) borrow less than
Rs 5 lakhs, and 18% borrow
between Rs 5 – 10 lakhs on a
per annum basis. Most farmers
(65.79%) ar
** p < .01 + Reliability coefficie
** p < .01 + Reliability coefficie
References
Table 23: The Results of Mann-Whitney U Test for DOWJONES Index Daily ReturnsDr. Rosy Kalra
Mr. Piyuesh Pandey
subject is asked to allocate (say) 100 points across the
alternatives in a choice set so as to reflect their
preferences, we can obtain information on his or her
most preferred alternative as well as information on
his or her relative preferences. Using this approach, we
combine the benefits of the discrete choice method
and the classical conjoint method to estimate the
tradeoff exchange rate between hedonic and
utilitarian design attributes.
Proposed Methodology: Pareto-optimal
Design
To study consumers' relative preference for the
hedonic and utilitarian attributes of a product, we
consider three levels of both the hedonic and
utilitarian dimension: low (-1), medium (0) and high
(1). If we present a choice set with the profiles {11, 10,
01}, the first profile dominates the others and the
respondent's choice is trivially made. Similarly, if we
present a choice set with the profiles {00, 10, 01}, the
first profile is dominated and will not be selected. For
this reason, choice sets given to a respondent should
have no dominating or dominated profiles. Choice sets
with no dominating or dominated profiles are called
Pareto optimal subsets. Wiley (1978) recognized the
need for Pareto optimal choice sets in choice
experiments. Raghavarao and Wiley (1998) and
Raghavarao and Zhang (2002) gave further results on
Pareto optimal sets in choice experiments.
Although experiments with choice sets of the same
size are more common, studies involving choice sets of
varying sizes have also been applied to study choice
behavior with pareto-optimal designs (Koelemeijer
and Oppewal 1999). Two Pareto optimal choice sets 2 for estimating the main effects of a 3 design are {-11,
00, 1-1} and {01, 10}. Selected respondents are
randomly divided into two groups. Each group is then
presented with one of the above two choice sets and
respondents are asked to allocate points across the
alternatives so as to reflect their preferences. Since the
above two choice sets have no dominating or
dominated profiles, different respondents will make
different allocations and we can gain an insight into the
importance of hedonic and utilitarian attributes.
This approach to decision making assumes that
consumers are able to determine which alternative in
a choice set provides the highest overall value. The
assumption of “preference ordering” implies that
consumers have a clear preference ranking between
any set of options such that it allows them to know
whether one alternative is at least as good as another.
In practice, subjects may arrive at decisions not with
clearly ranked preferences, but rather, as a result of
being forced to choose. Also, if a respondent does not
have a “most preferred” alternative, it may result in
indecision and a tendency to avoid commitment.
Therefore, respondents are also presented with a 'no-
choice' option within each choice set. Respondents
may choose the 'no-choice' option when none of the
alternatives appears attractive, or when the decision
maker expects to find better alternatives by continuing
to search (Dhar 1997). This leads to two Pareto-
optimal choice sets used in this research: (-11, 00, 1-1,
No-choice), and (01, 10, No-choice).
Conceptual Model and Estimation
Let y represent the points allocated to the jth profile in ij
the ith choice set. The response consists of the average
of the points allocated to any alternative from the ith
choice set. The average will be modeled using a ijy
main effects only model:
where is the general mean; , are unknown parameters, and , are defined as follows: Hb Ub ijHd ijUd
dH ij = 1, if the hedonic attribute is at its high level in the jth profile of the ith choice set
= 0, if the hedonic attribute is at its medium level in the jth profile of the ith choice set
= -1, if the hedonic attribute is at its low level in the jth profile of the ith choice set
dUij = 1, if the utilitarian attribute is at its high level in the jth profile of the ith choice set
= 0, if the utilitarian attribute is at its medium level in the jth profile of the ith choice set
= -1, if the utilitarian attribute is at its low level in the jth profile of the ith choice set
ISSN: 0971-1023 | NMIMS Management ReviewVolume XXIX April-May 2016
ISSN: 0971-1023 | NMIMS Management ReviewVolume XXIX April-May 2016
Aesthetics versus Function: Assessing Relative Customer PreferenceAesthetics versus Function: Assessing Relative Customer Preference
14 15
Changes
cities of India, and therefore street
Contents
mall farmers. Majority of the
farmers (82%) borrow less than
Rs 5 lakhs, and 18% borrow
between Rs 5 – 10 lakhs on a
per annum basis. Most farmers
(65.79%) ar
** p < .01 + Reliability coefficie
** p < .01 + Reliability coefficie
References
Table 23: The Results of Mann-Whitney U Test for DOWJONES Index Daily ReturnsDr. Rosy Kalra
Mr. Piyuesh Pandey
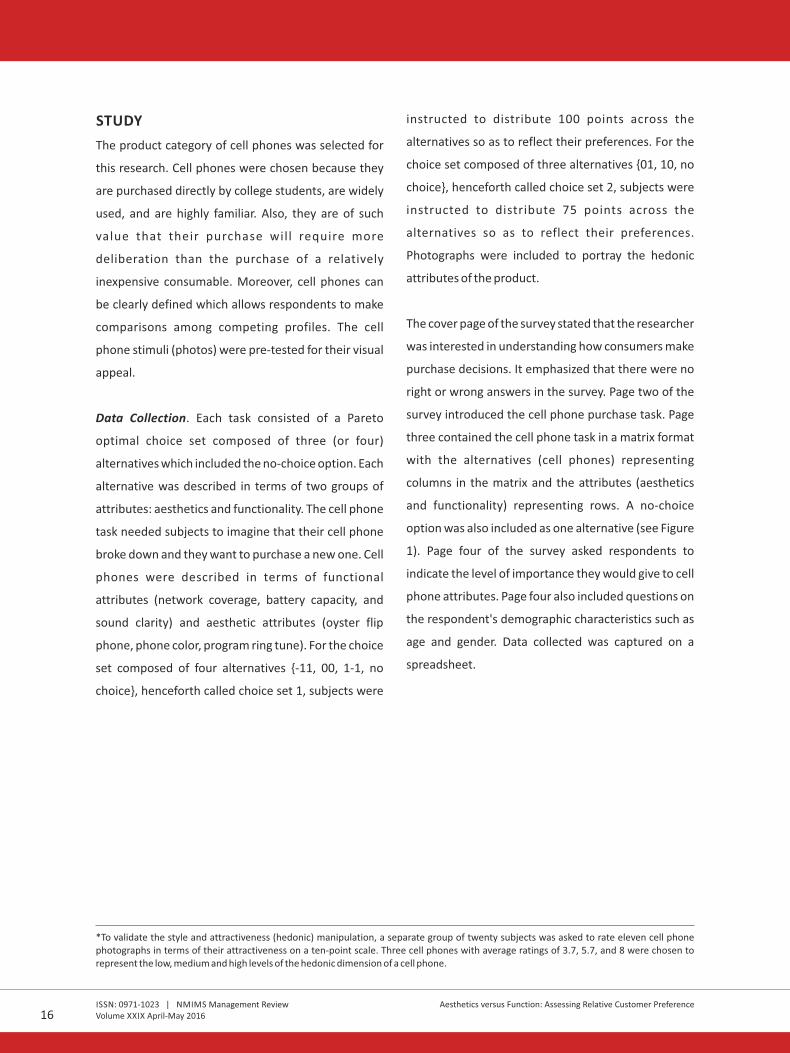
STUDY
The product category of cell phones was selected for
this research. Cell phones were chosen because they
are purchased directly by college students, are widely
used, and are highly familiar. Also, they are of such
value that their purchase will require more
deliberation than the purchase of a relatively
inexpensive consumable. Moreover, cell phones can
be clearly defined which allows respondents to make
comparisons among competing profiles. The cell
phone stimuli (photos) were pre-tested for their visual
appeal.
Data Collection. Each task consisted of a Pareto
optimal choice set composed of three (or four)
alternatives which included the no-choice option. Each
alternative was described in terms of two groups of
attributes: aesthetics and functionality. The cell phone
task needed subjects to imagine that their cell phone
broke down and they want to purchase a new one. Cell
phones were described in terms of functional
attributes (network coverage, battery capacity, and
sound clarity) and aesthetic attributes (oyster flip
phone, phone color, program ring tune). For the choice
set composed of four alternatives {-11, 00, 1-1, no
choice}, henceforth called choice set 1, subjects were
instructed to distribute 100 points across the
alternatives so as to reflect their preferences. For the
choice set composed of three alternatives {01, 10, no
choice}, henceforth called choice set 2, subjects were
instructed to distribute 75 points across the
alternatives so as to reflect their preferences.
Photographs were included to portray the hedonic
attributes of the product.
The cover page of the survey stated that the researcher
was interested in understanding how consumers make
purchase decisions. It emphasized that there were no
right or wrong answers in the survey. Page two of the
survey introduced the cell phone purchase task. Page
three contained the cell phone task in a matrix format
with the alternatives (cell phones) representing
columns in the matrix and the attributes (aesthetics
and functionality) representing rows. A no-choice
option was also included as one alternative (see Figure
1). Page four of the survey asked respondents to
indicate the level of importance they would give to cell
phone attributes. Page four also included questions on
the respondent's demographic characteristics such as
age and gender. Data collected was captured on a
spreadsheet.
*To validate the style and attractiveness (hedonic) manipulation, a separate group of twenty subjects was asked to rate eleven cell phone photographs in terms of their attractiveness on a ten-point scale. Three cell phones with average ratings of 3.7, 5.7, and 8 were chosen to represent the low, medium and high levels of the hedonic dimension of a cell phone.
FIGURE 1EXAMPLE OF CELL PHONE TASK
Cell phone A Cell phone B Cell phone C No Cell Phone
Functionality
Network Coverage: 98%
Battery Capacity : 3 days
Sound Clarity : very high
Style & Attractiveness* Oyster flip phone : No Change phone colors: No Program ring tune : No
Functionality
Network Coverage: 95%
Battery Capacity : 2 days
Sound Clarity : high
Style & Attractiveness* Oyster flip phone : No Change phone colors: No Program ring tune : Yes
Functionality
Network Coverage: 92%
Battery Capacity : 1 day
Sound Clarity :medium
Style & Attractiveness* Oyster flip phone : Yes Change phone colors: Yes Program ring tune : Yes
Choose not to
buy a cell phone
Points: __________ Points: ___________ Points: __________ Points:_________
*All brand symbols were removed from the cell phone pictures in the paper questionnaire.
CELL-PHONE A CELL-PHONE B CELL-PHONE C
Results. Forty two subjects completed the survey of which 21 were presented choice set 1 with four alternatives {-
11, 00, 1-1, no choice}, and 21 were presented choice set 2 with three alternatives {01, 10, no choice}. The average
points allocated to each alternative are given in Table 1 and Table 2.
Table 1. Average points allocated to each alternative in Choice Set 1.
Choice Set 1 (Number of Subjects = 21) ij
High functionality Low hedonics 32.00
Medium functionality Medium hedonics 29.90
Low functionality High hedonics 28.95
No choice
9.15
y
ISSN: 0971-1023 | NMIMS Management ReviewVolume XXIX April-May 2016
ISSN: 0971-1023 | NMIMS Management ReviewVolume XXIX April-May 2016
Aesthetics versus Function: Assessing Relative Customer PreferenceAesthetics versus Function: Assessing Relative Customer Preference
16 17
Changes
cities of India, and therefore street
Contents
mall farmers. Majority of the
farmers (82%) borrow less than
Rs 5 lakhs, and 18% borrow
between Rs 5 – 10 lakhs on a
per annum basis. Most farmers
(65.79%) ar
** p < .01 + Reliability coefficie
** p < .01 + Reliability coefficie
References
Table 23: The Results of Mann-Whitney U Test for DOWJONES Index Daily ReturnsDr. Rosy Kalra
Mr. Piyuesh Pandey

Table 2. Average points allocated to each alternative in Choice Set 2
Choice Set 2 (Number of Subjects = 21)
High functionality Medium hedonics 31.62
Medium functionality High hedonics 38.48
No choice 4.90
ij y
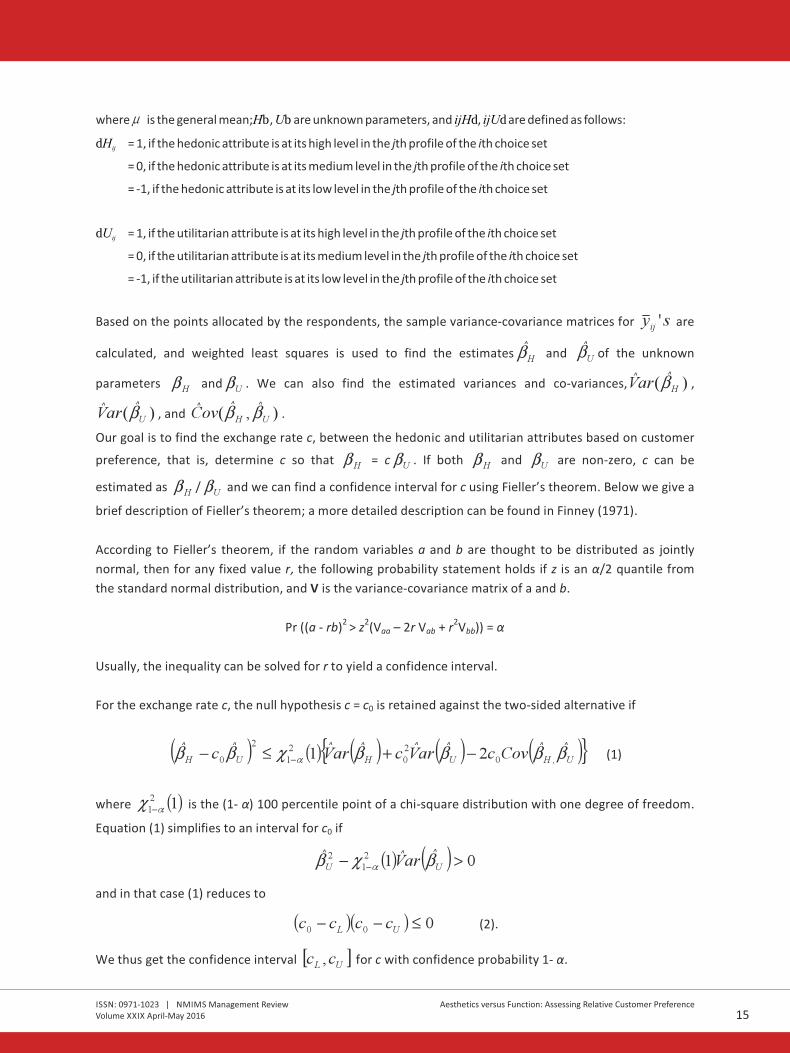
Based on the points allocated, the sample variance-
covariance matrices were calculated, and weighted
least squares was used to estimate the main effects of
functional and aesthetic benefits. Both the functional
effect (Z = 2.99, p = 0) and the aesthetic effect (Z = 2.84,
p = 0) are significant in this study. As predicted, both
the aesthetics and the functional dimensions of a cell
phone are salient and significantly influence customer
preference. It also shows that cell phones are not a
purely functional device and customers value both the
aesthetics and functional benefits offered by cell
phones.
We obtain the following estimates:
As stated above, both the functional effect (Z = 2.99, p
= 0) and the aesthetics effect (Z = 2.84, p = 0) are
significant. Substituting the above estimates in (1) we
get the following confidence interval for c: (0.220245,
4.441052).
GENERAL DISCUSSION
What is the role of different types and levels of
attributes in the formation of customer preference?
Does attribute tradeoff involving aesthetics and
functional attributes alter consumer preference for a
product? These are some of the questions that have
been explored in prior research. However, prior work
on consumer tradeoffs involving aesthetics and
functional attributes has shown that consumer
preference between aesthetics and function is
dictated by the principles of functional and hedonic
dominance (Chitturi 2015a; Chitturi 2015b; Chitturi et
al., 2007). For example, a designer would like to design
aesthetic and functional benefits into a product to
maximize consumer preference because consumer
preference between aesthetics and function varies
depending upon their minimum functional needs. On
the other hand, a marketing manager would like to
price a product to leverage greater willingness-to-pay
for aesthetic benefits over functional benefits based
on the principle of hedonic dominance (Chitturi et al.,
2007). Therefore, it is important for designers and
marketers to be able to assess relative preference
between hedonic versus utilitarian benefits offered by
the product. This article introduces an experimental
design methodology to estimate the tradeoff
exchange rate between any two product attributes.
The proposed method uses a discrete choice
experiment, combined with point allocation across the
alternatives in the choice set, to measure preferences
of the respondents. This approach combined with
Fieller's theorem allows us to obtain information on
the respondent's most preferred product alternative
as well as information on his or her relative attribute
preferences.
Why does Consumer Preference Alter between
Aesthetics Versus Function?
Consistent with the principle of functional
precedence, customers are more likely to choose a
more utilitarian product over a more hedonic product
(Chitturi, Raghunathan, and Mahajan 2007), unless
they are able to justify their desire for hedonic
consumption (Okada 2005). In the absence of a valid
justification, the negative feelings of guilt and anxiety
prevent them from choosing a more hedonic product
over a more utilitarian one (Chitturi, Raghunathan,
and Mahajan 2007). In addition, customers feel
uncertain about functional performance when they
contemplate choosing an aesthetically superior
product that is also functionally inferior. This
anticipatory feeling of anxiety results from concerns
about the ability of the functionally inferior product to
meet the minimum utilitarian needs of the customer
(Chitturi, Raghunathan, and Mahajan 2007).
Collectively, the feelings of guilt and anxiety
discourage customers from choosing a hedonically
superior product in the absence of a justification for
hedonic consumption (Okada 2005). Under such
circumstances, the utilitarian benefits offered by a
product have greater influence on customer
preference compared to hedonic benefits.
It has been shown that higher levels of functional
attributes lead to greater customer confidence in the
ability of the product to meet the customers' minimum
utilitarian needs. As the confidence associated with
the utilitarian performance of the product goes up, the
a s s o c i ate d a nx i et y co m e s d ow n ( C h i tt u r i ,
Raghunathan, and Mahajan 2007). Reduced anxiety
with utilitarian performance leads to greater customer
focus on hedonic benefits and lesser focus on
utilitarian benefits—i.e., customers give greater
importance to hedonic benefits over utilitarian
benefits. Furthermore, reduced anxiety and increased
confidence offer valid justification to give greater
importance to hedonic consumption due to its
improved self-expressive benefits as per the principle
of hedonic dominance (Chitturi et al., 2007)).
Managerial Implications
All products offer benefits that can be categorized into
two types—hedonic and utilitarian (Batra and Ahtola
1990; Dhar and Wertenbroch 2000; Okada 2005). As a
result, product designers need to be cognizant of the
attributes they design into a product and how these
attributes contribute to the hedonic and utilitarian
benefit dimensions. Depending upon the cost of
designing a set of attributes for a product, the
designers would like the product to be priced so as to
at least recover the cost of developing the product.
However, marketing managers have to price the
product based on the benefits it offers and the changes
in the relative consumer preference between hedonic
and functional attributes offered by the product. They
are looking to maximize sales and profit.
Understanding how customers choose between
competing products that offer different levels of
various attributes is critical to effective product design
decisions. In this article, we use a methodology that
combines a discrete choice approach with conjoint
analysis. This approach allows us to combine ranking
as well as rating information with small sample sizes.
The paper uses Fieller's theorem to estimate the
tradeoff exchange rate between the aesthetic and
functional benefits offered by the competing products
in a choice set. In this paper, we show how the
proposed discrete choice experimental design
combined with Fieller's theorem can estimate the
relative preference between any two determinant
attributes that influence purchase decisions. As an
ISSN: 0971-1023 | NMIMS Management ReviewVolume XXIX April-May 2016
ISSN: 0971-1023 | NMIMS Management ReviewVolume XXIX April-May 2016
Aesthetics versus Function: Assessing Relative Customer PreferenceAesthetics versus Function: Assessing Relative Customer Preference
18 19
Changes
cities of India, and therefore street
Contents
mall farmers. Majority of the
farmers (82%) borrow less than
Rs 5 lakhs, and 18% borrow
between Rs 5 – 10 lakhs on a
per annum basis. Most farmers
(65.79%) ar
** p < .01 + Reliability coefficie
** p < .01 + Reliability coefficie
References
Table 23: The Results of Mann-Whitney U Test for DOWJONES Index Daily ReturnsDr. Rosy Kalra
Mr. Piyuesh Pandey
Table 2. Average points allocated to each alternative in Choice Set 2
Choice Set 2 (Number of Subjects = 21)
High functionality Medium hedonics 31.62
Medium functionality High hedonics 38.48
No choice 4.90
ij y
Based on the points allocated, the sample variance-
covariance matrices were calculated, and weighted
least squares was used to estimate the main effects of
functional and aesthetic benefits. Both the functional
effect (Z = 2.99, p = 0) and the aesthetic effect (Z = 2.84,
p = 0) are significant in this study. As predicted, both
the aesthetics and the functional dimensions of a cell
phone are salient and significantly influence customer
preference. It also shows that cell phones are not a
purely functional device and customers value both the
aesthetics and functional benefits offered by cell
phones.
We obtain the following estimates:
As stated above, both the functional effect (Z = 2.99, p
= 0) and the aesthetics effect (Z = 2.84, p = 0) are
significant. Substituting the above estimates in (1) we
get the following confidence interval for c: (0.220245,
4.441052).
GENERAL DISCUSSION
What is the role of different types and levels of
attributes in the formation of customer preference?
Does attribute tradeoff involving aesthetics and
functional attributes alter consumer preference for a
product? These are some of the questions that have
been explored in prior research. However, prior work
on consumer tradeoffs involving aesthetics and
functional attributes has shown that consumer
preference between aesthetics and function is
dictated by the principles of functional and hedonic
dominance (Chitturi 2015a; Chitturi 2015b; Chitturi et
al., 2007). For example, a designer would like to design
aesthetic and functional benefits into a product to
maximize consumer preference because consumer
preference between aesthetics and function varies
depending upon their minimum functional needs. On
the other hand, a marketing manager would like to
price a product to leverage greater willingness-to-pay
for aesthetic benefits over functional benefits based
on the principle of hedonic dominance (Chitturi et al.,
2007). Therefore, it is important for designers and
marketers to be able to assess relative preference
between hedonic versus utilitarian benefits offered by
the product. This article introduces an experimental
design methodology to estimate the tradeoff
exchange rate between any two product attributes.
The proposed method uses a discrete choice
experiment, combined with point allocation across the
alternatives in the choice set, to measure preferences
of the respondents. This approach combined with
Fieller's theorem allows us to obtain information on
the respondent's most preferred product alternative
as well as information on his or her relative attribute
preferences.
Why does Consumer Preference Alter between
Aesthetics Versus Function?
Consistent with the principle of functional
precedence, customers are more likely to choose a
more utilitarian product over a more hedonic product
(Chitturi, Raghunathan, and Mahajan 2007), unless
they are able to justify their desire for hedonic
consumption (Okada 2005). In the absence of a valid
justification, the negative feelings of guilt and anxiety
prevent them from choosing a more hedonic product
over a more utilitarian one (Chitturi, Raghunathan,
and Mahajan 2007). In addition, customers feel
uncertain about functional performance when they
contemplate choosing an aesthetically superior
product that is also functionally inferior. This
anticipatory feeling of anxiety results from concerns
about the ability of the functionally inferior product to
meet the minimum utilitarian needs of the customer
(Chitturi, Raghunathan, and Mahajan 2007).
Collectively, the feelings of guilt and anxiety
discourage customers from choosing a hedonically
superior product in the absence of a justification for
hedonic consumption (Okada 2005). Under such
circumstances, the utilitarian benefits offered by a
product have greater influence on customer
preference compared to hedonic benefits.
It has been shown that higher levels of functional
attributes lead to greater customer confidence in the
ability of the product to meet the customers' minimum
utilitarian needs. As the confidence associated with
the utilitarian performance of the product goes up, the
a s s o c i ate d a nx i et y co m e s d ow n ( C h i tt u r i ,
Raghunathan, and Mahajan 2007). Reduced anxiety
with utilitarian performance leads to greater customer
focus on hedonic benefits and lesser focus on
utilitarian benefits—i.e., customers give greater
importance to hedonic benefits over utilitarian
benefits. Furthermore, reduced anxiety and increased
confidence offer valid justification to give greater
importance to hedonic consumption due to its
improved self-expressive benefits as per the principle
of hedonic dominance (Chitturi et al., 2007)).
Managerial Implications
All products offer benefits that can be categorized into
two types—hedonic and utilitarian (Batra and Ahtola
1990; Dhar and Wertenbroch 2000; Okada 2005). As a
result, product designers need to be cognizant of the
attributes they design into a product and how these
attributes contribute to the hedonic and utilitarian
benefit dimensions. Depending upon the cost of
designing a set of attributes for a product, the
designers would like the product to be priced so as to
at least recover the cost of developing the product.
However, marketing managers have to price the
product based on the benefits it offers and the changes
in the relative consumer preference between hedonic
and functional attributes offered by the product. They
are looking to maximize sales and profit.
Understanding how customers choose between
competing products that offer different levels of
various attributes is critical to effective product design
decisions. In this article, we use a methodology that
combines a discrete choice approach with conjoint
analysis. This approach allows us to combine ranking
as well as rating information with small sample sizes.
The paper uses Fieller's theorem to estimate the
tradeoff exchange rate between the aesthetic and
functional benefits offered by the competing products
in a choice set. In this paper, we show how the
proposed discrete choice experimental design
combined with Fieller's theorem can estimate the
relative preference between any two determinant
attributes that influence purchase decisions. As an
ISSN: 0971-1023 | NMIMS Management ReviewVolume XXIX April-May 2016
ISSN: 0971-1023 | NMIMS Management ReviewVolume XXIX April-May 2016
Aesthetics versus Function: Assessing Relative Customer PreferenceAesthetics versus Function: Assessing Relative Customer Preference
18 19
Changes
cities of India, and therefore street
Contents
mall farmers. Majority of the
farmers (82%) borrow less than
Rs 5 lakhs, and 18% borrow
between Rs 5 – 10 lakhs on a
per annum basis. Most farmers
(65.79%) ar
** p < .01 + Reliability coefficie
** p < .01 + Reliability coefficie
References
Table 23: The Results of Mann-Whitney U Test for DOWJONES Index Daily ReturnsDr. Rosy Kalra
Mr. Piyuesh Pandey

example, we test the proposed methodology to
estimate relative customer preference between
aesthetics and functionality for the category of cell
phones. The same methodology can be replicated for
any other two attributes of a product in any product
category.
How does the knowledge of relative customer
preference between any two attributes under
consideration by design engineers and managers
benefit the product development team? A clear and
precise understanding of relative customer preference
between determinant attributes is critical to
optimizing product design leading to a greater
• Adamowicz, W. P., Boxall, M., and Williams, M. (1998). Stated Preference Approaches for Measuring Passive
Use Values: Choice Experiments versus Contingent Valuation, American Journal of Agricultural Economics, 80,
64-75.
• Batra, R., and Ahtola, O. T. (1990). Measuring the Hedonic and Utilitarian Sources of Consumer Attitudes,
Marketing Letters, 2:2, 159-170.
• Batsell, R. R., and Louviere, J. L. (1991). Experimental Choice Analysis, Marketing Letters, 2, 199-214.
• Chitturi, R. (2015a). Design for Affect: A Core Competency for the 21st Century, GfK-Marketing Intelligence
Review, Fall 2015.
• Chitturi, R. (2015b), “Good Aesthetics is Great Business: Do We Know Why?” in The Psychology of Design:
Creating Consumer Appeal, Rajeev Batra, Colleen M. Seifert, and Diann E. Brei, eds. Routledge: Taylor &
Francis Group, Pages 252-262, (September 2015). Based on the invited papers presented at the Psychology of
Design conference at the University of Michigan at Ann Arbor.
• Chitturi, R. (2009). Emotions by design: A consumer perspective. International Journal of Design, 3(2), 7-17.
• Chitturi, R., Raghunathan, R., and Mahajan, V. (2007). Form Versus Function: How the Intensities of Specific
Emotions Evoked in Functional Versus Hedonic Tradeoffs Mediate Product Preferences, Journal of Marketing
Research, 44, 702 - 714.
• Dhar, R. (1997). Consumer Preference for a No-Choice Option, Journal of Consumer Research, 24, 215-231.
• Dhar, R., and Wertenbroch, K. (2000). Consumer Choice Between Hedonic and Utilitarian Goods, Journal of
Marketing Research, 37 (1), 60 – 71.
probability of new product success. Knowledge of a
tradeoff exchange rate allows designers and marketers
to calibrate the relative change in customer preference
obtained by enhancing the level of a product attribute
involved in the tradeoff vis-à-vis the other attribute.
This relative difference in customer preference when
combined with the cost of enhancing these attributes
gives design and marketing managers a basis for
pricing the product. Collectively, the information
allows designers to make optimal attribute selection
decisions, and allows marketing managers to more
accurately manage return on investment (ROI)
associated with a product development project.
References
• Finney, D. J. (1971). Probit Analysis, Cambridge: Cambridge University Press.
• Ghose, S. and Lowengart, O. (2012). Consumer Choice and Preference for Brand Categories, Journal of
Marketing Analytics Vol. 1, 1, 3–17.
• Haider, W., and Ewing, G.O. (1990). A Model of Tourist Choices of Hypothetical Caribbean Destination, Leisure
Sciences, 12, 33-47.
• Johnson, R. M., and Olberts, K. A. (1991). Using Conjoint Analysis in Pricing Studies: Is One Price Variable
Enough? American Marketing Association Advanced Research Techniques Forum Conference Proceedings,
164-173.
• Kamakura, W. A., and Srivastava, R. K. (1984). Predicting Choice Shares Under Conditions of Brand
Interdependence, Journal of Marketing Research, 21, 420-434.
• Koelemeijer, K., and Oppewal, H. (1999). Assessing the Effect of Assortment and Ambience: a Choice
Experimental Approach, Journal of Retailing, 75(3), 319-345.
• Louviere, J. L., and Woodworth, G. (1983). Design and Analysis of Simulated Consumer Choice of Allocation
Experiments: A Method Based on Aggregate Data, Journal of Marketing Research, 20, 350-67.
• Luce, M. F., Bettman, J. R., and Payne, J. W. (2001). Emotional Decisions, in Monographs of the Journal of
Consumer Research, 1, ed. D. R. John, University of Chicago Press, Chicago, IL.
• Luce, R., and Tukey, J. W. (1964). Simultaneous Conjoint Measurement: A New Type of Fundamental
Measurement, Journal of Mathematical Psychology, 1, 1-27.
• Okada, E. M. (2005). Justification Effects on Consumer Choice of Hedonic and Utilitarian Goods, Journal of
Marketing Research, 42 (1), 43 – 53.
• Olson, J. and Jacoby, J. (1973). Cue utilization in the quality perception process. In: M. Venkatesan (ed.) rdProceedings 3 Annual Conference. Chicago, IL: Association of Consumer Research, pp. 167–179.
• Propper, C. (1995). The Disutility of Time Spent on the United Kingdom's National Health Service Waiting Lists,
Journal of Human Resources, 30, 677-700.
• Raghavarao, D., and Wiley, J. B., (1998). Estimating Main Effects with Pareto Optimal Subsets, Australian
Journal of Statistics, 40(4), 425-432.
n• Raghavarao, D., and Zhang, D. (2002). 2 Behavioral Experiments Using Pareto Optimal Choice Sets, Statistica
Sinica, 12, 1085-1092.
• Richardson, P.S., Dick, A.S. and Jain, A.K. (1994). Extrinsic and intrinsic cue effects on perceptions of store
brand quality. Journal of Marketing 48(4): 29–36.
• Wiley, J. B. (1978). Selecting Pareto optimal subsets from multi-attribute alternatives, in Advances in
Consumer Research, V, ed. K. Hunt, Chicago, IL pp. 171-174.
ISSN: 0971-1023 | NMIMS Management ReviewVolume XXIX April-May 2016
ISSN: 0971-1023 | NMIMS Management ReviewVolume XXIX April-May 2016
Aesthetics versus Function: Assessing Relative Customer PreferenceAesthetics versus Function: Assessing Relative Customer Preference
20 21
Changes
cities of India, and therefore street
Contents
mall farmers. Majority of the
farmers (82%) borrow less than
Rs 5 lakhs, and 18% borrow
between Rs 5 – 10 lakhs on a
per annum basis. Most farmers
(65.79%) ar
** p < .01 + Reliability coefficie
** p < .01 + Reliability coefficie
References
Table 23: The Results of Mann-Whitney U Test for DOWJONES Index Daily ReturnsDr. Rosy Kalra
Mr. Piyuesh Pandey

Ravindra Chitturi is an Associate Professor of Marketing in the College of Business & Economics at Lehigh
University. He holds an Executive MBA and a PhD in Marketing from the University of Texas at Austin, and a
BS in Electrical Engineering from National Institute of Technology at Trichy, India. Professor Chitturi's award
winning research in the Journal of Marketing and consulting expertise is in design, emotions, technology,
branding, creativity and innovation. He has been a computer design engineer, manager, and an executive
with firms such as Intel and IBM. Most recently, he was head of engineering at a technology startup in
Dallas, Texas. He can be reached at [email protected]
Pallavi Chitturi is an Associate Professor in the Department of Statistics and Director of the Center for
Statistical Analysis. Dr. Chitturi teaches statistics courses at The Fox School of Business and for the EMBA
programs in Philadelphia and Cali, Colombia. She also teaches for the Executive Doctorate in Business
Administration program and serves as the Associate Academic Director of the program. Her research
interests are in the areas of choice based conjoint analysis, experimental design, and quality assurance. Dr.
Chitturi has made research presentations at national and international conferences, and has published
articles in statistics and quality management journals. She has supervised Ph.D. dissertations and
published a book titled 'Choice Based Conjoint Analysis – Models and Designs'. She can be reached at
ISSN: 0971-1023 | NMIMS Management ReviewVolume XXIX April-May 2016
Abstract
Extreme volatility in stock markets is a matter of
concern for both regulators and investors because it
can cause widespread losses. This paper attempts to
find out whether the phenomenon of volatility is the
same across the entire stock market or differs across
the underlying sectors. It studies volatility in select
indices of NSE which include one broad market index
and five sectoral indices over a period of fifteen
quarters. It is found that volatility significantly differs
across sectors within the stock market as well as
between sectors and the market as a whole
represented by the broad market index.
Keywords: Volatility, stock market, NSE, sectoral
index, Nifty
Is Volatility Uniform Across the Stock Market?Evidences from Select Indices of NSE
Sankersan SarkarPrashant Verma
Is Volatility Uniform Across the Stock Market?Evidences from Select Indices of NSE
ISSN: 0971-1023 | NMIMS Management ReviewVolume XXIX April-May 2016
Aesthetics versus Function: Assessing Relative Customer Preference
22 23
Changes
cities of India, and therefore street
Contents
mall farmers. Majority of the
farmers (82%) borrow less than
Rs 5 lakhs, and 18% borrow
between Rs 5 – 10 lakhs on a
per annum basis. Most farmers
(65.79%) ar
** p < .01 + Reliability coefficie
** p < .01 + Reliability coefficie
References
Table 23: The Results of Mann-Whitney U Test for DOWJONES Index Daily ReturnsDr. Rosy Kalra
Mr. Piyuesh Pandey
Top Related