


Languages
Pages
Legal

Ground Vibration Testing
Noise, Vibration and Harshness
Experimental Modal Analysis
Material and Fatigue Testing
Engine Testing
Aerospace Vibration Testing
Laser-based Vibration Measurement Technology Helps toIncrease Performance, Improve Time-to-market and Lower Costsin Aerospace Development
2
Aerospace Vibration Testing
Today’s market pressure for new,affordable high performance aerospaceproducts is increasing the number ofproduct variants and the complexity of tested structures. Product develop-ment and design refinement teams are requesting more efficient modaltesting to increase throughput, whilemaintaining accuracy adequate to correlate with FE analysis models (i.e.load analysis, acoustic radiation, etc.).
In addition, these new structuresrequire a substantial number of spatialdata points. The combination of morestructures and and more measurementpoints is rapidly increasing the costs ofdoing a traditional modal test with it’slabor intensive approach of instrumen-ting structures with accelerometers andmulti-channel data acquisition systems.
Noise, Vibration and Harshness
The fight for commercial aircraft ordershas lead aerospace manufacturers toseek competitive advantages in twosignificant areas: fuel economy andincreased passenger comfort. Conse-quently, today’s aerospace engineersare more concerned with noise mea-
surements than their predecessorswere. By improving interior soundquality, aircraft engineers increase passenger comfort and desire to fly in a next generation commercial jet. In addition, by reducing exterior noise,the designer can improve the aircraft’sacceptance in urban settings where airtraffic is growing rapidly.
Polytec Vibrometers are a requirementfor leading aerospace companies eagerto make NVH measurements on theirnewest aircraft.
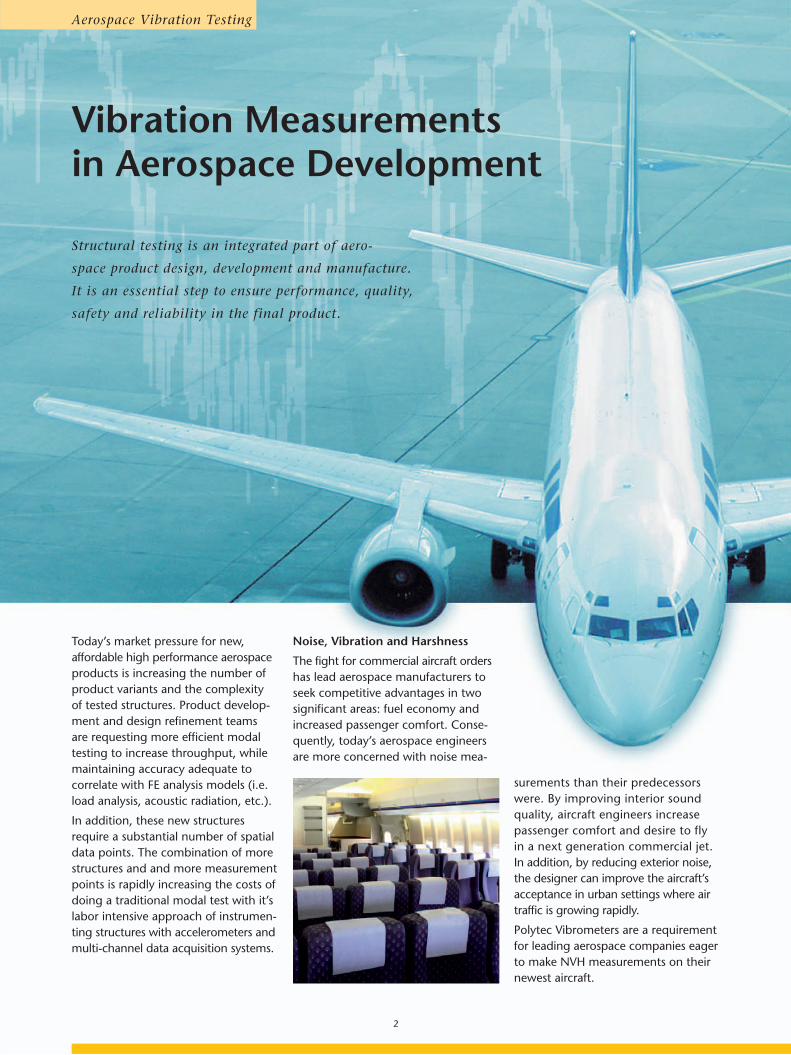
Vibration Measurements in Aerospace Development
Structural testing is an integrated part of aero-
space product design, development and manufacture.
It is an essential step to ensure performance, quality,
safety and reliability in the final product.
3
Material delamination detected by non-linear laser vibrometry. Photo courtesy:IKP-ZFP, University of Stuttgart.
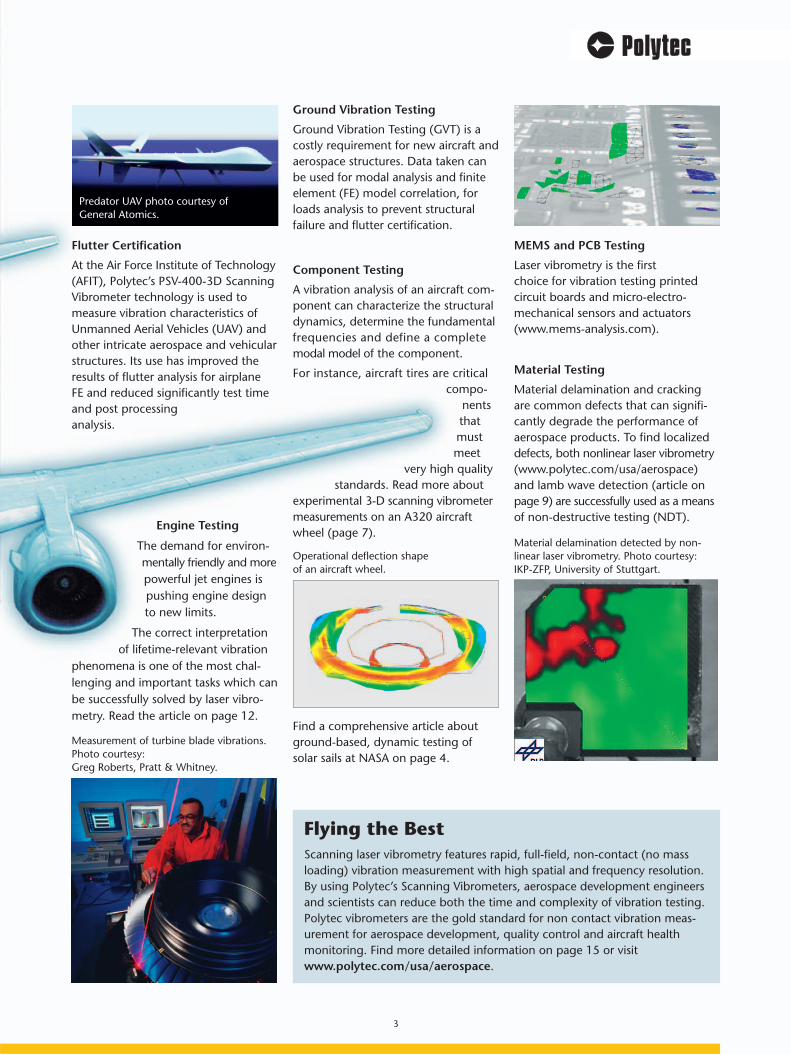
Flutter Certification
At the Air Force Institute of Technology(AFIT), Polytec’s PSV-400-3D ScanningVibrometer technology is used tomeasure vibration characteristics ofUnmanned Aerial Vehicles (UAV) andother intricate aerospace and vehicularstructures. Its use has improved theresults of flutter analysis for airplane FE and reduced significantly test timeand post processinganalysis.
Engine Testing
The demand for environ-mentally friendly and morepowerful jet engines ispushing engine designto new limits.
The correct interpretationof lifetime-relevant vibration
phenomena is one of the most chal-lenging and important tasks which canbe successfully solved by laser vibro-metry. Read the article on page 12.
Predator UAV photo courtesy ofGeneral Atomics.
Measurement of turbine blade vibrations.Photo courtesy: Greg Roberts, Pratt & Whitney.
Flying the BestScanning laser vibrometry features rapid, full-field, non-contact (no massloading) vibration measurement with high spatial and frequency resolution.By using Polytec’s Scanning Vibrometers, aerospace development engineersand scientists can reduce both the time and complexity of vibration testing.Polytec vibrometers are the gold standard for non contact vibration meas-urement for aerospace development, quality control and aircraft healthmonitoring. Find more detailed information on page 15 or visit www.polytec.com/usa/aerospace.
MEMS and PCB Testing
Laser vibrometry is the first choice for vibration testing printed circuit boards and micro-electro-mechanical sensors and actuators (www.mems-analysis.com).
Ground Vibration Testing
Ground Vibration Testing (GVT) is acostly requirement for new aircraft andaerospace structures. Data taken canbe used for modal analysis and finiteelement (FE) model correlation, forloads analysis to prevent structural failure and flutter certification.
Component Testing
A vibration analysis of an aircraft com-ponent can characterize the structuraldynamics, determine the fundamentalfrequencies and define a completemodal model of the component.
For instance, aircraft tires are criticalcompo-
nentsthatmustmeet
very high qualitystandards. Read more about
experimental 3-D scanning vibrometermeasurements on an A320 aircraftwheel (page 7).
Material Testing
Material delamination and crackingare common defects that can signifi-cantly degrade the performance ofaerospace products. To find localizeddefects, both nonlinear laser vibrometry(www.polytec.com/usa/aerospace)and lamb wave detection (article onpage 9) are successfully used as a meansof non-destructive testing (NDT).
Find a comprehensive article aboutground-based, dynamic testing ofsolar sails at NASA on page 4.
Operational deflection shape of an aircraft wheel.
4
Space Structures
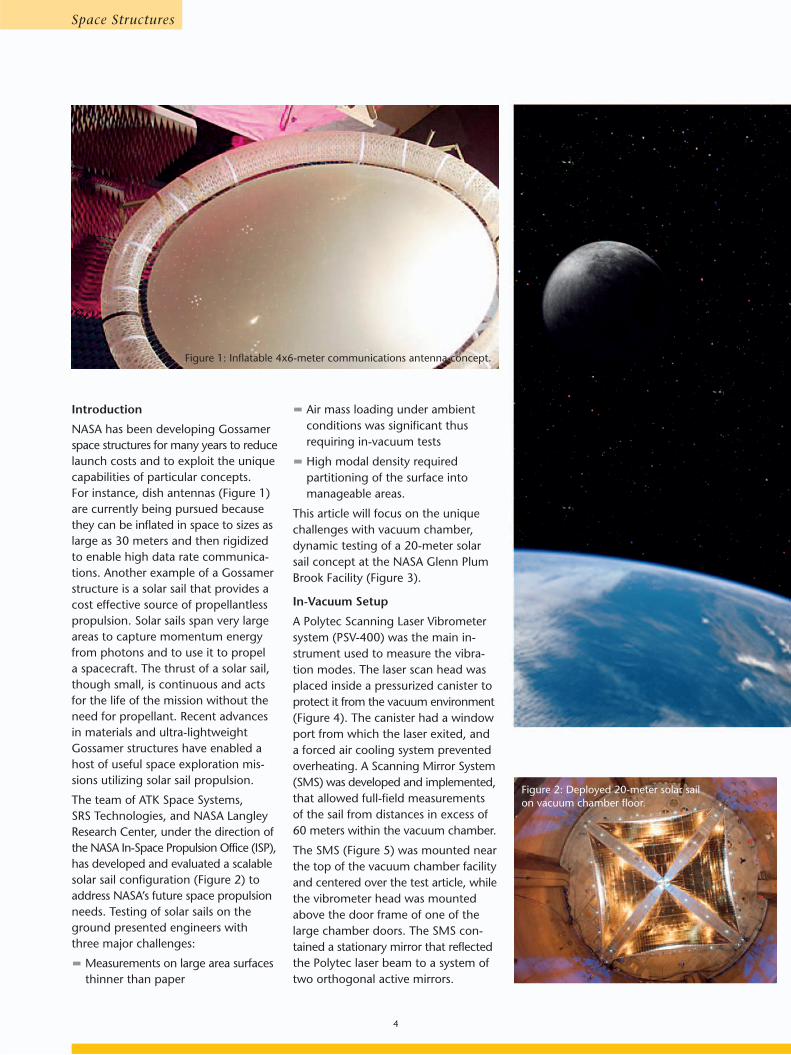
Introduction
NASA has been developing Gossamerspace structures for many years to reducelaunch costs and to exploit the uniquecapabilities of particular concepts. For instance, dish antennas (Figure 1)are currently being pursued becausethey can be inflated in space to sizes aslarge as 30 meters and then rigidizedto enable high data rate communica-tions. Another example of a Gossamerstructure is a solar sail that provides acost effective source of propellantlesspropulsion. Solar sails span very largeareas to capture momentum energyfrom photons and to use it to propel a spacecraft. The thrust of a solar sail,though small, is continuous and actsfor the life of the mission without theneed for propellant. Recent advancesin materials and ultra-lightweightGossamer structures have enabled ahost of useful space exploration mis-sions utilizing solar sail propulsion.
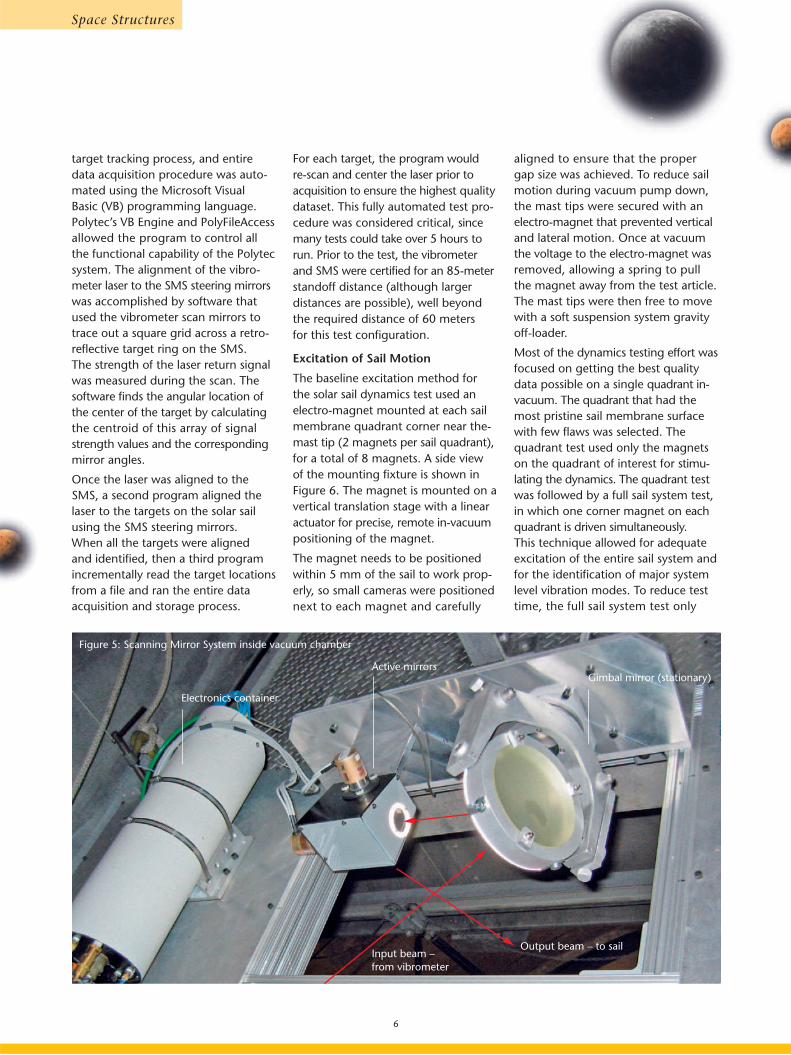
The team of ATK Space Systems, SRS Technologies, and NASA LangleyResearch Center, under the direction ofthe NASA In-Space Propulsion Office (ISP),has developed and evaluated a scalablesolar sail configuration (Figure 2) toaddress NASA’s future space propulsionneeds. Testing of solar sails on theground presented engineers withthree major challenges:
Measurements on large area surfacesthinner than paper
Air mass loading under ambientconditions was significant thusrequiring in-vacuum tests
High modal density required partitioning of the surface intomanageable areas.
This article will focus on the uniquechallenges with vacuum chamber,dynamic testing of a 20-meter solarsail concept at the NASA Glenn PlumBrook Facility (Figure 3).
In-Vacuum Setup
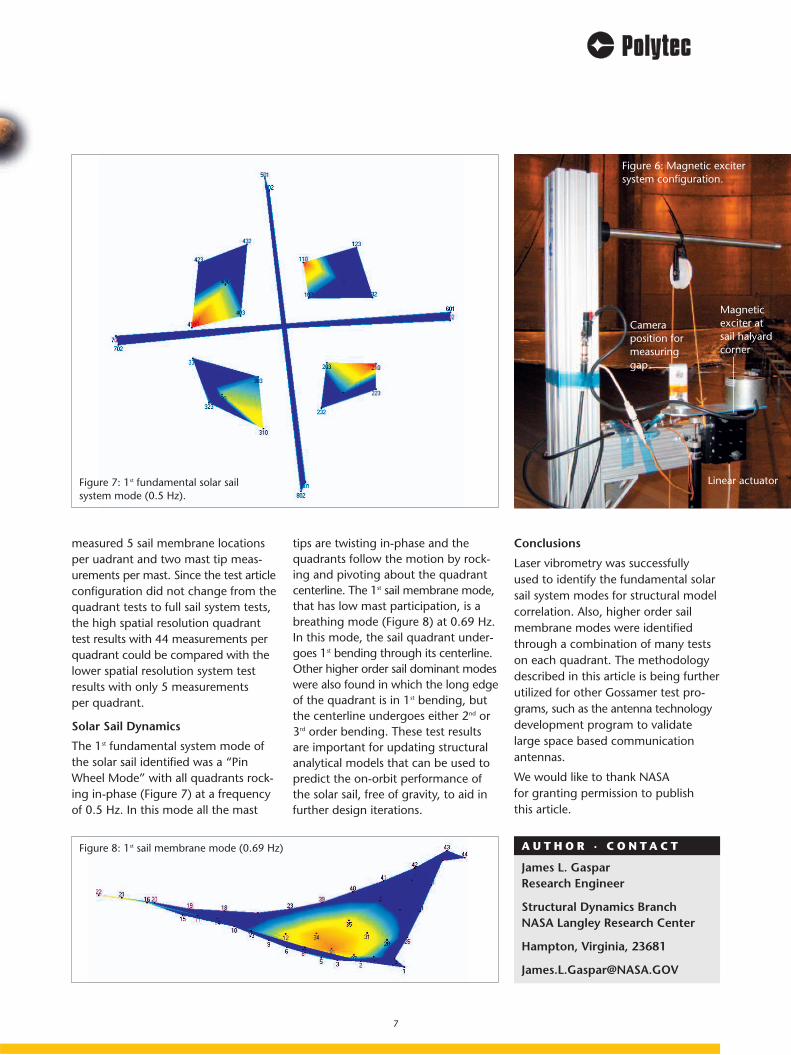
A Polytec Scanning Laser Vibrometersystem (PSV-400) was the main in-strument used to measure the vibra-tion modes. The laser scan head wasplaced inside a pressurized canister toprotect it from the vacuum environment(Figure 4). The canister had a windowport from which the laser exited, anda forced air cooling system preventedoverheating. A Scanning Mirror System(SMS) was developed and implemented,that allowed full-field measurements of the sail from distances in excess of60 meters within the vacuum chamber.
The SMS (Figure 5) was mounted nearthe top of the vacuum chamber facilityand centered over the test article, whilethe vibrometer head was mountedabove the door frame of one of thelarge chamber doors. The SMS con-tained a stationary mirror that reflectedthe Polytec laser beam to a system oftwo orthogonal active mirrors.
Figure 1: Inflatable 4x6-meter communications antenna concept.
Figure 2: Deployed 20-meter solar sail on vacuum chamber floor.

5
These mirrors were used to scan thesurface of the sail to find retro-reflectivetargets previously attached to the sailsurface. These targets were essential to getting a good return signal andovercoming the specular nature of the reflective sail surface.
Fully Automated Test Procedure
A specially developed target trackingalgorithm enabled automatic centeringof the laser beam on each retro-reflectivetarget. The initial laser system alignment,
Sail Away…Laser Vibrometry Helps to Validate Gossamer Space Structures
NASA is pursuing the development of large ultra-lightweight structures commonly referred to as Gossamer
space structures. These structures have large areas and small aerial densities, which complicates ground
testing significantly as the ground operations interfaces and gravity loading can become cumbersome. Laser
vibrometry has proven to be a critical sensing technology for validating the dynamical characteristics of
these Gossamer structures, due to its precision, range, and non-contacting (zero-mass loading) nature.
Figure 3: Vacuum chamber facility. Figure 4: PSV-400 Scanning Vibrometer inpressurized canister.
6
Space Structures
Figure 5: Scanning Mirror System inside vacuum chamber
target tracking process, and entiredata acquisition procedure was auto-mated using the Microsoft Visual Basic (VB) programming language. Polytec’s VB Engine and PolyFileAccessallowed the program to control all the functional capability of the Polytecsystem. The alignment of the vibro-meter laser to the SMS steering mirrorswas accomplished by software thatused the vibrometer scan mirrors totrace out a square grid across a retro-reflective target ring on the SMS. The strength of the laser return signalwas measured during the scan. Thesoftware finds the angular location ofthe center of the target by calculatingthe centroid of this array of signalstrength values and the correspondingmirror angles.
Once the laser was aligned to theSMS, a second program aligned thelaser to the targets on the solar sailusing the SMS steering mirrors. When all the targets were aligned and identified, then a third programincrementally read the target locationsfrom a file and ran the entire dataacquisition and storage process.
For each target, the program would re-scan and center the laser prior toacquisition to ensure the highest qualitydataset. This fully automated test pro-cedure was considered critical, sincemany tests could take over 5 hours torun. Prior to the test, the vibrometerand SMS were certified for an 85-meterstandoff distance (although larger distances are possible), well beyondthe required distance of 60 meters for this test configuration.
Excitation of Sail Motion
The baseline excitation method for the solar sail dynamics test used anelectro-magnet mounted at each sailmembrane quadrant corner near the-mast tip (2 magnets per sail quadrant),for a total of 8 magnets. A side view of the mounting fixture is shown inFigure 6. The magnet is mounted on avertical translation stage with a linearactuator for precise, remote in-vacuumpositioning of the magnet.
The magnet needs to be positionedwithin 5 mm of the sail to work prop-erly, so small cameras were positionednext to each magnet and carefully
aligned to ensure that the propergap size was achieved. To reduce sailmotion during vacuum pump down,the mast tips were secured with anelectro-magnet that prevented verticaland lateral motion. Once at vacuumthe voltage to the electro-magnet wasremoved, allowing a spring to pull the magnet away from the test article. The mast tips were then free to movewith a soft suspension system gravityoff-loader.
Most of the dynamics testing effort wasfocused on getting the best qualitydata possible on a single quadrant in-vacuum. The quadrant that had themost pristine sail membrane surfacewith few flaws was selected. Thequadrant test used only the magnetson the quadrant of interest for stimu-lating the dynamics. The quadrant testwas followed by a full sail system test,in which one corner magnet on eachquadrant is driven simultaneously.This technique allowed for adequateexcitation of the entire sail system andfor the identification of major systemlevel vibration modes. To reduce testtime, the full sail system test only
Electronics container
Active mirrorsGimbal mirror (stationary)
Output beam – to sailInput beam – from vibrometer
7
measured 5 sail membrane locationsper uadrant and two mast tip meas-urements per mast. Since the test articleconfiguration did not change from thequadrant tests to full sail system tests,the high spatial resolution quadranttest results with 44 measurements perquadrant could be compared with thelower spatial resolution system testresults with only 5 measurements per quadrant.
Solar Sail Dynamics
The 1st fundamental system mode ofthe solar sail identified was a “PinWheel Mode” with all quadrants rock-ing in-phase (Figure 7) at a frequencyof 0.5 Hz. In this mode all the mast
tips are twisting in-phase and thequadrants follow the motion by rock-ing and pivoting about the quadrantcenterline. The 1st sail membrane mode,that has low mast participation, is abreathing mode (Figure 8) at 0.69 Hz.In this mode, the sail quadrant under-goes 1st bending through its centerline.Other higher order sail dominant modeswere also found in which the long edgeof the quadrant is in 1st bending, butthe centerline undergoes either 2nd or3rd order bending. These test resultsare important for updating structuralanalytical models that can be used topredict the on-orbit performance ofthe solar sail, free of gravity, to aid infurther design iterations.
Figure 6: Magnetic exciter system configuration.
Figure 8: 1st sail membrane mode (0.69 Hz)
Figure 7: 1st fundamental solar sailsystem mode (0.5 Hz).
Conclusions
Laser vibrometry was successfully used to identify the fundamental solarsail system modes for structural modelcorrelation. Also, higher order sailmembrane modes were identifiedthrough a combination of many testson each quadrant. The methodologydescribed in this article is being furtherutilized for other Gossamer test pro-grams, such as the antenna technologydevelopment program to validatelarge space based communicationantennas.
We would like to thank NASA for granting permission to publish this article.
James L. GasparResearch Engineer
Structural Dynamics BranchNASA Langley Research Center
Hampton, Virginia, 23681
A U T H O R · C O N T A C T
Camera position formeasuringgap
Magneticexciter atsail halyardcorner
Linear actuator
Experimental 3-D Scanning Vibrometer Measurements
on a Complete A320 Aircraft Wheel
8
Where the Rubber Hits the Runway
Figure 3: Average frequency response functionFigure 2: Operational deflection shapes at 37 Hz (a) and 353 Hz (b).
a) b)
A high measurement pointdensity was used with over
100 points on the tire and hub(Figure 1). Because of the non-
periodic nature of white-noise excita-tion, a Hanning window with 66%overlap was used. Operational deflec-tion shapes (ODS), frequency responsefunctions (FRF) and coherence weremeasured from 30 to 400 Hz. Opera-tional deflection shapes (ODS) werethen constructed from the data. Formore complete analysis and modelverification, this experimental data canbe passed to modal analysis software.
Results
Main resonances occurred at 37, 69 and353 Hz. The ODS at 37 Hz shows a puretire bending (Figure 2 a). At 353 Hz, ahub bending oscillation is combinedwith a higher tire bending shape(Figure 2 b). The FRFs (Figure 3) wereclean and the deflection shapes werespatially well resolved. The coherencewas reduced at frequencies betweenresonances, but in the regions aroundthe peaks it was sufficient for opera-tional modal analysis verification.
Summary
The 3-D Scanning Vibrometry improvesthe quality of experimental modal analy-sis of aircraft wheels by combining a
simple setup procedure with a highmeasurement point density. Gooddeflection shapes are quickly and easilyobtained without perturbing the struc-ture. While only one example, this mea-surement represents a growing trendwithin the aerospace industry to perform3-D tests on aircraft components.
The complete measurement setup (includingshaker and shaker controller) was providedby SOPEMEA. The aircraft wheel was suppliedby Messier-Bugatti.
M. Jean-Marc Guilbault
Groupe SOPEMEA
Vélizy, France
C O N T A C T
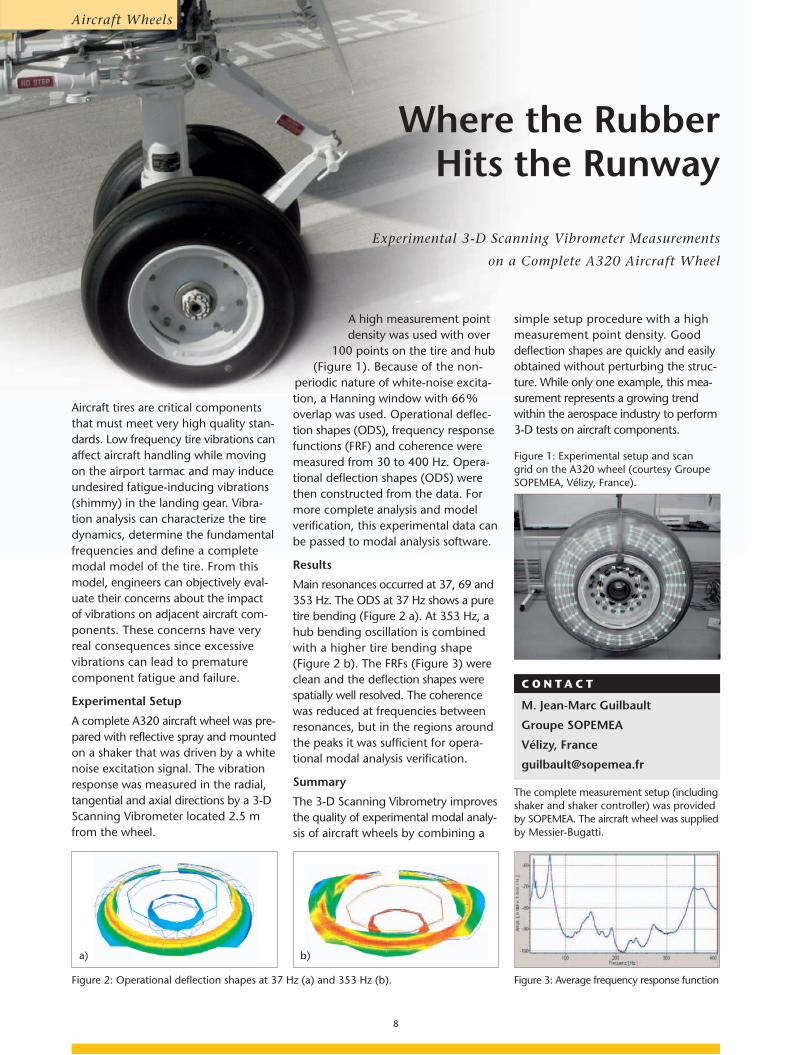
Aircraft tires are critical componentsthat must meet very high quality stan-dards. Low frequency tire vibrations canaffect aircraft handling while movingon the airport tarmac and may induceundesired fatigue-inducing vibrations(shimmy) in the landing gear. Vibra-tion analysis can characterize the tiredynamics, determine the fundamentalfrequencies and define a completemodal model of the tire. From thismodel, engineers can objectively eval-uate their concerns about the impact of vibrations on adjacent aircraft com-ponents. These concerns have veryreal consequences since excessivevibrations can lead to prematurecomponent fatigue and failure.
Experimental Setup
A complete A320 aircraft wheel was pre-pared with reflective spray and mountedon a shaker that was driven by a whitenoise excitation signal. The vibrationresponse was measured in the radial,tangential and axial directions by a 3-DScanning Vibrometer located 2.5 mfrom the wheel.
Figure 1: Experimental setup and scan grid on the A320 wheel (courtesy GroupeSOPEMEA, Vélizy, France).
Aircraft Wheels

9
Health Monitoring of Aerospace Structures:
Laser Vibrometry for Damage Detection Using Lamb Waves
Healthy Airplanes
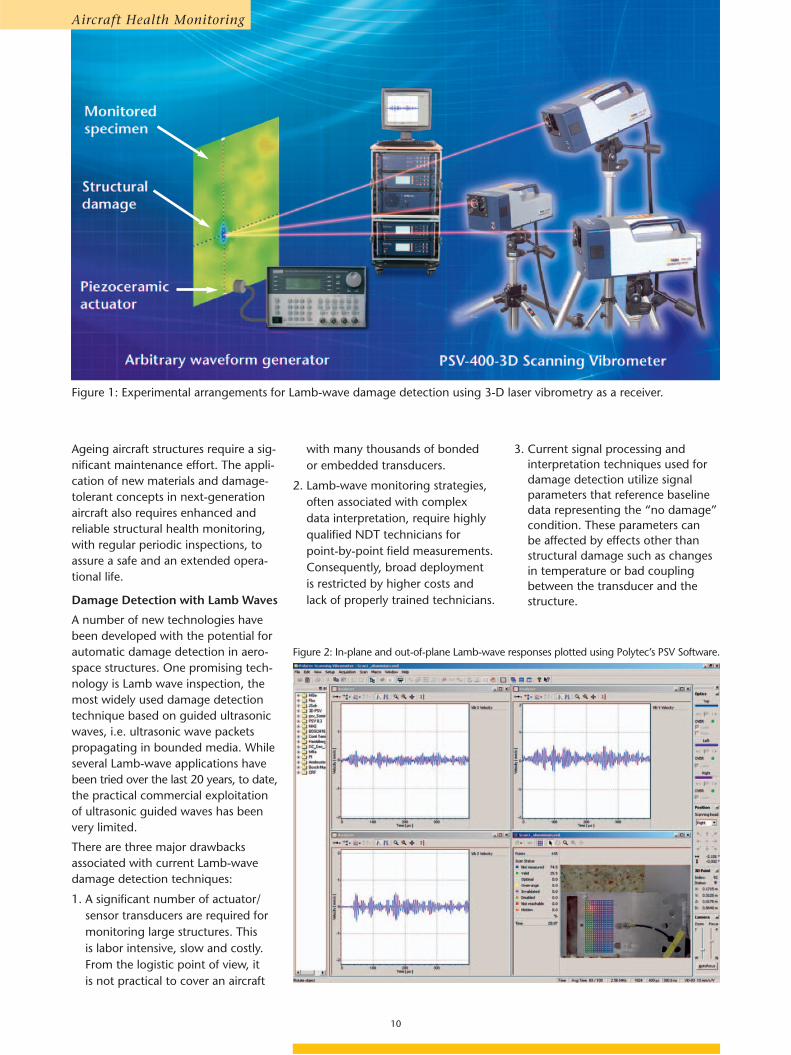
Lamb wave inspection uses guidedultrasonic waves to detect damage instructures. Its commercial exploitationhas been limited by drawbacks in current detection techniques. Using a new detection technology known as 3-D Scanning Laser Vibrometry,structural damage is clearly identifiedby locally increased in-plane and out-of-plane vibrations. The method issimple, fast and reliable, eliminatingcomplex Lamb wave propagationstudies, baseline measurements andsignal post-processing.
Introduction
Aircraft designers, manufacturers andoperators face many test and measure-ment challenges in the near future.
New, large capacity civil airframes thatmake greater use of composite materialsare being developed and will be morewidely used. At the same time, newmilitary structures exhibit improvedperformance by relying on greaterstructural complexity.
End-users of these new aerospacestructures demand reduced life-cyclecosts and high operational availability.These goals can be achieved with theapplication of new materials and wideruse of damage-tolerant design con-cepts that result in lighter structuresand better performance.
While these new aircraft are beingdeveloped, the existing fleet is ageingand must be maintained.
A number of life extension programshave been considered and performedin recent years; civil structures arebeing converted from passenger air-craft to freighters and military aircraftare redesigned to add new weaponcapabilities. These developments are a major challenge to existing aircraftstructure inspection and maintenancemethods.
10
Aircraft Health Monitoring
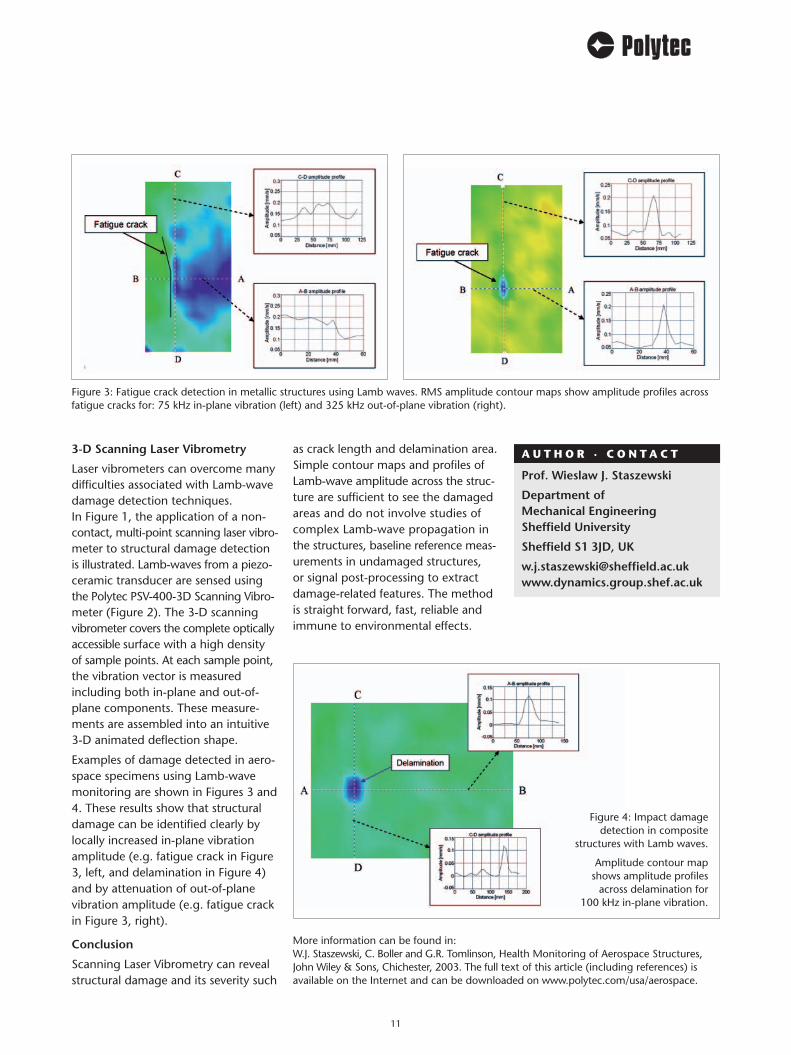
Figure 2: In-plane and out-of-plane Lamb-wave responses plotted using Polytec’s PSV Software.
with many thousands of bonded or embedded transducers.
2. Lamb-wave monitoring strategies,often associated with complex data interpretation, require highlyqualified NDT technicians for point-by-point field measurements. Consequently, broad deployment is restricted by higher costs and lack of properly trained technicians.
3. Current signal processing andinterpretation techniques used fordamage detection utilize signalparameters that reference baselinedata representing the “no damage”condition. These parameters can be affected by effects other thanstructural damage such as changesin temperature or bad couplingbetween the transducer and thestructure.
Ageing aircraft structures require a sig-nificant maintenance effort. The appli-cation of new materials and damage-tolerant concepts in next-generationaircraft also requires enhanced andreliable structural health monitoring,with regular periodic inspections, toassure a safe and an extended opera-tional life.
Damage Detection with Lamb Waves
A number of new technologies havebeen developed with the potential forautomatic damage detection in aero-space structures. One promising tech-nology is Lamb wave inspection, themost widely used damage detectiontechnique based on guided ultrasonicwaves, i.e. ultrasonic wave packetspropagating in bounded media. Whileseveral Lamb-wave applications havebeen tried over the last 20 years, to date,the practical commercial exploitationof ultrasonic guided waves has beenvery limited.
There are three major drawbacks associated with current Lamb-wavedamage detection techniques:
1. A significant number of actuator/sensor transducers are required formonitoring large structures. This is labor intensive, slow and costly.From the logistic point of view, it is not practical to cover an aircraft
Figure 1: Experimental arrangements for Lamb-wave damage detection using 3-D laser vibrometry as a receiver.
11
3-D Scanning Laser Vibrometry
Laser vibrometers can overcome manydifficulties associated with Lamb-wavedamage detection techniques. In Figure 1, the application of a non-contact, multi-point scanning laser vibro-meter to structural damage detectionis illustrated. Lamb-waves from a piezo-ceramic transducer are sensed usingthe Polytec PSV-400-3D Scanning Vibro-meter (Figure 2). The 3-D scanningvibrometer covers the complete opticallyaccessible surface with a high density of sample points. At each sample point,the vibration vector is measuredincluding both in-plane and out-of-plane components. These measure-ments are assembled into an intuitive3-D animated deflection shape.
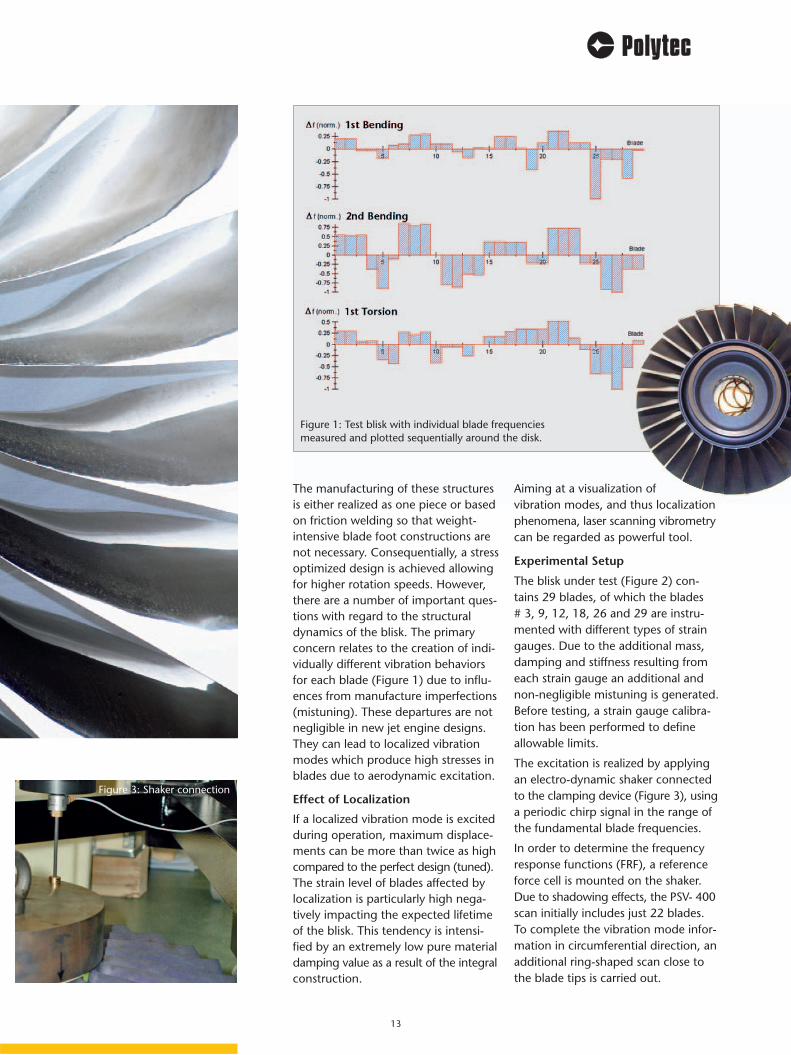
Examples of damage detected in aero-space specimens using Lamb-wavemonitoring are shown in Figures 3 and4. These results show that structuraldamage can be identified clearly bylocally increased in-plane vibrationamplitude (e.g. fatigue crack in Figure3, left, and delamination in Figure 4)and by attenuation of out-of-planevibration amplitude (e.g. fatigue crackin Figure 3, right).
Conclusion
Scanning Laser Vibrometry can revealstructural damage and its severity such
as crack length and delamination area.Simple contour maps and profiles ofLamb-wave amplitude across the struc-ture are sufficient to see the damagedareas and do not involve studies ofcomplex Lamb-wave propagation inthe structures, baseline reference meas-urements in undamaged structures,or signal post-processing to extractdamage-related features. The methodis straight forward, fast, reliable andimmune to environmental effects.
Figure 3: Fatigue crack detection in metallic structures using Lamb waves. RMS amplitude contour maps show amplitude profiles acrossfatigue cracks for: 75 kHz in-plane vibration (left) and 325 kHz out-of-plane vibration (right).
Figure 4: Impact damage detection in composite
structures with Lamb waves.
Amplitude contour map shows amplitude profiles
across delamination for 100 kHz in-plane vibration.
Prof. Wieslaw J. Staszewski
Department of Mechanical Engineering Sheffield University
Sheffield S1 3JD, UK
[email protected] www.dynamics.group.shef.ac.uk
A U T H O R · C O N T A C T
More information can be found in: W.J. Staszewski, C. Boller and G.R. Tomlinson, Health Monitoring of Aerospace Structures,John Wiley & Sons, Chichester, 2003. The full text of this article (including references) isavailable on the Internet and can be downloaded on www.polytec.com/usa/aerospace.

12
Jet Engine Testing
Using Scanning Vibrometry to Visualize Localization Effects of a Jet Engine Compressor Blisk
Blade integrated disk (blisk) technolo-gy is an innovation increasingly usedin the design of jet engines. To becommercially effective, blisks must bedesigned and manufactured to speci-fications that insure long lifetimes. The dynamic properties of blisks canbe used as an important quality checkon the manufacturing and the designprocess. With this type of inspection,the correct interpretation of lifetimerelevant vibration phenomena is oneof the most challenging and important
tasks. The non-contact measure-ments taken by the PSV-400 ScanningVibrometer are essential for precisevibration mode visualization and discrimination between acceptableand unacceptable localized vibrationamplitudes.
Introduction
The demand for environmentallyfriendly and more powerful jet enginesis pushing the integral design of bladeintegrated disk to new limits.
Secure Power for Jet Engines
Figure 2: Arrangement of 1128 scan points withstrain gauge instrumented blades identified.
3 9
12
1826
29
13
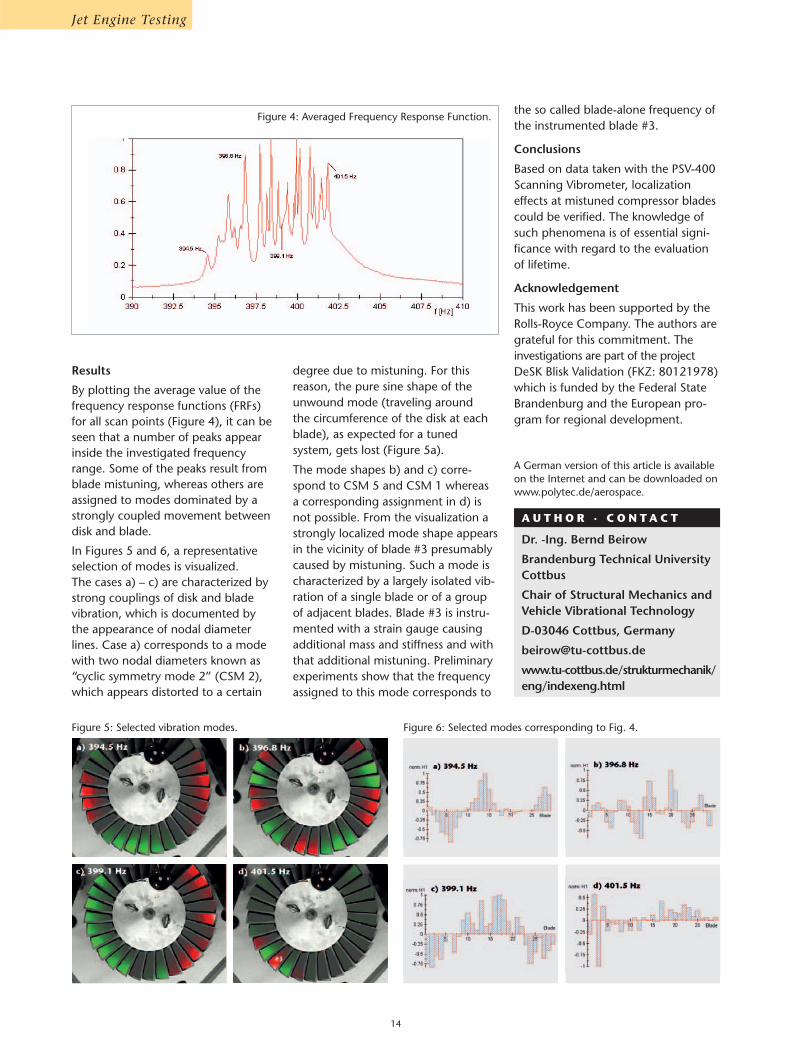
The manufacturing of these structuresis either realized as one piece or basedon friction welding so that weight-intensive blade foot constructions arenot necessary. Consequentially, a stressoptimized design is achieved allowingfor higher rotation speeds. However,there are a number of important ques-tions with regard to the structuraldynamics of the blisk. The primaryconcern relates to the creation of indi-vidually different vibration behaviorsfor each blade (Figure 1) due to influ-ences from manufacture imperfections(mistuning). These departures are notnegligible in new jet engine designs.They can lead to localized vibrationmodes which produce high stresses inblades due to aerodynamic excitation.
Effect of Localization
If a localized vibration mode is excitedduring operation, maximum displace-ments can be more than twice as highcompared to the perfect design (tuned).The strain level of blades affected bylocalization is particularly high nega-tively impacting the expected lifetimeof the blisk. This tendency is intensi-fied by an extremely low pure materialdamping value as a result of the integralconstruction.
Aiming at a visualization ofvibration modes, and thus localizationphenomena, laser scanning vibrometrycan be regarded as powerful tool.
Experimental Setup
The blisk under test (Figure 2) con-tains 29 blades, of which the blades # 3, 9, 12, 18, 26 and 29 are instru-mented with different types of straingauges. Due to the additional mass,damping and stiffness resulting fromeach strain gauge an additional andnon-negligible mistuning is generated.Before testing, a strain gauge calibra-tion has been performed to defineallowable limits.
The excitation is realized by applyingan electro-dynamic shaker connectedto the clamping device (Figure 3), usinga periodic chirp signal in the range ofthe fundamental blade frequencies.
In order to determine the frequencyresponse functions (FRF), a referenceforce cell is mounted on the shaker.Due to shadowing effects, the PSV- 400scan initially includes just 22 blades.To complete the vibration mode infor-mation in circumferential direction, anadditional ring-shaped scan close tothe blade tips is carried out.
Figure 3: Shaker connection
Figure 1: Test blisk with individual blade frequenciesmeasured and plotted sequentially around the disk.
14
Jet Engine Testing
Results
By plotting the average value of thefrequency response functions (FRFs)for all scan points (Figure 4), it can beseen that a number of peaks appearinside the investigated frequencyrange. Some of the peaks result fromblade mistuning, whereas others areassigned to modes dominated by astrongly coupled movement betweendisk and blade.
In Figures 5 and 6, a representativeselection of modes is visualized. The cases a) – c) are characterized bystrong couplings of disk and bladevibration, which is documented by the appearance of nodal diameterlines. Case a) corresponds to a modewith two nodal diameters known as“cyclic symmetry mode 2” (CSM 2),which appears distorted to a certain
degree due to mistuning. For this reason, the pure sine shape of theunwound mode (traveling around the circumference of the disk at eachblade), as expected for a tuned system, gets lost (Figure 5a).
The mode shapes b) and c) corre-spond to CSM 5 and CSM 1 whereas a corresponding assignment in d) isnot possible. From the visualization astrongly localized mode shape appearsin the vicinity of blade #3 presumablycaused by mistuning. Such a mode ischaracterized by a largely isolated vib-ration of a single blade or of a groupof adjacent blades. Blade #3 is instru-mented with a strain gauge causingadditional mass and stiffness and withthat additional mistuning. Preliminaryexperiments show that the frequencyassigned to this mode corresponds to
the so called blade-alone frequency ofthe instrumented blade #3.
Conclusions
Based on data taken with the PSV-400Scanning Vibrometer, localizationeffects at mistuned compressor bladescould be verified. The knowledge ofsuch phenomena is of essential signi-ficance with regard to the evaluationof lifetime.
Acknowledgement
This work has been supported by theRolls-Royce Company. The authors aregrateful for this commitment. Theinvestigations are part of the projectDeSK Blisk Validation (FKZ: 80121978)which is funded by the Federal StateBrandenburg and the European pro-gram for regional development.
Dr. -Ing. Bernd Beirow
Brandenburg Technical UniversityCottbus
Chair of Structural Mechanics andVehicle Vibrational Technology
D-03046 Cottbus, Germany
www.tu-cottbus.de/strukturmechanik/eng/indexeng.html
A U T H O R · C O N T A C T
A German version of this article is availableon the Internet and can be downloaded onwww.polytec.de/aerospace.
Figure 4: Averaged Frequency Response Function.
Figure 5: Selected vibration modes. Figure 6: Selected modes corresponding to Fig. 4.
15
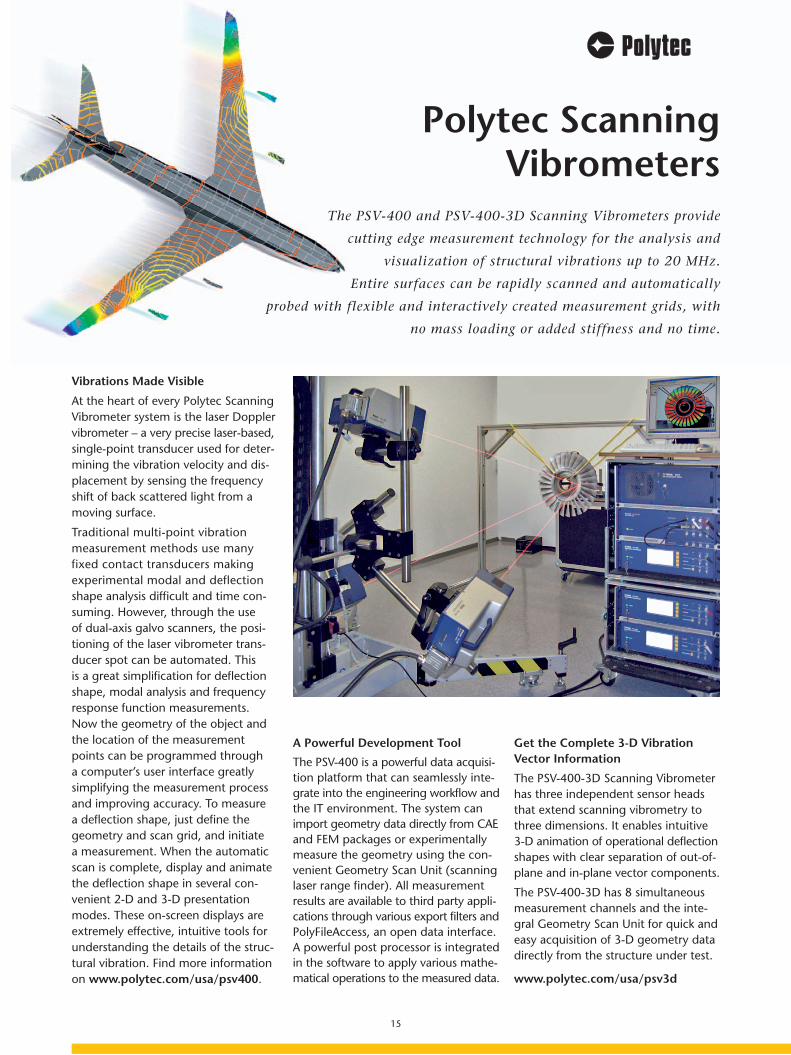
Vibrations Made Visible
At the heart of every Polytec ScanningVibrometer system is the laser Dopplervibrometer – a very precise laser-based,single-point transducer used for deter-mining the vibration velocity and dis-placement by sensing the frequencyshift of back scattered light from amoving surface.
Traditional multi-point vibration measurement methods use many fixed contact transducers makingexperimental modal and deflectionshape analysis difficult and time con-suming. However, through the use of dual-axis galvo scanners, the posi-tioning of the laser vibrometer trans-ducer spot can be automated. This is a great simplification for deflectionshape, modal analysis and frequencyresponse function measurements. Now the geometry of the object andthe location of the measurementpoints can be programmed through a computer’s user interface greatlysimplifying the measurement processand improving accuracy. To measure a deflection shape, just define thegeometry and scan grid, and initiate a measurement. When the automaticscan is complete, display and animatethe deflection shape in several con-venient 2-D and 3-D presentationmodes. These on-screen displays areextremely effective, intuitive tools forunderstanding the details of the struc-tural vibration. Find more informationon www.polytec.com/usa/psv400.
A Powerful Development Tool
The PSV-400 is a powerful data acquisi-tion platform that can seamlessly inte-grate into the engineering workflow andthe IT environment. The system canimport geometry data directly from CAEand FEM packages or experimentallymeasure the geometry using the con-venient Geometry Scan Unit (scanninglaser range finder). All measurementresults are available to third party appli-cations through various export filters andPolyFileAccess, an open data interface.A powerful post processor is integratedin the software to apply various mathe-matical operations to the measured data.
Get the Complete 3-D VibrationVector Information
The PSV-400-3D Scanning Vibrometerhas three independent sensor headsthat extend scanning vibrometry tothree dimensions. It enables intuitive3-D animation of operational deflectionshapes with clear separation of out-of-plane and in-plane vector components.
The PSV-400-3D has 8 simultaneousmeasurement channels and the inte-gral Geometry Scan Unit for quick andeasy acquisition of 3-D geometry datadirectly from the structure under test.
www.polytec.com/usa/psv3d
The PSV-400 and PSV-400-3D Scanning Vibrometers provide
cutting edge measurement technology for the analysis and
visualization of structural vibrations up to 20 MHz.
Entire surfaces can be rapidly scanned and automatically
probed with flexible and interactively created measurement grids, with
no mass loading or added stiffness and no time.
Polytec Scanning Vibrometers
About Polytec
Proud to Be Number OnePolytec is a global enterprise with corporate facilities in Europe, North America and Asia. A strong Polytec team of sales managers, appli-cation engineers and skilled representatives deliversPolytec technology to all parts of the world.
Founded in 1967, Polytec GmbH is an ISO-9000certified manufacturer supplying customers withthe gold-standard in laser Doppler measurementsolutions. All of our vibrometer systems are devel-opped, engineered and manufactured to thehighest standards and specifications. Engineeringsuch a sophisticated product requires a truly multi-disciplined company. Polytec’s long-standing re-putation and undisputed performance advantagesare well known. We are very proud of the PolytecScanning Vibrometer. Its design and constructiondemonstrate our expertise in opto-mechanics,electronics, computer hardware & software, aswell as applications knowledge in the field ofmechanical engineering.
Polytec At Your ServiceOur market-leading position is built on inno-vative technology, high-quality products, engi-neering excellence, expert technical advice andthousands of satisfied customers worldwide.Polytec offers world-class products, technicalsupport, measurement services, system rentalsand training classes to support customers at everylevel in solving their measurement challenges.
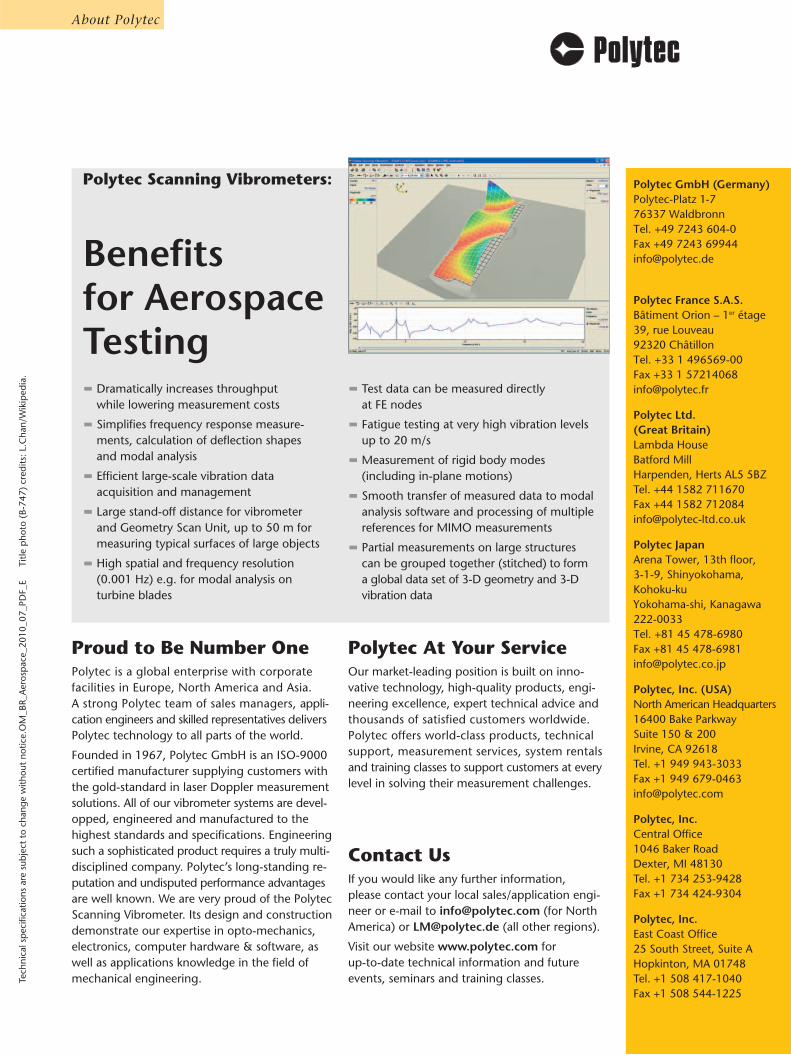
Dramatically increases throughput while lowering measurement costs
Simplifies frequency response measure-ments, calculation of deflection shapes and modal analysis
Efficient large-scale vibration data acquisition and management
Large stand-off distance for vibrometer and Geometry Scan Unit, up to 50 m formeasuring typical surfaces of large objects
High spatial and frequency resolution (0.001 Hz) e.g. for modal analysis on turbine blades
Test data can be measured directly at FE nodes
Fatigue testing at very high vibration levels up to 20 m/s
Measurement of rigid body modes (including in-plane motions)
Smooth transfer of measured data to modalanalysis software and processing of multiplereferences for MIMO measurements
Partial measurements on large structurescan be grouped together (stitched) to form a global data set of 3-D geometry and 3-Dvibration data
Advancing Measurements by Light
Contact UsIf you would like any further information, please contact your local sales/application engi-neer or e-mail to [email protected] (for NorthAmerica) or [email protected] (all other regions).
Visit our website www.polytec.com for up-to-date technical information and futureevents, seminars and training classes.
Polytec Scanning Vibrometers:
Benefits for AerospaceTesting
Tech
nica
l sp
ecifi
catio
ns a
re s
ubje
ct t
o ch
ange
with
out
notic
e.O
M_B
R_A
eros
pac
e_20
10_0
7_PD
F_E
T
itle
pho
to (
B-74
7) c
red
its: L
.Cha
n/W
ikip
edia
.
Polytec GmbH (Germany) Polytec-Platz 1-7 76337 Waldbronn Tel. +49 7243 604-0 Fax +49 7243 69944 [email protected]
Polytec France S.A.S. Bâtiment Orion – 1er étage 39, rue Louveau 92320 Châtillon Tel. +33 1 496569-00 Fax +33 1 57214068 [email protected]
Polytec Ltd. (Great Britain) Lambda House Batford Mill Harpenden, Herts AL5 5BZTel. +44 1582 711670 Fax +44 1582 712084 [email protected]
Polytec JapanArena Tower, 13th floor, 3-1-9, Shinyokohama, Kohoku-ku Yokohama-shi, Kanagawa 222-0033 Tel. +81 45 478-6980 Fax +81 45 478-6981 [email protected]
Polytec, Inc. (USA)North American Headquarters 16400 Bake Parkway Suite 150 & 200 Irvine, CA 92618 Tel. +1 949 943-3033 Fax +1 949 679-0463 [email protected]
Polytec, Inc.Central Office 1046 Baker Road Dexter, MI 48130 Tel. +1 734 253-9428 Fax +1 734 424-9304
Polytec, Inc. East Coast Office 25 South Street, Suite A Hopkinton, MA 01748 Tel. +1 508 417-1040 Fax +1 508 544-1225
Top Related