


Languages
Pages
Legal

Aer Lingus Investor and Analyst DayLondon, 26 January 2010

Slide 2Aer Lingus Investor Day | 26 January 2010
Disclaimer
Certain information included in these statements is forward-looking and involves risks and uncertainties that could cause actual results to differ materially from those expressed or implied by the forward looking statements.
Forward-looking statements include, without limitation, projections relating to results of operations and financial conditions and the Company's plans and objectives for future operations, including, without limitation, discussions of the Company's Business Plan programs, expected future revenues, financing plans and expected expenditures and divestments. All forward-looking statements in this report are based upon information known to the Company on the date of this report. Due to such uncertainties and risks, you should not place undue reliance on such forward-looking statements, which speak only as at the date of this report. The Company undertakes no obligation to publicly update or revise any forward-looking statement, whether as a result of new information, future events or otherwise, except as required by law or by any appropriate regulatory authority.
It is not reasonably possible to itemise all of the many factors and specific events that could cause the Company's forward looking statements to be incorrect or that could otherwise have a material adverse effect on the future operations or results of an airline operating in the global economy. Among the factors that are subject to change and could significantly impact the Company’s expected results are the fuel costs, competition from new and existing carriers, costs associated with environmental, safety and security measures, actions of governments and regulatory authorities, fluctuations in currency exchange rates and interest rates, airport access and charges, industrial relations, the economic environment of the airline industry and the general economic environment in the markets to which the Company operates.
The financial information presented for 2009 in this report is unaudited and is based on judgements made by management applying the Group’s accounting policies.

Slide 3Aer Lingus Investor Day | 26 January 2010
ProgrammeIntroduction – Colm Barrington, Chairman
Refocusing Aer Lingus – Christoph Mueller, CEO
Financial Review – Andrew Macfarlane, Interim CFO
Summary – Christoph Mueller, CEO
Coffee break
Q & A – Additional presenters to take questions
(Chaired by Christoph Mueller) – Anne Bradley (ground handling)
– Enda Corneille (corporate affairs & shared services)
– Michael Grealy (HR & organisation change)
– Stephen Kavanagh (chief commercial officer)
– Steve Kelly (cabin ops)
– Davina Pratt (flight ops)
– Fergus Wilson (chief engineer)
Closing remarks & conclusion

Colm BarringtonChairmanIntroduction
Slide 5Aer Lingus Investor Day | 26 January 2010
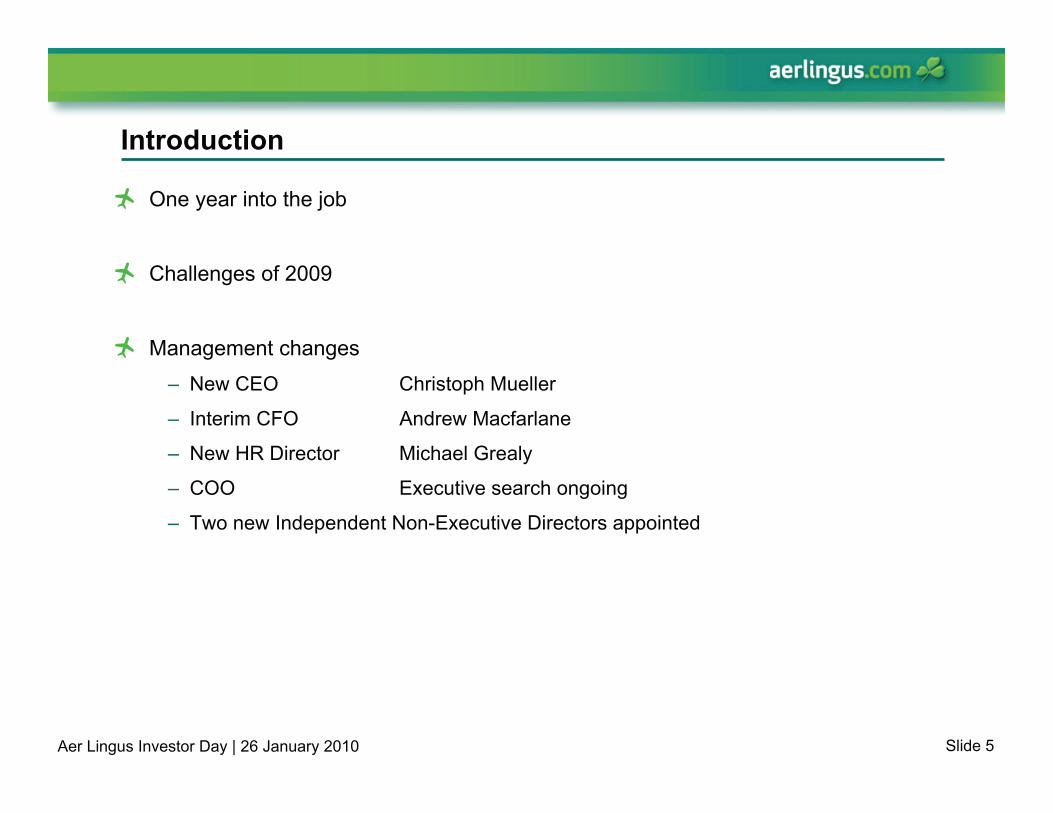
Introduction
One year into the job
Challenges of 2009
Management changes– New CEO Christoph Mueller
– Interim CFO Andrew Macfarlane
– New HR Director Michael Grealy
– COO Executive search ongoing
– Two new Independent Non-Executive Directors appointed

Christoph MuellerCEORefocusing Aer Lingus
Slide 7Aer Lingus Investor Day | 26 January 2010
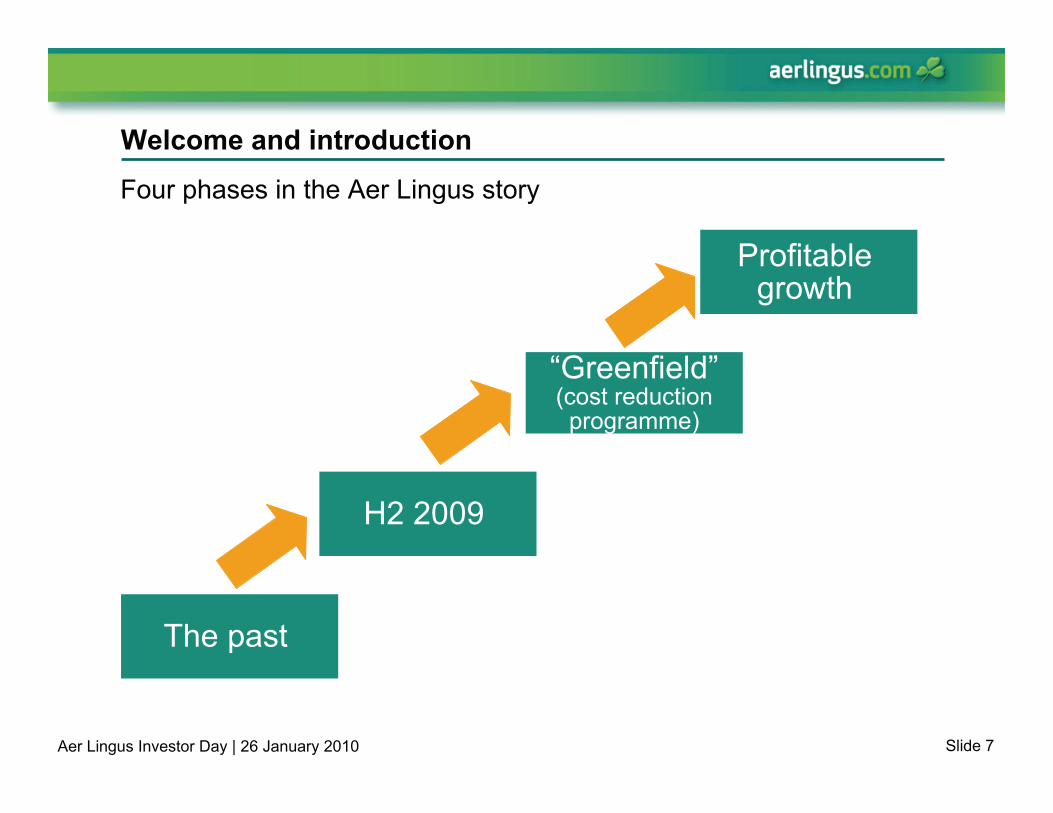
Welcome and introduction
“Greenfield”(cost reduction programme)
Four phases in the Aer Lingus story
H2 2009
The past
Profitable growth

Slide 8Aer Lingus Investor Day | 26 January 2010
0.40
0.60
0.80
1.00
1.20
1.40
GBP : EUR USD : EUR2008 2009
-
1000
2000
3000
UK USA/Canada
2008 (9 months) 2009 (9 months)
(25%)
(15%)
(5%)
5%
15%
1990
1992
1994
1996
1998
2000
2002
2004
2006
2008
UK USA Ireland Total EU Global
The economic context – Ireland disproportionately affected
Average yearly exchange rate GDP (real change %)
Source: EIU
Passenger traffic (% change)
Source: AEA, CSO, CAA, BTSNotes: Irish data pre 2006 includes only Dublin, Cork and Shannon airports
Incoming visitors to Ireland by origin
Source: CSO
Source: Bloomberg
- 21%
- 18%
(10%)
(5%)
-
5%
10%
Q1 04 Q1 05 Q1 06 Q1 07 Q1 08 Q1 09
US UK Ireland World OECD EU27
Slide 9Aer Lingus Investor Day | 26 January 2010
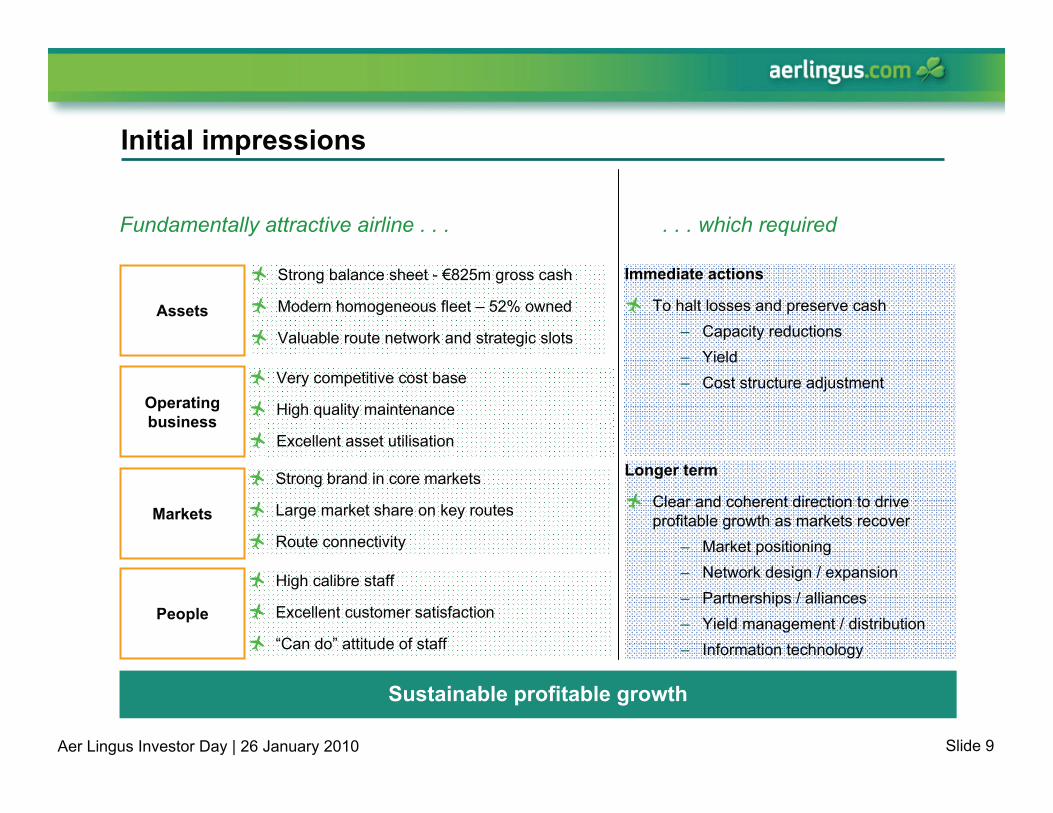
Sustainable profitable growth
Initial impressions
Assets
Operating business
Markets
People
Strong balance sheet - €825m gross cash
Modern homogeneous fleet – 52% owned
Valuable route network and strategic slots
Very competitive cost base
High quality maintenance
Excellent asset utilisation
Fundamentally attractive airline . . . . . . which required
Strong brand in core markets
Large market share on key routes
Route connectivity
High calibre staff
Excellent customer satisfaction
“Can do” attitude of staff
Immediate actions
To halt losses and preserve cash– Capacity reductions– Yield– Cost structure adjustment
Longer term
Clear and coherent direction to drive profitable growth as markets recover
– Market positioning– Network design / expansion– Partnerships / alliances– Yield management / distribution– Information technology

Slide 10Aer Lingus Investor Day | 26 January 2010
7.979.61
10.7412.33
77 75 75 74
5
10
15
2005 2006 2007 200840
50
60
70
80
7.47 7.61 8.89 10.04
7.979.61
10.7412.3315.44
17.23
19.63
22.37
-
4
8
12
16
20
24
2005 2006 2007 2008
Long-haul Short-haul
The past – network growing significantly into the downturn
Declining load factors
CAGR: +13%
Short haul
Long haul
Increasing ASKs ('000)
Led to significant load factor reductions particularly in long haul
7.47 7.61 8.89 10.04
86 8076
71
5
10
15
2005 2006 2007 200840
50
60
70
80
90
ASK SLF (%)
Slide 11Aer Lingus Investor Day | 26 January 2010
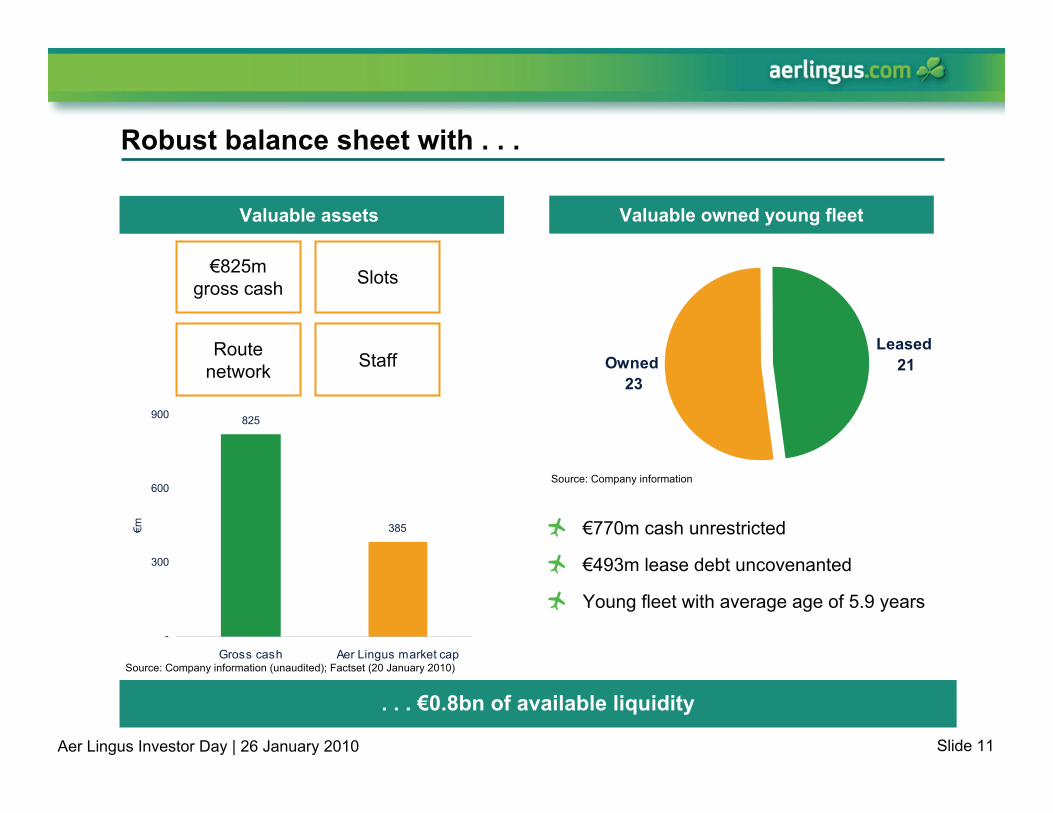
825
385
-
300
600
900
Gross cash Aer Lingus market cap
€m
Owned 23
Leased 21
Robust balance sheet with . . .
Valuable assets Valuable owned young fleet
. . . €0.8bn of available liquidity
€770m cash unrestricted
€493m lease debt uncovenanted
Young fleet with average age of 5.9 years
€825m gross cash Slots
Route network Staff
Source: Company information (unaudited); Factset (20 January 2010)
Source: Company information

Slide 12Aer Lingus Investor Day | 26 January 2010
Immediate actions to address demanding trading conditions
Capacity
Yield
Cost
Capacity still increasing
Over-aggressive network expansion
Small profit (1)€(94)m loss
H2 2009H1 2009
Lower price points not stimulating demand
Load factor focus depressed yield
Cost base remains too high for market conditions and scale of business
Long haul capacity reduced
Loss making routes closed
Over-served short haul capacity cut
Re-focus pricing policy onto yield / ASK, not load factor
€97m cost saving programme actioned
(1) Unaudited operating profit (pre-exceptionals)
Slide 13Aer Lingus Investor Day | 26 January 2010
(40%)
(30%)
(20%)
(10%)
-
10%
20%
30%
40%
Mar-08
Jun-08
Sep-08
Dec-08
Mar-09
Jun-09
Sep-09
Dec-09
Aer Lingus LufthasaBritish Airways Air France
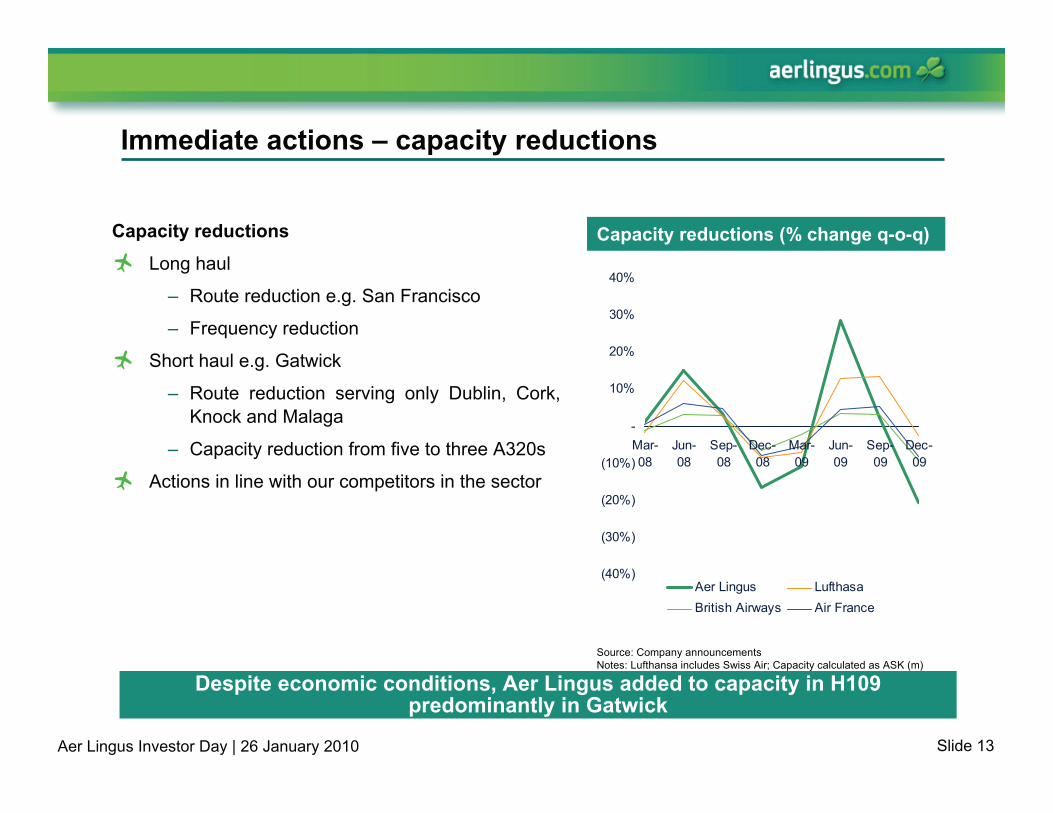
Immediate actions – capacity reductions
Capacity reductions
Long haul
– Route reduction e.g. San Francisco
– Frequency reduction
Short haul e.g. Gatwick
– Route reduction serving only Dublin, Cork, Knock and Malaga
– Capacity reduction from five to three A320s
Actions in line with our competitors in the sector
Capacity reductions (% change q-o-q)
Despite economic conditions, Aer Lingus added to capacity in H109 predominantly in Gatwick
Source: Company announcements Notes: Lufthansa includes Swiss Air; Capacity calculated as ASK (m)

Slide 14Aer Lingus Investor Day | 26 January 2010
26 2730
6 6
64 435 55
-
5
10
15
20
25
30
35
40
45
50
2007 2008 2009
A320 A321 A330-200 A330-300
Immediate actions – capacity management
Major reductions in capex spend delivered
Deferral of nine aircraft
No additional cost to Aer Lingus and pre-delivery payment schedule revised
Macro economic outlook supports aircraft delivery deferrals over the coming years
Flexibility within the leased fleet
Possibility to convert A320s to A319s
Capacity reductions
Positive effect on long term cashflow
* Potential to convert to A350 for delivery at a later date agreed with Airbus
Aer Lingus fleet
Long haul fleet
Short haul fleet
Aircraft Original date Deferred dateA320 Oct-10 Apr-11A320 Nov-10 May-11A330* 2010 Q3 2013 - Q1 2014A330* 2011 Q3 2013 - Q1 2014A330* 2011 Q3 2013 - Q1 2014A350 2014 2015A350 2014 2015A350 2014 2015A350 2014 2015
Delivery
Source: Company information
Source: Company information

Slide 15Aer Lingus Investor Day | 26 January 2010
0.87 1.36 1.29 1.79 1.560.290.29 0.26
0.23 0.261.161.17 1.13
1.09 1.192.32
2.81 2.683.11 3.01
-
1.00
2.00
3.00
4.00
2005 2006 2007 2008 2009
€cen
t
Fuel Aircraft lease & depreciation Airport charges
Immediate actions – Cost per ASK have been reduced…
Source: Company information. Note 2009 financials unaudited; staff costs stated pre exceptional and share based payments
… but further reductions required for demanding markets
Cost / ASK evolution
Con
trolla
ble
cost
sU
ncon
trolla
ble
cost
s
0.27 0.25 0.26 0.22 0.280.28 0.29 0.26 0.26 0.280.49 0.42 0.42 0.33 0.36
0.58 0.53 0.490.45 0.42
1.62 1.57 1.561.49 1.30
3.20 3.10 3.052.72 2.60
0.04(0.04) 0.05 (0.04)-
1.00
2.00
3.00
4.00
2005 2006 2007 2008 2009
€cen
t
Other Distribution cost En-route charges Maintenance Ground ops Staff One-off costs
0.08
(0.11)

Slide 16Aer Lingus Investor Day | 26 January 2010
Jan Feb Mar Apr May Jun Jul Aug Sep Oct Nov Dec2009 2008
Dec 09 + 2%Jan 09 -6%
- 18%
- 21%
- 19%
- 9%
Jan Feb Mar Apr May Jun Jul Aug Sep Oct Nov Dec
2009 2008
Immediate results – yield
Yields are improving and exceeded 2008 levels in December 2009
Source: Company information (2009 unaudited)Note (1): Represents quarter change on prior year quarterNote: Long haul revenue includes JFK/BOS/ORD/MCO only
Long haul fare revenue / ASK(y-o-y (1))
Source: Company information (2009 unaudited)
Transatlantic Business Class Load Factor
Slide 17Aer Lingus Investor Day | 26 January 2010
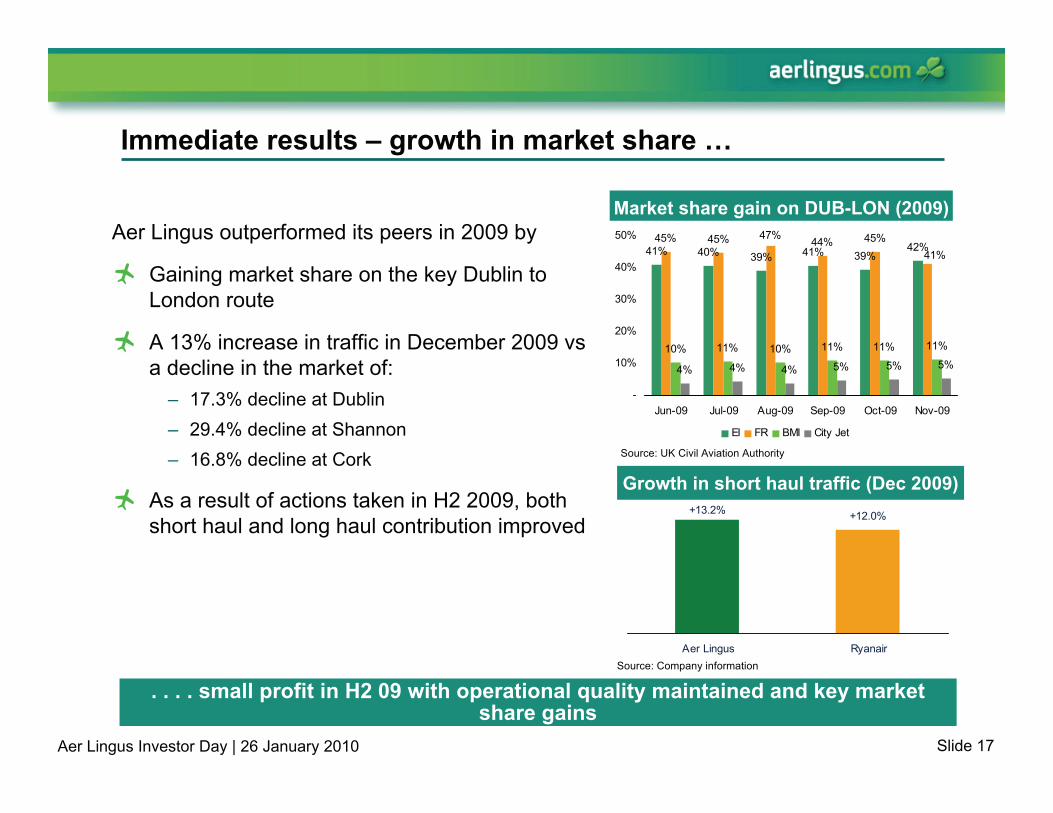
+13.2% +12.0%
Aer Lingus Ryanair
Immediate results – growth in market share …
Market share gain on DUB-LON (2009)
. . . . small profit in H2 09 with operational quality maintained and key market share gains
Aer Lingus outperformed its peers in 2009 by
Gaining market share on the key Dublin to London route
A 13% increase in traffic in December 2009 vs a decline in the market of:
– 17.3% decline at Dublin– 29.4% decline at Shannon– 16.8% decline at Cork
As a result of actions taken in H2 2009, both short haul and long haul contribution improved
Source: Company information
41% 40% 39% 41% 39%42%
45% 45% 47% 44% 45%
10% 11% 10% 11% 11% 11%
4% 4% 4% 5% 5% 5%
41%
-
10%
20%
30%
40%
50%
Jun-09 Jul-09 Aug-09 Sep-09 Oct-09 Nov-09
EI FR BMI City Jet
Source: UK Civil Aviation Authority
Growth in short haul traffic (Dec 2009)
Slide 18Aer Lingus Investor Day | 26 January 2010
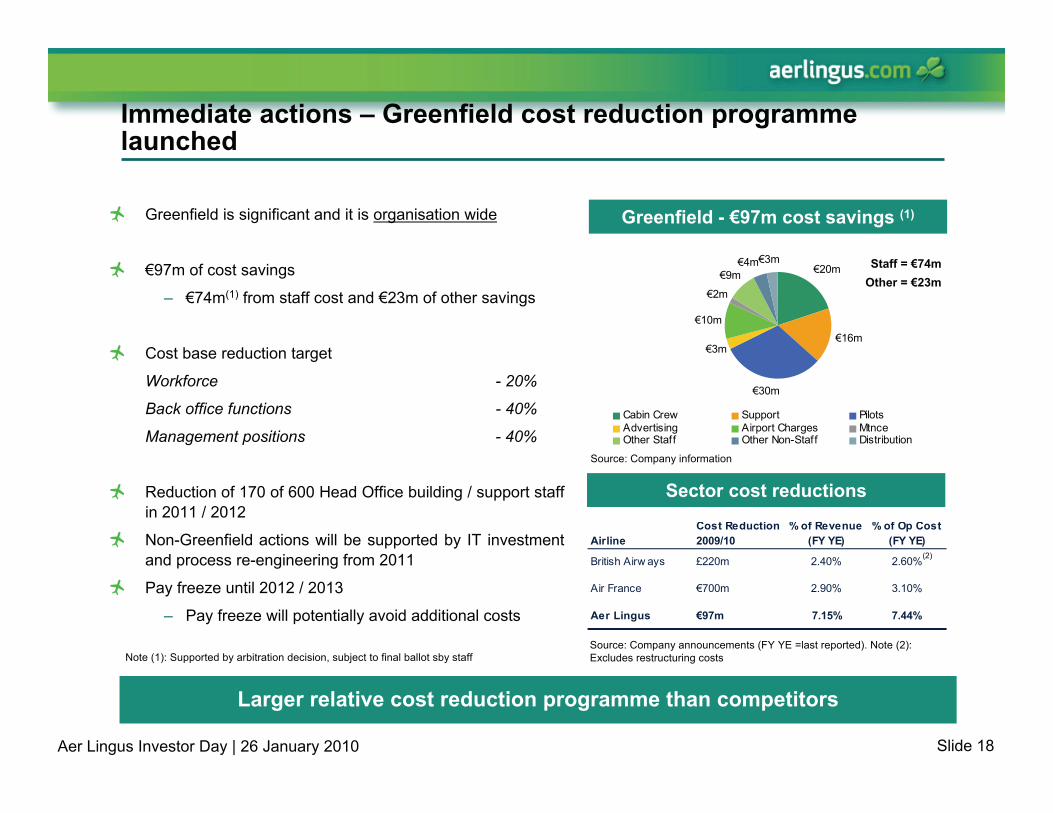
AirlineCost Reduction2009/10
% of Revenue (FY YE)
% of Op Cost (FY YE)
British Airw ays £220m 2.40% 2.60%
Air France €700m 2.90% 3.10%
Aer Lingus €97m 7.15% 7.44%
€20m
€16m
€30m
€3m
€10m
€2m
€9m€4m€3m
Cabin Crew Support PilotsAdvertising Airport Charges MtnceOther Staff Other Non-Staff Distribution
Greenfield is significant and it is organisation wide
€97m of cost savings
– €74m(1) from staff cost and €23m of other savings
Cost base reduction target
Workforce - 20%
Back office functions - 40%
Management positions - 40%
Reduction of 170 of 600 Head Office building / support staff in 2011 / 2012
Non-Greenfield actions will be supported by IT investment and process re-engineering from 2011
Pay freeze until 2012 / 2013
– Pay freeze will potentially avoid additional costs
Immediate actions – Greenfield cost reduction programme launched
Greenfield - €97m cost savings (1)
Source: Company information
Larger relative cost reduction programme than competitors
Staff = €74mOther = €23m
Sector cost reductions
Source: Company announcements (FY YE =last reported). Note (2): Excludes restructuring costs Note (1): Supported by arbitration decision, subject to final ballot sby staff
(2)

Slide 19Aer Lingus Investor Day | 26 January 2010
€40m€50m
€74m
€8m
€23m
€4m
€97m
€58m
€44m
-
20
40
60
80
100
120
2010 (forecast)
2010 (run rate)
2012 (full year)
Sav
ings
vs
2009
(€m
)Greenfield cost saving initiatives agreed
Restructuring costs have a payback period of less than 1 year – significantly better than previous agreements
Bulk of back office support andheadquarter headcount to occur in 2011 / 2012 – only limited impact in 2010 budget
€40m cash costs of redundancies in 2010 and €20m P&L charge in 2010 for redundancies to take place in 2011
Restructuring initiatives to return Aer Lingus to profitability by addressing fundamental structural issues
Key Cost Saving ElementsSavings overview – 2010 to 2012
Staff cost savings
Other cost savings
Source: Company information. Note: Above forecast assumes no change in operating environment
Slide 20Aer Lingus Investor Day | 26 January 2010
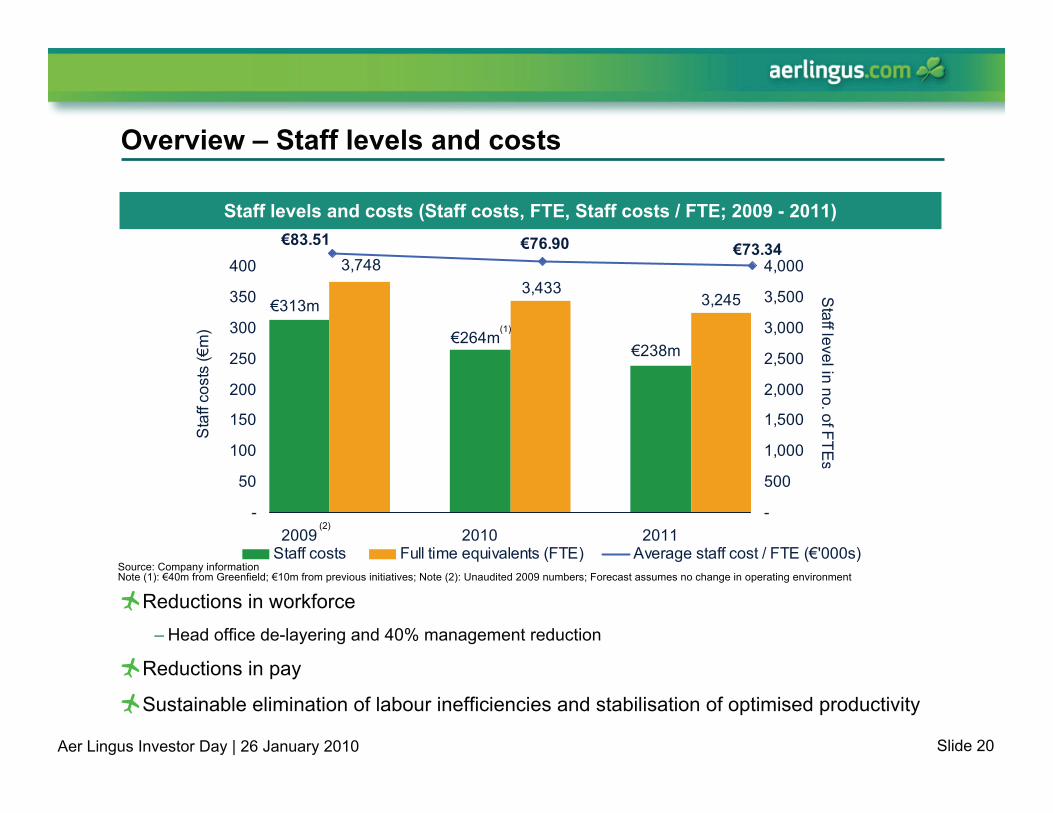
€238m€264m
€313m 3,2453,433
3,748
-
50
100
150
200
250
300
350
400
2009 2010 2011
Sta
ff co
sts
(€m
)
-
500
1,000
1,500
2,000
2,500
3,000
3,500
4,000
Staff level in no. of FTE
s d
Staff costs Full time equivalents (FTE) Average staff cost / FTE (€'000s)
€83.51 €73.34€76.90
Overview – Staff levels and costs
Staff levels and costs (Staff costs, FTE, Staff costs / FTE; 2009 - 2011)
Reductions in workforce– Head office de-layering and 40% management reduction
Reductions in pay
Sustainable elimination of labour inefficiencies and stabilisation of optimised productivity
Note (1): €40m from Greenfield; €10m from previous initiatives; Note (2): Unaudited 2009 numbers; Forecast assumes no change in operating environment
(1)
(2)
Source: Company information

Strategic options for Aer Lingus

Slide 22Aer Lingus Investor Day | 26 January 2010
Step 2“Greenfield” cost reduction programme
Cost reduction programme to re-align cost base for growth
Market / product positioning to match customer demand
Network optimisation and expansion
Expansion of alliances and partnerships
IT investment to drive yield and route optimisation
Step 3Profitable growth
Step IH2 2009
Stringently manage cash position
Pull capacity on loss making routes
Re-focus revenue philosophy to concentrate on yield
Improved cost position …
A three step approach ...
…opens the path to profitable growth

Slide 23Aer Lingus Investor Day | 26 January 2010
Adjusting the revenue model to drive profitable growth
Systematic and disciplined approach to looking at the business
Revenues can be maximised through the exploitation of superior product offering
IT investment will underpin the yield management model
Aer Lingus will seek to access latent demand through:
– Network enhancement– Exploring partnerships – Bespoke distribution channels
Yield Management
MarketPositioning
DistributionModel
IT Platform
Profitable Growth
Yield Management
PartnershipsNetwork Enhancement

Slide 24Aer Lingus Investor Day | 26 January 2010
Business13%
Leisure53%
Other6%
VFR28%
Network design – meeting our passengers’ needs
Our ‘time sensitive’ bookings
Only 13% of market passenger bookings are time sensitive – concentrated on a few routes
Relatively low proportion require high frequency time sensitive ‘business’travel
Time sensitive travel concentrated on a few routes e.g. Ireland – UK
% booked within 21 days of travel
- 10% 20% 30% 40% 50% 60%
IRE-UK
Sun
Overallshorthaul
UK-Air39%
UK-Sea8%
Europe46%
North America 7%
Passenger market overview (total to and from Ireland)
87% of travel to Ireland is non-business
Source: CSO
Our ‘time sensitive’ bookings
Source: Company information
The Market Aer Lingus

Slide 25Aer Lingus Investor Day | 26 January 2010
Enhancing the business model – value carrier
Pure LCC model not sustainable for Aer Lingus …– Deeply discounted aircraft not available
– Unsustainable tax funded regional airport incentive deals
– Reducing growth opportunities due to completion of modal split changes
– The cost overhang of the Aer Lingus seniority list
Whilst a ‘full service’ model is not competitive …– Small relative size of Business Market
– Disadvantageous geographic position for short haul connecting flows
– Low fares embedded in Irish Marketplace
Slide 26Aer Lingus Investor Day | 26 January 2010
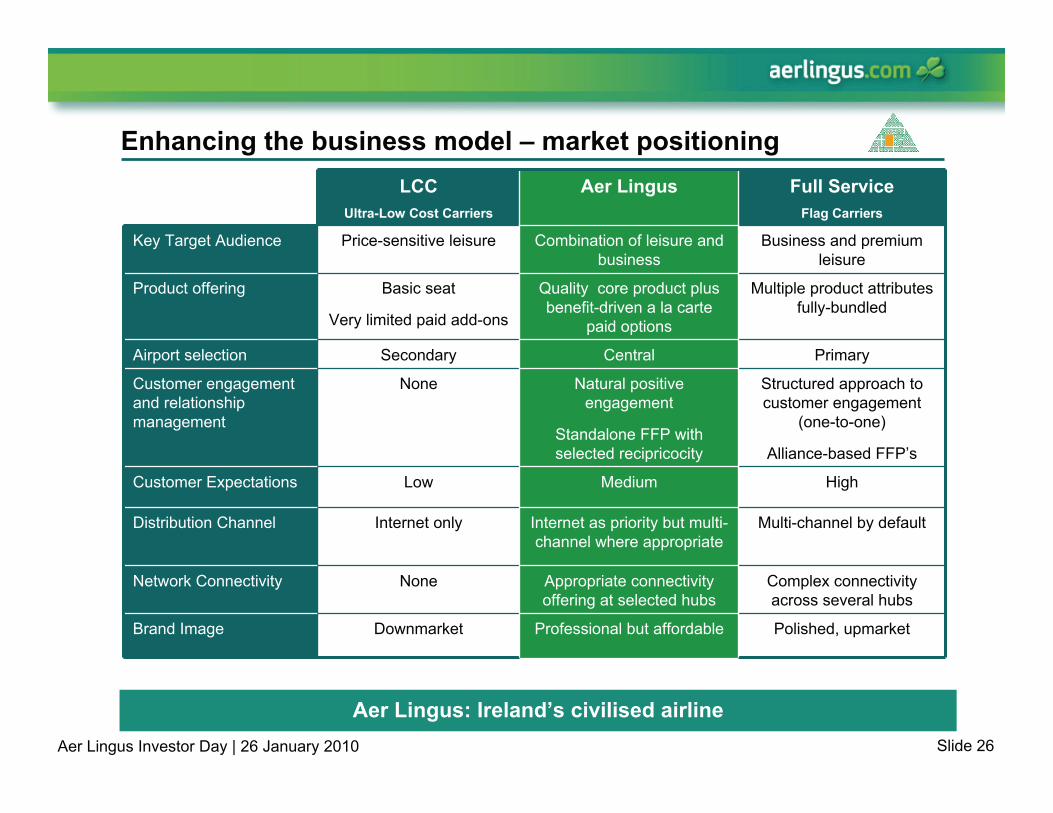
Enhancing the business model – market positioningLCC
Ultra-Low Cost Carriers
Aer Lingus Full ServiceFlag Carriers
Key Target Audience Price-sensitive leisure Combination of leisure and business
Business and premium leisure
Product offering Basic seat
Very limited paid add-ons
Quality core product plus benefit-driven a la carte
paid options
Multiple product attributes fully-bundled
Airport selection Secondary Central Primary
Customer engagement and relationship management
None Natural positive engagement
Standalone FFP with selected recipricocity
Structured approach to customer engagement
(one-to-one)
Alliance-based FFP’s
Customer Expectations Low Medium High
Distribution Channel Internet only Internet as priority but multi-channel where appropriate
Multi-channel by default
Network Connectivity None Appropriate connectivity offering at selected hubs
Complex connectivity across several hubs
Brand Image Downmarket Professional but affordable Polished, upmarket
Aer Lingus: Ireland’s civilised airline

Slide 27Aer Lingus Investor Day | 26 January 2010
Enhancing the business model – product positioning
Primary airports with full multi channel distribution
High
Low
Positioning
Full ServiceMultiple product
attributes and services that are all-
inclusive
Aer LingusStrong core
product attributes
with benefit-driven paid
options
LCCA seat with very basic and limited paid add-
ons
Service level rating
More ways to check-in & premium desksHigher quality loungesCarry children unaccompanied
Greater seat pitch than Hybrid or LCC’s
Free food and beveragesComp drinksHigher crew:pax ratio
Consistent use of jetwaysFull transfer connectivity
Full alliance driven FFP with many partnersLeveraged use of customer database and customer contact strategy
Central airports with selected multi channel distribution
Lounge access for FFPFlexiFares
Good seat comfort, recline and amenities
Pre-order food/all-day breakfast and good crew engagement
Occasional use of jetwaysLimited transfer connectivity
FFP with few partners
Secondary airports with internet only distribution
Charge to check-inFirst-come boarding
No seat reclineNo window blindsNo coat hooksNo literature pocketsLow seat pitch
Paid food and drinks with limited choice
No jetwaysNo transfers
Credit card based reward programme
Before flight
Departure airport
Inflight product
Crew & catering
Arrival airport
Post flight
Central airports BookingReservations
Check-inLoungesBoarding
Seating and comfortTechnology
Food, beverages and drinksCrew:Passengerratio
Aircraft parking JetwaysBaggage claim & Transfers
Loyalty programme and CRM
Enhanced modular offering for customers
Slide 28Aer Lingus Investor Day | 26 January 2010
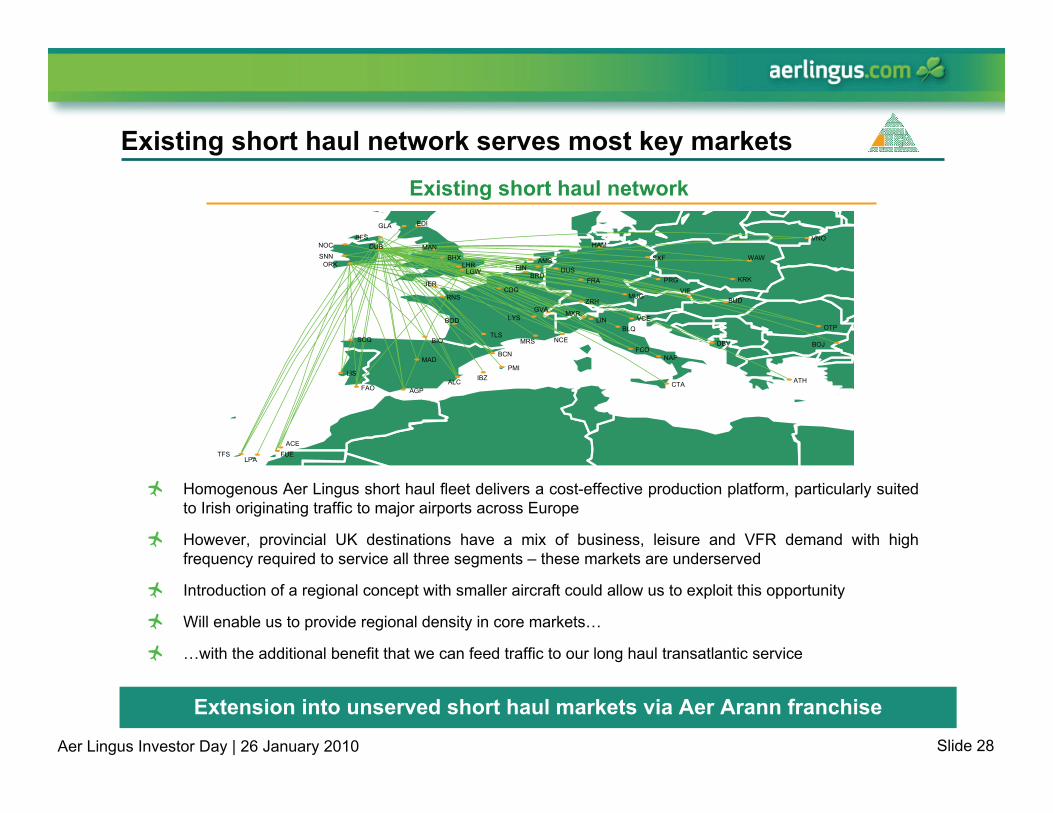
Existing short haul network serves most key marketsExisting short haul network
Homogenous Aer Lingus short haul fleet delivers a cost-effective production platform, particularly suited to Irish originating traffic to major airports across Europe
However, provincial UK destinations have a mix of business, leisure and VFR demand with high frequency required to service all three segments – these markets are underserved
Introduction of a regional concept with smaller aircraft could allow us to exploit this opportunity
Will enable us to provide regional density in core markets…
…with the additional benefit that we can feed traffic to our long haul transatlantic service
Extension into unserved short haul markets via Aer Arann franchise
GLA EDI
BFSNOC
SNN
VNO
ORK
DUB MANBHX
LHRLGW
HAM
WAWSXF
KRK
OTP
BUD
PRG
AMS
BOJ
EIN DUSBRU
FRAJER
RNS
BOD
BIOSCQ
LIS
MADBCN
TLS
PMIIBZALC
AGPFAO
ACEFUETFS
LPA
VIEMUG
ZRH
CDG
DBV
ATH
VCEBLQ
CTA
NAPFCO
NCEMRS
LYSGVA MXR
LIN

Slide 29Aer Lingus Investor Day | 26 January 2010
Aer Arann partnership enhances short haul network
Aer Lingus operatedProposed franchise routes Phase I
ROI / UK regional networkAer Arann franchise arrangement enhances network
– Cardiff, Glasgow, Edinburgh etc
Key advantages are– Deepens penetration in core Ireland and
UK markets– Improves network frequency– Serves regional business markets– Consolidates long haul traffic in Dublin hub
All achieved at no cost to Aer Lingus
Aer Lingus will selectivity seek new routes to in-fill short haul network
– But new routes need to deliver return on investment
Aer Arann franchise will make a positive profit contribution
NOC
BFS
GLAEDI
MME
JER
BLK
DSA
BRS LHRLGW
CWL
BHX
DUB
ORK
SNN
MAN
Slide 30Aer Lingus Investor Day | 26 January 2010
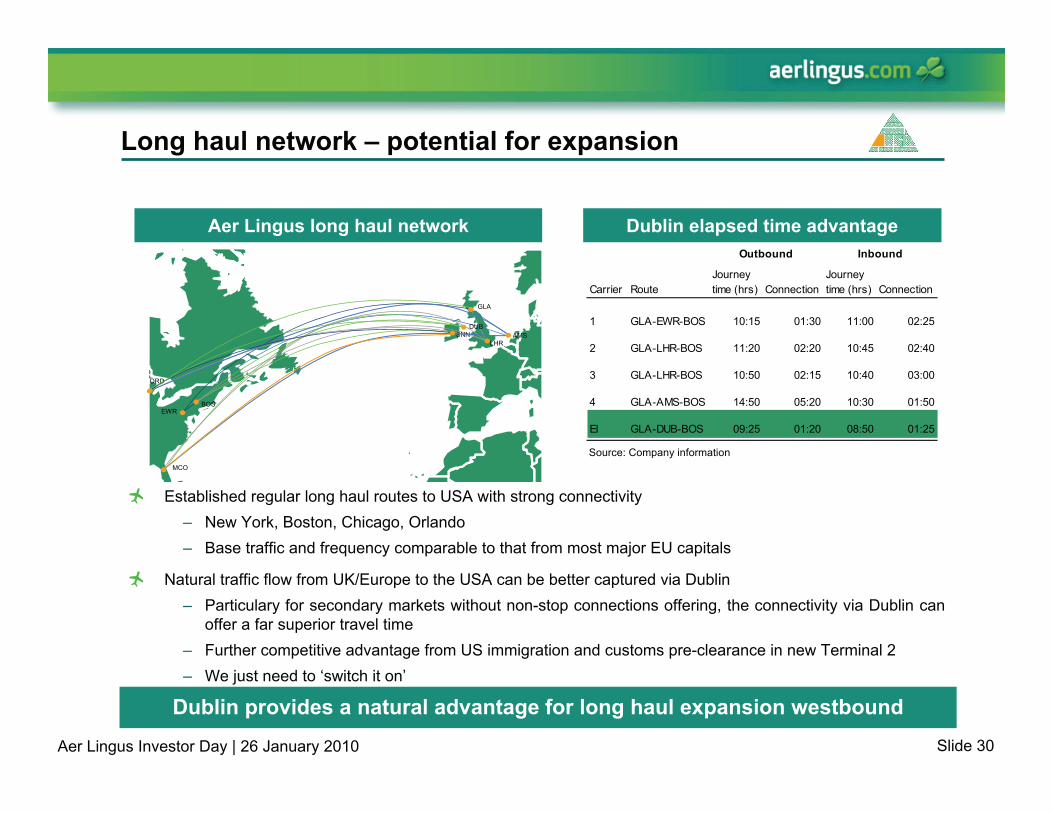
Long haul network – potential for expansion
Dublin elapsed time advantageAer Lingus long haul network
Established regular long haul routes to USA with strong connectivity– New York, Boston, Chicago, Orlando– Base traffic and frequency comparable to that from most major EU capitals
Natural traffic flow from UK/Europe to the USA can be better captured via Dublin– Particulary for secondary markets without non-stop connections offering, the connectivity via Dublin can
offer a far superior travel time– Further competitive advantage from US immigration and customs pre-clearance in new Terminal 2– We just need to ‘switch it on’
Dublin provides a natural advantage for long haul expansion westbound
Carrier RouteJourney time (hrs) Connection
Journey time (hrs) Connection
1 GLA-EWR-BOS 10:15 01:30 11:00 02:25
2 GLA-LHR-BOS 11:20 02:20 10:45 02:40
3 GLA-LHR-BOS 10:50 02:15 10:40 03:00
4 GLA-AMS-BOS 14:50 05:20 10:30 01:50
EI GLA-DUB-BOS 09:25 01:20 08:50 01:25
Outbound Inbound
GLA
AMSDUB
LHRSNN
BOSEWR
MCO
ORD
Source: Company information

Slide 31Aer Lingus Investor Day | 26 January 2010
Long haul network – connectivity
Beyond US Gateway Traffic – JetBlue and United Airlines
Dallas Fort Worth
AustinHouston
Seattle
Aguadilla
Portland
PonceSan Juan
Omaha
New OrleansJacksonville
St Louis
ChicagoKansas City
Minneapolis
ClevelandDetroit
BaltimoreWashington
Richmond
Raleigh-DurhamCharlotte
CincinnatiLouisville
IndianapolisPittsburgh
Columbus
Nashville
Atlanta
Buffalo Rochester
Lexington
San Jose
BurbankLong Beach Phoenix
Las Vegas
San Diego
Los Angeles
Oakland
San FranciscoSacramento
Salt Lake City
Denver
Miami
Orlando
Fort Myers Fort LauderdaleWest Palm Beach
Tampa
SyracuseBurlington
BostonNew York
Portland MC
Aer Lingus now connecting to over 50 US cities
JetBlue relationship traffic grew over 170% in 2009 versus 2008
EI code now on 35 cities with United Airlines with application for six Canadian cities pending

Slide 32Aer Lingus Investor Day | 26 January 2010
Long haul network – connectivity
European Connectivity to US via Dublin
Aer Lingus now connecting to US from over 27 European cities via Dublin. This number will grow with Aer Arann franchise
Significant year on year growth 7% in 2008 and 31% in 2009
Traffic source will be further leveraged by additional connectivity
Lisbon
Faro Malaga
Glasgow Edinburgh
Gatwick
Madrid Barcelona
Nice
MilanLINATE
Munich
Frankfurt
AmsterdamDusseldorf
Brussels
Paris
Vienna
.Vilnius
Warsaw
Krakow
USA via Dublin
Shannon Manchester
Rome
Birmingham
Heathrow
Slide 33Aer Lingus Investor Day | 26 January 2010
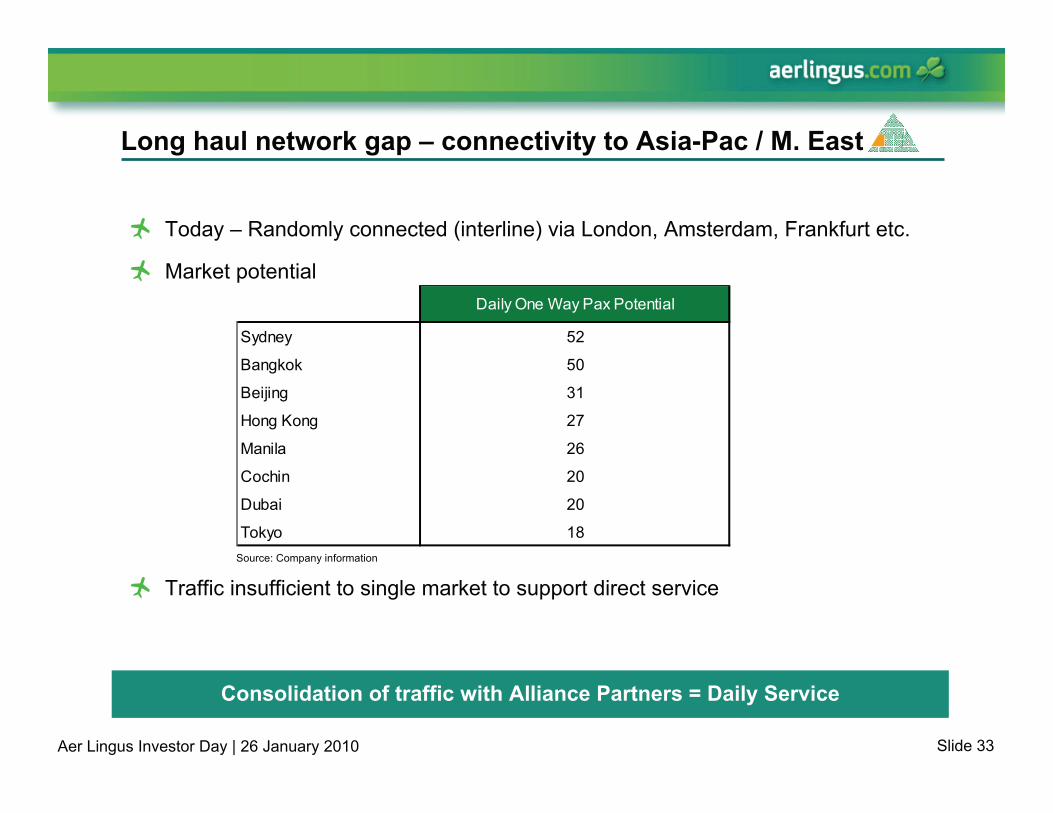
Long haul network gap – connectivity to Asia-Pac / M. East
Today – Randomly connected (interline) via London, Amsterdam, Frankfurt etc.
Market potential
Traffic insufficient to single market to support direct service
Consolidation of traffic with Alliance Partners = Daily Service
Daily One Way Pax Potential
Sydney 52
Bangkok 50
Beijing 31
Hong Kong 27
Manila 26
Cochin 20
Dubai 20
Tokyo 18Source: Company information

Slide 34Aer Lingus Investor Day | 26 January 2010
Aer Lingus has a successful partner network
Connecting and point-to-point code-share between Ireland and North America
In addition, Aer Lingus has its code on 35 domestic US services and growing
Delivered in excess of 150 sectors per day in first full year of relationship
Connecting code-share between Dublin and Cork to Amsterdam
Serving traffic flows to Far East and Africa
Delivered close to 150,000 sectors in 2009
Connections via New York and Boston to more than 40 jetBlue destinations
Low cost distribution on aerlingus.com and soon to be expanded onto GDS platform
Delivering in excess of 60 sectors per day
Connecting code-share between Dublin, Cork, Belfast and London
Serving traffic flows to Middle/Far East, Australia, New Zealand and Africa
Delivered in excess of 150,000 sectors in 2009
Aer Lingus has developed a partner network providing network depth
Slide 35Aer Lingus Investor Day | 26 January 2010
United Extended Code Share
Initial service between Washington, Dulles and Madrid – To commence daily operations from March 2010
Both carriers equally share the commercial and economic benefits and risk– Aer Lingus managing the operational aspects of the new partnership services
– United Airlines taking responsibility for managing revenue generation
The Partnership route structure will be marketed and sold under both Aer Lingus and United Airlines codes
– Will leverage both parties’ network capabilities
Further expansion and development of the partnership will be jointly assessed and agreed and may develop into a broader and deeper joint venture

Slide 36Aer Lingus Investor Day | 26 January 2010
Yield management – general principles
– Maintain low fare proposition as central to competitive position
– Generate a premium to lowest fare based on service and network offering
– Maximise ancillary revenue and cost recovery opportunities
– Unbundle product to maximise total revenue opportunity
– Recalibrate pricing model to manage elasticity and segment demand
New revenue management model will contribute to yield enhancement
Low fare
Recalibrate pricing model
Unbundle product
Maximise ancillary revenue
Premium to lowest fare
Mod
el e
volu
tion

Slide 37Aer Lingus Investor Day | 26 January 2010
Revenue management
Different business models
Max revenue per ASK ‘opening and closing fare classes to maximise yield’
Max SLF ‘changing price to maximise load factor’
LCC
Full service
Slide 38Aer Lingus Investor Day | 26 January 2010
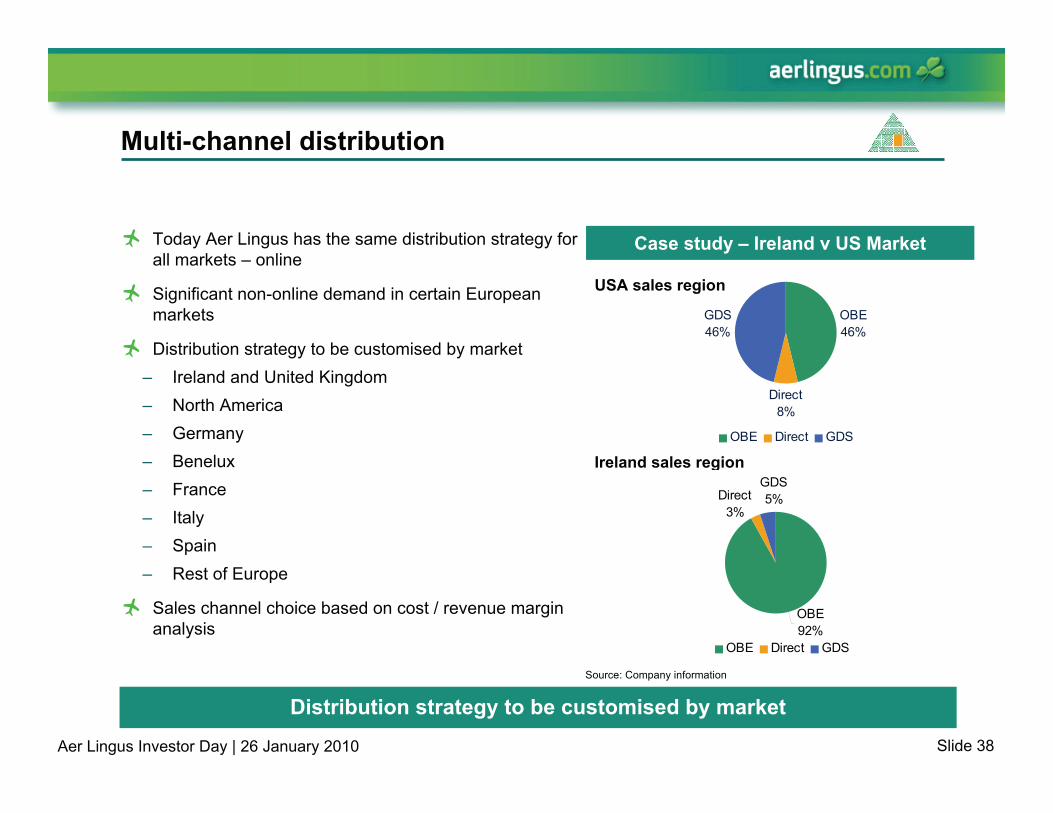
OBE46%
Direct8%
GDS46%
OBE Direct GDS
Multi-channel distribution
Distribution strategy to be customised by market
Today Aer Lingus has the same distribution strategy for all markets – online
Significant non-online demand in certain European markets
Distribution strategy to be customised by market– Ireland and United Kingdom– North America– Germany– Benelux– France– Italy– Spain– Rest of Europe
Sales channel choice based on cost / revenue margin analysis
Case study – Ireland v US Market
USA sales region
Ireland sales region
Source: Company information
Direct3%
OBE92%
GDS5%
OBE Direct GDS
Slide 39Aer Lingus Investor Day | 26 January 2010
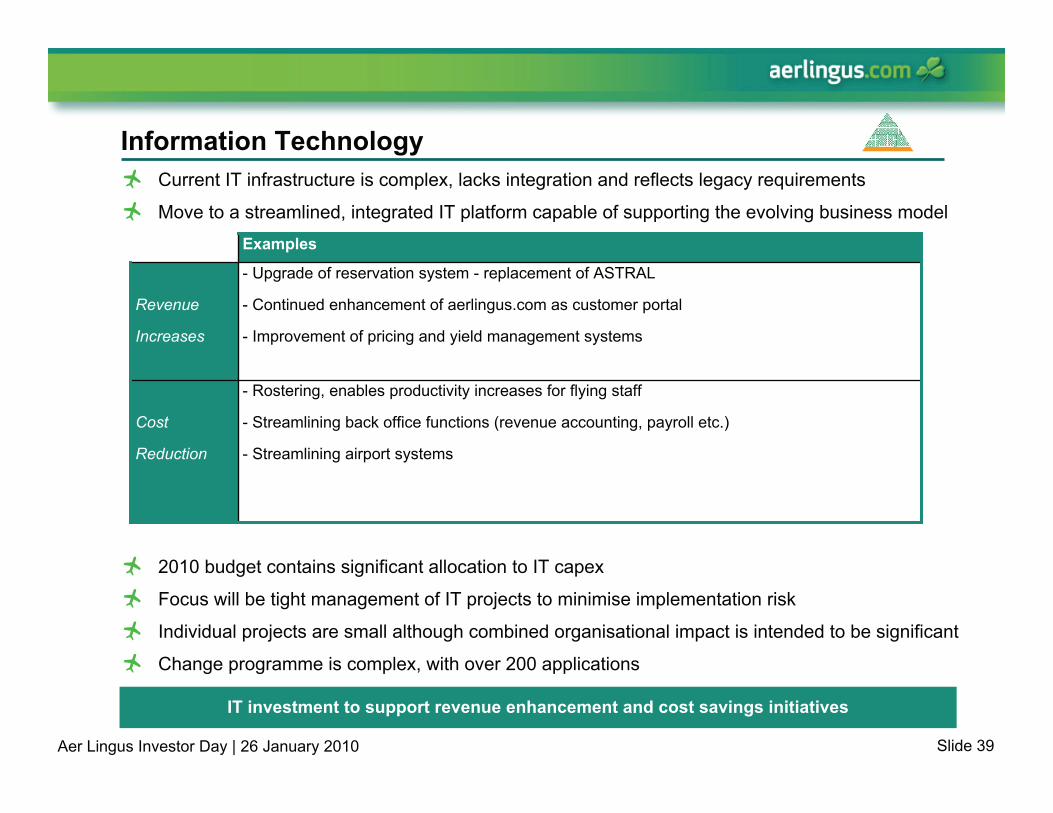
Information Technology
IT investment to support revenue enhancement and cost savings initiatives
Current IT infrastructure is complex, lacks integration and reflects legacy requirements
Move to a streamlined, integrated IT platform capable of supporting the evolving business model
- Rostering, enables productivity increases for flying staff
- Streamlining back office functions (revenue accounting, payroll etc.)
- Streamlining airport systems
- Upgrade of reservation system - replacement of ASTRAL
- Continued enhancement of aerlingus.com as customer portal
- Improvement of pricing and yield management systems
Examples
Cost
Reduction
Revenue
Increases
2010 budget contains significant allocation to IT capex
Focus will be tight management of IT projects to minimise implementation risk
Individual projects are small although combined organisational impact is intended to be significant
Change programme is complex, with over 200 applications

Andrew MacfarlaneInterim CFO

Slide 41Aer Lingus Investor Day | 26 January 2010
770
493
55
684
-
100
200
300
400
500
600
700
800
900
Cash Leasing Debt NBV of aircraftfleet
€m
Unrestricted Cash Restricted CashOwned & leased assets
Cash & debt balances as at 31/12/09
Robust balance sheet
Source: Company information (unaudited)Net book value of aircraft subject to impairment testing“Cash” balances comprise cash, deposits, current account balances and other investments
Aer Lingus has the financial flexibility & strength to endure difficult trading conditions
No restrictions on €770m of gross cash balances
Leasing debt does not carry financial covenants or terms that act as a constraint on operations
79% of cash invested for periods of < 1 year
We own 23 of our 44 aircraft
Slide 42Aer Lingus Investor Day | 26 January 2010
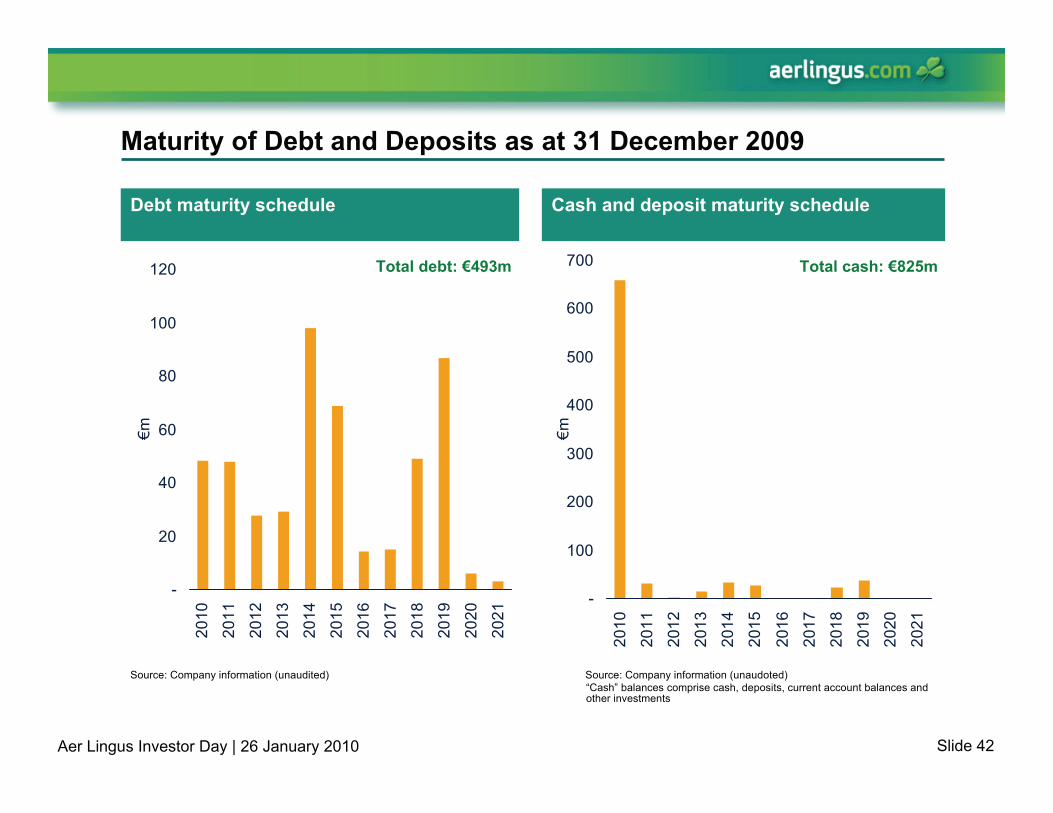
Maturity of Debt and Deposits as at 31 December 2009
Debt maturity schedule Cash and deposit maturity schedule
Source: Company information (unaudoted)Source: Company information (unaudited)
-
20
40
60
80
100
120
2010
2011
2012
2013
2014
2015
2016
2017
2018
2019
2020
2021
€m
-
100
200
300
400
500
600
700
2010
2011
2012
2013
2014
2015
2016
2017
2018
2019
2020
2021
€m
“Cash” balances comprise cash, deposits, current account balances and other investments
Total debt: €493m Total cash: €825m
Slide 43Aer Lingus Investor Day | 26 January 2010
-
50
100
150
200
250
300
350
400
2010 2011 2012 2013 2014-
100
200
300
400
500
600
700
800
900
1,000
Potential lease payments if maturing leases extended
Aggregate capex
Aggregate capex 2015-2018 (right hand scale)
2015-2018
€m
€m
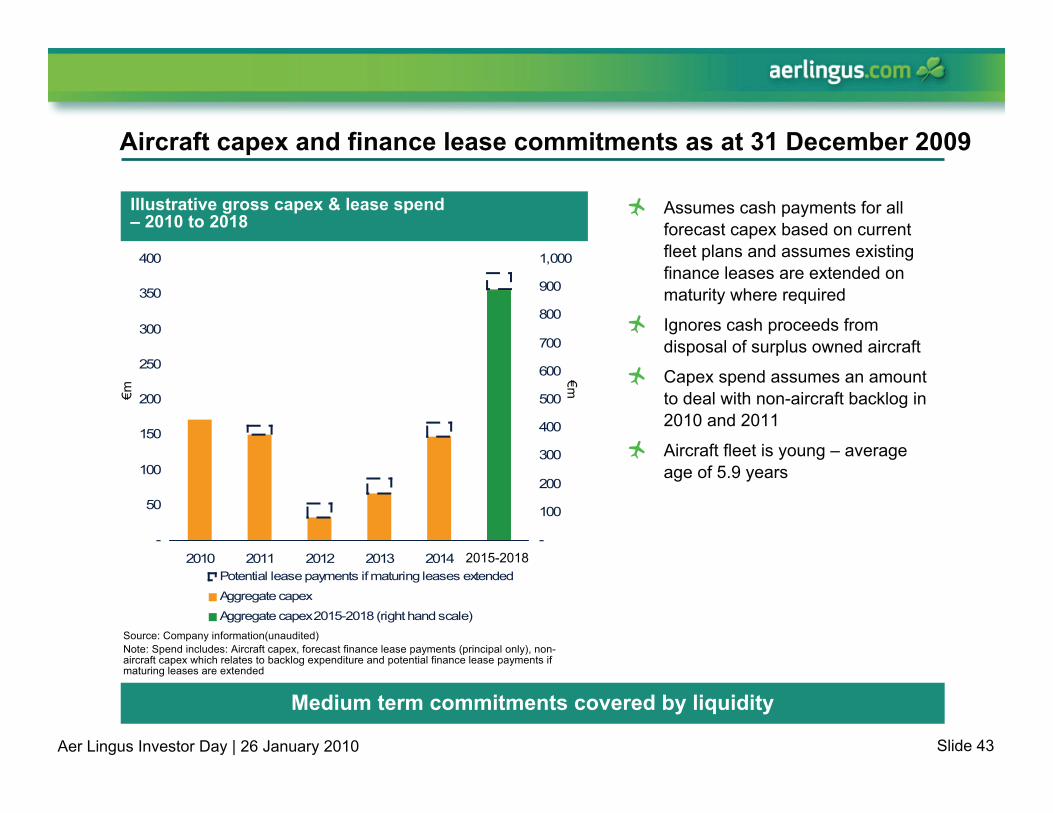
Aircraft capex and finance lease commitments as at 31 December 2009
Assumes cash payments for all forecast capex based on current fleet plans and assumes existing finance leases are extended on maturity where required
Ignores cash proceeds from disposal of surplus owned aircraft
Capex spend assumes an amount to deal with non-aircraft backlog in 2010 and 2011
Aircraft fleet is young – average age of 5.9 years
Medium term commitments covered by liquidity
Illustrative gross capex & lease spend – 2010 to 2018
Source: Company information(unaudited)Note: Spend includes: Aircraft capex, forecast finance lease payments (principal only), non-aircraft capex which relates to backlog expenditure and potential finance lease payments if maturing leases are extended
Slide 44Aer Lingus Investor Day | 26 January 2010
2009 cash flow
Over the course of 2009, Aer Lingus’ gross cash reduced by c.€400m
Four main drivers of the outflow:
– 2009 operating loss
– Payment for restructuring costs that had been provided for at the end of 2008
– Finance raised for only one of the 2009 aircraft deliveries resulting in net cash outflow for capex of c.€100m
– Repayment of maturing debt
Aer Lingus has sufficient liquidity to meet its medium term requirements
Source: Company information (unaudited)

Slide 45Aer Lingus Investor Day | 26 January 2010
0
200
400
600
800
1000
1200
1400
1600
2005
2006
2007
2008
2009
2010
2011
2012
2013
Fuel hedging
Source: Company information
Revised approach to fuel price hedging should smooth underlying volatility
2010
2011
67%
16%
$772/tonne
$762/tonne
% hedged Price (1)
Hedging levelsActual historic & forward fuel prices 2005 – 2013
2009 fuel cost €332m for 496,000 tonnes (2008: €401m for 539,000tonnes)
Until H1 2009, Aer Lingus’ hedging policy focused on:– Minimum hedge level
– Strategic hedging of remaining risk
From H2 2009 onwards, Aer Lingus has adopted a systematic approach to hedging
(1) Excluding “intoplane” costs of $50-$60 per tonne
$/to
nne
Slide 46Aer Lingus Investor Day | 26 January 2010
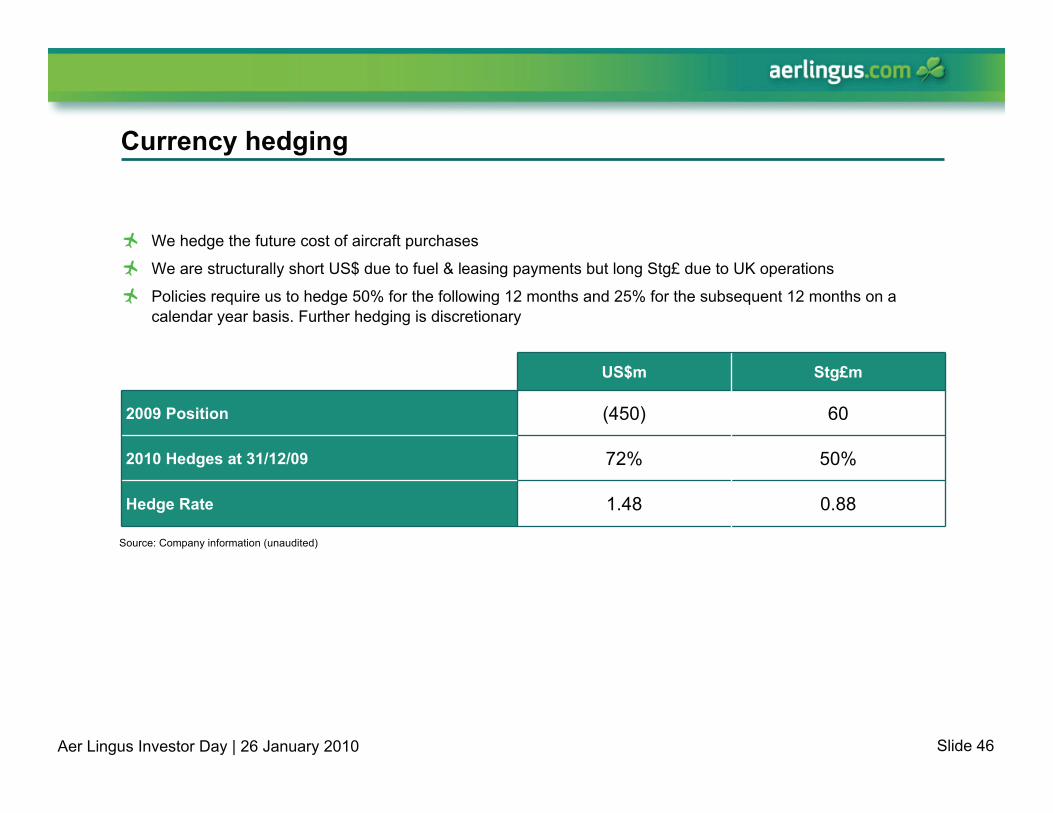
Currency hedging
0.88
50%
60
Stg£mUS$m
2009 Position (450)
2010 Hedges at 31/12/09 72%
Hedge Rate 1.48
We hedge the future cost of aircraft purchases
We are structurally short US$ due to fuel & leasing payments but long Stg£ due to UK operations
Policies require us to hedge 50% for the following 12 months and 25% for the subsequent 12 months on a calendar year basis. Further hedging is discretionary
Source: Company information (unaudited)

Slide 47Aer Lingus Investor Day | 26 January 2010
Considerations for 2010
2010 will be a year of transition to position Aer Lingus for recovery
We are prepared for another year of tough market conditions – we expect revenues to continue to decline. In addition, Q1 bookings have been affected by bad weather
Capacity reductions in Gatwick only after Q1 2010
Any movement in currency exchange rate (Sterling / Euro) may impact top line and results
Uncertainty of Air Traffic Controller labour relations
Fuel costs should be lower than in 2009
Airport charges are likely to be c.€20m higher but uncertainty about ability to pass departure tax and increased airport fees onto passenger without significant volume losses
In-year benefits of Greenfield staff savings (assuming favourable ballots) of c.€40m. Exit run rate of c.€50m. Further staff savings to be delivered in 2011 and 2012. Total savings of €74m still expected to be achieved
In-year benefits of non-staff Greenfield savings of €4m. Exit rate at end of 2011 expected to be €23m
Interest income will be broadly offset by interest expense
Full year 2009 results will be announced on 10 March 2010

SummaryChristoph Mueller

Slide 49Aer Lingus Investor Day | 26 January 2010
Summary
Fundamentally attractive airline
Actions taken to enhance short term position
Greenfield will dramatically alter the cost base
Opportunities for profitable growth in the long term
Appendices

Slide 51Aer Lingus Investor Day | 26 January 2010
Appendix – Aer Lingus profile
A reminder, Aer Lingus in overview– Founded in 1936 by Irish Government. In October 2006, it was
floated the Irish and London Stock Exchanges
Award winning products & services offering– Passengers: contributes over 85% of revenue (2008) with both
economy and business class offered
– Ancillary services: including in-flight catering and magazine, hotel and car bookings. The sector has shown strongest revenue growth in past few years, 38% y-o-y in 2008
– Cargo: transportation on both long and short haul routes with cargo handling also provided for other airlines from Irish bases
Young modern aircraft– Short haul fleet: 6 Airbus A321s and 30 Airbus A320s; all
economy class seating with 4 A320s for delivery from 2010
– Long haul fleet: 8 Airbus A330 aircraft
Global network– 80 routes to and from the United Kingdom and Continental
Europe, and a long haul network to six destinations in the USA
– Enhanced via partnerships with British Airways, jetBlue, KLM and recently United Airlines
Fleet overview (2009)
Source: Company information. Note (1): Unaudited 2009 numbers
Financial summary
Source: Company information
€m 2007 2008 H1 2009 (1)
Revenue 1,285 1,357 555Passenger 1,123 1,152 452Ancilliary 109 150 84Other 53 56 19
EBIT (pre exceptionals) 79 (18) (93)
Net profit 105 (108) (74)
23 21
Leased Ow ned
6
30
35
A321 A320
A330-200 A330-300
Top Related