


Languages
Pages
Legal

National Aeronautics and Space Administration
www.nasa.gov
ARSET Applied Remote Sensing Training http://arset.gsfc.nasa.gov @NASAARSET
Advanced Webinar on using NASA Remote Sensing for Flood Monitoring and Management
Instructors: • Amita Mehta (ARSET) • Elena Cristofori (Guest Speaker, TRIM)
Week-1

National Aeronautics and Space Administration Applied Remote Sensing Training Program 2
Course Structure
• One session per week on March 16, 23, 30, and April 6, 2016 – 8:00 a.m. – 9:00 a.m. EDT (UTC-4) for Europe, Africa, the Middle East, and Southeast Asia
– 4:00 p.m. – 5:00 p.m. EDT (UTC-4) for the Americas and Asia-Pacific
• Each session will include – Presentations
– Demonstrations and instructions for hands-on exercises for selected flood cases
– A homework assignment
• Q & A following each session or by email to Amita Mehta ([email protected])

National Aeronautics and Space Administration Applied Remote Sensing Training Program 3
• Week 1: About ARSET & NASA Remote Sensing Data for Flood Management, Intro to Flood Monitoring Tools
• Week 2: Overview of TRMM-based Flood Monitoring Tools
• Week 3: Demonstration of the MODIS-based Inundation Mapping
http://arset.gsfc.nasa.gov/disasters/webinars/nasa-remote-sensing-observations-flood-management
Prerequisite NASA Remote Sensing Observations for Flood Management

National Aeronautics and Space Administration Applied Remote Sensing Training Program 4
Course Material
Webinar presentations, exercises, homework assignments, and recordings
http://arset.gsfc.nasa.gov/disasters/webinars/advfloodwebinar
Links will be available here

National Aeronautics and Space Administration Applied Remote Sensing Training Program 5
Homework and Certificate
• Homework – Hands-on exercises
– Answers to homework questions via Google form
– Available at http://arset.gsfc.nasa.gov/disasters/webinars/advfloodwebinar
• Certificate of Completion – Attend all 4 webinar sessions
– Complete all 4 homework assignments
– Certificates will be emailed approx. 2 months after the course finishes by Marines Martins ([email protected])
National Aeronautics and Space Administration Applied Remote Sensing Training Program 6
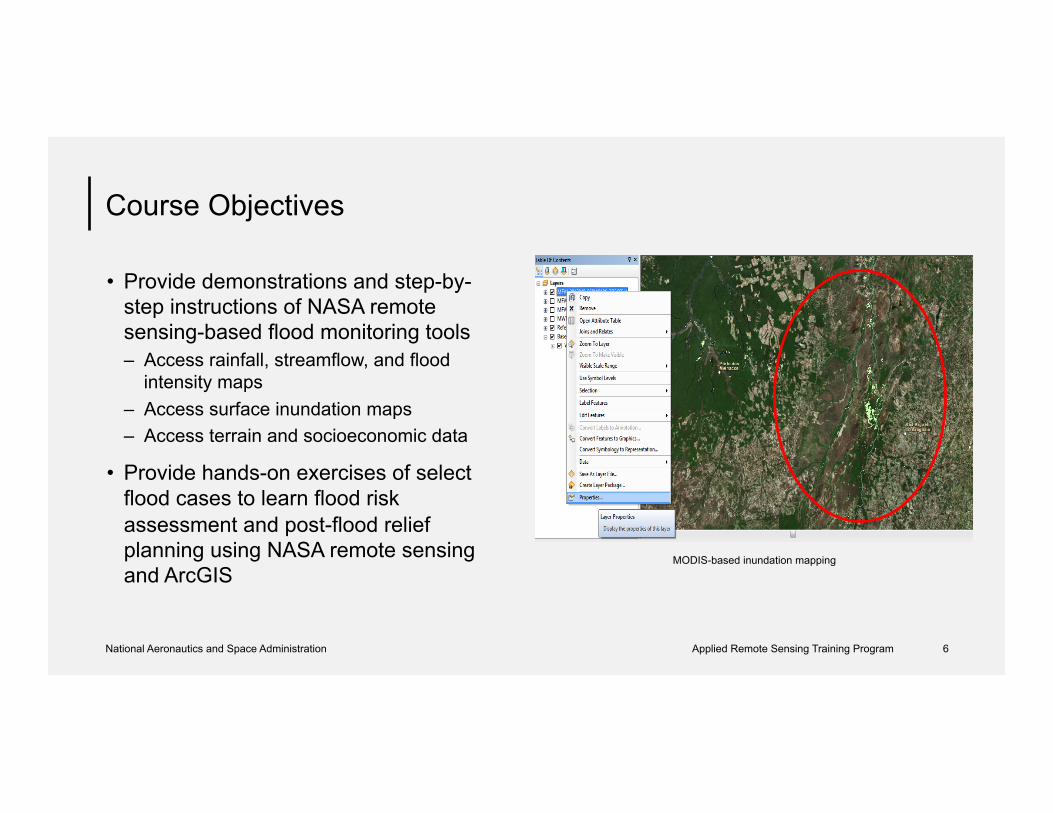
MODIS-based inundation mapping
Course Objectives
• Provide demonstrations and step-by-step instructions of NASA remote sensing-based flood monitoring tools – Access rainfall, streamflow, and flood
intensity maps – Access surface inundation maps – Access terrain and socioeconomic data
• Provide hands-on exercises of select flood cases to learn flood risk assessment and post-flood relief planning using NASA remote sensing and ArcGIS

National Aeronautics and Space Administration Applied Remote Sensing Training Program 7
Course Outline
Week 1: Demonstration of Flood Mapping Web Tools Based on NASA Remote Sensing Observations of Rainfall
Week 2: Demonstration of Flood Mapping Web Tools Based on NASA Remote Sensing Observations of Land Cover
Week 3: Overview & Access to Ancillary NASA Data for Flood Management
Week 4: Flooding Case Studies Using NASA Web Tools and GIS
National Aeronautics and Space Administration Applied Remote Sensing Training Program 8
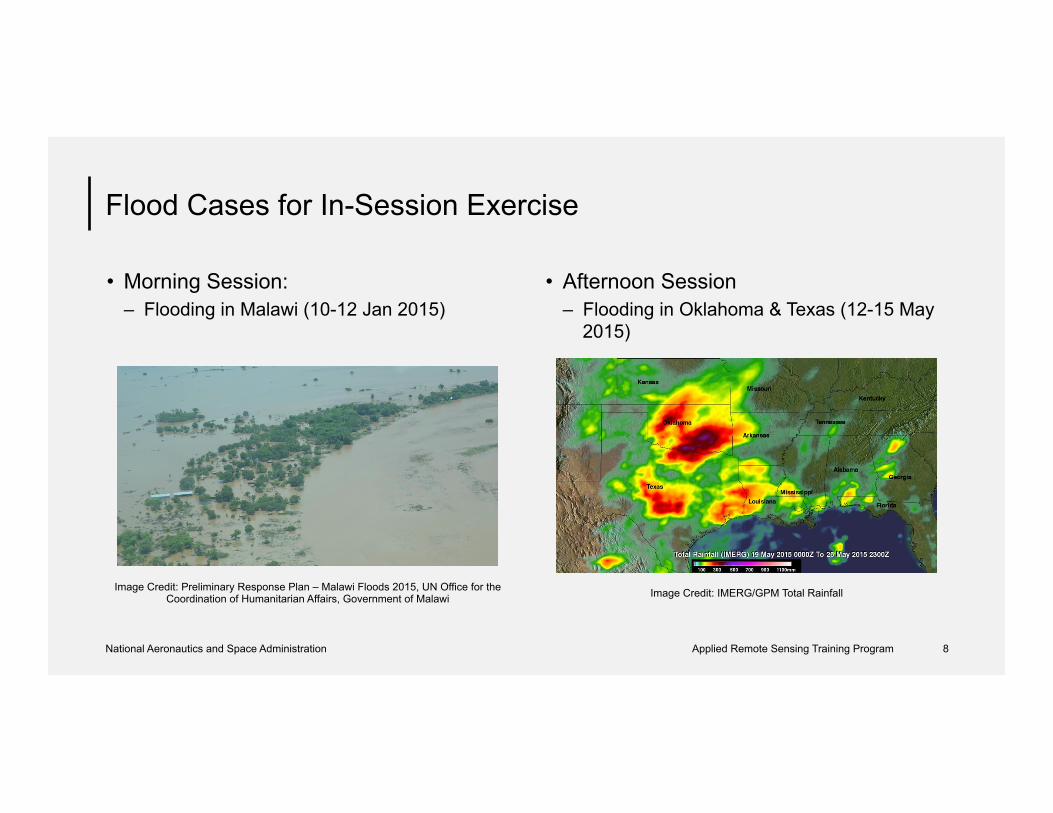
• Morning Session: – Flooding in Malawi (10-12 Jan 2015)
• Afternoon Session – Flooding in Oklahoma & Texas (12-15 May
2015)
Flood Cases for In-Session Exercise
Image Credit: Preliminary Response Plan – Malawi Floods 2015, UN Office for the Coordination of Humanitarian Affairs, Government of Malawi Image Credit: IMERG/GPM Total Rainfall
National Aeronautics and Space Administration Applied Remote Sensing Training Program 9
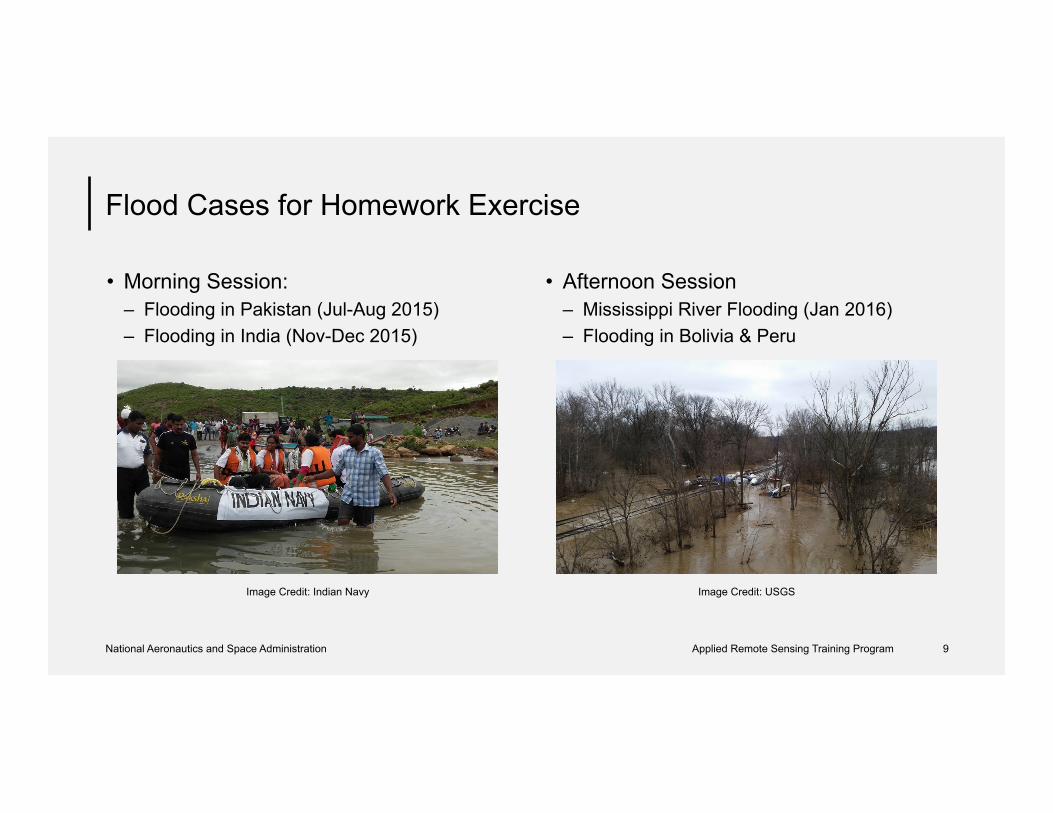
• Morning Session: – Flooding in Pakistan (Jul-Aug 2015) – Flooding in India (Nov-Dec 2015)
• Afternoon Session – Mississippi River Flooding (Jan 2016) – Flooding in Bolivia & Peru
Flood Cases for Homework Exercise
Image Credit: Indian Navy Image Credit: USGS

National Aeronautics and Space Administration Applied Remote Sensing Training Program 10
Agenda: Week 1
• Review of NASA flood monitoring tools
• Overview of NASA/USAID SERVIR
• Demonstration and hands-on exercise of accessing Rainfall, Streamflow, and Flood Intensity from Global Flood Monitoring System (GFMS)
• Overview and hands-on exercise of using Extreme Rainfall Detection System (ERDS) for Flood Early Warning
Image Credit: Terra MODIS/Worldview; 17 Jan 2016
Review of NASA Flood Monitoring Tools

National Aeronautics and Space Administration Applied Remote Sensing Training Program 12
NASA Remote Sensing Observations for Flood Monitoring
There are primarily 3 types of flood monitoring tools that use remote sensing observations:
1. Derive streamflow & runoff to monitor flooding conditions by using rainfall and weather data in a hydrology model – Global Flood Monitoring System (GFMS) http://flood.umd.edu – NASA and US Agency for International Development SERVIR : h$p://www.servirglobal.net
2. Infer flooding conditions by using satellite-derived precipitation – Extreme Rainfall Detection System (ERDS):
http://playground.ithacaweb.org/apps/world/leaflet/erds2.html/#layers
3. Detect flood water on previously dry land surfaces by using satellite-derived land-cover observations – MODIS NRT Global Flood Mapping: http://oas.gsfc.nasa.gov/floodmap/ – Dartmouth Flood Observatory: http://floodobservatory.colorado.edu/
http://arset.gsfc.nasa.gov/sites/default/files/users/Flood_Week1_8June2015_Final.pdf

National Aeronautics and Space Administration Applied Remote Sensing Training Program 13
Flood Monitoring Using NASA Rainfall Observations
1. Derive streamflow & runoff to monitor flooding conditions by using rainfall and weather data in a hydrology model – Global Flood Monitoring System (GFMS) http://flood.umd.edu
– NASA and US Agency for International Development SERVIR : h$p://www.servirglobal.net
2. Infer flooding conditions by using satellite-derived precipitation – Extreme Rainfall Detection System (ERDS):
http://playground.ithacaweb.org/apps/world/leaflet/erds2.html/#layers

National Aeronautics and Space Administration Applied Remote Sensing Training Program 14
NASA Rainfall Observations Used in GFMS, SERVIR, & ERDS2
• Combines precipitation from TRMM and several national/international satellites to obtain 3-hourly, 0.25°x0.25° resolution data with global coverage between 50°S to 50°N
• TMPA will be replaced with Integrated Multi-SatellitE Retrievals (IMERG) for Global Precipitation Measurement (GPM) data with half-hourly, 0.1°x0.1° resolution and global coverage between 65°S to 65°N
Tropical Rainfall Measuring Mission (TRMM) Multi-satellite Precipitation Analysis (TMPA)
Note: TRMM is no longer flying, but TRMM-based calibration is used to provide near real-time rainfall from a constellation of national & international satellites for flooding applications. Near real-time IMERG data is also available from: ftp://jsimpson.pps.eosdis.nasa.gov
Daily TMPA/3B42RT for 15 February 2016
Image Credit: Terra MODIS/Worldview; 17 Jan 2016
SERVIR

National Aeronautics and Space Administration Applied Remote Sensing Training Program 16
SERVIR GLOBAL
https://www.servirglobal.net/
• Works in 30 countries
• Remote Sensing-based data products and training available via websites
• Flood monitoring and mapping based on TMPA rainfall and CREST hydrologic model

National Aeronautics and Space Administration Applied Remote Sensing Training Program 17
SERVIR Regional Activities
https://www.servirglobal.net/Global/Activity-Mapper?hub=africa
SERVIR-Eastern and Southern Africa initiative, helps nations like Malawi use geospatial technologies to reduce disaster risk and enhance capacity in disaster management.

Image Credit: Terra MODIS/Worldview; 17 Jan 2016
Global Flood Monitoring System (GFMS)

National Aeronautics and Space Administration Applied Remote Sensing Training Program 19
• Provides global maps, time series, and animations (50°S-50°N) of instantaneous and accumulated rain over 24, 72, and 168 hours
• Streamflow rates and flood detection at 1/8th degree (~12km) and 1km
• Uses a hydrological model together with: – TMPA – Surface temperature and winds from NASA
reanalysis model MERRA – Runoff generation from UW Variable Infiltration
Capacity (VIC) – Runoff routing model from UMD
GFMS http://flood.umd.edu

Image Credit: Terra MODIS/Worldview; 17 Jan 2016
Exercise: Global Flood Monitoring System
Image Credit: Terra MODIS/Worldview; 17 Jan 2016
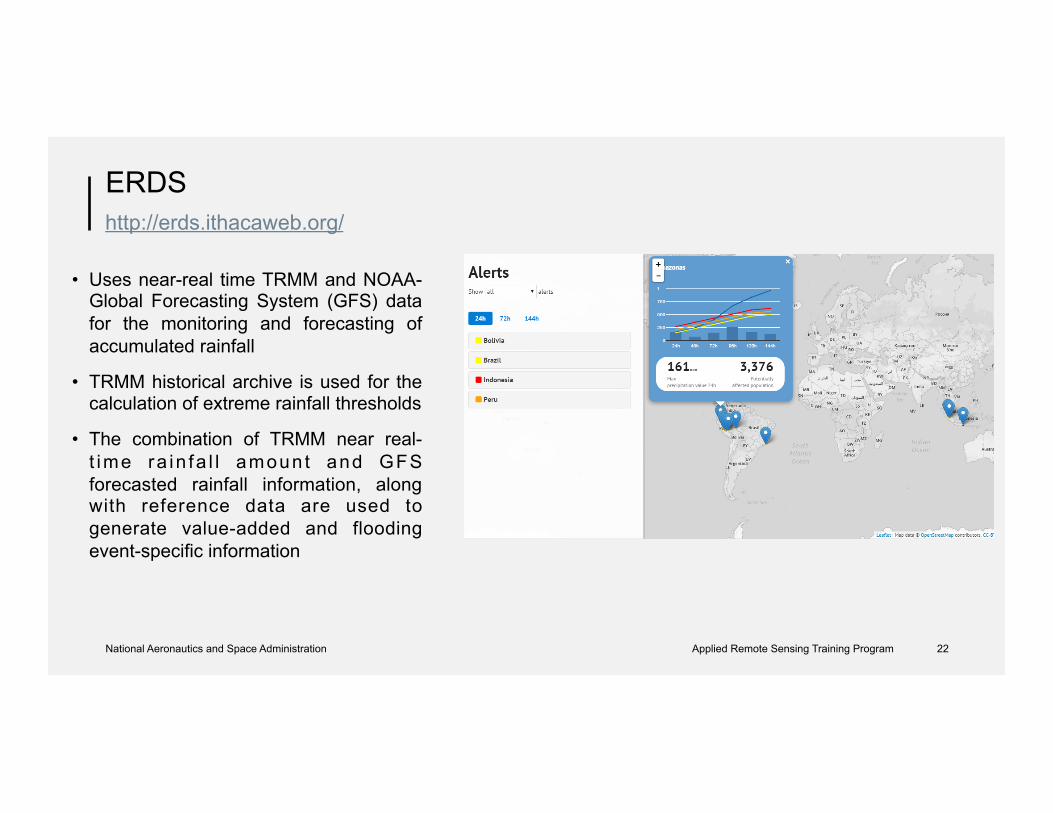
Extreme Rainfall Detection System (ERDS)
http://erds.ithacaweb.org/
National Aeronautics and Space Administration Applied Remote Sensing Training Program 22
• Uses near-real time TRMM and NOAA-Global Forecasting System (GFS) data for the monitoring and forecasting of accumulated rainfall
• TRMM historical archive is used for the calculation of extreme rainfall thresholds
• The combination of TRMM near real-t ime ra in fa l l amount and GFS forecasted rainfall information, along with reference data are used to generate value-added and flooding event-specific information
ERDS http://erds.ithacaweb.org/

National Aeronautics and Space Administration Applied Remote Sensing Training Program 23
• Provides global maps and time series of near-real time (50°S-50°N) and forecasted accumulated rainfall over 24, 48, 72, 96, 120 and 144 hours
• Provides extreme rainfall alerts at at 0.25°x0.25° level and at administrative districts level
• Provides event-specific information such as the list of the affected countries and an estimation of the affected population
• Currently the ERDS system is one of the tools used by OMEP, UN World Food Programme (WFP) Emergency Preparedness Unit
ERDS http://erds.ithacaweb.org/

Image Credit: Terra MODIS/Worldview; 17 Jan 2016
Exercise: Extreme Rainfall Detection System (ERDS)

National Aeronautics and Space Administration Applied Remote Sensing Training Program 25
Coming Up Next Week
• Demonstration and hands-on exercises on inundation mapping using remote sensing of land cover from Terra and Aqua – Moderate Resolution Imaging Spectroradiometer (MODIS) – Dartmouth Flood Observatory
– MODIS Near Real-Time Global Flood Mapping
– Exercise of MODIS Flood Mapping using QGIS
Flood Mapping Web Tools Based on NASA Remote Sensing Observations of Land Cover

National Aeronautics and Space Administration Applied Remote Sensing Training Program 26
Thank You The recording of today’s session will be available shortly at
http://arset.gsfc.nasa.gov/disasters/webinars/advfloodwebinar
Top Related