


Languages
Pages
Legal


ORNL/TM-2017/302 CRADA/NFE-13-04586
Advanced Controls for Ground-Source Heat Pump Systems
Xiaobing Liu Patrick Hughes Anthony Gehl Shawn Hern (formerly ClimateMaster) Dan Ellis (formerly ClimateMaster) June 2017
CRADA final report for CRADA number NFE-13-04586
Approved for public release. Distribution is unlimited.

DOCUMENT AVAILABILITY
Reports produced after January 1, 1996, are generally available free via US Department of Energy (DOE) SciTech Connect. Website http://www.osti.gov/scitech/ Reports produced before January 1, 1996, may be purchased by members of the public from the following source: National Technical Information Service 5285 Port Royal Road Springfield, VA 22161 Telephone 703-605-6000 (1-800-553-6847) TDD 703-487-4639 Fax 703-605-6900 E-mail [email protected] Website http://www.ntis.gov/help/ordermethods.aspx Reports are available to DOE employees, DOE contractors, Energy Technology Data Exchange representatives, and International Nuclear Information System representatives from the following source: Office of Scientific and Technical Information PO Box 62 Oak Ridge, TN 37831 Telephone 865-576-8401 Fax 865-576-5728 E-mail [email protected] Website http://www.osti.gov/contact.html
This report was prepared as an account of work sponsored by an agency of the United States Government. Neither the United States Government nor any agency thereof, nor any of their employees, makes any warranty, express or implied, or assumes any legal liability or responsibility for the accuracy, completeness, or usefulness of any information, apparatus, product, or process disclosed, or represents that its use would not infringe privately owned rights. Reference herein to any specific commercial product, process, or service by trade name, trademark, manufacturer, or otherwise, does not necessarily constitute or imply its endorsement, recommendation, or favoring by the United States Government or any agency thereof. The views and opinions of authors expressed herein do not necessarily state or reflect those of the United States Government or any agency thereof.

iii
ORNL/TM-2017/302
CRADA/NFE-13-04586
Energy and Transportation Science Division
Advanced Controls for Ground-Source Heat Pump Systems
Xiaobing Liu
Patrick Hughes
Anthony Gehl
Shawn Hern (formerly ClimateMaster)
Dan Ellis (formerly ClimateMaster)
Date Published:
June 2017
Prepared by
OAK RIDGE NATIONAL LABORATORY
Oak Ridge, Tennessee 37831-6283
managed by
UT-BATTELLE, LLC
for the
US DEPARTMENT OF ENERGY
under contract DE-AC05-00OR22725
Approved for Public Release

iii
TABLE OF CONTENTS
LIST OF FIGURES ..................................................................................................................................... iv LIST OF TABLES ....................................................................................................................................... iv ACRONYMS .............................................................................................................................................. vii ABSTRACT .................................................................................................................................................. 1 1. STATEMENT OF OBJECTIVES ........................................................................................................ 2 2. BENEFITS TO THE FUNDING DOE OFFICE'S MISSION ............................................................. 2 3. TECHNICAL DISCUSSION OF WORK PERFORMED BY ALL PARTIES ................................... 3
3.1 A FIRST-OF-ITS-KIND FLEXIBLE RESEARCH PLATFORM FOR DGSHP
SYSTEMS .................................................................................................................................. 3 3.1.1 Overview ........................................................................................................................ 3 3.1.2 Ground Source Emulator ............................................................................................... 3 3.1.3 Experimental DGSHP System ....................................................................................... 6 3.1.4 Data Acquisition System .............................................................................................. 10 3.1.5 Research Capability ..................................................................................................... 11
3.2 SMART WATER HEATING CONTROL FOR GS-IHP ........................................................ 11 3.2.1 Background and Introduction ...................................................................................... 11 3.2.2 Apparatus for Water Heating Test ............................................................................... 12 3.2.3 Water Heating Performance with Existing Control ..................................................... 14 3.2.4 New Controls ............................................................................................................... 18 3.2.5 Conclusions and Recommendations ............................................................................ 22
3.3 SMART PUMPING CONTROL .............................................................................................. 23 3.3.1 Background and Introduction ...................................................................................... 23 3.3.2 Simulation-based Study ............................................................................................... 24 3.3.3 Experimental Tests ....................................................................................................... 25 3.3.4 Conclusions and Recommendations ............................................................................ 31
4. SUBJECT INVENTIONS .................................................................................................................. 32 5. COMMERCIALIZATION POSSIBILITIES ..................................................................................... 33 6. PLANS FOR FUTURE COLLABORATION.................................................................................... 33 7. CONCLUSIONS ................................................................................................................................ 33 REFERENCES ........................................................................................................................................... 35
iv
LIST OF FIGURES
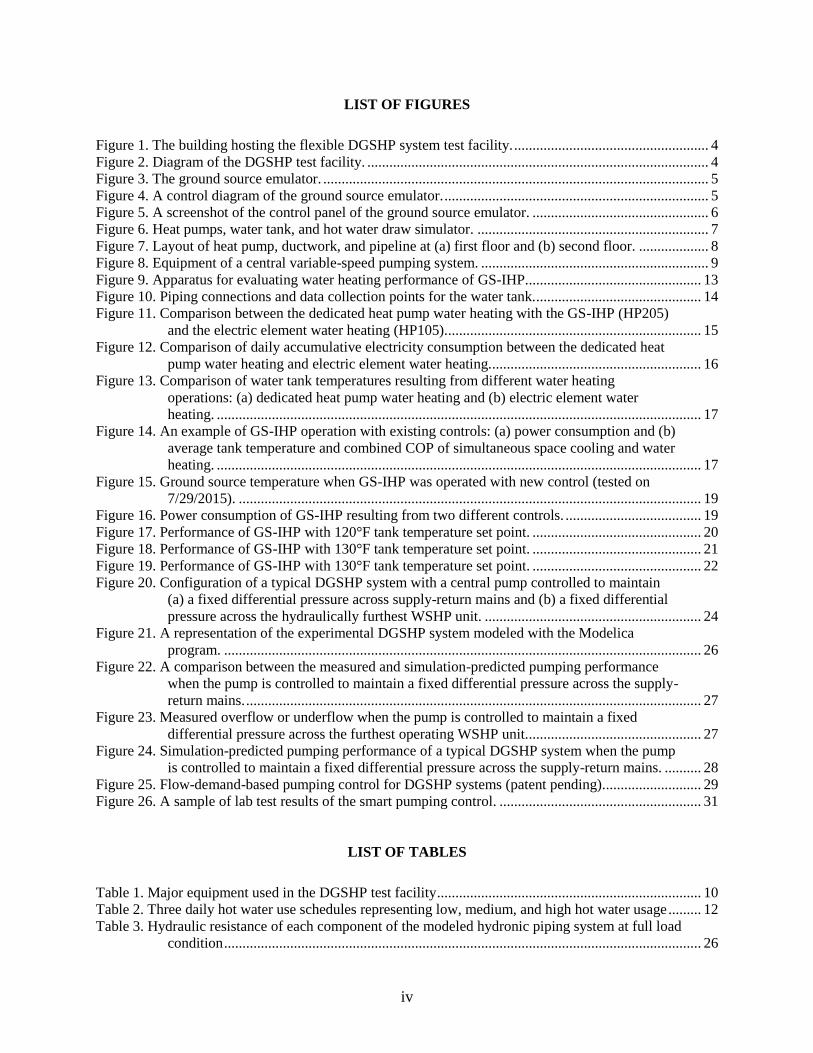
Figure 1. The building hosting the flexible DGSHP system test facility. ..................................................... 4 Figure 2. Diagram of the DGSHP test facility. ............................................................................................. 4 Figure 3. The ground source emulator. ......................................................................................................... 5 Figure 4. A control diagram of the ground source emulator. ........................................................................ 5 Figure 5. A screenshot of the control panel of the ground source emulator. ................................................ 6 Figure 6. Heat pumps, water tank, and hot water draw simulator. ............................................................... 7 Figure 7. Layout of heat pump, ductwork, and pipeline at (a) first floor and (b) second floor. ................... 8 Figure 8. Equipment of a central variable-speed pumping system. .............................................................. 9 Figure 9. Apparatus for evaluating water heating performance of GS-IHP................................................ 13 Figure 10. Piping connections and data collection points for the water tank. ............................................. 14 Figure 11. Comparison between the dedicated heat pump water heating with the GS-IHP (HP205)
and the electric element water heating (HP105). ..................................................................... 15 Figure 12. Comparison of daily accumulative electricity consumption between the dedicated heat
pump water heating and electric element water heating. ......................................................... 16 Figure 13. Comparison of water tank temperatures resulting from different water heating
operations: (a) dedicated heat pump water heating and (b) electric element water
heating. .................................................................................................................................... 17 Figure 14. An example of GS-IHP operation with existing controls: (a) power consumption and (b)
average tank temperature and combined COP of simultaneous space cooling and water
heating. .................................................................................................................................... 17 Figure 15. Ground source temperature when GS-IHP was operated with new control (tested on
7/29/2015). .............................................................................................................................. 19 Figure 16. Power consumption of GS-IHP resulting from two different controls. ..................................... 19 Figure 17. Performance of GS-IHP with 120°F tank temperature set point. .............................................. 20 Figure 18. Performance of GS-IHP with 130°F tank temperature set point. .............................................. 21 Figure 19. Performance of GS-IHP with 130°F tank temperature set point. .............................................. 22 Figure 20. Configuration of a typical DGSHP system with a central pump controlled to maintain
(a) a fixed differential pressure across supply-return mains and (b) a fixed differential
pressure across the hydraulically furthest WSHP unit. ........................................................... 24 Figure 21. A representation of the experimental DGSHP system modeled with the Modelica
program. .................................................................................................................................. 26 Figure 22. A comparison between the measured and simulation-predicted pumping performance
when the pump is controlled to maintain a fixed differential pressure across the supply-
return mains. ............................................................................................................................ 27 Figure 23. Measured overflow or underflow when the pump is controlled to maintain a fixed
differential pressure across the furthest operating WSHP unit. ............................................... 27 Figure 24. Simulation-predicted pumping performance of a typical DGSHP system when the pump
is controlled to maintain a fixed differential pressure across the supply-return mains. .......... 28 Figure 25. Flow-demand-based pumping control for DGSHP systems (patent pending). .......................... 29 Figure 26. A sample of lab test results of the smart pumping control. ....................................................... 31
LIST OF TABLES
Table 1. Major equipment used in the DGSHP test facility ........................................................................ 10 Table 2. Three daily hot water use schedules representing low, medium, and high hot water usage ......... 12 Table 3. Hydraulic resistance of each component of the modeled hydronic piping system at full load
condition .................................................................................................................................. 26

v


vii
ACRONYMS
ASHRAE American Society of Heating Refrigeration and Air-conditioning Engineer
DGSHP distributed ground source heat pump
DP differential pressure
EE electric element
GHP geothermal heat pump
GSHP ground source heat pump
GS-IHP ground source integrated heat pump
SC space cooling
SH space heating
VFD variable frequency drive
WH water heating
WSHP water source heat pump

1
ABSTRACT
Ground source heat pumps (GSHP), also known as geothermal heat pumps (GHP), are proven advanced
HVAC systems that utilize clean and renewable geothermal energy, as well as the massive thermal
storage capacity of the ground, to provide space conditioning and water heating for both residential and
commercial buildings. GSHPs have higher energy efficiencies than conventional HVAC systems. It is
estimated, if GSHPs achieve a 10% market share in the US, in each year, 0.6 Quad Btu primary energy
consumption can be saved and 36 million tons carbon emissions can be avoided (Liu et al. 2017).
However, the current market share of GSHPs is less than 1%. The foremost barrier preventing wider
adoption of GSHPs is their high installation costs. To enable wider adoption of GSHPs, the cost-
effectiveness of GSHP applications must be improved.
Under a collaborative research and development agreement (CRADA), researchers at Oak Ridge National
Laboratory (ORNL) worked with ClimateMaster, a U.S. GSHP manufacturer, to improve the performance
and efficiency of GSHPs by advancing controls in both component and system levels. Main results of this
CRADA collaboration include:
• an innovative flow-demand-based control for variable speed pumping for distributed GSHP (or
DGSHP) systems, which can dynamically adjust the pump speed at real time and deliver only the
water flow needed to each individual heat pump in a DGSHP system. This newly invented pumping
control (patent pending, Invention Disclosure #: 201403380, DOE S-138,004) has potential to reduce
pumping energy by 60% in typical DGSHP systems,
• a new control for ground source integrated heat pumps (GS-IHP), which avoids the electric power
surges resulting from the existing control during the simultaneous space cooling and water heating
operation, and significantly reduces or even eliminates the operation of the electric backup water
heating elements. Experimental test results indicated that this new control improved the combined
COP of GS-IHPs for space cooling and water heating by 10% compared with the existing control
when the ground source supply temperature is below 75ºF, and
• a first-of-its-kind research facility capable of supporting development and verification of various
emerging technologies for DGSHP applications in a low-risk and realistic real-building environment.

2
1. STATEMENT OF OBJECTIVES
Ground source heat pumps (GSHP), also known as geothermal heat pumps (GHP), are proven advanced
HVAC systems that utilize clean and renewable geothermal energy, as well as the massive thermal
storage capacity of the ground, to provide space conditioning and water heating for both residential and
commercial buildings. GSHPs have higher energy efficiencies than conventional HVAC systems. It is
estimated, if GSHPs achieve a 10% market share in the US, in each year, 0.6 Quad Btu primary energy
consumption can be saved and 36 million tons carbon emissions can be avoided (Liu et al. 2017).
However, the current market share of GSHPs is less than 1%. The foremost barrier preventing wider
adoption of GSHPs is their high installed costs. To enable wider adoption of GSHPs, the cost-
effectiveness of GSHP applications must be improved.
The objective of this project is to improve the performance and efficiency of GSHPs by advancing
controls in both component and system levels through close collaboration with ClimateMaster, a U.S.
GSHP manufacturer. Particularly, this project focused on two areas: one is to improve the water heating
efficiency of the newly developed ground source integrated heat pump (GS-IHP)—a single packaged unit
providing both space conditioning and 100% water heating; and the other is to improve the pumping
efficiency of distributed ground source heat pump (DGSHP) systems, which is predominantly used in
GSHP applications for multi-family residential, commercial, and institutional buildings in the US.
As a result of a previous CRADA collaboration with Oak Ridge National Laboratory (ORNL),
ClimateMaster launched the Trilogy™ 40 Q-Mode™ series GS-IHP in 2014, now known as the Trilogy
45® Q-Mode® (http://www.climatemaster.com/residential/trilogy/ and
http://www.climatemaster.com/residential/trilogy/qe/). This project utilized the ClimateMaster® pat.
pending Trilogy® Q-Mode® (QE) series GS-
IHP (http://www.climatemaster.com/residential/trilogy/qe/). The Q-Mode® technology produces year-
round domestic hot water on demand, even when space conditioning is not required. The patent-pending
Q-Mode technology produces year-round domestic hot water on demand, even when space conditioning
is not required. This project will characterize the water heating performance resulting from existing
controls and further refine the controls by using additional inputs (e.g., historical usage patterns,
temperatures at various levels within the tank, etc.) to improve the water heating performance and
efficiency. Field studies indicate that excessive pumping energy consumption is a common issue in
commercial building or multi-family building DGSHP systems, which results in lower than expected
operational energy efficiency of DGSHP systems. A system-level pumping control that can optimize the
operation of the circulation pump will be developed to provide additional energy savings.
2. BENEFITS TO THE FUNDING DOE OFFICE'S MISSION
The Building Technologies Office (BTO) within DOE’s Office of Energy Efficiency and Renewable
Energy (EERE) is responsible for developing and deploying technologies that can substantially reduce
energy consumption in residential and commercial buildings. While many high efficiency options are
available, GSHPs are among the most efficient and was identified by BTO as a high-impact technology.
As stated in DOE’s Research and Development Roadmap for Geothermal (Ground-Source) Heat Pumps
(DOE 2012), reducing cost and improving performance is crucial to making GSHPs more economically
competitive and thus widely adopted.
This project aimed to improve the operational efficiency of GSHP systems by developing smart controls
at both the component and system levels. These smart controls would be essential components of the
next-generation GSHP systems, which will be able to optimize their operation based on thermal loads in
real time and capable of meeting all the space conditioning and water heating demands.

3
The results of this project will help improve the cost effectiveness of GSHP applications and enable wider
adoption and sustainable growth in the US and other countries.
3. TECHNICAL DISCUSSION OF WORK PERFORMED BY ALL PARTIES
This CRADA project includes following tasks:
• Characterize the water heating performance of GS-IHPs with existing controls
• Refine the existing controls to improve performance of GS-IHPs
• Develop a smart control for the circulation pump of DGSHP systems
• Characterize the performance of the developed smart pumping control
To support the above tasks, a first-of-its-kind test facility for DGSHP systems was designed and built at a
flexible research platform (FRP) in ORNL. ClimateMaster donated GSHP units and provided valuable
inputs, technical support, and feedbacks during this study. In addition, ClimateMaster also conducted
initial lab tests to evaluate various water heating controls. Technical discussions of the work performed by
all parties are presented in following sub-sections.
3.1 A FIRST-OF-ITS-KIND FLEXIBLE RESEARCH PLATFORM FOR DGSHP SYSTEMS
3.1.1 Overview
The DGSHP system test facility at ORNL is a first-of-its-kind facility. It is in a 3,200 ft2 two-story
building at the main campus of ORNL (Figure 1). This building has 10 zones (five zones on each floor),
and the plan of each floor is almost identical, except for two entrances on the first floor. The occupancy
in each zone is simulated with an electric heater and a humidifier that are controlled based on a set of
predefined schedules to represent the internal heat and moisture gains in a typical residential or
commercial building.
The facility is comprised of (1) a ground source emulator, which can mimic the supply temperatures of
various ground sources (e.g., groundwater, surface water, and ground loop); (2) a 12-ton DGSHP system
with two two-stage 2-ton GSHP units and two 5-ton GS-IHP units, which can provide not only space
heating and space cooling but also 100% domestic hot water; (3) a hydronic piping system with two
alternative pumping configurations (i.e., a central pumping station and individual circulator in each GSHP
unit), and (4) a data acquisition and visualization system to collect and visualize data from the more than
150 sensors and meters. Each GSHP unit conditions multiple zones in the two-story building through a
damper-controlled duct system. A hot water usage simulator is installed to automate hot water draws
following various programmable patterns. Figure 2 shows the schematic diagram the water side of the
research facility.
3.1.2 Ground Source Emulator
A ground source emulator (GSE) is designed and built to provide source water at a user-specified
temperature to represent various ground sources, including groundwater, surface water, and ground loop.
As shown in figures 2 and 3, the GSE includes a 15-ton air-cooled chiller (including three 5 ton modules),
an 85 gallon 35 kW (125 kBtu/h) electric water heater, a 1.5 horsepower constant speed circulation pump,
a plate frame heat exchanger (PFHX), a 50-gallon buffer tank, and a controller.

4
Figure 1. The building hosting the flexible DGSHP system test facility.
Figure 2. Diagram of the DGSHP test facility.
Figure 4 shows a control diagram of the GSE. The operation of the chillers and the water heater is
controlled based on the temperature difference across the PFHX at the source water side. The controller
turns on the chiller if the source water is receiving heat from the GSHP units, and it turns on the water
heater when the source water is releasing heat to the GSHP units. The source side supply temperature to
the PFHX is maintained at a user-specified set point by modulating the output of the chiller or the water
heater. The allowable range of the source water supply temperature (“T_GSE_S” shown in Figure 4) is

5
50–75ºF, and the supply water temperature to the GSHP (“T_HP_S” at the other side of the PFHX) will
vary between 45 and 80ºF, which represents the typical range of ground source temperature in the United
States. The cooling output of the chiller is staged depending on the difference between the measured
T_GSE_S and its set point. The heating output of the water heater is modulated through a two-step
process: (1) staging the opening of a motorized valve to initially adjust the hot water flow rate and (2)
varying the speed of a hot water circulator through a PID control to maintain T_GSE_S at the set point.
The water temperature in the hot water tank is maintained at 120ºF by the built-in control of the water
heater.
Figure 3. The ground source emulator.
Figure 4. A control diagram of the ground source emulator.
A control panel for GSE is developed for setting control parameters and monitoring the performance of
the GSE. Figure 5 is a screenshot of the control panel. The dynamic plot at the bottom of the control panel
gives various temperature measurements at GSE. This figure shows that T_GSE_S was maintained within
a 2°F deadband of different set points. The deadband can be reduced to 1°F if a more constant source
water temperature is desired.
Water Heater
Air-cooled Chiller
Buffer Tank
Plate Frame Heat Exchanger
Electric Water Heater
TT_GSE_S
Controller
(~15 ton)
Connect to interior piping)
(~120 KBTU/h)
(~36 GPM, 50 ft head)
(~180 KBTU/h)(50-75 F)
TT_GSE_R
(40-85 F)
T_HP_R
(35-90 F)T_HP_S
(45-80 F)
Set point is based on “Ground Source Selection”
(50 GAL)
Circulator and Modulating Valve
M
Air-cooled Chillers Mechanical Room of the Ground
Source Emulator

6
Figure 5. A screenshot of the control panel of the ground source emulator.
3.1.3 Experimental DGSHP System
The experimental DGSHP system is comprised of four GSHPs: two of them are identical two-stage
GSHP units, and the other two are identical GS-IHP units. Each GS-IHP unit also ties with a hot water
tank to produce domestic hot water in addition to space conditioning. To simulate various hot water usage
patterns, a hot water draw simulator is implemented at each hot water tank, which can automatically draw
hot water from the tank based on a predefined schedule for the flow rate and duration of each water draw.
Figure 6 shows photos of the GSHPs, the water tank of GS-IHP, and the hot water draw simulator used in
the experimental DGSHP system.
These GSHPs are attached to a two-pipe common water loop to exchange heat with the GSE through the
PFHX. Each of these GSHPs serves multiple zones in the building through a ductwork, each branch (to a
zone) of which has a motorized damper for modulating airflow in response to the varying heating and
cooling loads in the zone. The layout of the first and the second floors is identical, and each floor is
served with a two-stage GSHP and a GS-IHP, as shown in Figure 7.
Each GSHP has its own built-in variable-speed circulator, which draws water from the water loop and
returns it back after exchanging heat with the GSHP. The internal circulator is controlled by the GSHP to

7
modulate the water flow rate so that a constant temperature difference across the water-refrigerant coil
can be maintained. These internal circulators can be bypassed so that the water flow can be delivered to
each GSHP with an external central pumping station, which is the most typical pumping configuration of
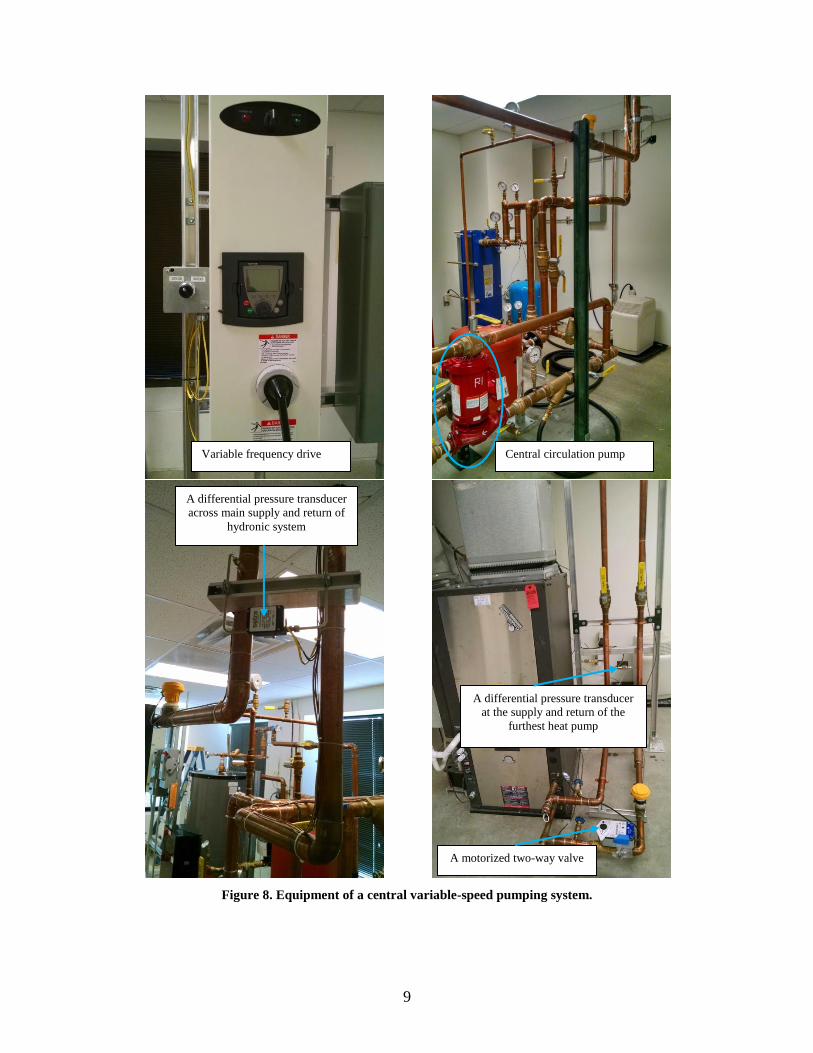
DGSHP systems in commercial applications. Figure 8 shows the equipment of the central variable-speed
pumping system, including a variable frequency drive (VFD), a circulation pump, two differential
pressure transducers (one at the main supply and return and the other at the hydraulically furthest GSHP
from the central loop pump), a motorized two-way valve in each of the two-stage GSHP units to shut off
flow when the GSHP is not called on by its thermostat. The major equipment used in the GSE and the
DGSHP system is listed in Table 1.
Figure 6. Heat pumps, water tank, and hot water draw simulator.
State-of-the-art 2-stage GSHP
Integrated GSHP with hot water generation
Use a dedicated mechanical system to emulate various ground sources
Automated hot water draws with various programmable
patterns
Hot Water Draw Simulator

8
(a)
(b)
Figure 7. Layout of heat pump, ductwork, and pipeline at (a) first floor and (b) second floor.
Integrated
Heat Pump
QE1860
Two-stage
Heat Pump
TEV026
Ductwork
with
motorized
damper in
each zone
Integrated
Heat Pump
QE1860
Two-stage
Heat Pump
TEV026
Ductwork
with
motorized
damper in
each zone
9
Figure 8. Equipment of a central variable-speed pumping system.
Central circulation pump Variable frequency drive
A differential pressure transducer
across main supply and return of
hydronic system
A differential pressure transducer
at the supply and return of the
furthest heat pump
A motorized two-way valve

10
Table 1. Major equipment used in the DGSHP test facility
Name Manufacturer Model Count
Heat Pump
ClimateMaster TEV026BGD02ALTS, 2 ton 2
ClimateMaster QEV1860AGE02BLS, 4 ton integrated with
water heating
2
Smart Tank ClimateMaster ATC32U02 (50 gallon) 2
Thermostat ClimateMaster AWS050AW1245S (for TEV026) 2
ClimateMaster AWC99B01R (for QEV1860) 2
Air-cooled Chiller Unico UCH0605-2C0 3
Electric Water Heater Rheem-Ruud 85 gallon, 480V/3ph, 36 kW input 1
Circulation pump (ground
source loop) Bell & Gossett
1-1/2 hp, 208V/3ph, 57 gpm at 68 ft head (90
series)
1
Circulation pump (water heater) Bell & Gossett ECOCIRC XL 20-35 1
Circulation pump (heat pump
loop) Bell & Gossett
1-1/2 hp, 208V/3ph, 30 gpm at 85 ft head (90
series)
1
Variable frequency drive Schneider
Electric S-FlexTM 212
1
3.1.4 Data Acquisition System
There are 152 data points collected by two Campbell Scientific data loggers at four time intervals
(30 seconds, 1 minute, 15 minute, or 1 hour), including the following.
• Indoor air temperature and humidity at each zone of the building
• Performance of each GSHP unit
– Power draw, water flow rate, inlet and outlet water temperatures
– Fan power, airflow rate, temperature and humidity of return air and supply air of each GSHP unit
• Performance of individual circulator integrated within each GSHP unit
– Flow rate
– Pump power
• Performance of central pumping system
– Flow rate
– Pump power
– Differential pressures
• Performance of water heater tank
– Water temperature at specified locations within the tank (via a thermocouple tree)
– Tank supply and discharge water temperatures
– GSHP supply and return water temperature to the tank, as well as the flow rate
– Power draw of electric elements in the water tank
• Performance of outdoor air (OA) ventilation system
– OA temperature and humidity
– Total OA flow rate
– OA fan power
All these sensors and meters, as well as the hot water draw simulator, have been calibrated either by their
vendors or by ORNL staff onsite at the facility. An automated data visualization and analysis tool has
been developed for this project.

11
3.1.5 Research Capability
The flexible DGSHP system test facility at ORNL is used to (1) test advanced control strategies for water
heating of the GS-IHP and (2) evaluate various pumping configurations and controls. Besides, this facility
can also be used to support other studies, such as:
• optimizing performance of a virtual-sensing-based low-cost monitoring and fault detection and
diagnostics (FDD) system,
• validating results of energy simulation tools and the methods for estimating energy savings,
• evaluating various outdoor air (OA) ventilation designs and controls, as well as their impacts on the
overall system efficiency, and
• improving multi-zone variable air supply control of advanced GSHP unit.
3.2 SMART WATER HEATING CONTROL FOR GS-IHP
3.2.1 Background and Introduction
GS-IHPs can provide for building water heating needs in one of the three operation modes: (1) dedicated
heat pump water heating (DHPWH); (2) simultaneous water heating with space cooling (SSC&WH); and
(3) alternative water heating and space heating (ASH-WH). In addition, when the GS-IHP is not available
to provide water heating (e.g., being locked out due to a fault or its full capacity is used to meet the
demand for space heating or space cooling), the two backup electric elements installed in the hot water
tank can be activated to provide water heating, which is referred as electric element water heating
(EEWH). The water heating operation of a GS-IHP unit is controlled with following built-in strategies:
• run in DHPWH mode if room temperature is satisfied (i.e., below the space cooling set point or above
the space heating set point), and the water temperature at the lower portion of the water tank is below
the hot water tank (HWT) set point minus a deadband (e.g., 15°F),
• run in SSC&WH mode if room temperature is less than 1°F (adjustable) above the cooling set point,
the cooling output is less than a user-specified maximum, and the water temperature at the lower
portion of the water tank is below the HWT set point minus a deadband,
• run in ASH-WH mode if both space heating and water heating demands coexist. Water heating
normally takes priority over space heating. If space temperature drops more than 1°F (adjustable)
below the space heating set point, space heating will be activated and water heating will be
terminated, and
• run in EEWH mode when the GS-IHP is not available for water heating. If the temperature at the
upper portion of the water tank is below the HWT set point minus a deadband, the upper electric
element is turned on; or if the temperature at the lower portion of the water tank is below the DHW
set point minus a deadband, the lower electric element is turned on. Only one electric element is
turned on at a time, and the upper electric element takes higher priority.
In this study, the water heating performance of GS-IHPs resulting from the built-in control strategies was
evaluated through a series of tests at the flexible DGSHP test facility. Based on the observed

12
shortcomings of the existing controls, two new control strategies were developed and implemented.
Performance of the new controls was tested and compared with the existing controls. The test apparatus
and measured performance data are presented below along with conclusions and recommendations.
3.2.2 Apparatus for Water Heating Test
The two GS-IHP units have the same apparatus for evaluating their water heating performance. As shown
in Figure 9, each apparatus is comprised of a GS-IHP unit, a water tank, and two holding tanks. The hot
water draw is automated with a hot water draw simulator. The hot water draw schedules (i.e., the flow
rate and duration of each hot water draw) were developed using the Domestic Hot Water Event Generator
developed by National Renewable Energy Laboratory (Hendron et al. 2010). This tool can generate a
series of year-long hot water event schedules consistent with realistic probability distributions of start
time, duration and flow rate variability, clustering, and seasonality. Based on the generated hot water
event schedules of a three-bedroom house in Knoxville, TN, three daily hot water use schedules
representing low, medium, and high hot water usage are loaded in the hot water draw simulator. The main
characteristics of the three daily schedules are presented in Table 2. The discharged hot water is stored
temporarily in a holding tank before it is de-chlorinated and dumped into a storm drain outside the
building.
Table 2. Three daily hot water use schedules representing low, medium, and high hot water usage
Schedule Max flow rate
(GPM)
Total hot water draw
(Gallons)
Max hot water draw
(Gallons/Draw)
Number of hot water draws
(-)
Low 2.1 29 13.7 14
Medium 2.2 40 8.3 18
High 3.5 107 17.2 24
Figure 10 shows the instrumentation at the hot water tank tied with a GS-IHP unit. A thermocouple tree is
inserted into the tank to measure the water temperature at six different locations. Other measurements
include the inlet temperature of the city water, outlet temperature of the tank, the delivered hot water
temperature (after mixing the hot water from the tank with the city water to reach a given set point), the
inlet and outlet water temperature and flow rate of the GS-IHP, and the power consumption of the electric
elements.

13
(a) A GS-IHP unit tied with a hot water tank and a holding tank for discharge hot water
(b) Hot water tank and hot water draw simulator
Figure 9. Apparatus for evaluating water heating performance of GS-IHP.
GS-IHP unit
Water tank
Holding tanks to temporarily
store discharged hot water
A hot water draw simulator
A thermocouple tree
with 6 temperature
sensors at different
locations in the tank
Upper electric
element (another
one is at the
lower portion of
the tank)

14
Figure 10. Piping connections and data collection points for the water tank.
3.2.3 Water Heating Performance with Existing Control
3.2.3.1 Performance Evaluation: DHPWH vs EEWH
Water heating performance in the DHPWH and EEWH modes was tested with a high daily hot water load
(i.e., 107 gallons in total and with a maximum 3.5 GPM hot water draw flow rate). In this test, the GS-
IHP in room 105 (referred to as HP105) was turned off and only the two electric elements in the hot water
tank were available for water heating in EEWH mode; the GS-IHP in room 205 (referred to as HP205)
ran in DHPWH mode. Figure 11 compares the performance of the two water heating operation modes. As
shown in Figure 11 (a), hot water delivered by HP205 was maintained at 120ºF for all the hot water
draws, which is 10–15ºF higher than that delivered by HP105. In addition, HP205 ran for a shorter time
and with about 40% lower power draw than HP105, as shown in Figure 11 (b). The source water supply
temperature of HP205 was maintained at 75±1 ºF by the GSE when it ran in DHPWH mode. Figure 11 (c)
shows that the water heating COP of DHPWH dropped from 6.8 to 3.8 when the average hot water
temperature in the tank increased from 73 to 120ºF. The average water heating COP of the DHPWH
operation is about five times higher than that of the EEWH operation.

15
(a) Domestic hot water supply temperatures
(b) Electricity consumptions
(c) Average hot water tank temperature and water heating COP of HP205
Figure 11. Comparison between the dedicated heat pump water heating with the GS-IHP (HP205) and the
electric element water heating (HP105).
020406080
100120140
9:0
0
9:1
5
9:3
0
9:4
5
10
:00
10
:15
10
:30
10
:45
11
:00
11
:15
11
:30
11
:45
12
:00
12
:15
12
:30
12
:45
13
:00
13
:15
13
:30
13
:45
14
:00
14
:15
14
:30
14
:45
15
:00
15
:15
15
:30
15
:45
16
:00
16
:15
16
:30
16
:45
De
live
red
DH
W T
em
pe
ratu
re [
F]
Time
Tout_DHW_205_Avg Tout_DHW_105_Avg
0
10
20
30
40
50
60
9:0
09
:15
9:3
09
:45
10
:00
10
:15
10
:30
10
:45
11
:00
11
:15
11
:30
11
:45
12
:00
12
:15
12
:30
12
:45
13
:00
13
:15
13
:30
13
:45
14
:00
14
:15
14
:30
14
:45
15
:00
15
:15
15
:30
15
:45
16
:00
16
:15
16
:30
16
:45
Ele
ctri
c P
ow
er
Co
nsu
mp
tio
n
(WH
pe
r 1
min
ute
)
Time
Ded. WH (HP205) Elec. Heating (HP105)
1
2
3
4
5
6
7
20
40
60
80
100
120
140
9:0
0
9:1
6
9:3
29
:48
10
:04
10
:20
10
:36
10
:52
11
:08
11
:24
11
:40
11
:56
12
:12
12
:28
12
:44
13
:00
13
:16
13
:32
13
:48
14
:04
14
:20
14
:36
14
:52
15
:08
15
:24
15
:40
15
:56
16
:12
16
:28
16
:44
Wat
er
He
atin
g C
OP
Tem
pe
ratu
re (
F)
Time
Avg_TankTemp COP_(with WH)

16
HP205 consumed 65% less electricity than HP105 during the day for these tests (Figure 12), which is less
than the expected 80% electricity savings suggested by the DHPWH mode water heating COPs shown in
Figure 11(c). This is because HP205 provided more heat to the tank than HP105. As shown in Figure 13,
while the entire tank was warmed up to 120ºF by HP205 after each DHPWH operation, the water
temperature at the lower portion of the water tank of HP105, which is measured by temperature sensors
#1 and #2 as shown in Figure 13 (b), was around 70ºF during most time of the day because only the upper
electric element was activated and the EEWH operation did not create convection to mix the water in the
tank. Thus, the tank water temperature was stratified—cold water at the lower portion and hot water at the
upper portion.
Figure 12. Comparison of daily accumulative electricity consumption between the dedicated heat pump water
heating and electric element water heating.
(a) Water temperature at various levels of the water tank of HP205 (DHPWH mode)
(b) Water temperature at various levels of the water tank of HP105 (EEWH mode)
0
2000
4000
6000
8000
10000
Ded. WH (HP205) EE WH (HP105)
Dai
ly D
HW
Po
we
r C
on
sum
pti
on
(W
H)
50
60
70
80
90
100
110
120
130
140
9:0
09
:15
9:3
09
:45
10
:00
10
:15
10
:30
10
:45
11
:00
11
:15
11
:30
11
:45
12
:00
12
:15
12
:30
12
:45
13
:00
13
:15
13
:30
13
:45
14
:00
14
:15
14
:30
14
:45
15
:00
15
:15
15
:30
15
:45
16
:00
16
:15
16
:30
16
:45
Ho
t W
ate
r Te
mp
era
ture
[F]
TC_tank205_1_Avg
TC_tank205_2_Avg
TC_tank205_3_Avg
TC_tank205_4_Avg
TC_tank205_5_Avg
TC_tank205_6_Avg
50
60
70
80
90
100
110
120
130
9:0
0
9:1
5
9:3
0
9:4
5
10
:00
10
:15
10
:30
10
:45
11
:00
11
:15
11
:30
11
:45
12
:00
12
:15
12
:30
12
:45
13
:00
13
:15
13
:30
13
:45
14
:00
14
:15
14
:30
14
:45
15
:00
15
:15
15
:30
15
:45
16
:00
16
:15
16
:30
16
:45
Ho
t W
ate
r Te
mp
era
ture
(F)
TC_tank105_1_Avg
TC_tank105_2_Avg
TC_tank105_3_Avg
TC_tank105_4_Avg
TC_tank105_5_Avg
TC_tank105_6_Avg

17
Figure 13. Comparison of water tank temperatures resulting from different water heating operations:
(a) dedicated heat pump water heating and (b) electric element water heating.
3.2.3.2 Performance Evaluation: SSC&WH
Performance in the SSC&WH mode was tested with the three different daily hot water loads—light,
medium, and high. During an 8-hour test shown in Figure 14, the GS-IHP (in room 105) was supplied
with 65±1ºF source water and it ran in the dedicated space cooling (DSC) or SSC&WH mode. The room
temperature was maintained at 75ºF by the GS-IHP. Figure 14 (a) shows the measured power
consumption of the GS-IHP at each 1 minute time interval. As can be seen from this figure, the power
consumption was flat and gradually increased with time (due to increased cooling load in the afternoon),
except at three short time periods when the power consumption suddenly surged three to four times
higher. These surges resulted from the SSC&WH operation, as indicated by the increase of the average
tank temperature during the same time periods. The power surge during SSC&WH operation was due to
the switch of source water—from the 65±1°F ground source to the hot water tank, which has a much
higher temperature. Figure 14 (b) shows that the combined COP of the GS-IHP, which is the ratio of the
total output in space cooling and water heating to the total power input of the GS-IHP, dropped from 3.7
to 1.4 when the average tank temperature increased from 100ºF to 130ºF.
(a)
(b)
Figure 14. An example of GS-IHP operation with existing controls: (a) power consumption and (b) average
tank temperature and combined COP of simultaneous space cooling and water heating.
0
20
40
60
80
100
9:0
09
:15
9:3
09
:45
10
:00
10
:15
10
:30
10
:45
11
:00
11
:15
11
:30
11
:45
12
:00
12
:15
12
:30
12
:45
13
:00
13
:15
13
:30
13
:45
14
:00
14
:15
14
:30
14
:45
15
:00
15
:15
15
:30
15
:45
16
:00
16
:15
16
:30
16
:46
Po
we
r U
se in
1-M
inu
te
Inte
rval
(W
H)
WH_GSHP_tot_105_Tot
0.5
1.5
2.5
3.5
4.5
5.5
6.5
20
40
60
80
100
120
140
9:0
09
:16
9:3
29
:48
10
:04
10
:20
10
:36
10
:52
11
:08
11
:24
11
:40
11
:56
12
:12
12
:28
12
:44
13
:00
13
:16
13
:32
13
:48
14
:04
14
:20
14
:36
14
:52
15
:08
15
:24
15
:40
15
:56
16
:12
16
:28
16
:45
CO
P
Tem
pe
ratu
re (
F)
Avg_tank_temp COP_(with WH)

18
Since GS-IHP can modulate its cooling capacity to match the varying cooling load, it runs continuously
when there is any cooling load in the building. If the cooling load is mild (so the room temperature is
maintained less than 1°F above the cooling set point), the water heating operation will be in the
SSC&WH mode, in which case the water heating output is dependent on the cooling load instead of the
water heating load. On the other hand, when the cooling load is high (i.e., the room temperature is more
than 1°F above the cooling set point), the existing control gives priority to space cooling and disables the
water heating operation of the GS-IHP no matter how cold the water in the tank is. When the tank water
temperature dropped below its set point minus a deadband due to water draws or tank heat loss, the
electric element in the tank was activated to warm up the water. Since the heat output of the 3 kW electric
element was only about 40% of the average water heating capacity of the GS-IHP, the hot water recovery
was slow. Experimental test results indicated that the delivered hot water temperature could still be below
100°F even after running the electric element for 20 minutes. This poor hot water supply could be
avoided if the GS-IHP is allowed to heat up the tank at an earlier time. It indicates that a more active
control for the water heating is needed to eliminate the operation of the electric element.
3.2.4 New Controls
A new water heating control was developed that alternates the space cooling and water heating operation
of the GS-IHP based on real time measurements of the room temperature and the water temperature at
various depths in the tank. When significant thermal stratification in the water tank is detected (e.g., the
lower portion of the water tank is 15°F cooler than the DHW set point), the GS-IHP will run in DHPWH
mode until the room temperature is 2°F higher than its set point; then GS-IHP is switched to DSC mode
to cool down the room temperature 2°F below the set point. If the tank temperature is still lower than its
set point at the end of the DSC operation, GS-IHP will switch back to the DHPWH mode. This alternative
space cooling and water heating operation (ASC-WH) continues until the entire tank is warmed up to its
set point. This new control eliminates the power surge resulting from SSC&WH operation and reduces or
avoids backup electric element operation since the tank is fully charged even when the cooling load is
high. Since the DSC operation rejects heat to the ground source, while the DHPWH operation extracts
heat from the ground, by alternating these two operations, the ground source can recover quickly from
previous operations and thus provide a more favorable temperature for the DSC and DHPWH operations.
In addition, another new control strategy was tested for GS-IHP, which raises the set point (up to 130°F)
of the water in the tank if more than 60 gallon daily hot water demand is expected in the coming day. The
elevated tank water temperature increases the thermal energy stored in the tank and thus helps reduce or
even eliminate the operation of the electric element. The measured performances of the above two new
controls are discussed below.
3.2.4.1 Performance Evaluation: SSC&WH vs ASC-WH
Figure 15 shows the ground source supply and return temperature of the GS-IHP at room 105 on 29 July,
2015, when it was operated with the new control to alternate between DSC and DHPWH operations. The
ground source supply temperature was maintained at 65±1°F during the day. When the GS-IHP ran in the
DHPWH mode, the ground source return temperature was lower than the supply temperature since heat
was extracted from the source water and vice versa in the DSC operation. Figure 16 shows the measured
power consumptions of the GS-IHP (at each 1-minute time interval) resulting from the existing
(SSC&WH) and the new (ASC-WH) controls, respectively. As can be seen from this figure, the new
control reduced peak power use by 36% compared with the existing control.

19
Figure 15. Ground source temperature when GS-IHP was operated with new control (tested on 7/29/2015).
Figure 16. Power consumption of GS-IHP resulting from two different controls.
The daily combined COPs of the GS-IHP resulting from the existing and new controls were calculated
with equations (1) and (2), respectively. The results indicated that the new control resulted in a 10%
increase (from 4.0 to 4.4) in the combined COP compared with that resulting from the existing control.
WH
QQCOP
WHSC
WHSCSim
413.3, (1)
COP
Q
COP
Q
QQCOP
DHPWH
WH
DSC
SC
WHSCAlt
, (2)
where
COPSim is the combined efficiency of SSC&WH mode, QSC is the space cooling output, QWH is the water
heating output, WH WHSC is the total power consumption of the GS-IHP when it ran in SSC&WH mode,
COPAlt is the combined efficiency of ASC-WH mode, COPDSC and COPDHPWH are the efficiency of the
GS-IHP when it ran in DSC and DHPWH modes, respectively.
Further analysis indicates that the combined COP of the SSC&WH is higher than that of ASC-WH when
the ground source supply water temperature is higher than 75°F. So, if reducing power consumption is
0
20
40
60
80
100
9:3
0
9:4
0
9:5
0
10
:00
10
:10
10
:20
10
:30
10
:40
10
:50
11
:00
11
:10
11
:20
11
:30
11
:40
11
:50
12
:00
12
:10
12
:20
12
:30
12
:40
12
:50
13
:00
13
:10
13
:20
13
:30
13
:40
13
:50
14
:00
14
:10
14
:20
14
:30
14
:40
14
:50
15
:00
15
:10
15
:20
15
:30
15
:40
15
:50
Tem
pe
ratu
re (
F)
Ground source supply Ground source return
0
10
20
30
40
50
60
9:3
0
9:4
0
9:5
0
10
:00
10
:10
10
:20
10
:30
10
:40
10
:50
11
:00
11
:10
11
:20
11
:30
11
:40
11
:50
12
:00
12
:10
12
:20
12
:30
12
:40
12
:50
13
:00
13
:10
13
:20
13
:30
13
:40
13
:50
14
:00
14
:10
14
:20
14
:30
14
:40
14
:50
15
:00
15
:10
15
:20
15
:30
15
:40
15
:50
Po
we
r U
se in
1-M
inu
te
Inte
rval
(W
H)
ASC-WH SSC&WH

20
more desirable than reducing peak electricity demand, the SSC&WH operation would be recommended
when the ground source supply water temperature is higher than 75°F.
3.2.4.2 Adjust Tank Temperature Set Point Based on Predicted DHW Loads
The impact of the elevated tank water temperature set point on the water heating COP was evaluated by
running the two identical GS-IHP units simultaneously but with different tank water temperature set
points. The same high hot water draw schedule (Table 2) and ground source supply temperature (50‒
80°F) were applied to the two GS-IHP units.
Figure 17 shows the measured performance of the GS-IHP unit in room 205 (120°F tank water
temperature set point). As shown in Figure 17 (a), the GS-IHP unit ran in two different modes during the
day, including five DHPWH operations and a DSH operation. Figure 17 (b) shows that the water heating
COP decreased with the increase of the average tank water temperature. The average water heating COP
of the five water heating events is 5.1.
(a) Power consumption, water and air side supply temperatures
(b) Average tank temperature and water heating efficiency
Figure 17. Performance of GS-IHP with 120°F tank temperature set point.
Figure 18 shows the measured performance data of the GS-IHP unit in room 105 (130°F water tank set
point). As shown in Figure 18 (a), the GS-IHP unit ran in three different modes during the day, including
0
20
40
60
80
100
120
0
10
20
30
40
50
9:0
0
9:1
7
9:3
4
9:5
1
10
:08
10
:25
10
:42
10
:59
11
:16
11
:33
11
:50
12
:07
12
:24
12
:41
12
:58
13
:15
13
:32
13
:49
14
:06
14
:23
14
:40
14
:57
15
:14
15
:31
15
:48
16
:05
16
:22
16
:39
16
:56 Su
pp
ly A
ir/W
ate
r T
em
p. (
F)
Po
we
r U
se in
1-M
inu
te In
terv
al
(WH
)
HP Power Cons. (HP205) Entering Water Temp. (HP205) Supply Air Temp. (HP205)
1
2
3
4
5
6
7
20
40
60
80
100
120
140
9:0
0
9:1
6
9:3
29
:48
10
:04
10
:20
10
:36
10
:52
11
:08
11
:24
11
:40
11
:56
12
:12
12
:28
12
:44
13
:00
13
:16
13
:32
13
:48
14
:04
14
:20
14
:36
14
:52
15
:08
15
:24
15
:40
15
:56
16
:12
16
:28
16
:44
Wat
er
He
atin
g C
OP
Tem
pe
ratu
re (
F)
Avg_TankTemp COP_(with WH)
DSH
DHPWH

21
DSC, DHPWH, and dedicated space heating (DSH). There were three DHPWH operations during the
day. Figure 18 (b) shows that the water heating COP decreased with the increase of the average tank
water temperature. The average COP of the three water heating events was 4.6.
(a) Power consumption, water and air side supply temperatures
(b) Average tank water temperature and water heating efficiency
Figure 18. Performance of GS-IHP with 130°F tank temperature set point.
By comparing figures 17 and 18, it can be seen that elevating tank water temperature set point reduced the
frequency of water heating cycles because of the increased hot water thermal capacity in the water tank.
However, elevating tank water temperature set point reduced the heat pump water heating efficiency as
shown in the above case. There was no any backup electric element operation observed at either of the
two GS-IHPs during this test, which was conducted on December 18, 2015 when the weather was mild
and the demand for space conditioning was low.
However, if space conditioning demand is higher, there could be competitions between the space
conditioning and water heating operations. The increased hot water thermal capacity resulting from the
elevated tank water temperature could help avoid or reduce backup electric element operation during
periods with competing hot water and space conditioning demands. An earlier test performed on October
15, 2015 showed that the backup electric element in the water tank at room 205 was activated in the late
afternoon to keep the hot water at 120°F when the space cooling load was high. In contrast, the electric
element in the water tank at room 105 was off during the entire test and the tank temperature was
0
20
40
60
80
100
120
0
10
20
30
40
509
:00
9:1
7
9:3
4
9:5
1
10
:08
10
:25
10
:42
10
:59
11
:16
11
:33
11
:50
12
:07
12
:24
12
:41
12
:58
13
:15
13
:32
13
:49
14
:06
14
:23
14
:40
14
:57
15
:14
15
:31
15
:48
16
:05
16
:22
16
:39
16
:56
Sup
ply
Air
/Wat
er
Te
mp
. (F)
Po
we
r U
se in
1-M
inu
te In
terv
al
(WH
)
HP Power Cons. (HP105) Entering Water Temp. (HP105) Supply Air Temp. (HP105)
DSH
DHPWH
0.5
1.5
2.5
3.5
4.5
5.5
6.5
20
40
60
80
100
120
140
9:0
09
:16
9:3
29
:48
10
:04
10
:20
10
:36
10
:52
11
:08
11
:24
11
:40
11
:56
12
:12
12
:28
12
:44
13
:00
13
:16
13
:32
13
:48
14
:04
14
:20
14
:36
14
:52
15
:08
15
:24
15
:40
15
:56
16
:12
16
:28
16
:44
Syst
em
CO
P
Tem
pe
ratu
re (
F)
Avg_tank_temp COP_(with WH)
DSH DHPWH DSC

22
maintained by the GS-IHP at about 130°F. As a result, the combined COP for space cooling and water
heating of the GS-IHP in room 105 is 6% higher than that in room 205 (5.5 vs. 5.2).
Figure 19. Performance of GS-IHP with 130°F tank temperature set point.
3.2.5 Conclusions and Recommendations
• The DHPWH operation of the GS-IHP is significantly more energy efficient than the EEWH
operation. With a 75ºF source water supply temperature, the water heating COP of DHPWH is about
five times higher than that of EEWH. In addition, the quality of hot water delivery is better and the
recovery time is shorter in DHPWH operation.
• The existing controls of the tested GS-IHPs enabled SSC&WH operation even when the ground
source temperature is much lower than the hot water tank temperature. This resulted in power surges,
due to the increased pressure lift of the compressor for providing both space cooling and water
heating at the same time.
• A new control for GS-IHP was developed that enables ASC-WH operation. This control avoids the
power surges resulting from the SSC&WH operation while delivering hot water as needed and
maintaining room temperature within a wider (but acceptable) range. Furthermore, this control
significantly reduces or even eliminates the operation of the electric elements since the water tank is
fully charged even when cooling load is high. Experimental test results indicated that this new control
improved the combined COP of the GS-IHP for space cooling and water heating by 10% compared
with the existing control when the ground source supply water temperature was 65ºF. However, the
SSC&WH operation may have a higher combined COP than the ASC-WH operation when the ground
source supply water temperature is higher than 75°F.
• Elevating the tank water temperature increased the stored hot water capacity and thus reduced the
frequency of water heating operation. This could help avoid or reduce backup electric element
operation during periods of high hot water demand. However, elevating tank water temperature set
point will reduce the water heating efficiency when hot water demand is low.
0
20
40
60
80
100
9:0
0
9:1
6
9:3
2
9:4
8
10
:04
10
:20
10
:36
10
:52
11
:08
11
:24
11
:40
11
:56
12
:12
12
:28
12
:44
13
:00
13
:16
13
:32
13
:48
14
:04
14
:20
14
:36
14
:52
15
:08
15
:24
15
:40
15
:56
16
:12
16
:28
16
:45
0:0
0
Po
we
r U
se in
1-M
inu
te In
terv
al
(WH
)
HP105_GHP HP105_Electric HP205_GHP HP205_Electric
23
3.3 SMART PUMPING CONTROL
3.3.1 Background and Introduction
Most commercial building and large multi-family residential building GSHP systems in the United States
are in a distributed or DGSHP configuration. In a DGSHP system, each zone of the building is
conditioned with an individual water source heat pump (WSHP) unit each connected in parallel through a
common water loop. Each zone heat pump can be turned on and off independently to satisfy the varying
heating or cooling load in the zone it serves. A two-way solenoid valve is usually installed at each heat
pump, and this valve will be closed to block the water flow when the heat pump is not in operation and
vice versa. Variable speed pumps are commonly used in DGSHP systems and controlled to maintain a
fixed differential pressure (DP) either across supply-return mains or at the WSHP unit hydraulically
furthest from the central pump, as shown in Figure 20.
Although variable speed pumps have potential to reduce pumping energy, field studies of installed
DGSHP systems (Henderson et al. 2000; Kavanaugh and Kavanaugh 2012) indicated that most variable
speed pumps did not operate at expected low speeds during part load conditions and excessive pumping
energy use is a common issue. Recent case studies of six new commercial DGSHP systems indicate that
pumping power contributed 16% to 45% to the total power consumption (Liu et al. 2015). The high
pumping energy use resulting from the excessive pumping led to a lower-than-expected operational
efficiency of the DGSHP systems, especially when building heating and cooling loads were not at peak.
Reducing pumping energy use is crucial for improving the operational efficiency of DGSHP systems.
It was found that the excessive pumping during part load conditions was due, at least in part, to the
conventional control strategy for the variable-speed pump, which modulates pump speed to maintain a
fixed DP across the supply-return mains of the piping system. This DP set point is usually arbitrarily
determined and often much higher than needed (Henderson et al. 2000; Moore and Fisher 2003; Su et al.
2013). At part load conditions when some individual WSHP units are shut off, the water flow to these
units is usually blocked off, and thus the total water flow demand of the DGSHP system is reduced. With
the reduced system water flow, the hydraulic resistance of the main pipelines of the piping system
decreases. However, since a fixed DP is maintained between the supply-return mains, the reduced
hydraulic resistance at the main pipelines must be offset by the increased resistance at each operating
WSHP unit. When there is not any flow regulating valve at the WSHP unit (to automatically adjust its
hydraulic resistance), more-than-needed water flow will be pumped through the operating WSHP unit(s).
Lowering the DP set point can significantly reduce system flow rate and the associated pumping energy
use, but a DP set point that is too low will result in significant underflow in operating WSHP units,
especially at high loading conditions, resulting in low operational efficiency and potentially damage to
those units. Dynamically resetting DP is recommended in 2015 ASHRAE Handbook for HVAC
Applications (ASHRAE 2015), but no specific recommendations on how to do so are provided.

24
Figure 20. Configuration of a typical DGSHP system with a central pump controlled to maintain (a) a fixed
differential pressure across supply-return mains and (b) a fixed differential pressure across the hydraulically
furthest WSHP unit.
A new control for the variable speed pump was developed in this project (patent pending). It utilizes the
available design parameters of the individual WSHP units and real time measurements from a few
additional temperature sensors to determine the needed system water flow rate at any given time and
automatically adjusts the DP set point based on the system water flow demand and the characteristics of
the hydraulic resistance of the piping system. The DP set point is then further refined based on the
measured temperature difference at each operating WSHP unit to ensure proper water flow is delivered to
them.
A simulation-based study was performed to compare the performance of the conventional and the new
pumping controls and assess the energy saving potential of improving pumping controls. A brief
summary of this study is presented in the next section, and more detailed information can be found in a
technical paper (Niu, Liu, and O’Neill 2016). Both the conventional and the new pumping controls were
implemented and tested at ORNL’s flexible research platform for DGSHP systems. The experimental
tests and the main findings are introduced in section 3.3.3.
3.3.2 Simulation-based Study
A computer model for a simplified DGSHP hydronic piping system was developed using Modelica model
(Modelica 2015) on the Dymola platform (Dassault 2015). The component models of the hydronic piping
system were adapted from LBNL’s Modelica Building Library V1.6 (Wetter et al. 2014). Three different
pumping control strategies were simulated, including the two pressure-based conventional controls and
the new flow-demand-based control.
The simulation results indicate that a significant overflow occurs at part load conditions when the pump is
controlled to maintain a constant DP across the supply-return mains of the piping system. On the other
hand, an underflow occurs at part load conditions when the pump is controlled to maintain a constant DP
across the furthest WSHP unit. The flow-demand-based control can provide the needed flow rate to each
WSHP unit at any given time and with less pumping energy use than the two conventional controls. A
case study for applying the new pumping control to a typical DGSHP system serving a medium size
office building indicates that the annual pumping energy consumption can be reduced by 64% if the new
control is used to replace the conventional control, which is to maintain a constant DP across the supply-
return mains (Niu, Liu, and O’Neill 2016).
DP
Ground heat exchanger
DP
Variable
speed
pump

25
3.3.3 Experimental Tests
Both the conventional and the new pumping controls were implemented at the DGSHP system flexible
test facility. The hydronic piping system of the DGSHP system was balanced by adjusting the hydraulic
resistance of each parallel loop to ensure the needed (design) water flow rate can be delivered to each of
the four individual heat pump units when all of them are in operation (i.e., at full load condition). A series
of tests were conducted to (1) validate the Modelica model and (2) verify the energy savings achieved by
the new pumping control.
3.3.3.1 Validation of the Modelica Simulation Results
All the 15 possible combinations of the on/off status of the four WSHP units were set up successively at
the experimental DGSHP system. The central pump was controlled with the two conventional control
strategies to maintain a constant DP across (1) the supply-return mains (referred as DP1 henceforth) or
(2) the hydraulically furthest WSHP unit (referred as DP2 henceforth). The set points for DP1 (14.8 ft of
H2O) and DP2 (6 ft of H2O) are the measured values of DP1 and DP2 at the full load condition after the
piping system is balanced. The measured pumping performance data include DP1 and DP2, the flow rate
in each WSHP unit, pump power consumption, and the frequency of the electric power supplied from the
VFD.
The hydronic piping system was modeled with the Modelica program. Figure 21 shows a graphical
presentation of one of the computer models, in which the conventional control with fixed DP across the
supply-return mains is modeled. The modeled piping system is comprised of several components,
including the main pipes, which distribute water flow to multiple WSHP units, and branch pipes
dedicated to particular heat pump units. Each WSHP unit was modeled as a hydraulic resistance, which
varies with the unit water flow rate. The hydraulic resistance of each component of the modeled piping
system at full load condition is estimated based on the measured values of DP1 and DP2 during the
balancing process and listed in Table 3. The central pump was modeled based on its performance data
provided by the pump manufacturer.

26
Figure 21. A representation of the experimental DGSHP system modeled with the Modelica program.
Table 3. Hydraulic resistance of each component of the modeled hydronic piping system at full load condition
Section name R1 R2 R3 R4 R5 R6 R7 R8 HP1 HP2 HP3 HP4
Hydraulic resistance (ft H2O) 7.1 1.4 1.4 1.4 6 6 6 6 6 6 6 6
The pumping energy saving potential (PESP) is determined by comparing the actually measured pumping
power to what would have been if the design water flow were delivered to each operating individual
WSHP unit, which is calculated according to the affinity law as expressed in following equation.
PESP = 1 − (Fl_Exp
Fl_Mea)3, (3)
where
𝐹𝑙_𝐸𝑥𝑝 and 𝐹𝑙_𝑀𝑒𝑎 are the expected and the measured flow rate in the piping system, respectively.
Figure 22 shows a comparison between the measured and the simulation-predicted pumping performance
when the pump is controlled to maintain DP1 at a fixed set point. As can be seen in this figure, the
Modelica simulation correctly predicted the overflow, and the discrepancy between the measured and
simulation-predicted maximum overflow percentages was less than two percentage points (8.5% vs.
9.9%). Thus, the PESPs calculated with the measured and simulation-predicted overflow percentages are
close to each other (21.7% vs. 24.6%).

27
Figure 22. A comparison between the measured and simulation-predicted pumping performance when the
pump is controlled to maintain a fixed differential pressure across the supply-return mains.
Both the measured data and simulation results indicate that the overflow increases with a decrease of the
part load ratio (PLR), which is the ratio of the expected system water flow at a given time (depending on
which individual WSHP units are running) to the system water flow when all the WSHP units are in
operation. Furthermore, for a given PLR, the degree of overflow depends on the locations of the operating
units—the further away from the central pump, the more significant overflow.
Figure 23. Measured overflow or underflow when the pump is controlled to maintain a fixed differential
pressure across the furthest operating WSHP unit.
Figure 23 shows the experimental results of the overflow or underflow at various PLRs when the pump
was controlled to maintain DP2 at a fixed set point. As shown in this figure, this pumping control resulted
in slight (<5%) overflow or significant (>30%) underflow for a given PLR. The significant underflow
occurred when the water flow to the hydraulically furthest WSHP unit, where the DP2 sensor is located,
was blocked off. However, only a little overflow occurred at each operating WSHP unit if water flow was
0%
5%
10%
15%
20%
25%
30%
0% 2% 4% 6% 8% 10% 12%Pu
mp
ing
Ene
rgy
Savi
ng
Po
ten
tial
Overflow Percentage
Experiment Simulation
-40%
-35%
-30%
-25%
-20%
-15%
-10%
-5%
0%
5%
0.0 0.2 0.4 0.6 0.8 1.0
Ove
rflo
w/u
nd
erf
low
Pe
rce
nta
ge
PLR

28
not blocked off. It indicates that, to prevent underflow, continuous water flow is needed at the
hydraulically furthest WSHP unit in the DGSHP system no matter whether it is called on or not. Although
the reduced overflow resulted in lower pumping power, the continuous water flow at the furthest heat
pump unit offset some of the pumping energy savings.
The observed overflow and the corresponding PESP are moderate at the experimental DGSHP system
(serving a 3,200 ft2 building). This is due to the short main pipes for distributing water flow to the
multiple individual heat pumps, of which the head loss is affected by PLR. These short main pipes have
low hydraulic resistances (see R2, R3, and R4 in Table 3) and thus only account for a small fraction of the
needed DP1. Therefore, the needed DP1 does not change much under part-load conditions, as does the
system flow rate.
In order to assess the PESP for typical DGSHP systems, the piping system of a DGSHP system serving a
medium-size office building (with 53,628 ft2 floor space) was simulated with the Modelica model. The
predicted pumping performance with this typical DGSHP system is shown in Figure 24 along with that
for the experimental DGSHP system. As shown in this figure, both the overflow and the PESP are much
more significant (about 80%) in the typical DGSHP system.
Figure 24. Simulation-predicted pumping performance of a typical DGSHP system when the pump is
controlled to maintain a fixed differential pressure across the supply-return mains.
3.3.3.2 Implementation of the Smart Pumping Control
Below is a step-by-step procedure of the flow-demand-based pumping control.
1. Set the initial set point of DP1 (e.g., the measured value of DP1 when the piping system is balanced
and all individual heat pump units are supplied with the needed water flow).
2. When the DGSHP system is running, determine the system flow demand at each time interval (e.g.,
every minute) based on the on/off status and the design flow rate of each individual WSHP unit.
3. If the system flow demand is different from it was at the previous time interval, change the DP1 set
point based on the new system flow demand and the hydraulic characteristic of the piping system.
0%
10%
20%
30%
40%
50%
60%
70%
80%
90%
0% 20% 40% 60% 80% 100%
Po
ten
tial
Pu
mp
ing
Ene
rgy
Savi
ng
Overflow Percentage
Experiment Simulation Small (Exp) Simulation Large

29
4. Refine the DP1 set point according to the measured water side temperature difference (WSTD) at
each operating WSHP unit.
• If the WSTD of any WSHP unit is greater than a predefined upper bound (e.g., 12°F), the DP1 set
point will increase gradually at small intervals until the WSTDs of all the running WSHP units
are below the upper bound.
• If the WSTD of any WSHP unit is less than a predefined lower bound (e.g., 8°F), the DP1 set
point will decrease gradually at small intervals until the WSTDs of all the operating WSHP units
are above the lower bound.
• When some WSTDs are above the upper bound but other WSTDs are below the lower band, the
DP1 set point will increase until all the WSTDs are below the upper bound.
The hydraulic characteristic of the piping system is defined here as a correlation between the system flow
demand and the required DP1 to deliver such a flow. This correlation can be roughly determined after
balancing the piping system at full load condition. First, close the two-way valves of a few WSHP units to
block off water flow through these units and then manually adjust the DP1 set point until the expected
system flow is delivered, which can be verified by a fixed or portable flow meter. Repeat this process
several times by blocking off different WSHP units (to mimic a range of part-load conditions) to
determine the DP1 set points for delivering the expected system flows at various part-load conditions.
The on/off status of an individual WSHP unit can be obtained from the building’s energy management
system or by examining the air-side supply temperature at each unit. Additional temperature sensors are
needed if the above information is not available. Wireless temperature sensors may be more convenient
and cost-effective for implementing the flow-demand-based control for existing DGSHP systems. Figure
25 shows a diagram of the flow-demand-based pumping control that uses wireless sensors for measuring
WSTD at each WSHP unit.
Figure 25. Flow-demand-based pumping control for DGSHP systems (patent pending).
3.3.3.3 Lab Test of the Smart Pumping Control
The smart pumping control has been tested at ORNL’s experimental DGSHP system. Figure 25 presents
the results of one of the tests. In this test, one 2-ton heat pump unit (#204 with 6 GPM design flow rate)
was running continuously and the other 2-ton unit (#104 with 6 GPM design flow rate) was turned on and
off at different times. When only one 2-ton unit was turned on, the PLR was 0.2 and with both running

30
the PLR was 0.4. As shown in Figure 26(a), DP1 was automatically modulated and kept below the initial
DP1 set point, which was 14.8 ft and needed to deliver the designed flow to each heat pump unit when all
of them were running. The WSTDs were maintained between 7.5 and 10.5°F during the test, as shown in
Figure 26(b). Since the DP1 set point is automatically adjusted, WSTDs can be maintained within the
same range no matter whether the individual WSHP units run in heating or cooling mode. In contrast,
with the conventional fixed DP control, WSTDs will be lower in heating mode (indicating overflow) than
in cooling mode since the water side heat transfer rate is smaller when the individual zone heat pumps run
in heating mode. Figure 26(c) shows that the smart pumping control resulted in a lower pumping power
than that resulting from the fixed DP control. The maximum pumping power reduction was 19% during
this test. Cumulatively, the pump consumed 14% less electricity compared with that resulting from the
fixed DP control for meeting the same flow demands. As discussed in section 3.3.3.1, more pumping
energy savings could be achieved for DGSHP systems with a larger piping system (i.e., with higher
hydraulic resistance).

31
(a)
(b)
(c)
Figure 26. A sample of lab test results of the smart pumping control.
3.3.4 Conclusions and Recommendations
Both computer simulations and lab tests indicate that the conventional pumping control of DGSHP
systems, which is to maintain a constant DP across either the supply-return mains of the hydronic piping
system, or the hydraulically furthest zone heat pump unit at the piping system, results in excessive
pumping or significant underflow under part-load conditions. It unnecessarily increases the pumping
energy and can potentially result in failure of individual zone units. The newly developed smart pumping
control can deliver the needed water flow to each zone WSHP unit with less pumping energy by
automatically adjusting the DP set point based on the system flow demand.
0
2
4
6
8
10
12
4
6
8
10
12
14
16
19:00 19:02 19:04 19:06 19:08 19:10 19:12 19:14 19:16 19:18 19:20 19:22 19:24
Flo
w R
ate
(G
PM
)
Dif
fere
nti
al P
ress
ure
b
etw
ee
n S
up
ply
an
d
Re
turn
Mai
ns
(ft
H2O
)
Fixed DP Auto-adjusted DP Water Flow (#204) Water Flow (#104)
0
2
4
6
8
10
12
19:00 19:02 19:04 19:06 19:08 19:10 19:12 19:14 19:16 19:18 19:20 19:22 19:24
Wat
er
Sid
e T
em
pe
ratu
re
Dif
fere
nce
(F)
WSTD (#104) WSTD (#204)
0
6
12
18
24
30
36
0
50
100
150
19:00 19:02 19:04 19:06 19:08 19:10 19:12 19:14 19:16 19:18 19:20 19:22 19:24Sy
ste
m F
low
Rat
e (
GP
M)
Pu
mp
Po
we
r [W
]
Pump Power (Auto-adjusted DP) Pump Power (Fixed DP) System Water Flow

32
Lab tests of the smart pumping control indicate that 14% of the pumping energy can be saved in the
small-scale experimental DGSHP system. A simulation-based case study indicates that the annual
pumping energy consumption of a typical DGSHP system serving a medium-size office building can be
reduced by 62% with the smart pumping control compared with the conventional control, which
maintains a fixed DP across the supply-return mains of the piping system.
It is recommended that the smart pumping control be implemented at an existing commercial DGSHP
system to demonstrate its benefits. Wireless temperature sensors with lower cost, more robust
communication and better reliability need to be identified or developed, which will improve the
performance and cost-effectiveness of the smart pumping control. In addition, since the efficiency of a
zone WSHP unit is affected by the water flow rate, the smart pumping control could be further developed
to minimize the total power consumption of both the individual heat pump units and the central pump.
4. SUBJECT INVENTIONS
The conventional variable speed pumping control for DGSHP systems results in excessive pumping or
significant underflow under part-load conditions. It unnecessarily increases the pumping energy
consumption and can potentially result in premature failure of individual zone heat pump units. The high
pumping energy use resulting from the excessive pumping leads to a lower-than-expected operational
efficiency of DGSHP systems, especially when building heating and cooling loads are not at peak.
Reducing pumping energy use is crucial for improving the operational efficiency of DGSHP systems.
The invention (patent pending, Invention Disclosure #: 201403380, DOE S number: S-138,004)
developed through this study is a new control system for the variable speed pump used in DGSHP
systems. This new control can dynamically adjust the DP set point at real time based on the on/off status
of each GSHP unit and deliver only the needed water flow to each operating zone heat pump units. The
on/off status of the individual zone units can be obtained from the building’s energy management system,
or additional measurements of the air- or water-side temperatures at each unit.
This new control system can reduce or even eliminate overflow or underflow in any zone unit of a
DGSHP system. In addition, unlike the conventional pumping control systems, this new control system
does not require any bypass flow. Therefore, it has potential to significantly reduce pumping energy and
thus improve the operational efficiency of DGSHP systems. This new control system may also be used to
identify abnormal operation of individual zone units and the circulation pump.
Computer simulation predicts that significant pumping energy savings can be achieved with this new
pumping control. A simulation-based case study indicates that the annual pumping energy consumption
of a typical DGSHP system serving a medium-size office building can be reduced by 62% with the new
pumping control compared with the conventional control, which maintains a fixed DP across the supply-
return mains of the piping system.
The convenience and cost effectiveness of implementing this new pumping control, especially for
retrofitting existing pumping control, could be improved by using wireless temperature sensors that have
low cost, reliable measurement, and robust communication. Besides, by integrating with performance
modeling of GSHP units and proper optimization algorithms, this control system can be further developed
to minimize the total energy consumption of the entire DGSHP system.

33
5. COMMERCIALIZATION POSSIBILITIES
As described before, this newly invented pumping control system can effectively address the
shortcomings of the conventional pumping controls. Although this project focus on its application in
DGSHP systems, this pumping control system can be used in other HVAC systems that use hydronic
pumping systems, and even some industry processes involve hydronic pumping. It is estimated that this
new pumping control system can reduce pumping energy use of existing HVAC systems by 50%. Based
on this and other information from DOE’s Building Energy Data Book (DOE 2009), it is estimated that
this new pumping control system can save 51 Trillion BTU primary energy each year in the US, which
also means an annual reduction of 3.4 million tons of CO2 emissions.
The new pumping control system has been introduced in the annual conference of American Society of
Heating, Refrigeration, and Air-conditioning Engineers (ASHRAE) in 2016. Similar pumping control
(e.g., the Grundfos Hydro MPC integrated pumping systems1) has been presented in a major trade show
in early 2017. ClimateMaster expressed interest in commercializing the new pumping control system
developed in this study. It is planned to install the new pumping control system in an existing commercial
DGSHP systems to demonstrate its benefits. Field demonstration of the new pumping control could also
be held in China, where 1.1 billion square meters (12 billion square foot) more buildings will be
conditioned with GHP systems from 2016 through 2020 per China’s Economic and Social Development
Plan for the 13th Five-Year Period2.
6. PLANS FOR FUTURE COLLABORATION
The research team plans to work with ClimateMaster to further improve the new pumping control
systems. The planned collaborations include (1) development of new wireless temperature sensors that
have low cost, reliable measurement, and robust communication; (2) integration with performance
modeling of GSHP units and proper optimization algorithms to minimize the total energy consumption of
the entire DGSHP system; and (3) field demonstration of the new pumping control systems applied in
commercial DGSHP systems.
7. CONCLUSIONS
GSHPs are a proven technology that utilizes clean and renewable geothermal energy, as well as the
massive thermal storage capacity of the ground, to provide space conditioning and water heating for both
residential and commercial buildings. It has a higher energy efficiency than conventional space
conditioning and water heating systems. It is estimated that a reduction of 0.6 Quad Btu in primary energy
consumption and 36 million tons in carbon emissions will be realized each year if GSHP achieves a 10%
market share in the United States. However, the current market share of GSHPs in the United States is
less than 1%. To enable wider adoption of GSHPs, the cost-effectiveness of GSHP applications needs to
be improved.
This project aimed to improve the operational efficiency of GSHP systems by developing smart controls
at the component and system levels. Close collaboration with the US industry partner, ClimateMaster,
through this CRADA project resulted in the following achievements:
1 http://us.grundfos.com/products/find-product/hydro-mpc1.html 2 The 13th Five-Year Period for Economic and Social Development was jointly developed by the National
Development and Reform Commission, the Ministry of Land and Resources, and the National Energy Bureau
(http://www.mlr.gov.cn/xwdt/jrxw/201702/t20170207_1439676.htm).

34
• a first-of-its-kind flexible test facility capable of supporting development and verification of
various emerging technologies for GSHP or DGSHP applications in a low-risk and realistic
real-building environment,
• an innovative flow-demand-based control for DGSHP system variable speed loop pumps,
which can dynamically adjust the DP set point at real time and deliver only the needed water
flow to each operating individual zone heat pump in the system. This newly invented
pumping control (patent pending, Invention Disclosure #: 201403380, DOE S number: S-
138,004) has potential to reduce pumping energy by 60% in typical DGSHP systems.
• a better control for GS-IHPs, which avoids the power surges resulting from the SSC&WH
operation and significantly reduces or even eliminates the operation of the electric elements.
Experimental test results also indicated that this new control improved the combined COP of
the GS-IHP for space cooling and water heating by 10% compared with the existing control
when the ground source supply temperature was below 75ºF.
In addition to supporting the optimization and field verification needs of this project, the flexible test
facility built during this project provides a first-of-its-kind facility capable of supporting other valuable
research to further improve the energy efficiency of DGSHP or GSHP systems over their expected service
life and reduce costs (e.g., fault detection and diagnostics, improved control through application of low-
cost wireless sensors, etc.) .With this facility, various emerging technologies can be developed and
verified in a low-risk realistic real-building environment.
Further support from the US Department of Energy and industrial partners is desired to commercialize the
new control systems developed in this project. It is an essential component of the next-generation of
GSHP systems, which will be more cost-effective and capable of meeting all the space conditioning and
water heating demands; and can optimize its operation based on thermal loads in real time.

35
REFERENCES
ASHRAE, 2015. ASHRAE Handbook—HVAC Applications, American Society of Heating,
Refrigerating and Air-Conditioning Engineers, Inc., Atlanta.
Dassault. 2015. http://www.3ds.com/products-services/catia/products/dymola
Henderson Jr, H. I., M. K. Khattar, S.W. Carlson, and A.C. Walburger. 2000. “The implications of the
measured performance of variable flow pumping systems in geothermal and water loop heat pump
applications,” ASHRAE Transactions, 106(2), 533–542.
Hendron, R., J. Burch, and G. Barker. 2010. “Tool for Generating Realistic Residential Hot Water Event
Schedules,” presented at the SimBuild 2010 conference, August 15–19, 2010.
Kavanaugh, S. and J. Kavanaugh. 2012. “Long-Term Commercial GSHP Performance: Part 2: Ground
Loops, Pumps, Ventilation Air and Controls,” ASHRAE Journal, 54(7).
Modelica. 2015. https://www.modelica.org
Liu, X., P. Hughes, J. Spitler, A. Anderson. 2017. “An updated Assessment of the Technical Potential of
Geothermal Heat Pump Applications in the United States,” 2017 Annual IGSHPA conference, March
14-16, 2017.
Moore, B. J. and D. S. Fisher. 2003. “Pump pressure differential set point reset based on chilled water
valve position,” ASHRAE Transactions, 1, 373–379.
Niu, F., X. Liu, and Z. O’Neill. 2016. A Simulation-Based Study on Different Control Strategies for
Variable Speed Pump in Distributed Ground Source Heat Pump Systems. ASHRAE Transaction,
Volume 122, Part 2.
Su, C. L. and K. T. Yu. 2013. “Evaluation of Differential Pressure Set point of Chilled Water Pumps in
Clean Room HVAC Systems for Energy Savings in High-Tech Industries. Industry Applications,”
IEEE Transactions, 3, 1015–1022.
U.S. DOE (U.S. Department of Energy). 2009. 2009 Buildings Energy Data Book. Prepared by D&R
International, Ltd. Washington, DC: U.S. DOE Energy Efficiency and Renewable Energy.
http://buildingsdatabook.eren.doe.gov/
Wetter, M., W. Zuo, T. S. Nouidui, and X. Pang. 2014. “Modelica buildings library,” Journal of Building
Performance Simulation, 7(4), 253–270.
Top Related