


Languages
Pages
Legal

Adaptive mechanisms and genomic plasticity for drought tolerance
identified in European black poplar (Populus nigra L.)
MAUD VIGER*1, HAZEL K. SMITH*1, DAVID COHEN2,3, JENNIFER DEWOODY1,6,
HARRIET TREWIN1, MARIJKE STEENACKERS4, CATHERINE BASTIEN5 AND GAIL
TAYLOR1+
1 Centre for Biological Sciences, Life Sciences Building, University of Southampton, Southampton, SO17 1BJ,
United Kingdom
2 UMR Ecologie et Ecophysiologie Forestières, INRA NANCY-Lorraine, France
3 Université de Lorraine, UMR Ecologie et Ecophysiologie Forestière, BP 239, F-54506 Vandoeuvre, France
4 Ministry of the Flemish Community, Research Institute for Nature and Forest (INBO), Geraardsbergen, B-
9500, Belgium
5 INRA, Unité de Recherche Amélioration Génétique et Physiologie Forestières, 2163 avenue de la Pomme de
Pin, CS 40001 Ardon, 45075 Orléans Cedex 2, France
6 Current address: USDA Forest Service, National Forest Genetics Lab, 2480 Carson Road, Placerville, CA
95667, USA
*These authors contributed equally to this research
+ Corresponding Author: Tel: +44 (0)2380592335
Fax: +44 (0)2380594459
E-mail: [email protected] (Gail Taylor)
RUNNING TITLE: ADAPTATION TO DROUGHT IN POPLAR
1
1
2
3
4
5
6
7
8
9
10
11
12
13
14
15
16
17
18
19
20
21
22
23
24
25

Abstract
Summer droughts are likely to increase in frequency and intensity across Europe, yet
long-lived trees may have limited drought resilience. It is therefore critical that we
improve our understanding of phenotypic plasticity to drought in natural populations
for ecologically and economically important trees such as Populus. A common garden
experiment was conducted using approximately 500 wild Populus nigra trees,
collected from 11 river populations across Europe. Phenotypic variation was found
across the collection, with southern genotypes from Spain and France characterised by
small leaves and limited biomass production. To examine the relationship between
phenotypic variation and drought resilience, six genotypes with contrasting leaf
morphologies were subjected to a water deficit experiment. ‘North eastern’ genotypes
were collected at wet sites and responded to water deficit with reduced biomass
growth, slow stomatal closure and reduced water use efficiency (WUE) assessed by
Δ13C. In contrast, ‘southern’ genotypes originating from arid sites showed rapid
stomatal closure, improved WUE and limited leaf loss. Transcriptome analyses of a
genotype from Spain (Sp2, originating from an arid site) and another from northern
Italy (Ita, originating from a wet site), revealed dramatic differences in gene
expression response to water deficit. Transcripts controlling leaf development and
stomatal patterning, including SPCH, ANT, ER, AS1, AS2, PHB, CLV1, ERL1–3 and
TMM were down-regulated in Ita but not Sp2 in response to drought.
Keywords: Black poplar (Populus nigra), carbon isotope discrimination (Δ13C), stomatal
number, drought, water deficit, microarray
2
26
27
28
29
30
31
32
33
34
35
36
37
38
39
40
41
42
43
44
45
46
47
48
49
Introduction
Forests in Europe and elsewhere are likely to experience unprecedented rises in temperature
and increases in the frequency and intensity of summer droughts in the future (Lindner et al.
2010; IPCC, 2014). The capacity for long-lived forest trees to adapt to such a rapidly
changing climate is determined by adjustments to functional traits including both
morphological and physiological levels. This phenotypic plasticity allows trees to respond to
a rapidly changing climate and thus provides a mechanism for acclimation (Bussotti et al.,
2015). Although recent droughts in Europe have had major effects on forest tree mortality
(Solberg 2004; Bréda & Badeau 2008; Allen et al. 2010), high phenotypic plasticity could
enable populations to survive in a changing environment (Benito-Garzón et al., 2011), where
moderate droughts will be increasingly common. As such, understanding phenotypic
responses to drought provides an important insight into likely long-term genetic adaptations
(Alberto et al. 2013).
The traits which underpin drought tolerance are complex and may vary in importance
depending on severity, duration and timing of the drought (Bréda et al., 2008; Tardieu &
Tuberosa 2010), but they include reduced leaf size and number, ABA-dependent and -
independent signalling, lowered stomatal aperture and numbers, reduced stomatal
conductance (gs), decreased leaf growth and altered patterns of root development (Tardieu &
Tuberosa 2010). Improved water use efficiency (WUE), is also associated with severe
drought, where WUE is the ratio between net carbon assimilation (A) and transpiration rate
(E), and is negatively associated with carbon isotope discrimination (Δ13C) or positively
correlated with carbon isotope composition (δ13C) (Farquhar & Richard 1984; Farquhar et al.
1989; Condon et al. 2002). How these traits link to their underlying regulatory gene and
metabolism networks is being elucidated in poplar, where gene expression in response to
3
50
51
52
53
54
55
56
57
58
59
60
61
62
63
64
65
66
67
68
69
70
71
72
73
74
drought has been followed in P. deltoides and P. trichocarpa (Street et al. 2006), P.
euphratica (Bogeat-Triboulot et al. 2007), Populus clones of P. deltoides x P. nigra (Cohen
et al. 2010), P. balsamifera (Hamanishi et al. 2010; Hamanishi et al. 2015) and P. nigra x P.
maximowiczii (Wilkins et al. 2009).
Furthermore, microarray studies on drought tolerance in Populus balsamifera have identified
variation in the pattern of transcript abundance between genotypes, which was correlated to
growth maintenance after a water deficit (Hamanishi et al. 2010). These important studies
generally focus on using commercial tree genotypes to elucidate gene expression changes
which may be involved in determining water deficit responses. However, there is a limited
understanding of genomic responses to drought in wild collections, which may harbour
genetic potential for adaptation and increasingly provide the focus for large-scale genomic
and genetic analysis of links between traits and genes.
Natural collections of trees obtained from diverse climatic zones have traditionally been used
to establish common garden experiments for phenology trials (Rohde et al. 2011), but their
use for more complex genomic analysis is now emerging. Recently, the potential to exploit
natural genetic variation has been recognised in Arabidopsis with genome wide association
studies for traits becoming routine (Atwell et al. 2010), but the relevance of Arabidopsis for
understanding tree adaptation may be limited (Taylor 2002). Drought tolerance is an
obviously multi-genic trait and genomic technologies allow the investigation of such traits, in
contrast to traditional single gene studies which can limit the focus to the interaction between
a small number of genes and therefore impede the identification of different pathways
involved in drought response and adaptation.
4
75
76
77
78
79
80
81
82
83
84
85
86
87
88
89
90
91
92
93
94
95
96
97
98
99
European black poplar (Populus nigra) is a riparian species that is widely distributed in
Europe, North Africa, and Central and West Asia (Vanden Broeck 2003). It has many
economic uses, including domestic plantations and breeding programs (Vanden Broeck
2003). Ecologically, P. nigra is a keystone riparian species (Vanden Broeck 2003),
threatened by river drainage, water management (Gaudet et al. 2008) and climate change.
Understanding phenotypic plasticity in response to drought of P. nigra is important. Populus
is also widely accepted to be a model tree since it is fast-growing, its genome is fully
sequenced and there are a wide array of applicable genomic and genetic resources available
(Taylor 2002; Tuskan et al. 2004; Tuskan et al. 2006; Jansson & Douglas 2007). Although
poplars are considered sensitive to drought as they are abundant in riparian environments and
often have a high demand for water (Dreyer et al. 2004; Street et al. 2006), considerable
variation in response to water deficit has been observed between genotypes of Populus
(Marron et al. 2002; Monclus et al. 2006; Street et al. 2006; Huang et al. 2009; Regier et al.
2009; Cocozza et al. 2010; Viger et al. 2013).
The aims of this study were; 1) to quantify natural variation in a wide natural collection of
black poplar for traits related to drought tolerance, 2) to elucidate phenotypic plasticity in
response to drought in a group of genotypes based on this study and 3) to determine the
transcriptomic differences underlying drought tolerance in extreme genotypes from this
natural collection. Alongside these aims, the relationship between drought tolerance and tree
adaptation to their region of origin, which differ particularly in precipitation was examined.
We have used this three-fold approach to identify the genomic basis of drought tolerance and
adaptation in this important riparian tree species.
5
100
101
102
103
104
105
106
107
108
109
110
111
112
113
114
115
116
117
118
119
120
121
122
123
Material and Methods
Common garden experiment
Plant material and growth conditions
Cuttings from wild trees of P. nigra of 479 genotypes were collected from five different
European countries: Spain, France, Italy, Germany and The Netherlands (Table S1).
Genotypes were grouped into 11 populations related to the river system near the collection
(Fig. 1). Hardwood cuttings were planted in a common garden in Belgium, Geraardsbergen
(50º 46‟51.23”N) in the spring 2004, cut at the base in the spring 2005, and side stems
removed so that trees grew as single stems in June 2005. The experiment followed a
randomised block design with six blocks each containing one replicate of each genotype with
a double row of Populus ‘Muur’ planted around the six blocks. The trees were planted at 0.75
m x 2 m spacing. The site was rain-fed and not fertilised between March and September, but
it was weed controlled and treated with fungicides every three weeks during this period.
Assessing phenotypic traits in the Populus nigra collection
Each replicate was assessed for twelve morphological traits over three growing seasons
(2005, 2006 and 2007). The youngest fully mature leaf was harvested, traced while fresh and
placed in a paper bag. Leaf outlines were scanned using an Umax Astra 6700 scanner and
assessed using Image J software (Image J.1.32.j, Wayne Rasband, USA). Leaf outlines were
measured for leaf area (mm2), leaf length (mm) and leaf width (mm), from which the leaf
ratio (length:width) was calculated. Leaves collected in the second growing season (2005)
were placed in paper bags, dried for 48h at 80oC, and weighed to calculate specific leaf area
(SLA) as the ratio of leaf area (mm2) to leaf dry weight (mg).
6
124
125
126
127
128
129
130
131
132
133
134
135
136
137
138
139
140
141
142
143
144
145
146

Epidermal cell number and size was measured using cell imprints taken in 2006 from the first
interveinal region of the abaxial surface of the first fully mature leaf following the methods of
Gardner et al. (1995). Images of cell imprints were assessed in Image J (Abramoff et al.
2004) to count the number of cells and stomata per unit area and average cell area of ten cells
per leaf. From these measures stomatal density (ratio of stomata number per unit area),
stomatal index (ratio of the number of stomata per total cell number as a percentage), and cell
number per leaf, estimated as the ratio of leaf area (mm2) to cell area (mm2), were calculated.
Two measures indicative of biomass were also assessed for each replicate. Height was
recorded following the second year of growth (2005), and circumference 1 m above ground
level was assessed following the second (2006) and third year of growth (2007).
Wood was collected in March 2007, with 30 cm sections cut from 40 cm above ground, then
put in a plastic bag and stored in a cold room. Samples were debarked and cut into small
pieces for Δ13C measurements. Samples were dried in the oven for 48h at 80ºC before being
ground using a ball grinder (Glen Creston ball, Retsch MM300, London, UK) and stored in a
glass container. 1 mg of material was weighed and placed into a 6 x 4 mm tin capsule
(Elemental Microanalysis, Devon, UK). Samples were analysed using a SerCon 20-20 Stable
Isotope Analyzer with ANCA-GSL Solid/Liquid Preparation Module (SerCon, Crewe, UK).
Carbon isotope composition was determined by δ13C (‰) = δplant = [(Rsample - Rreference) / Rreference]
× 1000, where Rsample and Rreference are the 13C/12C ratios of the sample and the reference
respectively, in VPDB (Vienna Pee Dee Belemnite) units (Scrimgeour et al. 2004). Carbon
isotope discrimination was calculated as Δ13C (‰) = [(δair - δplant)/(1+( δplant /1000)] with δair
assumed to be -8‰ (Farquhar & Richard 1984; Monclus et al. 2006).
7
147
148
149
150
151
152
153
154
155
156
157
158
159
160
161
162
163
164
165
166
167
168
169
170
171

Drought experiment
Plant material and growth conditions
In order to examine phenotypic plasticity related to water deficit, a subset of trees were
chosen for a moderate drought glasshouse experiment in Southampton, UK. Six genotypes
were selected from the P. nigra collection (Table S2): four from the extreme “leaf size”
genotypes (two Spanish ‘small leaf’, Sp1, Sp2; one Italian ‘large leaf’, Ita and one from the
Netherlands ‘large leaf’, NL) and two from the Drôme population in France (Fr1, Fr2). These
genotypes were chosen to test the hypothesis that ‘small leaf’ genotypes are indicative of
adaptation to low water availability. The French genotypes were selected to represent a range
of temperatures and precipitation patterns, since the French river populations span a diverse
range of climatic conditions between Spain, Italy and the Netherlands. Cuttings were planted
in John Innes No. 2 (John Innes, Norwich, UK) without fertilisation in January 2007 in a
glasshouse and cut back in November 2007 at 10 cm from the base. They were watered daily
and put into dormancy conditions (natural light, 15 ºC:13 ºC day:night). In May 2008, the
temperature in the glasshouse was set at 22 ºC:16 ºC, day:night. During the experiment,
photoperiod was maintained 16 h:8 h, light:dark with a minimum photosynthetic active
radiation at the top of the plants of 150 μmol m -2 s-1, supplementing natural daylight. The
number of replicates for each genotype varied between 5 and 10 per condition (Table S2).
The trees were randomised in 10 blocks containing one replicate per genotype per treatment.
At the start of the experiment on September 1st 2008, 200 ml of water was added to each tree
and the pots were then covered in aluminium foil to prevent water evaporation. The first
mature leaf and the first emerging young leaf were tagged with cotton string. Over the next
month (30 days), soil moisture content was measured every morning with a Delta-T ML2x
ThetaProbe connected to an HH2 moisture meter (Delta-T Devices, Cambridge, UK). Well-
8
172
173
174
175
176
177
178
179
180
181
182
183
184
185
186
187
188
189
190
191
192
193
194
195
196

watered trees (control) were watered to field capacity and drought stressed trees were kept
between 15–20 % percent volume soil moisture as determined as a suitable moderate drought
treatment for poplar by Street and colleagues (2006). Using a repeated measurements test
over time, soil moisture content showed significant differences between treatment
(F1,50=363.17, p<0.001) but no significant differences between genotypes (F5,50=1.06,
p=0.392) and no genotype x treatment interaction effect (F5,50=0.82, p=0.543), meaning all
the genotypes had their soil moisture decreased equally under drought (Fig.3, Fig. S1, Fig.
S2).
Physiological and growth measurements
Biomass measurements were conducted on September 1st 2008 (0 day after drought (DAD))
and September 17th 2008 (16DAD). Measures included height (cm), stem diameter (mm,
measured using digital callipers at 10 cm from the stem base), the number of branches, and
the number of leaves. Height and stem diameter growth were calculated as the difference
between 0DAD and 16DAD. The number of branches and leaves developed during the
experiment was calculated as the difference between the 0DAD and 16DAD for branch
number and leaf number respectively. Leaves newly developed (NLN) during the experiment
above the tag on the first emerging leaf were also counted at 16DAD and used with the total
number of leaves at 0DAD and 16DAD to calculate the number of fallen leaves, as
senescence = (NL16DAD-NL0DAD)-NLN. The third mature leaf (counting from the uppermost
mature leaf) was sampled at 27DAD, traced, and dried as described above. Dried leaves were
used to calculate SLA, the ratio of leaf area in cm2 (prior to drying) to leaf dry mass in grams
(Marron et al. 2005).
9
197
198
199
200
201
202
203
204
205
206
207
208
209
210
211
212
213
214
215
216
217
218
219
220
The first three leaves which emerged on the main stem during the experiment were followed
for leaf area using the leaf tagged on 0DAD. The contour of the leaves was traced onto paper
before the images were scanned and processed using ImageJ (Abramoff et al. 2004). Stomatal
conductance (gs) was measured on the first mature leaf tagged at 0DAD, 5DAD and 15DAD,
using a steady-state porometer (LI-1600; LICOR, Inc. Lincoln, Nebraska, USA). In order to
examine variation in WUE, a young leaf (third leaf from the top) of each tree was placed in a
paper bag on 19DAD and oven dried. Δ13C was measured as described for the wood collected
in Belgium.
Gene expression analysis
Young leaves were sampled on 19DAD for gene-expression analyses (microarrays and real-
time PCR). Two genotypes – one from Spain (Sp2) and one from Italy (Ita) were selected for
microarray analysis based on being the most extreme genotypes in terms of morphology.
Each sample (the first two unfurled leaves) was flash frozen in liquid nitrogen and stored at -
80°C for further analysis. RNA was extracted following the CTAB protocol from Chang et
al. (1993). Eight RNA samples, corresponding to two biological replicates of both well-
watered and drought treatments per genotype, were sent to the European Arabidopsis Stock
Centre (NASC, Loughborough, UK) microarray service for the cDNA synthesis,
fragmentation, array hybridization and scanning using Affymetrix GeneChip Poplar Genome
Arrays (Affymetrix, Santa Clara, USA). Affymetrix CEL files were imported into R software
(Core Team, 2014, R Foundation for Statistical Computing, http://www.R-project.org). Probe
sets exhibiting no signal intensity were filtered out by a Present call procedure as described
by McClintick and Edenberg (2006). Briefly, CEL files were normalised using the MAS5
algorithm with default parameters (affy package, v1.48.0, Gauthier et al, 2004). MAS5
provides a detection call, Absent (A), Present (P) or Marginal (M), which indicates whether
10
221
222
223
224
225
226
227
228
229
230
231
232
233
234
235
236
237
238
239
240
241
242
243
244
245

the specific transcript is detectable. For each probe set, the percentage of Present calls in each
condition was calculated. Probe sets that exhibited a percentage of Present calls of 100% in at
least one condition for both genotypes were kept. The other probe sets were removed from
the analysis. This procedure also allowed probe sets that hybridized exclusively to one
genotype to be discarded (Cohen et al., 2010). Finally, 31084 validated probe sets were
retained. In order to compute differential gene expression, CEL files were then normalised
using the RMA algorithm with default parameters (affy package, v1.48.0). Differential
expression was calculated as log2(Fold Change) between drought and control samples for the
31084 validated probe sets. Statistical significance of differential expression was tested using
moderated t-tests implemented in the eBayes function (limma package v3.24.12, Smyth,
2004) and FDR corrections for multiple-testing were applied. Thresholds of |Log2(FC)|≥1
and corrected p-value<0.05 were used to identify differentially expressed genes. Probe sets
were annotated using the Poparray website (http://aspendb.uga.edu/poparray) and assigned to
a Populus gene model (v. 3.0) and its closest Arabidopsis homolog, and GO (Gene Ontology)
biological process, cellular component and molecular function classifications.
The software Mapman (Thimm et al., 2004) was used for pathway analysis. Statistics
(Wilcoxon Rank Sum Test with a Benjamini-Hochberg FDR correction) were implemented
in Mapman to reveal BINs exhibiting a significant difference in expression profile behaviour
compared to the other BINs. Gene ontology enrichment was also studied using the PAGE
tool on AgriGo web site (Du et al. 2010) with default parameters using validated probe sets
as the reference.
Results of the microarray experiment were confirmed using quantitative real-time PCR
(qPCR) for a set of differentially expressed candidate genes. Forward and reverse primers
11
246
247
248
249
250
251
252
253
254
255
256
257
258
259
260
261
262
263
264
265
266
267
268
269
270
were designed, from the Populus trichocarpa genome (v1.2), specifically to each gene (Table
S3). Reverse transcription of RNA to cDNA was performed using the ImProm-II Reverse
Transcription kit (Promega UK, Southampton, UK) following the manufacturer’s
instructions. Each qPCR reaction was composed of 5 µL 2X Precision-SY Master Mix
(PrimerDesign Ltd, UK), 5 pmol forward and reverse primers and 25 ng diluted cDNA.
Plates were run on a Chrom4 Real-Time PCR Detection System (Bio-Rad Laboratories,
Hercules, USA). Reactions were incubated at 95 °C for 10 minutes and then 40 cycles of 15
seconds at 95 °C, 1 minute at 60°C and a plate read. An incubation at 72 °C for 10 minutes
followed. A melting curve was then performed from 60 °C to 95 °C with a read every 0.2 °C
and 1 second hold, in order to check for primer dimers, DNA contamination and secondary
products. Values were exported with the software Opticon Monitor 3.1 (Bio-Rad
Laboratories, Hercules, USA). Amplification efficiency was measured following the equation
from Liu & Saint (2002):
E = (Rn,A / Rn,B) ^ [1/CT,A-CT,B) ] + 1
where Rn,A and Rn,B are Rn at arbitrary thresholds A and B in an individual curve, respectively,
and CT,A and CT,B are the threshold cycles at these arbitrary thresholds (Liu & Saint 2002).
Ratios were calculated as E (control−drought ) target
E(control−drought ) refe rence
Statistical analysis
Data from the Belgium common garden experiment were analysed using the SPSS software
package (SPSS, Chicago, USA). Kolmogorov-Smirnov tests were used to test for normality
and transformation (log10) was carried out when required. A GLM tested the effects of block
and river population:
Y ij = µ + α i + β j + ε
12
271
272
273
274
275
276
277
278
279
280
281
282
283
284
285
286
287
288
289
290
291
292
293
294
where Yij is the phenotype in the ith block and in the jth river population, i is the block
effect, j is the river population effect, and is the residual error. A comparison of means was
carried out between river populations using a Student-Newman-Keuls post-hoc test.
A GLM was also performed to test genotype effects:
Y i = µ + α i + ε
where Yi is the phenotype in the ith genotype, i is the genotype effect and is the residual
error.
Climatic data from the region of origin for genotypes were correlated with and among
phenotypic traits as measured in the common garden was tested using Spearman’s rho in
SPSS v19.0 (SPSS, Chicago, USA).
Data from the glasshouse experiment were also analysed for genotype and treatment effect
(and their interaction) using the SPSS software package (SPSS, Chicago, USA). Normality
(Kolmogorov-Smirnov test) and block effects were checked before performing an ANOVA
GLM. Data were transformed using a natural log when required. A GLM tested the effects of
genotype and treatment:
Y ij = µ + α i + β j + ε
where Yij is the phenotype in the ith genotype and in the jth treatment, i is the genotype
effect, j is the treatment effect, and is the residual error. A comparison of means was
carried out among genotypes using a Student-Newman-Keuls post-hoc test. A test for
repeated measurements was used for leaf area over time for each leaf number. Phenotypic
plasticity in drought response was quantified using the equation drought−control
controlx100 from
Street et al. (2006).
13
295
296
297
298
299
300
301
302
303
304
305
306
307
308
309
310
311
312
313
314
315
316
317
318
Results
Common garden
The collection of nearly 500 genotypes of P. nigra selected from contrasting climatic zones
across Europe was used to study natural variation in wood carbon isotope discrimination
(Δ13C), leaf, cell and biomass traits for trees grown under well-watered conditions in a
Belgium common garden field site (Fig. 1). Significant differences in plant morphology were
observed between natural populations. Leaf area, stem circumference and Δ13C varied
significantly between river sites (F10,482=129.8, p<0.001; F10,453=35.2, p<0.001; F10,466=33.5,
p<0.001 respectively with Type III sums of squares). For stomatal index (SI), although the
difference was not significant (p<0.05), a trend was apparent with northern populations (Italy,
The Netherlands and Germany) exhibiting a high SI, while genotypes from French
populations showed a lower SI. In contrast to other measurements, the Spanish genotypes
were intermediate in their ranking (Fig. 1e). Leaf area and stem circumference were highest
in the northern river populations (Italy, The Netherlands and Germany), while Spanish and
Southern French genotypes had the smallest leaves and stem circumference (Fig. 1d and 1f).
Δ13C tended to decrease along this north-south latitudinal gradient, although there were
exceptions, such as for genotypes from west Loire (Fig. 1g), but suggests that, under well-
watered conditions, water use efficiency was higher for genotypes from northern latitudes,
when grown in the Belgian common garden.
Correlation between leaf, cell, and biomass traits within and among growing seasons showed
that leaf area correlated with tree height and circumference, both of which are woody
biomass traits (Table S4, Fig. 2). In the third year of growth (2006), when leaf cell traits were
measured, there was a strong positive correlation between cell number per leaf and leaf area
(Table S4, Fig. 2, R2 = 0.927, P < 0.0001) but a weak negative correlation between cell area
14
319
320
321
322
323
324
325
326
327
328
329
330
331
332
333
334
335
336
337
338
339
340
341
342
343

and leaf area (Table S4, Fig. 2, R2 = -0.235, P < 0.0001). Furthermore, stomatal patterning
correlated strongly with all biomass traits with the exception of stomatal index showing no
relationship to leaf shape ratios in either 2005 or 2006 (R2 = -0.059, P < 0.85; R2 = 0.025, P <
0.429 respectively). Precipitation at the genotype site of origin correlated with leaf and stem
phenotypic traits with higher precipitation (mean annual, minimum and maximum) correlated
with increased leaf areas, which are made up of a greater number of smaller cells per leaf
with more stomata, higher SLA, and increased stem height and circumference (Table S4).
Additionally, higher temperatures (mean annual, minimum and maximum) correlated with
leaf shape ratio and SLA. The temperature of the coolest month seems most important with
respect to leaf area and cell number per leaf, as well as stem height and circumference in
2005 and 2006 respectively. However, mean annual temperature and the temperature of the
warmest month also correlated with reduced leaf cell size and stem circumference and
increased abaxial stomatal density (Table S4).
Drought experiment
Six contrasting genotypes were selected from the common garden trial to further elucidate
phenotypic plasticity in response to drought, and how this varied across genotypes adapted to
local drought conditions. These genotypes were subjected to a moderate drought in a
controlled environment glasshouse in southern England (Fig. 3a). Variation in response to
drought was observed across the six selected genotypes (Table 1). Interaction between
genotype and treatment was significant for Δ13C, from a two-way ANOVA and close to
significant (p<0.10) for stem growth. Five of the nine traits measured, showed both genotype
and drought main ANOVA effects, whilst highly significant drought effects were observed
for stomatal conductance, Δ13C, leaf production and growth traits (Table 1). Furthermore,
15
344
345
346
347
348
349
350
351
352
353
354
355
356
357
358
359
360
361
362
363
364
365
366
367

SLA varied significantly between genotypes but was unaffected by the drought treatment
(Table 1).
Biomass
Images taken on 20DAD revealed the main morphological variation in response to drought
across the six selected genotypes (represented by four genotypes in Fig. 3b). Biomass
production was also measured (Table S5, Fig.4) and revealed that height growth decreased
for all genotypes in response to drought (genotype: F5,85=6.6, p<0.001; treatment: F1,85=37.1,
p<0.001) with the largest decrease (-86%) for the Ita genotype (Fig. 4a). Fr1 and Sp2
maintained some height growth under drought with only moderate reductions apparent (-32%
and -37% respectively).
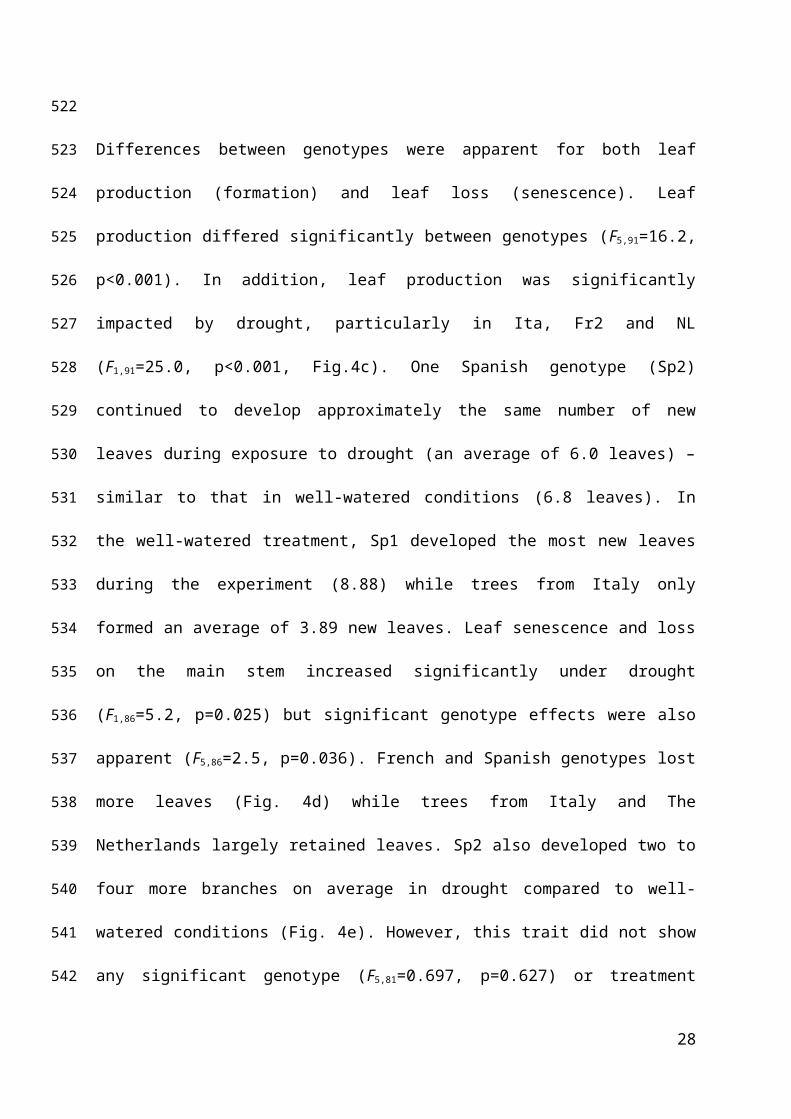
Differences between genotypes were apparent for both leaf production (formation) and leaf
loss (senescence). Leaf production differed significantly between genotypes (F5,91=16.2,
p<0.001). In addition, leaf production was significantly impacted by drought, particularly in
Ita, Fr2 and NL (F1,91=25.0, p<0.001, Fig.4c). One Spanish genotype (Sp2) continued to
develop approximately the same number of new leaves during exposure to drought (an
average of 6.0 leaves) – similar to that in well-watered conditions (6.8 leaves). In the well-
watered treatment, Sp1 developed the most new leaves during the experiment (8.88) while
trees from Italy only formed an average of 3.89 new leaves. Leaf senescence and loss on the
main stem increased significantly under drought (F1,86=5.2, p=0.025) but significant genotype
effects were also apparent (F5,86=2.5, p=0.036). French and Spanish genotypes lost more
leaves (Fig. 4d) while trees from Italy and The Netherlands largely retained leaves. Sp2 also
developed two to four more branches on average in drought compared to well-watered
conditions (Fig. 4e). However, this trait did not show any significant genotype (F5,81=0.697,
16
368
369
370
371
372
373
374
375
376
377
378
379
380
381
382
383
384
385
386
387
388
389
390
391
392

p=0.627) or treatment effects (F1,81=0.948, p=0.33). Genotypes NL, Ita and Fr2 developed no
branches in response to water deficit. SLA was measured at the end of the experiment and
revealed a significant genotype (F5,87=10.5, p<0.001) but not a treatment effect (F1,87=3.0,
p=0.09)
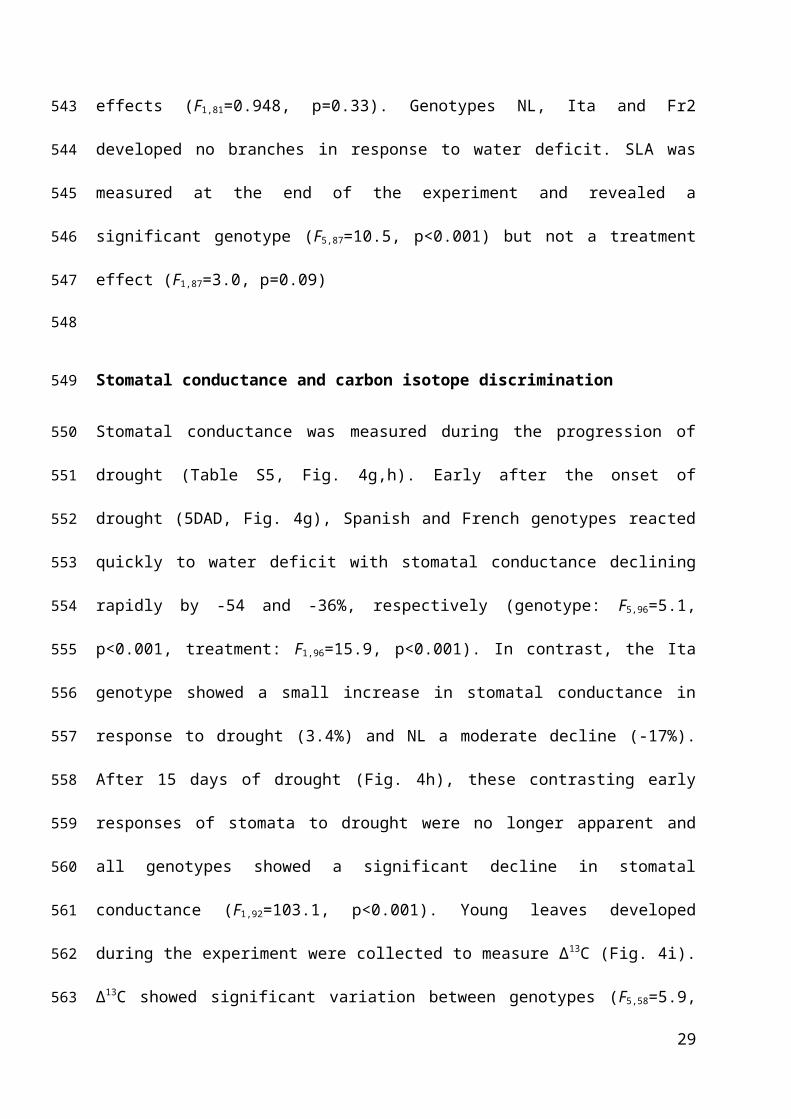
Stomatal conductance and carbon isotope discrimination
Stomatal conductance was measured during the progression of drought (Table S5, Fig. 4g,h).
Early after the onset of drought (5DAD, Fig. 4g), Spanish and French genotypes reacted
quickly to water deficit with stomatal conductance declining rapidly by -54 and -36%,
respectively (genotype: F5,96=5.1, p<0.001, treatment: F1,96=15.9, p<0.001). In contrast, the Ita
genotype showed a small increase in stomatal conductance in response to drought (3.4%) and
NL a moderate decline (-17%). After 15 days of drought (Fig. 4h), these contrasting early
responses of stomata to drought were no longer apparent and all genotypes showed a
significant decline in stomatal conductance (F1,92=103.1, p<0.001). Young leaves developed
during the experiment were collected to measure Δ13C (Fig. 4i). Δ13C showed significant
variation between genotypes (F5,58=5.9, p<0.001), a highly significant effect of drought
(F1,58=7.5, p=0.008) and a significant interaction of genotype x treatment (F5,58= 2.6,
p=0.037), indicating that the response to drought differed depending on genotype. While
Sp1, Sp2 and Fr1 decreased their Δ13C by around 10% during the drought treatment, possibly
indicating an increase in water use efficiency (WUE), Fr2 showed no variation between
treatment and Ita increased Δ13C under drought.
17
393
394
395
396
397
398
399
400
401
402
403
404
405
406
407
408
409
410
411
412
413
414
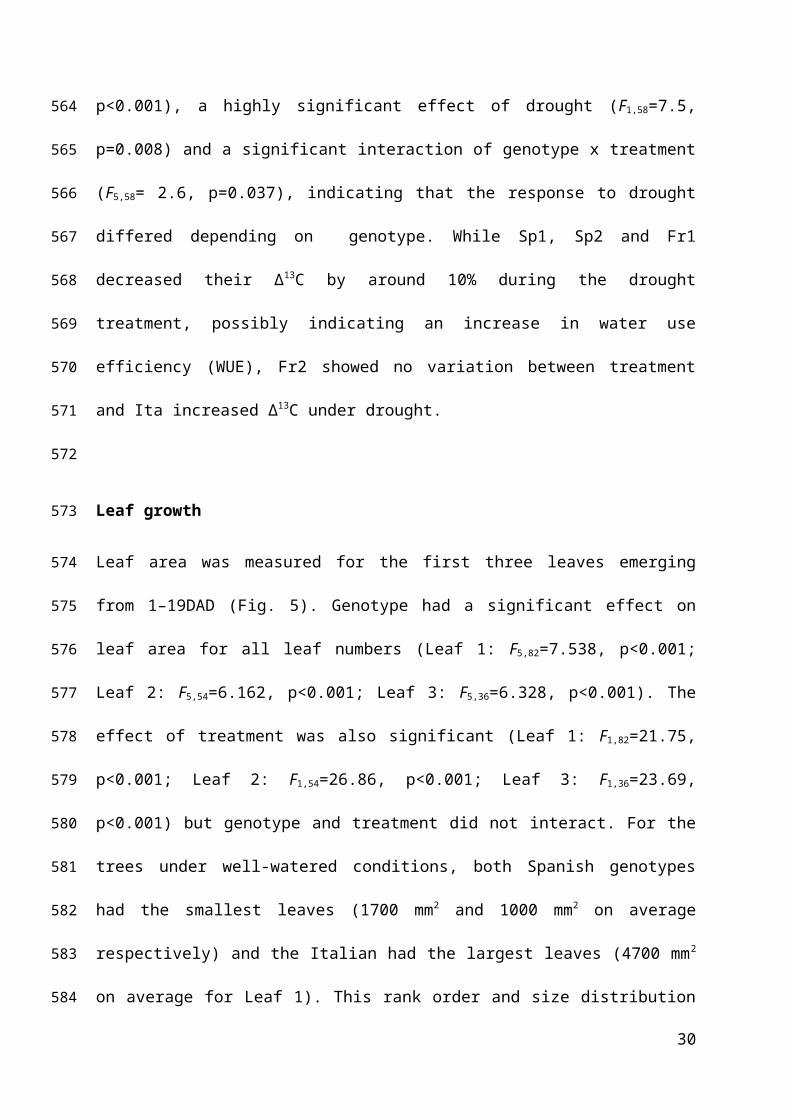
Leaf growth
Leaf area was measured for the first three leaves emerging from 1–19DAD (Fig. 5).
Genotype had a significant effect on leaf area for all leaf numbers (Leaf 1: F5,82=7.538,
p<0.001; Leaf 2: F5,54=6.162, p<0.001; Leaf 3: F5,36=6.328, p<0.001). The effect of treatment
was also significant (Leaf 1: F1,82=21.75, p<0.001; Leaf 2: F1,54=26.86, p<0.001; Leaf 3:
F1,36=23.69, p<0.001) but genotype and treatment did not interact. For the trees under well-
watered conditions, both Spanish genotypes had the smallest leaves (1700 mm2 and 1000
mm2 on average respectively) and the Italian had the largest leaves (4700 mm2 on average for
Leaf 1). This rank order and size distribution was consistent with that observed in the
common garden experiment, indicating the greenhouse conditions did not change the
phenotypic differences in these plants. Sp2 showed the smallest reduction in leaf area (-21.2
%) and Fr2 the largest reduction (-66.3%) in response to drought.
Transcriptome response to drought
Dramatic differences were apparent in the transcriptomic responses to drought in the
contrasting Spanish and Italian genotypes selected for gene expression analysis (Table S9). In
the Northern Italian genotype (Ita), 8857 probe sets displayed a significant two-fold change in
intensity in response to drought (3610 up-regulations and 5247 down-regulations, Fig. 6a,b).
In contrast, for the Spanish genotype (Sp2), only 1067 probe sets exhibited a two-fold
differential expression between control and drought conditions (338 up-regulations and 729
down-regulations, Fig. 6a,b). Only 258 probe sets were commonly up-regulated between the
two genotypes under drought and 643 were commonly down-regulated in response to drought
(Fig. 6c, Table S9).
18
415
416
417
418
419
420
421
422
423
424
425
426
427
428
429
430
431
432
433
434
435
436
437
438
A combination of pathway analysis from Mapman and PAGE analysis from AgriGO allowed
functional enrichments to be identified (Table 3, Fig. 8). Only three bins were significant in
the Mapman analysis for the Spanish genotype in response to drought (Table 3, Table S7 for
full details): Cell (p= 0.0000003), secondary metabolism (p=0.01) and transport
(p=0.000062). The Italian genotype had 24 Mapman bins which were significant (p<0.05)
including DNA, RNA, cell, stress, transport, hormone metabolism and signalling (Table 3,
Table S7 for full details).
PAGE analysis of drought responsive genes confirmed the results from Mapman and allowed
453 and 115 significantly enriched GO terms to be highlighted for Ita and Sp2, respectively
(Table S8). Eighty three GO terms were commonly enriched for both genotypes. Among the
31 common down-regulated biological processes (Table S8), 50% were related to cell
division (e.g “mitosis”, “DNA metabolic process”, “chromosome organisation”, “cell cycle”,
etc.). Other negatively regulated processes were also found such as “regulation of gene
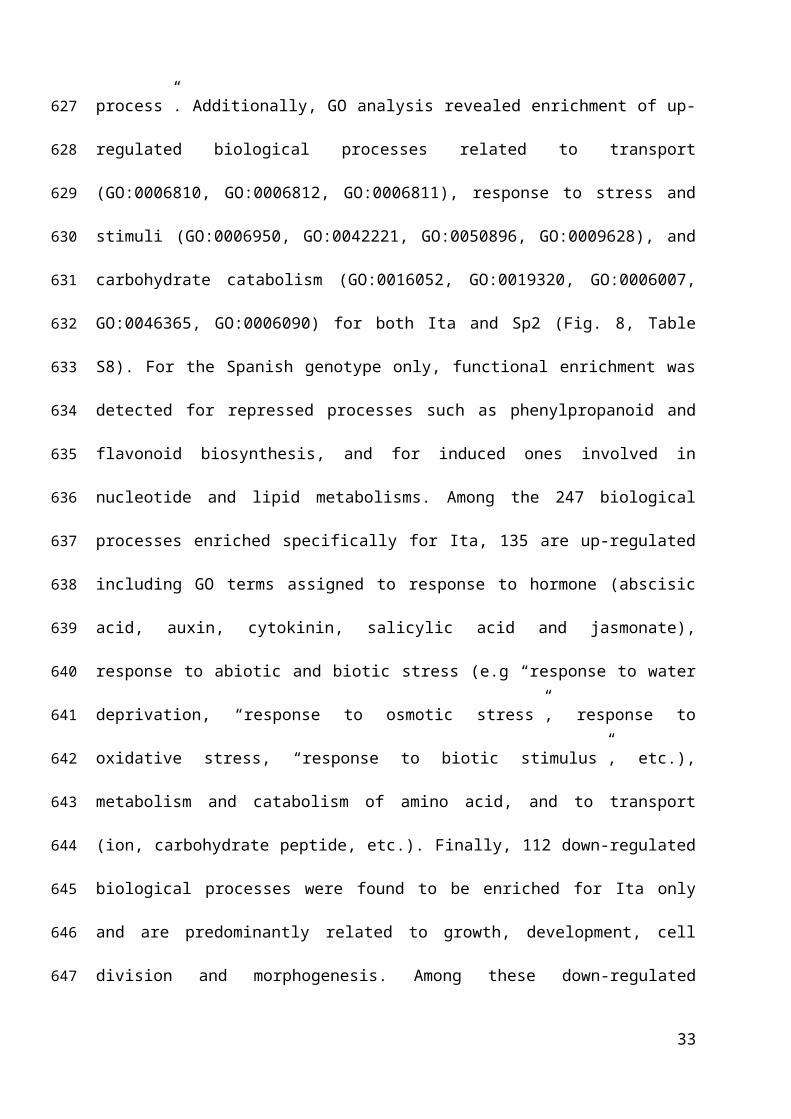
expression” and “secondary metabolic process”. Additionally, GO analysis revealed
enrichment of up-regulated biological processes related to transport (GO:0006810,
GO:0006812, GO:0006811), response to stress and stimuli (GO:0006950, GO:0042221,
GO:0050896, GO:0009628), and carbohydrate catabolism (GO:0016052, GO:0019320,
GO:0006007, GO:0046365, GO:0006090) for both Ita and Sp2 (Fig. 8, Table S8). For the
Spanish genotype only, functional enrichment was detected for repressed processes such as
phenylpropanoid and flavonoid biosynthesis, and for induced ones involved in nucleotide and
lipid metabolisms. Among the 247 biological processes enriched specifically for Ita, 135 are
up-regulated including GO terms assigned to response to hormone (abscisic acid, auxin,
cytokinin, salicylic acid and jasmonate), response to abiotic and biotic stress (e.g “response to
water deprivation, “response to osmotic stress”, response to oxidative stress, “response to
19
439
440
441
442
443
444
445
446
447
448
449
450
451
452
453
454
455
456
457
458
459
460
461
462
463

biotic stimulus”, etc.), metabolism and catabolism of amino acid, and to transport (ion,
carbohydrate peptide, etc.). Finally, 112 down-regulated biological processes were found to
be enriched for Ita only and are predominantly related to growth, development, cell division
and morphogenesis. Among these down-regulated developmental processes, of particular
interest were “stomatal complex development” and its parent term “organ development” that
encompassed drought responsive genes. Among drought responsive genes, of particular
interest were those related to stomatal development and patterning (Fig. 7) and leaf
development (Table 2), since these showed marked differences between genotypes in
response to drought. In Sp2, only four genes were significantly down-regulated in response to
drought; two Erecta genes (ERECTA), one Erecta-like coding gene (ERL2) and Mute (MUTE),
an ortholog of Speechless which did not lead to a functional enrichment. In contrast, eight
transcripts determining stomatal patterning were down-regulated in Ita in response to
drought, including two Speechless orthologs (SPEECHLESS and MUTE), two Erecta coding
genes (ERECTA), three Erecta-like coding genes (ERL1, ERL2 and ERL3) and Too Many
Mouths (TMM). Transcripts controlling the activity of the shoot apical meristem and leaf
development were also down-regulated in the Italian genotype in response to drought (Table
2), such as five close homologs of Asymmetric leaves coding genes (AS1, Potri.017G112300,
Potri.006G085900, Potri.004G102600 and AS2, Potri.010G177100 , Potri.008G079800), six
homologs of Phabulosa (PHB), CLAVATA1 (CLV1) and five homologs of Aintegumenta
(ANT). Two of the same homologs of AS1 and AS2 were down-regulated in Sp2, as well as in
one of the PHB homologs, but in general, as for stomatal patterning transcripts, there were far
fewer changes in Sp2 then in Ita for leaf development transcript response to drought.
20
464
465
466
467
468
469
470
471
472
473
474
475
476
477
478
479
480
481
482
483
484
485
486
487

Variation under well-watered conditions
To elucidate constitutive differences in gene expression between the Spanish and Italian
genotypes that are present in well-watered conditions, a comparison was also completed for
the control dataTable S6). 252 up-regulated and 284 down-regulated transcripts were
identified in Sp2 compared to Ita (Fig. 6c). The AgriGO analysis showed enriched GO terms
differentially expressed between Sp2 and Ita in well-watered conditions, and these were
generally related to secondary metabolism. Also up-regulated in the Spanish genotype were
ERD1 (EARLY RESPONSE TO DEHYDRATION 1) AND RD21 (RESPONSIVE TO
DEHYDRATION 21).
Real-time qPCR
Microarray results were validated by real-time qPCR on four candidate genes selected after
microarray analysis. Gene expression was quantified for additional genotypes that were not
included in the microarray experiment: Fr1 from France and NL from the Netherlands (Fig.
S3). Real-time qPCR values were expressed in response to drought for each genotype.
SPEECHLESS expression ratios were lower in response to drought in both Ita and Sp2,
although this response was greater in Ita (F3,32=9.311, p<0.001, Figure S3).The expression
ratios of ERECTA were reduced in response to drought with no significant difference
between genotypes (F3,32=0.845, p=0.48, Figure S3).
Discussion
Our analysis has revealed significant natural variation between populations of black poplar
originating from contrasting climatic conditions within Europe. By combining a common
garden approach with manipulative experiments and genome-wide gene expression, this
21
488
489
490
491
492
493
494
495
496
497
498
499
500
501
502
503
504
505
506
507
508
509
510
511
study provides considerable insight into the intra-specific variation in drought tolerance for
this important keystone riparian tree species. We have identified transcriptome and trait
differences that suggest important adaptive mechanisms that exist within the species.
When grown at a single site in northern Europe under well-watered conditions, leaf, cell, and
stem size traits differed among genotypes of P. nigra (Fig. 1), indicating significant genetic
variance. Further, significant correlation among traits were found in established P. nigra trees
(Table S4, Fig. 2). Consistent with previous studies in Populus (Rae et al. 2004; Monclus et
al. 2005), leaf area in P. nigra correlated with stem circumference and plant height, indicating
leaf size is an early diagnostic indicator of biomass (Rae et al. 2009), with genotypes
originating from areas of higher precipitation characterised by larger and more deltoid leaves
(Fig. 1, Table S4). Smaller leaf morphotypes from Spain and southern France, which
originate from regions of lower precipitaion had smaller, more rhomboid leaves. In addition
to being an early diagnostic indicator for yield, leaf expansion is known to be highly sensitive
to water availability and breeding programs use variation in leaf size as a drought related trait
(Levi et al. 2009; Ashraf 2010). Therefore, we hypothesise that Spanish and southern French
genotypes have smaller leaves as an adaptation to drought in their native environment.
Similar observations have been drawn for two other genotypes of P. nigra from contrasting
northern and southern (water limited) environments in Italy (Regier et al. 2009; Cocozza et
al. 2010).
Although Populus is often defined as sensitive to drought, large variation in traits related to
drought tolerance and water stress response have been reported, but generally in F1 or F2
hybrids of commercial value, and not for a wild collection such as described here. For
example, osmotic adjustment varies across F1 and F2 genotypes (Marron et al. 2002;
22
512
513
514
515
516
517
518
519
520
521
522
523
524
525
526
527
528
529
530
531
532
533
534
535
536

Tschaplinski et al. 2006), as does leaf expansion (Street et al. 2006), leaf abscission (Street et
al. 2006), WUE (Rae et al. 2004; Monclus et al. 2005; Monclus et al. 2006; Voltas et al.
2006; Dillen et al. 2008) and Δ13C (Monclus et al. 2012). Stomatal traits linked to improved
drought tolerance are complex and related to both stomatal function (opening and closing)
and stomatal development and patterning. For the population of P. nigra, genotypic variation
was clear in Δ13C and varied with site of origin (Fig. 1). Wood Δ13C was lower in populations
from the north and east of Europe, such as The Netherlands, Germany, and northern Italy,
and this indicates higher water use efficiency (WUE). However, these trees were collected
from wet environments in Europe, comparable to the conditions in the common garden,
suggesting that they are particularly well adapted to the Belgian climate. On the other hand,
and perhaps counter-intuitively, Spanish and southern French populations had the highest
Δ13C, suggesting a lower WUE and poor control of water loss without a reduction in
photosynthesis or lowered photosynthetic rates but with unchanged stomatal conductance.
However, estimating WUE from Δ13C in this study is complicated by the use of bulk wood
(with potential variability in lignin:cellulose ratio) and no quantification of leaf anatomy,
which can have different internal conductance to CO2 thus impacting the isotopic model of
WUE. It is possible that the lower WUE in genotypes originating from areas of low
precipitation is due to different ecological strategies of these genotypes when they are grown
in an environment where water is not limited. Although the relationship between Δ13C/WUE
varies with climate and can respond positively to precipitation (Ferrio et al. 2003; Otieno et
al. 2005), WUE generally decreases with increasing levels of precipitation (Li et al. 2007), as
we have also shown here in the glasshouse in all but the Ita genotype. In contrast to Δ13C, no
significant differences were observed between populations in stomatal index (a measure of
stomatal patterning), although there was a trend of increased stomatal numbers in northern
and eastern genotypes. Given the potential for stomatal patterning and related genes to affect
23
537
538
539
540
541
542
543
544
545
546
547
548
549
550
551
552
553
554
555
556
557
558
559
560
561
stomatal conductance and thus WUE (Woodward et al., 2002; Masle et al., 2005; Roussel et
al., 2009), this lack of significance was surprising. Any adaptation to water deficit by the
small-leaf morphotypes, characteristic of Spanish trees, is likely, however, to involve
additional physiological pathways that are distinct from those controlling stomatal
development. It is also possible that stomatal patterning is phenotypically plastic, with
differential stomatal patterning occurring in leaves in response to water deficit and our data
for gene expression from the drought experiment would support this contention.
Contrasting genotypes were identified from the moderate drought experiment on genotypes
from four locations (Fig. 3a), with different adaptive mechanisms apparent for response to
drought stress. The ‘northern eastern’ genotype is characteristic of the northern Italian and
Netherlands genotypes, originating from areas of high precipitation, where tree productivity
and leaf area development is generally high but where height growth and new leaf formation
decreased dramatically following the onset of drought. No branches were developed in
drought and SLA remained unchanged. At the same time, the Ita and NL genotypes lost few
leaves through abscission in response to drought. Stomata responded slowly to drought, and
carbon isotope discrimination increased and decreased in Ita and NL, respectively. In
contrast, a ‘southern’ genotype, from a region of low precipitation, is characterised by the
Spanish and southerly French populations. Slow-growing with small leaves, these genotypes
responded to drought with rapid stomatal closure, with the maintenance of leaf expansion (for
Sp2) and formation (at least in the extreme example of Sp2), but with some leaf loss. Leaf
senescence and loss in response to drought allows remobilisation of nutrients from mature
leaves (Abreu & Munné-Bosch 2008) and reduced whole-plant transpiration, improving
drought tolerance (Chaves et al. 2003; Munné-Bosch & Alegre 2004). Rapid stomatal closure
only five days after drought in French and Spanish genotypes supports the idea that variation
24
562
563
564
565
566
567
568
569
570
571
572
573
574
575
576
577
578
579
580
581
582
583
584
585
586
in stomatal behaviour can exist within species, as was shown by Sparks & Black (1999) in
four populations of Populus trichocarpa originating from contrasting environments.
Stomatal closure is a biological process to avoid water loss in the event of drought stress but
can have other physiological consequences as it can inhibit photosynthesis (Cornic 2000).
There is a trend in our results which indicates that Sp2 closed stomata more in response to
drought when compared to Ita (5DAD and 15DAD) and this correlated with reduced Δ13C
under drought, suggesting an increase in WUE in droughted conditions. In a study of δ13C in
beech planted in different sites throughout Europe, the highest values (thus the lowest values
of Δ13C) were observed in the most southern location in France (Keitel et al. 2006). Monclus
et al. (2005) studied different genotypes of Populus (tolerant and non-tolerant to drought) and
showed that the drought tolerant trees tended to decrease in Δ13C, but the inverse was
observed for the non-tolerant genotypes. Thus there is much evidence to show Δ13C varies
between tolerant and non-tolerant genotypes and we suggest that this may be due to stomatal
responsiveness in tolerant genotypes. However, if this is the case and rapid stomatal closure
is an important drought response mechanism, the consequences of this phenotypic plasticity
for tree productivity at plantation-scale remain to be elucidated.
Genotypes from Spain and Italy were selected for gene expression analyses because their
sites of origin differed markedly in rainfall but not temperature, and thus likely represented
contrasting strategies for response to soil water deficits. Given the controlled application of
water deficit, with controlled constant temperature in this experiment, it was surprising to see
that gene expression changes differed so markedly between the two genotypes, with more
than twice the number of differentially expressed genes observed in the Ita compared to the
Sp2 genotype. It is remarkable that only 901 transcripts were commonly expressed in
25
587
588
589
590
591
592
593
594
595
596
597
598
599
600
601
602
603
604
605
606
607
608
609
610
611

response to drought for both genotypes, considering more than 8000 changes in gene
expression were observed in total. This result strongly suggests that the Spanish and Italian
genotypes are differentially adapted to drought stress and that this involves considerable
plasticity in gene expression – manifested in contrasting phenotypic acclimation to the
imposed stress. This result is similar to that from Mediterranean species, which has suggested
that phenotypic plasticity is lower in plants from low resource environments as part of a
conservative resource-use strategy (Valladares et al. 2000). These contrasting patterns of
gene expression in P. nigra, and their associated phenotypes, provide important clues to aid
our understanding of adaptation. This will help to ensure the availability of a resilient gene
pool as drought stress increases across Europe, which is a valuable resource for future
management and conservation of black poplar.
A larger number of Gene Ontology groups related to ‘response to stimulus’ were significantly
expressed in Ita compared to in Sp2, suggesting a highly water stress responsive gene
expression pattern in the Ita trees (Fig. 9). Similar conclusions were drawn for salt-stressed
(Walia et al. 2005; Walia et al. 2007) and drought stressed (Degenkolbe et al. 2009) rice
genotypes. When comparing two genotypes of potatoes, Schafleitner et al. (2007) observed
only 186 up-regulated and 77 down-regulated genes in common while 1713 genes were
expressed in total in response to drought.
There are two important phenotypic traits, which underpin drought tolerance and appear to be
key to understanding genomic plasticity and adaptation in these contrasting genotypes of
black poplar. These traits are linked to leaf development and stomatal patterning and
contribute to drought tolerance. Leaf size determines leaf and canopy transpiration (Radin et
al. 1994; Levi et al. 2009; Ashraf 2010) and is also tightly related to yield, an important trait
26
612
613
614
615
616
617
618
619
620
621
622
623
624
625
626
627
628
629
630
631
632
633
634
635
636
linked to fitness (Rae et al.. 2004; Monclus et al.. 2005). Leaf production and leaf loss
represent important adaptive mechanisms enabling long-lived trees to moderate the amount
of transpiring leaf surface area. Furthermore, stomatal aperture and stomatal number both
contribute to the control of transpiration, leaf-level water use efficiency and drought tolerance
(Nilson & Assmann 2007). Whilst both genotypes showed reduced leaf expansion in
response to drought, for the Ita genotype this reduction was dramatic (< 50%), whilst for Sp2
it was moderate (< 20%). Changes in gene expression concur with these different
developmental responses to drought. Transcripts determining the balance between shoot
apical meristem activity and the initiation and development of leaf primordia were down-
regulated for the Italian genotype in drought (Table 2), including ANT, PHB, AS1, AS2 and
CLV1 while only AS1 and AS2 were down-regulated in Sp2. These data suggest that cell
proliferation, rate of leaf expansion and leaf size would be reduced for the Ita genotype in
drought, confirming our observations, with less impact on the Sp2 genotype. Ita expression is
thus more concentrated in reacting to stress rather than maintaining leaf development (Fig. 9)
and this is supported by a drastic down-regulation of processes linked to cell division
revealed by gene ontology analysis.
Similarly, striking differences in genes controlling stomatal initiation and number were
observed in response to drought for Spanish and Italian genotypes. Stomata regulate CO2 and
water-vapour exchange between leaves and the atmosphere (MacAlister et al. 2007) and
prevent water loss through partial stomatal closure. Although the genetic control of stomatal
initiation and patterning is now well documented (Barton 2007; Gray 2007; Casson &
Hetherington 2010; Torii, 2015), less is known about how the environment interacts with the
control of stomatal patterning, although genes regulating the development of stomata have
also been discovered in response to light (Casson et al. 2009), CO2 (Gray et al. 2000; Hu et
27
637
638
639
640
641
642
643
644
645
646
647
648
649
650
651
652
653
654
655
656
657
658
659
660
661
al. 2010) and drought (Masle et al. 2005). Unfortunately stomatal patterning was not
measured here but our on-going research suggests patterning differs depending on genotype
(Smith, unpublished).
Several stomatal patterning genes that negatively regulate stomatal number were down-
regulated in response to drought for the Italian genotype including TMM (TOO MANY
MOUTHS), ERECTA, ERL1 (ERECTA-LIKE 1, Fig. 7). In particular, there is strong evidence
that increased transcript abundance in ERECTA is linked to declining stomatal numbers, and
that ERECTA acts to regulate the initial decision of cells to enter the stomatal developmental
pathway (Shpak et al. 2007). Two positive regulators of stomatal development were also
down-regulated – SPEECHLESS and MUTE. Overall, the down-regulation of ERECTA,
ERL1 and TMM in the Italian genotype suggests that the formation of stomata was stimulated
in response to drought. Few changes in gene expression for genes that regulate stomatal
numbers were apparent for the Spanish ecotype; only the ERECTA gene showed any response
to drought, and this could still be significant. The stomatal patterning phenotype remains to
be tested in these P. nigra trees.
Although our prediction is for increased stomatal numbers in response to drought for Ita, this
has not yet been tested but is the subject of future research alongside RNA-Seq analysis of
guard cell and epidermal gene expression. The stimulation of stomatal initiation in response
to drought is somewhat counter-intuitive and recent reports for P. balsamifera showed
reduced stomatal numbers following drought treatment (Hamanishi et al. 2012). These
authors also assessed expression of several stomatal patterning genes and differences between
two commercial genotypes were apparent, although they were often inconsistent across
28
662
663
664
665
666
667
668
669
670
671
672
673
674
675
676
677
678
679
680
681
682
683
684
685
several sampling times. Nevertheless, they reinforce the concept that the regulation of
stomatal numbers varies intra-specifically and may be an important control point to elucidate
differences in adaptation to drought in the genus Populus (Roussel et al., 2009).
In summary, we have identified significant differences in response to drought for black
poplar genotypes collected from dry and wet environments across Europe. ‘Southern’
Spanish trees are well adapted to slow growth in droughted conditions, producing small
leaves and partially closed stomata, with a higher intrinsic water use efficiency, whilst Italian
and ‘north eastern’ trees demonstrate a dramatic response to drought with reduced growth
and increased stomatal formation. We hypothesise therefore that each of these strategies may
be of value, depending on the likely frequency and duration of drought in a particular
environment. Importantly here, we have identified a suite of genes that will be the focus of
our future research using reverse genetic approaches and testing material in the field in
contrasting drought environments. Thus, screening for functional genomic and genetic
variation in genotypes from diverse geographic locations under drought stress is a powerful
strategy to inform the conservation and management of germplasm resources in a future,
changing climate and should be exploited more widely in these difficult-to-study, long-lived
but critical plants that contribute to timber, fuel, fibre and ecosystem service provision on a
global scale.
Acknowledgments
The authors thank P.J. Tricker, N.R. Street, A. Rae, C. Dixon, S. Milner, and B. Street for
field and laboratory assistance, K. Schamp for field assistance, M.J. Tallis for preliminary
data analysis and Forest Research for grinding the wood samples. This research was
29
686
687
688
689
690
691
692
693
694
695
696
697
698
699
700
701
702
703
704
705
706
707
708
709
supported by the European Commission through the Directorate General Research within the
Fifth Framework for Research – Quality of Life and Management of the Living Resources
Programme, contact No. QLK5-CT-2002-00953 (POPYOMICs), within the Sixth Framework
for Research as part of the Network of Excellence EVOLTREE, contract No. 016322 –
Sustainable development, Global Change and Ecosystems Programme and through the
Seventh Framework for Research, Food Agriculture and Fisheries, Biotechnology, within the
project ENERGYPOPLAR, contract No. FP7-211917 and WATBIO, contract No. FP7-
311929. Support was also provided by the UK Department for Environment, Food and Rural
Affairs BEGIN project, contract number NF0424, and an Overseas Research Student Award
Scheme (to JD).
30
710
711
712
713
714
715
716
717
718
719
720
721

References
Abramoff MD, Magelhaes PJ, Ram SJ (2004) Image processing with ImageJ. Biophotonics
International 11, 36-42.
Abreu E, Munné-Bosch S (2008) Salicylic acid may be involved in the regulation of drought-
induced leaf senescence in perennials:A case study in field-grown Salvia officinalis L.
plants. Environment and Experimental Botany 64, 105-112.
Alberto FJ, Aitkin AN, Alia R, Gonzalez-Martinez SC, Hänninen H, Kremer A, Lefèvre F,
Lenormand T, Yeaman S, Whetten R, Savolainen O (2013) Potential for evolutionary
responses to climate change- evidence from tree populations. Global Change Biology
19, 1645-1661.
Allen CD, Macalady AK, Chencouni H, Bachelet D, McDowell N, Vennetier M, Kitzberger
T, Rigling A, Breshears DD, Hogg EH, Gonzalez P, Fensham R, Zhang Z, Castro J,
Demidova N, Lim J-H, Allard G, Running SW, Semerci A, Cobb N (2010). A global
overview of drought and heat-induced tree mortality reveals emerging climate change
risks for forests. Forest Ecology and Management 259, 600-684.
Ashraf M (2010). Introducing drought tolerance in plants: Recent advances. Biotechnology
Advances 28, 169-183.
Atwell S, Huang YS, Vilhjálmsson BJ, Willems G, Horton M, Li Y, Meng D, Platt A, Tarone
AM, Hu TT, Jiang R, Muliyati NW, Zhang X, Amer MA, Baxter I, Brachi B, Chory J,
Dean C, Debieu M, de Meaux J, Ecker JR, Faure N, Kniskern JM, Jones JD, Michael
T, Nemri A, Roux F, Salt DE, Tang C, Todesco M, Traw MB, Weigel D, Marjoram P,
Borevitz JO, Bergelson J, Nordborg M (2010). Genome-wide association study of 107
phenotypes of Arabidopsis thaliana inbred lines. Nature 465, 627-631
31
722
723
724
725
726
727
728
729
730
731
732
733
734
735
736
737
738
739
740
741
742
743
744
745

Barton MK (2007). Making holes in leaves: Promoting cell state transitions in stomatal
development. The Plant Cell 19, 1140-1143.
Benito-Garzón M, Alía R, Robson M, Zavala MA (2011). Intra-specific variability and
plasticity influence potential tree species distributions under climate change. Global
Ecology and Biogeography 20(5), 766-778.
Bogeat-Triboulot MB, Brosche M, Renaut J, Jouve L, Le Thiec D, Fayyaz P, Vinocur B,
Witters E, Laukens K, Teichmann T, Altman A, Hausman JF, Polle A, Kangasjarvi J,
Dreyer E (2007). Gradual soil water depletion results in reversible changes of gene
expression, protein profiles, ecophysiology, and growth performance in Populus
euphratica, a poplar growing in arid regions. Plant Physiology 143, 876-892.
Bréda N, Badeau V (2008). Forest tree responses to extreme drought and some biotic events:
Towards a selection according to hazard tolerance? C.R. Geoscience 340, 651-662.
Bussotti F, Pollastrini M, Holland V, Brüggemann W (2015). Functional traits and adaptive
capacity of European forests to climate change. Environmental and Experimental
Botany 111, 91-113.
Casson SA, Franklin KA, Gray JE, Grierson CS, Whitelam GC, Hetherington AM (2009).
Phytochrome B and PIF4 regulate stomatal development in response to light
quantity. Current Biology 19, 229-234.
Casson SA, Hetherington AM (2010). Environmental regulation of stomatal development.
Current Opinion in Plant Biology 13, 90-95.
Chang S, Puryear J, Cairney J (1993). A simple and efficient method for isolating RNA from
pine trees. Plant Molecular Biology Reporter 11, 113-116.
Chaves MM, Maroco JP, Pereira JS (2003). Understanding plant responses to drought - from
genes to the whole plant. Functional Plant Biology 30, 239-264.
32
746
747
748
749
750
751
752
753
754
755
756
757
758
759
760
761
762
763
764
765
766
767
768
769
Cocozza C, Cherubini P, Regier N, Saurer M, Frey B, Tognetti R (2010). Early effects of
water deficit on two parental clones of Populus nigra grown under different
environmental conditions. Functional Plant Biology 37, 244-254.
Cohen D, Bogeat-Triboulot MB, Tisserant E, Balzergue S, Martin-Magniette M-L, Lelandais
G, Ningre N, Renou J-P, Tamby J-P, Le Thiec D, Hummel I (2010). Comparative
transcriptomics of drought responses in Populus: a meta-analysis of genome-wide
expression profiling in mature leaves and root apices across two genotypes. BMC
Genomics 11, 630.
Condon AG, Richards RA, Rebetzke GJ, Farquhar GD (2002). Improving Intrinsic Water-
Use Efficiency and Crop Yield. Crop Science 42, 122-131.
Cornic G (2000). Drought stress inhibits photosynthesis by decreasing stomatal aperture - not
by affecting ATP synthesis. Trends in Plant Science 5, 187-188.
Degenkolbe T, Thi Do P, Zuther E, Repsilber D, Walther D, Hincha DK, Köhl KI (2009).
Expression profiling of rice cultivars differing in their tolerance to long-term drought
stress. Plant Molecular Biology 69, 133-153.
Dillen SY, Marron N, Koch B, Ceulemans R (2008). Genetic Variation of Stomatal Traits
and Carbon Isotope Discrimination in Two Hybrid Poplar Families (Populus deltoides
'S9-2' x P. nigra 'Ghoy' and P. deltoides 'S9-2' x P. trichocarpa 'V24'). Annals of
Botany 102, 399-407.
Dreyer E, Bogeat-Triboulot MB, Le Thiec D, Guehl JM, Brignolas F, Villar M, Bastien C,
Martin F, Kohler A (2004). Tolérance des peupliers à la sécheresse: peut-on espérer
l'améliorer? Biofutur 247, 54-58.
Du Z, Zhou K, Ling Y, Zhang Z, Su Z (2010). agriGO: a GO analysis tookit for the
agricultural community. Nucleic Acids Research 38, W64-W70.
33
770
771
772
773
774
775
776
777
778
779
780
781
782
783
784
785
786
787
788
789
790
791
792
793
Farquhar GD, Ehleringer JR, Hubick KT (1989). Carbon Isotope Discrimination and
Photosynthesis. Annual Review of Plant Physiology and Plant Molecular Biology 40,
503-537.
Farquhar GD, Richard RA (1984). Isotopic Composition of Plant Carbon Correlates With
Water-Use Efficiency of Wheat Genotypes. Australian Journal of Plant Physiology
11, 539-552.
Ferrio JP, Florit A, Vega A, Serrano L, Voltas J (2003). Delta C-13 and tree-ring width
reflect different drought responses in Quercus ilex and Pinus halepensis. Oecologia
137, 512-518.
Gardner SDL, Taylor G, Bosac C (1995). Leaf Growth of Hybrid Poplar Following Exposure
to Elevated CO2. New Phytologist 131, 81-90.
Gaudet M, Jorge V, Paolucci I, Beritognolo I, Scarascia Mugnozza G, Sabatti M (2008).
Genetic linkage maps of Populus nigra L. including AFLPs, SSRs, SNPs, and sex
trait. Tree Genetics & Genomes 4, 25-36.
Gray JE (2007). Plant development: Three steps for stomata. Current Biology 17, R213-
R215.
Gray JE, Holroyd GH, van der Lee FM, Bahrami AR, Sijmons PC, Woodward FI, Schuch W,
Hetherington AM (2000). The HIC signalling pathway links CO2 perception to
stomatal development. Nature 408, 713-716.
Hamanishi E, Raj S, Wilkins O, Thomas BR, Mansfield SD, Plant AL, Campbell MM
(2010). Intraspecific variation in the Populus balsamifera drought transcriptome.
Plant, Cell & Environment 33(10), 1742-1755.
Hamanishi E., Thomas B.R., Campbell M. (2012). Drought induces alterations in the
stomatal development program in Populus. Journal of Experimental Botany 63, 4959-
4971.
34
794
795
796
797
798
799
800
801
802
803
804
805
806
807
808
809
810
811
812
813
814
815
816
817
818
Hamanishi E, Barchet GLH, Dauwe R, Mansfield SD, Campbell MM (2015). Poplar trees
reconfigure the transcriptome and metabolome in response to drought in a genotype-
and time-of-day-dependent manner. BMC Genomics 16: 329.
Hu H, Boisson-Dernier A, Israelsson-Nordstrom M, Bohmer M, Xue S, Ries A, Godoski J,
Kuhn J, Schroeder JI (2010). Carbonic anhydrases are upstream regulators of CO2-
controlled stomatal movements in guard cells. Nature Cell Biology 12, 87-93.
Huang X, Xiao X, Zhang S, Korpelainen H, Li C (2009). Leaf morphological and
physiological responses to drought and shade in two Populus cathayana populations.
Biologia Plantarum 53, 588-592.
IPCC, 2014: Climate Change 2014: Synthesis Report. Contribution of Working Groups I, II
and III to the Fifth Assessment Report of the Intergovernmental Panel on Climate
Change [Core Writing Team, R.K. Pachauri and L.A. Meyer (eds.)]. IPCC, Geneva,
Switzerland, 151 pp.
Jansson S, Douglas CJ (2007). Populus: A Model System for Plant Biology. Annual Review
of Plant Biology 58, 435-458.
Keitel C, Matzarakis A, Rennenberg H, Gessler A (2006). Carbon isotopic composition and
oxygen isotopic enrichment in phloem and total leaf organic matter of European
beech (Fagus sylvatica L.) along a climate gratient. Plant, Cell and Environment 29,
1492-1507.
Levi A, Ovnat L, Paterson AH, Saranga Y (2009). Photosynthesis of cotton near-isogenic
lines introgressed with QTLs for productivity and drought related traits. Plant Science
177, 88-96.
Li YG, Jiang GM, Liu MZ, Niu SL, Gao LM, Cao XC (2007). Photosynthetic response to
precipitation/rainfall in predominant tree (Ulmus pumila) seedlings in Hunshandak
Sandland, China. Photosynthetica 45, 133-138.
35
819
820
821
822
823
824
825
826
827
828
829
830
831
832
833
834
835
836
837
838
839
840
841
842
843

Lindner M, Maraschek M, Netherer S, Kremer A, Barbati A, Garcia-Gonzalo J, Seidl R,
Delzon S, Corona P, Kolström M, Lexer MJ, Marchetti M (2010). Climate Change
impacts, adaptive capacity, and vulnerability of European forest ecosystems. Forest
Ecology and Management, 259, 698-709.
Liu W, Saint DA (2002). A new quantitative method of real time reverse transcription
polymerase chain reaction assay based on simulation of polymerase chain reaction
kinetics. Analytical Biochemistry 302, 52-59.
MacAlister CA, Ohashi-Ito K, Bergmann DC (2007). Transcription factor control of
asymmetric cell divisions that establish the stomatal lineage. Nature 445, 537-540.
Marron N, Delay D, Petit JM, Dreyer E, Kahlem G, Delmotte FM, Brignolas F (2002).
Physiological traits of two Populus x euramericana clones, Luisa Avanzo and
Dorskamp, during a water stress and re-watering cycle. Tree Physiology 22, 849-858.
Marron N, Villar M, Dreyer E, Delay D, Boudouresque E, Petit JM, Delmotte FM, Guehl JM,
Brignolas F (2005). Diversity of leaf traits related to productivity in 31 Populus
deltoides x Populus nigra clones. Tree Physiology 25, 425-435.
Masle J, Gilmore SR, Farquhar GD (2005). The ERECTA gene regulates plant transpiration
efficiency in Arabidopsis Nature 436, 866-870.
McClintock JN, Edenberg HJ (2006). Effects of filtering by Present call on analysis of
microarray experiments. BMC Bioinformatics 7, 49.
Monclus R, Dreyer E, Delmotte FM, Villar M, Delay D, Boudouresque E, Petit JM, Marron
N, Brechet C, Brignolas F (2005). Productivity, leaf traits and carbon isotope
discrimination in 29 Populus deltoides x P-nigra clones. New Phytologist 167, 53-62.
Monclus R, Dreyer E, Villar M, Delmotte FM, Delay D, Petit JM, Barbaroux C, Thiec D,
Brechet C, Brignolas F (2006). Impact of drought on productivity and water use
36
844
845
846
847
848
849
850
851
852
853
854
855
856
857
858
859
860
861
862
863
864
865
866
867

efficiency in 29 genotypes of Populus deltoides x Populus nigra. New Phytologist 169,
765-777.
Monclus R, Leplé J-C, Bastien C, Bert P-F, Villar M, Marron N, Brignolas F, Jorge V (2012).
Integrating genome annotation and QTL position to identify candidate genes for
productivity, architecture and water-use efficiency in Populus spp. BMC Plant
Biology 12, 173
Munné-Bosch S, Alegre L (2004). Die and let live: leaf senescence contributes to plant
survival under drought stress. Functional Plant Biology 31, 203-216.
Nilson SE, Assmann SM (2007). The Control of Transpiration. Insights from Arabidopsis.
Plant Physiology 143, 19-27.
Otieno DO, Schmidt MWT, Kinyamario JI, Tenhunen J (2005). Responses of Acacia tortilis
and Acacia xanthophloea to seasonal changes in soil water availability in the savanna
region of Kenya. Journal of Arid Environments 62, 377-400.
Radin JW, Zhenmin L, Percy RG, Zeiger E (1994). Genetic variability for stomatal
conductance in Pima cotton and its relation to improvements of heat adaptation. PNAS
91, 7217-7221.
Rae AM, Robinson KM, Street NR, Taylor G (2004). Morphological and physiological traits
influencing biomass productivity in short-rotation coppice poplar. Canadian Journal
of Forest Research 34, 1488-1498.
Rae AM, Street NR, Robinson KM, Harris N, Taylor G (2009). Five QTL hotspots for yield
in short rotation coppice bioenergy poplar: The Poplar Biomass Loci. BMC Plant
Biology 9, 23
Regier N, Streb S, Cocozza C, Schaub M, Cherubini P, Zeeman SC, Frey B (2009). Drought
tolerance of two black poplar (Populus nigra L.) clones: contribution of carbohydrates
and oxidative stress defence. Plant, Cell and Environment 32, 1724-1736.
37
868
869
870
871
872
873
874
875
876
877
878
879
880
881
882
883
884
885
886
887
888
889
890
891
892
Rohde A, Storme V, Jorge V, Gaudet M, Vitacolonna N, Fabbrini F, Ruttink T, Zaina G,
Marron N, Dillen S, Steenackers M, Sabatti M, Morgante M, Boerjan W, Bastien C
(2011). Bud set in poplar - genetic dissection of a complex trait in natural and hybrid
populations. New Phytologist 189(1), 106-121.
Roussel M, Dreyer E, Montpied P, Le-Provost G, Guehl J-M, Brendel O (2009). The
diversity of 13C isotope discrimination in a Quercus robur full-sib family is
associated with differences in intrinsic water use efficiency, transpiration efficiency
and stomatal connductance. Journal of Experimental Botany 60(8), 2419-2431.
Schafleitner R, Gutierrez Rosales RO, Gaudin A, Alvarado Aliaga CA, Nomberto Martinez
G, Tincopa Marca LR, Avila Bolivar L, Mendiburu Delgado F, Simon R, Bonierbale
M (2007). Capturing candidate drought tolerance traits in two native Andean potato
clones by transcription profiling of field grown plants under water stress. Plant
Physiology and Biochemistry 45, 673-690.
Scrimgeour CM, Robinson D, Smith KA, Cresser MS (2004). Stable isotope analysis and
applications. Soil and environmental analysis modern instrumental techniques. New
York: Marcel Dekker, Inc, 381-431.
Shpak ED, McAbee JM, Pillitteri LJ, Torii KU (2007). Stomatal patterning and
differentiation by synergistic interactions of receptor kinases. Science 309, 290-293.
Smyth GK (2004). Linear models and empirical Bayes methods for assessing differential
expression in microarray experiments. Statistical Applications in Genetics and
Molecular Biology 3(1), 3.
Solberg S (2004). Summer drought: a driver for crown condition and mortality of Norway
spruce in Norway. Forest Pathology 34, 93-104.
Sparks JP, Black RA (1999). Regulation of water loss in populations of Populus trichocarpa:
the role of stomatal control in preventing xylem cavitation. Tree physiology 19, 453-
38
893
894
895
896
897
898
899
900
901
902
903
904
905
906
907
908
909
910
911
912
913
914
915
916
917

459.
Street NR, Skogstrom O, Sjodin A, Tucker J, Rodriguez-Acosta M, Nilsson P, Jansson S,
Taylor G (2006). The genetics and genomics of the drought response in Populus.
Plant J. 48, 321-341.
Tardieu F, Tuberosa R (2010). Dissection and modelling of abiotic stress tolerance in plants.
Current opinion in plant biology 13, 206-212.
Taylor G (2002). Populus: Arabidopsis for Forestry. Do We Need a Model Tree? Annals of
Botany 90, 681-689.
Thimm O, Bläsing O, Nagel A, Meyer S, Kruger P, Selbig J, Muller LA (2004). MAPMAN:
a user-driven tool to display genomics data sets onto diagrams of metabolic pathways
and other biological processes. Plant Journal 37, 914-939.
Torii KU (2015) Stomatal differentiation: the beginning fo the end. Current Opinion in Plant
Biology 28, 16-22.
Tschaplinski TJ, Tuskan GA, Sewell MM, Gebre GM, Donald ETI, Pendleyi C (2006).
Phenotypic variation and quantitative trait locus identification for osmotic potential in
an interspecific hybrid inbred F-2 poplar pedigree grown in contrasting environments.
Tree Physiology 26, 595-604.
Tuskan GA, DiFazio S, Jansson S, Bohlmann J, Grigoriev I, Hellsten U, Putnam N, Ralph S,
et al. (2006). The Genome of Black Cottonwood, Populus trichocarpa (Torr. &
Gray). Science 313, 1596-1604.
Tuskan GA, DiFazio S, Teichmann T (2004). Poplar Genomics is Getting Popular: The
Impact of the Poplar Genome Project on Tree Research. Plant Biology 6, 2-4.
Valladares F, Martinez-Ferri E, Balaguer L, Perez-Corona E, Manrique E (2000). Low leaf-
level response to light and nutrients in Mediterranean evergreen oaks: a conservative
resource use strategy? New Phytologist 148, 79-91.
39
918
919
920
921
922
923
924
925
926
927
928
929
930
931
932
933
934
935
936
937
938
939
940
941
942

Vanden Broeck A (2003). EUFORGEN Technical Guidelines for genetic conservation and
use for black poplar (Populus nigra).In. Rome: International Plant Genetic Resources
Institute.
Viger M, Rodriguez-Acosta M, Rae AM, Morison JIL, Taylor G (2013). Towards improved
drought tolerance in bioenergy crops: QTL for carbon isotope composition and
stomatal conductance in Populus. Food and Energy Security 2, 220-236.
Voltas J, Serrano L, Hernandez M, Peman J (2006). Carbon Isotope Discrimination, Gas
Exchange and Stem Growth of Four Euramerican Hybrid Poplars under Different
Watering Regimes. New Forests 31, 435-451.
Walia H, Wilson C, Condamine P, Liu XG, Ismail AM, Zeng L, Wanamaker SI, Mandal J,
Xu J, Ciu X, Close TJ (2005). Comparative transcriptional profiling of two
contrasting rice genotypes under salinity stress during the vegetative growth stage.
Plant Physiology 139, 822-835.
Walia H, Wilson C, Zeng L, Ismail AM, Condamine P, Close TJ (2007). Genome-wide
transcriptional analysis of salinity stressed japonica and indica rice genotypes during
panicle initiation stage. Plant Molecular Biology 63, 609-623.
Wilkins O, Waldron L, Nahal H, Provart NJ, Campbell MM (2009). Genotype and time of
say shape the Populus drought response. The Plant Journal 60, 703-715.
Woodward FI, Lake JA, Quick WP (2002). Stomatal development and CO2: Ecological
consequences. New Phytologist 153, 477-484.
40
943
944
945
946
947
948
949
950
951
952
953
954
955
956
957
958
959
960
961
962
963
964

Tables
Table 1: Summary of statistical results presenting the F-value and p-value for each trait using a GLM test for the main effects genotype and
treatment and the interaction genotype x treatment. Bold values are significant (p<0.05)
Genotype Water treatment Genotype x Water treatment
Trait F p-value F p-value F p-value
gs 5DAD 5.078 <0.001 15.860 <0.001 1.344 0.252
gs 15DAD 1.469 0.207 103.092 <0.001 1.912 0.100
Δ13C 5.893 <0.001 7.511 0.008 2.567 0.037
Height growth 6.579 <0.001 37.086 <0.001 0.726 0.606
Stem diameter growth 2.116 0.071 14.77 <0.001 1.989 0.088
Branches formation 0.697 0.627 0.948 0.333 0.639 0.670
New leaf development 16.216 <0.001 24.964 <0.001 0.523 0.758
Leaf senescence 2.502 0.036 5.182 0.025 0.839 0.526
SLA 10.538 <0.001 2.977 0.088 0.923 0.470
41
965
966
967
968
969
970
Table 2: Candidate genes involved in leaf development differentially expressed under drought in the Italian (Ita) and Spanish (Sp2) genotypes.
Details include the name of the gene and probe set ID, the poplar (v3.0) and Arabidopsis gene models, the log2 expression ratio for each
genotype (in bold if p<0.05) and a brief description of its function.
Name Probe Set ID
Poplar gene model (v3.0)
Arabidopsis gene model
Ita Log2(FC)
Sp2 Log2(FC) Description
AS1 PtpAffx.163978.1.S1_at Potri.004G102600 AT2G37630.1 -2.70 -1.87 Involved in specification of the leaf proximodistal axis
AS1 PtpAffx.2947.1.S1_atPotri.017G112300 AT2G37630.1
-2.92 -0.24 Involved in specification of the leaf proximodistal axisAS1 PtpAffx.2947.2.A1_at -1.66 -0.31
AS1 Ptp.4356.1.S1_at Potri.006G085900 AT2G37630.1 -4.93 -0.92 Involved in specification of the leaf proximodistal axis
AS2 PtpAffx.207814.1.S1_at Potri.008G079800 AT1G65620.1 -2.91 -2.20 Required for formation of a symmetric flat leaf lamina
AS2 PtpAffx.209221.1.S1_atPotri.010G177100 AT1G65620.1
-1.82 -1.23 Required for formation of a symmetric flat leaf laminaAS2 PtpAffx.44821.1.A1_s_at -2.07 -1.04
CLV1 PtpAffx.201597.1.S1_at Potri.002G019900 AT1G75820.1 -2.06 -0.52 Controls shoot and floral meristem sizePHB Ptp.548.1.S1_at
Potri.001G372300 AT2G34710.1-3.29 -0.46
Controls adaxial –abaxial patterningPHB Ptp.548.1.S1_x_at -3.14 -0.37PHB PtpAffx.38907.1.S1_at Potri.011G098300 AT2G34710.1 -2.21 -0.79 Controls adaxial –abaxial patterningANT PtpAffx.1799.1.A1_at
Potri.014G008100 AT4G37750.1-4.26 -1.19
Required for control of cell proliferationANT PtpAffx.211416.1.S1_at -3.23 -0.77ANT PtpAffx.147010.1.A1_at Potri.002G114800 AT4G37750.1 -1.41 -0.80 Required for control of cell proliferationANT PtpAffx.34524.3.A1_a_at Potri.005G148400 AT4G37750.1 -4.35 -2.21 Required for control of cell proliferation
42
971
972
973
974
975
Table 3: Description of the significant bins from the microarrays transcripts list in response to drought for the Spanish and the Italian genotypes.
The probability (p-value) was calculated using a Wilcoxon Sum of Rank test with a Benjamini Hochberg correction in MapMan (Thimm et al.,
2004). Examples of significant transcripts are given for several significant bins with the probe set ID, Poplar gene model, a brief description and
log2. Complete list is in Table S7.
Genotype Bin code Bin name Probe Set ID Poplar gene
modelArabidopsis gene model Brief description log2
(FC)
Ita 28DNA (128 probes, p=7.87E-15)
28.1 DNA synthesis /chromatin structure ptpaffx.200289.1.s1_at Potri.001G074000 AT5G44635.1 Minichromosome maintenance
(MCM2/3/5) family protein -4.97
28.1.3 DNA synthesis /chromatin structure histone ptp.4194.1.s1_x_at Potri.017G123700 AT3G45980.1 Histone superfamily protein -1.62
28.2 DNA repair ptp.1405.1.s1_at Potri.014G128500 AT2G47590.1 Photolyase/blue-light receptor 2 -1.48
Ita 31 Cell (213 probes, p=9.91E-18)
31.2 Cell division ptpaffx.204723.1.s1_at Potri.009G089200 AT3G19590.1Transducin/WD40 repeat-like superfamily protein -4.20
31.3 Cell cycle ptpaffx.200879.1.s1_at Potri.001G272000 AT2G26760.1 Cyclin B1;4 -4.69
31.4 Cell vesicle transport ptpaffx.2864.2.s1_at Potri.003G177700 AT1G04760.1Vesicle-associated membrane protein 726 1.80
Ita 20 Stress (148 probes, p=0.004)
20.1 Stress biotic ptp.6055.1.s1_at Potri.007G043500 AT4G37000.1 Accelerated cell death 2 (ACD2) 1.65
20.2.1 Stress abiotic heat ptpaffx.210289.1.s1_at Potri.012G017600 AT5G42020.1Heat shock protein 70 (Hsp 70) family protein 1.38
20.2.3 Stress abiotic drought/salt ptpaffx.208807.1.s1_x_atPotri.010G094100 AT1G26850.1
S-adenosyl-L-methionine-dependent methyltransferases superfamily protein -1.83
Genotype Bin Bin name Probe Set ID Poplar gene Arabidopsis Brief description log2
43
976
977
978
979
980

code model gene model (FC)
Ita 27 RNA (559 probes, p=0.04)
27.3.3
RNA regulation of transcription AP2/EREBP, APETALA2/Ethylene-responsive element binding protein family
ptpaffx.211416.1.s1_at
Potri.014G008100 AT4G37750.1
ANT, Integrase-type DNA-binding superfamily protein
-3.23
27.3.6 RNA regulation of transcription bHLH ptpaffx.210224.1.s1_at
Potri.012G031800 AT5G53210.1SPCH, basic helix-loop-helix (bHLH) DNA-binding superfamily protein -2.70
27.3.22RNA regulation of transcription HB transcription factor family
ptpaffx.38907.1.s1_atPotri.011G098300 AT2G34710.1
PHB, Homeobox-leucine zipper family protein/lipid-binding START domain-containing protein -2.21
27.3.25RNA regulation of transcription MYB domain transcription factor family
ptpaffx.212699.1.s1_atPotri.015G041100 AT1G22640.1
myb domain protein 3-1.61
27.3.32
RNA regulation of transcription WRKY domain transcription factor family
ptpaffx.203170.1.s1_at
Potri.003G111900 AT2G30590.1
WRKY DNA-binding protein 21
2.06
27.3.50RNA regulation of transcription General Transcription
ptpaffx.200328.1.s1_s_atPotri.001G082700 AT4G24150.1
Growth-regulating factor 8-2.42
Sp2 31 Cell (57 probes, p=3.34E-7)
31.1 Cell organisation ptpaffx.148282.1.s1_s_at Potri.002G111900 AT1G50010.1 Tubulin alpha-2 chain -1.5231.2 Cell division ptpaffx.212842.1.s1_at Potri.015G090600 AT3G25100.1 Cell division cycle 45 -1.4131.3 Cell cycle ptpaffx.63679.1.a1_s_at Potri.005G181400 AT1G44110.1 Cyclin A1;1 -2.56
44
981

Figure legends
Figure 1: Association population information and measurements from the common garden
experiment in Belgium: mean annual rainfall and temperature per river population (a), map of
the 11 river populations of Populus nigra collected in five European countries (b), leaf size
and shape variation between populations (c), Leaf area in mm2 (d), stomatal index in % (e),
stem circumference in cm (f) and wood carbon isotope discrimination in ‰ (g). Same letter
indicates no significant difference at 5% level, Student-Newman-Keuls post-hoc testing. Each
value with bars represents the average ± standard error.
Figure 2: Correlations of biomass traits of interest: leaf area and height in 2005 (a), leaf area
and cell area in 2006 (b) and leaf area and cell number per leaf in 2006 (c). Leaf traits are
based on the youngest fully mature leaf from each tree. Spearman’s rho (rs) and the
probability that it differs from zero (p) is provided for each correlation.
Figure 3: Soil moisture content (%) over time (days after drought) for each genotype (a).
Black symbols represents well-watered (control) and open symbols are for drought
treatments. Each value with bars represents the average ± standard error. Photographic
representation of the morphological effects of drought on the trees grown in the greenhouse
(b).
Figure 4: Percentage difference of biomass using the formula [(drought - control)/(control x
100)] from Street et al. (2006): Height growth in mm (a), stem diameter growth in mm (b),
new leaf formation (c), leaf senescence (d), branch formation (e), Specific Leaf Area in
cm2.g-1 (f), stomatal conductance in μmol m-2 s-1 after 5 (g) and 15 (h) days of drought and
carbon isotope discrimination in ‰ (i).
45
982
983
984
985
986
987
988
989
990
991
992
993
994
995
996
997
998
999
1000
1001
1002
1003
1004
1005
1006

Figure 5: Leaf area development over time (days after drought) for the first emerging
leaf (■), the second leaf emerging (●) and the third leaf emerging (▼) under well-watered
conditions (full lines and white symbols) and drought stress (broken lines and black
symbols) for each genotypes: Sp1 (a), Sp2 (b), Fr1 (c), Fr2 (d), Ita (e), NL (f). Percentage
difference in leaf area corresponds for the 1st emerging leaf after 18 DAD following the
formula [(drought - control)/(control x 100)] from Street et al. (2006).
Figure 6: Venn diagram representing the Affymetrix ID probe sets which were two-fold up
(a) and down (b) regulated in response to moderate drought – differentially expressed
between the Spanish Sp2 (white) and the Italian Ita (grey) genotypes. Numbers in the circle
overlap indicate the number of transcripts common to both genotypes and numbers outside
the overlap indicate the number of transcripts exclusive to the genotype indicated. Circles (c)
indicate the number of transcripts up-regulated and down-regulated in Sp2 compared to Ita in
well-watered conditions.
Figure 7: Gene expression changes for Sp2 and Ita in response to water deficit for stomatal
patterning candidate genes: ERECTA, ERL1, ERL2, ERL3, TMM, SPCH and MUTE. Values
are in log2.
Figure 8: Z-score values of the main groups for Sp2 and Ita genotypes transcripts in response
to drought using the PAGE analysis from AgriGO (Du et al., 2010). Full analysis is in Table
S9.
Figure 9: Summary of the response to drought in two genotypes of Populus nigra.
46
1007
1008
1009
1010
1011
1012
1013
1014
1015
1016
1017
1018
1019
1020
1021
1022
1023
1024
1025
1026
1027
1028
1029
1030
1031
Supplementary documents:
Table S1: Details of the populations of Populus nigra, their location and climates.
Temperature and precipitation data were collected from the website
http://www.worldclim.org/. Range of temperatures and precipitations are given for the
population collected at different locations (e.g. along a river system).
Table S2: Provenance of the six P. nigra genotypes used in the drought experiment.
Table S3: Forward and Reverse primers for each candidate gene (5’ to 3’).
Table S4: Climatic data from the region of origin and phenotypic correlation among traits
measured in a common garden study of P. nigra from natural populations across western
Europe. Correlation coefficients were estimated as Spearman’s rho, with p-values corrected
for multiple comparisons using the sequential Bonferroni (asterisks).
Table S5: Summary of the measurements for each genotype under well-watered (control) and
drought treatments. Average ± standard error.
Table S6: Normalised microarray expression matrix using the complete list of transcripts.
Table S7: Complete Mapman analysis. Description of the significant bins from the
microarray transcripts list in response to drought for the Spanish and the Italian genotypes.
The probability (p-value) was calculated using a Wilcoxon Sum of Rank test with a
Benjamini Hochberg correction in MapMan (Thimm et al., 2004). Complete list of
47
1032
1033
1034
1035
1036
1037
1038
1039
1040
1041
1042
1043
1044
1045
1046
1047
1048
1049
1050
1051
1052
1053
1054
1055
1056

significant transcripts are given for each significant bin with the probe set ID, Poplar gene
model, a brief description, and log2 expression ratio.
Table S8: Complete AgriGO analysis with all the significant GO groups per genotype, the
description of the GO term, the number of transcripts, the Z-score and the False Discovery
Rate (FDR).
Figure S1: Volumetric soil moisture at final day of harvest (a) and rate of soil drying ((final
soil moisture – initial soil moisture)) x 100 (b).
Figure S2: Volumetric soil moisture at DAD5 when stomatal conductance measurements
were taken.
Figure S3: Expression ratio (log2) from real-time qPCR in response to drought per genotype
for the candidate genes: SPEECHLESS (a), IP3 (b), ATHVA22A (c) and ERECTA (d). Same
letter indicate no significant difference at 5% level, Student-Newman Keuls post-hoc testing.
Each value with bars represents the average ± standard error.
48
1057
1058
1059
1060
1061
1062
1063
1064
1065
1066
1067
1068
1069
1070
1071
1072
1073
1074
Top Related