


Languages
Pages
Legal


d0
AD-A281 411
OFFICE OF NAVAL RESEARCH
,... .GRANT: N00014-90-J-1230
• -3 ,, 94 'U.. R&T CODE 4133015
"ROBERT J. NOWAK
Technical Report No. 59
Cyclic Voltammetric Analysis of Ferrocene Alkanethiol Monolayer ElectrodeKinetics Based on Marcus Theory
by
L. Tender, M. T. Carter, and R. W. Murray
94-21685 Prepared for Publication
iDTIC QUALIy INSPECTED a
Analytical Chemistry
University of North Carolina at Chapel HillDepartment of Chemistry
Chapel Hill, NC
July 1, 1994
Reproduction in whole or in part is permitted for any purpose of theUnited States Government
This document has been approved for public release and sale; its distribution is unlimited.
94 7 12 374

REPORT DOCUMENTATION PAGE Form Approved
Pulic• regotin bude for th• €Ohlectuoc Of inform•altiOn is estimated to averaqe 1 sour iser res~l'..e tInc~uoain the time 'otr 0~w M B Nrsrut ot . 074 -0h788lsic dtl r•
P! ' ýes 41"n' ', he imeorrevilewing instrumtons. searching existing data sources.gatherng a. d mautalnui the data needed. and comleting and ressewung the c0l1ection of rnformation. 4ond comments regarding this burden estimate or any other aspect of thisS* •colcthon of information. inluding sdg7 tion fo- r'jducin this burden. to Washington Headquarters Sersices. Oirectorate tor information Operationsand SReorts. 1215 effersonloomu Highway. Suite 1204. ArhngtOn. VA 222024302. a to Vhe Office of Management and Budget. Paperwork Reduction Project (0704-0188). Wangton. DC 20503.
1. AGENCY USE ONLY (Leave blank) 2. REPORT DATE 13. REPORT TYPE AND DATES COVERED
11,1IN 1 IA I Interim May 93 - Jun 944. TITLE AND SUBTITLE 5. FUNDING NUMBERSCyclic Voltammetric Analysis of Ferrocene Alkanethiol MonolayerElectrode Kinectics Based on Marcus Theory& AUTHOR(S) N00014-90-J-1230
L. Tender, M. T. Carter, and R. W. Murray
7. PERFORMING ORGANIZATION NAME(S) AND ADDRESS(ES) 8. PERFORMING ORGANIZATIONREPORT NUMBER
The University of North Carolina at Chapel Hill Tech. Report 59Department of ChemistryChapel Hill, N.C. 27599-32909. SPONSORING/MONITORING AGENCY NAME(S) AND ADDRESS(ES) 10. SPONSORING I MONITORING
AGENCY REPORT NUMBER
Office of Naval ResearchDepartment of the NavyArlington, VA 22217
11. SUPPLEMENTARY NOTES
a23. CIS7RIB.JTION A'ij. LA3ILA 57A',I'r !2!:. 0"7- ,:CN CC,- E
Approved for Public Release, Distribution Unlimited _
13. ABSTRACT (Maximum 2CO words)
Theory for electrode kinetics of surface-immobilized monolayers in cyclic voltammetry is developedbased on the Marcus free energy-rate relation. Numerical calculations show that when the appliedover-potential exceeds ca. 30% of the reorganizational energy of the electrode reaction, voltammetrypredicted from Marcus theory differs from that based on classical Butler-Volmer kinetics with regardto waveshape, peak currents and their dependence on potential sweep rate, and variation of peakpotential with potential sweep rate. Estimates of the standard rate constant, k-, can be made fromEm data without exact knowledge of reorganizational energies. Examples are given of evaluating klfor monolayers of ferrocene alkanethiols chemisorbed on Au(1 11) electrodes, when the monolayersare highly ordered, and kinetically monodisperse, and when they are somewhat disordered, andkinetically disperse on bulk gold electrodes at room and 150K temperatures.
14. SUBJECT TERMS 15. NUMBER OF PAGES
Electrode kinetics, monolayers, cyclic voltammetry, Marcus equation 16. PRICE CODE
17. SECURITY CLASSIFICATION 18. SECURITY CLASSIFICATION 19. SECURITY CLASSIFICATION 20. LIMITATION OF ABSTRACTOF REPORT | OF THIS PAGEI OF ABSTRACT
UnClassified jnClassified UnClassified Unlimited
NSN 7540-01-280-5500 Stanoaro Form '98 •Rev 2-89)•Pr!C?,O5O OV ANSI oito 139-*S2j9. 02

bQ
a1
June 20, 1994
CYCLIC VOLTAMMETRIC ANALYSIS OF FERROCENE ALKANETHIOL
MONOLAYER ELECTRODE KINETICS BASED ON MARCUS THEORY
Leonard Tendera, Michael T. Carter, and Royce W. Murray*
Kenan Laboratories of Chemistry
University of North Carolina, Chapel Hill, NC 27599-3290
ABSTRACT
Theory for electrode kinetics of surface-immobilized monolayers in cyclic
voltamnmetry is developed based on the Marcus free energy-rate relation. Numerical
calculations show that when the applied over-potential exceeds 0a. 30% of the
reorganizational energy of the electrode reaction, voltammetry predicted from Marcus theory
differs from that based on classical Butler-Volmer kinetics with regard to waveshape, peak
currents and their dependence on potential sweep rate, and variation of peak potential with
potential sweep rate. Estimates of the standard rate constant, k1, can be made from EpEAK
data without exact knowledge of reorganizational energies. Examples are given of evaluating
ko for monolayers of ferrocene alkanethiols chemisorbed on Au(1 11) electrodes, when the
monolayers are highly ordered, and kinetically monodisperse, and when they are somewhat
disordered, and kinetically disperse on bulk gold electrodes at room and 150K temperatures.
"Present address: Department of Chemistry, University of California, Berkeley, CA 94707
hAeesslon Fo7
I TIS GRA&IDTI TAB [3Unanomwced 1]Justgi.cation
ByDist.ribut t an/
ýDist ,:J..'O'ft'1

2
CYCLIC VOLTAMMETRIC ANALYSIS OF FERROCENE ALKANETHIOL
MONOLAYER ELECTRODE KINETICS BASED ON MARCUS THEORY
Theory enabling measurement of heterogeneous electron transfer rates from cyclic
voltammetric oxidation-reduction peak potential separations, AEpEAK was presented some
time ago by Nicholson and Shainm for diffusing and by Laviron2 for diffusionless (i.e.,
surface bound) electrochemical systems. This methodology is appealing by its ease of
application; standard electron transfer rate constants (kO) result from analysis of the
dependence of AEpEAK values on potential sweep rate using numerically generated working
curvesi or explicit expressions2. These theoretical formulations are based on the Butler-
Volmer3 free energy-rate relation, which in the context of modem electron transfer theory
due to Marcus4 , asiunes that the applied potential (free energy, over-potential, qf=iE - E°')
is much smaller than the electrode reaction's reorganizational energy barrier (X).
This paper will describe the theoretical and experimental behavior of cyclic
voltammetry of non-diffusing (immobilized) electrode reactants when -q is not negligible in
comparison to X, i.e., in or approaching what is commonly referred to as the Marcus
inverted region4,5. This contribution is made in the context of recent potential step
experiments6,7 with electroactive, self-assembled monolayers in which the ratio ,j/X is not
small. Co-chemisorption of a mixture of the alkanethiols CH3(CH 2)15SH and
CpFeCpCO2(CH2)16SH (Cp = cyclopentadienyl) on Au(l 11) produces a dilute layer of
ferrocene sites that are separated, sometimes quite uniformly, from the Au surface by the
alkane chains. This tunnelling barrier depresses the ordinarily fast CpFeCp°/+ electron
transfer rates to values sufficiently slow as to be readily measurable6 even when large over-
3
potentials (17) are applied in potential step experiments. Since the Butler-Volmer relation3 is
inappropriate when q/X is not small, the Marcus4,5 equation, integrated over the continuum
of electronic energies of the electrode8 , was employed for analysis of the observed 6 over-
potential-rate results.
While the potential step experiment and its analysis for electron transfer rate constants
of self-assembled monolayers are straightforward, cyclic voltammetric experiments are also
straightforward and can be less tedious to carry out. Rate analysis of potential sweep data
requires a solution of the combined potential sweep voltammetry-Marcus theory problem,
which is the thrust of this paper. Our numerical (finite difference) calculations reveal that
voltammetry under conditions of comparable over-potential and reorganizational energy has
characteristics differing substantially from the familiar voltammetry of Butlei-Volmer
electrode kinetics2 . The calculations are presented as working curves convenient for
measurement of standard electron transfer rate constants k0 using ,EpEAK values. Good
estimates of e° can be obtained from AEpEA data without assumptions about values of
reorganization energy (X). The peak currents and shape of the voltammetric wave are very
sensitive to X, but reorganizational energy X is reliably obtained from peak currents and
shape only when the electroactive layer is kinetically monodisperse. The theoretical results
are illustrated by application to three cases of experimental voltammetry of ferrocene
alkanethiol monolayers.
EXPERIMENTAL
Chemicals. CpFeCpCO2(CH2)l6SH and CpFeCpCO2(CH2)18SH were prepared by literature
methods. 9 Alkanethiols (hexadecyl and octadecyl, Aldrich, > 97%), absolute ethanol
4
(AAPER Alcohol and Chemical Co.) and perchloric acid (Fisher, 11.1 N aq.) were used as
received. Water was purified with a Barnstead Nanopure system.
Electrode Fabrication. The evaporated gold working electrode used for the data in Figures 6
and 7 consisted of 2000 A of gold and a 150 A titanium underlayer evaporated at room
temperature at ca. lx10x7 torr onto a silicon (100) substrate. An open bottom glass
electrochemical cell was employed in which the working electrode served as the cell bottom
and the electrode area (0.7 cm2) was defined by a sealing rubber "o"-ring positioned between
the electrode and the glass cell. Ag/(aq. 1M AgClO 4) reference electrode and Pt wire
counter electrodes were employed in IM HC1O 4 electrolytic solution.
The bulk gold electrodes used in Figures 8 and 9 (1 mm radius) and Figures 10 and
11 (0.25 mm radius) were fabricated by attaching a Teflon shrouded copper wire with silver
solder (Kester) to ca. 1 cm long gold wires (Aldrich, 99.99 %). The two wires were
encapsulated together in a cylinder of insulating epoxy (Shell Epon 828, m-phenylenediamine
curing agent, cured overnight at 700 C), and sanded (Buehler 600 grit) to expose gold areas
of 0.0314 and 0.0019 cm2 , respectively. For aqueous experiments, SCE reference and Pt
flag counter electrodes were employed in a three compartment glass cell with the larger gold
working electrode. The electrolyte was 1 M HClO4 . For low temperature experiments (see
below), the smaller gold disk was used as the working electrode and the large gold disk was
employed as a quasi-reference electrode.
Chemisorbed Ferrocene Monolayer Preparation. The evaporated gold electrode used in
Figures 6 and 7 was after fabrication immediately immersed into 1 mM
CpFeCpCO2(CH2)1 sSH and 1 mM CH3(CH2)17 SH in ethanol to soak undisturbed at room
5
temperature for 3 days, followed by a rinse with ethanol and a further 10 days soak in 1 mM
CH 3(CH 2)17SH in ethanol to exchange loosely bound ferrocene sites out of the film.
The 0.0314 cm2 bulk gold electrode used in Figures 8 and 9 was polished with
aqueous slurries of successively finer alumina powder (down to 0.05 Am, Buehler), sonicated
for 5 min. in water, and rinsed with water followed by ethanol. Finally, to ensure removal
of alumina from the gold surface, the electrode was polished with 0.25 Am diamond paste
(Buehler), rinsed extensively with water and sonicated in ethanol. The electrode was etched
in dilute a= g ia (3:1:6 HCl:HNQ3:H20) for 5 min,10 rinsed with water, and ethanol and
then immersed in an ethanol solution of 0.5 mM CpFeCpCO2(CH2)16SH and 0.5 mM
CH3(CH2)1 SSH for 3 days. After rinsing with ethanol the electrode was soaked for an
additional 7 days in 1 mM CH3(CH2)15SH in ethanol. For low temperature work, the
electrode, polished and etched as above, was soaked for 6 days at room temperature in an
ethanolic solution containing 0.25 mM CpFeCpCO2(CH2)16SH and 0.75 mM
CH 3(CH 2)15SH, then rinsed with ethanol and used without annealing in alkanethiol solution.
The large Au disk, serving as quasi-reference, was abraded with fine grit sandpaper to
remove surface thiol.
Low Temperature Voltammetry. Experiments at low temperature (150K) were performed
in an electrolyte solution composed of 2:1 (v:v at RT) chloroethane (EtCl) and butyronitrile
(PrCN) and 0.075 M Bu4NPF6 electrolyte. A Janis/Leybold closed cycle helium cryostat was
employed in which the electrochemical cell is mounted directly on the cold head of the
cryostat. The electrode configuration has been reported previously11 . Electrochemical
equipment was locally constructed and of conventional design.

6
RESULTS AND DISCUSSION
Electron Transfer Kinetic Theory. For a simple, reversible electron transfer reaction
between a metal electrode and an attached redox species
Ox + e- - Red (1)kox.n
the dependency of kRed,,) and kox,., (the forward and reverse it-dependent half reaction rate
constants) on 71 as expressed by the Butler-Volmer relations is
k,,.4 = k exp(- T--*% (2)
k,, = k° exp( (3)UB
where ,i - E - E°', kB is the Boltzmann constant, T the temperature, k0 the standard rate
constant, and the transfer coefficient 3, a, is assumed to equal to 0.5. The analogous Marcus
relations4,5
k, = k' exp(- T1 T__ (4)2kjT 4kT
=o~ ka eXP(-fl-- - (5)2k8T 41kT
reduce to the Butler-Volmer equations when -I/X 4 1. The Marcus relations4,5 predict that,
as tj approaches X, the rate constants do not continue to increase exponentially with iq (as
they always do in the Butler-Volmer formulation) but maximize at qj = X X and actually

7
decrease at larger t (classical Marcus "inverted" region). When electron transfers occur at a
metal interface, however, it is necessary to account for the energy distribution of electrons
about the Fermi level in the metal which, following Chidsey 6, leads to
exp{-(x- +)) 2 BT
kk4 Tf'. kBT 4X (6)PBJ1 +exp(x)
exp{- (x- '- )2kBT} ')k," =lpk~-kBT 4 & 7
LP-B_. 1 +exp(x)
where X is electron energy relative to the Fermi level, /t is the distance dependent electronic
coupling between electrode and redox sites and P is the density of electronic states in the
metal electrode. us is anticipated to depend exponentially on distance, d, according to7 ,
p = Io exp(-ld) (8)
where to is coupling at zero edge-to-edge reactant separation and the decay constant#
depends on the details of the structure through which tunnelling occurs. The decay constant
has been reported by Chidsey as ca. 1.07 per CH2 group for ferrocene alkane thiol
monolayers on gold electrodes. 12
ke is given by Equation (6) or (7) for t) - 0. Assuming values of two of the three
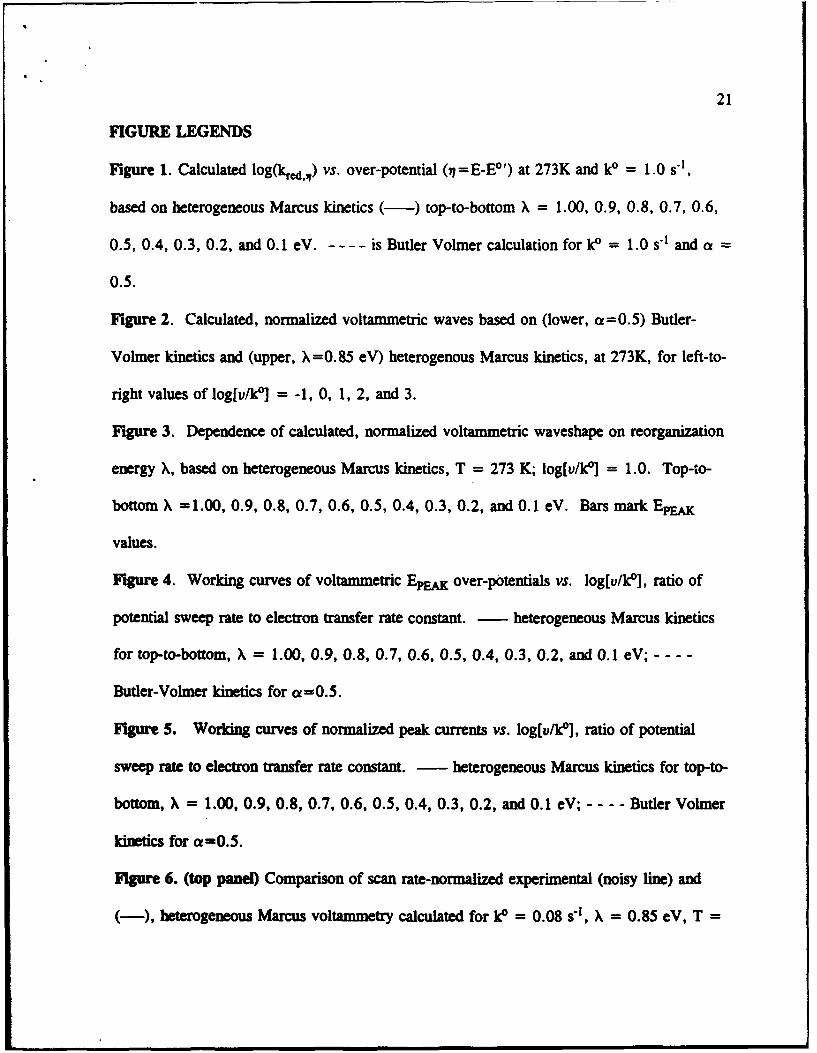
parameters ki, X, or 1&p fixes the value of the third. Figure 1 gives examples of reduction
reaction rate constants calculated at different over-potentials from Equation (6) at 273K for a
fixed value of k° (I s-1) and a series of values of X (and a corresponding series of JLO values).
At small values of E - E°', these curves are the same as the exponentially increasing reaction

8
rates predicted by the Butler-Volmer Equation (4) for the same k"° value, but at larger over-
potentials and at smaller values of X, Equation (6) predicts reaction rates that increase less
than exponentially with E - E°'. At sufficiently large 1, and/or small X, the heterogeneous
electron transfer rate constants fold over to become, at 17 > X, essentially independent of
over-potential. The heterogeneous electron transfer rates however do not decrease at 7 > X,
as predicted in homogeneous solutions in the classical Marcus "inverted" region, because of
the continuum of electronic states in the metal electrode6 '8. We will refer to Equations (6)
and (7) as the heterogeneous Marcus equations, and to the range of over-potentials
sufficiently large that rate constants lie substantially below those predicted by Butler-Volmer
kinetics, eventually becoming independent of over-potential, as the Marcus-Density of States
rate limited region (Marcus-DOS).
The limiting rate constants (at large 71) in Figure 1 are determined by the value of Ap,
which in the series of calculations shown at constant k° and decreasing X, decreased in
accord with X.
Linear Sweep Voltammetry Calculations. Statements pertinent to calculating linear sweep
voltammograms in which the reaction rate is controlled by either the Butler-Volmer
Equationzs (4) and (5) or the heterogeneous Marcus Equations (6) and (7) are as follows: The
current for first order reaction of a diffusionless electroactive species is
i, = nFA (k., r. - kR,,~ rO (9)
where the reaction rate constants are given by Equations (4,5) or (6,7), and F is the Faraday,
A the electrode area, and rox,1 and rR, the instantaneous surface coverages of the
oxidized and reduced redox species, respectively. The applied potential, relative to E"', is tj

9
17* + ut where ,i* is the initial potential, v is potential sweep rate (V/s) and t is time.
Overall chemical stability of Ox and Red is expressed in a mass balance equation
r;, + rd = ro,, + r,,,, = r (10)
where r is total surface coverage and the initial surface coverages r ox and r*Rd are given
by application of the Nernst equation.
Numerical solutions for linear sweep voltammetric currents were performed using a
personal computer and a locally written program. To calculate voltammograms, , was
changed in increments of dq (< 1 mV, sufficiently small that calculated currents were
independent of the chosen dci), allowing reaction to proceed during time intervals of dt=
d•i/v at rates according to Equations (4,5) or (6,7). The instantaneous values of rox,,7 and
rRed,, at each over-potential were calculated from their initial values and the oxidative or
reductive charges passed since initiation of the potential sweep.
Behavior of "Marcus-DOS" Linear Sweep Voltammetry. Linear sweep voltammograms in
which q approaches X differ substantially from classical Butler-Volmer kinetics2 . Figure 2
(lower) shows room temperature Butler-Volmer voltammograms calculated for several values
of log[v/kD] as the applied q is swept from 0.2 V to -1.0 V. (Increasing v is completely
equivalent to decreasing k° in these calculations. Note that currents are normalized for
surface coverage (1I), electrode area, and sweep rate). At v/k" = 10-1, the voltammogram
has an almost reversible shape. At larger values, v/k' = 1, the peak currents become
smaller and the wave broader, but at even larger ratios, no further change occurs. Larger
sweep rates and smaller rate constants in Butler-Volmer kinetics simply cause the peak
potential to shift to higher over-potentials.
10
Voltammograms like those in Figure 2 (lower) have been presented before2 '13, and
are shown here simply for comparison to those calculated from the heterogeneous Marcus
relations in Figure 2 (upper). Choosing a reorganizational energy X = 0.85 eV (as was
found for a ferrocene alkanethiol 6), we see that as log[v/k°] is increased, the 273K
voltammetric peak potentials again move to larger over-potentials, but in addition the
waveshapes become progressively broader and the peak currents smaller. The peak currents
do not scale linearly with sweep rate as was the case in Figure 2 (lower), and they and the
waveshape (vide infra) are quite sensitive to the value of X.
The results of Figure 2 (upper) additionally show that significant changes in
voltammetric behavior occur at over-potentials far less than the selected X = 0.85eV;
Marcus-DOS effects become apparent in the voltamnmetry in fact at over-potentials as small
as ca. 30% of the chosen reorganizational energy. The curvature in Figure 1 is the
qualitative reason for the voltammetric waveshapes changes in Figure 2 (upper); the
incremental increase in reaction rate with increment in over-potential becomes smaller at
larger over-potentials.
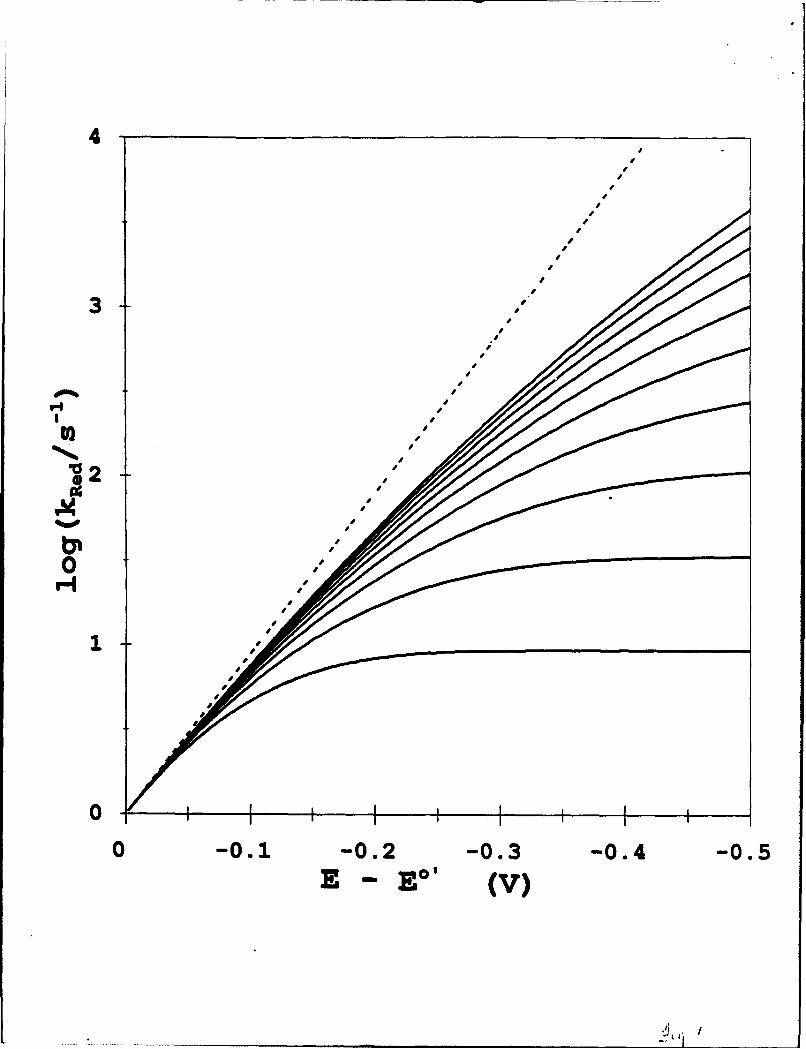
Figure 3 illustrates the sensitivity of voltammetric peak currents and waveshape to
reorganizational energy, for the case of log[v/k0 ] = 1. For decreasing X (equivalently, as
i7/ grows), the voltammetric peaks develop more prominent "diffusion-like" tails and the
peak current falls. For very small X values (0.10 eV, e;g., a reaction in a hydrocarbon-like
solvent environment where the dipolar reorientation energies are small), the post-peak current
tail can become so prominent that most of the total charge for consumption of Ir is passed in
the post-peak region and the actual location of the peak potential becomes difficult to discern.

The latter effect places, in cases where i/X > 1, a practical limitation on using AEpEAJ
values for the purpose of determining k0 .
The EpEAK values in Figure 3 vary somewhat with reorganizational energy, but these
changes are relatively small compared to the dependence of AEpEkK on log[v/k°] shown in
Figure 2 (upper). This important observation creates a framework for estimation of k'"
values in the absence of information about the value of X, as discussed below. Also note in
Figure 3 that EpEK, as X is decreased, first moves to more negative and then to more
positive potentials. Normally, EpEAK for reaction of a diffusionless electrochemical system
occurs at an over-potential at which the rate of exhaustion of the reactant overtakes the
exponential rise in rate constant. The peculiar reversal of the direction of change in EpEAK
in Figure 3 arises for small values of X through the effect of limiting of rate constants at
higher values of 7/X that occurs in the heterogeneous version of Marcus kinetics (e.g.,
Figure 1).
It is additionally apparent from Figure 3 that fitting of calculated to experimental
voltammograms and/or the use of peak currents, should allow an evaluation of X, the
reorganizational energy. It is important to note that this application requires that all of the
redox sites exhibit the same rate of reaction with the electrode. In experiments with
ferrocene alkanethiols14 , at both room temperature in aqueous medium and low temperature
in non-aqueous solvents, we typically observe dispersion (i.e., non-uniformity) in the value
of the rate constant, by a factor of 3 or more. The dispersion is clearly evident, by non-
linearities of In[current] vs. time plots from potential step experiments. Such dispersion in
non-aqueous systems has also been noted by Finklea"5 . Qualitatively, in potential sweep
12
experiments, the existence of a kinetic dispersion in which the rate constants among the
population of redox sites vary from large to small is expected to produce a broadening and
tailing of the voltarnmetric waves analogous to that seen in Figure 3. Additionally, apparent
dispersions in rate constants can be induced (a) according to a plane-of-electron transfer
model16 in potential step experiments' 7 through a variation in the couple's effective formal
potential as a function of the Ox/Red ratio, and (b) simply by a distribution of actual EO'
values among the surface redox sites because of how q is experimentally referenced to an
average EP'. 14b Thus, application of waveshaes as in Figure 3 for assessment of
reorganization energy reguires that the absence of kinetic dispersion (from whatever source)
be established beforehand by another method, of which potential step experiments would
presently be the priferred approach. This is a limitation of the linear potential sweep method
for measuring reorganizational energies.
Returning to the determination of rate constant k", Figure 4 gives working curves for
the dependence of EpEAK (vs. EO') on log[v/k0 ] at 273K for Butler-Volmer (---) and for
heterogeneous Marcus kinetics (-), based on various values of X. Figure 5 similarly
shows working curves for the dependence of normalized peak currents ip/vrA on log[v/kl] at
273K. Figure 4 shows that for moderate values of over-potential (EpEAK vs. EO'), substantial
deviations occur between calculations based on heterogeneous Marcus and on Butler-Volmer
theories, the former predicting slower electron transfer kinetics. On the other hand, there
are relatively minor differences between EpEA values calculated (at a given log[v/k°]) for
different reorganizational energies, until very large EpEK over-potentials are reached,
whereupon EpEAK values fold over toward values independent of the v/k0 ratio. (This folding

13
over represents the approach to the plateau-like voltammetry seen at the bottom of Figure 3,
and so will be difficult to explore since the EpEJK becomes difficult to define.) The most
significant observation to be made from Figure 4 is that, for moderate over-potentials, at
which clearly defined peaks can be seen, the value of k"' that is obtained from an EpEAK
determination does not depend strongly on the selected value of reorganizational energy.
This is the basis for our statement that the linear potential sweep method allows estimation of
reaction rate constants, independent of knowledge of X (or of models for its determination).
Figure 5, the analog of Figure 4, is based on the peak current dependence of
log[v/kO]. A great sensitivity to the value of reorganizational energy is evident, and in the
absence of kinetic dispersion (vide supra), peak currents can serve as a basis for
measurement of reorganizational energy.
Tables I and H provide a more extensive numerical display of the peak potential and
current dependencies on u/k", and allow an expanded scale reconstruction of the 273K
working curves of Figures 4 and 5.
Comparisons to Experimental Results. The electron transfer rate constant and
reorganizational energy for the CpFeCp°1+ reaction in aqueous HC1O4 at 273K in a mixed
monolayer self-assembled by co-chemisorption of CpFeCpCO2(CH2),gSH and CH3(CH2)17SH
on a Au(111) electrode have been determined 12 to be kIc = 0.075 ± 0.015 s- and X = 0.85
± 0.05 eV, respectively. These results were obtained using the potential step method.
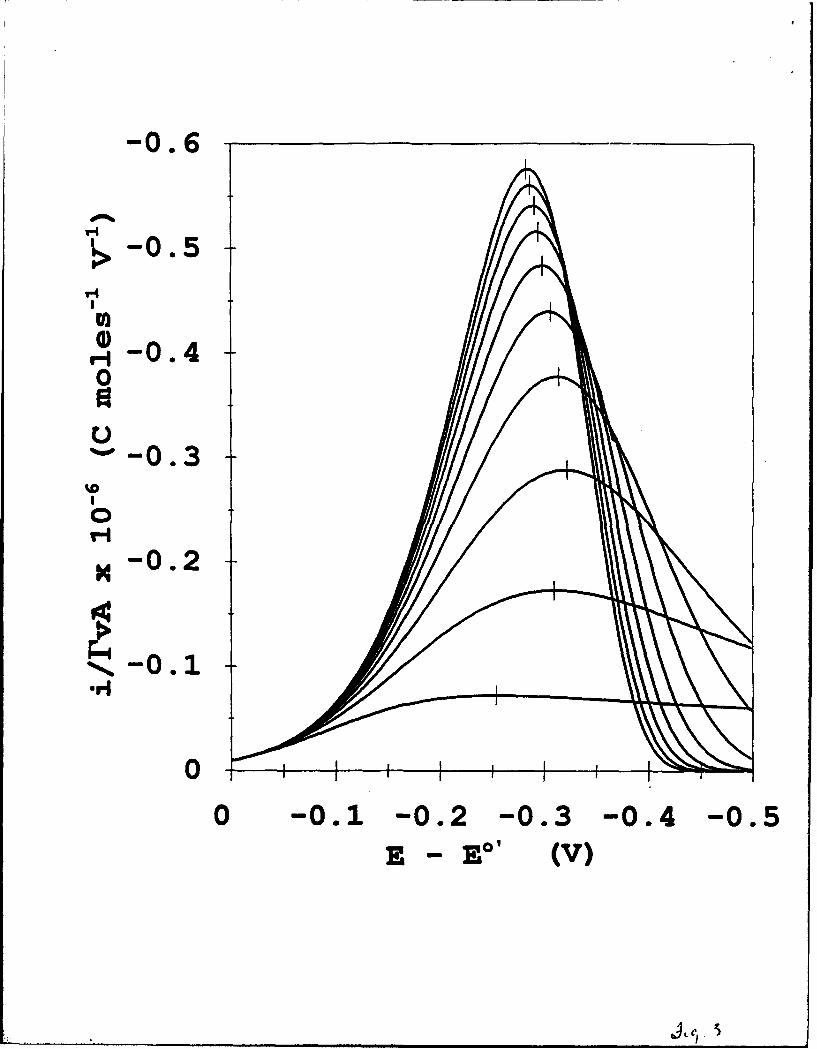
Figure 6 (upper) shows the reduction scan part of a linear sweep voltammogram taken
for a film of the above composition prepared as in the previous report6. This film contained
r = 8.8x10"1 mol/cm2 of ferrocenium sites and from potential step results was known to be
14
kinetically monodisperse. Overlaid on these data are voltammograms calculated (-) as
outlined above using the kinetic parameters k° = 0.08 s"1 and X = 0.85 eV. To compare to
the experimental data, which are uncorrected for charging current background, a double layer
capacitance component is added to the theoretical curve. The double layer component was
calculated by assuming that capacitance scales linearly with the mole fraction of oxidized
ferrocene sites between limiting values of fully oxidized (5.14xl07 F cm"2) and fully reduced
(8.7x10"7 F cm"2) films. The fit between the experimental and calculated curves, for both
potential sweep rates, is excellent, showing that assessment of ki and X by linear sweep
voltammetry and by the potential step method yield fully consistent results.
We now illustrate use of the working curve data in Figures (4,5) and Tables I,11. The
reductive EpEAK of the experimental 250 mV/s voltammogram ip Figure 6 (upper) is -238
mV. Application of the EpEAK vs. log[u/k"] working curve in Figure 4 shows that for
log[v/k°] = 0.5, every X-dependent curve except X = 0.1 eV predicts an EpEK within 10
mV of the experimentally observed value. This value of log[v/k0 ] corresponds to a rate
constant of 0.08±0.002 s4, the uncertainty representing the 10 mV variation. Application of
the Figure 5 working curve (or Table HI) for ip/vrA vs. log[v/k 0 ] to find X proves to be less
satisfactory. The experimental uncertainties in measuring ip/v (with capacitative background
correction) and r couple with the very steep dependence of ip/vlA vs. log[v/k°] produce
substantial uncertainty in the estimated X; values ranging from 0.9 to over 1.1 eV can be
obtained. Simulation of the entire current-potential curve as in Figure 6 seems to be more
reliable for estimation of the reorganizational energy, than use of peak currents alone.
Figure 6 (lower) shows the best fit to the experimental curve with a calculated Butler-

15
Volmer voltammogramn that we were able to obtain, using a = 0.5, k= 0.06 s1, and
matching the EpEAK values. The Butler-Volmer theory is much less successful in fitting to
the experimental result than is the heterogeneous Marcus calculation; most significantly it
was not possible to match the overall waveshape. The effects of the "DOS-limited" aspect of
Marcus theory are clearly evident in this waveshape comparison, even though the over-
potentials at the EpEAK values in Figure 6 (upper) are much less than the obtained
reorganizational energy. On the other hand, the kV obtained from the poor fit ure 6
(lower) is not very different from that determined using heterogeneous Marcus kinetics,
which is a reflection of the fact that in Figure 4 the lines for the two theories are not very
different at EpEAK = -238mV.
Figure 7 presents another somewhat more demanding comparison of the Figure 6
250 mV/s reductive voltammetric waveshape to theory. By calculating the current axis as
log[i/nFArox,,], which is equal to the rate constant log[k0 x,,4,] the data are transformed into
a rate constant/over-potential curve which can be compared directly with curves like those in
Figure 1. Figure 7 (- * -) corresponds to the heterogeneous Marcus case of k" = 0.08 s-'
and X = 0.85 eV, giving an excellent fit to the transformed voltammogram over the major
portion of the wave, from -0.2 to -0.3V. The fit fails at the highest over-potentials where
the small size of the experimental currents causes substantial uncertainty, and at the leading
edge of the voltammogram owing to neglect in this plot of the pseudo-reversibility of the
reaction at the lowest over-potentials.
Mixed CpFeCpCO 2(CH2 )1ISH/CH3(CH2)17 SH films" like those used in Figures 6
and 7 exhibit highly linear plots of In[transient current] vs. time in potential step

16
experiments. The slope of an In[i] vs. t plot gives the reaction rate constant; the plot's
linearity means that all of the ferrocene sites exhibit the same electron transfer rate constant.
One infers that these ferrocene sites experience nearly identical dipolar environments and
nearly identical distances and alkane layer structure intervening between ferrocene and gold
surface. This behavior is a consequence of the high degree of ordering achieved in these
films.
Other recent workl4b,.1 has produced less ordered self-assembled monolayers on Au
(111) and bulk gold that exhibit some curvature in potential step ln[i] vs. time plots for their
electrochemical reactions. The voltammetric waves for these monolayers also are broadened
even at slow potential scan rates (near-equilibrium). These films have some dispersion in
either the dipolar environments of the redox sites, or in the structure of the ilkane layer
tunnelling barrier, or both, which gives rise to a range of apparent formal potentials and/or
of electron transfer rate constants for the immobilized redox sites (vide supra). Dispersion in
rate constants is in fact well-known in solid state electron transport in amorphous films 19,
where dispersions in site dipolar environment, intersite distance, etc, occur in the material's
preparation and are thereafter fixed by the sites' limited mobilities. Kinetic dispersion is
found for example in electron transport through dry, mixed valent films of poly-vinylferrocene.20 The kinetic dispersion in the self-assembled ferrocene alkanethiol films can
then be regarded as an example of two-dimensional disorder. We will apply the
heterogeneous Marcus theory to voltammograms of such monolayers.
Figure 8 (inset) shows an experimental voltammogram at 298K in 1 M HClO 4 for a
ferrocene aikanethiol monolayer based on co-chemisorbed CpFeCpCO2(CH2)16SH (3.6 x 10-

17
10 mol/cm2) and CH3(CH 2)15SH. The bold curve in Figure 8 is the background-corrected
reductive branch and the curve ---o--- is a voltammogram calculated from heterogeneous
Marcus theory for k° - 1.0 s-1 and X = 0.85 eV. The theoretical curve was chosen for the
best fit to the EpEAK vs. E°' value. The match between the experimental and calculated
voltammetric waveshapes is not very good; the experimental voltammogram is broader and
exhibits a lower peak current. The monolayer sample used in Figure 8 gave for a potential
step to E' from a potential off the wave, In[i] vs. t plots with slopes indicating a rate
constant of ca. 4.5 sl at times before 0a. 50 msec. The slope decreased to a value of about
1 s0 at about 100 msec, remaining reasonably constant thereafter out to 1.9 sec, at which
point 51% of the ferrocene sites had been oxidized and the reaction was complete. The
dispersion in the ferrocenium sites' rate constants is thus roughly 5-fold and is the presumed
source of the peak broadening seen in Figure 8.
Voltammograms of the film in Figure 8, taken for a series of potential scan rates
produced the EpEAK - E' values (0) plotted in Figure 9 against log[v]. Figure 9 contains
overlays of the experimental plot with curves from Figure 4 to produce a good match2 ' of
the variation of EpEA with scan rate. Butler-Volmer kinetics (--- + ---) fail to describe the
observed peak potential-scan rate dependence in Figure 9. The heterogeneous Marcus fit
corresponds to a rate constant ke = 1 sf which is close to that obtained, 1.25 sV, by the
potential step method for the same chain length ferrocene alkanethiol monolayer chemisorbed
in a highly ordered film6 like that in Figures 6,7. That is, the linear sweep voltammetry
electron dynamics analysis of a film with a significant kinetic dispersion, gives an "average"
k° that is a reasonable estimate of the value in a kinetically uniform film. This observation is
18
important in a practical sense, showing that determinations of "average" kinetic rates by
comparisons like those in Figures 8,9 can be relatively forgiving with respect to the degree
of film disorder. The extent to which more substantial kinetic dispersion may induce drift of
the "average k"°" away from that appropriate for a kinetically uniform monolayer will require
further experience to evaluate.
Figures 10 and 11 show voltammetric results for another example of a kinetically
disperse CpFeCpCO2(CH2)16SH:CH3(CH2)15SH monolayer on a 0.5 mm dia. etched Au
electrode, in 2:1 EtCI:PrCN at 150K. Figure 10 shows the determination of k' and X by a
method analogous to that described above, using a set of calculations like those in Figure 4,
but for 150K. The experimental data for EpEK - EO' are plotted against log[u] and
compared to the corresponding 150K working curves. The working curves exhibit a greater
variation with reorganizational energy at this low temperature than they do at room
temperature; this and the substantial experimental potential sweep rate range allows in this
case making an estimate of•X as shown by the best match. The results indicateX = 0.9 to
1.0 eV and k° = 1.4(±0.4)x104 s-1; the error in k' represents 2 standard deviations. These
results are consistent with a large body of unpublished datal4b that we have obtained at low
temperatures in this solvent.
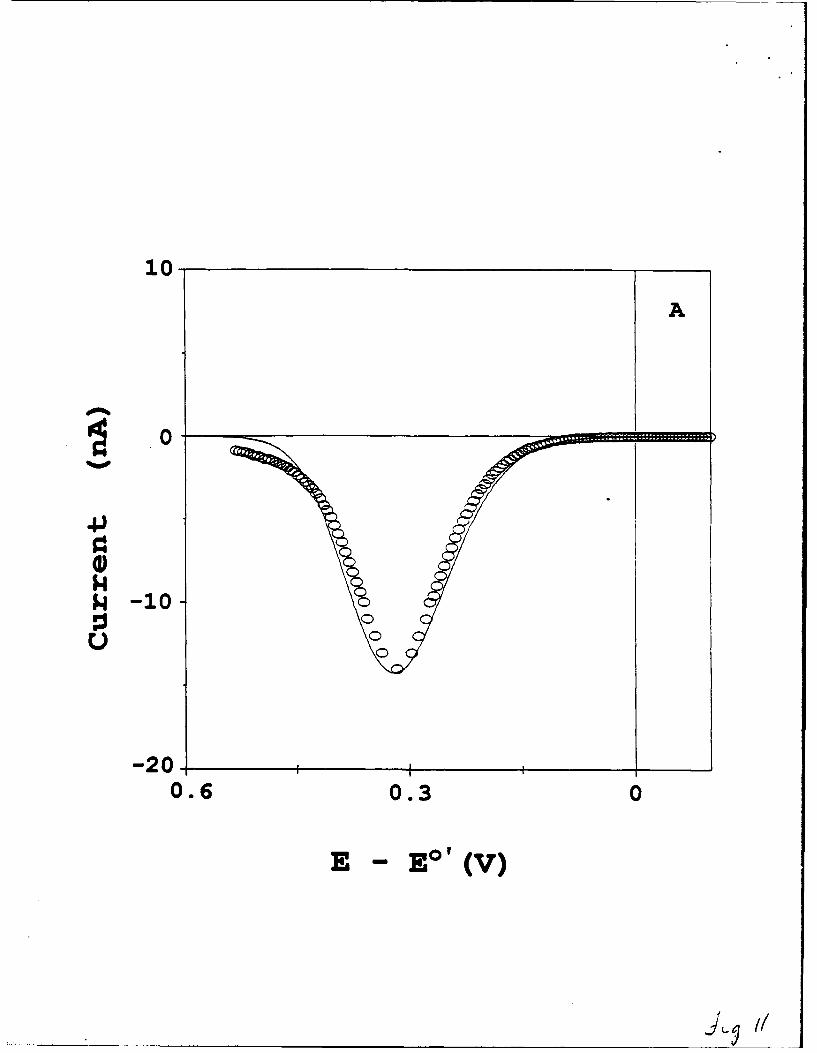
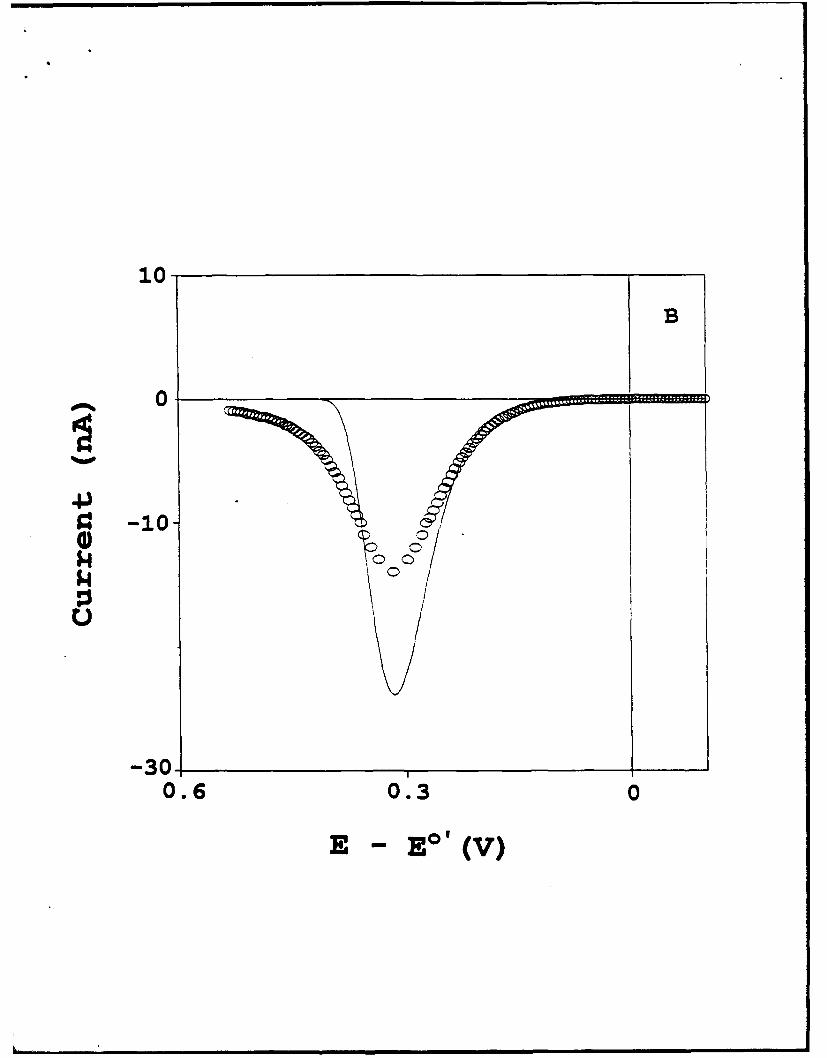
The waveshape of the low temperature voltammet'y is examined in Figure 11, which
displays the effects of the kinetic dispersion (or equivalently, in E°') in these films. Figure
IlA (solid squares) shows a background corrected 100 mV/s voltammogram for the
CpFeCpCO2(CH2) 16SH:CH3(CH2)15SH monolayer ( f 1=.5xLO 10 mol/cm2) at 150K. The
open squares represent an attempted fit of this voltammogram using X = 0.4 eV and

19
k' = 5x10⁴ s-1. We believe that the low value of X in this fit is an artifact, caused by the
voltammetric peak broadening and tailing of the kinetic dispersion. A potential step
experiment on this film exhibited a 7-fold slope variation in a In[i] vs. t plot. Figure 1 B
compares the experimental voltammetry to a voltammogram calculated for the results
obtained in Figure 10, i.e., X = 0.9 to 1.0 eV and k* = 1.4(±0.4)x104 s-1. The EpEAK
value matches exactly, but the waveshapes are quite different. The difference reflects the
effects of the dispersion in kinetic behavior of the ferrocene sites in this film.
ACKNOWLEDGEMENTS
This research was funded in part by grants from the Office of Naval Research and the
National Science Foundation. The authors gratefully acknowledge helpful discussions and
experimental data for Figures 6 and 7 which were provided by C.E.D. Chidsey and M.
Linford of Stanford University. Roger Terrill of UNC-CH is gratefully acknowledged for
assistance with data analysis.
References
1. Nicholson, R. S., Shain, I.; Anal. Chem. 1964, 36, 706.
2. Laviron, E.; J. Electroanal. Chem. 1979, 101, 19.
3. Bard, A. J.; Faulkner, L. R.; Electrochemical Methods; Wiley: New York, 1980.
4. Marcus, R. A.; J. Chem Phys. 1965, 43, 679.
5. Newton, M. D.; Sutin, N.; Annu. Rev. Phys. Chean. 1984, 35, 437.
6. Chidsey, C. E. D.; Science 1991, 251, 919.
7. Finklea, H. 0.; Hanshaw, D. D.; J. Am Chem. Soc. 1992, 114, 3173.
8. Hummel, R. E.; Electronic Properties of Materials: Springer-Verlag: Berlin, 1985.

20
9. Chidsey, C. E. D.; Bertozzi, C. R.; Putvinski, T. M.; Mujsce, A. M. J. Am. Chem.
Soc. 1990, 112, 4301.
10. Creager, S.E.; Hockett, L. A.; Rowe, G. K. Langmuir 1992, 8, 854.
11. Curtin, L.J.; Peck, S.R.; Tender, L.M.; Murray, R.W.; Rowe, G.K.; Creager, S.E.
Anal. Chem. 1993, 65, 386.
12. Dubois, L.H.; Nuzzo, R. G. Annu. Rev. Phys. Chem. 1992, 43, 437.
13. Hubbard, A.T.; Anson, F. in Bard, A.J. (Ed.) Electroanalytical Chemistry, Vol. 4,
Marcel Dekker: NY, pp. 129.
14. a) Peck, S. R. Ph. D. Dissertation, University of North Carolina, 1992. b) Tender,
L.M.; Carter, M. T.; Richardson, J. N.; Rowe, G. K.; Murray, R. W.; University of
North Carolina, unpublished results.
15. Ravenscroft, M. S.; Finklea, H. 0. J. Phys. Chem., 1994, 98, 3843.
16. Smith, C. P.; White, H. S. Anal. Chem. 1992, 64, 2398.
17. Creager, S. E.; Weber, K. Langmuir, 1993, 9, 844.
18. Chidsey, C. E. D.; Holcolm, M.; Stanford University, 1993, unpublished results.
19. a) Scher, H.; Montroll, E.W.; Phys. Rev. B 1975, 12, 2455. b) Pfister, G. Phys. Rev. B
1977, 16, 3676.
20. Sullivan, M. G., Murray, R. W. J. Phys. Chem., 1994, 98, 4343.
21. The comparison ignores the difference between explrimental (298K) and calculated
(273K) tmpeature; the error is between 20 and 33% in the fitted valve of k°.
21
FIGURE LEGENDS
Figure 1. Calculated log(ke,,d) vs. over-potential (,q=E-EO') at 273K and k° = 1.0 Sl,
based on heterogeneous Marcus kinetics (-) top-to-bottom X = 1.00, 0.9, 0.8, 0.7, 0.6,
0.5, 0.4, 0.3, 0.2, and 0.1 eV. ---- is Butler Volmer calculation for k' = 1.0 s-1 and ac
0.5.
Figure 2. Calculated, normalized voltammetric waves based on (lower, of=0.5) Butler-
Volmer kinetics and (upper, X =0.85 eV) heterogenous Marcus kinetics, at 273K, for left-to-
right values of log[v/k0 ] = -1, 0, 1, 2, and 3.
Figure 3. Dependence of calculated, normalized voltammetric waveshape on reorganization
energy X, based on heterogeneous Marcus kinetics, T = 273 K; log[v/k"] = 1.0. Top-to-
bottom X = 1.00, 0.9, 0.8, 0.7, 0.6, 0.5, 0.4, 0.3, 0.2, and 0.1 eV. Bars mark EpAK
values.
Figure 4. Working curves of voltammetric EpEAKJ over-potentials vs. log[v/kl], ratio of
potential sweep rate to electron transfer rate constant. - heterogeneous Marcus kinetics
for top-to-bottom, X = 1.00, 0.9, 0.8, 0.7, 0.6, 0.5, 0.4, 0.3, 0.2, and 0.1 eV; ----
Butler-Volmer kinetics for ci=0.5.
Figure 5. Working curves of normalized peak currents vs. log[v/kI], ratio of potential
sweep rate to electron transfer rate constant. - heterogeneous Marcus kinetics for top-to-
bottom, X = 1.00, 0.9, 0.8, 0.7, 0.6, 0.5, 0.4, 0.3, 0.2, and 0.1 eV; ---- Butler Volmer
kinetics for a=0.5.
Fmgure 6. (top panel) Comparison of scan rate-normalized experimental (noisy line) and
(--), heterogeneous Marcus voltammetry calculated for ko = 0.08 s0, X = 0.85 eV, T=

22
273K. Experimental voltammogram is for well ordered, kinetically uniform, mixed self-
assembled monolayer of CpFeCpCO2(CH 2)18 SH (P = 9.3(±-.2)xi0"ll mol/cm 2) and
CH 3(CH2)17SH co-chemisorbed on Au(1 11), T = 273K, A = 0.7 cm 2, v = 100 mV/s (left-
hand-curve) and 250 mV/s (right-hand-curve), 0. M HCIO4 . Experimental currents at 7 = -
0.5 V and 0.2 V (at both scan rates) give double-layer capacitances of 5.4x10"7 F and
8.7x10"7 F at these potential limits, which are used to simulate capacitance background of
calculated voltammogram. (lower panel) Comparison of scan rate-normalized experimental
(noisy line, same as 250mV/s experiment in upper panel) and (-), Butler-Volmer
voltammetry calcualted for k0 = 0.06 s-1, a = 0.5, T = 273K.
Figure 7. Reduction branch of 250 mV/s experimental voltammogram (noisy curve) of
Figure 6(upper) wiih current axis transformed as log[i,/nFA' 0 x,,J] = koxJ, compared to
curves calculated as in Figure 1 for (---.--) heterogeneous Marcus kinetics with k" = 0.08
sl, X = 0.85 eV, T = 273K and (-- + -- ) Butler-Volmer kinetics with k° = 0.08 s-1 and
a = 0.5 Inset shows complete experimental cyclic voltammogram for 250 mV/s.
Figure 8. Reduction branch (-) of 10 V/s experimental voltammogram (entire
voltammogram shown in inset) for a disordered, kinetically disperse, mixed self-assembled
monolayer of CpFeCpCO2(CH2 )16SH (r = 3.6x10"10 mol/cm2) and CH3(CH2)15SH co-
chemisorbed on eced Au, T = 298K, A = 0.03 cm 2, 1.0 M HClO 4 . Double layer,
backgrouml-subtracted voltammogram (-) is compared to voltammogram calculated (--*-
-) for heterogeneous Marcus kinetics with k' = 1.0 s-1, X = 0.85 eV, T = 273K, best fit
for E value.
Figure 9. Over-potentials (E, see table inset, E - EO' = 0.5AEp ) for monolayer

23
described in Figure 8. Voltammograms taken as a function of potential scan rate from 50
mV/s to 50 V/s, experimental data (0) positioned on log[v/kO] axis for k° = 1.0 s". (-1)
curves from Figure 4; X varies from top-to-bottom as in Figure 4; experimental V° = 1.0 s-1
was selected for best fit of experimental data with Figure 4 curves. (- + -) Butler-
Volmer curve from Figure 4.
Figure 10. X-dependent working curves for peak over-potential (EpEAK-E°') vs. log (v/k°) at
150K, compared to data (squares) for a monolayer of CpFeCpCO2(CH2)1 6SH:
CH 3(CH2 )1 5SH (rf= 1.5x10"10 mol/cm2) in 2:1 EtCl:PrCN with 0.075M Bu4NPF6 electrolyte.
The data fit best to the working curves using k° = 1.4 x 10⁻⁴ s"1 and X=0.9 eV.
Figure 11. Comparison of Marcus-DOS theory to oxidation branch of cyclic voltammogram
at 150K. Experimental details are the same as Figure 10. Panel A: best fit of waveshape at
100 mV/s by heterogeneous Marcus theory, for X =0.4 eV and k*f= 5x10⁻⁴ s-1 ; Panel B:
comparison of 100 mV/s waveshape to heterogeneous Marcus theory, for X=0.9 eV and k°
= 1.4x 10⁴ s-1. Calculated and experimental voltammograms are denoted by solid lines,
and open circles, respectively.

Log (v/ k)S•- Li N) M 0 I I I ... . , , ,IN I-A)
- -m -p -I mmmi ! ! - -0 MSCD nIi
00
04I IQIL~
W LiJ
* ~i~. ~iii II I i.iI *i w --
i ILoll 0
Lol a -j IQ -- - -S
11 1-1."at LP -
Ab P ..ru. u- ra

M 0 nMWMI i
M' r- r~.- P-4
"- kc* M CC CI In0
el m IVL I4
-I I It 11 1 1 1 it I I I
- ~~~ ~ J' 1;: a---N - - i=
r- r'ri rn
C,_ * I r
I-m I- c N = zr. I1 e inC *k i- I, V.- -
N~ ~ I -C=,4 It 'n
it- I C- -r M -% -iii -iii C.a -C -l
0~ , , ýC"i1,I I
1l %1 -n1111=1 II" u 7 I7 7cN7 11
C. -r %Z -c -c 1C .r C R l t 1% u%Z M I ** N U* N = Li . C %- N
N = 0i v C M %-c N tiý %Z IN IM I l i : L N C n V I I
c% ~mm r(0 ilrm ) iiiiI
J#J/
0/
0 -0 1 - .2 0.3 0. 4-0.
E EO (V

-0.9
'>-0.7
I-0.5
0-0.3
-0.1-0.9
W4-0.7
0*rI
0.3
-0.1
0.2 0 -0.2 -0.4 -0.6 -0.8 -1
Eveak - E (' (V)
-0.6
'•-0.5
, 0.40
H -0.30
I0
H-0.2
% -0.1
0
0 -0.1 -0.2 -0.3 -0.4 -0.5E -E° (V)

-1600
-1400
-1200
-1000
-800
• -600
-400
-200
-2 0 2 4 6Log ((v/k0 ) /V)
qI

-1 I
0-%-0.9
0.8I
-0.70
S-0 . 6
-0.5
"'4 -0.4
-0.3
-0.2
0
-2 0 2 4 6Log ( (v/k 0 ) /V)
j
-5
-3
0.24 -4 0
-3-2
-1
0.2 0.1 0 -. 1 -O.2 -O.3-0.4 -O.5E - E°'(V)

1.5
1 -
II
o• 0.5
0 0
1.5
-0.5 0.5 0 -0.5E -E of (V)
0 -0.1 -0.2 -0.3 -0.4E Eo' (V)

0 -
10
4'20•"12 -40
U
30 UOR
o00.40 + I I I
0.6 0 -0.6
Ep-eaj - o (V)
40
0.6 0.4 0.2 0 -0.2Epeak - Eo' (V)
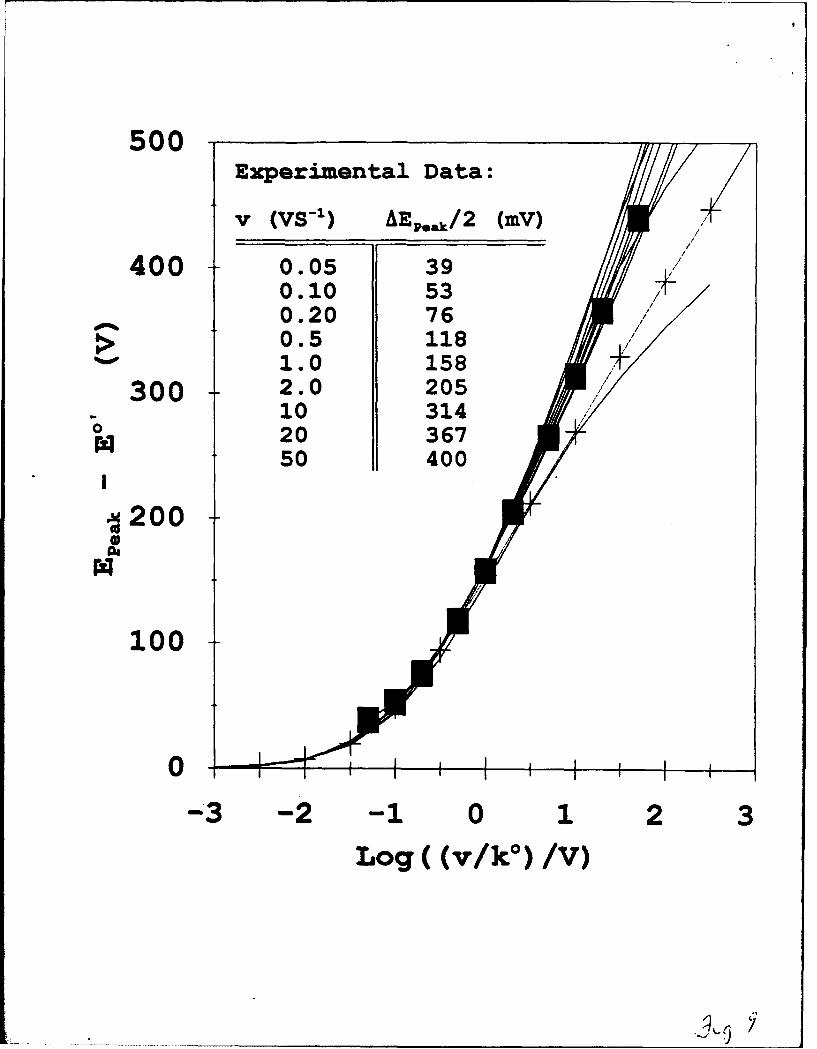
500Experimental Data:
v (VS-1) AEPo•k/2 (mV)
400 0.05 390.10 530.20 76
> 0.5 1181.0 158
300 2.0 20510 314
o 20 36750 400
I
•200
100
0-3 -2 -1 0 1 2 3
Log ((v/k 0 ) /V)

1400-
1200= 0.8 eV
>I0 1. 0 eV~!1000-
~0.6 eV•0 800
P4 1 = 0. 4 eV
M 600
P4 400-
200
0 2 4 6 8 10
log (v/k 0 )
(a)f ,6'•
10-
A
004J
w4 -10
(U)
-20-0.6 0.3 0
E Eo' (V)
j. //
10-B
S0°
4.)-10-
4)
-3010.6 0.3 0
E -E' (V)
Top Related