


Languages
Pages
Legal


Active and silent chromophore isoforms for phytochrome Pr photoisomerization: Analternative evolutionary strategy to optimize photoreaction quantum yieldsYang Yang, Martin Linke, Theodore von Haimberger, Ricardo Matute, Leticia González, Peter Schmieder, andKarsten Heyne Citation: Structural Dynamics 1, 014701 (2014); doi: 10.1063/1.4865233 View online: http://dx.doi.org/10.1063/1.4865233 View Table of Contents: http://scitation.aip.org/content/aca/journal/sdy/1/1?ver=pdfcov Published by the American Crystallographic Association, Inc. Articles you may be interested in Guanidine and guanidinium cation in the excited state—theoretical investigation J. Chem. Phys. 141, 074307 (2014); 10.1063/1.4892569 Modelling vibrational coherence in the primary rhodopsin photoproduct J. Chem. Phys. 137, 22A523 (2012); 10.1063/1.4742814 Communication maps computed for homodimeric hemoglobin: Computational study of water-mediated energytransport in proteins J. Chem. Phys. 135, 065103 (2011); 10.1063/1.3623423 A diabatic three-state representation of photoisomerization in the green fluorescent protein chromophore J. Chem. Phys. 130, 184302 (2009); 10.1063/1.3121324 Optimal control of ultrafast cis-trans photoisomerization of retinal in rhodopsin via a conical intersection J. Chem. Phys. 123, 144508 (2005); 10.1063/1.2034488
Active and silent chromophore isoforms for phytochromePr photoisomerization: An alternative evolutionary strategyto optimize photoreaction quantum yields
Yang Yang,1,2 Martin Linke,1 Theodore von Haimberger,1 Ricardo Matute,3
Leticia Gonz�alez,4 Peter Schmieder,5 and Karsten Heyne1,2,a)
1Department of Physics, Freie Universit€at Berlin, Arnimallee 14, 14195 Berlin, Germany2Center for Supramolecular Interactions, Takustr. 3, 14195 Berlin, Germany3Department of Chemistry and Biochemistry, UCLA, 607 Charles E. Young Drive East,Los Angeles, California 90095-1569, USA4Universit€at Wien, Institut f€ur Theoretische Chemie, W€ahringer Str. 17, A-1090 Wien5Leibniz-Institut f€ur Molekulare Pharmakologie, Robert-R€ossle Str. 10, 13125 Berlin,Germany
(Received 5 November 2013; accepted 11 January 2014; published online 5 February 2014)
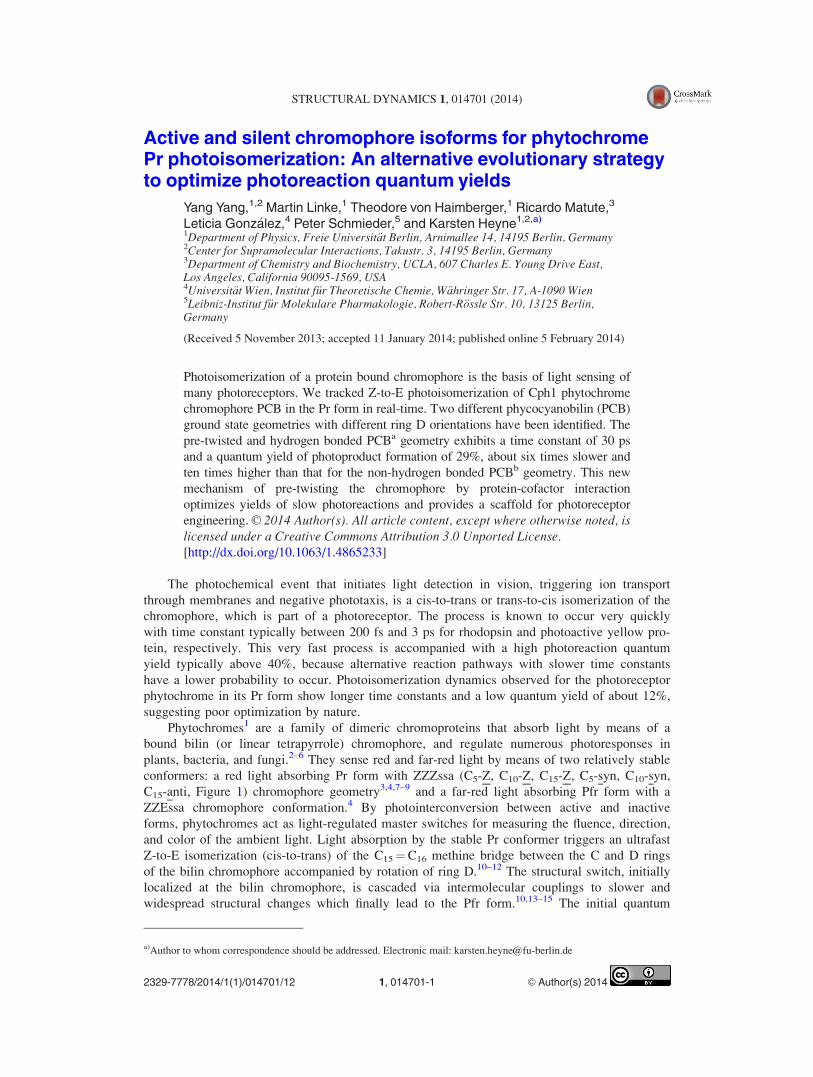
Photoisomerization of a protein bound chromophore is the basis of light sensing of
many photoreceptors. We tracked Z-to-E photoisomerization of Cph1 phytochrome
chromophore PCB in the Pr form in real-time. Two different phycocyanobilin (PCB)
ground state geometries with different ring D orientations have been identified. The
pre-twisted and hydrogen bonded PCBa geometry exhibits a time constant of 30 ps
and a quantum yield of photoproduct formation of 29%, about six times slower and
ten times higher than that for the non-hydrogen bonded PCBb geometry. This new
mechanism of pre-twisting the chromophore by protein-cofactor interaction
optimizes yields of slow photoreactions and provides a scaffold for photoreceptor
engineering. VC 2014 Author(s). All article content, except where otherwise noted, islicensed under a Creative Commons Attribution 3.0 Unported License.[http://dx.doi.org/10.1063/1.4865233]
The photochemical event that initiates light detection in vision, triggering ion transport
through membranes and negative phototaxis, is a cis-to-trans or trans-to-cis isomerization of the
chromophore, which is part of a photoreceptor. The process is known to occur very quickly
with time constant typically between 200 fs and 3 ps for rhodopsin and photoactive yellow pro-
tein, respectively. This very fast process is accompanied with a high photoreaction quantum
yield typically above 40%, because alternative reaction pathways with slower time constants
have a lower probability to occur. Photoisomerization dynamics observed for the photoreceptor
phytochrome in its Pr form show longer time constants and a low quantum yield of about 12%,
suggesting poor optimization by nature.
Phytochromes1 are a family of dimeric chromoproteins that absorb light by means of a
bound bilin (or linear tetrapyrrole) chromophore, and regulate numerous photoresponses in
plants, bacteria, and fungi.2–6 They sense red and far-red light by means of two relatively stable
conformers: a red light absorbing Pr form with ZZZssa (C5-Z, C10-Z, C15-Z, C5-syn, C10-syn,
C15-anti, Figure 1) chromophore geometry3,4,7–9 and a far-red light absorbing Pfr form with a
ZZEssa chromophore conformation.4 By photointerconversion between active and inactive
forms, phytochromes act as light-regulated master switches for measuring the fluence, direction,
and color of the ambient light. Light absorption by the stable Pr conformer triggers an ultrafast
Z-to-E isomerization (cis-to-trans) of the C15¼C16 methine bridge between the C and D rings
of the bilin chromophore accompanied by rotation of ring D.10–12 The structural switch, initially
localized at the bilin chromophore, is cascaded via intermolecular couplings to slower and
widespread structural changes which finally lead to the Pfr form.10,13–15 The initial quantum
a)Author to whom correspondence should be addressed. Electronic mail: [email protected]
2329-7778/2014/1(1)/014701/12 VC Author(s) 20141, 014701-1
STRUCTURAL DYNAMICS 1, 014701 (2014)

yield determines the efficiency, of all successive reaction steps. Therefore, to design synthetic
light sensing and light harvesting systems with optimized efficacy it is essential to determine
the exact molecular reaction mechanism of ultrafast photoisomerization.
Unfortunately, only a few spectroscopic methods allow direct tracking of fast structural
changes in biomolecules on a nanosecond time scale.16 From direct and indirect methods, it is
known that the chromophore in photoreceptors such as rhodopsin, bacteriorhodopsin, and photo-
active yellow protein isomerize around a C¼C double bond on a time scale of 0.2 to 3 ps with
yields of 40% to 65%, a reaction process much faster and five to ten times more efficient in the
protein than in solution.17–26 The primary photoisomerization of the Pr phytochrome has been
investigated by means of ultrafast electronic and vibrational spectroscopy of plant and bacterial
phytochromes. From these studies, isomerization time constants in the range of 3 ps to 16 ps
and 25 ps to 40 ps were reported,14,27–32 followed by lumi-R photoproduct formation with
quantum yields in the range of 7% to 16%.8,15,28–31
The low photoproduct quantum yield in phytochrome was proposed to result from photore-
ceptor heterogeneity.33,34 Different geometries of phycocyanobilin (PCB) chromophores in solu-
tion were reported with time constants in the range of 3 ps to 500 ps, not detectable in phyto-
chrome Pr photoreaction.35,36 Despite the kinetic insight gained from these electronic and
vibrational investigations, it was not possible to establish when the C15¼C16 double bond isom-
erization and ring D rotation occur, let alone determine the influence of chromophore heteroge-
neity in phytochromes or the structural orientation of ring D in the photoproduct lumi-R. A nu-
clear magnetic resonance (NMR) study by Song et al.34,37 reported two PCB geometries in the
Pr ground state Pr-I and Pr-II with different ring D orientations but unknown photoreactive
properties. Although traditional femtosecond time resolved infrared and Raman spectroscopic
methods provide important information on structural dynamics,8,29 they are not able to track
orientational changes of vibrational transition dipole moments (tdm) in real time directly.
In this study, we used polarization resolved femtosecond visible pump infrared probe (prfs
VIS-IR) spectroscopy19,38 to determine the frequency position and orientation of the vibrational
modes on a femtosecond time scale from excitation to formation of the first photoproduct lumi-
R. Prfs VIS-IR spectroscopy provides direct transient information on the relative angle between
the excited electronic transition dipole moment (tdm) and the probed vibrational tdm. The tdms
are fixed within the molecular scaffold of the chromophore, and their properties depend on the
electronically excited state. To solely obtain signals from the chromophore’s �(C¼O) and
�(C¼C) stretching vibrations, we used the phycocyanobilin (PCB) chromophore bound to13C/15N labeled Cph1D2 protein in D2O, shifting all �(C¼O), �(C¼C), and �(C¼N) stretching
vibrations of the protein to longer wavelengths and all significant protein vibrations out of our
spectral window of 1660–1745 cm�1.
FIG. 1. PCB chromophore of Cph1D2 phytochrome with ZZZssa (C5-Z, C10-Z, C15-Z, C5-syn, C10-syn, C15-anti) geome-
try. Absorption spectrum of Cph1D2 Pr form (black line) and applied excitation pulse profile (red line).
014701-2 Yang et al. Struct. Dyn. 1, 014701 (2014)

Our technique allows us to directly address and answer questions concerning the timing of
the chromophore isomerization and ring D rotation, the heterogeneity of chromophore structures
and their photoreaction quantum yields, the ZZZssa Pr and the ZZEssa lumi-R ground state ge-
ometry (with the help of calculated structures), and the low average quantum yield of the pho-
toreaction compared to that of other photoreceptors. The direct marker bands for Z-to-E isomer-
ization in the 1700 cm�1 spectral region were monitored by prfs VIS-IR spectroscopy at a
spectral resolution of 1.5 cm�1 and a time resolution better than 400 fs, sufficient to resolve
sample heterogeneities and dynamics on the time scale believed to govern the S1-S0 transition.
RESULTS AND DISCUSSION
Structural changes initiated by the photoexcitation are reflected in changes in the chromo-
phores’ vibrational spectrum. Upon excitation, isotropic transient absorption signals Aiso were
determined by the absorption signals with parallel Ak and perpendicular A? polarization, with
respect to the pump pulse polarization according to Aiso¼ (Akþ 2A?)/3. All transients were
best fitted by a biexponential decay of (4.7 6 1.4) ps and (30 6 5) ps.8,15,29–31 The error margins
represent 1r standard deviations as determined by exhaustive search analysis (ExSeAn).39
In Figure 2(a), the ground state recovery at 1631 cm�1 represents signals of the PCB delo-
calized mode comprising the C15¼C16 methine bridge and the C17¼C18 double bond of the D
ring,29 superimposed with signals from 13C labeled carbonyl modes of the protein. Frequencies
above 1670 cm�1 originate exclusively from chromophore �(C¼O) stretching vibrations. The
decay of the �(C19¼O)* stretching vibration of ring D in the electronically excited state of Pr
(Fig. 2(a)) has its maximum at 1680 cm�1 and is red-shifted with respect to its ground state
absorption.10,27,40 The decay is dominated by the 30 ps time constant (80%). Two distinct
bleaching signals of the �(C19¼O) stretching vibration in the Pr ground state, at 1701 cm�1 and
1708 cm�1, are presented in Figure 2(b). The �(C19¼Oa) bleaching signal at 1701 cm�1 has
only a negligible 4.7 ps contribution of 5% (Fig. S3(b)),41 while the �(C19¼Ob) bleaching sig-
nal at 1708 cm�1 exhibits a pronounced 4.7 ps contribution of 30%. The bleaching recovery at
100 ps is more than seven times greater for �(C19¼Ob) than for �(C19¼Oa).41 Since the differ-
ence between the time constants of the two bleaching bands cannot originate from overlap with
FIG. 2. Transient dynamics at frequency positions of marker bands calculated for isotropic conditions. (a) Bleaching signal
of �(C15¼C16) and �(C17¼C18) stretching vibrations (open red circles), absorption of �(C19¼O)* stretching vibration in
the electronically excited state. (b) Bleaching signals of �(C19¼Oa) and �(C19¼Ob) stretching vibrations in the Pr state
(solid and open red circles, respectively). (c) Bleaching signal of �(C1¼O) stretching vibration and �(C19¼O) absorption of
lumi-R.
014701-3 Yang et al. Struct. Dyn. 1, 014701 (2014)
the �(C19¼O)* vibrational band of Pr, two distinct �(C19¼O) vibrations must exist, resulting
from at least two different chromophore ground state geometries in Cph1D2.34 Additional sup-
port is given by the analysis of the perturbed free induction decay (PFID) signal.41 The expo-
nential rise of the PFID signal is related to the Lorentzian line width of the absorption band as
its Fourier transform.42–44 The optimal fit gives a dephasing time constant of sdep¼ 1620 fs
with a 1r error margin from 1350 fs to 2000 fs (Fig. S1).41 This translates to a Lorentzian line
width range of 6 cm�1 to 8 cm�1. Given this line width the bleaching band at �1705 cm�1 in
the decay associated spectrum (DAS) at time zero (Fig. 4) cannot be explained by a single
absorption band, but can well be simulated with two absorption bands at 1701 cm�1 and
1708 cm�1. Exhaustive search analysis of the positions of the two absorption bands shows that
their frequencies exhibit distinct values (Fig. S2).41 Analysis of the polarization resolved DAS
(Fig. 4) provides relative angles between the vibrational transition dipole moments of these two
vibrations with the electronic transition dipole moment (tdm) of the S0!S1 transition. We find
distinct angles of 29� and 16� for �(C19¼O)a and �(C19¼O)b, respectively. The frequency posi-
tion of the �(C19¼O) vibrational band of PCB was reported to be in the spectral region of
1696 cm�1 to 1707 cm�1.10,27,30,45,46 In previous studies, no direct indications for two
�(C19¼O) vibrational bands had been reported.29 With our higher spectral resolution of
1.5 cm�1 and the time resolved spectroscopic method, we are able to assign two distinct vibra-
tional bands located at 1701 cm�1 and 1708 cm�1, each having a width of 8 cm�1. Those fre-
quency positions are known to result from the �(C19¼O) stretching vibration in the presence or
absence of a hydrogen bond, respectively.10 However, hot ground states or hot electronic
excited states would contribute as positive signals with the same relative angles as the ground
state or electronic excited state, respectively.47 Hence, neither a hot ground state nor a hot elec-
tronic excited state contribution can account for the negative signal at 1701 cm�1 with a relative
angle of 29�. Additionally, careful analysis of the data show that the second bleaching band sig-
nal at 1701 cm�1 cannot origin from overlapping of the electronic excited state signal and the
ground state bleaching signal (Fig. S8).41
Thus, these findings demonstrate the heterogeneity of the chromophore structure in
phytochromes12,14,34,48–51 and shed new light on the analysis of phytochrome infrared spectra in
the spectral region around 1700 cm�1.
As it turns out, the crystal structure exhibits only the hydrogen bonded chromophore geom-
etry PCBa (Fig. 6(a)).1 Thus, we modeled the second chromophore geometry (Fig. 6(b)), which
exhibits a �(C19¼Ob) vibrational tdm vector more parallel to the lel (16�), than the PCBa ge-
ometry (29�). We rotate ring D to the b facial chromophore side and optimized the geometry
by density functional theory (DFT). In this position, the C19¼O group of ring D is not able to
form a hydrogen bond. Calculations show a small frequency blue shift of 1 cm�1 (Table I),
while experiments provide a frequency blue shift of a 7 cm�1. This is due to the missing hydro-
gen bond of the more planar geometry PCBb.
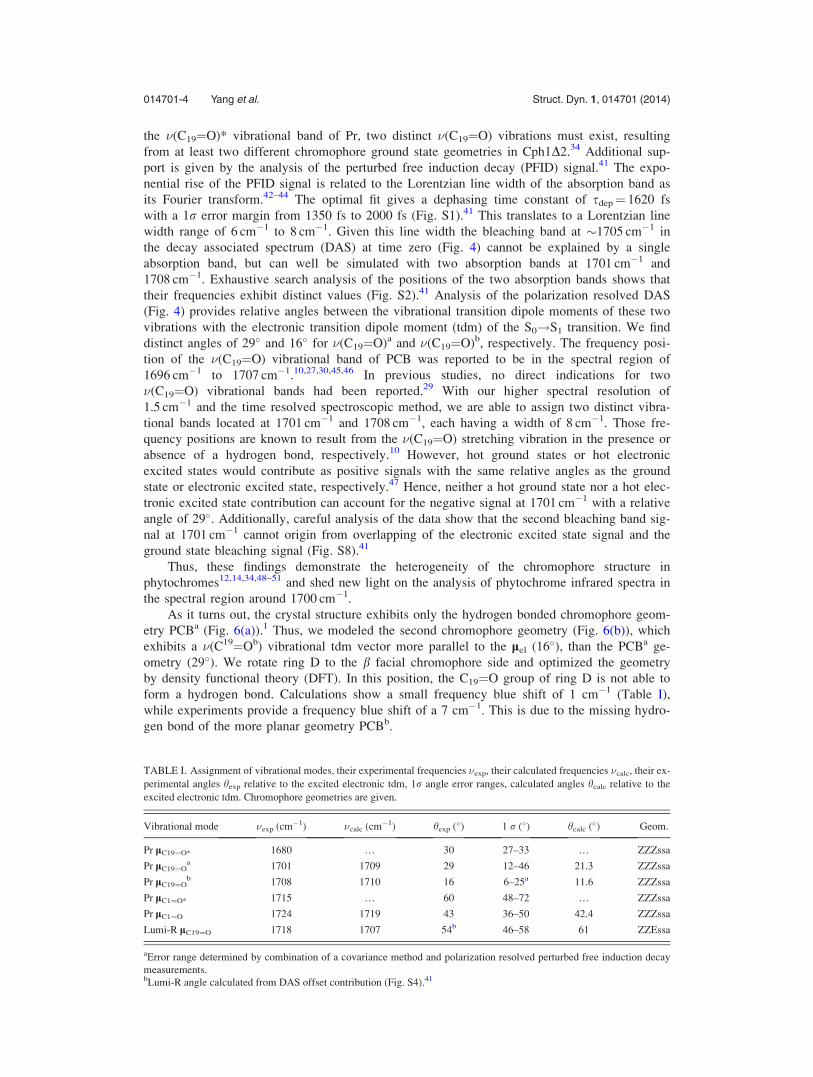
TABLE I. Assignment of vibrational modes, their experimental frequencies �exp, their calculated frequencies �calc, their ex-
perimental angles hexp relative to the excited electronic tdm, 1r angle error ranges, calculated angles hcalc relative to the
excited electronic tdm. Chromophore geometries are given.
Vibrational mode �exp (cm�1) �calc (cm�1) hexp (�) 1 r (�) hcalc (�) Geom.
Pr lC19¼O* 1680 … 30 27–33 … ZZZssa
Pr lC19¼Oa 1701 1709 29 12–46 21.3 ZZZssa
Pr lC19¼Ob 1708 1710 16 6–25a 11.6 ZZZssa
Pr lC1¼O* 1715 … 60 48–72 … ZZZssa
Pr lC1¼O 1724 1719 43 36–50 42.4 ZZZssa
Lumi-R lC19¼O 1718 1707 54b 46–58 61 ZZEssa
aError range determined by combination of a covariance method and polarization resolved perturbed free induction decay
measurements.bLumi-R angle calculated from DAS offset contribution (Fig. S4).41
014701-4 Yang et al. Struct. Dyn. 1, 014701 (2014)
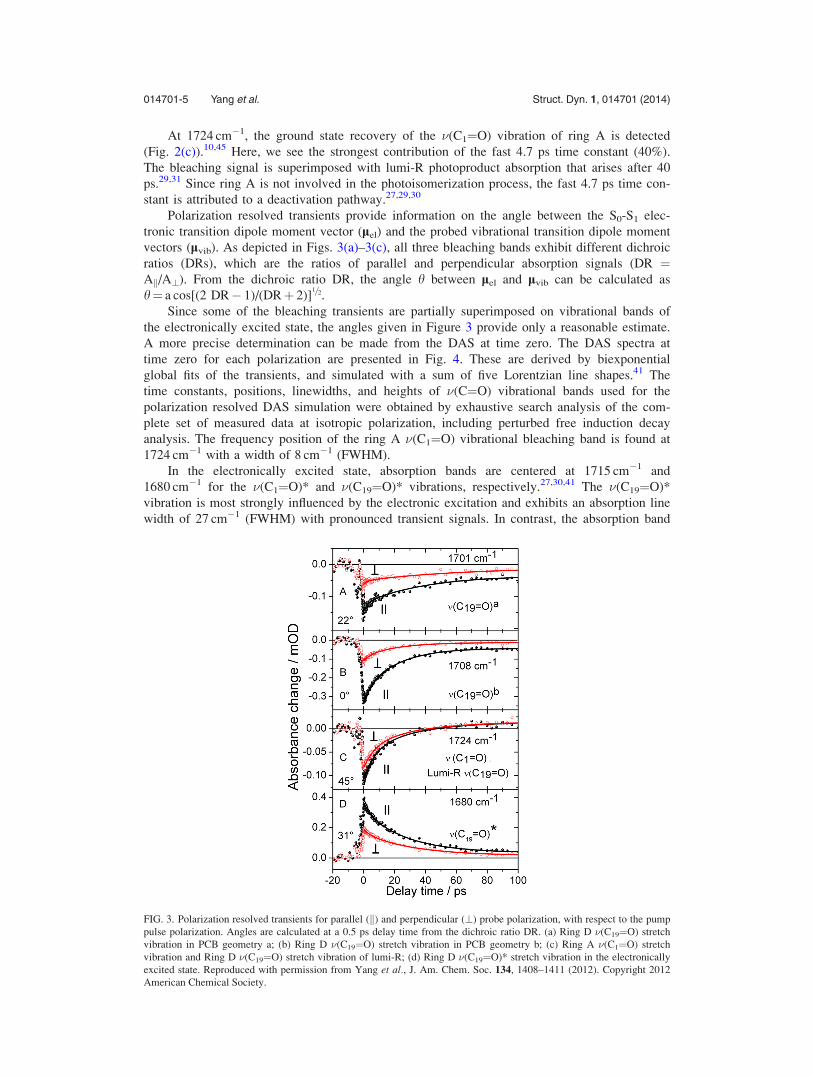
At 1724 cm�1, the ground state recovery of the �(C1¼O) vibration of ring A is detected
(Fig. 2(c)).10,45 Here, we see the strongest contribution of the fast 4.7 ps time constant (40%).
The bleaching signal is superimposed with lumi-R photoproduct absorption that arises after 40
ps.29,31 Since ring A is not involved in the photoisomerization process, the fast 4.7 ps time con-
stant is attributed to a deactivation pathway.27,29,30
Polarization resolved transients provide information on the angle between the S0-S1 elec-
tronic transition dipole moment vector (lel) and the probed vibrational transition dipole moment
vectors (lvib). As depicted in Figs. 3(a)–3(c), all three bleaching bands exhibit different dichroic
ratios (DRs), which are the ratios of parallel and perpendicular absorption signals (DR ¼Ak/A?). From the dichroic ratio DR, the angle h between lel and lvib can be calculated as
h¼ a cos[(2 DR� 1)/(DRþ 2)]1=2.
Since some of the bleaching transients are partially superimposed on vibrational bands of
the electronically excited state, the angles given in Figure 3 provide only a reasonable estimate.
A more precise determination can be made from the DAS at time zero. The DAS spectra at
time zero for each polarization are presented in Fig. 4. These are derived by biexponential
global fits of the transients, and simulated with a sum of five Lorentzian line shapes.41 The
time constants, positions, linewidths, and heights of �(C¼O) vibrational bands used for the
polarization resolved DAS simulation were obtained by exhaustive search analysis of the com-
plete set of measured data at isotropic polarization, including perturbed free induction decay
analysis. The frequency position of the ring A �(C1¼O) vibrational bleaching band is found at
1724 cm�1 with a width of 8 cm�1 (FWHM).
In the electronically excited state, absorption bands are centered at 1715 cm�1 and
1680 cm�1 for the �(C1¼O)* and �(C19¼O)* vibrations, respectively.27,30,41 The �(C19¼O)*
vibration is most strongly influenced by the electronic excitation and exhibits an absorption line
width of 27 cm�1 (FWHM) with pronounced transient signals. In contrast, the absorption band
FIG. 3. Polarization resolved transients for parallel (k) and perpendicular (?) probe polarization, with respect to the pump
pulse polarization. Angles are calculated at a 0.5 ps delay time from the dichroic ratio DR. (a) Ring D �(C19¼O) stretch
vibration in PCB geometry a; (b) Ring D �(C19¼O) stretch vibration in PCB geometry b; (c) Ring A �(C1¼O) stretch
vibration and Ring D �(C19¼O) stretch vibration of lumi-R; (d) Ring D �(C19¼O)* stretch vibration in the electronically
excited state. Reproduced with permission from Yang et al., J. Am. Chem. Soc. 134, 1408–1411 (2012). Copyright 2012
American Chemical Society.
014701-5 Yang et al. Struct. Dyn. 1, 014701 (2014)

of the �(C1¼O)* vibration exhibits a very small signal and is located at 1715 cm�1 with a line
width of 8 cm�1 FWHM (Fig. S3).41 The �(C1¼O)* vibration is only detectable by its dichroic
ratio, which is below one and results in a positive peak in the spectrum for perpendicular polar-
ization at around 1715 cm�1 (Fig. 4). The small contribution of the �(C1¼O)* vibration to the
signal is attributed to weak anharmonic coupling, which is made possible by negligible struc-
tural change in ring A during photoisomerization.29
Analysis of polarization resolved DAS spectra at time zero yields the angles between lel
and the investigated vibrational tdms (Table I). Additionally, the angle (lel, lC19¼O*) between
the S0-S1 tdm and the �(C19¼O)* stretching vibrational tdm was analyzed by ExSeAn and an
angle of 30� (1r range of 18� to 42�) was determined. Error margins given in Table I were
derived by the covariance matrix method. All determined angles are compatible with the values
directly deduced from the kinetic traces, except the angle (lel, lC1¼O*), which is not observable
in the transients.
The polarization resolved decay of the �(C19¼O) vibration in both its electronically excited
state and its ground state is presented in Figs. 5(a) and 5(b) on a logarithmic scale. While the
two decaying polarization resolved transients of the �(C19¼Ob) bleaching band in Fig. 5(a)
show identical slopes, the slopes of the two polarization resolved transients for the �(C19¼O)*
stretching band in the electronically excited state are different (Fig. 5(b)). This was interpreted
as ring D orientational change in the electronic excited state to the transition state (90� twist)
with a time constant of 30 ps and a quantum yield of about 16%.52 The time dependent
dichroic ratio change (Fig. 5(c)) shows a negligible increase up to 3 ps, followed by a decrease
on the time scale of tens of picoseconds. The average angle increases steadily up to 30 ps, sup-
porting the argument that the fast time component of 4.7 ps is associated with C¼C bond order
reduction, a prerequisite for ring D rotation, and relaxation processes that lead to the initial
ground state.27,30,31
Thus, our data support an isomerization mechanism with a single isomerization around the
C15¼C16 double bond via a strongly twisted transition state.5 An isomerization mechanism
including an additional rotation around the C14-C15 single bond in the electronically excited
state would result in negligible dichroic ratio changes and is therefore less likely.13,15,53 The
initial negligible increase of the dichroic signal (Fig. 5(c)) over time, followed by a delayed
dichroic signal decrease can be explained by two models: (I) Ring D rotates away from His290
to smaller twisting angles (clockwise rotation) for PCBa chromophore geometries with a-facial
disposition,2 while the non-isomerizing PCBb chromophores with b-facial disposition rattle
around their average orientation. The a-facial disposition is defined by ring D lying on the
a-face of the coplanar B- and C-rings.2 This implies ring D to be located on the b-facial side
after isomerization, in contrast to the Pfr structure reported by Song et al.34 on Cph1. (II) A
FIG. 4. Decay associated spectrum at time zero and simulation for polarizations parallel (k) and perpendicular (?) to the
pump pulse polarization. The DAS at time zero is the sum of all DAS components. Negative peak at 1724 cm�1, �(C1¼O)
stretching vibration; positive signals around 1715 cm�1, �(C1¼O)* stretching vibration in the electronically excited state;
negative peak at 1708 cm�1, �(C19¼O)b stretching vibration; shoulder at 1701 cm�1, �(C19¼O)a stretching vibration; posi-
tive peak at 1680 cm�1, �(C19¼O)* stretching vibration.
014701-6 Yang et al. Struct. Dyn. 1, 014701 (2014)

significant part of the PCBa chromophores with a-facial disposition show counter-clockwise
rotation of ring D, thereby slowly passing His290 resulting in a slow dichroic decrease.
Another part of PCBa chromophores with b-facial disposition rotate clockwise to smaller twist-
ing angles on a faster time scale, but do not isomerize, thereby increasing the dichroic ratio
(Fig. 5(c)). Non-isomerizing PCBb chromophores rattle around their average orientation and
decay to the ground state. This implies ring D to be located on the a-facial side after isomeriza-
tion, in agreement with the Pfr structure presented by Song et al.34 on Cph1. This is the model
we favor.
Combining measured relative angles for the Pr ground state (see Table I) with calculated
angles, we are able to verify structural models of the chromophore in the protein binding
pocket. The calculated angles of the ZZZssa structural model shown in Fig. 6 are in complete
agreement with the experimentally determined ones (Table I).1,4 The chromophore structures
with orientation of ring D for PCBa and PCBb match very well with the Pr-II and Pr-I geome-
tries reported by Song et al.,54 respectively.
Lumi-R formation was estimated with a quantum yield of about 12% and an angle (lel,
lC19¼O) of 654�, matching the calculated angle of 61� for the ZZEssa geometry shown in Fig.
6(c) (see also Figs. S4, S6, and S7).41 From one relative angle alone one cannot determine whether
lumi-R adopts a a-facial or b-facial geometry of ring D. Circular dichroism (CD) experiments
showed opposite rotational strengths of Pr and Pfr in the longest wavelength band, suggesting a
reversal of chirality upon photoisomerization, and thus supporting model II.2,55,56 But heterogeneity
of Pr ground states complicate interpretation of CD spectra, since PCBa and PCBb geometries
show opposite rotational strengths with a twofold calculated intensity strength for PCBa (Fig. S5).41
Using transients and difference spectra, the individual quantum yields of PCBa and PCBb
geometries were determined.41 The more planar PCBb geometry without hydrogen bonding
FIG. 5. Polarization resolved transient signals and simulations of the �(C19¼O) stretching vibration. (a) �(C19¼O)b vibra-
tion in the Pr ground state plotted on a logarithmic scale: Identical slopes for parallel (k) and perpendicular (?) polarization
indicate no change in dichroic behavior. (b) �(C19¼O)* vibration in the Pr excited state plotted on a logarithmic scale:
Transient for parallel polarization (k) exhibits a steeper slope than that for perpendicular (?) polarization, demonstrating a
change to greater angles. (c) DR calculated by the data (circles) and simulations (blue line) of the �(C19¼O)* vibrational
data presented in (b). The simulation shows a negligible increase up to 3 ps, followed by a decrease on the time scale of
tens of picoseconds. Reproduced with permission from Yang et al., J. Am. Chem. Soc. 134, 1408–1411 (2012). Copyright
2012 American Chemical Society.
014701-7 Yang et al. Struct. Dyn. 1, 014701 (2014)

exhibits a ninefold lesser quantum yield of 3%, and has a twofold population as compared to
the hydrogen bonded PCBa geometry with quantum yield of 29%. This indicates that
pre-twisting of ring D in the electronic ground state via a single hydrogen bond increases the
quantum yield for lumi-R formation significantly.
On the basis of the Cph1 crystal structure,1 previously reported models,12,29,31,32 and
our data, we propose a detailed model for counter-clockwise Pr photoisomerization.2
Photoexcitation of the chromophore to the electronically excited state S1 shifts the positive
charge from ring B and ring C toward C14¼C15 methine bridge of ring D. Reduction of nega-
tive charge at ring D breaks the hydrogen bond between His290 and the ring D C19¼O
group.12,31 This enables His290 to move away and open the door for counter-clockwise rotation
of ring D. Additionally, the positive charge at C14¼C15 methine bridge alters the hydrogen
bond of the water between ring B and ring C, and the hydrogen bond of amino acids Asp207
and Tyr263 in the vicinity of rings C and D. Changes in the hydrogen bond network can induce
displacement of Asp207 and Tyr263 reducing steric hindrance for counter-clockwise rotation of
FIG. 6. Calculated PCB chromophore geometries with Pr S0!S1 transition dipole moment lel (black arrow) and vibra-
tional tdms of �(C19¼O)a and �(C1¼O) (red arrows). lel and lC15O show negligible components in the z direction, in con-
trast to lC195Oa. (a) PCBa geometry, (b) PCBb geometry, and (c) lumi-R geometry (a-facial ring D position). Note, tdm
arrows can point in either direction.
014701-8 Yang et al. Struct. Dyn. 1, 014701 (2014)

PCBa ring D with a-facial disposition.1,34 Tyr176 is not directly involved in a hydrogen bond
network in the Pr state, but is expected to induce steric hindrance for clockwise rotation of
PCBb ring D with b-facial disposition.1 In the electronically excited state, the double bond char-
acter of the C14¼C15 methine bridge is reduced, and potential energy from the distorted chro-
mophore ring D is transformed to rotational energy. A part of the PCBa chromophores passes
His290, rotate counter-clockwise to the transition state, and isomerizes, while the remaining
PCBa chromophores rotate clockwise, do not overcome the potential barriers, and relax back to
the ground state.
Only about 3% of the chromophores with PCBb geometry overcome the potential barrier in
the electronic excited state and isomerize to lumi-R (Figs. 7(a) and 7(b), blue lines), while 97%
relax back to the Pr ground state.
Whether the two Pr isoforms PCBa and PCBb undergo interconversion between the silent
and the active forms can be tested by temperature dependent measurements.
Rotation of ring D to a more planar geometry is suggested by a dichroic ratio increase in
the �(C19¼O)* vibrational band within the first 3 ps (Fig. 5(c)) and a fluorescence red-shift on
the same timescale.31 A more planar geometry between ring C and ring D reduces the strain in
the C14-C15¼C16 moiety and induces dramatic changes in the C15-H hydrogen out of plane
mode due to increased steric interaction between ring C and ring D within the first picoseconds,
as also reported by femtosecond time resolved Raman experiments.29 Intramolecular steric inter-
actions between the C13 methyl of ring C and the N-H of ring D prevent planarity of the
C14-C15¼C16 moiety, resulting in a barrier in the electronic excited state (Fig. 7).14,31,32 In most
cases, the rotational energy of the chromophores is too low to pass the potential barrier separat-
ing the two geometries. PCBa chromophores passing His290 experience a shallow excited state
potential surface allowing ring D rotation to higher distortion angles and the formation of a tran-
sition state in which ring D is twisted by 90�. The increase in distortion angle of ring D is
reflected by the decrease in dichroic ratio over time (Fig. 5(c)). After passing the His290,
changes in the C15-H hydrogen out of plane mode due to steric interaction between ring C and
ring D are negligible.29 As a result of the shallow excited state potential energy surface ring D
rotation occurs on a time scale of tens of ps. From there, relaxation to the electronic ground state
Pr is observed with the same time constant as lumi-R formation (30 ps).29,31,52
PCBb chromophores without a hydrogen bond to His290 exhibit a more planar geometry
and lower potential energy on the excited state surface as presented in Figure 7, resulting in a
lower probability for reaching the transition state and forming lumi-R. As depicted in Figure 7,
FIG. 7. Schematic potential energy surface as a function of the angle between ring C and ring D plane for model II.
Reaction pathways (black arrows) and quantum yields (black numbers) of PCBa. Time constants are given for both PCB
geometries. PCBb reaction pathways (blue arrows) and quantum yields (blue numbers). Excitation of PCBb (blue arrow)
show small excess energies too low to overcome the barriers efficiently. After PCBa excitation to the S1 state (black arrow)
the hydrogen bond to His290 breaks and His290 moves away, resulting in a potential barrier reduction (red arrow). The
PCBa chromophores are able to rotate counter-clockwise to the twisted transition state with a �90� distortion angle. With a
quantum yield of 29% the forward reaction to lumi-R occurs. Only a small fraction (3%) of the chromophores with PCBb
geometry overcomes the barrier and photoisomerizes to a photoproduct.
014701-9 Yang et al. Struct. Dyn. 1, 014701 (2014)

the stronger the pre-twisting the higher the potential energy and the higher the lumi-R quantum
yield.3,4 Consequently, phytochromes with amino acids blocking the space needed for ring D
rotation, as shown for the Cph1-Y263F mutant,60 or in which ring D is fixed with additional
hydrogen bonds, would exhibit a reduced quantum yield for lumi-R formation. Such observa-
tions have been reported by other groups, thus corroborating our model.27,28,53,57,60
CONCLUSION
In Cph1 phytochrome, Pr photoisomerization and rotation of ring D occurs in the electronic
excited state via a 90� twisted transition state with a time constant of 30 6 5 ps. A sixfold faster
relaxation time constant of 4.7 6 1.4 ps is also present. This would normally lead to a poor quan-
tum yield. However, heterogeneity, that is, two possible chromophore geometries PCBa and
PCBb, leads to two photoreactions with differing efficiencies. We identified PCBa and PCBb geo-
metries with distinct quantum yields of 29% and 3%, respectively. The PCBa and PCBb geome-
tries match the Pr-II and Pr-I geometries determined by NMR studies, respectively.37 PCBa
(Pr-II) has a strongly pre-twisted ring D geometry induced by a hydrogen bond between ring D’s
carbonyl group and His290. The pre-twisting of PCBa (Pr-II) allows a higher potential energy in
the electronic excited state to be reached, permitting potential barriers induced by steric hin-
drance to be overcome. This chromophore geometry exhibits a ninefold higher quantum yield
than PCBb (Pr-I), but a sixfold longer time constant of 30 6 5 ps. The high quantum yield in
combination with a long time constant is very unusual for photoreceptors.
This demonstrates an alternative evolutionary strategy to improve photoreactions. Pre-
twisting of the chromophore by strong steric interactions and hydrogen bonding in the ground
and electronic excited states enhance the photoreaction quantum yield by separating reaction
pathways for differing geometries in the electronic excited state. This mechanism optimizes
yields of slow photoreactions by large structural rearrangements and provides a scaffold for
photoreceptor engineering.
METHODS
Pump and probe pulses were generated using nonlinear optical methods. By difference fre-
quency mixing in various steps, we obtained mid-IR pulses of 200 fs (FWHM) or shorter at a
repetition rate of 1.088 kHz. Simultaneously, laser pulses of 200 fs duration at 660 nm were
generated and used to photoexcite the sample in the absorption maximum of the Pr form, thus
initiating the photoreaction (Fig. 1). Photoselection experiments were performed using focal
pump pulse diameters of 500 lm, sample thicknesses of 50 lm, focal probe pulse diameters of
180 lm, and pump pulse energies of 30 nJ. This results in excitation coefficients of below 3%
and in relative signal strengths in agreement with electronic extinction coefficient of PCB
(�82 000 (Mcm)�1) and extinction coefficient of C¼O stretching vibrations (�2000 (Mcm)�1).
The transient absorption was simultaneously probed by two mid-IR pulses with polarizations
oriented parallel and perpendicular, with respect to the pump pulse polarization at various delay
times.47 Probe pulses were dispersed with an imaging spectrograph and recorded with a 2 � 32
element MCT array detector. We prepared the 13C/15N labeled Cph1D2 phytochrome holopro-
tein (non-labelled PCB chromophore) in 2H2O solution at an optical density of 0.4 optical den-
sity at 660 nm, as described previously.9,41,43,48,51,58,59 Background illumination at wavelengths
longer than 715 nm ensures that the sample remains in the Pr form. The high repetition rate
requires that the sample be moved across the focused laser beams with a Lissajous sample cell
in order to avoid multiple excitation of a specific sample volume. For comparison, the vibra-
tional tdms were determined theoretically at the B3LYP/6-31G(d) level of theory. The struc-
tures of the different chromophores were obtained as described.41
ACKNOWLEDGMENTS
This work was supported by the Deutsche Forschungsgemeinschaft (SFB 1078, TP B3). We
thank MPI-Halle and the Computing Center at the FUB (ZEDAT) for support.
014701-10 Yang et al. Struct. Dyn. 1, 014701 (2014)

1L. O. Essen, J. Mailliet, and J. Hughes, “The structure of a complete phytochrome sensory module in the Pr ground state,”Proc. Natl. Acad. Sci. U.S.A. 105, 14709–14714 (2008).
2N. C. Rockwell, L. Shang, S. S. Martin, and J. C. Lagarias, “Distinct classes of red/far-red photochemistry within the phy-tochrome superfamily,” Proc. Natl. Acad. Sci. U.S.A. 106, 6123–6127 (2009).
3J. R. Wagner, J. S. Brunzelle, K. T. Forest, and R. D. Vierstra, “A light-sensing knot revealed by the structure of thechromophore-binding domain of phytochrome,” Nature 438, 325–331 (2005).
4J. Hughes, “Phytochrome three-dimensional structures and functions,” Biochem. Soc. Trans. 38, 710–716 (2010).5N. C. Rockwell, Y. S. Su, and J. C. Lagarias, “Phytochrome structure and signaling mechanisms,” Annu. Rev. Plant Biol.57, 837–858 (2006).
6N. C. Rockwell and J. C. Lagarias, “The structure of phytochrome: A picture is worth a thousand spectra,” Plant Cell 18,4–14 (2006).
7R. A. Matute, R. Contreras, G. P�erez-H�ernandez, and L. Gonz�alez, “The chromophore structure of the cyanobacterialphytochrome Cph1 as predicted by time-dependent density functional theory,” J. Phys. Chem. B 112, 16253–16256(2008).
8J. J. van Thor, K. L. Ronayne, and M. Towrie, “Formation of the early photoproduct Lumi-R of cyanobacterial phyto-chrome Cph1 observed by ultrafast mid-infrared spectroscopy,” J. Am. Chem. Soc. 129, 126–132 (2007).
9J. Hahn, H. M. Strauss, and P. Schmieder, “Heteronuclear NMR investigation on the structure and dynamics of the chro-mophore binding pocket of the cyanobacterial phytochrome Cph1,” J. Am. Chem. Soc. 130, 11170–11178 (2008).
10H. Foerstendorf, C. Benda, W. Gartner, M. Storf, H. Scheer, and F. Siebert, “FTIR studies of phytochrome photoreactionsreveal the C¼O bands of the chromophore: Consequences for its protonation states, conformation, and protein inter-action,” Biochemistry 40, 14952–14959 (2001).
11F. Siebert, R. Grimm, W. Rudiger, G. Schmidt, and H. Scheer, “Infrared-spectroscopy of phytochrome and modelpigments,” Eur. J. Biochem. 194, 921–928 (1990).
12K. Heyne, J. Herbst, D. Stehlik, B. Esteban, T. Lamparter, J. Hughes, and R. Diller, “Ultrafast dynamics of phytochromefrom the cyanobacterium Synechocystis, reconstituted with phycocyanobilin and phycoerythrobilin,” Biophys. J. 82,1004–1016 (2002).
13J. Matysik, P. Hildebrandt, W. Schlamann, S. E. Braslavsky, and K. Schaffner, “Fourier-transform resonance Raman-spectroscopy of intermediates of the phytochrome photocycle,” Biochemistry 34, 10497–10507 (1995).
14V. A. Sineshchekov, “Photobiophysics and photobiochemistry of the heterogeneous phytochrome system,” Bba-Bioenergetics 1228, 125–164 (1995).
15F. Andel, K. C. Hasson, F. Gai, P. A. Anfinrud, and R. A. Mathies, “Femtosecond time-resolved spectroscopy of the pri-mary photochemistry of phytochrome,” Biospectroscopy 3, 421–433 (1997).
16H. Ihee, S. Rajagopal, V. Srajer, R. Pahl, S. Anderson, M. Schmidt, F. Schotte, P. A. Anfinrud, M. Wulff, and K. Moffat,“Visualizing reaction pathways in photoactive yellow protein from nanoseconds to seconds,” Proc. Natl. Acad. Sci.U.S.A. 102, 7145–7150 (2005).
17D. Polli, P. Altoe, O. Weingart, K. M. Spillane, C. Manzoni, D. Brida, G. Tomasello, G. Orlandi, P. Kukura, R. A.Mathies, M. Garavelli, and G. Cerullo, “Conical intersection dynamics of the primary photoisomerization event invision,” Nature 467, 440–443 (2010).
18J. Herbst, K. Heyne, and R. Diller, “Femtosecond infrared spectroscopy of bacteriorhodopsin chromophore isomer-ization,” Science 297, 822–825 (2002).
19K. Heyne, O. F. Mohammed, A. Usman, J. Dreyer, E. T. J. Nibbering, and M. A. Cusanovich, “Structural evolution of thechromophore in the primary stages of trans/cis isomerization in photoactive yellow protein,” J. Am. Chem. Soc. 127,18100–18106 (2005).
20A. Usman, O. F. Mohammed, K. Heyne, J. Dreyer, and E. T. J. Nibbering, “Excited state dynamics of a PYP chromo-phore model system explored with ultrafast infrared spectroscopy,” Chem. Phys. Lett. 401, 157–163 (2005).
21K. Heyne, J. Herbst, B. Dominguez-Herradon, U. Alexiev, and R. Diller, “Reaction control in bacteriorhodopsin: Impactof arg82 and asp85 on the fast retinal isomerization, studied in the second site revertant arg82ala/gly231cys and variouspurple and blue forms of bacteriorhodopsin,” J. Phys. Chem. B 104, 6053–6058 (2000).
22P. Hamm, M. Zurek, T. Roschinger, H. Patzelt, D. Oesterhelt, and W. Zinth, “Femtosecond spectroscopy of the photoiso-merisation of the protonated Schiff base of all-trans retinal,” Chem. Phys. Lett. 263, 613–621 (1996).
23S. Schenkl, F. van Mourik, G. van der Zwan, S. Haacke, and M. Chergui, “Probing the ultrafast charge translocation ofphotoexcited retinal in bacteriorhodopsin,” Science 309, 917–920 (2005).
24Q. Wang, R. W. Schoenlein, L. A. Peteanu, R. A. Mathies, and C. V. Shank, “Vibrationally coherent photochemistry inthe femtosecond primary event of vision,” Science 266, 422–424 (1994).
25J. Dobler, W. Zinth, W. Kaiser, and D. Oesterhelt, “Excited-state reaction dynamics of bacteriorhodopsin studied by fem-tosecond spectroscopy,” Chem. Phys. Lett. 144, 215–220 (1988).
26H. Kandori, Y. Shichida, and T. Yoshizawa, “Photoisomerization in rhodopsin,” Biochemistry-Moscowþ 66, 1197–1209(2001).
27K. C. Toh, E. A. Stojkovic, A. B. Rupenyan, I. H. M. van Stokkum, M. Salumbides, M.-L. Groot, K. Moffat, and J. T. M.Kennis, “Primary reactions of bacteriophytochrome observed with ultrafast mid-infrared spectroscopy,” J. Phys. Chem. A115, 3778–3786 (2011).
28K. C. Toh, E. A. Stojkovic, I. H. M. van Stokkum, K. Moffat, and J. T. M. Kennis, “Proton-transfer and hydrogen-bondinteractions determine fluorescence quantum yield and photochemical efficiency of bacteriophytochrome,” Proc. Natl.Acad. Sci. U.S.A. 107, 9170–9175 (2010).
29J. Dasgupta, R. R. Frontiera, K. C. Taylor, J. C. Lagarias, and R. A. Mathies, “Ultrafast excited-state isomerization inphytochrome revealed by femtosecond stimulated Raman spectroscopy,” Proc. Natl. Acad. Sci. U.S.A. 106, 1784–1789(2009).
30C. Schumann, R. Gross, N. Michael, T. Lamparter, and R. Dilier, “Sub-picosecond mid-infrared spectroscopy of phyto-chrome Agp1 from Agrobacterium tumefaciens,” Chemphyschem 8, 1657–1663 (2007).
31M. G. Muller, I. Lindner, I. Martin, W. Gartner, and A. R. Holzwarth, “Femtosecond kinetics of photoconversion of thehigher plant photoreceptor phytochrome carrying native and modified chromophores,” Biophys. J. 94, 4370–4382 (2008).
014701-11 Yang et al. Struct. Dyn. 1, 014701 (2014)
32A. R. Holzwarth, E. Venuti, S. E. Braslavsky, and K. Schaffner, “The phototransformation process in phytochrome. 1.Ultrafast fluorescence component and kinetic-models for the initial Pr-]Pfr transformation steps in native phytochrome,”Biochim. Biophys. Acta 1140, 59–68 (1992).
33H. Kandori, K. Yoshihara, and S. Tokutomi, “Primary process of phytochrome—Initial step of photomorphogenesis ingreen plants,” J. Am. Chem. Soc. 114, 10958–10959 (1992).
34C. Song, G. Psakis, K. Langlois, J. Mailliet, W. G€artner, J. Hughes, and J. Matysik, “Two ground state isoforms and achromophore D-ring photoflip triggering extensive intramolecular changes in a canonical phytochrome,” Proc. Natl.Acad. Sci. U.S.A. 108, 3842–3847 (2011).
35A. H. Goller, D. Strehlow, and G. Hermann, “The excited-state chemistry of phycocyanobilin: A semiempirical study,”Chemphyschem 6, 1259–1268 (2005).
36M. Bischoff, G. Hermann, S. Rentsch, D. Strehlow, S. Winter, and H. Chosrowjan, “Excited-state processes in phycocya-nobilin studied by femtosecond spectroscopy,” J. Phys. Chem. B 104, 1810–1816 (2000).
37C. Song, T. Rohmer, M. Tiersch, J. Zaanen, J. Hughes, and J. Matysik, “Solid-state NMR spectroscopy to probe photoac-tivation in canonical phytochromes,” Photochem. Photobiol. 89, 259–273 (2013).
38M. Lim, T. A. Jackson, and P. A. Anfinrud, “Binding of CO to myoglobin from a heme pocket docking site to form nearlylinear Fe-C-O,” Science 269, 962–966 (1995).
39T. A. Roelofs, C. H. Lee, and A. R. Holzwarth, “Global target analysis of picosecond chlorophyll fluorescence kineticsfrom pea-chloroplasts—A new approach to the characterization of the primary processes in photosystem-Ii alpha-unitsand beta-units,” Biophys. J. 61, 1147–1163 (1992).
40M. Theisen, M. Linke, M. Kerbs, H. Fidder, A. Madjet Mel, A. Zacarias, and K. Heyne, “Femtosecond polarizationresolved spectroscopy: A tool for determination of the three-dimensional orientation of electronic transition dipolemoments and identification of configurational isomers,” J. Chem. Phys. 131, 124511 (2009).
41See supplementary material at http://dx.doi.org/10.1063/1.4865233 for materials and methods, computational details,PFID analysis, analysis of spectral components, CD spectra, and Lumi-R quantum yield.
42P. Hamm, “Coherent effects in femtosecond infrared-spectroscopy,” Chem. Phys. 200, 415–429 (1995).43K. Wynne and R. M. Hochstrasser, “The theory of ultrafast vibrational spectroscopy,” Chem. Phys. 193, 211–236 (1995).44P. Nuernberger, K. F. Lee, A. Bonvalet, T. Polack, M. H. Vos, A. Alexandrou, and M. Joffre, “Suppression of perturbed
free-induction decay and noise in experimental ultrafast pump-probe data,” Opt. Lett. 34, 3226–3228 (2009).45J. J. van Thor, N. Fisher, and P. R. Rich, “Assignments of the Pfr-Pr FTIR difference spectrum of cyanobacterial phyto-
chrome Cph1 using N-15 and C-13 isotopically labeled phycocyanobilin chromophore,” J. Phys. Chem. B 109,20597–20604 (2005).
46H. Foerstendorf, T. Lamparter, J. Hughes, W. Gartner, and F. Siebert, “The photoreactions of recombinant phytochromefrom the cyanobacterium Synechocystis: A low-temperature UV-Vis and FT-IR spectroscopic study,” Photochem.Photobiol. 71, 655–661 (2000).
47M. Linke, Y. Yang, B. Zienicke, M. A. S. Hammam, T. Von Haimberger, A. Zacarias, K. Inomata, T. Lamparter, and K.Heyne, “Electronic transitions and heterogeneity of the bacteriophytochrome Pr absorption band: An angle balancedpolarization resolved femtosecond VIS pump-IR probe study,” Biophys. J. 105, 1756–1766 (2013).
48M. H. Lim, T. A. Jackson, and P. A. Anfinrud, “Femtosecond near-IR absorbance study of photoexcited myoglobin:Dynamics of electronic and thermal relaxation,” J. Phys. Chem.-US 100, 12043–12051 (1996).
49D. von Stetten, M. Gunther, P. Scheerer, D. H. Murgida, M. A. Mroginski, N. Krauss, T. Lamparter, J. Zhang, D. M.Anstrom, R. D. Vierstra, K. T. Forest, and P. Hildebrandt, “Chromophore heterogeneity and photoconversion in phyto-chrome crystals and solution studied by resonance Raman spectroscopy,” Angew Chem. Int. Ed. Engl. 47, 4753–4755(2008).
50V. Sineshchekov, A. Loskovich, N. Inagaki, and M. Takano, “Two native pools of phytochrome A in monocots:Evidence from fluorescence investigations of phytochrome mutants of rice,” Photochem. Photobiol. 82, 1116–1122(2006).
51M. Roben, J. Hahn, E. Klein, T. Lamparter, G. Psakis, J. Hughes, and P. Schmieder, “NMR spectroscopic investigationof mobility and hydrogen bonding of the chromophore in the binding pocket of phytochrome proteins,” Chemphyschem11, 1248–1257 (2010).
52K. Heyne and T. Rubin, Messvorrichtung und Verfahren zur Untersuchung eines Probegases mittels Infrarot-Absoptionsspektroskopie (H. GmbH, Germany, 2009).
53A. J. Fischer and J. C. Lagarias, “Harnessing phytochrome’s glowing potential,” Proc. Natl. Acad. Sci. U.S.A. 101,17334–17339 (2004).
54K. Heyne, M. Hartmann, and K. Molkenthin, Pulsshaper und Laser mit Pulsshaper (F. U. Berlin, Germany, 2008).55B. Borucki, H. Otto, G. Rottwinkel, J. Hughes, M. P. Heyn, and T. Lamparter, “Mechanism of Cph1 phytochrome assem-
bly from stopped-flow kinetics and circular dichroism,” Biochemistry 42, 13684–13697 (2003).56S. C. Bj€orling, C.-F. Zhang, D. L. Farrens, P. S. Song, and D. S. Kliger, “Time-resolved circular dichroism of native oat
phytochrome photointermediates,” J. Am. Chem. Soc. 114, 4581–4588 (1992).57X. Yang, J. Kuk, and K. Moffat, “Conformational differences between the Pfr and Pr states in Pseudomonas aeruginosa
bacteriophytochrome,” Proc. Natl. Acad. Sci. U.S.A. 106, 15639–15644 (2009).58H. M. Strauss, J. Hughes, and P. Schmieder, “Heteronuclear solution-state NMR studies of the chromophore in cyanobac-
terial phytochrome Cph1,” Biochemistry 44, 8244–8250 (2005).59M. H. Lim, T. A. Jackson, and P. A. Anfinrud, “Modulating carbon monoxide binding affinity and kinetics in myoglobin:
The roles of the distal histidine and the heme pocket docking site,” J. Biol. Inorg. Chem. 2, 531–536 (1997).60J. Mailliet, G. Psakis, K. Feilke, V. Sineshchekov, L.-O. Essen, and J. Hughes, “Spectroscopy and a high-resolution crys-
tal structure of Tyr263 mutants of cyanobacterial phytochrome Cph1,” J. Mol. Biol. 413, 115–127 (2011).
014701-12 Yang et al. Struct. Dyn. 1, 014701 (2014)
Top Related