


Languages
Pages
Legal


.
1
ARMY RESDARCH~ABOIWTORY
Accuracy and Railguns
by Alexander E. Zielinski
ARL-TR-2392 February 2001
. Approved for public release, distribution is unlimited.

r x
The findings in this report are not to be construed as an official Department of the Army position unless so designated by other authorized documents.
Citation of manufacturer’s or trade names does not constitute an official endorsement or approval of the use thereof.
Destroy this report when it is no longer needed. Do not return it to the originator.
Army Research Laboratory Aberdeen Proving Ground, MD 21005-5066
ARL-TR-2392 February 2001
Accuracy and Railguns
Alexander E. Zielinski Weapons and Materials Research Directorate, ARL
.
Annroved for Dublic release: distribution is unlimited.
Abstract
Assessment of accuracy is dominated by a detailed experimental investigation of the launch and flight performance of a launcher and round. This assessment is commonly called a jump test. To evaluate the path of the round as it accelerates down the launcher, exits the barrel, and flies downrange to the target, single-shot firings are conducted. In the most recent test, integrated launch packages (ILPs) were launched at an exit velocity of 1,350 m/s. The test provides for the only set of accuracy data available in the world on EM gun-launched projectiles. The impact data show larger variability in the vertical direction than in the horizontal direction. Results from the jump test indicate that effects of the deviation of the launcher centerline (i.e., straightness) contribute significantly to the target impact dispersion. Substantial linear and angular rates at the muzzle are evident in the vertical direction. The contribution attributable to sabot discard is minimal in either plane.
ii

Table of Contents
List of Figures . . . . . . . . . . . . . . . . . . . . . . . . . . . . . . . . . . . . . . . . . . . . . . . . . . . . . . . . . . . . . . . . . . . . . . . . . . . . . . . . . . . . . . . . . . . . . . . . . . . . . . . . . . . V
1. Introduction . . . . . . . . . . . . . . . . . . . . . . . . . . . . . . . . . . . . . . . . . . . . . . . . . . . . . . . . . . . . . . . . . . . . . . . . . . . . . . . . . . . . . . . . . . . . . . . . . . . . . . . . . . . . . . 1
1.1 Free-Flight Data and Analysis ............................................................................. 2 1.2 Jump ..................................................................................................................... 2 1.3 Linear Rates ......................................................................................................... 3 1.4 Angular Rates ....................................................................................................... 6 1.5 Dispersion ............................................................................................................ 6
2. Technical Issues . . . . . . . . . . . . . . . . . . . . . . . . . . . . . . . . . . . . . . . . . . . . . . . . . . . . . . . . . . . . . . . . . . . . . . . . . . . . . . . . . . . . . . . . . . . . . . . . . . . . . . . . 8
3. Conclusions . . . . . . . . . . . . . . . . . . . . . . . . . . . . . . . . . . . . . . . . . . . . . . . . . . . . . . . . . . . . . . . . . . . . . . . . . . . . . . . . . . . . . . . . . . . . . . . . . . . . . . . . . . ..--- 9
4. References . . . . . . . . . . . . . . . . . . . . . . . . . . . . . . . . . . . . . . . . . . . . . . . . . . . . . . . . . . . . . . . . . . . . . . . . . . . . . . . . . . . . . . . . . . . . . . . . . . . . . . . . . . . . ..f.. 11
Distribution List . . . . . . . . . . . . . . . . . . . . . . . . . . . . . . . . . . . . . . . . . . .._............ . . . . . . . . . . . . . . . . . . . . . . . . . . . . . . . . . . . . . . . . . . . . . . 13
Report Documentation Page . . . . . . . . . . . . . . . . . . . . . . . . . . . . . . . . . . . . . . . . . . . . . . . . . . . . . . . . . . . . . . . . . . . . . . . . . . . . . . . . . . . 17
. . . 111

iv

List of Figures
Figure Paae
1. Jump Diagram . . . . . . . . . . . . . . . . . . . . . . . . . . . . . . . . . . . . . . . . . . . . . . . . . . . . . . . . . . . . . . . . . . . . . . . . . . . . . . .._........................... 3
2. Orthogonal X-ray Images From Shot 12 .................................................................... 4
3. Jump Component Dispersions ................................................................................... 7
4. Target Impact Dispersion as a Function of Launch Velocity ..................................... 7
5. Measurement of the Deviation From the Bore Centerline ......................................... 8
I I.
V

vi
1. Introduction
The earliest documented assessment of accuracy for electromagnetic gun-launched
projectiles occurred in 1997 [l]. The primary objective of the test program, however, was to
verify single-shot performance for the launcher and integrated launch package (ILP). During the
course of testing a developmental approach allowed accuracy to be assessed simply due to the
multitude of data acquired throughout the duration of the program. The initial results indicated
that the largest disturbances were located in the vertical direction (i.e., the rail plane). The
in-bore balloting loads created by the deviation of the bore centerline (i.e., straightness)
contributed significantly to the round to round dispersion. Unfortunately, testing with this
launcher was halted while attempting to demonstrate maximum performance.
In the most recent and most comprehensive jump test, a capacitor bank was used to provide
energy to the cannon caliber electromagnetic launcher [2]. The initial charge voltage was 7.2 kV
and the muzzle switch, used to ensure zero current at projectile exit, was closed at 2.14 ms [3].
The average peak current for the jump test was 615 kA, +2 kA. The average launch velocity
determined from the multistation flash x-ray images was 1,351 m/s, +lO m/s. Other electrical
data acquired during the shot include the breech, launcher, and muzzle voltages. The voltage
data and previous analysis indicate that the rear armature contact transitioned. While transition
certainly plays an important role in ILP performance, the entire accuracy evaluation was
conducted with a transitioned rear contact.
For evaluating launch dynamics, an aim point and intended line of flight (LoF) is essential; it
was established using a boresight. The boresight is inserted in the muzzle end of the launcher
and the crosshair in the eyepiece is marked on the downrange target. However, since the
boresight is referenced to the bore surface, some misalignment and variability can exist because
of the deviations of the bore centerline and surfaces. It was found that the standard deviation for
the horizontal direction is 0.36 mil and 0.42 mil in the vertical direction. (One mil corresponds
to 1 yd of deflection per 1,000 yd of range.) To reference the launcher LoF to the x-rays, a steel
cable was attached at the breech, pulled through the launcher, and suspended over a pulley
I

5-m downrange. The pulley was aligned with the boresight crosshair. The cable, for indicating
LoF, and beads, for referencing the subprojectile center of gravity (cg) location, were
superimposed upon each x-ray. The LoF was corrected for misalignment with the boresight
reading in the x-ray data reduction software.
Yaw cards (cardboard targets) were consistently used to assess the free-flight aerodynamics
of the projectile. Seven yaw cards were placed at measured intervals along the first 40 m of
trajectory. New yaw cards were put up before each shot, and the yaw card located at 40 m was
indicated with the boresight. The length of the subprojectile impact and the angular orientation
relative to a vertical reference line were recorded. The pitch, yaw, and angle of attack (AoA)
could then be determined from geometry. The maximum flight range was 222 m.
1.1 Free-Flight Data and Analysis. The free-flight angular motion of the subprojectile was
measured using the yaw cards placed along the flight path. The measured angular motion was
then fitted to a theoretical model of the yawing motion, which is based on an analytical solution
of the yawing motion of a rolling symmetric missile [l, 41. From the theoretical model, it is
possible to extract information about the aerodynamic performance of the subprojectile and
quantify the disturbances to the subprojectile during the launch and sabot discard. This
establishes the initial conditions for the free-flight angular motion. This information is then used
to evaluate aspects of the transitional ballistics which effect the accuracy and dispersion of the
subprojectile.
1.2 Jump. In this section, the series of six disturbances from shot start to target impact (TI)
are discussed. Jump is a vector, the sum of whose horizontal and vertical components is equal to
the linear deviation from the line of fire produced by forces acting on the ILP. These
displacements are typically expressed in mils. The first component is the pointing angle (PA) of
the muzzle at projectile exit. At the same time, the muzzle experiences a crossing velocity (CV)
that is imposed upon the projectile. The third component is the angular deviation of the
projectile cg motion (CG) relative to the instantaneous bore centerline at projectile exit. The
next component is the net deviation attributable to sabot discard disturbances (SD). The fifth
.
.
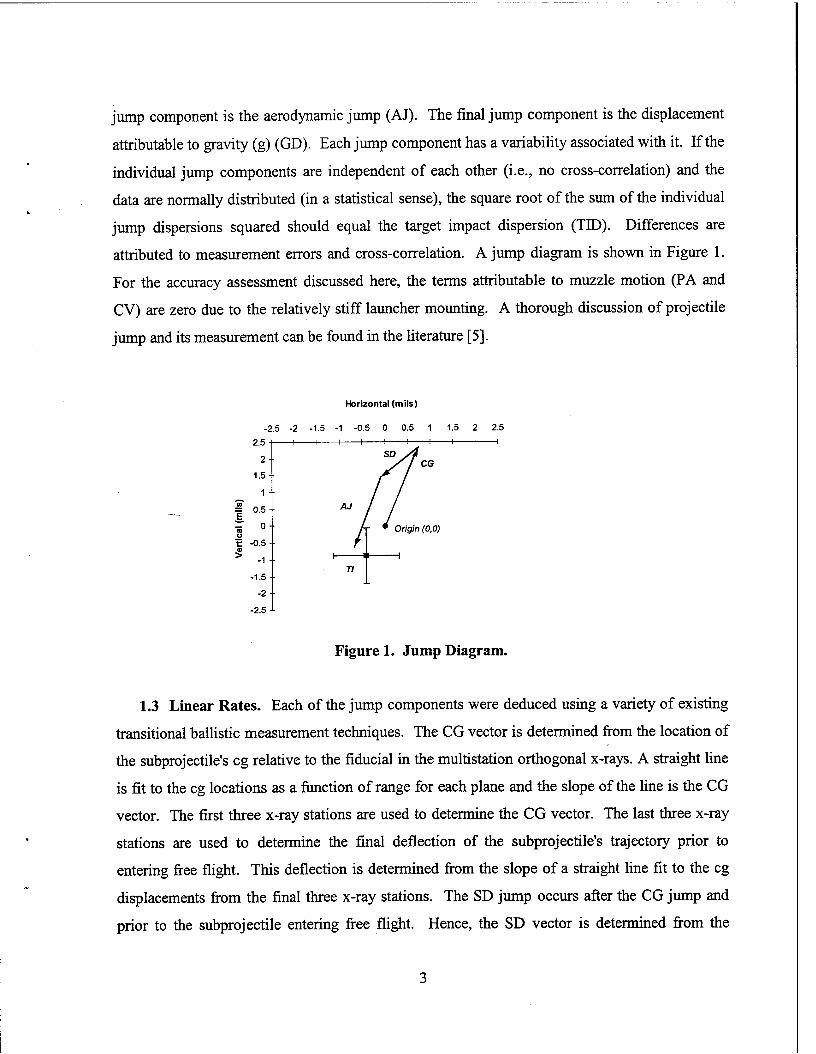
jump component is the aerodynamic jump (AJ). The final jump component is the displacement
attributable to gravity (g) (GD). Each jump component has a variability associated with it. If the
individual jump components are independent of each other (i.e., no cross-correlation) and the
data are normally distributed (in a statistical sense), the square root of the sum of the individual
jump dispersions squared should equal the target impact dispersion (TID). Differences are
attributed to measurement errors and cross-correlation. A jump diagram is shown in Figure 1.
For the accuracy assessment discussed here, the terms attributable to muzzle motion (PA and
CV) are zero due to the relatively stiff launcher mounting. A thorough discussion of projectile
jump and its measurement can be found in the literature [5].
Horizontal (mils)
-2
-2.5 i
Figure 1. Jump Diagram.
1.3 Linear Rates. Each of the jump components were deduced using a variety of existing
transitional ballistic measurement techniques. The CG vector is determined from the location of
.
the subprojectile’s cg relative to the fiducial in the multistation orthogonal x-rays. A straight line
is fit to the cg locations as a function of range for each plane and the slope of the line is the CG
vector. The first three x-ray stations are used to determine the CG vector. The last three x-ray
stations are used to determine the final deflection of the subprojectile’s trajectory prior to
entering free flight. This deflection is determined from the slope of a straight line fit to the cg
displacements from the final three x-ray stations. The SD jump occurs after the CG jump and
prior to the subprojectile entering free flight. Hence, the SD vector is determined from the

difference between the deflection measured from the last three x-rays and the deflection
attributable to the CG vector. An example of the x-ray data for shot 12, with the downrange
distances indicated, is shown in Figure 2.
Figure 2. Orthogonal X-ray Images From Shot 12.
Once the subprojectile enters fieeflight, it is subjected to aerodynamic forces which may
further deflect the flight trajectory of the subprojectile. The deflection due to the aerodynamic
forces can be decomposed into mean and fluctuating components. The mean component is
referred to as aerodynamic jump and it is produced by the angular rates as the round enters free
flight. These rates cause a linear deviation of the mean trajectory from the velocity vector the
projectile has entering freeflight. The yaw card data is used to measure the free-flight angular
rates. A reasonable approximation for AJ in mils [l] is given as
AJ = -1000 WI. ----+Y . n-wll~
The subprojectile moment of inertia (IS, diameter (d), mass (m), and C,, were measured,
whereas Ch was obtained from CFD computations. The angular rate (in rad/m), 6’, was
determined for each plane, 3.1-m downrange (i.e., free flight) from the fits to the yaw card data.
In addition to the mean deflection of the trajectory, the projectile’s swerving motion also has
a fluctuating component, s, produced by the aerodynamic forces associated with the yawing
motion of the round. These deflections are typically small and are usually not considered in a
4

jump test where the yaw card targets are many yaw cycles from the muzzle of the gun. Since the
impact data used to evaluate the jump components in the present evaluation are taken after
approximately ‘one cycle of yawing motion, the fluctuating part of the swerving motion is
included. This term represents an additional displacement for each plane along the trajectory.
The fluctuating part of the swerving motion can be determined by integrating the equations of
motion using the predicted lift coefficient, C ~a, and the measured yawing motion. The resulting
swerving motion is dampened periodically and is accounted for in the jump diagram by
correcting the impact location. Fortuitously, s is close to a minimum at the 40-m yaw card which
then minimizes the impact on the jump diagram.
Finally, GD, which only appears as a vertical displacement, has been computed in mils from
the launch velocity (V) and range (Z) as
GD = lOOO= 2v2 .
(2)
The target impact shown in Figure 1 has been corrected for both the fluctuating part of the
swerving motion and the vertical displacement due to gravity.
Once the jump vector diagram is assembled for each shot, each vector is referenced from the
origin. The variability of the vectors for each component is then computed as the dispersion for
the jump component. It is important to note that the summation of the jump vectors without
cross-correlations should end at the impact location (i.e., closed). However, sources of
measurement error should be accounted for in the analysis. (For example, the impact location is
known relative to the bore centerline to within the variability of the boresight.) It is
unreasonable to hold the impact location as an error-free datum. An error analysis was
conducted on the measured data; the result indicates that for all shots, an average of 4 mm is
needed in the horizontal direction and 15 mm in the vertical direction for the trajectory to be
within the impact location determined by the boresight. Therefore, based on the boresight
variability and x-ray measurement accuracy, the jump diagrams are considered “closed” for each
5

shot, and no additional vectors are added to the existing components to close with the measured
target impact location.
1.4 Angular Rates. The angular rates determined by the first three x-rays are indicative of
the in-bore balloting forces acting on the ILP cg. The angular rates associated with free flight are
also a result of the armature discard event and represent the final angular motion of the round.
The free-flight angular rates are larger in the present jump test than the rates measured in
previous tests [ 11. The average magnitude of the free-flight angular rate is 1.72’/m in the rail
direction and 0.63’/m in the insulator direction. On average, the rates representative of in-bore
balloting contribute 65% ‘toward the free-flight rates. Thus, the dominant factor driving AJ is
due to in-bore balloting. Similar conclusions were reached in a prior experimental effort [ 11.
1.5 Dispersion. In Figure 3, the dispersions for the CG, SD, and AJ jump components are
plotted for the insulator (horizontal) and rail (vertical) directions. The component dispersions are
larger in the rail direction than in the insulator direction. This trend was also observed in
previous work [ 11. However, the dominant contribution in the rail direction is from the
aerodynamic jump, while in the insulator direction it is attributable to in-bore balloting. As
alluded to previously, the rates generated from the launcher contribute significantly to the
dispersion.
The horizontal and vertical TIDs, based on a linear summation of the jump vectors and no
cross-correlation, are 0.62 and 2.07 mils and are quite reasonable compared to the TID measured
at the 40-m yaw card target (0.64 and 2.73 mils). This agreement is encouraging since the
calculations for the jump vectors do not rely on the target impact location data.
The impact data used to determine the TID was obtained 40-m downrange. The impact data
are corrected for the misalignment in the LoF due to boresight errors. Shown in Figure 4 is the
TID as a function of launch velocity. Data from previous work on a similar ILP [l], as well as
that from a similar-caliber, conventionally-launched munition are also included. The dashed
6

4 “[“ ’ , , - , “ , , : , , , , , , _ __ 1”‘: , , , . . . ^ _ . ” , , , , . - , , “ - ~ ” _ - . , , “ , “ , - x ” , , - , . . . , - _ . “ .
.
3.5 .I 1 8 Sabot Discard (SD) 1
3 ‘1 1 flCenterof Gravey(CG)
IIl-XLXX,-t” ,,,,1111 ‘
Rail Direction
Figure 3, Jump Component ~is~e~si~~s.
1200 1400 1600 1800 2000
MuzzleVelocity (rds)
Figure 4. Target Impact Dispersion as a Function of Launch Velocity.
lines are extrapolations of the measured data beyond 1,500 m/s. The TID appears to increase
linearly with velocity at a rate of 1.4 milskrnk. Despite the seemingly linear relationship,
further commentary is not warranted since the prior data used an identical launcher with a
different centerline.
The correlation of launcher straightness with accuracy and dispersion is not new [6, 71. The
angular rates and variability of the CG jump vector suggest that railgun straightness may be

correlated with accuracy and dispersion. The deviation from the bore centerline is measured as a
function of launcher length for the recent assessment and is shown in Figure 5. The vertical
component of the CG vector is in agreement with the trend of the centerline in the rail direction
at the muzzle. All of the ILPs exit the launcher oriented upwards. However, the same
correlation is not evident in the insulator direction. Nonetheless, producing a smoother
centerline will certainly contribute to smaller angular and linear rates.
A :.
: ._.--*s ._---... .’ -. L Up or
Right I
1
2.5 Leff or Down
-. - . . -. . Insulator Direction (Horizontal)
-600 l - Rail Direction (Vertical)
Travel (m)
Figure 5. Measurement of the Deviation From the Bore Centerline.
2. Technical Issues
The linear and angular rates produced by the launcher appear to be the major contributor to
the TID. The dominant linear rate for both planes was produced by the launcher (CG). The
linear rates were effectively managed using a less stiff front armature contact compared to that
measured in previous results [ 11.
The angular rates produced by the launcher contribute significantly toward the free-flight
rates. These rates manifest themselves as a linear displacement in aerodynamic jump (AJ).
These rates are managed in the subprojectile by the pitching moment coefficient. The goal of
further enhancing accuracy is then to balance the contribution of the linear and angular rates
through armature and subprojectile design changes so that the combined contribution toward TID
is minimized. While this trade-off can be accomplished analytically, obtaining a balance
8

depends on the rates generated by the launcher; therefore, it can best be quantified only through
experiments.
The deviation from the bore centerline (i.e., straightness) has been measured on
electromagnetic railguns [g-lo]. However, relatively little has been done to collectively assess,
quantify, and corroborate the causal relationships. Moreover, even less has been done to address
the unique details of railgun centerlines both in terms of manufacturability and accuracy
requirements.
3. Conclusions
Accuracy as related to railguns was assessed in a limited number of tests. The most
significant contributor to dispersion was found to be correlated with in-bore dynamics associated
with the deviation from the bore centerline. It is recommended that this characteristic of the
launcher be addressed with respect to manufacturability, as its origination is unclear. Also, the
possibility of alternate and/or higher accuracy measurement techniques should be explored.
Other contributors to accuracy not previously addressed include a launcher mount in which
the muzzle pointing angle (MP) and crossing velocity (CV) are not zero. The relative effect of
armature contact transition and gouging can be readily assessed in separate experiments. Finally,
multishot dynamics should be addressed along with consequences for extending bore life.
9

10

1.
2.
3.
4.
5.
6.
7.
8.
9.
4. References
Zielinski, A. E., P. Weinacht, D. W. Webb, and K. P. Soencksen. “An Investigation of the Ballistic Performance for an Electromagnetic Gun-Launched Projectile.” ARL-TR-1361, U.S. Army Research Laboratory, Aberdeen Proving Ground, MD, June 1997.
Zielinski, A. E., and M. Werst. “Cannon-Caliber Electromagnetic Launcher.” IEEE Transactions on Magnetics, vol. 33, no. 1, January 1997.
Zielinski, A., and P. Weinacht. “Improved Integrated Launch Package Ballistic Perfomrance.” IEEE Transactions on Magnetics, January 1999.
Murphy, C. H. “Free-Flight Motion of Symmetric Missiles.” BRL-TR-1216, U.S. Army Ballistic Research Laboratory, Aberdeen Proving Ground, MD, July 1963.
Bornstein, J., I. Celmins, P. Plostins, and E. M. Schmidt. “Techniques for the Measurement of Tank Cannon Jump.” BRL-MR-37 15, U.S. Army Ballistic Research Laboratory, Aberdeen Proving Ground, MD, December 1988.
Garner, J., M. Bundy, D. Webb, and B. Patton. “Variation in Muzzle Pointing Angle and Shot- Impact of a M242 Chain Gun.” ARL-TR-785, U.S. Army Research Laboratory, Aberdeen Proving Ground, MD, July 1995.
Bundy, M., and B. Patton. “Variation in Shot Impacts Due to a Controlled Bending of a Gun Tub. “ ARL-TR-1190, U.S. Army Research Laboratory, Aberdeen Proving Ground, MD, September 1996.
Burton, L. “A Comparison of In-Bore Projectile Motion From an Electromagnetic Railgun vs. That of a Conventional Cannon Barrel.” ARL-TR-295, U.S. Army Research Laboratory, Aberdeen Proving Ground, MD, October 1993.
Burton, L. “In-Bore Dynamic Response Analysis of a SLEKE I Projectile Fired From the Single Shot Gun (SSG) Railgun.” ARL-TR-470, U.S. Army Research Laboratory, Aberdeen Proving Ground, MD, July 1994.
10. Burton, L. “A RASCAL In-Bore Dynamic Analysis of the Task B and Task C Electromagnetic Railguns.” ARL-TR-726, U.S. Army Research Laboratory, Aberdeen Proving Ground, MD, April 1995.
11

12
NO. OF COPIES
2
1
1
1
ORGANIZATION
DEFENSE TECHNICAL INFORMATION CENTER DTIC DDA 8725 JOHN J KINGMAN RD STE 0944 FT BELVOIR VA 22060-62 18
HQDA DAM0 FDT 400 ARMY PENTAGON WASHINGTON DC 203 1 O-0460
OSD OUSD(A&T)/ODDDR&E(R) RJTREW THE PENTAGON WASHINGTON DC 20301-7100
DPTY CG FOR RDA US ARMY MATERIEL CMD AMCRDA 5001 EISENHOWER AVE ALEXANDRIA VA 22333-0001
INST FOR ADVNCD TCHNLGY THE UNIV OF TEXAS AT AUSTIN PO BOX 202797 AUSTIN TX 78720-2797
DARPA B KASPAR 370 1 N FAIRFAX DR ARLINGTON VA 22203-1714
US MILITARY ACADEMY MATH SC1 CTR GF EXCELLENCE MADN MATH MAJ HUBER THAYER HALL WEST POINT NY 10996-1786
DIRECTOR US ARMY RESEARCH LAB AMSRL D D R SMITH 2800 POWDER MILL RD ADELPHI MD 20783-l 197
NO. OF COPIES
1
13
ORGANIZATION
DIRECTOR US ARMY RESEARCH LAB AMSRL DD 2800 POWDER MILL RD ADELPHI MD 20783-l 197
DIRECTOR US ARMY RESEARCH LAB AMSRL CI AI R (RECORDS MGMT) 2800 POWDER MILL RD ADELPHI MD 20783-l 145
DIRECTOR US ARMY RESEARCH LAB AMSRL CI LL 2800 POWDER MILL RD ADELPHI MD 20783-l 145
DIRECTOR US ARMY RESEARCH LAB AMSRL CI AP 2800 POWDER MILL RD ADELPHI MD 20783-l 197
ABERDEEN PROVING GROUND
DIR USARL AMSRL CI LP (BLDG 305)

NO. OF COPIES
1
2
1
3
4
ORGANIZATION
DIR FOR THE DIRECTORATE OF FORCE DEVELOPMENT US ARMY ARMOR CENTER COL E BRYLA FT KNOX KY 4012 I-5000
US ARMY MATERIAL COMMAND AMC DCG T 5001 EISENHOWER BLVD ALEXANDRIA VA 22333-0001
US ARMY MISSLE COMMAND AMSMI RD DR MCCORKLE REDSTONE ARSENAL AL 35898-5240
US ARMY TACOM TARDEC J CHAPIN M TOURNER AMSTA TR D MS 207 WARREN MI 48397-5000
US ARMY TACOM ARDEC J BENNETT FSAE GCSS TMA BLDG 354 PICATINNY ARSENAL NJ 07806-5000
INST FOR ADVANCED TECH UNIV OF TEXAS AT AUSTIN P SULLIVAN F STEPHANI T WATT 4030 2 WEST BRAKER LANE AUSTIN TX 78759-5329
UNIV OF TEXAS AT AUSTIN CENTER FOR ELECT A WALLS J KITZMILLER S PRATAP J PAPPAS PRC MAIL CODE R7000 AUSTIN TX 78712
NO. OF COPIES ORGANIZATION
LOCKHEED MARTIN VOUGHT LFARRISMSWT21 KCOOKMSWT21 PO BOX 650003 DALLAS TX 752650003
INST FOR DEFENSE ANALYSIS I KOHLBERG 1801 N BEAUREGARD ST ALEXANDRIA VA 223 11
KAMAN ELECTROMAGNETICS CORP P MONGEAU 2FOXRD HUDSON MA, 0 1749
UNIV AT BUFFALO SUNY AB J SARJEANT PO BOX 601900 BUFFALO NY 14260-1900
UDLP B GOODELL R JOHNSON MS Ml70 4800 EAST RIVER RD MINNEAPOLIS MN 55421-1498
UNIV OF TEXAS AT AUSTIN M DRIGA ENS 434 DEPT OF ECE MAIL CODE 60803 AUSTIN TX 78712
SAIC G CHRYSSOMALLIS 3800 WEST 80TH ST SUITE 1090 BLOOMINGTON MN 55431
SAIC J BATTEH 4901 OLDE TOW-NE PARKWAY SUITE 200 MARIETTA GA 30068
14

NO. OF COPIES ORGANIZATION
1 SAIC K A JAMISON 1247 B N EGLIN PKWY SHALIMAR FL 32579
2 IAP RESEARCH INC D BAUER J BARBER 2763 CULVER AVE DAYTON OH 45429-3723
3 MAXWELL TECHNOLOGIES P REIDY T WOLFE 9244 BALBOA AVENUE SAN DIEGO CA 92 123
1 NORTH CAROLINA STATE UNIV M BOURHAM DEPT OF NUCLEAR ENGR BOX 7909 RALEIGH NC 276957909
1 MAXWELL PHYSICS INTERNATIONAL C GILMAN 2700 MERCED STREET PO BOX 5010 SAN LEANDRO CA 94577-0599
1 ATA ASSOCIATES W ISBELL PO BOX 6570 SANTA BARBARA CA 93 160-6570
15
NO. OF COPIES ORGANIZATION
ABERDEEN PROVING GROUND
21 DIR USARL AMSRL WM
E SCHMIDT A TANNER
AMSRL B A HORST
AMSRL WM TE J POWELL
AMSRLWMB B FORCH
AMSRL WM BA D LYON
AMSRL WM BC P PLOSTINS J GARNER v OSKAY M BUNDY G COOPER JSAHU P WEINACHT H EDGE B GUIDOS A ZIELINSKI D WEBB K SOENCKSEN S WILKERSON T ERLINE J NEWILL

16

REPORT DOCUMENTATION PAGE Form Approved OMB No. 0704-0188
ublic reporting burden for this collection of information is estimated to average 1 hour per response, including the time for reviewing in~t~~fions, +earching existing data SOWCBS, athering and mintalning the data needed. and completing and rwiswing the collection of information. Send c~mmnfs regatiing fhis burden estimate or any other aspect of this ,Ilenion of informaffon. including suggestions for reducing this burden. lo Washington Headquarfeters Services, DireCtOrate for lnfonmfion Operations and Reports, 1215 .kffeMn avls Highway. Suite 1204. Arhtion. VA Z202-4302. and to the Office of Management and gudoef. Pawwor* Rsducfion Proiedfg7M-@f88~. Washington. DC 2054%
. AGENCY USE ONLY (Leave blank) 2. REPORT DATE 3. REPORT TYPE AND DATES COVERED
February 2001 Final, Jan 00 - June 00 . TITLE AND SUBTITLE 5. FUNDING NUMBERS
&uracy and Railguns lL1622618AH80
8. AUTHOR(S)
Uexander E. Zielinski
. PERFORMING ORGANIZATION NAME(S) AND ADDRESS 8. PERFORMING ORGANIZATION
J.S. Army Research Laboratory REPORT NUMBER
IT-l-N: AMSRL-WM-BC ARL-TR-2392 Aberdeen Proving Ground, MD 21005-5069
I. SPONSORING/MONITORING AGENCY NAMES(S) AND ADDRESS 10.SPONSORINGIMONITORlNG AGENCY REPORT NUMBER
1. SUPPLEMENTARY NOTES
2a. DlSTRlBUTlON/AVAlL4BlLlM STATEMENT 12b. DISTRIBUTION CODE
ipproved for public release; distribution is unlimited.
3. ABSTRACT(Maximum 200 words)
Assessment of accuracy is dominated by a detailed experimental investigation of the launch and flight performance o t launcher and round. This assessment is commonly called a jump test. To evaluate the path of the round as i accelerates down the launcher, exits the barrel, and flies downrange to the target, single-shot firings are conducted. II he most recent test, integrated launch packages (ILPs) were launched at an exit velocity of 1,350 m/s. The test provide: :or the only set of accuracy data available in the world on EM gun-launched projectiles. The impact data show large rariability in the vertical direction than in the horizontal direction. Results from the jump test indicate that effects of the deviation of the launcher centerline (i.e., straightness) contribute significantly to the target impact dispersion. Substantia inear and angular rates at the muzzle are evident in the vertical direction. The contribution attributable to sabot discarc s minimal in either plane.
14. SUBJECT TERMS 15. NUMBER OF PAGES
:ailguq accuracy, jump test, straightness, centerline 18 18. PRICE CODE
17. SECURITY CLASSIFICATION 18. SECURllY CLASSIFICATION 19. SECURITY CLASSIFICATION 20. LIMITATION OF ABSTRACT OF REPORT OF THIS PAGE OF ABSTRACT
UNCLASSIFIED UNCLASSIFIED UNCLASSIFIED UL NSN 7540-01-280-5500
17 Standard Form 298 (Rev. 2-89) Prescribed by ANSI Std. 239-18 298-102

18

USER EVALUATION SHEET/CHANGE OF ADDRESS
This Laboratory undertakes a continuing effort to improve the quality of the reports it publishes. Your comments/answers to the items/questions below will aid us in our efforts.
1. ARL Report Number/Author ARL-TR-2392 (Zielinski) Date of Report Pebmary 2001
2. Date Report Received
3. Does this report satisfy a need? (Comment on purpose, related project, or other area of interest for which the report will be
used.)
4. Specifically, how is the report being used? (Information source, design data, procedure, source of ideas, etc.)
5. Has the information in this report led to any quantitative savings as far as man-hours or dollars saved, operating costs avoided, or efficiencies achieved, etc? If so, please elaborate.
6. General Comments. What do you think should be changed to improve future reports? (Indicate changes to organization, technical content, format, etc.)
Organization
CURRENT ADDRESS
Name
Street or P.O. Box No.
E-mail Name
City, State, Zip Code
7. If indicating a Change of Address or Address Correction, please provide the Current or Correct address above and the Old or
Incorrect address below.
OLD ADDRESS
Organization
Name
Street or P.O. Box No.
City, State, Zip Code
(Remove this sheet, fold as indicated, tape closed, and mail.) (DO NOT STAPLE)
Top Related