


Languages
Pages
Legal

Accessibility: introduction, perspectives and applications
Prof. dr. Karst Geurs Center for Transport Studies, University of Twente, the Netherlands

2
Contents
1. Different perspectives to measuring accessibility
2. A review of different approaches to measuring accessibility Theoretical and practical strengths and weaknesses Usability in economic and social evaluations
3. Conclusions
3
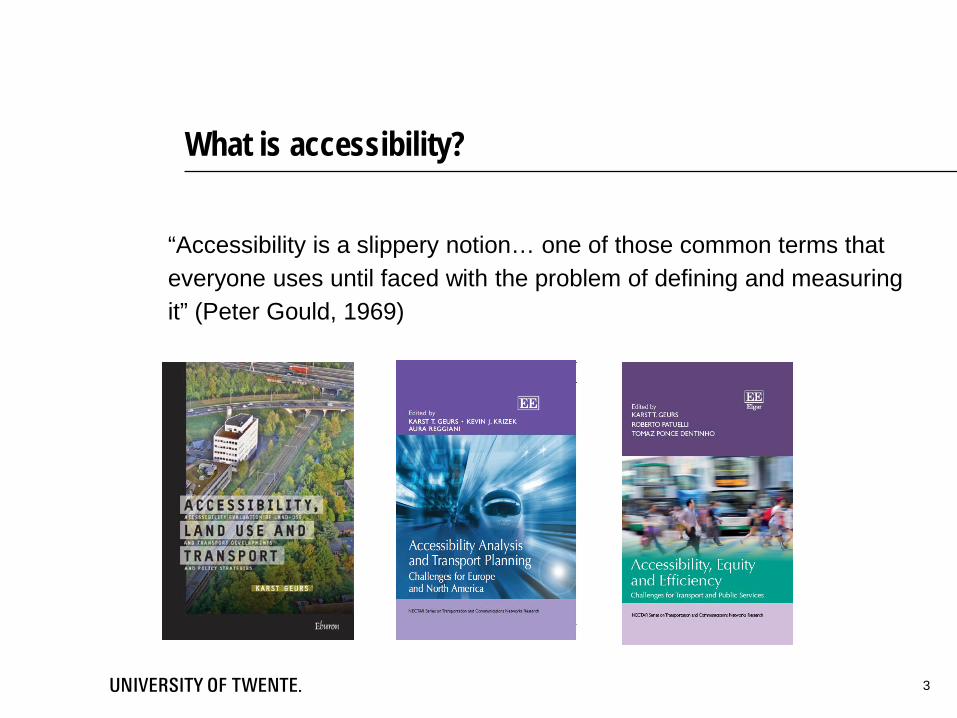
What is accessibility?
“Accessibility is a slippery notion… one of those common terms that everyone uses until faced with the problem of defining and measuring it” (Peter Gould, 1969)

4

5
Definition of accessibility: (Geurs, K.T., van Wee, B., 2004. Accessibility evaluation of land-use and transport strategies: review and research directions. Journal of Transport geography 12, 127-140)
Accessibility is an indicator for the impact of land-use and transport developments and policy plans on the functioning of the society in general.
Fundamentally, it should relate to the role of transport in society; to provide individuals the opportunity to participate in activities in different locations.
Definition (passenger travel) “the extent to which land-use and transport systems enable (groups of) individuals to reach activities or destinations by means of a (combination of) transport mode(s) (at various times of the day)”.

Land use (activity
locations)
Individual needs,
abilities, opportunties
Transport (time, cost,
effort)
Temporal constraints
and dynamics
Accessibility
(Geurs, K.T., van Wee, B., 2004. Accessibility evaluation of land-use and transport strategies: review and research directions. Journal of Transport geography 12, 127-140)
Four components of accessibility (Geurs, K.T., van Wee, B., 2004. Accessibility evaluation of land-use and transport strategies: review and research directions. Journal of Transport geography 12, 127-140)

7
Four main perspectives on accessibility
1. Infrastructure-based measures (transport planner’s perspective)
2. Location-based measures (urban planner’s perspective)
3. Person-based measures (time-space geography)
4. Utility-based measures (economist’s perspective)

8
Choice and operationalisation of accessibility measures depend on:
1. Study goal
2. Theoretical strenghts and weaknesses: treatment of different components and elements within these components.
3. Practical strengths and weaknesses Applicability/operationalisation (e.g., data availability, models) Interpretability /communicability (for researchers and
practitioners)
4. Usability in economic evaluations
5. Usability in social evaluations
9
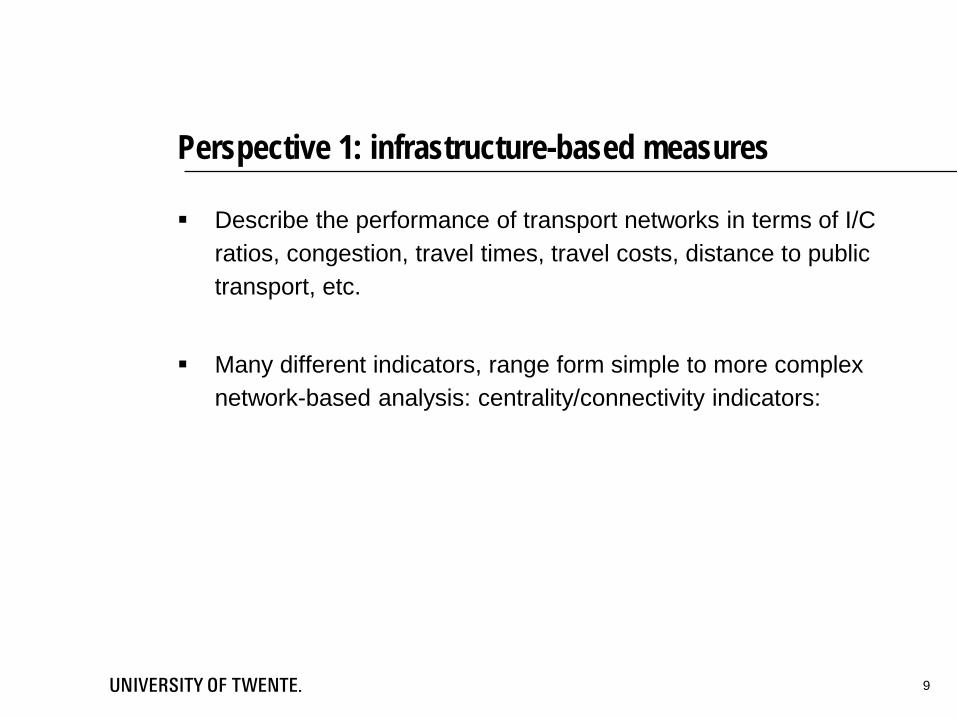
Perspective 1: infrastructure-based measures
Describe the performance of transport networks in terms of I/C ratios, congestion, travel times, travel costs, distance to public transport, etc.
Many different indicators, range form simple to more complex network-based analysis: centrality/connectivity indicators:

Accessibility measures in Dutch national transport policy
10
Policy document Indicator
First Transport Structure Plan (‘SVV1’; 1979)
Level-of-service (motorways)
Second Transport Structure Plan (‘SVV2’; 1990)
Detour factor (motorways) Congestion probability (motorways) Distance to access road (motorways) Capacity (motorways) Relative travel time (car/public transport) Speed (rail) Number of delayed trains (rail)
Mobility Policy Document (‘Nota Mobiliteit’, 2004)
Relative travel time between peak/off peak hours (motorways) Travel time reliability (motorways) Vehicle-hours lost (motorways) Punctuality (rail)
National Policy Strategy for Infrastructure and Environment (‘SVIR’; 2012)
Relative travel time between peak/off peak hours (motorways) Generalised transport cost
Geurs, K.T., D. Halden (2015). Accessibility Analysis and Transport Policy in the Netherlands and the UK. An International Handbook on Transport and Development, R. Hickman et al, eds., Edward Elgar, 459-475.
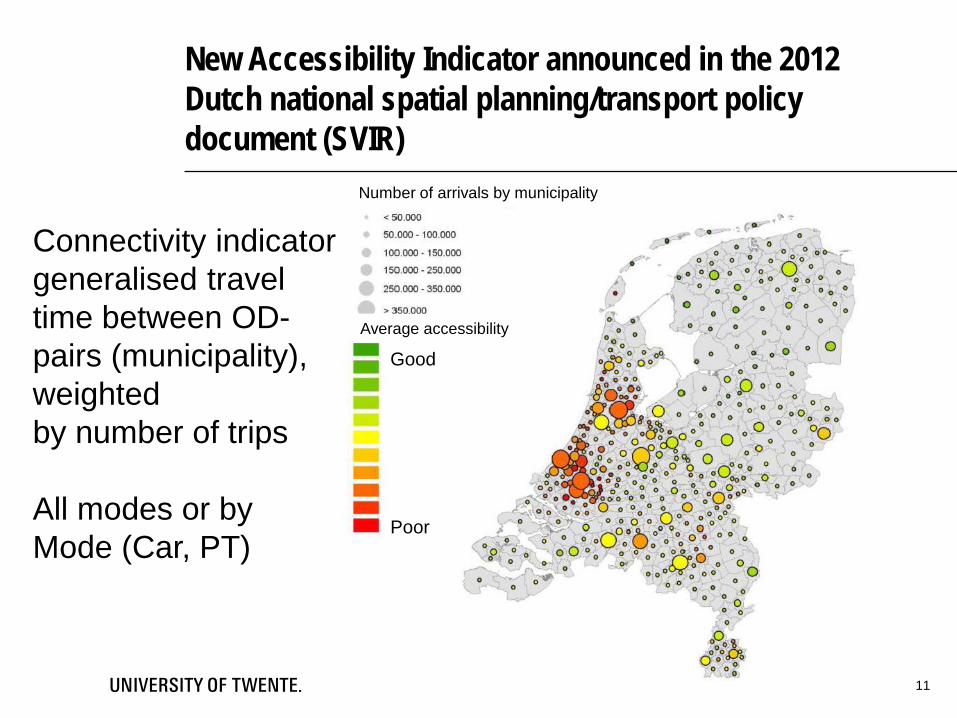
New Accessibility Indicator announced in the 2012 Dutch national spatial planning/transport policy document (SVIR)
11
Connectivity indicator generalised travel time between OD- pairs (municipality), weighted by number of trips All modes or by Mode (Car, PT)
Good
Poor
Average accessibility
Number of arrivals by municipality

12
Infrastructure-based measures
Theoretical strengths/weaknesses Excludes land use and individual components. A partial
measure of accessibility
Practical strengths/weaknesses: Easy to understand and communicate, easy to operationalise
(standard output of transport models), Link to transport policy goals; Standard input for economic appraisal of transport investments

Limitations to accessibility goals and measures in the Dutch transport policy and planning practice
Limitation 1: A sectoral policy approach Limitation 2: A Lack of attention for interactions between transport
and land use. Limitation 3: The treatment of the transport component Limitation 4: A lack of attention for measuring urban accessibility
(including walking and cycling). Limitation 5: Lack of attention for equity/distributional and justice
effects.
(There are some exceptions at the regional level)
13

14
Perspective 2: location-based accessibility measures
Threshold-based measures (travel time isochrones, cumulative opportunities/contour measures)
Potential accessibility Potential accessibility including competition effects

15
Threshold based accessibility measures (Cumulative opportunities/contour measure)
Impedance
Trip likelihood
0
1

16
Time isochrone/cumulative opportunities: UT, car, morning peak hour, 2008 Interactive website ‘national accessibility map’ (www.bereikbaarheidskaart.nl)

17
Threshold-based accessibility measures
Theoretical strenghts/weaknesses Land use component included in aggregate way Arbitrary choice of maximum travel time Assumes all activies are equally important -> weak link with
travel behaviour Standard measure does not include mismatch between demand
and supply of opportunities
Practical strenghts/weaknesses: Easy to compute (e.g. using GIS), does not require transport
models (thus popular among urban planners/geographers) Easy to communicate (absolute values)

18
Potential accessibility measure Hansen, W.G., 1959. How accessibility shapes land use. Journal of American Institute of Planners 25, pp. 73-76
∑=
−=n
j
cji
ijeDA1
β

19
MORE INFO: HTTPS://WWW.ASTRIDROJECT.COM/

Monday Amsterdam
2013/2014 TomTom data
Free flow Moderate Slow Stop and Go
DATA DESCRIPTION
20
• Growing abundance of detailed spatial data and real-time transport datasets provides many opportunities for improved accessibility modelling
• TOMTOM™ Speed Profile Data (2014)
• General Transit Feed Specification data (GTFS)
• Door-to-Door Approach

Land use component: jobs and workers at high spatial resolution (NL PC5);
Transport component: door to door approach to measuring travel times by car, bike-and-ride, walk-and-ride, bike
Temporal dynamics: Navigation data, GTFS data Individual component: Job matching by job skills and sector (in NL),
based on micro data Detailed survey conducted in NL (Randstad),
London, Sao Paulo on perceptions/barriers to accessibility, housing market, pollution
21
POTENTIAL JOB ACCESSIBILITY ANALYSIS

22
JOB ACCESSIBILITY BY CAR CITY COMPARISON OF DAILY CAR ACCESSIBILITY FLUCTUATIONS

23
JOB ACCESSIBILITY BY PT CITY COMPARISON OF PT ACCESSIBILITY FLUCTUATIONS

24
JOB ACCESSIBILITY – WALK AND RIDE ZUID HOLLAND (PC5) – PT ACCESSIBILITY VARIABILITY ACROSS THE DAY

25
JOB ACCESSIBILITY – BIKE AND RIDE ZUID HOLLAND (PC5) – PT ACCESSIBILITY VARIABILITY ACROSS THE DAY

26
Advanced location-based measures: potential accessibility with competition.
Joseph, A.E., Bantock, P.R., 1982. Measuring potential physical accessibility to general practitioners in rural areas: a method and case study. Social science and Medicine 16, 85-90.
∑∑=
=
=n
jijm
kjkk
ji dF
dFP
GPA
1
1
)()(

27
Inverse balancing factors of the doubly constrained spatial interaction model
∑=
−=n
j
cj
ji
ijeDb
a1
1 β
Tij = ai bj F(cij)

28
Geurs, K.T., Eck, J.R. Ritsema van, 2001. Urbanisation, accessibility and the environment (in Dutch). RIVM, Bilthoven. Geurs, K.T., Eck, J.R. Ritsema van, 2003. Accessibility evaluation of land-use scenarios: the impact of job competition, land-use and infrastructure developments for the Netherlands. Environment and Planning B: Planning & design 30, 69 - 87.
Job accessibility by car
Balancing factor Job potential
South west North east
Balancing factor Job potential
South west North east
Job accessibility by public transport

29
Location-based measures – Potential Accessibility
Theoretical strengths/weaknesses Rooted in Spatial Interaction Modelling; entropy-maximizing SIM
and MN logit model are compatible Includes land-use component; applicable in transport, land-use and
integrated land-use/transport policy appraisal Individual component: lacks heterogeneity in needs, preferences Standard PA does not include competition effects
Practical strengths/weaknesses: Easy to measure (e.g. GIS; SIM (thus popular among urban
planners and geographers) Standard PA easy to interpret; PA with competition less easy Measure itself has no meaning in terms of costs or benefits or
activity values

30
Perspective 3: “Person-based” measures
• Analysis of accessibility at the individual level
• Time-Space Geography
• Accessibility strongly depends on individual constraints (activity scheduling), temporal constraints (opening hours of shops), spatial contraints (travel budget)
• Space-time prisms (STP) and Daily Potential Path Area (DPPA):
Neutens, T., M. Delafontaine, D. M. Scott, P. De Maeyer (2012). An analysis of day-to-day variations in individual space-time accessibility. Journal of Transport Geography, 23, 81-91.

31
Person-based accessibility measures
Theoretical strengths/weaknesses Comprehensive measure of accessibility, Addresses all components of accessibility (transport typically
in simplified way) Capture interpersonal differences Hybrid utility-/person-based measures applied in the literature Does not include competition effects
Practical strengths/weaknesses Data need Complexity ; difficult to operationalise and aggregate Difficult to visualise and communicate

32
Perspective 4: Utility-based measures
Benefits that people derive from access to spatially distributed activities
Accessibility benefit measures based on doubly constrained spatial interaction model (Martinez, 1995; Martinez and Araya, 2000)
Logsum accessibility benefit measures based on MNL model
(Ben-Akiva and Lerman, 1985)

Logsum measure of accessibility benefits
The log of the denominator of the multinomial logit model Logsum considers the expected utilities of all alternatives in the
choice set of each traveller Exact measure of user benefits. Calculated in money terms,
multiplying the logsum by the inverse of the marginal utility of income (time or cost variable in utility function)).
∑=
j
V
V
nj nj
nj
eeP
MN logit model:

34
Example: using the logsum in an economic appraisal of a new railway link between Amsterdam and Almere, using a LUTI model
Redistribution of opportunities can result in substantial
accessibility benefits
Spatial planning affects efficiency of rail infrastructure projects
Logsum measure of accessibility benefits gives substantially higher benefits than conventional rule-of-half (includes destination utility). Important even with small distributional effects
(Geurs, K., Bok, M. de, Zondag, B., 2012. Accessibility benefits of integrated land use and public transport policy
plans in the Netherlands, In: Geurs, K.T., Krizek, K., Reggiani, A. (Eds.), Accessibility Analysis and Transport
Planning: Challenges for Europe and North America. Edward Elgar, Northampton, USA, pp. 189-216).

35
Logsum – theoretical strengths and weaknesses
Closed form expression founded in discrete choice theory Flexible; variety of attributes of the alternatives that it can
encapsulated within a single term (incl. latent variables) MNL properties: no natural constraints to the choice set; does not
account for unobserved taste variations Only utility of the choices made is counted. Stochastic element
represents uncertainty due to imperfect knowledge of the analyst, not the traveler. -> option value literature suggest that people might value options that they have available (in this case: options to reach destinations, use modes or maybe even routes)
Expected utility may differ from experienced utility

Logsum – practical strengths and weaknesses
More difficult to operationalise - > discrete choice model model is needed (but simple if present)
Method is relatively difficult to communicate to non-experts Useful to analyse changes in utility/monetary, does not represent
absolute levels of accessibility Visualisation is more difficult; logsums per transport mode or
zone cannot easily be calculated, since modes and zones are endogenous choice variables (can be estimated by proxy)
Outputs in monetary terms are easily communicated
36

Comparative studies
Different location-based accessibility metrics often work together to explain trip making at the aggregate or disaggregate level
Location-based and person-based measures are distinctive accessibility measures which reflect different dimensions of accessibility, i.e. space-time measures are more capable of capturing interpersonal differences (Kwan, 1998)
Substantial differences are found within the group of person-based measures (Neutens et al.)
37

Usability in economic evaluations
Logsum!
38
Usability in social evaluations (e.g., Van Wee and Geurs (2011); Lucas et al., 2016).
Distributional analysis goes back to 1970s: examine spatio- temporal inequalities in accessibility; input for e.g. Gini-index
Equity-based accessibility analysis: what is ‘fair’ or ‘unfair’ Utilitarian approach; choices of travellers are based on
willingness to pay (WPT) for travel options; not appropriate when there is specific aim to achieve greater equity from an investment.
Egalitarianism: all people should be treated equally (Sen, 1992). Egalitarian theories focus on relative differences in levels of well-being
Sufficientarianism: everybody should be well off up to a certain threshold -> a ‘sufficient’ level of accessibility. Focus is on an absolute level of well-being.
39

Equity-based accessibility analysis (1)
A growing field of research, but needs more work!
A balanced treatment of the four components of accessibility is important: infrastructure-based measures are not appropriate
Treatment of competition effects needs more attention in analysing equity-based accessibility (health access, education, etc.): a ‘sufficient’ level of access depends on competitors.
Monetising accessibility is problematic. WTP of low income people for (additional) travel is inherently low, which makes the valuation of the accessibility increases low.
40

Equity-based accessibility analysis (2)
Person-based and utility-based measures focus on interpersonal differences which is problematic from the ethical perspectives of egalitarianism and sufficientarianism
Standard and adapted location-based measures are more appropriate than logsum and arguably time-space measures.
A main challenge to set threshold values for a sufficientarianism index – what are ‘sufficient’ for accessibility levels to guarantee continued wellbeing. There is very little literature on this and this is an area which needs more research. Life satisfaction decreases with commuting distance, and increase
when the commute is by bike or foot (Lancée et al, 2017)
41

42
Conclusions:
There is a trade off between theoretical and practical strengths and weaknesses
The definition and operationalisation (choice of perspective and treatment of the 4 components) strongly affects the conclusions
Choice of accessibility measure depends on study aim, trade-off between theoretical and practical strengths/weaknesses
The Dutch practice focuses on infrastructure-based accessibility analysis, limiting accessibility to a sectoral approach

43
Conclusions:
Typically a combination accessibility measures works better, reflecting different dimensions of accessibility
Location-based measures are more appropriate as egalitarianism and sufficientarianism indexes than logsum and arguably also time-space measures.
There is very little literature on operationalizing accessibility-based sufficientarianism indices

College
44
Top Related