

![ATEX style emulateapj v. 5/2/11 - arXiv · 2019-01-05 · arXiv:1511.08679v3 [astro-ph.EP] 28 Feb 2016 Submittedfor publicationin the Astrophysical Journal Preprint typeset using](https://static.fdocuments.in/doc/165x107/5f6f1ae3d4a3823a2324c553/atex-style-emulateapj-v-5211-arxiv-2019-01-05-arxiv151108679v3-astro-phep.jpg)


Languages
Pages
Legal


University of Surrey
The use of a CFBG sensor for detecting damage in composite laminates and
adhesively bonded joints
JAYANTHI PALANLATPAN
A thesis submittedfor the Degree ofDoctor ofPhilosophy
University of Surrey
January 2008

Abstract Reliable in-situ damage detection techniques which can determine the existence and location of damage in composite materials and structures are critical for the effective use
of these materials. In this work, embedded chirped fibre Bragg grating (CFBG) sensors have been shown to be successful for both detection and location of matrix cracks in
composite laminates and disbond detection in bonded composite joints. In all the cases, the CFBG reflection spectra were predicted using commercial soffivare and agreed well
with the experimental results.
In the matrix cracking work, single matrix cracks in cross-ply GFRP (glass fibre
reinforced plastic) laminates were detected and located using a CFBG sensor embedded
within the 0' plies, near the 0190 interface. The CFBG sensor showed an approximately
sinusoidal variation of the intensity of the reflected spectrum at the position of the crack,
enabling both crack development and crack position to be identified. It was shown that
the precise position of the cracks does not correspond with the bottom of a dip in the
reflected spectrum, as has previously been thought.
Disbond initiation and progression from either end of a composite bonded joint was
monitored by embedding the CFBG sensor in one of the GFRP adherends, with the low
wavelength end of the sensor positioned at the cut end of the adherend. A shift in the low
wavelength end of the spectrum to lower wavelengths indicated disbond initiation and
movement of a perturbation in the reflected spectrum towards higher wavelengths indicated disbond propagation. In a related fashion, disbond initiation and propagation
was detected from the high-wavelength end of the spectrum (adjacent to the other cut end
of the adherend). With the aid of a parametric study based on a closed-fon-n solution for
the strain field in the bonded joint (available in the literature), it has been shown that the
sensitivity of the CFBG sensor in detecting the disbond depends mainly on the position of the sensor within the adherend and the strain distribution in the adherend. Finally,
artificial manufacturing defects were introduced into GFRP-GFRP bonded joints using Teflon inserts and it has been demonstrated that the location of the defects is possible
using the CFBG technique.

Author's Publications
Palaniappan J, Wang H, Ogin S L, Thorne A M, Reed G T, Tjin SC and McCartney L N, "Prediction of the reflected spectra from chirped fibre Bragg gratings
embedded within cracked crossply laminates", Measurenient Science and Technology,
17,2006,1-6.
Palaniappan J, Wang H, Ogin S L, Thorne A M, Reed G T, Crocombe AD and Tjin S C, "Structural health monitoring of bonded composite joints using embedded
chirped fibre Bragg gratings", Advanced Composite letters, 14/6,2005,185-192
Palaniappan J, Wang H, Ogin S L, Thorne A M, Reed G T, Crocombe A D, Rech Y
and Tjin S C, "Changes in the reflected spectra of embedded chirped fibre Bragg
gratings used to monitor disbonding in bonded composite joints", Composites Science
and Technology, 67/13,2007,2847-2853
Palaniappan J, Ogin S L, Thorne A M, Reed G T, Crocombe A D, Capell T F, Tjin S
C and Mohanty L, "Disbond growth detection in composite-composite single-lap joints
using chirped FBG sensors", article in press, corrected proof, Composite Science and Technology, available online 2007
Capell T F, Palaniappan J, Ogin S L, Crocombe A D, Reed G T, Thorne A M,
Mobanty L and Tjin S C, "The use of an embedded chirped fibre Bragg grating sensor to monitor disbond initiation and growth in adhesively bonded composite/metal single lap
joints", Jottrndl of Optics A: Pure Appied Optics, 9,2007, S40-S44
Palaniappan J, Wang H, Reed G, Thorne A, Ogin SL and Tjin S C, "Use of
conventional and chirped optical fibre Bragg gratings to detect matrix cracking damage in
composite materials", Journal of Physics: Conference series, 15 , 2005,55-60
ii

Palaniappan J, Wang H, Reed G, Thorne A, Ogin SL and Tjin SC, "Disbond
growth detection in bonded composite joints using a fibre Bragg grating", ECCM 12
(12th European Conference on Composite Materials), Biarritz (France), August 2006
Palaniappan J, Wang H, Ogin. S L, Thorne A, Reed G T, Crocombe AD and Tjin S C, "A novel optical method for measuring disbond growth in bonded composite joints", Photon '06, Sept 2006, Manchester, UK.
Palaniappan J, Ogin S L, Thorne A M, Reed G T, Tjin SC and Mohanty L,
"Detection of disbond initiation and growth in a bonded joint using a chirped fibre Bragg
grating sensor", Deformation and Fracture of Composites Conference (DFC9), April
2007, Sheffield, UK
Palaniappan J, Ogin S L, Thorne A M, Reed G T, AD Crocombe, Tjin SC and Mohanty L, "Reflected spectra prediction for chirped fibre Bragg gratings used for
disbond detection in composite/composite bonded joints", ICCM 16, July 2007, Kyoto,
Japan.
Capell T F, Ogin S L, Crocombe A D, Reed G T, Thorne A M, Palaniappan J, Tjin
SC and Mohanty L, "The use of thermal mismatch stresses to detect disbond initiation
and propagation in metal/composite bonded joints using a CFBG fibre optical sensor, ICCM 16, July 2007, Kyoto, Japan.
Ogin S L, Palaniappan J, Capell T F, Thorne A M, Reed G T, Crocombe A D, Tjin
SC and Mohanty L, "The use of a CFBG fibre optical sensor to detect disbond
development in composite/composite and metal/composite adhesively bonded joints",
OFMC 2007, Oct 2007, Teddington, UK
iii
Acknowledgments
I would like to express my sincere gratitude to my supervisors, Dr. SL Ogin, Prof. GT
Reed and Mr. AM Thorne for their supervision, useful advice and talented comments. Their valuable suggestions, comments and continued support throughout the research
made me work hard and enthusiastically. I would also like to thank Prof AD Crocombe,
for his helpful suggestion and sharp remarks and his student, Yannick Rech for support in
modelling.
A great thanks to my colleague Dr. Hongrui Wang who introduced me to the
experimental works and helped overcoming critical experimental problems. I would also like to thank TF Capell for the support in modelling and suggestions. I am grateful to
Dr. Brain Le Page and Mr. Peter Haynes for their helpful suggestions and outstanding
patience in dealing with my requests for the manufacture of laminate and usage of
essential experimental equipment.
I greatly acknowledge the financial support provided from University of Surrey for my
research as University Research scholarship. I am much thankful to the faculty of Engineering and Physical sciences for providing with all the necessary facilities.
iv

To my husband Sakthivel and son Kabilan And my parents
without whose enduring support and understanding this could never have been achieved

Contents
CONTENTS Abstract
Author's publications Acknowledgements iv
Contents vi CHAPTER I- INTRODUCTION 1-4
1.1. Composite material: an introduction 1
1.2. Objectives of present work 3
1.3. Thesis structure 3
CHAPTER 2- LITERATURE REVIEW 5-31
2.1. Introduction 5
2.2. Damages in Composite materials and bonded structures 2.2.1. Matrix cracking damage 6
2.2.2. Damage in adhesively bonded composite joints 9
2.3. Non-optical damage detection methods in composite materials and
structures 2.3.1. Cross-ply matrix cracking damage detection 11
2.3.2. Damage detection in adhesively bonded composite joints 13
2.4. Optical damage detection methods in composite materials and
structures 2.4.1. Optical fibre sensors 15
2.4.2. Fibre Bragg gratings - uniform and Chirped 19
2.4.3. Damage detection using FBG
2.4.3.1. Damage in composite laminate 23
2.4.3.2. Damage in adhesive bonded joint/ patch repair 28
2.5. Summary 30
CHAPTER 3- BACKGROUND THEORIES AND TOOLS 3242
3.1. Introduction 32
3.2. Matrix cracking 32
3.3. Adhesively bonded joints 34
3.4. Bragg grating sensors 3.4.1. Bragg grating theory 37
vi

Contents
3.4.1.1. Uniform FBG 38
3.4.1.2. Chirped FBG 39
3.5. Spectrum prediction software (OptiGrating) 40
3.6. Summary 42
CHAPTER 4- MATERL4, LS AND METHODS 43-57
4.1. Introduction 43
4.2. FBG sensor system 4.2.1. FBG sensor system arrangement 43
4.2.2. ASE broadband source 44
4.2.3. Optical spectrum analyser 45
4.2.4. Reflection spectrum capturing procedure 46
4.3. Material fabrication techniques
4.3.1. Sensor preparation 47
4.3.2. Laminate manufacture with embedded sensors 48
4.3.3. Matrix cracking coupon specimens 50
4.3.4. Single lap composite-composite bonded joint coupon specimens 51
4.3.5. Single lap composite-composite bonded joint with manufacturing
defect 54
4.4. Mechanical testing
4.4.1. Quasi-static tests for matrix cracking damage detection 55
4.4.2. Fatigue tests for disbond detection in bonded joints 56
4.4.3. Tensile tests for manufacturing defect detection in bonded joints 57
4.5. Summary 57
CHAPTER 5- MATRIX CRACKING DETECTION IN GFRP CROSSPLY
LAMINATE 59-76
5.1. Introduction 59
5.2. Response of uniform and chirped FBG sensors to applied strain 59
5.3. Response of uniform FBG sensors to matrix cracking 64
5.4. Response of chirped FBG sensors to matrix cracking 65
5.5. Modelling and prediction 69
5.6. Discussion
5.6.1. Reflection spectra changes recorded by the uniform FBG 73
5.6.2. Reflection spectra changes recorded by the Chirped FBG 74
Vil

Contents
5.7. Conclusions 75
5.8. Summary 76
CHAPTER 6- DISBOND DETECTION IN ADHESIVELY BONDED
COMPOSITE JOINT FROM THE LOW WAVELENGTH END OF THE
CFBG SENSOR 77-98
6.1. Introduction 77
6.2. Response of 45 mm CFBG sensor to disbond
6.2.1. Detection of disbond initiation 78
6.2.2. Detection of disbond propagation 80
6.3. Response of 15,30 and 60 mm CFBG sensors to disbonding 83
6.4. Modelling and prediction 6.4.1. FE modelling 87
6.4.2. Reflected spectra predictions using OptiGrating 91
6.4.3. Shape of the perturbation for different CFBG chirp rates and sensor lengths
6.4.3.1. Different chirp rates 93
6.4.3.2. Same chirp rate 94
6.5. Discussion 95
6.6. Conclusions 97
6.7. Summary 98
CHAPTER 7- DISBOND DETECTION IN ADHESIVELY BONDED
COMPOSITE JOINT FROM THE HIGH WAVELENGTH END OF THE
CFBG SENSOR 99-109
7.1. Introduction 99
7.2. Response of the 60 mm CFBG sensor to disbond 99
7.3. Modelling and predictions 104
7.4. Discussion 107
7.5. Conclusions 108
7.6. Summary 109
CHAPTER 8- PARAMETRIC STUDIES ON THE SENSITIVITY OF THE
CF`BG SENSORS 110-126
8.1. Introduction 110
8.2. Parametric model 110
viii

Contents
8.3. Scope of the parametric analysis 112
8.3.1. Comparison of the closed form solution with the FE results 113
8.4. Parametric study results 8.4.1. Effect of CFBG sensor location 116
8.4.2. Effect of adherend thickness and material 118
8.4.3. Surface mounting of CFBG sensor 124
8.5. Conclusions 125
8.6. Summary 126
CHAPTER 9- NIANUFACTURING DEFECT DETECTION IN AN
ADHESIVELY BONDED COM[POSITE JOINT USING THE CF`BG SENSOR 127-133
9.1. Introduction 127
9.2. Response of CFBG sensor to manufacturing disbond 127
9.3. Modelling and predictions 130
9.4. Conclusions 132
9.5. Summary 133
CHAPTER 10 - CONCLUSIONS & FUTURE WORKS 134-136
10.1 Conclusions
10.1.1. Introduction 134
10.1.2. Matrix cracking damage detection in composite laminates 134
10.1.3. In-service disbond detection in adhesively bonded joints 134
10.1.4. Manufacturing defect detection in adhesively bonded joints 135
10.2 Further Work 136
References 137-147
Appendix 148-157
ix

Chapter i INTRODUCTION
F- CHAPTER 1
INTRODUCTION
1. COMPOSITE MATERLAL: AN INTRODUCTION
Polymer matrix composite materials are increasingly being used for different types
of structures. For example in aerospace, they are widely used for radome, wing leading-
and trailing-edge panels and stabilisers. The new Boeing B787 is incorporating composite
material in the fuselage, a first for commercial jets, and will be using more than 50%
(by weight) of composite material (see Figure 1.1) [Seattlepi news]. In the marine area,
Mirabella V is the world's largest single-masted yacht made with composite materials
weighing 740 tonnes and measuring 75 metres in length. In the automobile sector, Ford
produced a car almost entirely from carbon fibre composite in 1979. In the energy
production sector, the largest wind turbine blade manufactured by LM Glasfiber is made of
composite materials and produces 5 MW power.
Materials used in 787 body
- Fiberglass K Carbon laminate composite
0 Aluminum E, Carbon san"ch composite -7 -ý -
'-- Aluminurnfsteelititanium
Total materials used By weight
Other Steel S% Composites 10% SO%
Itanium is%
Aluminum 20%
40
By comparison, the 777 uses 12 percent composites and 50 percent aluminum.
Figure 1.1. Materials used in B787 [credit: seattlepi news]
Composite materials essentially consist of two main constituents: a low modulus, low strength matrix material and a high stiffness, high strength reinforcements. These
distinct phases are combined on a macroscopic scale to produce a heterogeneous composite
with desirable characteristics that exceed those of the individual components. Matrices
include metals, ceramics and plastics and they serve to bind the fibres together, transfer
Chapter I INTRODUCTION
loads to the fibers and protect them against environmental attack and damage due to
handling. Reinforcements are the principal load-bearing elements. Reinforcements basically
come in three forms: particulate, discontinuous fibers and continuous fibers. Composite's
properties are best in the direction of the fibers. Perpendicular to the fibers the matrix
properties dominate because load must be transferre d by the matrix. As most structures are
not loaded in a single direction, even though one direction may dominate, it is necessary to
orient fibers in multiple directions. This is accomplished by stacking multiple plies together
called a laminate. The type of composites that are used for advanced applications such as
marine, aircraft, automobile application, as well as load bearing structural parts, are
continuous long fiber polymer matrix composite laminates and therefore those are the ones
that are going to be highlighted in this thesis.
Cross-ply composite laminates, with individual plies at angles of 0' and 90', Pften
exhibits several distinguishing modes of deterioration such as transverse matrix cracks, delarnination and debonding of fibres preceding final fracture under loading. Matrix
cracking is the first stage of damages and though it is not catastrophic in nature, its
presence can influence the overall mechanical behaviour of the structure [Mahi et al., 1995;
Berglund et al., 1992]. The existence and multiplication of matrix cracks can degrade the
life of the structure by introducing other more severe damage such as delamination and fibre breakage [Berglund et al., 1992; Guild et al., 1993].
Joining composite to composite and composite to metal using adhesives are an
attractive alternative to mechanical fasteners and are increasingly accepted in safety critical
applications, such as those in automotive and aerospace structures. Adhesive bonding of
composite structures is considered superior to mechanical fasteners for cost saving, weight
reduction and the stress distributed over the entire bond area [Baker et al., 2004; Adams
and Comyn, 2000]. The serious concern with these adhesively bonded joints is disbond
initiation and growth in either quasi-static loading or cyclic (fatigue) loading. As the
structural demands on these joints have increased, the need for reliable NDE (non
destructive evaluation) techniques and knowledge of damage tolerance has also increased.
OBJECTIVES OF PRESENT WORK
Determining the existence, location and extent of damage in such composite
materials is of great importance. Inspection of such structures in the past has been based
mainly on conventional non-destructive evaluation techniques. These techniques are often
F--

Chapter INTRODUCTION
difficult to use for in-service inspection of large components and they do not necessarily
provide a quantitative measure as to the extent of the damage. Consequently new
techniques are sought and structural health monitoring (SHM) of composite structures
using fibre Bragg grating (FBG) sensors is a promising and cost-effective solution
compared to regularly scheduled inspections. It is an advantage that such sensors can
provide information on the health of the structure not only during the in-service life of the
structure, but also during its manufacture. Fibre Bragg grating sensors with a uniform grating spacing have been used to detect
various types of damage in composite materials and structures. Much resea rch has been
done to detect the transverse matrix crack, the earliest form of macroscopic damage in
composite laminates, by the use of a unifonn FBG but it is observed that they could not identify the exact location of this damage [Okabe et al., 2004]. Furthermore uniform FBGs
were also used to detect disbond in bonded joints and repairs [McKenzie et al., 2000; Jones
et al., 2002; Li et al., 2004; Herzsberg et al., 2005; Marioli-Riga et al., 2005; Takeda et al.,
2004; Minakuchi et al., 2007], but this method cannot easily detect both the initiation and
the growth of a disbond. For these reasons the recent work has utilised an embedded
chirped FBG (CFBG) sensor, whose grating period increases linearly along the length of
the grating thereby producing broad range of wavelength, for the detection and location of
the transverse crack in the laminated composites and the initiation and propagation of disbond in the single lap bonded joint. The work was also extended to the detection of a defect caused during manufacturing of the bonded joint. Experimental, analytical and
modelling studies were undertaken for the in situ detection of damage in composite
materials with the great potential of CFBG sensors demonstrated in order to obtain information on the presence of damage, its size, and its location.
1.3. THESIS STRUCTURE
The structure of the thesis is as follows: Chapter 2 is the literature review which
gives an insight into the damage in composite materials and structures, in particular to
transverse matrix cracking in laminated composites and disbond in single lap bonded joints;
non-optical damage detection methods and optical techniques with the main focus on FBG
and CFBG sensors for the damage detection. Chapter 3 gives information on the
background theories of the study undertaken and the tool used for the studies. Chapter 4
describes the material fabrication and methods of experimentation. Chapters 5,6 and 7
F--

Chapter I INTRODUCTION
relate to the main experimental studies conducted in this work and each provides the results
and discussion of the experiments, modelling and predictions. Chapter 8 reports on the
parametric study undertaken to determine the factors affecting the sensitivity of the sensor in locating the defect. Chapter 9 presents the work undertaken to detect the manufacturing defect in bonded joints. Finally Chapter 10 summarises the major conclusions from the
study and then presents the direction for further work in this area.
F-
Chapter 2 LITERATURE REVIEW II
CHAPTER 2 LITERATURE REVIEW
2.1. INTRODUCTION
Fibre reinforced polymer (FRP) composites are finding increased usage in structural
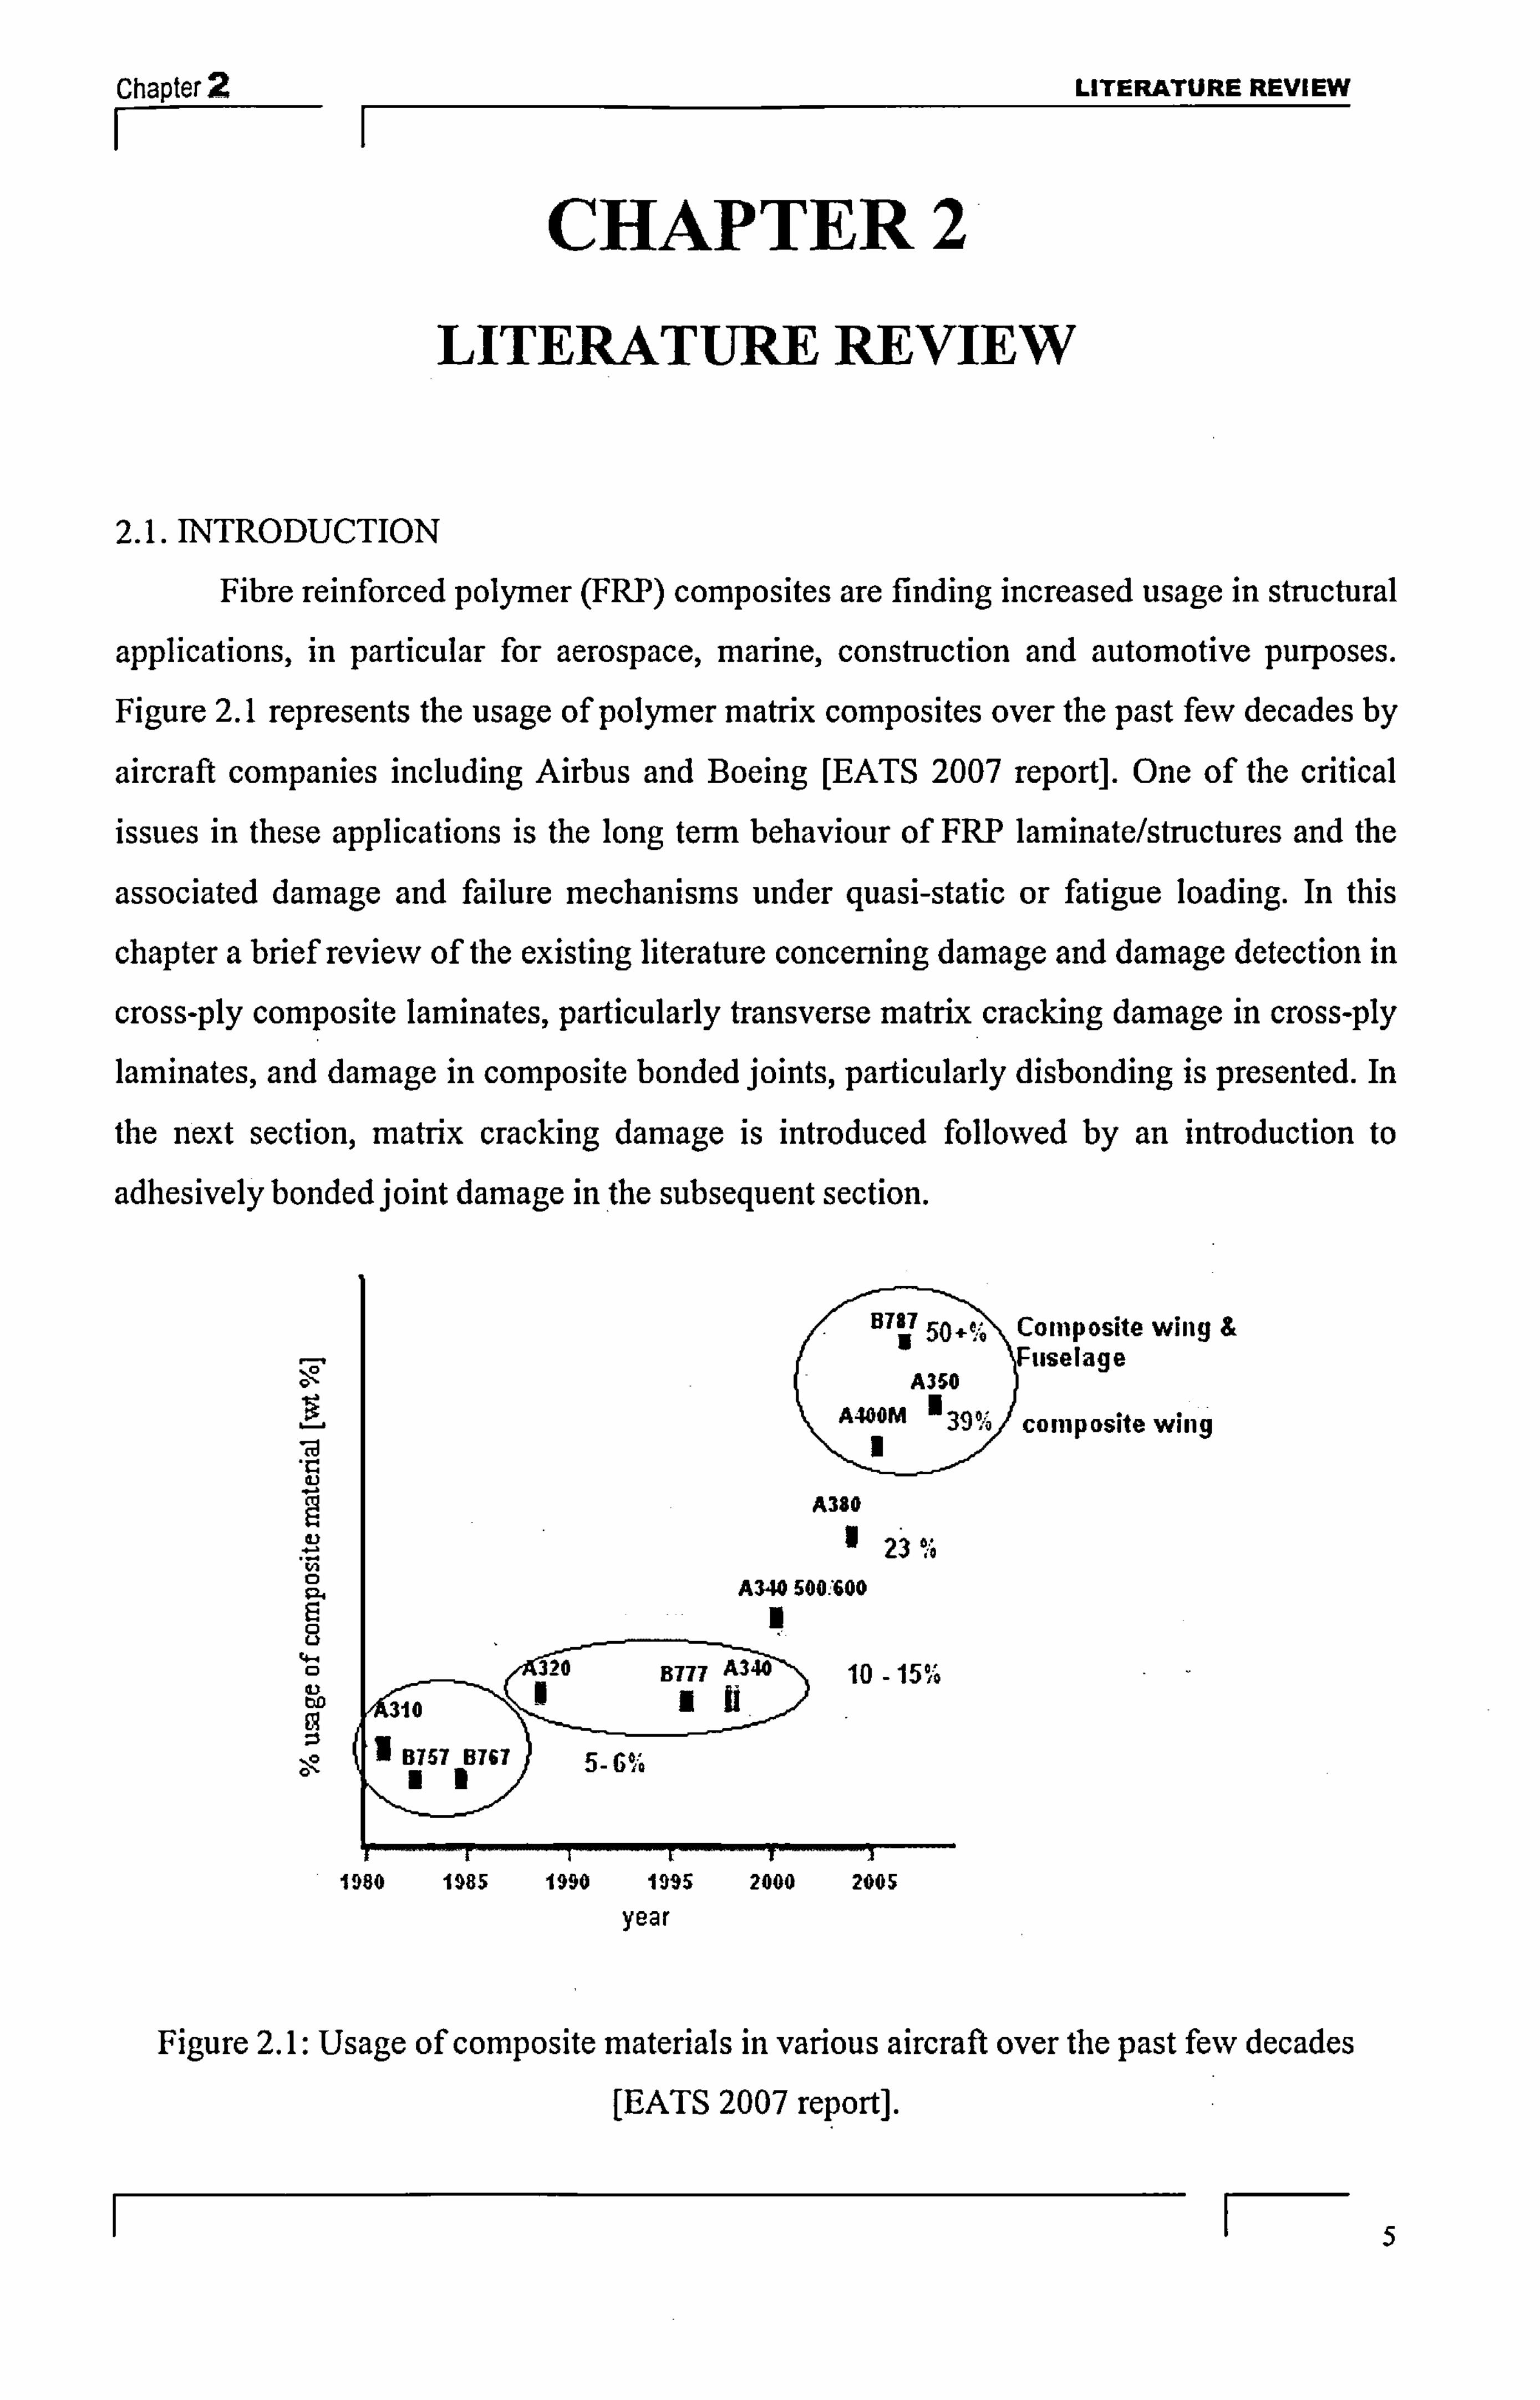
applications, in particular for aerospace, marine, construction and automotive purposes. Figure 2.1 represents the usage of polymer matrix composites over the past few decades by
aircraft companies including Airbus and Boeing [EATS 2007 report]. One of the critical issues in these applications is the long term behaviour of FRP laminate/structures and the
associated damage and failure mechanisms under quasi-static or fatigue loading. In this
chapter a brief review of the existing literature concerning damage and damage detection in
cross-ply composite laminates, particularly transverse matrix cracking damage in cross-ply laminates, and damage in composite bonded joints, particularly disbonding is presented. In
the next section, matrix cracking damage is introduced followed by an introduction to
adhesively bonded joint damage in the subsequent section.
L)
4ý 320
t)D
:i -0 B757 B767
-6 %
B787 50. ý,; Composite wing 5 -% 10
C B787
13 Fliselage
A4 A350
4OOM '39% collipositewilig
1
A390 1 23'%
A340 500400
B777 A64U 10-15% ab)
1980 1985 1990 1995 2000 2005 year
Figure 2.1: Usage of composite materials in various aircraft over the past few decades
[EATS 2007 report].
I F-

Chapter 1
LITERATURE REVIEW
2.2. DAMAGE IN COMPOSITE MATERIALS AND BONDED STRUCTURES:
2.2.1. Matrix cracking damage
A composite laminate can display three major macroscopic damage modes: matrix
cracking in 90' plies, delamination between 0' and 90' plies and fibre fracture [Berthelot et
al, 1996; Mahi et al., 1995; Berglund et al., 1992; Garrett and Bailey, 1977; Wang, 1984].
Figure 2.2 shows the various damage modes occurring in cross-ply composite laminates. Of
these, matrix cracking is generally the first type of damage observed easily and it has been
much studied, particularly in cross-ply composite laminates [Mahi et al., 1995; Berglund et
al., 1992]. As the transverse cracks are easily visible in transparent glass-fibre reinforced
epoxy laminates, many studies on transverse cracking development have concentrated on
these laminates [Parvizi et al., 1978; Ogin et al., 1985]. The transverse cracks initiate when
the applied strain is above a threshold value and this threshold strain value depends upon
the transverse ply thickness, stacking sequence and the material properties of the laminate
[Berglund et al., 1992; Garrett and Bailey, 1977]. Garret and Bailey (1977), for example, have shown that the threshold strain value for initiating the transverse cracks is lower for a 2.6 mm transverse ply thickness than for a 0.75 mm. thick transverse ply with the same 0'
plies. Different crack growth behaviour was observed in cross-ply laminates under quasi-
static or fatigue loading. In the case of quasi-static tensile loading, cracks initiate at the free
edges of the specimen for thick transverse plies and propagate instantaneously along the
thickness and width of the transverse ply [Berthelot et al., 1996]. Parvizi et al (1978)
observed that in thin transverse cross-ply laminates, the cracks initiates at the free edges of
the specimen but grow slowly with increasing strain before finally spanning the full width
of the transverse ply. Garrett and Bailey (1977) observed that, under quasi-static loading
for glass fibre reinforced polyester specimens; the crack spacing was uniform and decreased as the applied stress increased. The crack density increased until it reached a limiting value which depends on the transverse ply thickness at higher applied stress. Wang
(1984) suggested in work on carbon cross-ply laminates, that there is no saturation stage for
the crack density as was observed for glass fibre laminates, and that the fracture of the 0'
plies at high strain interrupts the development of additional transverse cracks.
I F--

Chapter 2 LITERATURE REVIEW
F-
-4110-
crw Ifin
fib" IrKbwt -Cammmum tromwerve groCking
Figure 2.2. Various damage modes in cross-ply composite laminates [Ber-thelot, 2003]
In the case of fatigue loading, transverse cracks initiate from the free edges in thick
transverse plies and grow slowly across the width of the specimen as the number of cycle is
increased [Berthelot et al., 1996; Boniface and Ogin, 1989]. The crack density increases
with increasing cycles [Berthelot et al., 1996] and the crack growth rate is a function of the
stresses in the fatigue cycles, with higher stress leading to higher growth rate [Boniface and Ogin, 1989]. The crack density not only depends on factors such as the number of cycles, laminate lay-ups, stress amplitude, but also on the temperature. Sun et al (2003), for
example studied cross-ply laminates in fatigue (tension-tension) loading at both room (24' C) and high (149' Q temperatures with a stress ratio of R=0.5 at 4 Hz. They observed
that the crack density increases rapidly at higher temperature leading to a lower life
compared to the laminate, at the same normalised stress level, at room temperature. The
crack spacing is not uniform in fatigue loading as observed in static loading; see Figure 2.3
[Berthelot et al., 1996; Boniface and Ogin, 1989]. Boniface and Ogin (1989) observed that
the crack growth rate decreases with decreasing crack spacing and there occurs crack arrest
, when the crack spacing is reduced to about half the transverse ply thickness.
IA Figure 2.3. Transverse crack growth in crossply laminate during fatigue loading
[Berthelot et al., 1996]
The development of transverse cracks either under quasi-static loading or fatigue
loading causes residual strain to develop upon unloading (i. e. a permanent small spacing
1 r-

Chapter 2 LITERATURE REVIEW II
extension of the specimen occurs) [Bassani et al., 1998] and results in a lowering of the
material properties such as stifffiess [Berthelot et al., 1996; Ogin et al., 1985; Tong et al.,
1997]. For example, Bassani et al. (1998) observed a residual strain of 85PE for a single
matrix crack, with increasing residual strain as the crack density increases. In case of
stiffness reduction, the stiffness of the specimen decreased progressively when the
transverse cracks developed. Ogin et al (1985) have shown three stages of the stifffiess
reduction in a [0/902/01 glass fibre laminate, the first stage being an initial rapid modulus
reduction followed by much slower reduction and finally rapid fall off just prior to failure.
The amount of reduction depends on the transverse ply thickness, the stacking sequence
and the material properties. For example, Garrett and Bailey (1977) observed a greater
stiffness reduction for a glass fibre laminate with a thicker transverse ply (0/906/0) than a
laminate with thinner transverse ply (0/90/0). Berthelot et al. (1996) reported that the
stiffness reduction in a glass epoxy laminate is more than that for a carbon epoxy laminate
due to a large ratio of transverse ply modulus to longitudinal ply modulus. Mahi et al.
(1995) studied the influence of stacking sequence by finite element analysis on the stiffness
reduction for a (07/90), and a (03/90/04). specimen where the total thickness for each ply
was the same but the specimen differ in their 90' ply arrangements. The authors observed
that the stifftiess reduction starts within the first hundred cycles for the (07/90), but only at
about 103 to 104 cycles for the (03/90/04),. Moreover the stiffness reduction was more for
the (07/90), at about 0.5% compared to the (03190/04), at about 0.15%.
Though the presence of matrix cracks does not lead to catastrophic failure, they do
promote secondary damage modes in composites such as delamination and fibre breakage
[Berglund et al., 1992; Guild et al., 1993; Takeda at al., 2007]. Transverse cracking also
provides an easier pathway for moisture ingress [Berthelot, 2003]. Moreover matrix
cracking is often used as the design criteria for certain critical applications such as (i) fluid
and/or pressure vessel design, and (ii) the design of aerospace structures. In these
applications, the presence of matrix cracks constitutes failure since the structural integrity
of the structure is compromised by the matrix cracking. Matrix cracks in pipes/pressure
vessels can lead to leaks and, in composite laminates, to delamination and fibre fracture.
Hence, early detection of damage could avoid complications and it would be beneficial to
have an in-situ continuous monitoring system which would monitor the growth and location
of the damage in a composite structure.
I F-
Chapter 2 LITERATURE REVIEW
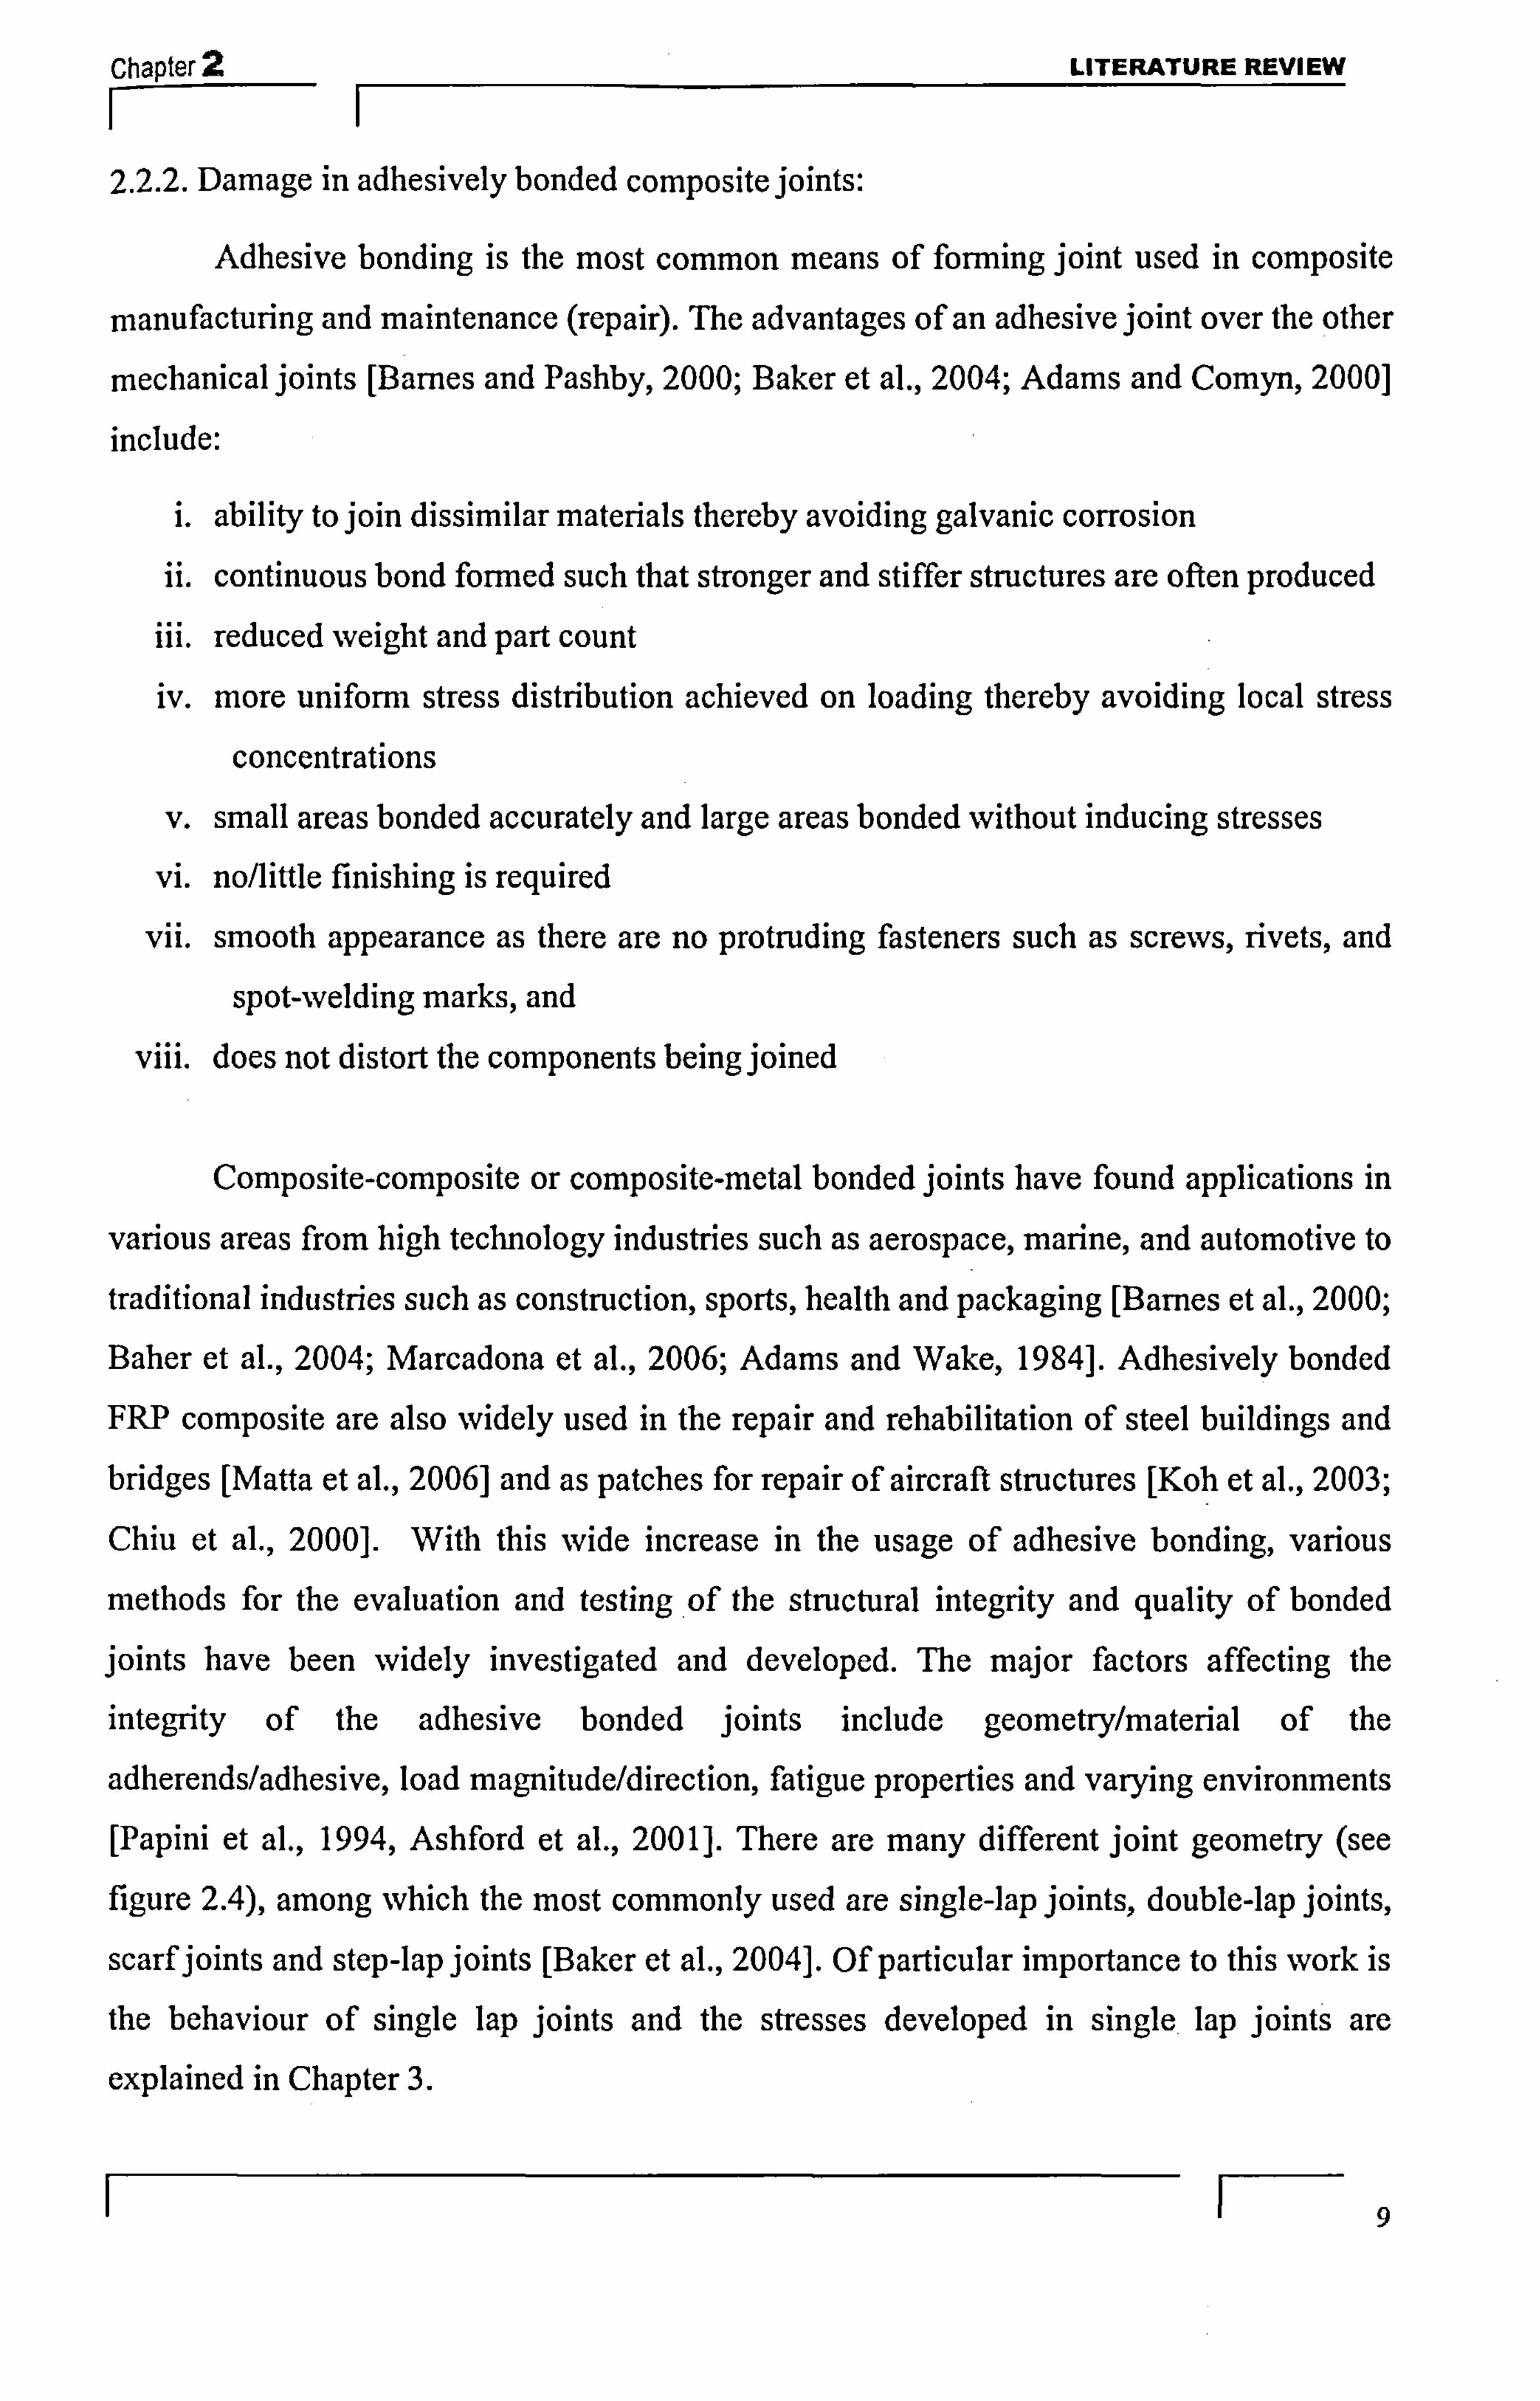
F- 2.2.2. Damage in adhesively bonded composite joints:
Adhesive bonding is the most common means of forming joint used in composite
manufacturing and maintenance (repair). The advantages of an adhesive joint over the other
mechanical joints [Barnes and Pashby, 2000; Baker et al., 2004; Adams and Comyn, 2000]
include:
i. ability to join dissimilar materials thereby avoiding galvanic corrosion ii. continuous bond formed such that stronger and stiffer structures are often produced
iii. reduced weight and part count iv. more unifonn stress distribution achieved on loading thereby avoiding local stress
concentrations
V. small areas bonded accurately and large areas bonded without inducing stresses
vi. no/little finishing is required
vii. smooth appearance as there are no protruding fasteners such as screws, rivets, and
spot-welding marks, and
viii. does not distort the components being joined
Composite-composite or composite-metal bonded joints have found applications in
various areas from high technology industries such as aerospace, marine, and automotive to
traditional industries such as construction, sports, health and packaging [Barnes et al., 2000;
Baher et al., 2004; Marcadona et al., 2006; Adams and Wake, 1984]. Adhesively bonded
FRP composite are also widely used in the repair and rehabilitation of steel buildings and bridges [Matta et al., 2006] and as patches for repair of aircraft structures [Koh et al., 2003;
Chiu et al., 2000]. With this wide increase in the usage of adhesive bonding, various
methods for the evaluation and testing of the structural integrity and quality of bonded
joints have been widely investigated and developed. The major factors affecting the
integrity of the adhesive bonded joints include geometry/material of the
adherends/adhesive, load magnitude/direction, fatigue properties and varying environments [Papini et al., 1994, Ashford et al., 2001]. There are many different joint geometry (see
figure 2.4), among which the most commonly used are single-lap joints, double-lap joints,
scarf joints and step-lap joints [Baker et al., 2004]. Of particular importance to this work is
the behaviour of single lap joints and the stresses developed in single, lap joints are
explained in Chapter 3.
1

Chapter 2 LITERATURE REVIEW
F-
Omsk-lap Joint Doublo-vAmp joint
Dinp I* -Adrno Joint Tapor*4 straLp l9krt
Tapere-d Ginjole-JAM W, StOPP64-I&P joint
Dowb4o-lap J*Iflt egad ilai"
Figure 2.4. Different joint geometry of the adhesively bonded joints [Baker et al., 2004]
Defects and damage in adhesive joints occurs either at the adherend-adhesive interface or within the adhesive layer itself, during manufacturing or in-service. For
example in the yachts used in the America cup races, whose hull and mast are made of CFRP sandwich composites, the critical damage is caused by skin-core debonding and debonding between structural members [Murayama et al., 2003]. Moreover, QinetiQ
(2006) has reported that, in a survey conducted in the European Framework IV project 'MONITOR' to determine the damage forms that the end users are of most concerned about in composite structures, 59% of end users have reported for disbond detection (these end
users are in aerospace, defense, research organizations and manufacturers). Hence, the
majority of nondestructive testing performed on bonded structures is aimed at detecting
disbonding and other forms of defect such as voids or porosity [Summerscales, 1990]. The
term disbond here is defined as a separation of the composite material from another
material to which it has been adhesively bonded such that it will not transfer load from the
adherend to another through the adhesive. Disbond during manufacturing could occur due to the presence of contaminants on
the adherend, inclusion of release film, poor process control and poor release procedure. Disbonding during service could be due to impact, fatigue loading and environmental degradation. Disbonds provide a site for fatigue crack propagation and hence will lead to
premature failure in structures [Adams and Wake, 1984]. The disbond also allows moisture to penetrate into the joint [Schindel et al., 1997]. Hence, a reliable non-destructive
1 10

Chapter 2 LITERATURE REVIEW
F- inspection technique which could detect the initiation and growth of the disbond failure at
an early stage would be effective.
2.3. NON-OPTICAL DAMAGE DETECTION METHODS IN COMPOSITE
MATERIALS AND STRUCTURES:
Damage detection in composite materials and in adhesively bonded composite joints
is extremely important and it still often remains a difficult problem to detect damage easily.
Damage such as matrix cracks and delamination within the composite, and disbonding
within joints, are difficult to detect and yet can potentially lead to catastrophic failure. For
adhesively bonded structures, damage is even more difficult to detect due to the
complexities of geometric details and loading. Being able to definitively detect damage is
an area that needs further research for obvious reasons related to safety, performance, and
cost [Baker et al., 2004]. Types of non destructive testing (NDT) for composite materials
and bonded joints originated from the processes developed for investigating metallic
materials. However composite materials being heterogeneous, anisotropic in mechanical
and physical properties, having poor electrical conductivity and low thermal conductivity has the consequence that only a few methods used for metallic structures in industry are
applicable to composite structures.
2.3.1. Cross-ply matrix cracking damage detection
Damage in crossply composite laminates, particularly matrix cracking, has been
studied by various means. For example, visual methods have often been used to detect
matrix cracking in glass fibre reinforced composite components if they are transparent
[Ogin et al. 1985; Ussorio, 2006] although this method is not suited for opaque composites
such as carbon composites (of course, matrix cracking detection using a visual technique is
not possible for structures that are painted). The edge replication technique [Ogin et al., 1985] and optical microscopy [Berglund et al., 1992, Tong et al., 1997] have been used to
determine crack density in composites. These techniques are ideal only for laboratory
specimens and cannot be used for larger structures. They suffer from the fact that the load
must be interrupted periodically and the component has to be removed from the testing
regime for each measurement which ftirther adds to the time required to complete a test.
Removing the specimen may induce artifacts in the results due to alignment problems in re-
gripping the specimen. Transverse cracks was also evaluated indirectly by measuring
III

Chapter 2 LITERATURE REVIEW
residual strain, stiffness reduction and Poisson's ratio reduction for the laminate [Ogin et
al., 1985; Tong et al., 1997; Bassam et al., 1998]. Other direct experimental NDT
techniques used for damage detection in composite laminate with different sensitivity levels
are dye penetrant X-ray radiography, ultrasonics and acoustic emission [Sun et al., 2003;
Noh et al., 2002; Crossman et al., 1980; Prosser et al., 1995., Jong, 2006; Surnmerscales,
1990; Gorman, 1991].
Penetrant-enhanced X-radiography, which utilizes a radio-opaque liquid (eg. Zinc
iodide , di-iodomethane) to infiltrate the examined area, was used to detect matrix cracks in
composites [Sun et al., 2003, Noh et al., 2002; Crossman et al., 1980]. The main drawback
of this technique is that it can resolve only damage connected to the surface, while internal
defects (impossible to fill with the dye) may remain undetected [Maslov at al., 2000]. The
other drawbacks include large and costly equipment, cannot be used for in-situ inspections
(needs the component to be removed for inspection), requires access to both sides of the
surface in order to emit and collect the X-ray radiation and there is a danger of radiation
exposure. Through-transmission or pulse-echo ultrasonic techniques [Maslov et al., 2000; Noh
et al., 2002] are most sensitive to flaws that lie parallel to the surface (e. g. delaminations),
but cannot detect damages lying perpendicular to the surface (matrix cracks) because the
cracks do not offer a wide enough reflecting surface as delaminations. The ultrasonic polar backscattering technique [Gorman, 1991] was successfully used to detect transverse cracks
running parallel to the fibre direction, in specimens manufactured with simple lamination
sequences, when loaded in tension. In the polar back scattering technique the transducer
was oriented at an angle to the tested surface so as to acquire the energy backscattered from
damage, and the high-frequency mechanical oscillations were used for the detection of damage mechanisms. The drawback in these techniques include the fact that water usually
needs to be used as a couplant, often needs access to both sides of the structure, cannot be
used for in-situ inspections and needs expert interpretation.
Acoustic emission [Prosser et al., 1995 (a); Prosser et al., 1995 (b); Jong, 2006]
involves the detection of the energy released by the material whilst under stress where
cracking events are detected using acoustic receivers such as microphones or piezoelectric
sensors. The method proves very efficient for monitoring structures in service but a precise identification of the size, shape and location of any flaws is not possible in composite
materials due to their anisotropy. Moreover, the data produced can be complicated to
1 12

Chapter 2 LITERATURE REVIEW
F- interpret and, for thinner laminates, the AE signals from cracks are not always detected
successfully [Prosser et al., 1995 (b)].
2.3.2. Damage detection in adhesively bonded composite joints:
Damage detection techniques for adhesively bonded joints and repairs also include
ultrasonic, acoustic emission, radiography and thermography techniques [Adams and
Drinkwater, 1997; Lowe et al., 2000; Thomas et al., 1998; Meola et al., 2004]. Of the
various methods available for monitoring the integrity of bonded composite joints,
ultrasonic methods are generally regarded as potentially the most useful [Adams and
Drinkwater, 1997]. Conventional ultrasound C-scan is time-consuming and expensive, with
the result that emphasis has been placed on developing techniques that extend the range
over which a given transducer can detect damage, though some types of debonding (e. g.
kissing bonds and interlayer defects) are difficult to detect with these techniques. The other
main problem with conventional ultrasonic methods is the need for a liquid couplant
between the transducer and test structure. This often makes ultrasonic methods
cumbersome, since the test object must be immersed in a water bath (which is not a
practical option for aircraft), and some materials (such as polymer-based composites) can
be affected or damaged through absorption of the liquid. As a result, various non-contact
ultrasonic transducers such as air and laser ultrasonic have been investigated for the
detection of disbond in bonded joints [Schindel et al., 1997; Adams and Drinkwater, 1997].
However these ultrasonic techniques also have the limitations of the time, require direct
access to joint area and require skilled labour [Lowe et al., 2000].
Acoustic emission (AE) techniques are used to detect the damage in the bonded
joints by positioning piezoelectric transducers on the surface of the structure to record the
stress waves emitted by the damage. For example, Matta et al (2006) studied the use of
acoustic emission signals to monitor disbond in the CFRP-steel bonded joints under load
using two acoustic piezoelectric transducers operating at a frequency of 200-750 kHz. They
noted that the acoustic parameters such as signal counts, amplitude and energy increased
significantly once the disbond initiated, and continued until the CFRP patches separated from the steel bar. They concluded that these acoustic emission parameters provided
valuable data for correlating acoustic emission signals and bond damage progression. The
analysis of the acoustic emission data also provided the basic information for identifying
1 13
Chapter 2 LITERATURE REVIEW
the damaged area location. The disadvantage of the technique lies in the complexity and
accuracy of data interpretation.
An example of the use of a thermographic technique is by heating one surface of a
bonded structure and observing the temperature rise of the opposite face. The areas of
disbond which resist the transfer of heat, show as cool areas [Thomas et al., 1998].
Alternatively, if the heated face is scanned, disbonds will show as hot areas. Temperature
sensing is normally detected with a scanned infrared camera. The success of using the
thermographic technique depends on the then-nal characteristics of the material (thermal
conductivity and thermal diffusivity) and there is a limitation on the depth of the damage
and the resulting size resolution. Backface strain measurement is another technique for monitoring disbond growth
[Crocombe et al., 2002]. Crocombe et al (2002) used this technique to monitor disbond
growth caused during fatigue loading in an Al-GFRP bonded joint. In this technique, the
strain is measured by locating a strain gauge on the exposed adherend surface (backface)
adjacent to the site of the adhesive damage in the bonded joint. The technique was based on
the strain distribution in single lap joints and detected the fatigue crack initiation by the
increase in local strain. This technique has the potential to determine both the fatigue crack initiation and the position of the crack initiation. But the limitations arise from the lack of a
convenient backface in many joint configurations. The NDE techniques, mentioned above, are either expensive, time-consuming,
complicated to interpret or difficult to use for complex geometries. For most of these
techniques, with the exception of acous tic emission and thermography, the testing must be
interrupted and the component must be removed from test setup or from service location to
perform the damage evaluation i. e. they are not suitable for on-line damage monitoring.
Moreover the key location of the inspection is the edge of the bonded joints and this is
almost impossible to achieve with the existing methods, other than optical methods. The
challenges for the use NDT in industrial circumstances are provided by a recent high profile
case study. After the investigation of the crash of an Airbus A300 (American airlines 587),
where the 27-foot high tail fin tore off, the National Transportation Safety Board (NTSB)
stated that current inspection methods may be inadequate to spot damage and recommended
even tighter non-destructive inspections on aircraft [National transportation report, 2004].
The damage in this A300 had gone undetected despite undergoing its routine inspection
involving ultrasonic, eddy current and visual NDI methods such as radiography. Hence,
1 14
Chapter 2 LITERATURE REVIEW II
new in-situ NDI techniques need to be developed, and sensors based on optical fibres may
present the way forward.
2.4. OPTICAL DAMAGE DETECTION METHODS IN COMPOSITE MATERIALS
AND STRUCTURES
The technique of using optics as a measuring tool has been reported for more than a
century but the current technique of optical sensing had its birth only within the past few
decades due to the development of low loss, optical fibre waveguides for the
telecommunication industries. Recent innovations in fibre optic instruments combined with
cost advantages have significantly increased their utility and demand as a sensor in
construction, aerospace, healthcare environments and defence and security [Merzbacher et
al., 1996, Badcock et al., 1995; Park et al., 2000; Lee et al., 2001; Steward et al., 2003;
Kageyama et al., 1998].
2.4. L Optical fibre sensors (OFS):
The following section provides an introduction to optical fibre sensors before
focussing on fibre Bragg gratings (FBG). Fibre optic sensors are one of the fastest growing
areas of light-based sensors technologies. They offer significant advantages such as insensitivity to EMI (electro magnetic interference), small size, light weight, non-
conductive, fast response and resistance to corrosion [Merzbacber et al., 1996]. In general, fibre optic sensors may be categorised under two headings, extrinsic sensors and intrinsic
sensors. Extrinsic sensors are those where the light leaves the feed or transmitting fibre to
be changed before it continues to the detector by means of the return or receiving fibre.
Intrinsic sensors are different in that the light beam doesn't leave the optical fibre but is
changed whilst still contained within it [Merzbacher et al., 1996]. OFS can be classified based on the optical properties been altered, they are intensity based sensors, interferometric sensors, polarimetric sensors and wavelength based sensors [Merzbacher et
al., 1996]. Michelson and Fabry-Perot (F-P) interferometer sensors are typical of interferometric sensors and the fibre Bragg grating is a wavelength based sensor. It is not
the intention to write a review of all of the sensors available, but a few will be discussed in
this chapter. The fibre optic sensors are used either surface mounted or embedded to monitor the
physical parameters and damage in composites. Though surface mounting sensors have the
I F- 15

Chapter 2 LITERATURE REVIEW
ease of installation, the optimum use of these sensors is obtained by embedding the sensor
in the composite itself, since they can then provide a more accurate measurement of what is
occurring in the material [Betz et al., 2003; Lau et al., 2001]. Betz et al (2003) for example,
studied the various -methods of attaching the fibre sensors such as surface mounting,
structural integration (embedding into the host material) and surface integration (surface
mounting but protected by a varnish on the structures) for successful structural monitoring
and concluded that the most satisfactory solution suitable for FRP composites is by
structural integration.
Embedding sensors could lead to complications and the interaction between the
optical fibre and the host composite and has been studied by various authors to try to
understand the response of the optical fibre due to embedding and the response of the
structure to the presence of the fibre. For long term structural monitoring using an optical
fibre sensor, the effect of such sensors on the strength, stiffness and fatigue life of
composite is important. Contradictory results, ranging from an improvement to a slight
degradation in the mechanical performance of composites have been described [Lau et al.,
2001; Okabe et al., 2002; Lee et al., 1995; Benchenkchou et al., 1998; Zhang et al., 2003].
The laminate layup, the number of embedded sensors, the embedding direction of the
sensors and their type of coating (bare fibre, acrylate coating etc. ) influences the results.
Lau et al. (2001), for example, observed a reduction in the strength of the composite laminate when the optical fibres were embedded perpendicular to the loading direction.
With regards to coatings, Okabe et al (2002) have calculated that the reflection spectrum
from coated embedded FBG sensors should be almost the same as the reflection spectrum
using uncoated sensors. Lee et al. (1995) observed no significant changes in the strength,
stiffness and Poisson's ratio of GFRP laminates containing embedded optical fibres and
observed the same mechanical behavior for unidirectional and cross-ply laminates with
different numbers of embedded sensors. However for fatigue loading they observed that
fatigue life decreased with an increasing number of embedded optical sensors. In contrast, few authors [Badcock et al., 1995; Benchekchou et al., 1998] showed that embedding
optical fibres in composites does not alter the fatigue behavior and that Benchekchou et al.
(1998) showed that embedding optical sensors within 0' orientation plies leads to better
fatigue behaviour than embedding them within 45' plies. Lee et al. (1995) have also shown
that the matrix crack damage accumulation was not affected by the embedded optical fibre
both for static loading and for cyclic loading. With some exceptions, overall it can be said
1 16
Chapter
F- LITERATURE REVIEW
that the inclusion of a single optical sensor causes no, or only very little strength/stiffness degradation when embedded parallel to the reinforcing fibres [Lau et al., 2001; Zhang and
Tai, 2003].
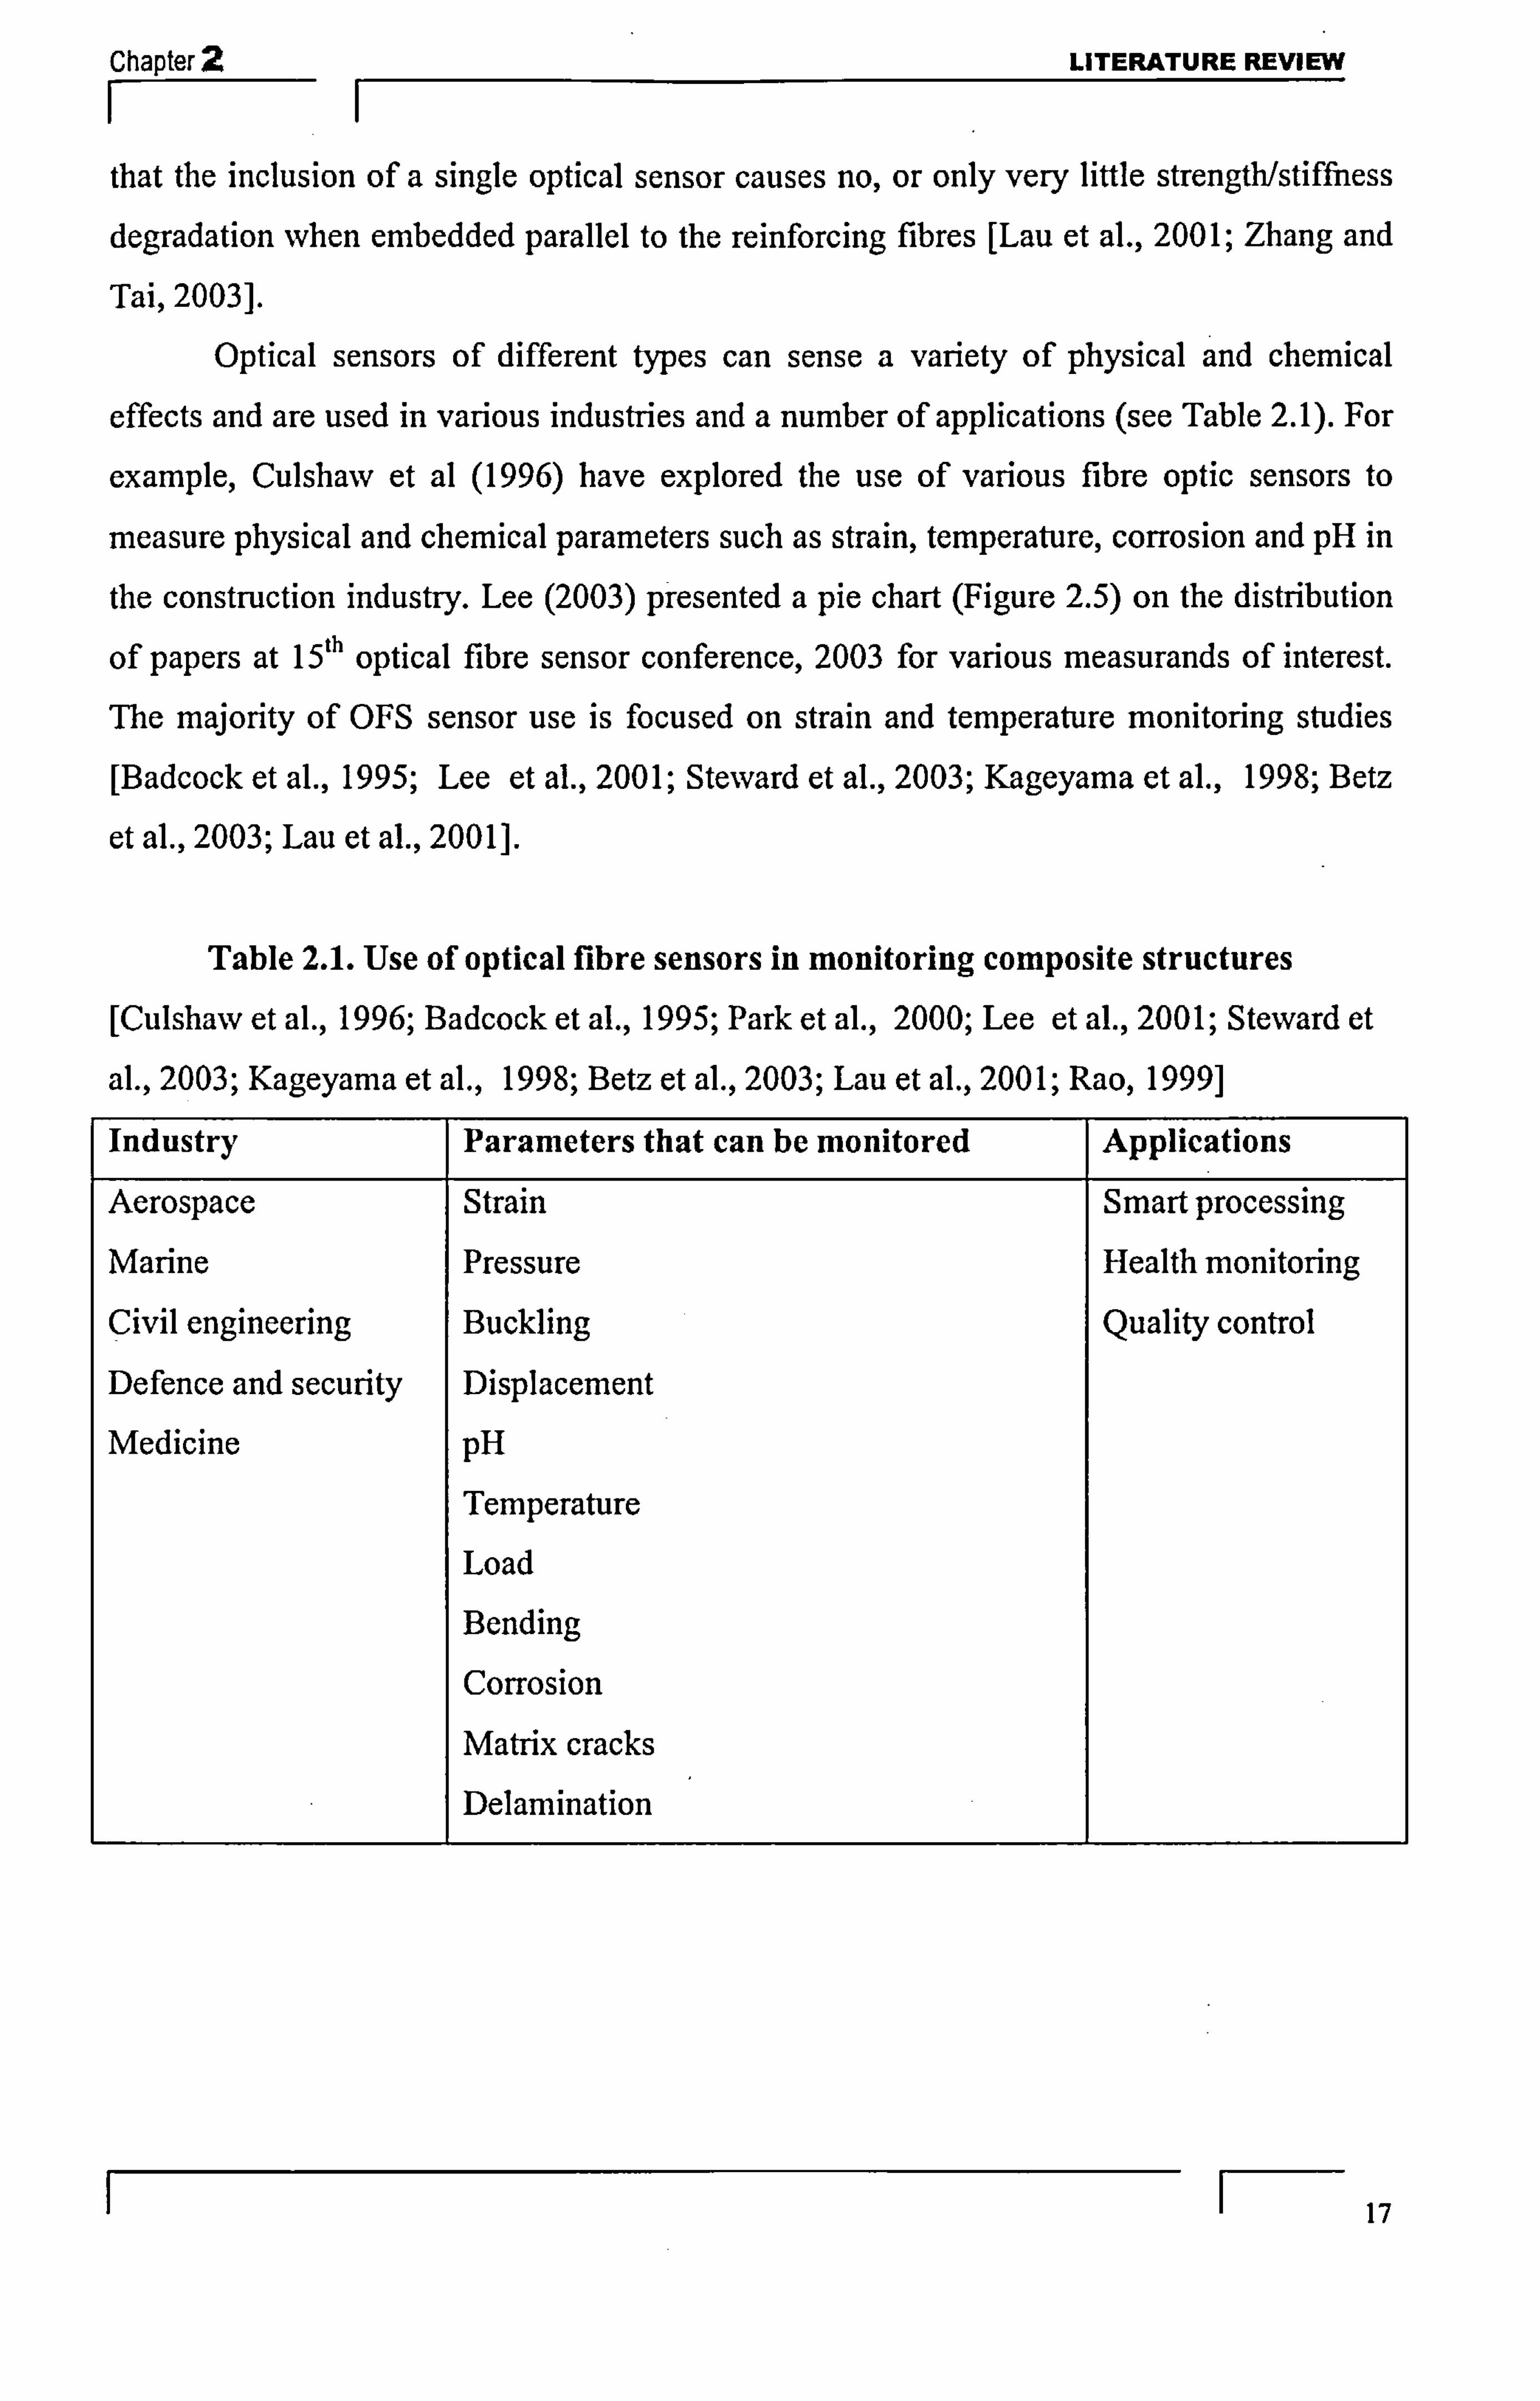
Optical sensors of different types can sense a variety of physical and chemical
effects and are used in various industries and a number of applications (see Table 2.1). For
example, Culshaw et al (1996) have explored the use of various fibre optic sensors to
measure physical and chemical parameters such as strain, temperature, corrosion and pH in
the construction industry. Lee (2003) presented a pie chart (Figure 2.5) on the distribution
of papers at 15 th optical fibre sensor conference, 2003 for various measurands of interest.
The majority of OFS sensor use is focused on strain and temperature monitoring studies [Badcock et al., 1995; Lee et al., 2001; Steward et al., 2003; Kageyama et al., 1998; Betz
et al., 2003; Lau et al., 20011.
Table 2.1. Use of optical fibre sensors in monitoring composite structures [Culshaw et al., 1996; Badcock et al., 1995; Park et al., 2000; Lee et al., 2001; Steward et
al., 2003; Kageyama et al., 1998; Betz et al., 2003; Lau et al., 2001; Rao, 1999]
Industry Parameters that can be monitored Applications
Aerospace Strain Smart processing Marine Pressure Health monitoring Civil engineering Buckling Quality control Defence and security Displacement
Medicine pH Temperature
Load
Bending
Corrosion
Matrix cracks Delamination
1 17

Chapter 1
Dispb-cement
%! ndIng/Tor. Qon Vibration/AaMerat Ion
515"M
- Rotation 62% A
Chemical/Gas 1131M
Current/ Voltagi 12.2%
LITERATURE REVIEW
Tcmperaturc 172%
Figure 2.5. Distribution of papers according to measurands of interest in conference OFS-15,2003 [Lee, 2003].
In addition to measuring physical and chemical parameters, fibre optic sensors have
emerged as a recent technique to detect damages in composite laminates/structures. For
example, intensity based optical fibre sensor (IBOF) fabricated with two lengths of optical fibres with a reasonable gap between two cleaved ends have been used for fatigue damage
detection in a CFRP laminate [Badcock et al., 1995]. The principle of the operation in this
IBOF depends on the output intensity change when the gap between the cleaved ends
changes due to strain change as the result of damage in the host. Plastic optical fibres
sensor, a multi-mode fibre in which core is made of polymer material, were used to detect
the damage (transverse cracks) by measuring the optical power loss in unidirectional and
cross-ply GFRP laminated composites [Takeda et al., 1999]. In the plastic optical fibre
sensor, the optical power decreased linearly as the strain increased before the initiation of
transverse cracks, but the optical power decreased nonlinearly when the cracks appeared. Work on polarimetric sensors to detect the transverse crack under quasi-static loading were done by embedding the sensor at 0190 interface of GFRP coupon [Wang et al., 2006].
Polarimetric fibre optic sensors are highly birefringent (HiBi) fibres which transmits
orthogonally polarized components of light with different velocities. The principle of this
sensor utilizes the differential delay between the two orthogonally polarized modes
propagating in the optical fibre to detect the applied external perturbation of interest (e. g.
strain, temperature, pressure etc). A step change in the optical output of the polarimetric
sensor is noted by the authors when a transverse crack passed the sensor. With respect to
damage detection in bonded joints, surface mounted fibre optic interferometric sensor was
1 18
Prtssum/Acoustic 152%

Chapter 2 LITERATURE REVIEW
proposed to detect the disbond in a concrete structure, an aluminium plate and a composite
plate when repaired by CFRP [Xu et al., 2005]. The principle of detection is that when the
quasi-impulse loading is applied to the repaired material containing the surface mounted
sensor, the optical phase shift that is proportional to the integral strain along the fibre is
different to that of a perfect bond. Integral strain is the total length change that occurs in
the optical fibre. There occurs a perturbation in the plot of fibre integral strain vs. load
position. The difference depends on the extent of the debonding, the relative position of the
debonding and the load applied.
2.4.2. Fibre Bragg gratings (FBG) - unifonn and chirped FBG:
A sensing device of considerable current interest in the fibre optic community is the
FBG because of its distinguishing advantages over other fibre optic sensors such as self-
referencing, smaller size than other FOS and unique wavelength multiplexing capabilities [Lau et al., 2001; Botsis et al., 2005]. Figure 2.6 shows a second pie chart by Lee (2003) on
the distribution of papers according to type of optical techniques in the 15 th optical fibre
sensors (OFS-15) conference in 2003. This pie chart clearly shows the interest in
investigating the capabilities of fibre Bragg grating sensors. A fibre Bragg grating sensor consists of a periodically varying refractive index that
is written into the core of a germanium doped single mode optical fibre [Erdogan, 1997;
Othonos A, 1997; Kersey et al., 1997]. When a broadband light is coupled into the optical fibre sensor, a reflection peak is obtained, centred on a wavelength called the Bragg-
wavelength (see Figure 2.7(a)). The Bragg-wavelength depends on the refractive index and
the period of the grating. Further details are provided in Chapter 3. As described in
previous sections, such optical sensors can be embedded readily into structures without influencing the mechanical properties of the host material due to their relatively small size [Lau et al., 2001].
I F-19

Chapter
F- Low-coherent Others
Inter ieroome ter 13.3%
FOG 4A%
Luminescence/_ Mackbody
6.6%
Fariday rotation 6.9%
LITERATURE REVIEW
Fiber gratings 441%
Figure 2.6. Distribution of papers according to technologies in the conference OFS- 15 [Lee, 2003 ].
Table 2.2. Strain and temperature sensitivity at different peak wavelengths [Rao, 1997]
Bragg Wavelength (w)
Strain sensitivity (PnVAE: )
Temperature sensitivity (PM/OC)
0.83 0.64 6.8 1.3 1 10 1.55 1.2 13
FBG sensors are sensitive to both strain and temperature changes and typical strain
and temperature sensitivities of FBG sensors at different wavelengths are shown in the
Table 2.2 [Rao, 1997]. Changes in strain or temperature will result in a change of the
grating period and refractive index of the Bragg grating and hence shift the Bragg
wavelength of the reflected light thus providing valuable information for monitoring strain,
temperature or damage in structures [Botsis et al., 2005; Lau et al., 2001; Guemes et al., 2002; Kuang et al., 2001; Gebremichael et al., 2005; Takeda et al., 2002; Moyo et al., 2005]. Lau et al. (2001) measured the internal strain of a composite strengthened concrete
structure at different locations using a single optical fibre with multiplexed FBG sensors. Some of the real time and in situ applications of FBG sensors for strain and temperature
monitoring includes a yacht, Jacquelina, fitted with 60 FBG sensors in its 38 rn free
standing mast and boom for the long term monitoring of the strain [King., 200 1]; [Vest Mill
bridge, (Oxfordshire, UK), Europe's first all fibre reinforced road bridge, embedded with 40 ruggedly protected FBGs to monitor traffic loading and environmental temperature at
1 20
Scattering/ Reflection Interferometers
10% 11.1%
Chapter 2 LITERATURE REVIEW
various locations along the structure [Gebremichael et al., 2005] and the structural health
monitoring of various rehabilitated bridge structures in Canada (such as Beddington Trail
bridge, Alberta; Salmon River bridge, Nova Scotia; Taylor bridge, Manitoba ) using FBG
sensors (both surface mounted and embedded) [Tennyson et al., 200 1 ].
FBG sensors have also been used for cure monitoring of composites. For example,
Kuang et al (2001) demonstrated the method of monitoring the cure in composites using
FBG sensors to monitor the residual strains. They measured the residual strains from the
embedded FBG within carbon epoxy and glass epoxy composite and fibre metal laminate
by the shift in the peak Bragg wavelength of FBG sensor. The peak wavelength shifted
towards the higher wavelength in unidirectional, quasi-isotropic and angle ply laminates but
the shift towards lower wavelength in cross-ply laminates due to various matrix shrinkage during polymerization and thermal shrinkage during cooling based on their stacking
sequence. They also observed a single well defined peak of FBG spectra for carbon fibre/epoxy unidirectional [04/(FBG)/041 composite, but splitting of the FBG spectra into
multiple peaks, and broadening of the width of the FBG spectra, in angle ply glass fibre/
epoxy [(45/-45)2/ {FBG) /(45/-45)21 composites. They suggested that the splitting of FBG
spectra in the angle ply composite is due to the non-uniforin loading. It is likely that this is
giving rise to a birefringence effect. In addition to these, uniform FBGs are used for
monitoring damage in composite materials and structures and these are presented in the
next section. In addition to unifonn FBG sensors, there are other types of FBG sensors [Erdogan,
1997; Othonos A, 1997; Kersey et aL, 1997), of which the chirped FBG (CFBG) is used in
this work. Unlike the uniform FBG, whose grating period is constant throughout, the
chirped FBG has a grating period which changes linearly with position (Figure 2.7). This
linear change in the grating period reflects a different wavelength at different points along
the fibre length and hence reflections occur over a spectral band of wavelength (further
details are given in Chapter 3). This relationship between the reflected spectrum and
physical distance along the sensor is very useful for investigating the position of changes in
strain, temperature, pressure and damage.
1 21

Chapter 1
(a)
0.539
0.538
0.537 E
0.536
0.535
0.534
0.533
0.532-
0.53
0.5310, 0
(b) 0.539
0.538
0-537
0.538
0.535
0.534
0.533
0.532
0.531
0.530 0
LITERATURE REVIEW
Figure 2.7 : Grating period along the position and its reflection spectra for
(a) uniform FBG (b) Chirped FBG
Tjin et al (2003) used CFBG sensors embedded in composites to sense and locate
local pressures in the range 0- 30 N along the length of sensor. The effect of pressure was
observed from the change in shape of the CFBG reflected spectrum (dips and peaks) at a
certain wavelength. The shape change at the certain wavelength showed an increased
reflectivity when the magnitude of applied pressure was increased and the shape change at
certain wavelength varied linearly with the point of application of the pressure. This effect
was used by Swart et al (2005) to monitor the magnitude and the position of oesophageal
pressures in a medical application using CFBG sensor. Nand et al (2006) demonstrated the
use of CFBG sensors for detecting and positioning a localised temperature change. The
temperature change was identified and located from the change in the shape of the
reflection spectrum (reduction in reflectance at shorter wavelengths and the corresponding increase in reflectance at longer wavelengths) at a particular wavelength. Gillooly et al
(2004) presented a surface mounted CFBG sensor as a wear sensor. There is a reduction in
1 22
10 20 30 40 so
Position along the grating, mm
10 20 30 40 so
Position 21ong tho grating. mm
Chapter 2 LITERATURE REVIEW
the bandwidth of the reflected spectrum due to abrasive removal of the gratings with the
higher spacings. Hence this sensor can be employed in monitoring the wear on a car brake,
the wear in combustible environments such as those in the oil and gas industry etc. Recently
a CFBG sensor was proposed as a self-temperature referenced strain sensor in non
isothermal thermoset processing by partially embedding the CFBG sensor in a thermoset
resin [Cusano et al., 2006]. The embedded part of the sensor monitors both the temperature
and the strain during curing of the resin while the free part of the sensor monitors only the
temperature changes. A number of papers have been concerned with the use of CFBGs for
monitoring damage in composite materials and structures and these are presented in the
next section.
2.4.3. DAMAGE DETECTION USING FBG
2.4.3.1. Damage in composite laminate
FBGs are currently the most widely studied type of fibre optical sensors. Two
diameters of uniform FBG sensors have been used: normal diameter FBG and small diameter FBG sensors. The core, cladding and outer diameter of the normal diameter FBG
are 9 gm, 125 gm and 250 pm respectively and the core, cladding and outer diameter of the
small diameter FBG sensors are 6.5 gm, 40 pm and 52 pm respectively [Okabe et al.,
2002]. Both diameter sensors have been used for monitoring damage in composite
materials such as transverse cracks and delaminations [Ussorio et al., 2006; Takeda et al.,
2002; Okabe et al., 2000; Okabe etal., 2002; Murayama et al., 2003; Takeda et al.. 2007].
Okabe et al (2002) have suggested that using small diameter FBG sensors will minimise
any mechanical property variation due to the embedding of sensors. Considering the results
using normal diameter sensors, multiple transverse cracks in CFRP were detected by
embedding uncoated normal diameter FBG in the 0' ply close to the 0190 interface. They
observed the FBG reflection spectrum upon increasing tensile stresses and noted the
distortion, i. e. broadening and some extra peaks, in the FBG reflection spectrum as the
transverse crack density is increased by tensile strain (see Figure 2.8). As the crack density
approached saturation, the spectrum became narrower with one single peak. These changes
are due to the non-unifon-n strain distribution caused by the transverse cracks.
1 23

Chapter
F- LITERATURE REVIEW
15
10
05
n
(F) (A) (B)
(C) (E)
I' 11 �
J 03) .......... E=0.30%, ty = 0.27%, p = 1.5cm
(C)- E=0.42%, tf=0.38%, p =7cm-1
(D)- E=0.57%, tf=0.52%, p =9.5cm*'
(E) ....... E=0.68%, ef = 0.64%, p = 10.5cm. -'
. (F) .......... c=0.77%, ef = 0.74%, p = 11.5 cm"
1546 1548 1550 1552 1554 1556 1558 1560
Figure 2.8: FBG reflection spectrum measured at various values of strain (P-) A-F. [Okabe et
al., 2002]
Ussorio et al (2006) have demonstrated that it is possible to detect a single
transverse crack in a crossply GFRP laminate by embedding the FBG sensors at the 0/90'
interface. A single transverse ply crack was grown by fatigue loading and the FBG
reflection spectra due to the crack showed a broadening of the spectra and secondary peaks
on the higher wavelength side. The enhanced strain field due to the matrix crack increased
the strain local to the crack plane. Consequently, additional reflections at higher
wavelengths are produced from this region of the FBG (see Figure 2.9), in addition to the
reflections from the parts of the FBG which do not experience the enhanced strain.
-15
-25
-35
Figure 2.9. (a) GFRP coupon with a transverse crack. (b) Reflected FBG spectra at increasing applied strains for a coupon with a crack [Ussorio et al., 2006].
Normal diameter uniform FBG sensors have also been used to detect delarnination in
composite laminates. For example, Takeda and his collegues (2005) embedded a 10 mm.
1 r- 24
-55 1 1546 1548 1550 1552.1554

Chapter 2 LITERATURE REVIEW
FBG sensor in a CFRP cross-ply laminate within 0' ply and close to 0/90 interface. A notch
was introduced in the CFRP laminate and one end of the FBG sensor was positioned near
the notch tip. Upon quasi-static loading, splits and transverse cracks occurred at the lower
strain at the notch tip and on increased strain the delamination starts to appear at the notch
tip. They recorded the reflection spectrum at 0.1% strain intervals with the load held
constant and noted that the form of the FBG spectrum was changed as the damage
occurred. When the initial damage occurs (splits and transverse cracks), the reflection
spectrum becomes broad and had some low intensity peaks at the longer wavelength due to
the non-uniforin strain distribution caused by the cracks. After the delamination was initiated from the crack tip, peaks with high intensity appeared at longer wavelengths because the longitudinal strain is high in the delaminated region.
The results using small diameter FBG [Okabe et al., 2000] embedded in the 0* ply for
transverse crack detection in cross-ply CFRP laminate by quasi-static loading, showed that
under loaded conditions the spectrum b ecame broader, showed some peaks on the long
wavelength side and the intensity of the highest peak became smaller as the transverse
crack density (p) increased due to the non-uniform strain distribution caused by the
transverse cracks. However, they noted that under unloaded conditions, the spectra
recovered its height but the form of the reflection spectrum was not recovered completely.
This disturbance in the spectra after unloading is due to the non-uniform thermal residual
strain distribution. The reflection spectra recorded by the authors after transverse cracking
under loaded conditions and unloaded condition are shown in Figure 2.10 and Figure 2.11
respectively. For delarnination detection, Takeda et al (2002) embedded a small diameter
FBG in 0/90 interface of CFRP cross-ply laminate. For the delamination onset from the
crack tip, a notch was introduced. One end of the sensor is placed near the tip of the
transverse crack grown from the notch. Quasi-static bending load with a four-point bending
device was applied and the reflection spectrum was recorded after unloading. They noted
that the form of the FBG spectrum was changed as the delarnination initiates and increases
in length due to the non-uniform strain distribution. When there was only a transverse crack (i. e. before the occurrence of the delamination), the reflection spectrum had only one sharp
narrow peak. After the delamination was initiated from the crack tip, another peak appeared
at longer wavelength due to higher strain in the delarnination region. The intensity of the
longer wavelength peak increased relatively with an increase of the delamination length.
1 25

Chapter
0.2
0.15
ri 0.1
0.05
LITERATURE REVIEW
(A) (B) (C)
1550 1555 1560 1w 1570 1575 Wavelength (nm)
(A) r-0.00%, p-O. Ocni-I (8) t. 0,25%, p=O. Ocm'l (C) c-0.43%, p- 6-Scrn'l (D) r=0.80%, p-II. Ocm'l (E) r-1.19%, p- 13.0cm-1
Figure 2.10 : Reflection spectra measured at various values of tensile strain (c)data (A)-(E)
[Okabe et al., 2002] 02 0.2 0.2 0.2
(A) (C) (D) (E)
0.15 0.15 0.15 0.15
t; 0.1 0.1 0.1 0.1
0.05 0.05 0.05 0.05
0 0 0 0 1551 1556 15SI 1556 1551 1556 1551 1556
Wavelength (nm)
Figure 2.11: Reflection spectra measured after unloading. These correspond to the spectra for (A), (C), (D) and (E) [Okabe et al., 2002]
The use of uniform FBG sensors could identify that damage had occurred in the
composite laminates, but could not locate the position of the damage. In order to achieve
this, a CFBG can be used. For example multiple cracks were identified and also located
from the CFBG reflection spectrum [Okabe et al., 2004]. A CFRP cross-ply laminate was
embedded with a CFBG sensor in the 0' ply close to the 0/90 interface and the CFBG
reflection spectrum was observed upon increasing tensile strain. As the tensile strain was increased the crack appears and then the crack density increases. The uniforinly increasing
grating spacing of the CFBG was interrupted by the strain field of the cracks leading to dips
in the CFBG reflection spectrum at certain wavelength and hence both crack development
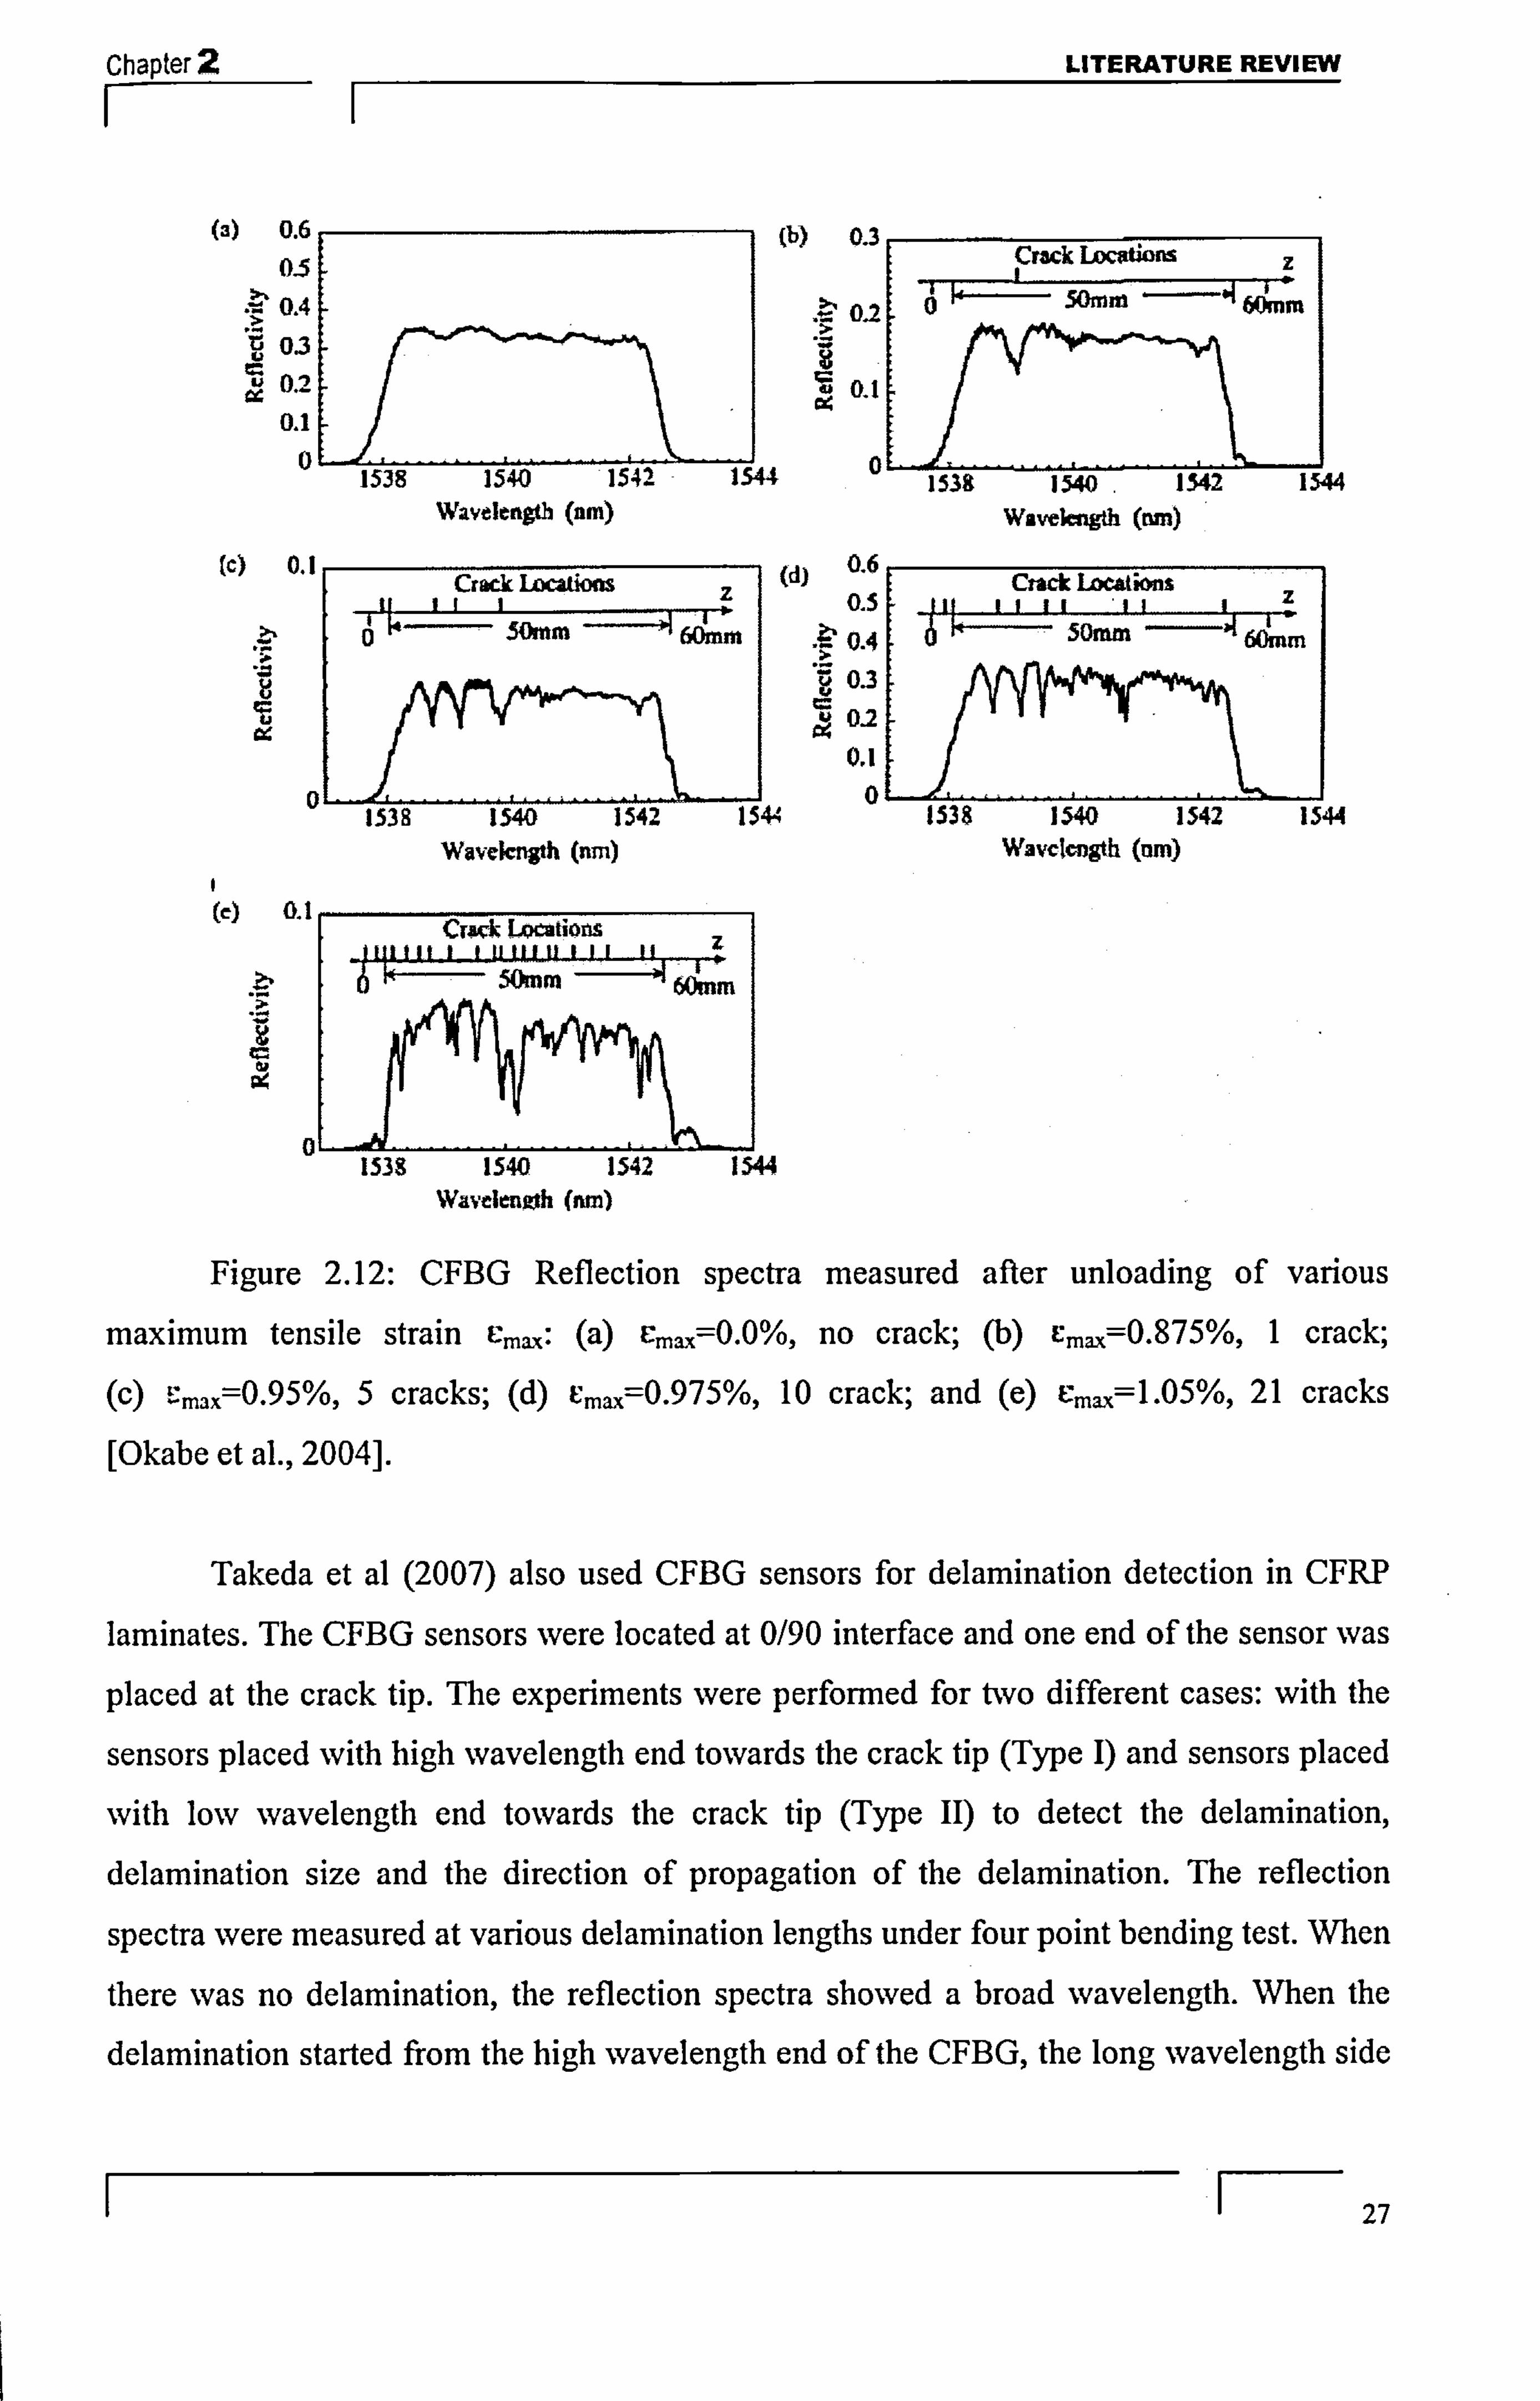
and crack position can be determined. Figure 2.12 shows the reflection spectrum recorded by Okabe et al. (2004) after unloading the specimen containing cracks at various maximum
strains. Small diameter CFBG sensors were also employed in a similar way to detect and locate the crack [Okabe et al., 2004]. In this case the dip was narrower as the small diameter CFBG sensor has larger amplitude of index modulation and hence higher spatial
resolution.
1 26
Chapter 2 LITERATURE REVIEW II
0.6
0-5
0.4
(b) 0.3
03 oi 0.1
1538 1540 1542 1544
0.1
Wavelenob (nm)
F- Crack 1A)catim 7
0 50min "n,
Waveknrh (nm)
0.2
,ä0.1 c4
(d)
44
Cr3ck L"ions z
60mm
Wa-ktWh (nm) 44
Crack Locatifts
it IIIIIIIz
50nun -" 60imm
Wavclcngth (nm) 14
1538 1540 1542 1544 Wavelenoh Nn)
Figure 2.12: CFBG Reflection spectra measured after unloading of various
maximum tensile strain (a) u,, ý, =O. O%, no crack; (b) c",, ý'=0.875%, 1 crack;
(c) -',,,, =0.95%, 5 cracks; (d) v,,, -, =0.975%, 10 crack; and (e) V,, ", '=l. 05%, 21 cracks [Okabe et al., 2004].
Takeda et al (2007) also used CFBG sensors for delamination detection in CFRP
laminates. The CFBG sensors were located at 0/90 interface and one end of the sensor was
placed at the crack tip. The experiments were performed for two different cases: with the
sensors placed with high wavelength end towards the crack tip (Type 1) and sensors placed
with low wavelength end towards the crack tip (Type 11) to detect the delamination,
delamination size and the direction of propagation of the delamination. The reflection
spectra were measured at various delamination lengths under four point bending test. When
there was no delamination, the reflection spectra showed a broad wavelength. When the
delamination started from the high wavelength end of the CFBG, the long wavelength side
Crack Locations 111111 11 11 , 11111 111 11 z Iý lk 50mm " 6dm,
1 27

Chapter 2 LITERATURE REVIEW
of the reflection spectrum shifted to longer wavelengths and the broad reflection spectrum
was divided into two halves. As the delamination propagated, the division of the spectrum
moved to long wavelengths and the longer wavelength shift increased (the spectrum width
increased) with the increase in delamination length. This effect is due to the release of
thermal residual strain in 0' ply as a result of delamination growth. When the delamination
starts and propagates from the low wavelength end of the CFBG, the change in the
reflection spectrum was not remarkable but the spectrum width decreased with increase in
delamination length. This is because the short wavelength component corresponding to
delamination region shifts to longer wavelength due to delamination growth but was
superimposed into the longer wavelength end. Embedded CFBG sensors were also investigated for detection of a combination of
damage processes (splits, cracks and delamination) in cross-ply CFRP laminates. For
example, Yashiro et al (2007) investigated the effect on the CFBG reflection spectrum of
each type of damage process (split, crack and delarnination) due to holes in the specimen.
They embedded the CFBG sensor close to 0/90 interface and the high wavelength end of
CFBG near the hole edge. Quasi-static loading was applied and the reflection spectra were
measured at various applied strains while the load was held constant. Before the onset of
cracks and delamination, the spectrum was broader with decreased reflectivity at higher
wavelengths. This is due to stress concentration around the hole. When the cracks appear,
some dips occurred in the reflection spectra at certain wavelengths. This is due to non-
uniforrn stress distribution caused by the transverse cracks. The number of dips increased
with the increase in transverse cracks. At the onset of delamination the decreased
reflectivity at higher wavelengths was recovered and as the delamination grew, the
reflectivity of the region close to the recovered region decreased while the recovered region became broader.
2.4.3.2. Damage in adhesive bonded joint/ patch repairs: - FBG sensors have been used by many authors [McKenzie et al., 2000; Jones et al.,
2002; Li et al., 2004; Herzsberg et al., 2005; Marioli-Riga et al., 2005; Takeda et al., 2004; Minakuchi et al., 2007] as either surface mounted, embedded within composites or
placed in the adhesive layer, to detect defects in adhesively bonded joints or adhesive bonded patch repairs. Jones, Galea and colleagues [McKenzie et al., 2000; Jones et al.,
2002] demonstrated that it is possible to monitor the disbond growth using an array of
1 28
Chapter 2 LITERATURE REVIEW
surface-mounted uniform FBG sensors in the aluminium skin of a honeycomb sandwich
panel that had been repaired with a boron/epoxy patch. The possibility of monitoring disbond grow-th is through changes in the residual thermal strain of a patch repair because
when the patch disbonds, the thermal residual strain is released and the FBG sensor shows
this signal change with respect to the input signal (the thermal strain occurs due to the
thermal expansion mismatch of a composite patch bonded at elevated temperature to a
metal substrate). Embedded FBGs have also been utilised for the health monitoring of adhesively
bonded joints/repairs [Li et al., 2004; Herzsberg et al., 2005; Marioli-Riga et al., 2005;
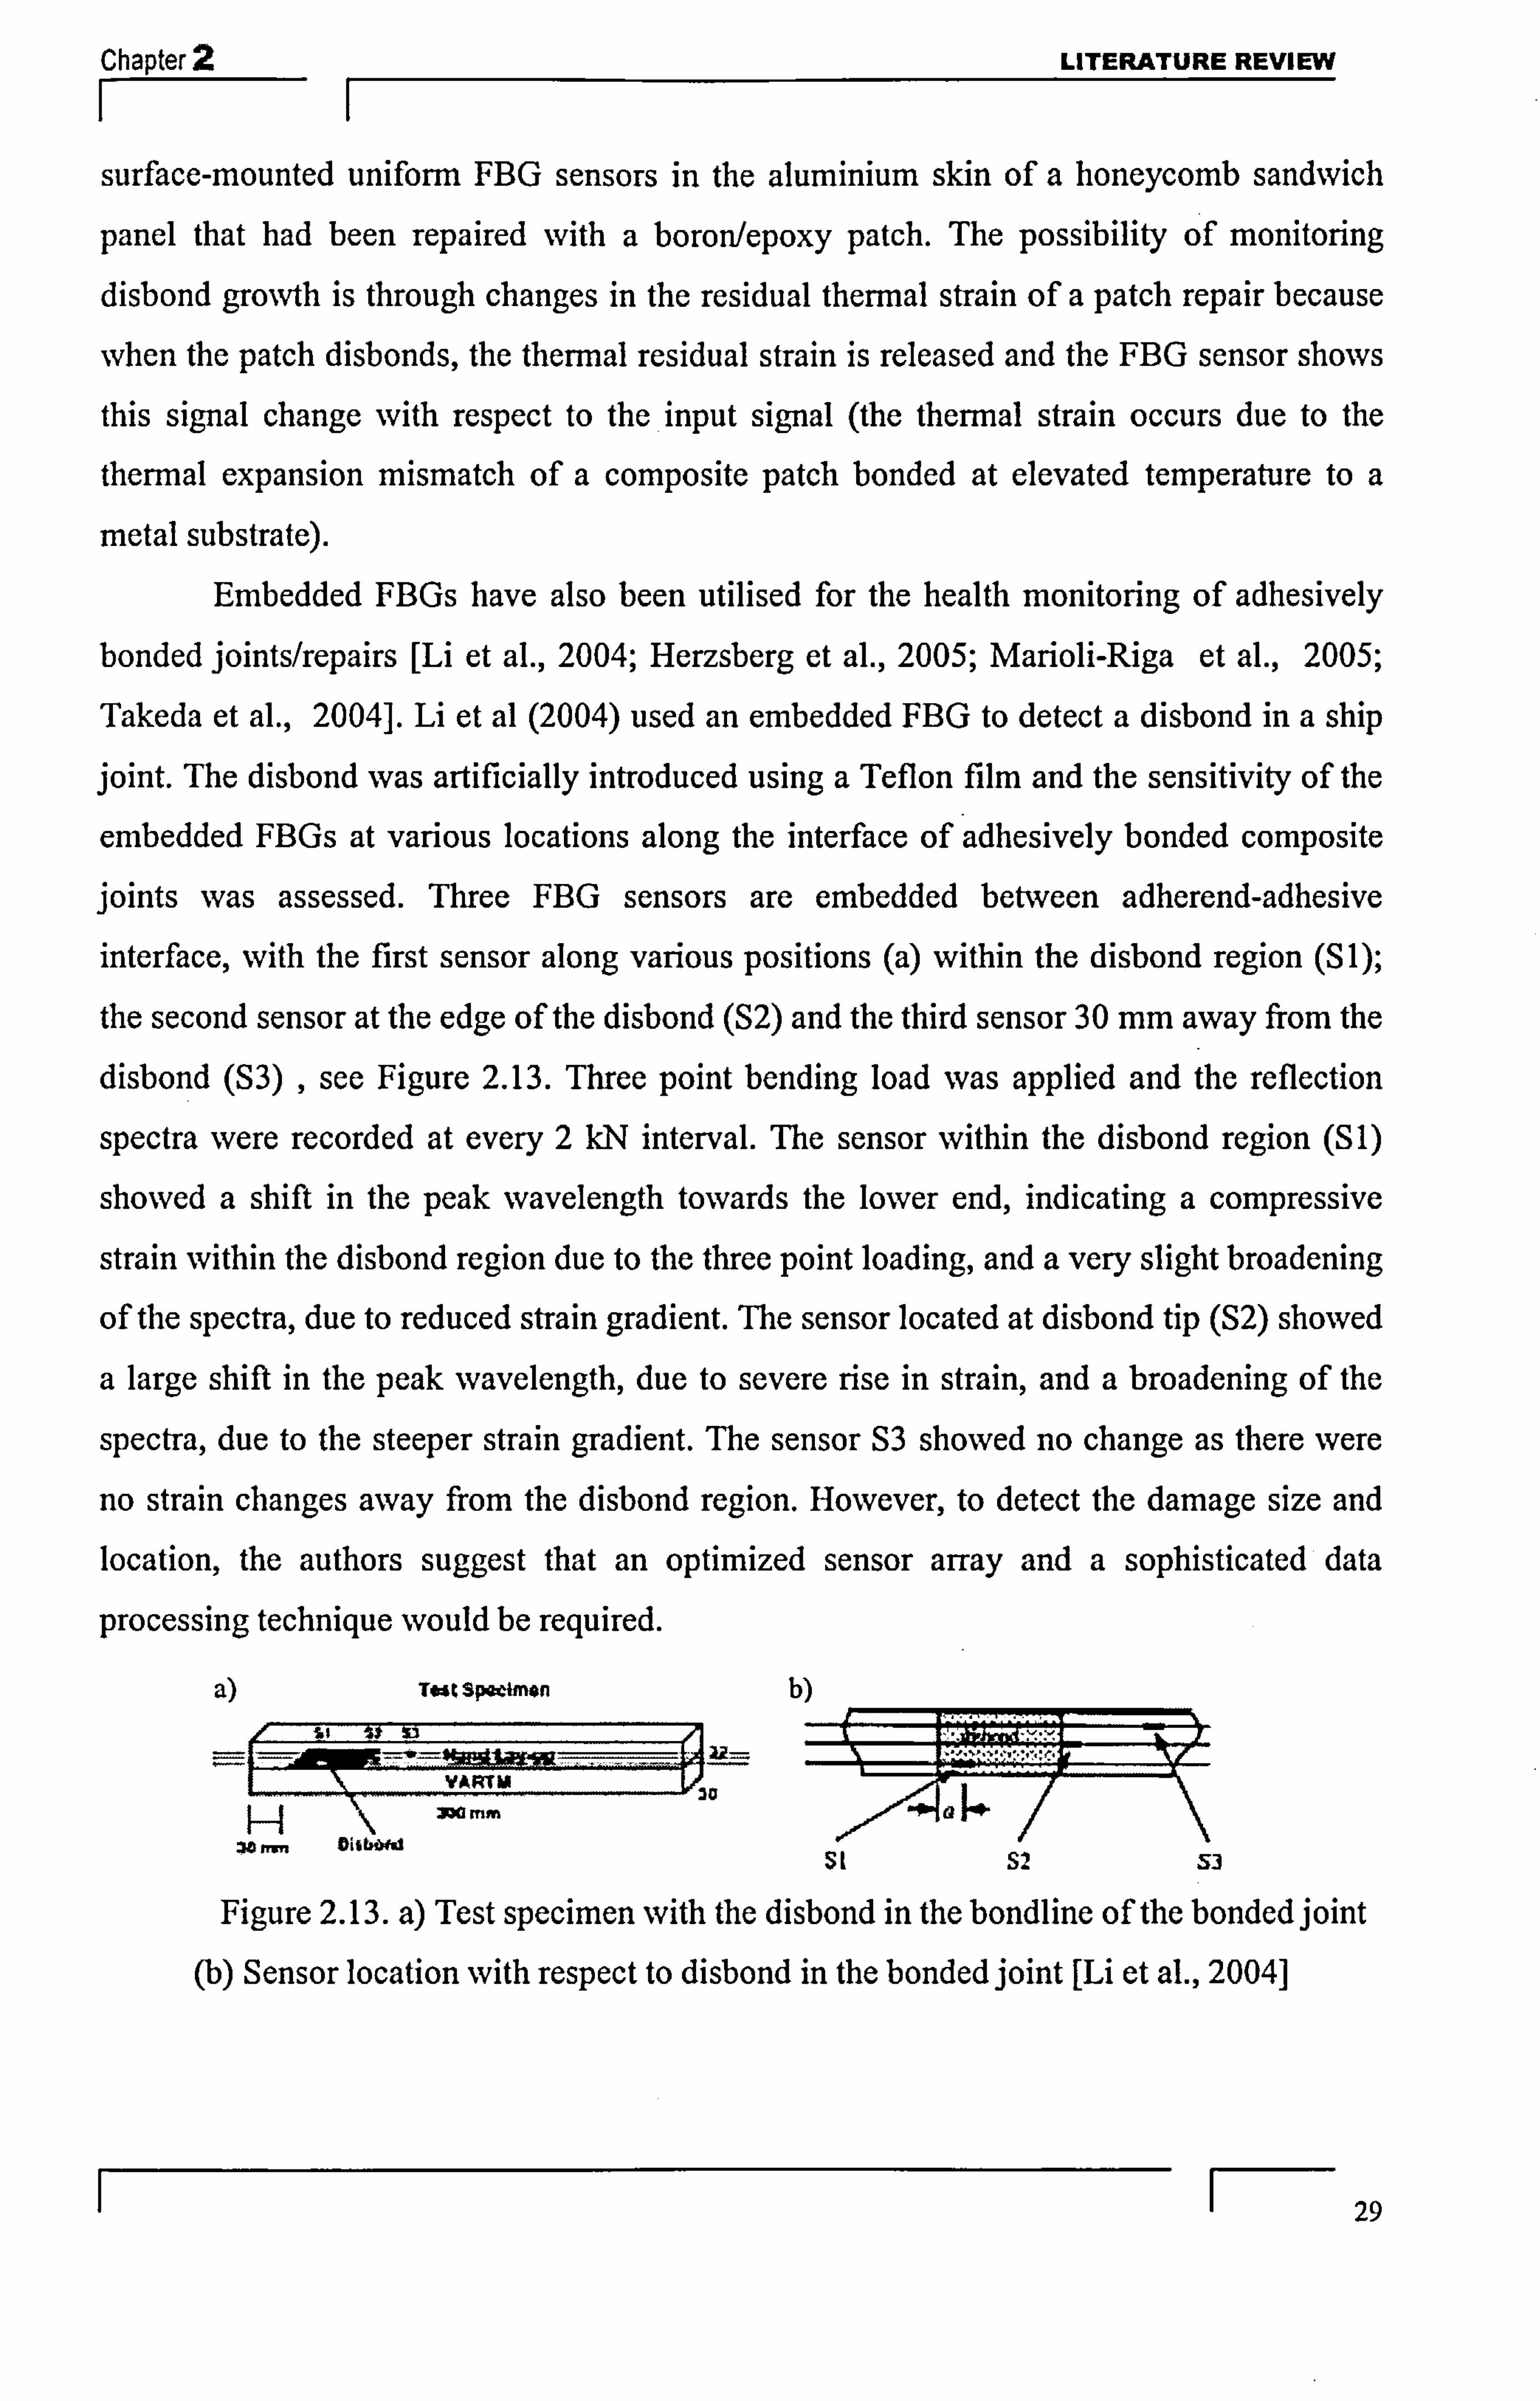
Takeda et al., 2004]. Li et al (2004) used an embedded FBG to detect a disbond in a ship joint. The disbond was artificially introduced using a Teflon film and the sensitivity of the
embedded FBGs at various locations along the interface of adhesively bonded composite joints was assessed. Three FBG sensors are embedded between adherend-adhesive interface, with the first sensor along various positions (a) within the disbond region (SI);
the second sensor at the edge of the disbond (S2) and the third sensor 30 mm away from the
disbond (S3) , see Figure 2.13. Three point bending load was applied and the reflection
spectra were recorded at every 2 kN interval. The sensor within the disbond region (SI)
showed a shift in the peak wavelength towards the lower end, indicating a compressive
strain within the disbond region due to the three point loading, and a very slight broadening
of the spectra, due to reduced strain gradient. The sensor located at disbond tip (S2) showed
a large shift in the peak wavelength, due to severe rise in strain, and a broadening of the
spectra, due to the steeper strain gradient. The sensor S3 showed no change as there were
no strain changes away from the disbond region. However, to detect the damage size and location, the authors suggest that an optimized sensor array and a sophisticated data
processing technique would be required.
a) Testspechnon b)
VARTM
3MMM a H "--4" 1- /
Wý Si S2 S3
Figure 2.13. a) Test specimen with the disbond in the bondline of the bonded joint
(b) Sensor location with respect to disbond in the bonded joint [Li et al., 2004]
I F- 29
Chapter 2 LITERATURE REVIEW
A Apart from normal diameter FBG sensors for damage detection in bonded
joints/repairs, small diameter FBG sensors were also used for damage detection by locating
them in the adhesive layer [Takeda et al., 2004; Minakuchi et al., 2007]. The form of the
reflection spectrum changed as the disbonding length increased. Under no disbond, the
FBG reflection spectrum showed a single peak. However, when the disbond reached the
FBG sensors another peak appeared at the shorter wavelength. The intensity of the shorter
wavelength increased relatively as the disbond length increased [Takeda et al., 2004].
Detection of both disbond and crack propagation in an aluminium plate patched with CFRP
was also discussed by Takeda et al (2004). The authors proposed that the appearance of
shorter and longer wavelength components to the existing reflection spectrum indicated the
existence of a disbond and a crack respectively. Takeda and colleagues [Minakuchi et al.,
2007] also proposed the use of an embedded small diameter FBG sensor for disbond
detection in a sandwich panel consisting of CFRP face sheet and an aluminium honeycomb
core. The small diameter sensor was embedded through a small slit in the adhesive layer
between the composite facesheet and honeycomb core during curing. The disbond in the
sandwich honeycomb structure was detected by the recovery of the reflection spectrum to
its original shape. The reflection spectrum recorded before curing is said to be the original
shaped reflection spectrum. On curing, the reflection spectrum was distorted due to the
non-uniform strain distribution induced by the formation of a fillet between the core and facesheet. When the disbond occured, this non-uniform strain was released and hence the
reflection spectrum gained its original shape.
SUMMARY:
In this chapter, an overview of matrix cracking in composite laminates and
disbonding in adhesively bonded joint/repairs was presented together with various NDT
techniques available for damage detection. In the subsequent sections optical fibre sensors
and in particular FBG and CFBG sensors are discussed. CFBG sensors are reported to have
the ability to indicate the position of the damage, but relatively little research has been
undertaken for matrix damage detection using CFBG sensors and more importantly none of
the work was performed to study the behaviour and to detect the matrix damage in a GFRP
laminate using CFBG sensors. In the case of disbonding in bonded joints, none of the
techniques mentioned can both indicate that a disbond has formed and monitor its
progression. Both of these areas of damage detection have been studied within this thesis.
1 F- 30

Chapter LITERATURE REVIEW
In the next chapter, the background theory of matrix damage in a composite laminate, an
adhesively bonded joint and a fibre Bragg grating are presented. The tool used to predict
the FBG reflection spectrum is also presented in next chapter.
1 31
Chapter 3 BACKGROUND THEORIES AND TOOLS
F- I CHAPTER .3
BACKGROUND THEORIES AND TOOLS
3.1. INTRODUCTION
This chapter is aimed at giving an introduction to the theoretical background
relevant to the work described in this thesis. In section 3.2, a brief discussion of the stress
redistribution in cracked cross-ply laminates is provided. Section 3.3 gives an overview of
adhesively bonded joints and the stresses in the single lap bonded joint. In section 3.4, a brief description is given on the theory relevant to fibre Bragg gratings, both uniform and
chirped. The computational tool used for the prediction of the FBG reflected spectra, the
commercial FBG software, OptiGrating [version 4.2], is discussed in section 3.5.
3.2. MATRIX CRACKING
Matrix cracking detection in the cross-ply laminates is one of the aims of the study
and hence it is important to understand the stress distribution for undamaged and damaged
laminates. For an undamaged cross-ply composite consisting of a central 90' ply with
thickness 2d and an outer 0' ply with thickness d (see Figure 3.1), the longitudinal stresses in the longitudinal plies (cF, ) and transverse plies (CY2) are given by
=a El
+ UT (eqn. 3.1) Eo
CY'2 ý C.
L2 +a
T (eqn. 3.2) Eo
where E, is the Young's modulus parallel to fibres ; E2 is the Young's modulus
perpendicular to fibres; CYT is the residual thermal stresses arising from the difference in the
thermal expansion coefficients in a direction along the fibres ao and in a direction
perpendicular to the fibres aO and EO is the composite Young's modulus parallel to the loading direction.
Eo is calculated using the equation
Eo = (bEl + dE2)
(eqn. 3.3) (b + d)
1 32

Chapter BACKGROUND THEORIES AND TOOLS
Matrix cracking in the transverse 900 plies is the first macroscopic damaged mode in the cross-ply laminate. The transverse matrix cracking causes the redistribution of
mechanical stress and the release of then-nal strain in the 90' plies in the cross-ply laminate.
To analyse the stress redistribution in a laminate when a transverse matrix crack is present,
a shear-lag model is widely used. According to this model, when the transverse ply
undergoes matrix cracking parallel to the fibres in this ply and perpendicular to the
longitudinal ply in the vicinity of the crack, the transverse ply carries no load and hence it is
taken by the adjacent longitudinal plies. Away from the crack, the load is shed back into the
transverse ply via shear. Matrix crýack MatrIx crack
-i- ä0-- 000000w0 jo. 0 O< o
00 0
cý x Qo
XZO
Figure3.1. Schematic edge view of a simple cross ply laminate with two consecutive
matrix cracks in the transverse ply of (0190), composite [Ussario, 2004]
The longitudinal stresses of the damaged composite in the longitudinal plies (CFI(D))
and the transverse plies (02(D)), with the origin of the co-ordinate at the middle of the
transverse ply midway between two cracks spaced 2s (see Figure 3.1), are given by
[Boniface et al., 1989]
ddE cosh(Ax) (eqn. 3.5) al (D) = 60 + -L-) (6 2+ 0700
bb Eo c. sh(, I, ))
072(D) =(a -: ýI+
aT)(1 - cosh(2x) (eqn. 3.6) Eo cosh(As)
The stress redistribution factor, X, is given by
A2 = 3G(b + d)E,,
(eqn. 3.7) hd 2 EIE2
where G is the shear modulus of the composite material. Assuming oT= 0, the longitudinal stress distribution at the longitudinal plies (a, ) and
transverse plies ((y2) are shown in the Figure 3.2.
1 33
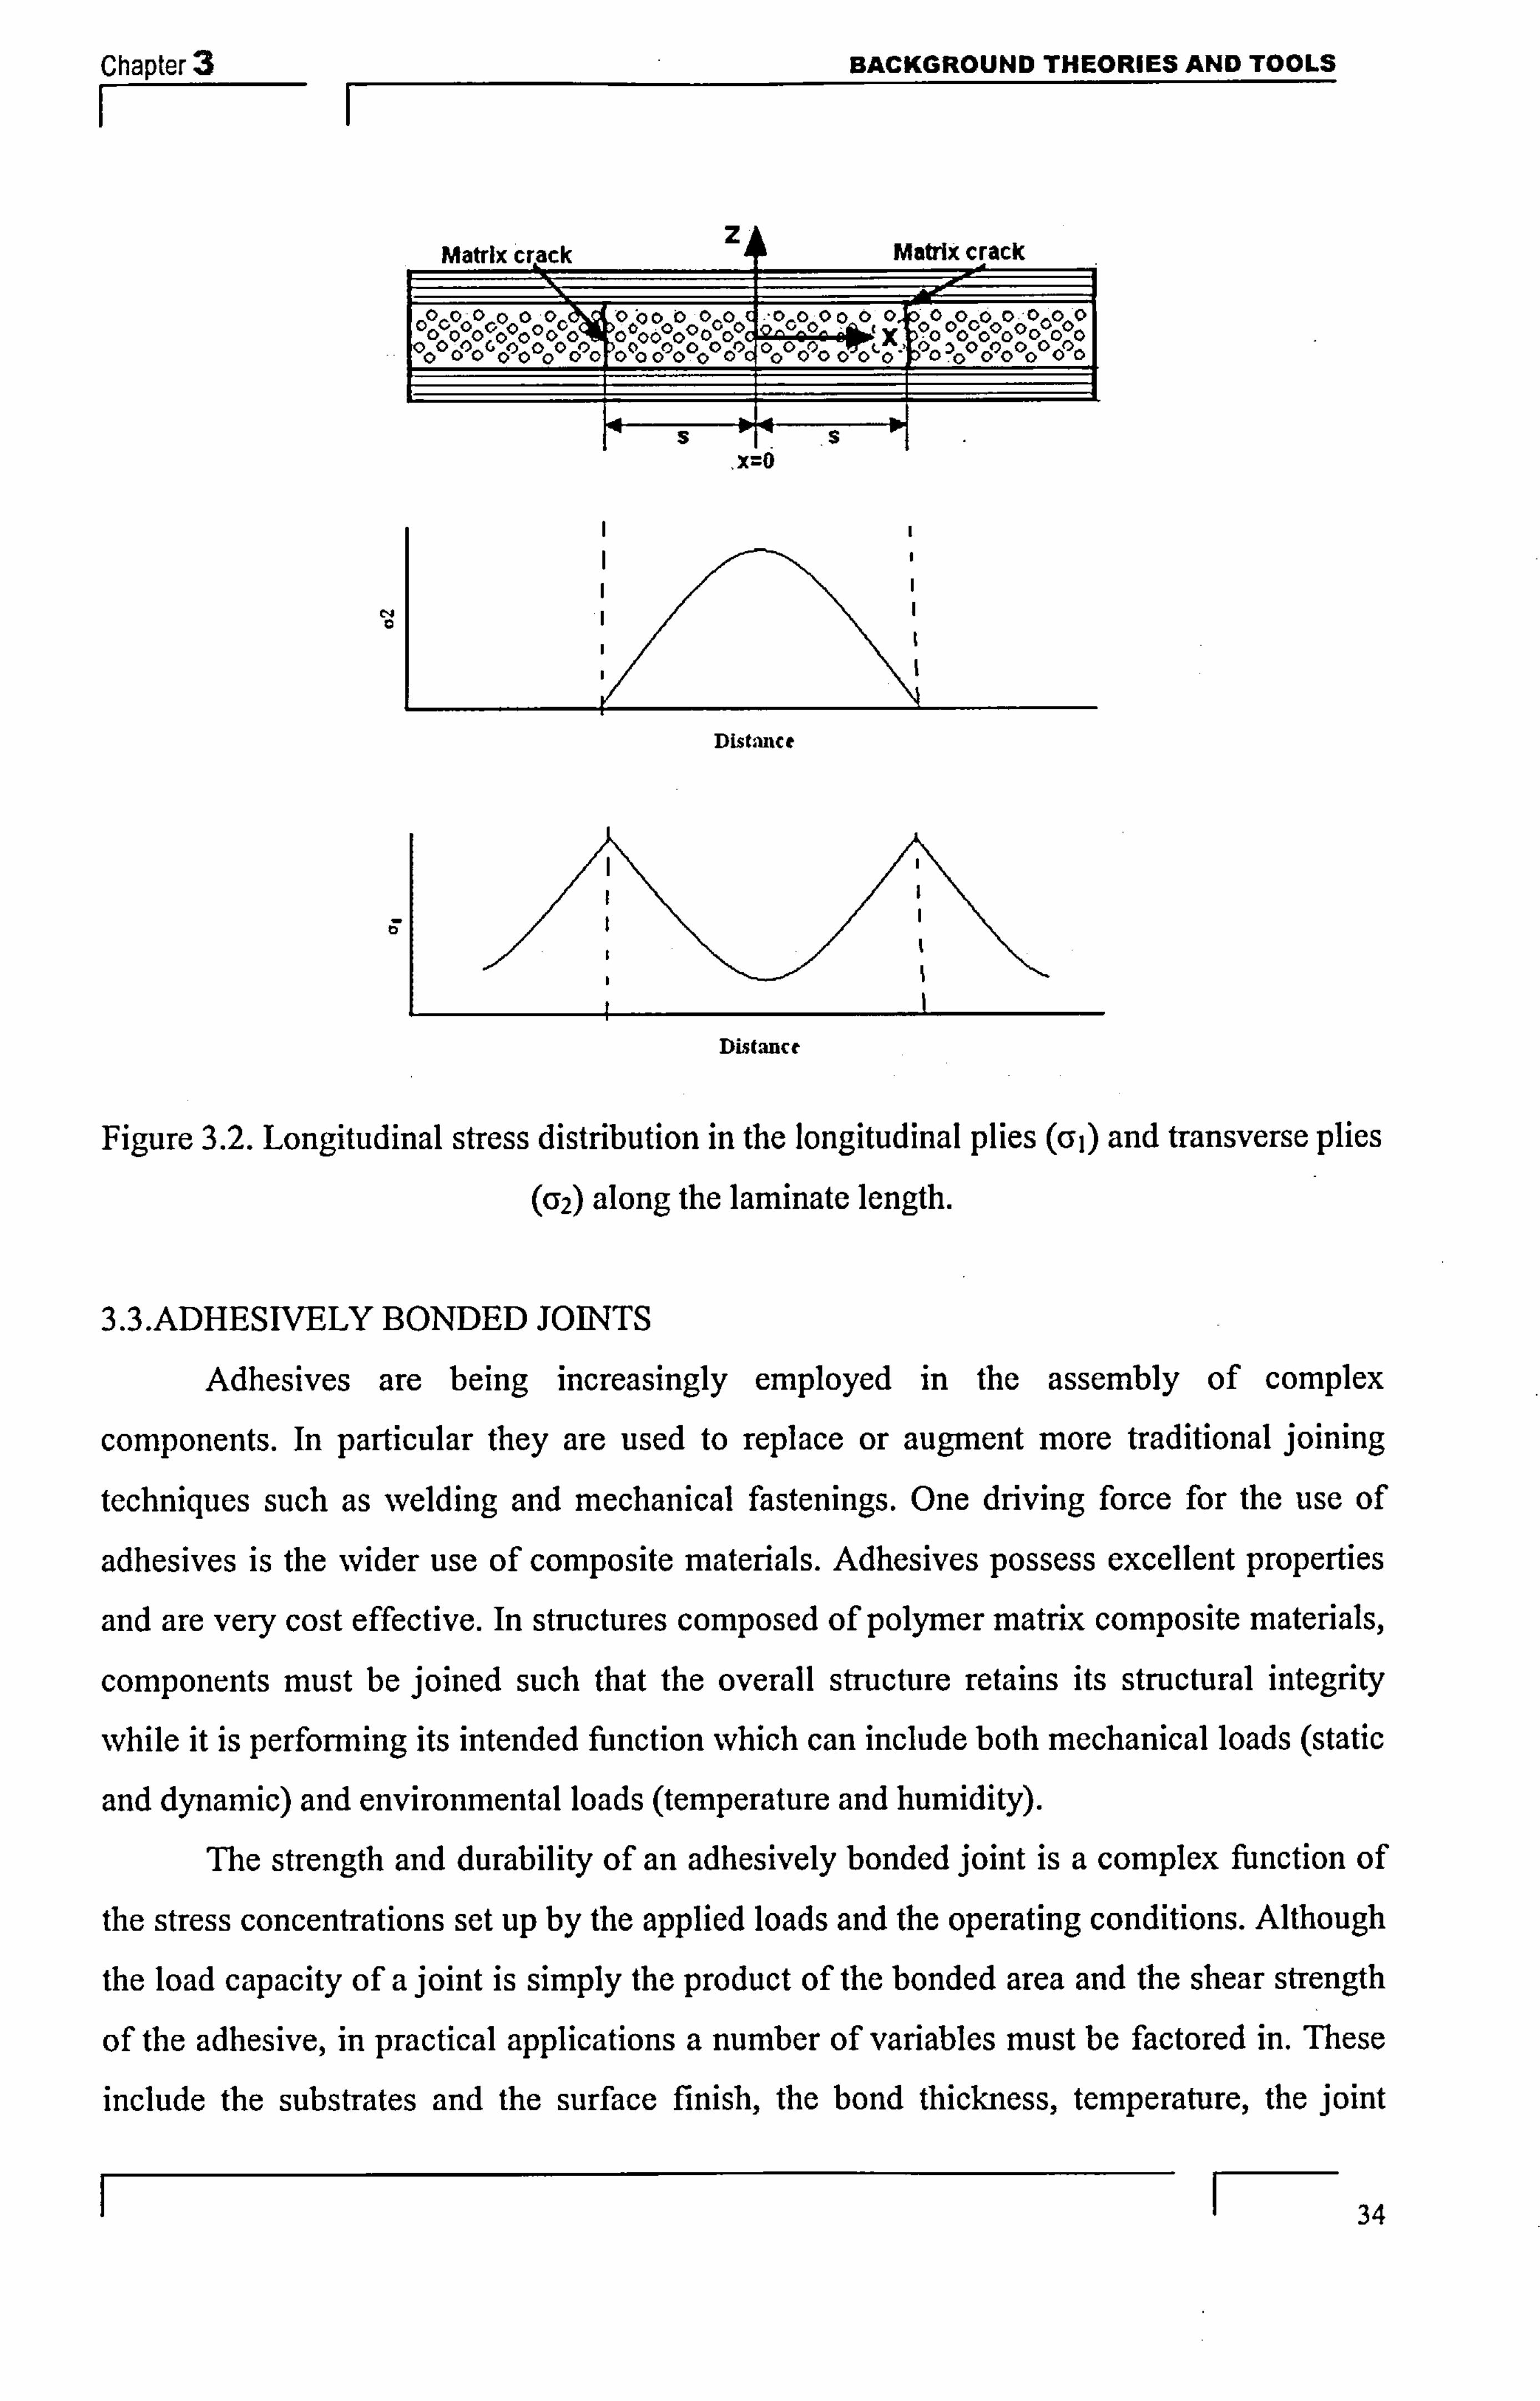
Chapter
, X=o
BACKGROUND THEORIES AND TOOLS
Distmict
Distance
Figure 3.2. Longitudinal stress distribution in the longitudinal plies ((;, ) and transverse plies (cF2) along the laminate length.
3.3. ADHESIVELY BONDED JOINTS
Adhesives are being increasingly employed in the assembly of complex
components. In particular they are used to replace or augment more traditional joining
techniques such as welding and mechanical fastenings. One driving force for the use of
adhesives is the wider use of composite materials. Adhesives possess excellent properties
and are very cost effective. In structures composed of polymer matrix composite materials,
components must be joined such that the overall structure retains its structural integrity
while it is performing its intended function which can include both mechanical loads (static
and dynamic) and environmental loads (temperature and humidity).
The strength and durability of an adhesively bonded joint is a complex function of
the stress concentrations set up by the applied loads and the operating conditions. Although
the load capacity of a joint is simply the product of the bonded area and the shear strength
of the adhesive, in practical applications a number of variables must be factored in. These
include the substrates and the surface finish, the bond thickness, temperature, the joint
1 34

Chapter 3 13ACKGROUND THEORIES AND TOOLS
geometry and the environment [Papnini et al., 1994; Ashford et al., 200 1 ]. Of the different
joint geometries such as single-lap joints, double-lap joints, scarf joints and step-lap joints,
single-lap joints (SLJs) are of much interest and widely studied for two reasons: they are
employed extensively in various configurations for a wide range of industrial products and they have simple and convenient test geometry for evaluating adhesively bonded joints.
The simplest model to calculate the adhesive shear stress Q in a single lap joint
under load as shown in Figure 3.3, is given by
p (eqn. 3.8) bl
where the applied force is P, the overlap length 1, and width b. Here the adherends are
assumed rigid and the adhesive may deform only in shear, and hence there will be a
uniform shear stress throughout the adhesive. However, this simple model is not valid as the stresses in the adhesive layer are not uniform. The simple lap joint has stress
concentrations due to differential shear of the bonded structures and the load eccentricity. The non-uniform deformation of the adhesive layer under loading is known as differential
shear. Hence, the adhesive layer will no longer be solely in shear, but will have peeling
stresses at the end of the joint.
Mmge Shw St-s
Figure 3.3. Simple rigid adherend model of single lap joint [Adams and Comyn, 2000]
P
Transverse (or Peel) Stress
Figure 3.4. Goland and Reissner bending model [Adams and Comyn, 2000]
1 35

Chapter
F- BACKGROUND THEORIES AND TOOLS
Goland and Reissner (1944) took the load eccentricity into account by relating the
moment at the adherend ends to the applied load and calculated the stress distribution in the
adherend and the adhesive. They assumed the adhesive to be elastic and have the same
material property as the adherends. They presented closed form solutions for calculating the
stress distribution in the single lap joint for ihvo cases:
a) The adhesive layer is extremely thin and rigid, so that its deformations are of little
importance. This is quantified by the condition I-'
<< -t; -t" << -t where t, and E" are the E,, E G, G
thickness and Young's modulus of the adhesive respectively; t and E are thickness and Young's modulus of the adherend respectively; Ga and G are the shear modulus of adhesive
and adherend respectively. From this analysis, the stress distribution along the adherend can be calculated.
b) The adhesive layer is thick and flexible so that its deformation makes a significant
contribution to the stress distribution in the joint. This was quantified by the
f ta It condition << << ". From this analysis, the stress distribution along the adhesive E E,, G G,,
can be calculated.
Figure 3.4 illustrates the joint defon-nation and the adhesive peel stress predicted by
the Goland and Reissner model under tensile loading. From the model, it was observed that
the adhesive peel stress peaks at the ends of the overlap and the adhesive shear stress varies
along the length of the joint with concentrations at the ends. The adherend shear stress was low at the adherend free ends and peaks at the overlap ends. Further details on the stress distribution in the adherend along the overlap length are given in Chapter 8.
3.4. BRAGG GRATING SENSORS
Fibre Bragg grating technology developed rapidly ftom 1989 when it was shown that
gratings could be written into the core of optical fibres using UV light [Othonos, 1997].
Now they are widely adopted in modem optical fibre telecommunications and sensor
systems. A phase mask technique was used to fabricate the FBG sensors by our
collaborators in Singapore for our application. In the phase mask method the phase mask is
used as a diffractive element and the UV light is focused on the optical fibre, which is
beneath the phase mask, to produce a permanent refractive index change in the core of the
I F- 36
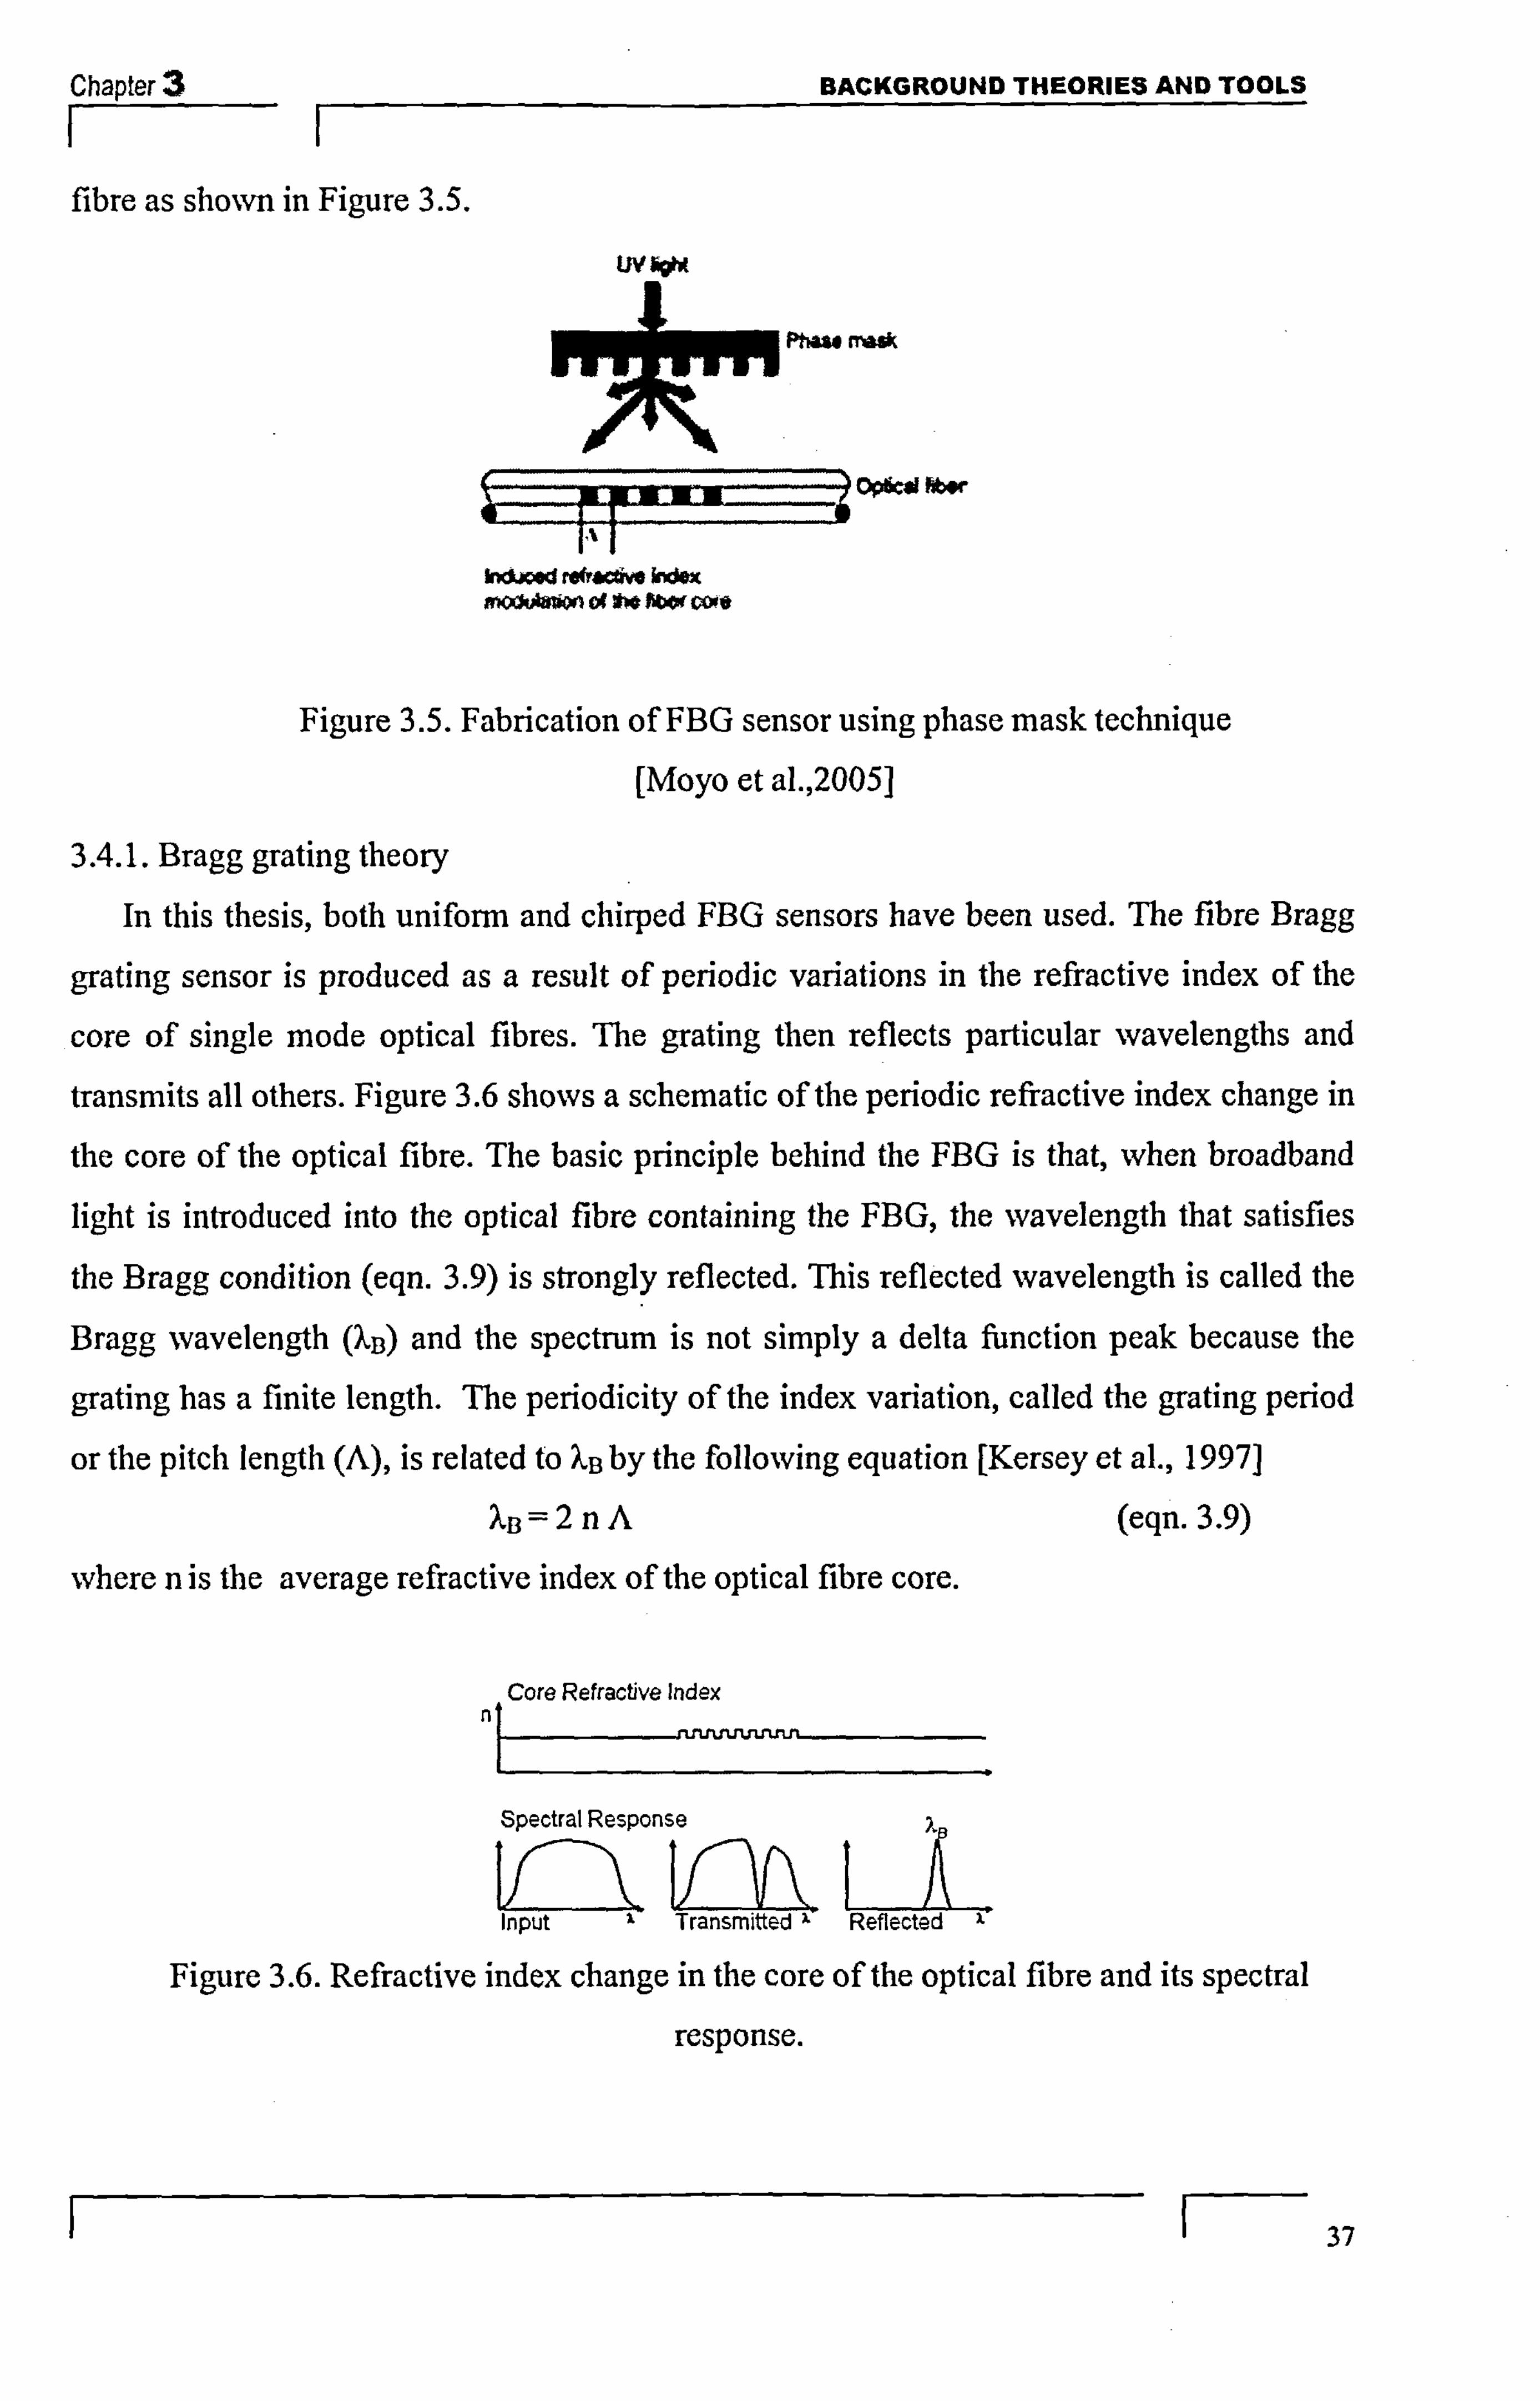
Chapter 3_ BACKGROUND THEORIES AND TOOLS
fibre as shown in Figure 3.5.
phäu n"
E-= ý Opkd m»r m119 1A1 klama robacgw kb*X mauwwn of v» fter voge
Figure 3.5. Fabrication of FBG sensor using phase mask technique
[Moyo et al., 2005]
3.4.1. Bragg grating theory
In this thesis, both uniforin and chirped FBG sensors have been used. The fibre Bragg
grating sensor is produced as a result of periodic variations in the refractive index of the
core of single mode optical fibres. The grating then reflects particular wavelengths and
transmits all others. Figure 3.6 shows a schematic of the periodic refractive index change in
the core of the optical fibre. The basic principle behind the FBG is that, when broadband
light is introduced into the optical fibre containing the FBG, the wavelength that satisfies
the Bragg condition (eqn. 3.9) is strongly reflected. This reflected wavelength is called the
Bragg wavelength (XiB) and the spectrum is not simply a delta function peak because the
grating has a finite length. The periodicity of the index variation, called the gating period
or the pitch length (A), is related to XB by the following equation [Kersey et al., 1997] X13=2 nA (eqn. 3.9)
where n is the average refractive index of the optical fibre core.
Core Refracfive Index n
Spectral Response ulý
Figure 3.6. Refractive index change in the core of the optical fibre and its spectral
response.
37

Chapter
F-- 3.4.1.1. Unifonn FBG
BACKGROUND THEORIES AND TOOLS
In a unifonn FBG, the grating period changes unifonuly and hence when broadband
light propagates through the unifonn FBG sensor, a single peak Bragg wavelength is
reflected. Figure 3.7 shows the optical fibre with a uniform FBG, with its reflected
spectrum and transmitted spectrum Nvhen the light is passed into the fibre.
Liput spectilun 1-0 0-9
0.6
0.4
0.2
O. OL
1552 1354 1556 15.53 Wiveknrl (mn)
Reflected specti-tun I. U 0.9 0.6 0.4 ol
1552 1554 1ý56 Wave] et. g-. b (=)
Tnuumitted spectnun Fiber Core Optical Fiber Index Modulation
.... I-C- S1 0.8-
VU ............... - --Zk.
'9 13*
)b: CL2-
L r, 4
1-554 1565
wave*rKM (nm)
. ..........
X 2nA 0
Fiber Axis
Figure 3.7. Light propagation in uniform FBG [Kersey et al., 1997]
From equation 3.8, it is clear that a shift in the Bragg wavelength would be observed
when the grating pitch or the refractive index changes. The grating pitch or the refractive index undergoes changes due to an externally applied load or temperature and the shift in
Bragg wavelength can be expressed [Kersey et al., 1997] as: 2
AA=2nA(j1-(Il )IP12-V(PII+PI2)1Pý6+[a+((dn (eqn. 3.10) 2 dT
where F is applied strain, P11 and P12 are Pockel's strain optic constants, v is Poissons' ratio,
a is the coefficient of then-nal expansion of the fibre material and AT is the temperature
change. Consequently, the theoretical wavelength shift for isothermal conditions when the
FBG is uniformly strained is given by [Rao, 1999]:
Ak=)6B (I -Pa)AF- (eqn. 3.11)
where p,, is the photoelastic coefficient of the fibre ( 0.22 for silica) and AF is change in the
applied longitudinal strain. For a unifonn strain, the peak wavelength is shifted according
to equation 3.11. Figure 3.8 shows the single peak wavelength shift in the reflection
I F- 38

Chapter 3_ BACKGROUND THEORIES AND TOOLS
spectrum as the fibres are uniformly strained. However, for a FBG subjected to non-
uniform axial strain under isothermal conditions, the wavelength shift is given by
A4Z)=14 (1-pa) Agz(z) (eqn. 3.12)
In this case, due to the non-uniform strain, the reflection spectrum is distorted. This
phenomenon can be used for damage detection [Okabe et aL, 2000; Okabe et al., 2002; Li
et al., 2004; Herzsberg et al., 2005] ]
iI
t1
1
Figure 3.8. Shift in the peak wavelength of unifonn FBG as the sensors are strained
3.4.1.2. Chirped FBG:
Chirped FBG sensors have a linearly increasing grating period. The Bragg
wavelength is different for each different period and hence a spectral band of wavelength is
reflected when a broadband light is coupled to the fibre. Thus the reflected wavelength is
also related to the position along the grating. Figure 3.9 shows a schematic of how the
grating period and the reflection spectrum change for the uniform and the chirped FBG. For
a CFBG experiencing a uniform strain, there is a uniform increase in grating period and the
whole reflected spectrum is shifted uniformly. The equations to calculate the grating period
and the refractive index from the axial strain are given by [Okabe et al., 2004]:
Grating period: A(z)=Ao(z)[I+Ez(z)]
where A, (z) = A, + AA(z -g 2
Refractive index:
n(Z) = ný, - 70 (P12 -V(PII +P12)ICz (Z)
(eqn. 3.13)
(eqn. 3.14)
(eqn. 3.15)
F- 39

Chapter 3 BACKGROUND THEORIES AND TOOLS
where AO is the initial grating period, no is the initial refractive index, A, is the central
grating period, AA is the linear change of the period along the grating, Lg is the grating length and z is the position along the grating from the end with the smallest period. The
properties of the chirped FBG used in this work are given in Table 4.2 of Chapter 4. Under
non-uniform strain conditions, the grating period at the particular location of the non-
uniforrn strain undergoes changes and hence the reflection spectrum at that region is
distorted, with the other parts of the reflection spectrum remaining essentially undisturbed.
Figure 3.9. Schematic Grating period and reflection spectra of
(a) uniform FBG, and (b) CFBG.
3.5. SPECTRUM PREDICTION SOFTWARE (OPTIGRATING)
A commercially available software package, OptiGrating [version 4.2], was used to
predict the reflection spectrum of the optical Bragg grating sensor once the strain distribution was known. In the software, the reflection spectra were predicted by defining
parameters such as the index profile of the fibres, the grating shape, the average index
change, the grating period chirp, the length, the strain-optic parameters and the thermo-
optic parameters. The reflection spectra could then be predicted for the sensor under the
unstrained and strained condition. When the prediction was made for strained condition,
either the strain distribution experienced by the sensor was defined or the gating period
and refractive change due to the strain changes were defined. Once all the parameters were
set up, numerical simulations were performed within OptiGrating by inbuilt equations and
the grating device characteristics, which include the reflection spectrum and the
transmission spectrum, are predicted. 1
40

Chapter BACKGROUND THEORIES AND TOOLS
In our study the experimental results from the fibre Bragg grating are compared
with the predicted OptiGrating reflection spectrum results. The studies of matrix cracking
and disbond detection involved non-unifonn strain distribution along the length of the
grating. The strain distribution was incorporated into the OptiGrating sofhvare and the
program was run to predict the spectrum. The parameters used in the software are given in
Table 3.1.
Table 3.1: Parameters used in OptiGrating
Core: Radius 4.5 gin Refractive index 1.45
Cladding:
Radius 62.5 [im Refractive index 1.44
Central wavelength 1.550 pm
Grating shape sine Average index change Uniform (0.0005) From
file
Period chirp No chirp(if uniform FBG)
or Linear (if chirped FBG)
Total chirp from file
Sensor length 10000 gm /15000 pm 30000 pm / 45000 gm/ 60000 pm
Index Modulation 0.0005/0.0002
Strain-optic parameters of fibre:
Photoelastic coefficients: P11 0.113 P12 0.252
Poisson's ratio 0.16
Thermo-optic parameters Not chosen Micro-strain linear /user defined
1 41

Chapter 3 BACKGROUND THEORIES AND TOOLS II
As mentioned above, for the OptiGrating prediction, there are two methods to
incorporate the strain distribution into the software. One method involved entering the
strain distribution as an equation which was fitted to the FE results. This equation was
entered within the user-defined micro-strain parameter of OptiGrating. The second method
was to calculate the modified grating period and refractive index using the equations 3.12
and 3.13 from the strain distribution. The first method was used when the strain profile was
simple (as in the matrix crack strain distribution, discussed in Chapter 5). This method was
simple, easy to apply and less time consuming when the strain distributions were simple. When the strain profile was complex (as in the disbond damage studies for the bonded joint
work), the second method was adopted [Okabe at al., 2004, Takeda et al., 2003]. An
equation solver within excel was used to calculate the grating period and refractive index
from the strain profile, which made the process of calculation easier. The calculation time
was reduced and hence this method was adopted for further studies, when the strain profile
was complex.
3.6. SUMMARY
In this chapter some background theory on matrix cracking in composite laminates and
stresses in bonded joints has been presented. In addition, theory for the fibre Bragg grating
sensors has been discussed and the methods used to predict the spectrum using the
OptiGrating software have been described. The next chapter outlines the experimental
methods used in the work.
1 42
Chapter 4 1
CHAPTER 4
MATERIALS AND METHODS
MATERIALS AND METHODS
4.1. INTRODUCTION
The present chapter describes the FBG sensor system used in the experimental work
and the methods adopted to carry out the experimental investigations. The first section describes the instruments utilised to build and operate the FBG sensor system and the
procedures for obtaining the reflection spectra when investigating either the matrix crack development or disbond detection. The second section is devoted to a description of the
manufacturing process for glass fibre/epoxy matrix cross-ply laminates with the embedded
sensors. The technique of developing single-lap composite bonded joints, without and with
manufacturing defects, is also described within this section. Loading of the specimens including tensile and fatigue loading are described in subsequent sections.
4.2. FBG SENSOR SYSTEM
4.2.1. FBG sensor system arrangement: The FBG system consists of a broadband light source, a coupler, an optical
spectrum analyzer (OSA) and a refractive index matching liquid, which was used to
eliminate the unwanted light reflections from the fibre ends. A schematic diagram of the
optical arrangement is shown in figure 4.1. All the connections in the system are through
single mode optical fibre. The starting point of the system is the broadband light source
which is connected to one of the four arms of a 3dB coupler. The second arm, at the same
end of the coupler, is connected to an Optical Spectrum Analyser (OSA). The light from the
broadband source passes through the coupler and is evenly split into two parts (see Figure
4.2). The FBG sensor embedded within a composite specimen is connected to one of the
two arms and the other ann is terminated in a black container of refractive index matching liquid (paraffin was used in this work, this avoided any reflection at the interface between
the optical fibre end and the liquid). The light through the other arm is transmitted to the
part of the optical fibre which is embedded in the specimen and contains the FBG sensor. This light is partly back-reflected and partly allowed through the grating. The transmitted
light is dispersed into a second container of refractive index matching liquid and absorbed
1 43

by -Che bolack walls of the containcr.
MAT- --S,
-dm arrangement. Figure 4.1. Diagram iBG s-vsL
j-". ",.
-, It 11 ;1 ;k liq
FWUre 4.2. Optical connections through 3 dB coupler. ý5
The reflected light from the FBG sensor carries the information relevant to the
experiment and fhe light passes through the coupler and is then analYsed and recorded using
the OSA. All opticai connections (i. e. the optical fibres) are stripped, cleaved and spliced. For s---ipping, chemical stripper (Nitromose) is used. The safety operating procedure WE. Ie
ýig, cleaving and splicing is attached in the 4A. The optical fibres are
spliced using an arc fusion splicer . 'actured by Fuji (see Figure 4.3"
4.2.2. ASE broadband source:
The Amplified Spontaneous Emission (ASE) broadband light source used in the
study is the JDS Uniphase / AFC Technolog; es (AFC BBS 15/16, see Figure 4.4). The
01101.14L power ot this source is aboul 3-mW, Cs. -ibuted over the whole rarp of the
waveleiýgthsbetween i520 nm to ýonnectionto the brO. -`-, S-Iullce
was rl-. ', a front parilel FC
44

Chapter 4 1
MATERIALS AND METHODS
This broadband source is classified under the class 3b laser source. Class 3b lasers
can present a major hazard through exposure to the direct or reflected laser beams, Nvhen there is a direct line-of-sight path to the laser beam or its reflection. Hence safety
regulations have to be followed while using the laser. Appendix 4B outlines the laser
product specification, laser beam hazards, the safety calculations relevant to the safe
operation of this laser and the safety procedures followed.
4.2.3. Optical spectrum Analyser (OSA):
The OSA used in our FBG system arrangement was a Type AQ-1425 (see figure
4.4) manufactured by Ando Electric Co., Ltd., Japan. This instrument detects the intensity
of light at each wavelength component. The shape of the intensity vs. wavelength diagram
(i. e. the light spectrum) is displayed on the OSA monitor. The way this analysis is carried
out by the device is by sweeping over a wavelength range, defined preliminarily by the
operator. The control panel in the OSA enables the setting of a series of parameters whose
value needs an adjustment to run the analysis of a specific light beam in the most efficient
way. The principal parameters for the OSA are: 1. centre wayelength: central value of the wavelength interval to be swept, 2. sweep width: amplitude of the wavelength interval to be swept, 3. resolution: amplitude of the wavelength interval to which a single intensity
data point is assigned 4. reference level: noise level for the current analysis
Figure 4.3: Are fusion splicer with controller and monitor used to splice the
optical fibres
1 45

Chapter4 I
MATERIALS AND METHODS
Figure 4.4 : ThorLabs ASE-FL7002 broadband source with type AQ-1425 optical
spectrum analyser
Once the centre wavelength and the sweep width have been given a value, the
sweep interval is completely defined. The instrument is capable of analysing wavelengths in the range 400nni to 1600nni and the wavelength range used in these experiments is 1525-
1575 nm. The resolution used in these experiments was I mn. The reference level of the
noise was set at -32 dB. All the above listed commands are adjusted by operating on the
instrument's built-in control panel. Once the parameters are setup manually in the OSA,
they are remotely controlled by a PC to run the sweep.
4.2.4. Reflection spectrum capturing procedure To capture the reflected spectrum from the optical sensors for the experiment, the
following basic procedure was followed:
switch on the ASE source
run a single sweep over the wavelength range through the PC-controlled OSA
store the analysis data for further processing. By launching broadband light through the single mode fibre to the FBG, the
reflected signal contains all the wavelengths which can be reflected by the FBG. This
spectrum was analysed and recorded with a single OSA sweep over the fixed wavelength
range. The reflection spectrum data was then stored as an MS-Excel readable file in the
fon-n of intensity for 560 data points which correspond to wavelength range. This was
converted to intensity against wavelength to be plotted as a spectrum.
1. F- 46

Chapter 4 MATERIALS AND METHODS
4.3. MATERIAL FABRICATION TECHNIQUES:
This thesis contains a study on detecting a matrix crack in composite laminates and disbonds (both service and manufacture) in composite-composite bonded joints using
chirped FBGs. The fabrication techniques for both studies are very similar. The process
starts with the preparation of the sensors and their incorporation into a GFRP laminate.
4.3.1. Sensor preparation
Both uniforrn FBG sensors and chirped FBG sensors were used in this work. The
uniform FBGs were 10mm long having a nominal Bragg wavelength of 1550 mn. The
CFBGs used were of various lengths (15 mm, 30 mm, 45 mm and 60 mm) written into the
core of a commercial single mode optical fibre. , All the CFBG sensors had the same
spectral bandwidth, having a full width at the half-maximum (FWHM) of the reflected
spectrum of 20 nm, and hence the sensors had different chirp rates (Table 4.1). The CFBG
sensors were supplied by the School of Electrical and Electronic Engineering, Nanyang
Technological University (NTU), Singapore. Table 4.2 shows the optical and thenno-
mechanical properties of CFBG sensors [Okabe et al., 2004].
Table 4.1: Grating length of CFBG sensors used and chirp rates
Grating length, mm Chirp rate, nmlcm 15 9
30 4.5
45 3
60 2.25
The entire length of the optical fibre provided by NTU was coated with an acrylate
resin, except for a short length of 70 to 80 mm. In this uncoated region of the optical fibre
segments, the Bragg grating was written. The position of Bragg grating was provided by
NTU in tenns of the start from the uncoated region (e. g 12 mm from the left of the
beginning of the bare fibre). Hence the position of the Bragg grating would be determined
to an accuracy of approximately I mm. The length of stripped fibre was not recoated after
the gratings were fabricated, which enabled direct contact with the epoxy matrix during the
manufacturing process of the composite specimens. The total length of the optical fibre in
which a few mm of the Bragg grating was written, supplied by NTU, was very long
1 47

Chapter 4 1
MATERIALS AND METHODS
(approximately 700 mm) and hence it was shortened to embed within the 200 mm long
GFRP coupons. The splices were arranged to be within the coupon to shield them from
breakage. The first operation executed, after the sensor was ready for embedment, was to
record the reflected spectrum of the free sensor under unloaded conditions. This was done
to obtain a spectrum which served as a reference for comparison with the spectra after
embedding in the composite.
Table 4.2: Properties of chirped FBG sensor [Okabe et al., 2004]
Poisson's ratio vf 0.16
Thermal expansion coefficient (x 10-6 C- 1),
a
0.5
Strain optic coefficients
Pil
P12
0.113
0.252
Initial average refractive index , no 1.449
Refractive index of cladding. nj 1.444
Index modulation, An 0.0005
4.3.2. Laminate manufacture with embedded sensors Continuous E-glass fibre-reinforced epoxy resin crossply laminates with different
lay-ups, were used for various studies as shown in Table 4.3. The use of curly brackets (())
shows the interface where the FBG or CFBG sensor was embedded.
Table 4.3. Lay-ups of the laminates manufactured for the study.
Thickness of each Total laminate Study Lay-up
ply, mm, thickness, mm
Matrix 0.5 3 (0/ {FBG/CFBG)/904 /0)
cracking Bonded 0.25 4.5
( 02 / (CFBG)/ 90 / 06 )s joints I
The production of GFRP coupons with embedded FBG sensors required several
steps. The GFRP laminates were manufactured by a wet impregnation technique using E-
1 48

Chapter 4 MATERIALS AND METHODS
glass fibres and an epoxy resin matrix. The following description, which applies to the
(02/ {CFBG}/90/06). laminates, was used in a simpler form for the (O/IFBG/CFBG)/904/0)
laminate. A dry preforrn was constructed by winding glass fibres (600 TEX ) around a steel frame (dimensions 450 mm x 450 mm). Figure 4.5 shows the winding of glass fibres onto
the steel frame. The inner 0' plies are wound first and the frame was then rotated through
90' to wind the 90" plies. The number of 0' plies and 90' plies depends on the study
mentioned in table 4.3. ne frame was then removed and two 5 mm. wide, thin Perspex
strips were bolted to the winding frame. Incorporation of the FBG or CFBG sensors into the
laminate was carried out as follows. FBG/CFBG sensors were to be placed near the outer 0/90 interface along 0' ply direction. Hence the sensors were positioned in the desired
locations by gluing the optical fibres onto Perspex strips perpendicular to 90' plies. The 0'
ply fibres were finally wound to form the outer longitudinal plies. The fibres at the
composite specimen ends were given an additional silicone rubber coating over the length
to prevent fibre breakage at these locations during fabrication and handling of the
specimens. The embedded portion of the silicone coating will not affect experimental
results, as it is located far from the gauge length in every specimen.
Figure 4.5: Photograph of winding machine; process of winding
the glass fibres onto the steel frame is shown
The fibre preform was now ready for impregnation. A tri-component epoxy resin (weight composition: 100 parts of Biphenyl A Epicholorohydrin resin 300; 60 parts of MNA hardener; 4 parts of Ancamine K61B catalyser) were mixed in a beaker and degassed
at 606 C in a vacuum oven. The liquid resin was introduced manually on one side of the
reinforcement stack and vacuumed for approximately 20 minutes to assist in drawing resin through the fibres and removing any air bubble content in the laminate. The procedure was
49
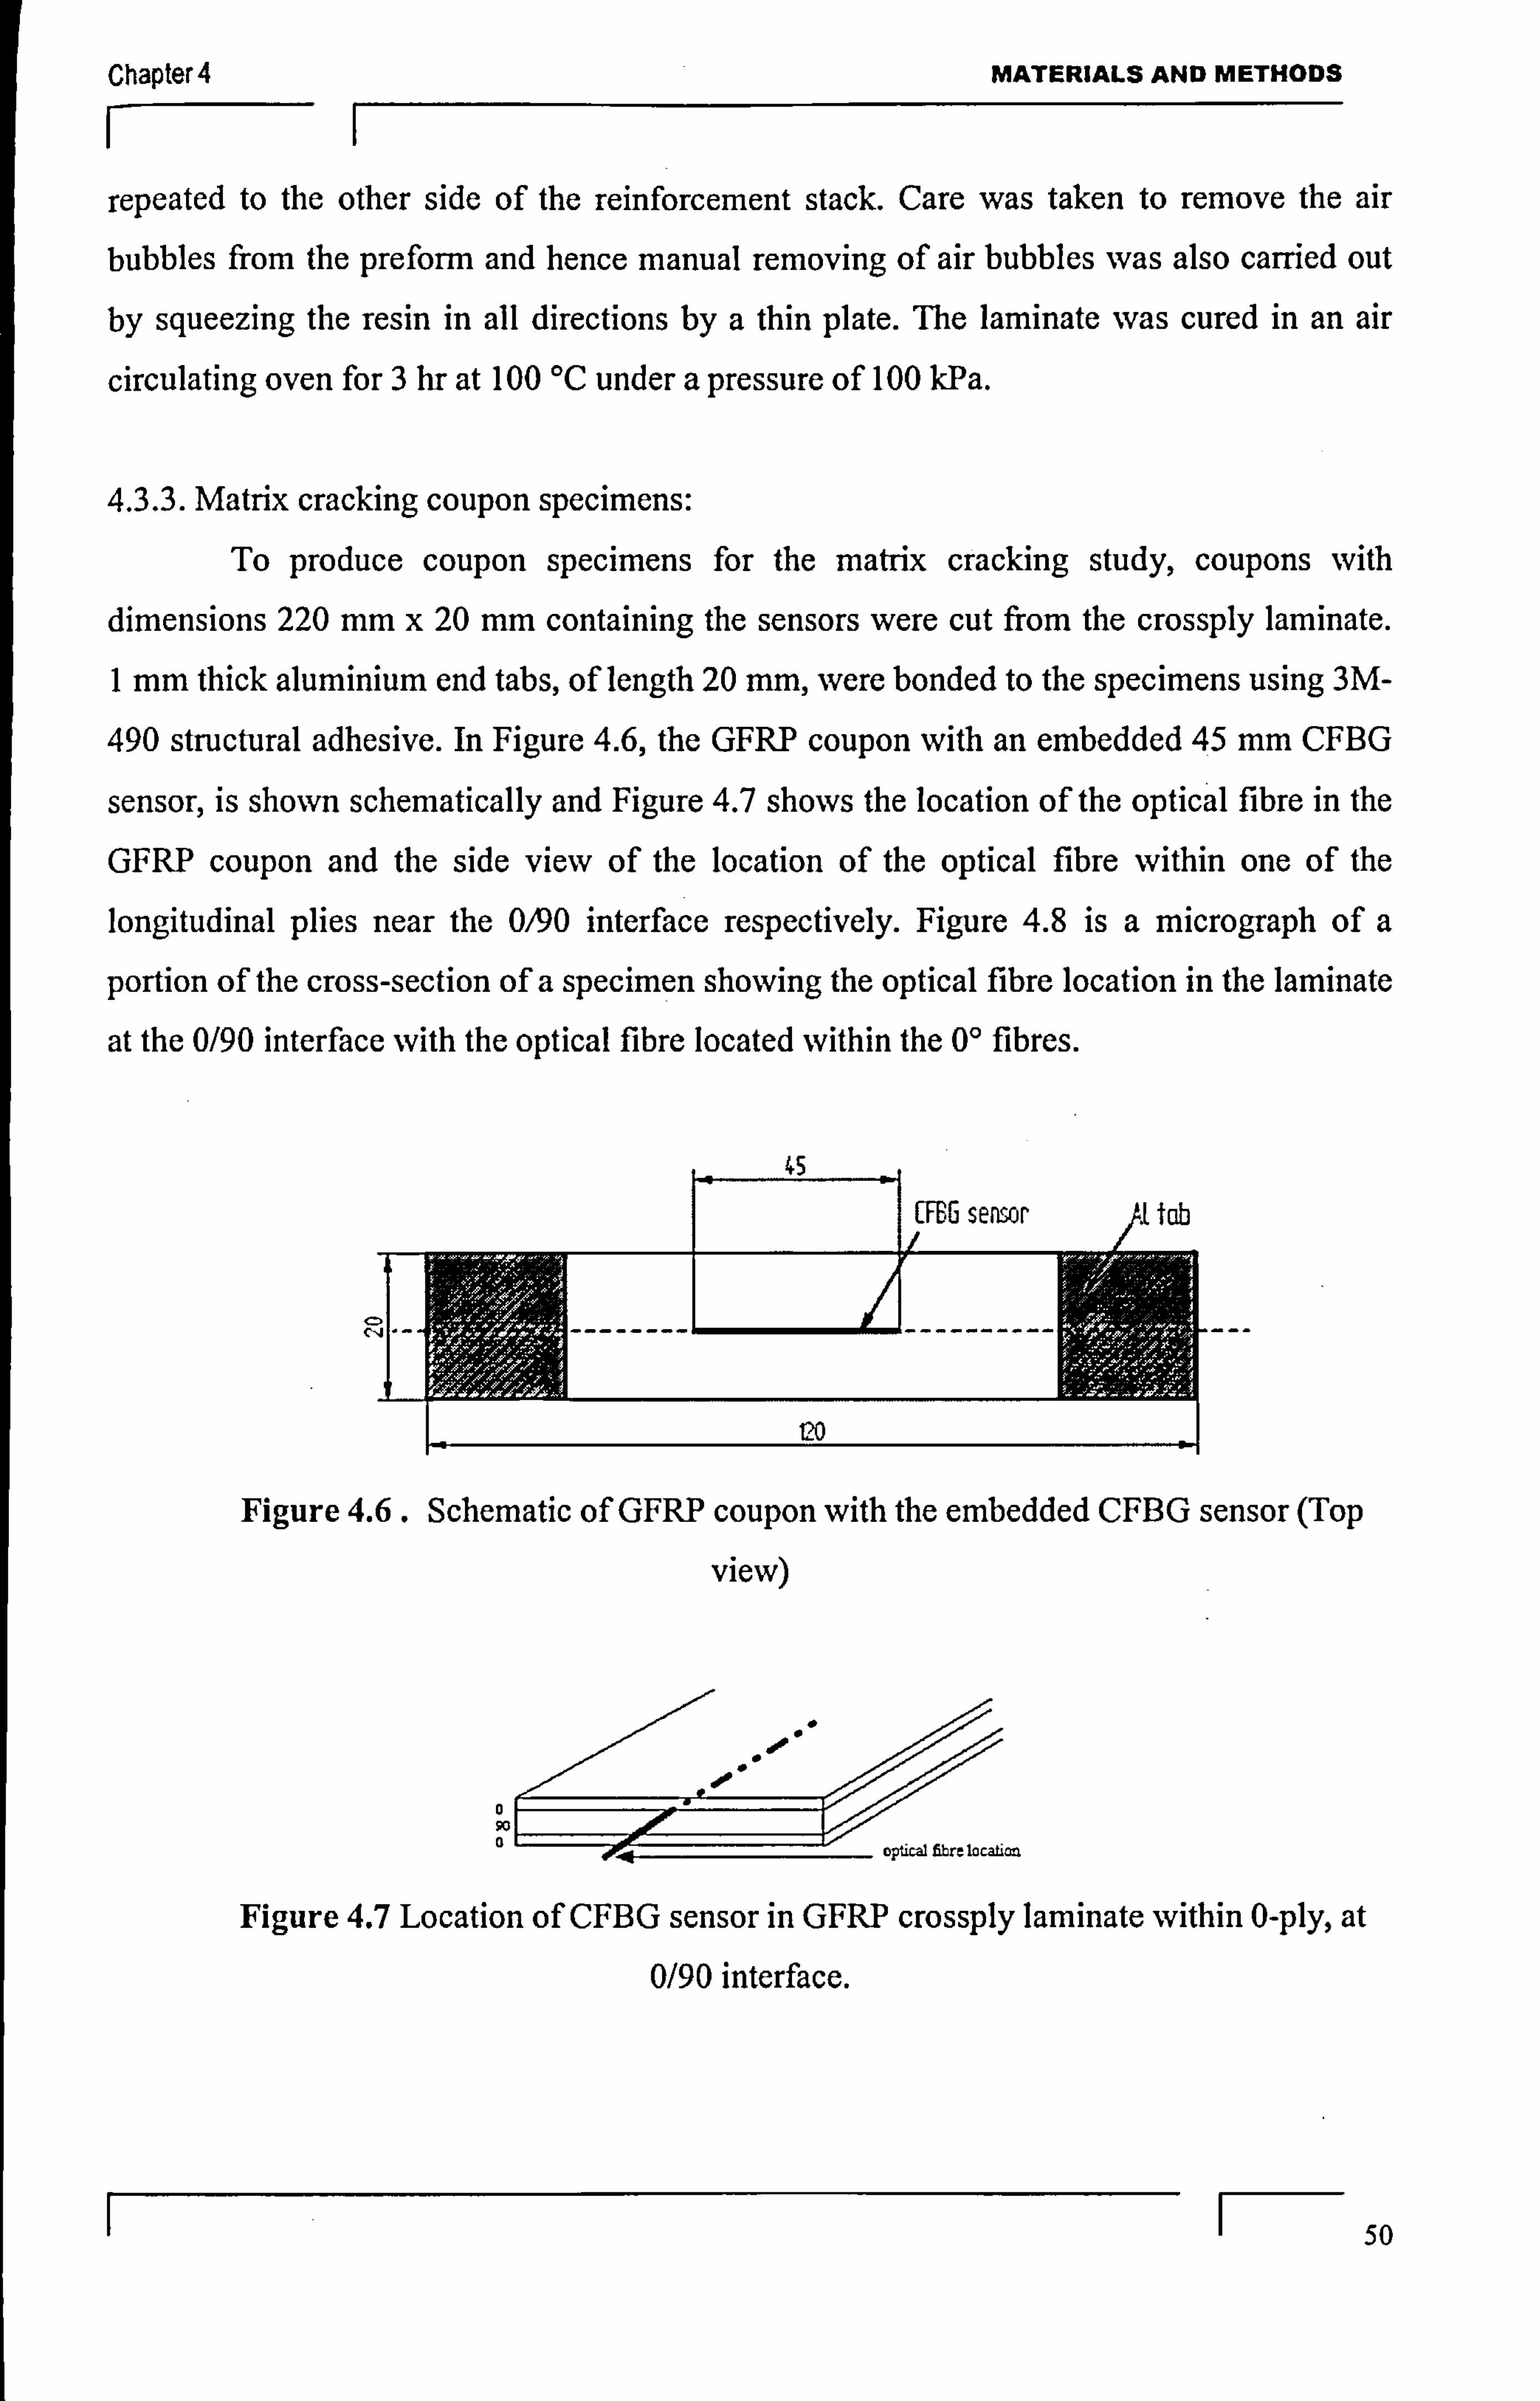
Chapter4 I
MATERIALS AND METHODS
repeated to the other side of the reinforcement stack. Care was taken to remove the air
bubbles from the preform and hence manual removing of air bubbles was also carried out
by squeezing the resin in all directions by a thin plate. The laminate was cured in an air
circulating oven for 3 hr at 100 'C under a pressure of 100 kPa.
4.3.3. Matrix cracking coupon specimens: To produce coupon specimens for the matrix cracking study, coupons with
dimensions 220 mm x 20 mm. containing the sensors were cut from the crossply laminate.
I mm thick aluminium end tabs, of length 20 mm, were bonded to the specimens using 3M-
490 structural adhesive. In Figure 4.6, the GFRP coupon with an embedded 45 mm CFBG
sensor, is shown schematically and Figure 4.7 shows the location of the optical fibre in the
GFRP coupon and the side view of the location of the optical fibre within one of the
longitudinal plies near the 0/90 interface respectively. Figure 4.8 is a micrograph of a
portion of the cross-section of a specimen showing the optical fibre location in the laminate
at the 0/90 interface with the optical fibre located within the 0' fibres.
c c
Figure 4.6. Schematic of GFRP coupon with the embedded CFBG sensor (Top
view)
optical fibre location
Figure 4.7 Location of CFBG sensor in GFRP crossply laminate within O-ply, at 0/90 interface.
1 50
Chapter 4 1
Figure 4.8: -Microg--zph 0, he crýlss-s--. -U. a of a specime-n (Mc-D/O)
crossply laminate showing the opt-cý.. lication at 0/90 interface along J' ý, y
The Perspex strips which were used to locate the optical fibres during the
fabrication stage rem ain embedded in the coupons, but within the grip area and well away from the gauge length of the coupons. This laminate fabrication procedure introduces a
small, though unknown, tensile pre-strain into the optical fibre which can vary from
specimen to specimen. With a chirped FBG, this pre-strain simply shifts the entire reflected
to -P n spectrum uniformly L slightly longer wavelengths. The optical trans are cy of the GFRP
11-aminates provided an advantage -in the study of matrix damage and the development of disbonding damage between the composite-composite adherends, as the damage
devellopment can be photographed for direct comparison with the sensor measurements.
4.3.4. Single lap composite-composite bonded joint coupon specimens: Coupon specimens with dimensions 220 mm x 20 mm containing the sensors of
vanýous lengths were cut -flrom the, (02 / JCFBG_J / 90 / 06), lay-up cross-ply laminate. For the
bonded joint stLdies the coupon is called an adherend. A number of studies were
undertaken using CFBG sensors to monitor disbondin adjacent to the low-wavelength or
high-,, '-. ý, elength end of the sensor. For the detection of the disbond adjacent to the low-
wavele---gth end of a bonded joint, CFBG sensors of various lengths (15,30,45 and 60 mm)
were used and for the study of disbond detection adjacent to the high-wavelength end a
CFBG sensor length equal to the overlap length of the bondel Joint (i. e. 60 mm) was used.
The adherends were cut so that the low wavelength end _-FBG sensor teri_-. *. --_, eJ at
the cut end of the adherend. For this to be possible, it was necessary to disc ate
between the low and nigh wavelength end of the sensor and to locate the end of Lho
51

Chapter 4 MATERIALS AND METHODS
This was done by applying a simple through-thickness load using a small finger-tightened
clamp mounted onto the coupon; this loading produces a perturbation in the reflected
spectrum which enables the low-wavelength end of the sensor to be identified, as shown in
Figure 4.9. This loading procedure was continued to identify the lower wavelength end of
the sensor and it was identified within an accuracy of I mm. The adherends prepared in this
way with embedded sensors, were 120-130 mm in length depending on the position of the
low wavelength end of the sensor in the laminate.
CFBG
b-20
-25
-30
-35
-40
-451 111111 1530 1535 1540 1545 1550 1555 1560 1565
Wavolmgdi, nm
Figure 4.9: (a) Schematic of a GFRP coupon with embedded CFBG sensor showing the
two positions used to apply a through-thickness compressive load to identify the low-
wavelength and high-wavelength end of the sensor; (b) superposition of typical CFBG
reflection spectra obtained when a GFRP coupon was loaded at positions I and 2.
Prior to bonding, the adherends were cleaned with acetone and the bonding surface
was abraded with a fine silicon carbide sheet. The adherend with the embedded sensor was bonded to the second adherend without an optical sensor using an adhesive (Araldite
AV119), a one-part heat-cured epoxy adhesive supplied by Huntsman, UK. AV119
adhesive was chosen as it is popular in aerospace industry and also produces a transparent
joint when used with the transparent GFRP adherends in this investigation. This is valuable for monitoring and recording the propagation of the disbond during the tests for a direct
1 52

Chapter 4 MATERIALS AND METHODS
II
comparison with the measurements made using the CFBG. The mechanical properties of
AV1 19 are given in Table 4.4 [Broughton et al., 1999].
Table 4A Properties of adhesive AV1 19 at room temperature [Broughton et aL, 1999]
Shear modulus (GPa) 1.07 ± 0.04
Shear strength (MPa) 47.6 ± 2.9
Young's modulus (GPa) 3.05
Poisson's ratio 0.4
Tensile strength (MPa) 70
(a)
fibre sensor
Aluminium wire spacer
CFOG -I- sonsot . A
Figure 4.10 : (a) Schematic diagram of the single-lap composite-composite bonded joints
with the sensor embedded in one of the adherends. (b) Edge view of the joint with
exaggerated adhesive thickness and wire spacer, showing 60 mm CFBG sensor embedded in the adherend; the low-wavelength end of the CFBG sensor terminating at the end of one
adherend.
1 53

Chapter 4 1
MATERIALS AND METHODS
The adherend containing the CFBG sensor was positioned such that the sensor was
close to the bondline but approximately 0.5 mm from the adhesive bondline as the CFBG
sensors were embedded near the first 0/90 interface. A uniform thickness of adhesive between the adherends was achieved by using aluminium wires with a diameter of 0.40 mm
as spacers and the bond was formed under light pressure in a finger-tightened spring-loaded jig. The overlap length of the bonded joints was 60 mm. The joint was cured at 120" C for
I hour. Figure 4.10 (a) and (b) shows the single-lap composite-composite bonded joints
with the sensor embedded in one of the adherends and the edge view of the joint with 60
mm long CFBG sensor in one of the adherend respectively. In the Figure 4.10 (b), the low-
wavelength end of the CFBG sensor terminating at the end of one adherend is also shown. Aluminum end tabs, length 20 mm, were bonded to the specimens using 3M-490 structural
adhesive. Now the single lap GFRP-GFRP bonded joint with dimensions l20x2O mm and 60 mm overlap was ready for testing. For the detection of disbond from the low-wavelength
end of bonded joint, CFBG sensors of various lengths (15,30,45 and 60 mm) were used
and for the study of disbond detection adjacent to the high wavelength end, a CFBG sensor
of length equal to the overlap length of th e bonded joint (i. e. 60 mm) was used.
4.3.5. Single lap composite-composite bonded joint with manufacturing defect:
The process of preparation of single lap composite-composite joints with
manufacturing defects (artificial disbonds) is similar to the process explained in section 4.3.4 except for the insertion of a defect using Teflon (PTFE). A piece of Teflon with di mensions 12 mm long, 25 mm wide and 0.25 mm thickness was inserted at the centre of
the overlap length. The size of the Teflon characterized the disbond size. The Teflon acted
as a spacer to provide the required thickness, so there was no need to use the aluminium
spacer wire. Hence the thickness of adhesive would be the thickness of the Teflon insertion
(i. e. 0.25 mm thick adhesive layer). The bonding was then continued as before using
elevated temperature epoxy adhesive AVI 19, and the joints were cured at 120' C for I
hour. In Figure 4.11 (a) the edge view of the bonded joint with the disbond due to the
Teflon insertion in the bond line is shown. Figure 4.11 (b) shows the transparent image of the GFRP bonded joint with the 12 mm Teflon insert within the bondline at the centre of the overlap. The dimensions of the bonded joint were 120 x 20 mm with an overlap length
of 60 mm.
F- 54

Chapter 4 1
(a)
6 60 mm ,L 60mm
0
MATERIALS AND METHODS
Gocal In A CFBO
Figure 4.11 (a) Edge view of the GFRP-GFRP bondedjoint with the Teflon in the
adhesive bondline. (b) transparent image of bonded joint with 12 mm Teflon insert
(artificial disbond) within the bondline at the centre of the overlap (Plan view).
4.4. MECHANICAL TESTING
4.4.1: Quasi-static tests for matrix cracking damage detection
Firstly, quasi-static tensile tests were carried out using an Instron 1341 computer-
controlled servo-hydraulic testing machine (Figure 4.12) at room temperature in a
temperature-controlled laboratory on the specimens with embedded uniform FBGs and
chirped FBGs. The specimens were subjected to simple unidirectional loading and the
reflected spectra were recorded with the specimen unloaded and under various tensile
strains. The parameter controlled in the loading process was the longitudinal strain of the
specimens, measured using an extensometer with the gauge length of 50 mm attached using
an elastic band to the surface of the coupon. The strain loading steps were increased in
increments of 0.05% longitudinal strain. The specimens were strained up to 0.3 %. The
reflection spectra for these undamaged specimens were recorded at these strains to compare
with the reflection spectra obtained for the specimen after the initiation of a matrix crack. The results were also used to calculate the strain sensitivity of the sensors having different
lengths.
For the study of the response of the FBG/CFBG sensor to matrix cracking damage,
matrix cracking was manually initiated in the transverse ply of the specimen adjacent to the
I F- 55
All dimensions are in mm
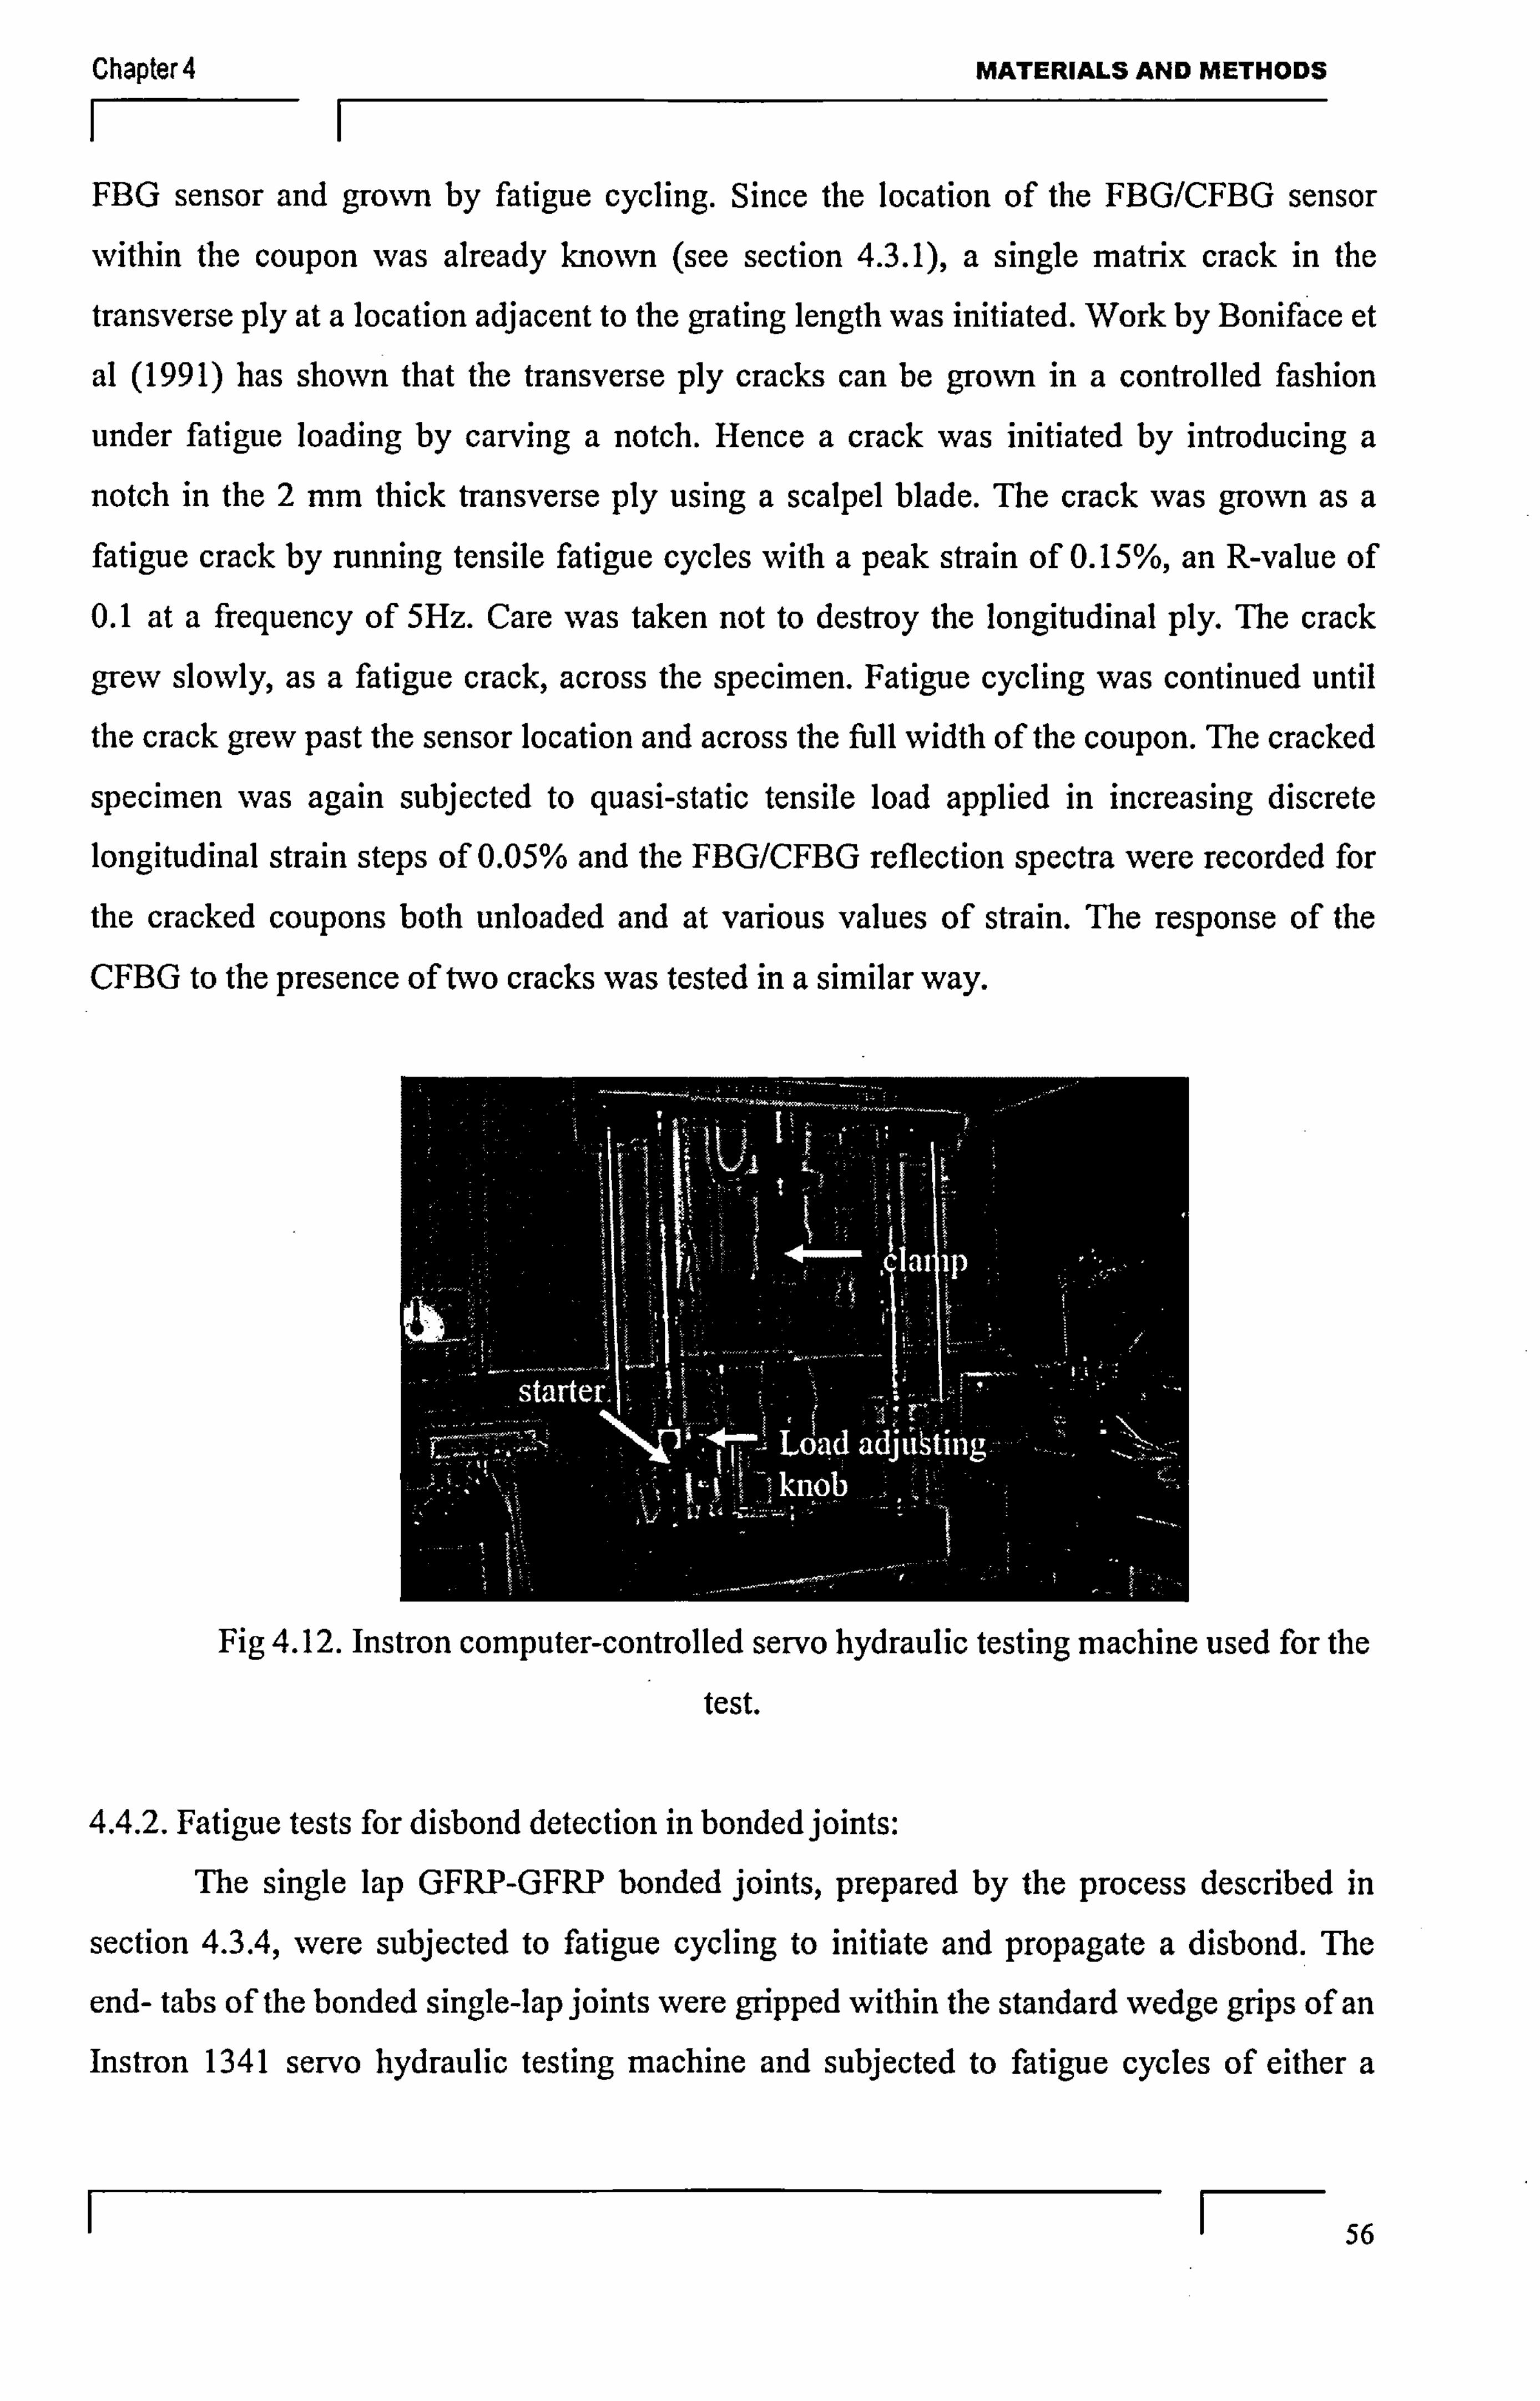
Chapter 4 MATERIALS AND METHODS
FBG sensor and grown by fatigue cycling. Since the location of the FBG/CFBG sensor
within the coupon was already known (see section 4.3.1), a single matrix crack in the
transverse ply at a location adjacent to the grating length was initiated. Work by Boniface et
al (1991) has shown that the transverse ply cracks can be grown in a controlled fashion
under fatigue loading by carving a notch. Hence a crack was initiated by introducing a
notch in the 2 mm thick transverse ply using a scalpel blade. The crack was grown as a fatigue crack by running tensile fatigue cycles with a peak strain of 0.15%, an R-value of 0.1 at a frequency of 5Hz. Care was taken not to destroy the longitudinal ply. The crack
grew slowly, as a fatigue crack, across the specimen. Fatigue cycling was continued until
the crack grew past the sensor location and across the ftill width of the coupon. The cracked
specimen was again subjected to quasi-static tensile load applied in increasing discrete
longitudinal strain steps of 0.05% and the FBG/CFBG reflection spectra were recorded for
the cracked coupons both unloaded and at various values of strain. The response of the
CFBG to the presence of two cracks was tested in a similar way.
Fig 4.12. Instron computer-controlled servo hydraulic testing machine used for the
test.
4.4.2. Fatigue tests for disbond detection in bonded joints:
The single lap GFRP-GFRP bonded joints, prepared by the process described in
section 4.3.4, were subjected to fatigue cycling to initiate and propagate a disbond. The
end- tabs of the bonded single-lap joints were gripped within the standard wedge grips of an Instron 1341 servo hydraulic testing machine and subjected to fatigue cycles of either a
1 56
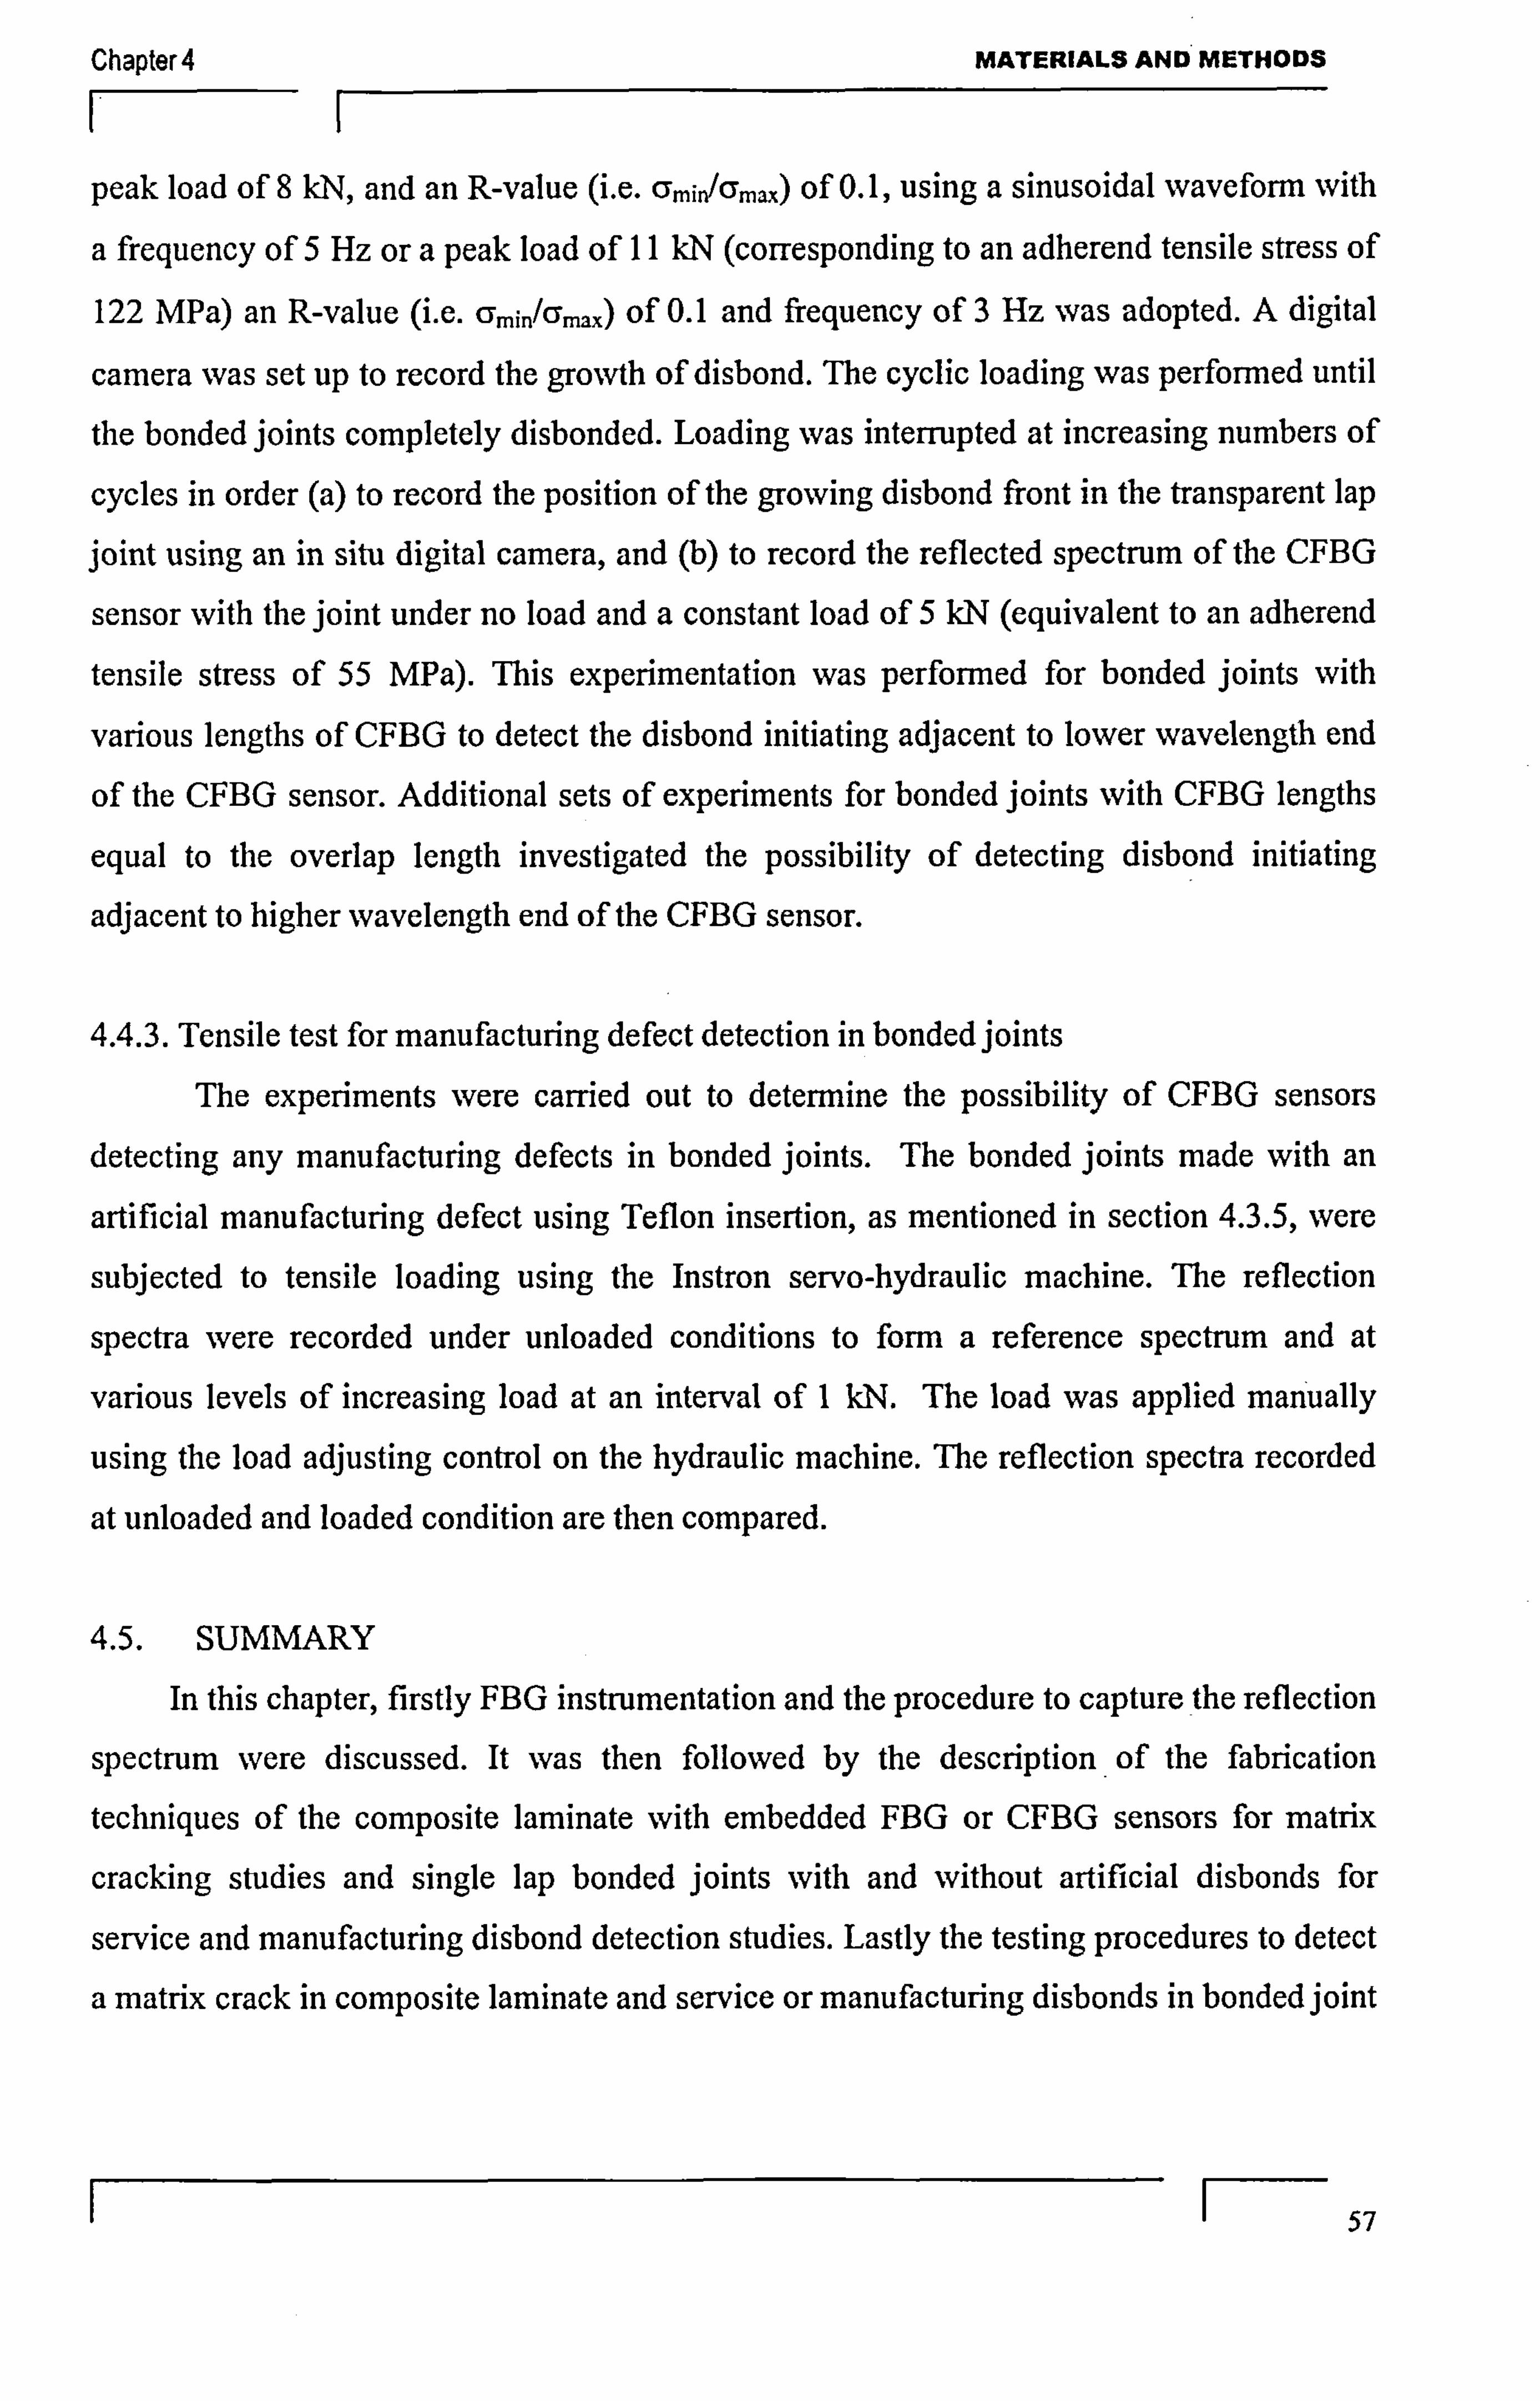
Chapter4 MATERIALS AND METHODS
peak load of 8 kN, and an R-value (i. e. cr,, i, /an,, _, ) of 0.1, using a sinusoidal waveforra with
a frequency of 5 Hz or a peak load of II kN (corresponding to an adherend tensile stress of
122 MPa) an R-value (i. e. Cy .. in/CF,,,,,, ) Of 0.1 and frequency of 3 Hz was adopted. A digital
camera was set up to record the growth of disbond. The cyclic loading was performed until
the bonded joints completely disbonded. Loading was interrupted at increasing numbers of
cycles in order (a) to record the position of the growing disbond front in the transparent lap
joint using an in situ digital camera, and (b) to record the reflected spectrum of the CFBG
sensor with the joint under no load and a constant load of 5 kN (equivalent to an adherend
tensile stress of 55 MPa). This experimentation was performed for bonded joints with
various lengths of CFBG to detect the disbond initiating adjacent to lower wavelength end
of the CFBG sensor. Additional sets of experiments for bonded joints with CFBG lengths
equal to the overlap length investigated the possibility of detecting disbond initiating
adjacent to higher wavelength end of the CFBG sensor.
4.4.3. Tensile test for manufacturing defect detection in bonded joints
The experiments were carried out to determine the possibility of CFBG sensors detecting any manufacturing defects in bonded joints. The bonded joints made with an
artificial manufacturing defect using Teflon insertion, as mentioned in section 4.3.5, were
subjected to tensile loading using the Instron servo-hydraulic machine. The reflection
spectra were recorded under unloaded conditions to forrn a reference spectrum and at
various levels of increasing load at an interval of I kN. The load was applied manually
using the load adjusting control on the hydraulic machine. The reflection spectra recorded
at unloaded and loaded condition are then compared.
4.5. SUMMARY
In this chapter, firstly FBG instrumentation and the procedure to capture the reflection
spectrum were discussed. It was then followed by the description of the fabrication
techniques of the composite laminate with embedded FBG or CFBG sensors for matrix
cracking studies and single lap bonded joints with and without artificial disbonds for
service and manufacturing disbond detection studies. Lastly the testing procedures to detect
a matrix crack in composite laminate and service or manufacturing disbonds in bonded joint
1 57

Chapter 4 MATERIALS AND METHODS
I F-- is discussed. In the next chapter, the results obtained for the matrix crack detection using
FBG and CFBG sensors are discussed.
1 58
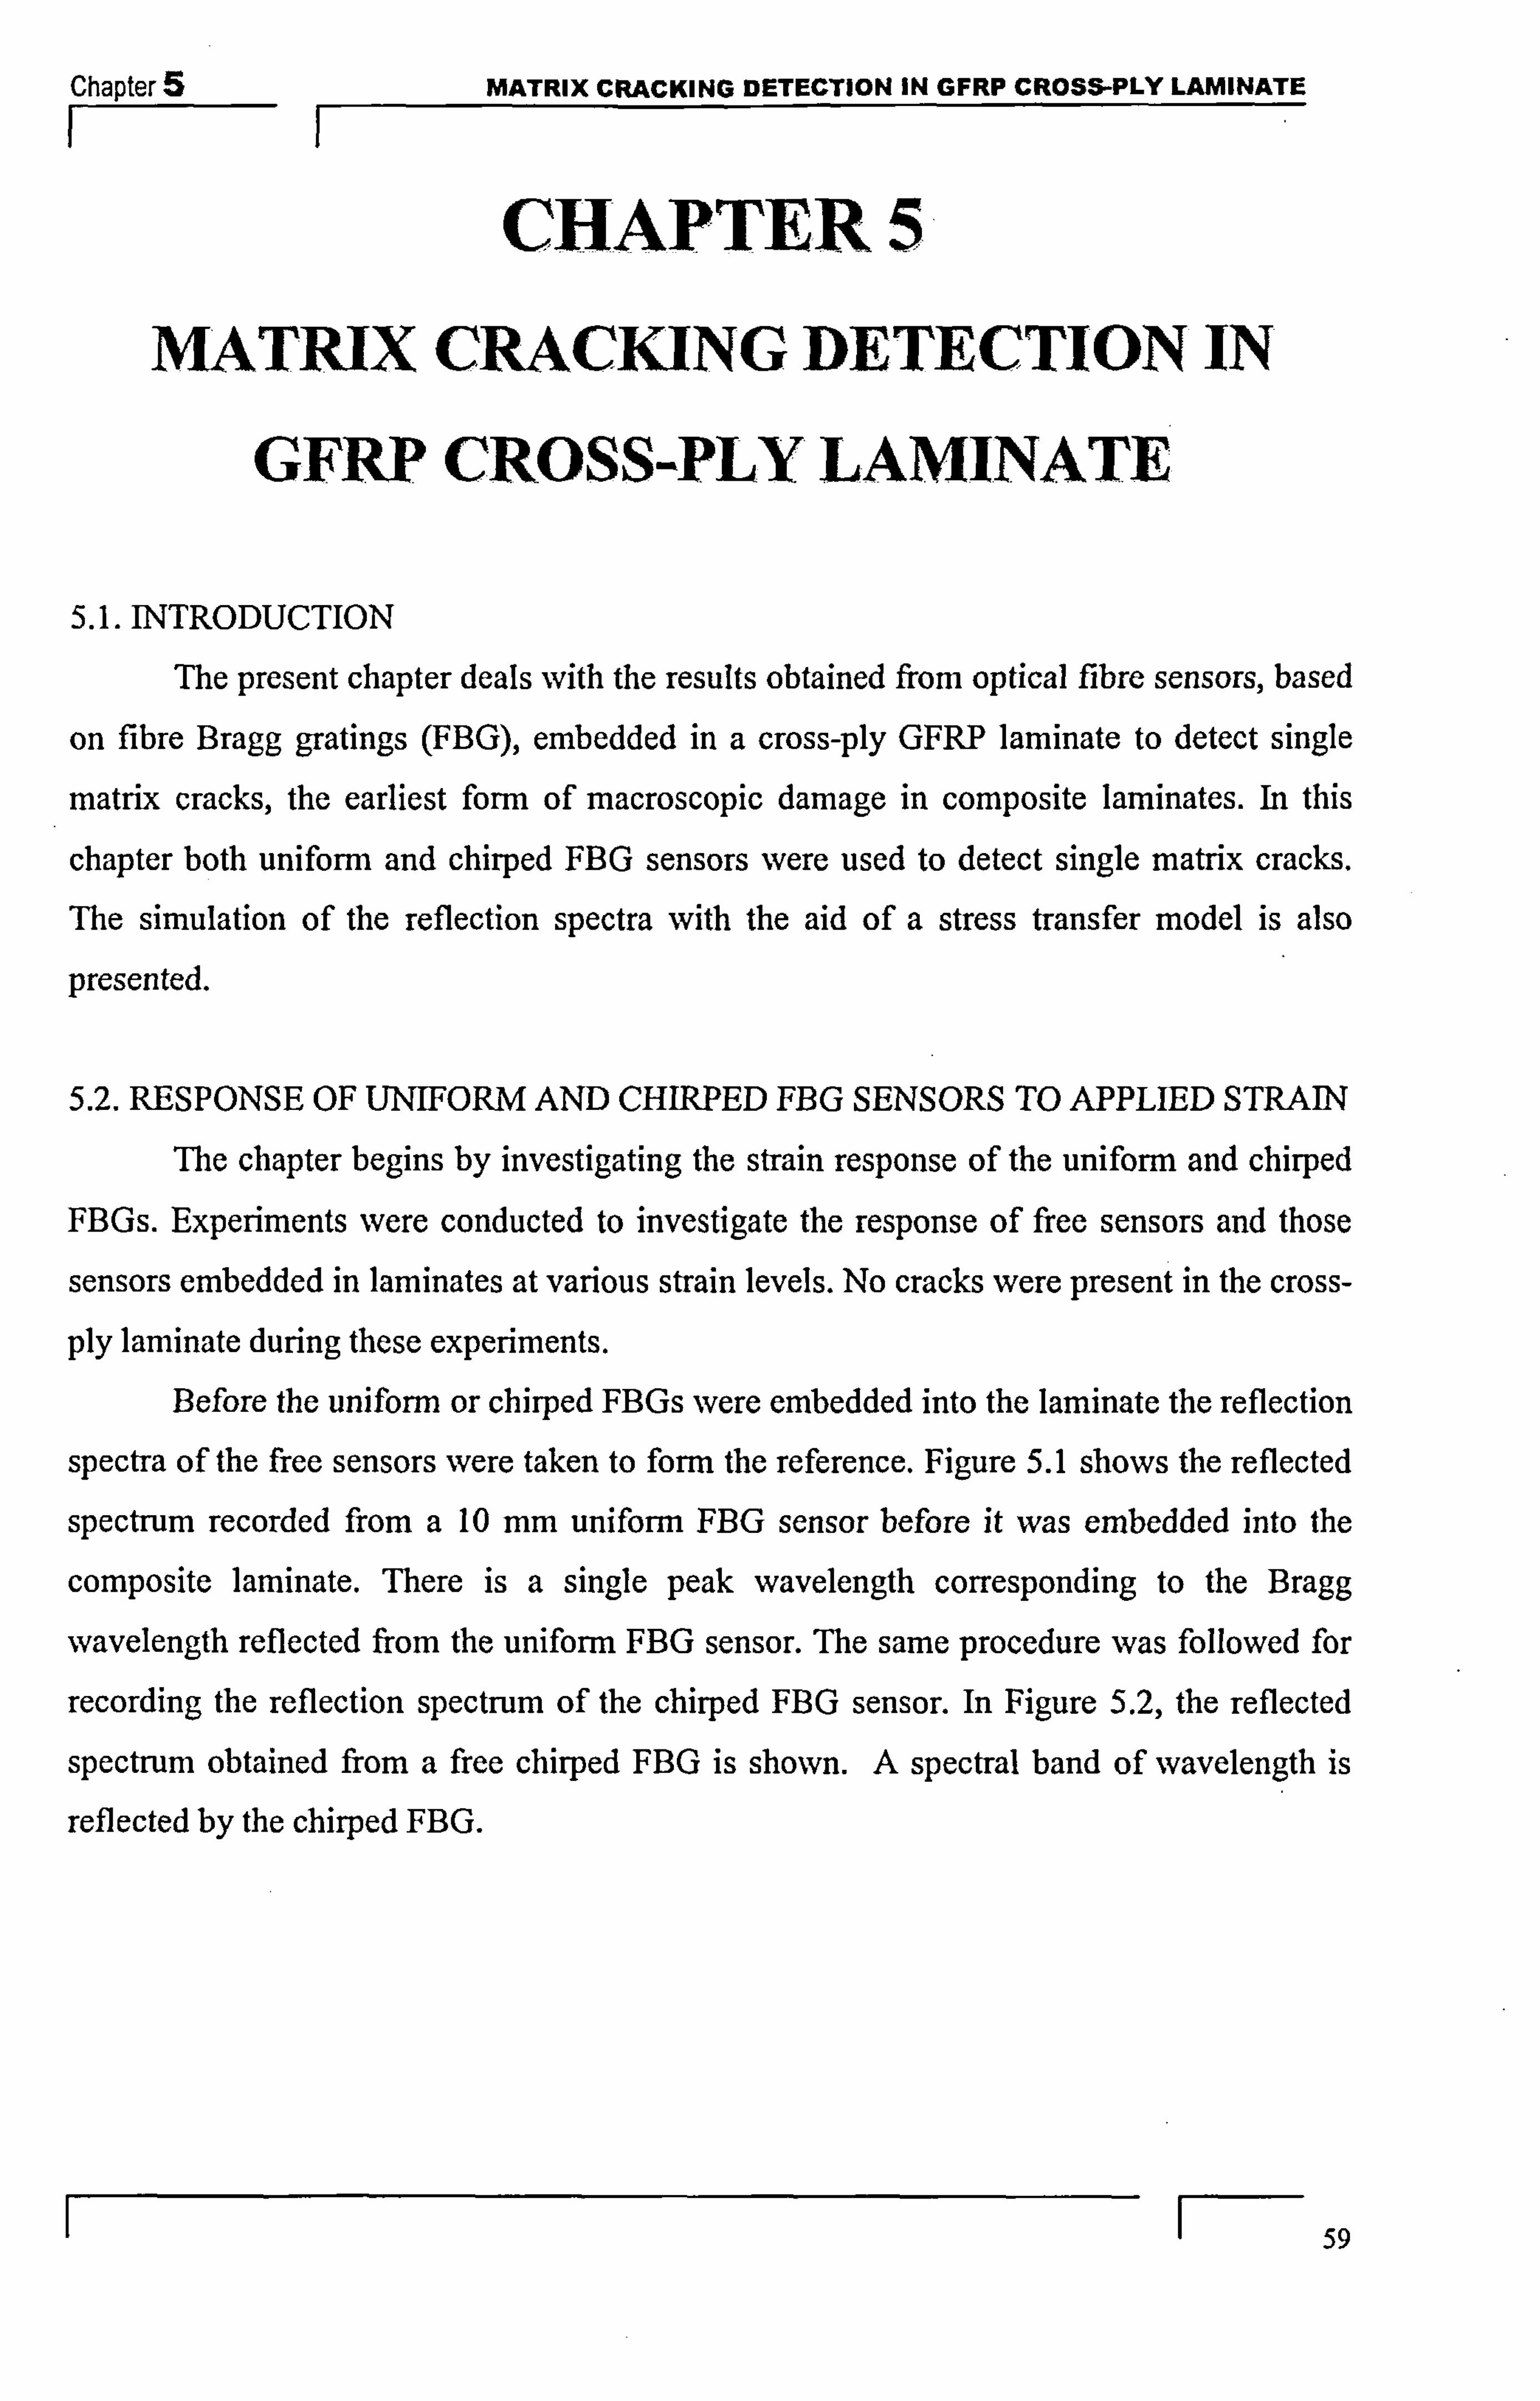
Chapter 5 MATRIX CRACKING DETECTION IN GFRP CROSS-PLY LAMINATE
F-
CHAPTER 5 NlATRIX CRACKING DETECTION IN
GFRP CROSS-PLY LAMINATE
5.1. INTRODUCTION
The present chapter deals with the results obtained from optical fibre sensors, based
on fibre Bragg gratings (FBG), embedded in a cross-ply GFRP laminate to detect single
matrix cracks, the earliest form of macroscopic damage in composite laminates. In this
chapter both uniforrn and chirped FBG sensors were used to detect single matrix cracks. The simulation of the reflection spectra with the aid of a stress transfer model is also
presented.
5.2. RESPONSE OF UNIFORM AND CHIRPED FBG SENSORS TO APPLIED STRAIN
The chapter begins by investigating the strain response of the uniform and chirped FBGs. Experiments were conducted to investigate the response of free sensors and those
sensors embedded in laminates at various strain levels. No cracks were present in the cross-
ply laminate during these experiments. Before the uniform or chirped FBGs were embedded into the laminate the reflection
spectra of the free sensors were taken to form the reference. Figure 5.1 shows the reflected
spectrum recorded from a 10 mm uniform FBG sensor before it was embedded into the
composite laminate. There is a single peak wavelength corresponding to the Bragg
wavelength reflected from the uniform FBG sensor. The same procedure was followed for
recording the reflection spectrum of the chirped FBG sensor. In Figure 5.2, the reflected
spectrum obtained from a free chirped FBG is shown. A spectral band of wavelength is
reflected by the chirped FBG.
59
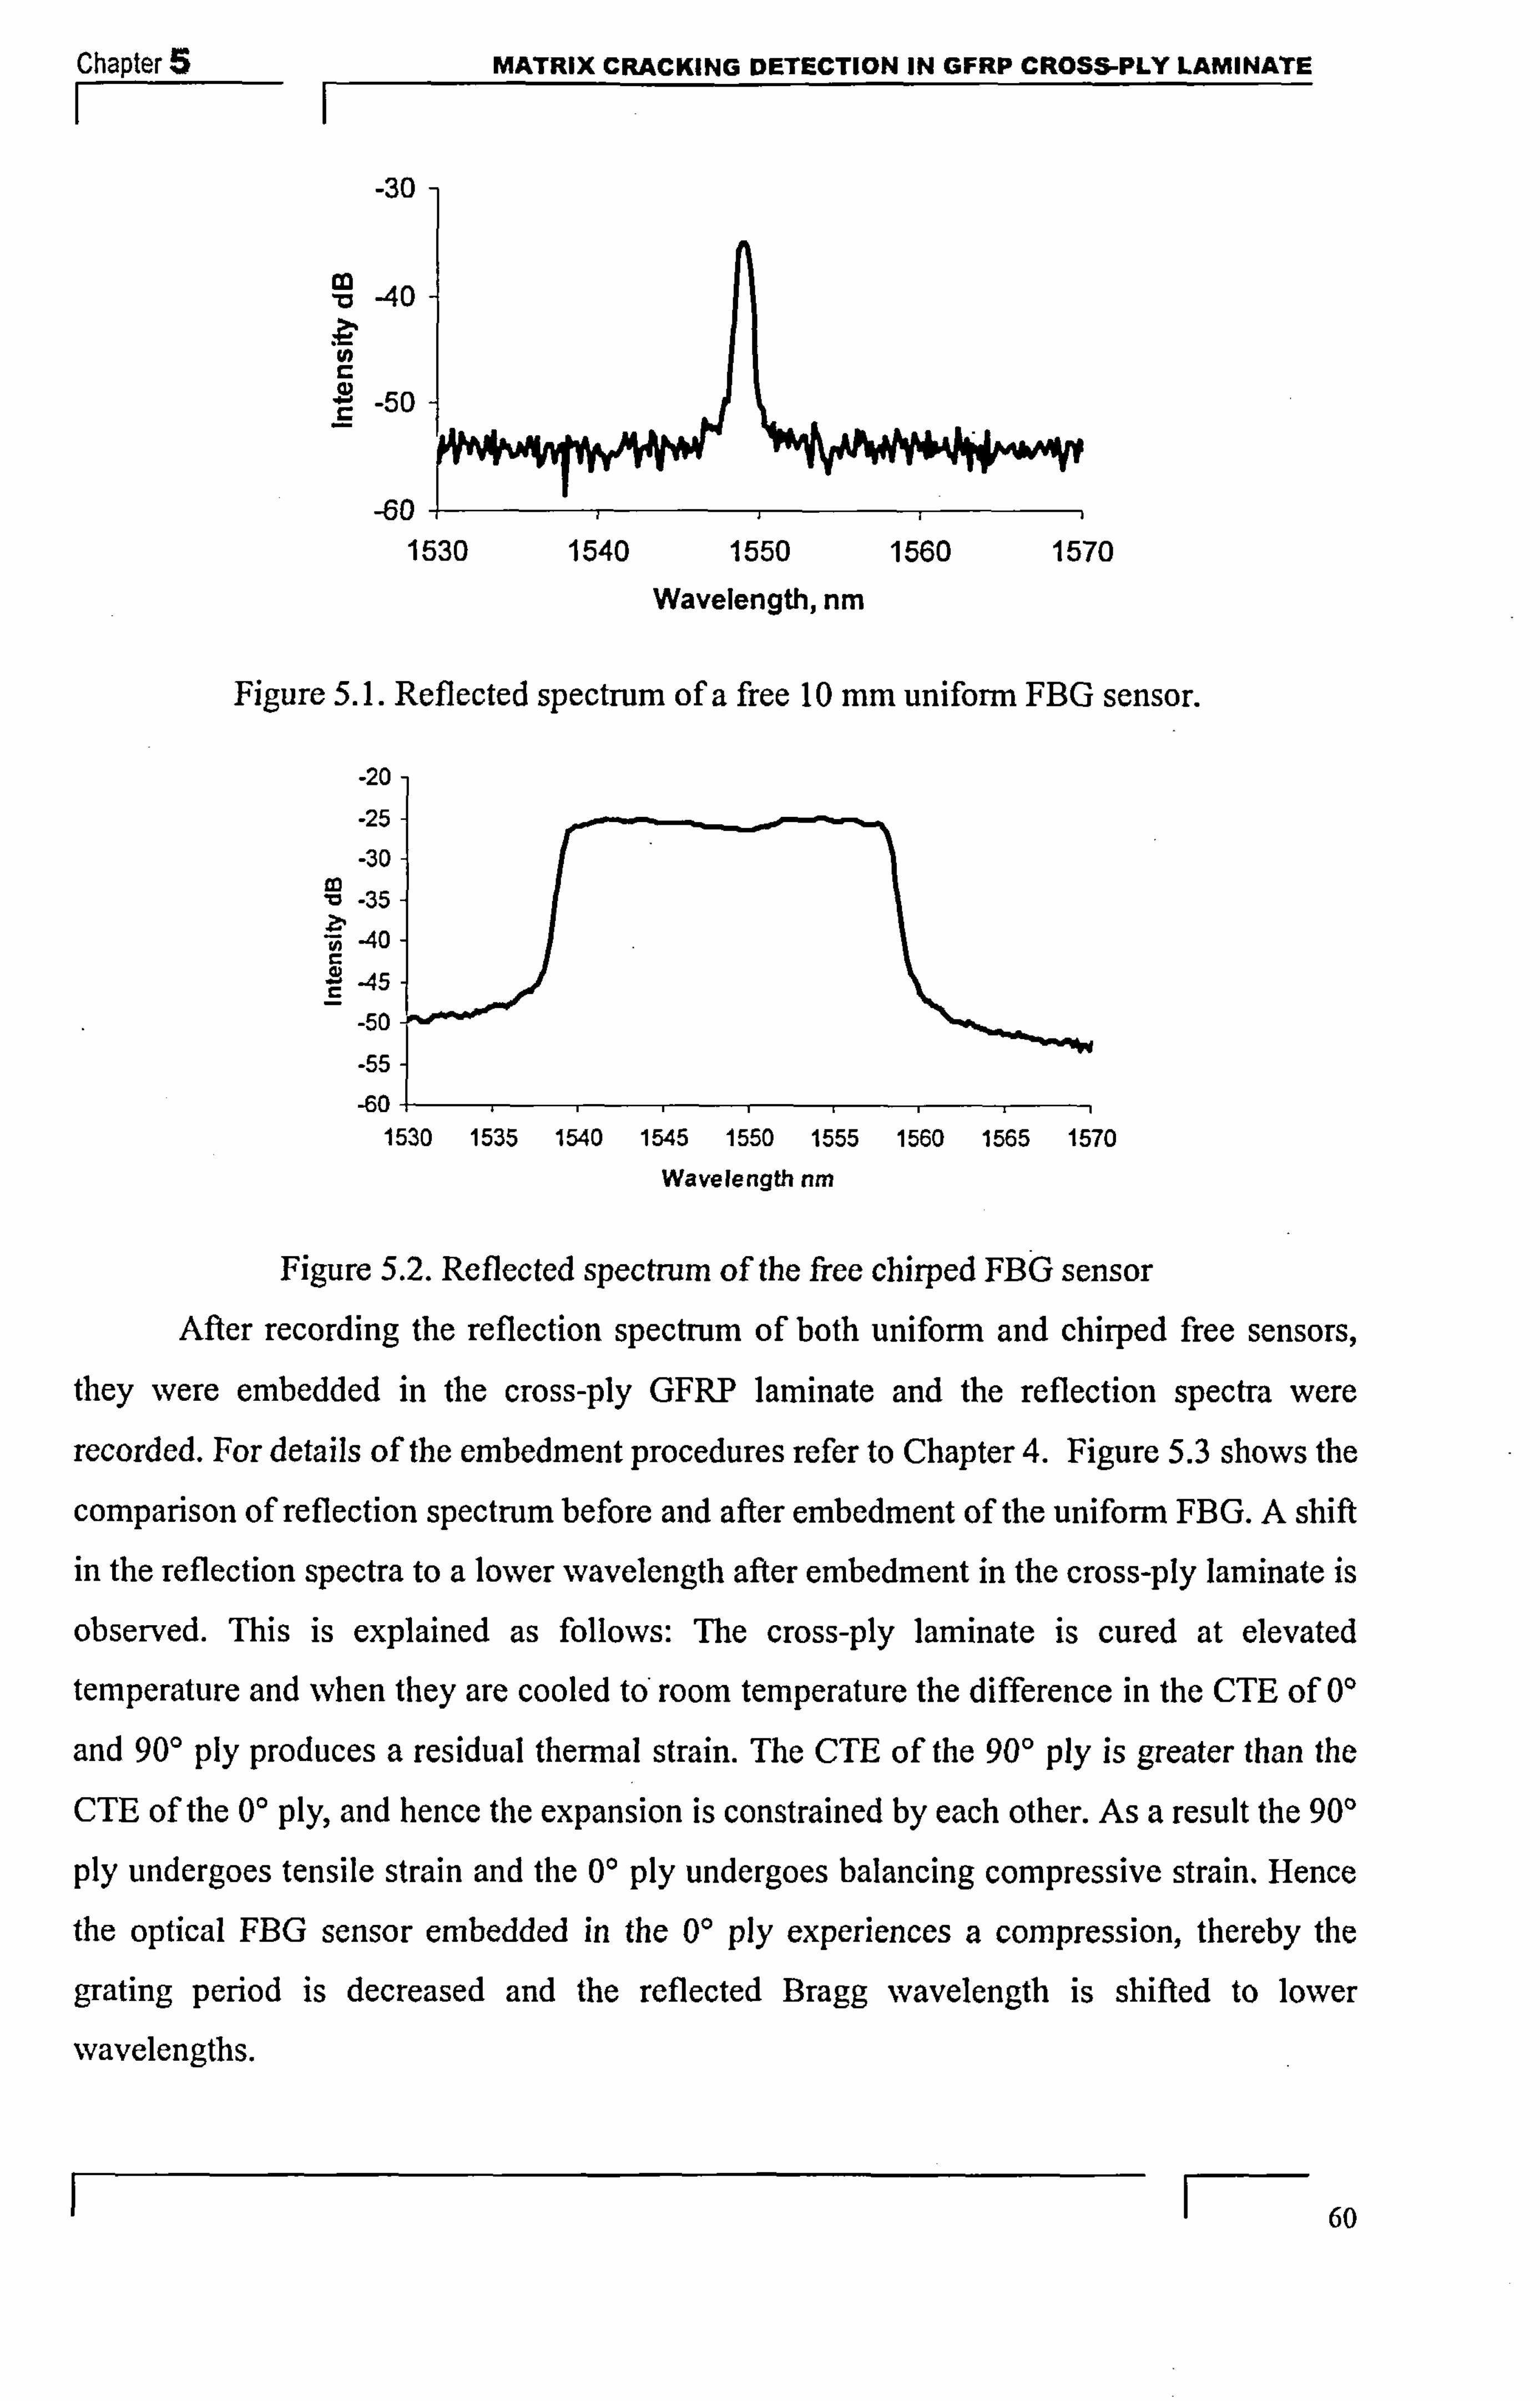
Chapter 5 MATRIX CRACKING DETECTION IN GFRP CROSS-PLY LAMINATE
F- I -30
-40
-50
-60 4- 1530
Figure 5.1. Reflected spectrum of a free 10 mm uniform FBG sensor.
-20-
-25 -
-30- to
-35 -
-40 -
-45
-50
-55
-60-- 1530
Figure 5.2. Reflected spectrum of the free chirped FBG sensor After recording the reflection spectrum of both uniform and chirped free sensors,
they were embedded in the cross-ply GFRP laminate and the reflection spectra were
recorded. For details of the embedment procedures refer to Chapter 4. Figure 5.3 shows the
comparison of reflection spectrum before and after embedment of the uniform FBG. A shift in the reflection spectra to a lower wavelength after embedment in the cross-ply laminate is
observed. This is explained as follows: The cross-ply laminate is cured at elevated temperature and when they are cooled to'roorn temperature the difference in the CTE of 0'
and 90' ply produces a residual thermal strain. The CTE of the 90' ply is greater than the
CTE of the 0' ply, and hence the expansion is constrained by each other. As a result the 90'
ply undergoes tensile strain and the 0' ply undergoes balancing compressive strain. Hence
the optical FBG sensor embedded in the 0' ply experiences a compression, thereby the
grating period is decreased and the reflected Bragg wavelength is shifted to lower
wavelengths.
60
1540 1550 1560 1570
Wavelength, nm
1535 1540 1545 1550 1555 1560 1565 1570
Wavelength nm

Chapter MATRIX CRACKING DETECTION IN GFRP CROSS-PLY LAMINATE
-35
-40
m 45
-50
-55
-60 1540 1560
Figure 5.3. Comparison of uniform FBG reflection spectrum before and after embedment in
a cross-ply laminate.
The cross-ply laminate with the embedded uniform FBG sensors were then
subjected to tensile loading as discussed in Chapter 4, section 4.4.1. The reflection spectra
were recorded with the coupon unloaded and at various increasing strain conditions with the longitudinal strain increased in steps of 0.05%. The reflection spectra obtained from a
uniform FBG are shown in Figure 5.4. As expected the main peak Bragg wavelength is
shifted to higher wavelengths as the strain is increased. But the shape of the spectrum
remains largely unchanged during the shift to higher wavelengths and the spectrum has an
approximately symmetrical shape about one main peak. The Bragg wavelength depends on the pitch length and an increase in pitch length as a consequence of a uniform strain
produces an increase in Bragg wavelength so that the spectra are shifted to higher
wavelengths. The sensitivity of the uniform FBG sensor is calculated by plotting the peak
wavelength shift in relation to the applied strain (Figure 5.5). From the plot, the sensitivity
of the uniform FBG sensor embedded in a cross-ply laminate is 1.24*10-3 run / pz. This
value is similar to the sensitivity value reported by Ussorio et al, 2004.
1 61
1550
Wavelength, nm

Chapter 5 MATRIX CRACKING DETECTION IN GFRP CROSS-PLY LAMINATE II
-0% -30 -0.05%
--0.10% -0.15%
0.20% -0 26%
-40- .
-0.30%
-45
-55 il ', II'. -. ýwvý 1545 1550 1555 1560
Wavelength, nm
Figure 5.4. Reflected spectra of an embedded FBG at different strain levels
1554
1553 E 1552
1551 tM CA 10-3 nIn/Ill: ,u 1550 2a Sensitivity = 1.24* 0 > cc
1549 A specimen 1
1548 m specimen 2
1547 *I specimen 3
0.0000 0.0010 0.0020 0.0030 0.0040
Strain
Figure 5.5. Bragg wavelength shift from uniform FBGs as a function of applied strain
The same procedure of recording the reflected spectra before and after embedding
the chirped FBG sensor and quasi-static loading were performed and the results arc shown in Figure 5.6 and 5.7. Again the compressive strain in the 0' ply shortens the pitch length
and hence the whole of the wavelength range in the reflection spectra is shifted to lower
wavelengths after embedment, as shown in Figure 5.6. The coupons were then subjected to
increasing strains and the reflection spectra are shifted uniformly to higher wavelengths in
proportion to the strain, as observed for the uniform FBG (see Figure 5.7). This is because
the uniform strain applied increases the period of the chirped grating along the grating length, thereby shifting the reflected wavelengths to higher values for all locations along the grating.
The reflected spectra shown in Figure 5.7 at various strains are for a chirped FBG of 30 mm length. Various lengths of CFBG were used and the same expenments were
1 62
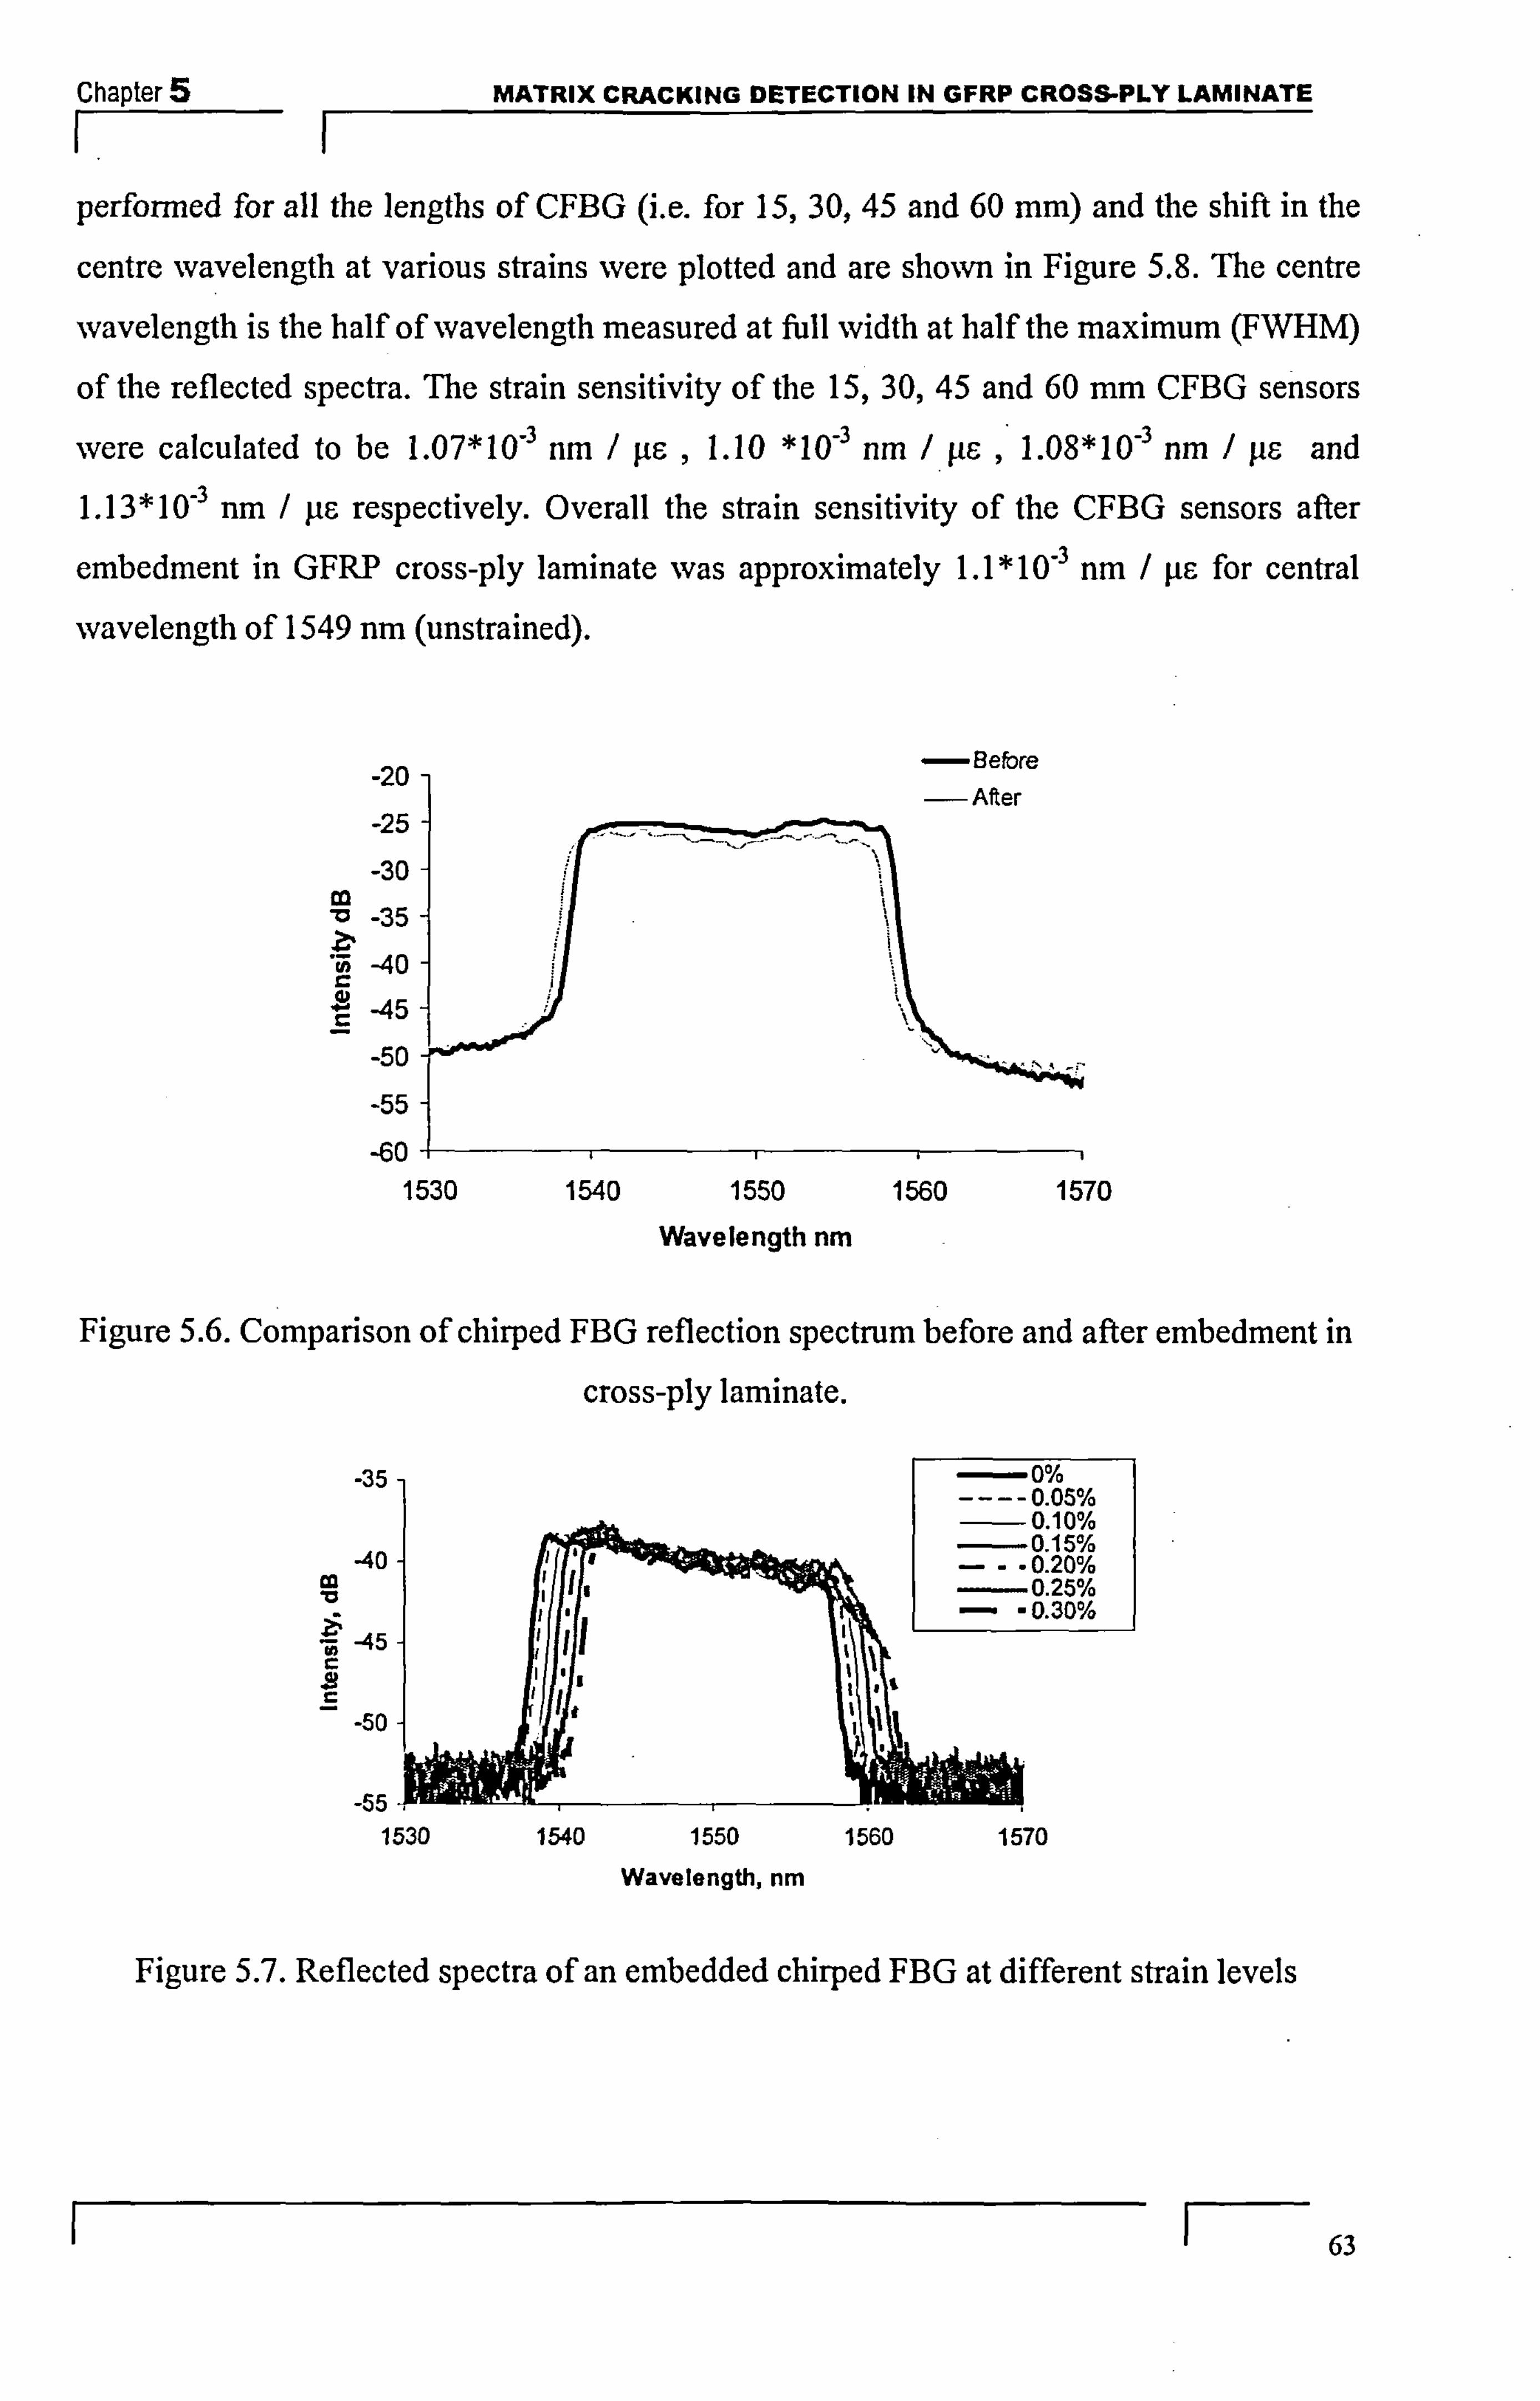
Chapter 5 MATRIX CRACKING DETECTION IN GFRP CROSS-PLY LAMINATE
F- I performed for all the lengths of CFBG (i. e. for 15,30,45 and 60 mm) and the shift in the
centre wavelength at various strains were plotted and are shown in Figure 5.8. The centre
wavelength is the half of wavelength measured at full width at half the maximum (FWHM)
of the reflected spectra. The strain sensitivity of the 15,30,45 and 60 mm CFBG sensors
were calculated to be 1.07*10-3 nm / jt6 , 1.10 *10-3 nm / fie ,. 1.08*10-3 nm / ps and
1.13* 10-3 run / ps respectively. Overall the strain sensitivity of the CFBG sensors after
embedment in GFRP cross-ply laminate was approximately 1.1 * 10-3 nm / ge for central
wavelength of 1549 nm (unstrained).
-20-
-25-
-30-
-35-
-40 -
-45-
-50
-55
-60 1530
Before
Figure 5.6. Comparison of chirped FBG reflection spectrum before and after embedment in
cross-ply laminate.
-35
-40
Zý F, -45
-50
-55 -PI 1530
-0.20% -0.25% - -0.30%
1570
Figure 5.7. Reflected spectra of an embedded chirped FBG at different strain levels
F- 63
1540 1550 1560 1570
Wavelength nm
1540 1550 1560
Wavelength, nm
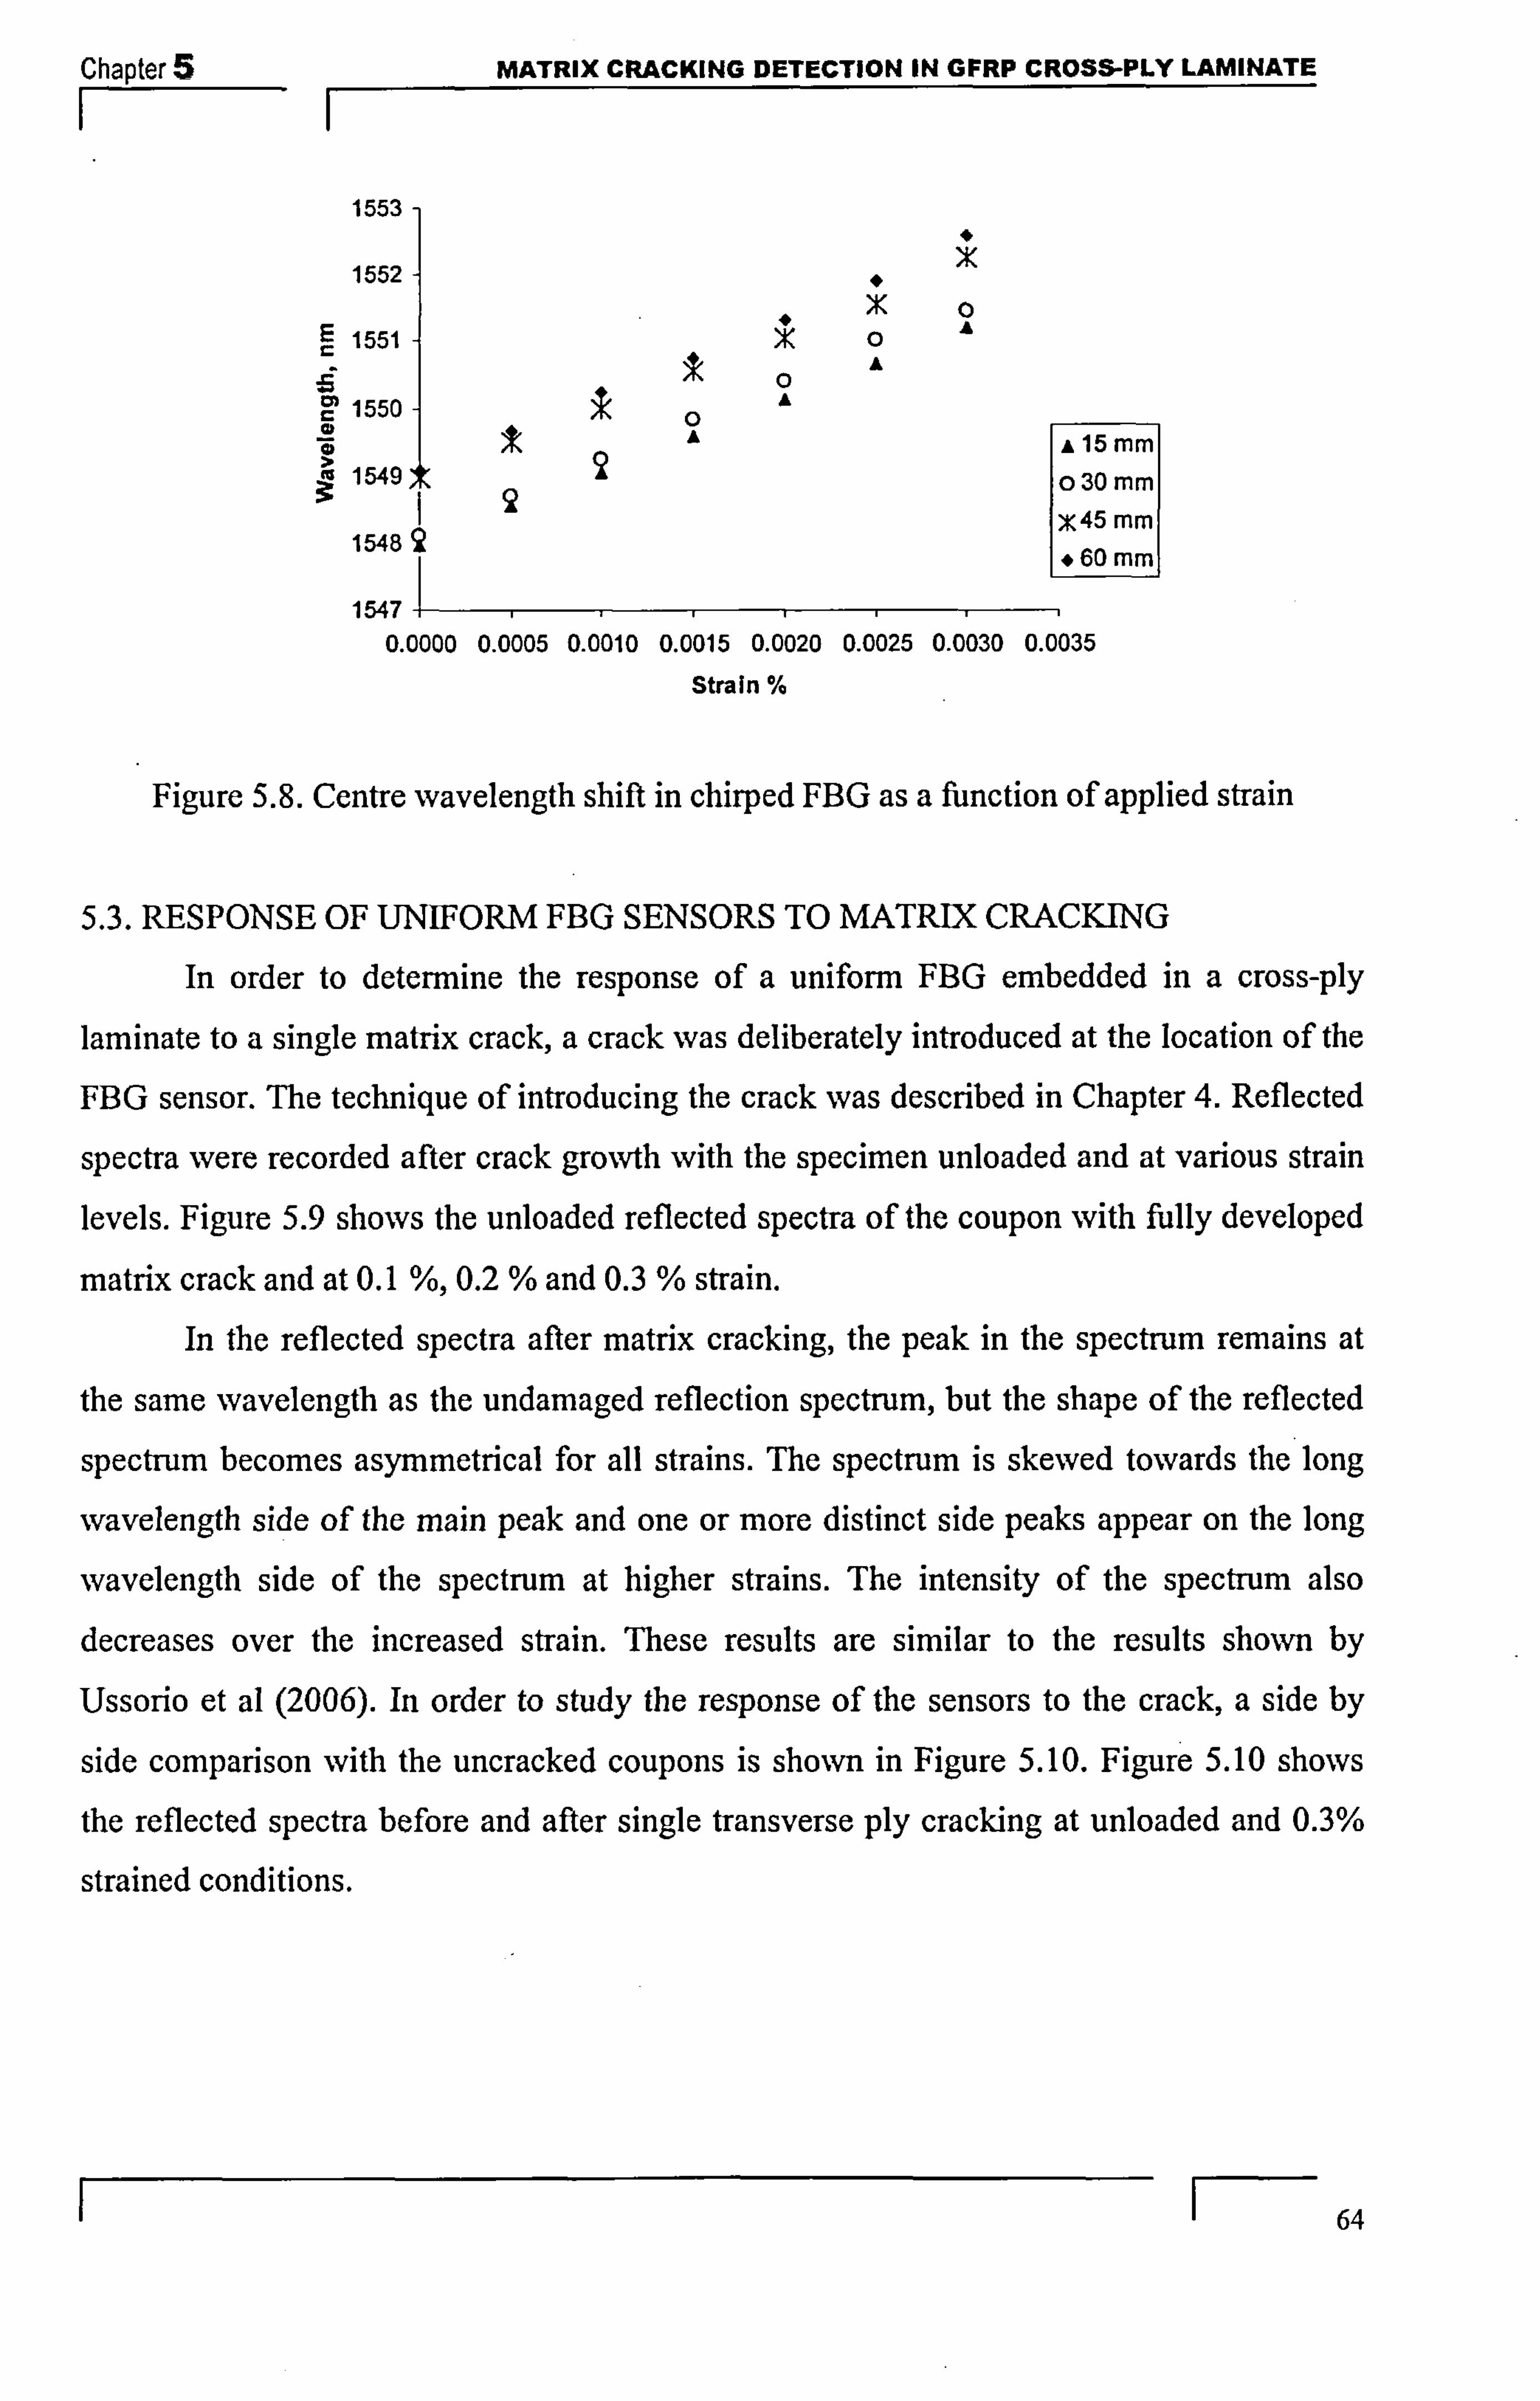
Chapter 5 MATRIX CRACKING DETECTION IN GFRP CROSS-PLY LAMINATE
F- I 1553
1552
E 1551
1550
1549
1548
A 15 mm o 30 mm X45 mm
*60mm
1547 1 0.0000 0.0005 0.0010 0.0015 0.0020 0.0025 0.0030 0.0035
Strain
Figure 5.8. Centre wavelength shift in chirped FBG as a ftinction of applied strain
5.3. RESPONSE OF UNIFORM FBG SENSORS TO MATRIX CRACKING
In order to determine the response of a uniform FBG embedded in a cross-ply
laminate to a single matrix crack, a crack was deliberately introduced at the location of the
FBG sensor. The technique of introducing the crack was described in Chapter 4. Reflected
spectra were recorded after crack growth with the specimen unloaded and at various strain levels. Figure 5.9 shows the unloaded reflected spectra of the coupon with fully developed
matrix crack and at 0.1 %, 0.2 % and 0.3 % strain. In the reflected spectra afler matrix cracking, the peak in the spectrum remains at
the same wavelength as the undamaged reflection spectrum, but the shape of the reflected
spectrum becomes asymmetrical for all strains. The spectrum is skewed towards the long
wavelength side of the main peak and one or more distinct side peaks appear on the long
wavelength side of the spectrum at higher strains. The intensity of the spectrum also decreases over the increased strain. These results are similar to the results shown by
Ussorio et al (2006). In order to study the response of the sensors to the crack, a side by
side comparison with the uncracked coupons is shown in Figure 5.10. Figure 5.10 shows
the reflected spectra before and after single transverse ply cracking at unloaded and 0.3%
strained conditions.
1 64

Chapter 5 MATRIX CRACKING DETECTION IN GFRP CROSS-PLY LAMINATE I-I
-25- -30 -
-35 - -40- -45-
-55 -60
1540
-0% -0.10%
-0.20% -0.30%
1550 1560 1570 Wavelength, nm
Figure 5.9. Reflected spectra of uniform FBG after cracking at various strain conditions
-25
. 30
-35
-40
-45-
-50-
-551
-25-
-30-
-35-
. 40-
45-
-50-
-55
-60 1540 1550 1560 1570
Wavelength, nm
Figure 5.10. Reflected spectra of uniform FBG at unloaded and 0.3 % strain for (a) coupon before transverse matrix cracking (b) coupon after transverse matrix cracking
From the changes in the reflection spectrum, the presence of the crack could be
identified. But as reported by Okabe et al (2004), though this technique provides information on the presence of crack, further details on the location of the crack are unable to be provided. In order to obtain quantitative information both on the presence and location of the crack, the response of chirped FBG to matrix cracks were studied; as the
reflected spectrum from the CFBG is a function of the position along the grating.
5.4. RESPONSE OF CHIRPED FBG SENSORS TO MATRIX CRACKING
The coupons with chirped FBG were studied for their response to matrix cracking in
the same manner as the coupons with uniform FBG. The crack was deliberately introduced
at the desired location and fatigue cycling was run at the peak load and frequency as
65
-60 i 1540 1550 1560 1570
Wavelength, nm

Chapter 5_ MATRIX CRACKING DETECTION IN GFRP CROSS-PLY LAMINATE II
reported in Chapter 4. The transverse crack introduced grew slowly across the width of the
coupon past the sensor and reached the coupon's other edge. After the single crack had grown fully, the reflection spectrum was taken in the
unloaded state and at a number of increasing strains. The reflection spectra at various
strains were then compared. Figure 5.11 is a photograph of the GFRP coupon with the
embedded CFBG sensor after a crack. Figure 5.12 (a) and (b) shows the recorded reflection
spectra at various strain levels for 15 mm, and 30 mm CFBG lengths respectively.
crack
Figure 5.11. GFRP coupon with embedded 30 mm CFBG sensor after a single transverse
crack
a) b)
-40
-45 co v
Z,
-55
-0% strain 0.1% strain 0.25% strain
-60 1 1535 1540 1545 1550 1555 1560 1565
Wavelength, nm
-30-
-35-
-40-
45- r
.s -50
-55
-60 1
Figure 5.12. CFBG reflection spectra after single matrix cracking at a number of strain levels for (a) 15 mm and (b) 30 nim CFBG lengths.
The comparison of the reflected spectra after damage for increasing strain
conditions showed two differences. The first being the shift of the reflection spectra to
higher wavelengths with increasing strains, as expected and as explained in section 5.2.
I F- 66
1540 1545 1550 1555 1560 1565 Wavelength, nm

Chapter 5 MATRIX CRACKING DETECTION IN GFRP CROSS-PLY LAMINATE
The second being a characteristic change in the shape of the reflection spectra after the
crack. In order to study this in detail, the reflection spectra before and after the single
matrix crack were compared, as shown in the Figure 5.13 (a) and (b) for a 15 mm. CFBG
length coupons under unloaded and 0.1 % strain conditions respectively. In Figure 5.14 (a)
and (b) the reflected spectra for a 30 mm CFBG length coupon under unloaded and 0.1 %
strain conditions are shown respectively.
a) b)
-35
-40
45
-50
-55
-60 4-
1535
I-Bebm kj
-After crack
1545 1555 1565 Wavelength, nm
-35 Before CrVA, 0.1% strain
I-Aftercrack.
0.1% strain 40
m 45
-50 - ji S -i-
-55-
-60 1535 1540 1545 1550 1555 1560 1565
Wavelength, nm
Figure 5.13. Comparison of reflection spectra for a 15 mm CFBG sensor before and after
crack for (a) unloaded condition (b) under 0.1 % strain
a) b)
-30-
-35 -
-40-
45-
-50
-55
-601 t
-30 Befbm crack, 0.1% stmi '
-35 -After crack. 0.1% strain]
-40
-45 JR
-50
-55
-60 1535 1540 1545 1550 1555 1S60 1565
Wavelength, nm
Figure 5.14. Comparison of reflection spectra for a 30 rum CFBG sensor before and after
crack for (a) unloaded condition (b) under 0.1 % strain
From the reflection spectra comparison, it is observed that there is an approximately
sinusoidal shape change at a particular location of the reflected spectrum after the crack has
passed the sensor. To locate the crack in the reflection spectrum, firstly the location of the
crack from the image of the transparent GFRP is identified. The crack location in the
transparent GFRP is reported in terms of position from the low wavelength end of the
67
1540 1545 1550 1555 1560 1565
Wavelength, nm

Chapter 5 MATRIX CRACKING DETECTION IN GFRP CROSS-PLY LAMINATE
CFBG sensors as the initial starting position of the low wavelength end of CFBG was
known with an accuracy of 1 mm. Then using FWHM in the CFBG reflection spectra as a
reference which corresponds to the length of CFBG sensor used, the position of the crack in
the image of the transparent GFRP is converted to the position in the reflection spectrum.
Fortunately, a position in the sinusoidal shape corresponds to the position of the crack in
GFRP.
Another crack was grown in a similar way but away from the first crack in a coupon
containing 30 mm CFBG sensor. The first crack in the coupon was approximately at 5 mm from the low wavelength end and the second crack was grown approximately at 20 mm. from the low wavelength end, making the crack locations 15 mm. apart from each other.
The reflected spectrum was then recorded with the coupon containing two cracks, 15 mm
apart. The position of the crack in reflection spectra was calculated as mentioned before
and is denoted by a vertical line and the uncertainty is indicated by the dotted lines in
Figure 5.15. It can be noted that the position of the crack is not at the minimum of the dip.
Takeda et al had suggested in their work on matrix crack in CFRP laminates that the
position of the crack is at the minimum of the dip [Okabe et al., 2004]. But it could be
clearly seen in our case that the position of crack is not at the minimum of the dip, though
the uncertainty in the crack position with respect to the CFBG makes a firm conclusion impossible. The modelling, described in section 5.5, sheds further light on this issue and indicates the exact position of the crack with respect to the perturbation in the reflection
spectrum.
-30
-35
-40
-45
-50
-55
-60 11 1530 1535 1540 1545 1550 1555 1560 1565
WavelengUlýnm
Figure 5.15. Reflection spectra in a 30 mm CFBG containing two cracks, 15 mm apart. Long vertical line denotes the position of the crack and the small dotted line denotes the
uncertainty in locating the position of crack.
68

Chapter 5 MATRIX CRACKING DETECTION IN GFRP CROSS-PLY LAMINATE
F- I To study how the characteristic shape change in the reflected spectra was related to
the crack position; the spectra were predicted using a stress transfer model and OptiGrating,
version 4.2. A stress transfer model was required to provide the strain distribution in the
composite laminate in the vicinity of crack. In the section below, the strain distribution due
to the transverse crack was obtained from the McCartney's stress transfer model [McCartney, 1998] and the prediction of reflected spectra using the strain distribution from
the model is discussed.
5.5. MODELLING AND PREDICTION
McCartney's stress transfer model [McCartney, 1998] was used to provide the strain distribution due to a crack in the composite laminate and McCartney carried out the
relevant calculations for this work. The mechanical properties used in the calculation are
shown in Table 5.1. The strain distribution for an unloaded coupon in the 00 ply at a distance of 62.5 pm (i. e. half the optical fibre diameter) from the 0/90 interface, for a single
crack in the 900 ply was predicted and is shown in Figure 5.16. The strain distribution
shown in Figure 5.16 is for an unloaded coupon, with the zero on the x-axis representing the physical location of the crack. The strains are compressive in the 00 ply due to the
thermal strains arising from the much smaller coefficient of thermal expansion parallel to
the 00 fibres within a ply than in the transverse directions. Consequently, during cooling from the cure temperature, tensile strains develop in the 900 plies and balancing
compressive strains in the 00 plies. In the plane of the crack, the thermal strain is relaxed,
with the consequence that the compressive strain in the 00 ply is reduced, although as a
result of the redistribution of strain in the vicinity of the crack, the strain is n ot reduced to
zero. The reflection spectra were then predicted using the OptiGrating soffivare. As
described in Chapter 3, the OptiGrating sofhvare requires the strain to be input as a function
of distance. The stress transfer result in Figure 5.16 is well represented by a Lorentzian
ftinction:
c=EO + 2A
- IV (eqn.
)T 4(x -x C)2 + IV2
with &O= -0.00247%, x, =O mm (crack position), w=0.78 (distribution width) and A=0.0023 % (amplitude), where x is the distance along the grating. For the prediction of the CFBG reflected spectra for a 15 mm CFBG length using the OptiGrating soffivare, the
F- 69

Chapter MATRIX CRACKING DETECTION IN GFRP CROSS-PLY LAMINATE
properties mentioned in Chapter 3 have been used, with an index modulation, An, of 0.0005. The reflection spectra in the vicinity of crack using the Lorentzian fit to accurate
stress transfer predicted for the index modulation 0.0005 are shown in Figure 5.17 (a)..
Okabe et al (2004) when modeling the reflected CFBG spectra due to transverse ply
cracking in carbon fibre/epoxy resin cross-ply laminates, suggested that a better fit to the
reflected spectrum could be obtained by optimizing the index of modulation, An. Figure
5.17(b) shows that a better fit can indeed be obtained by changing the value of An, in this
case to 0.0002. In particular, the sinusoidal variation of the spectrum in the vicinity of the
crack is now well-represented. Table 5.1. GFRP lamina properties [Ussorio et al., 2004]
Property Value
Longitudinal Young's modulus, El (GPa) 43
Transverse Young's modulus, E2 (GPa) 13
Transverse (through-thickness) Young's
modulus, E3 (GPa)
13
Shear modulus, G23 (GPa) 4.64
Shear modulus, GI 2 (GPa) 4
Shear modulus, GI 3 (GPa) 4
Poisson's ratio v23 0.4
Poisson's ratio 02 0.3
Poisson's ratio v2I 0.091
al (coefficient of thermal expansion parallel to fibres, K71)
8.7 x 10⁻⁶
a2 (coefficient of thermal expansion
perpendicular to fibres, K71)
34.3 x 10⁻⁶
AaAT (Aa is the difference between the
coefficients of thermal expansion; AT is the temperature difference between
room temperature and the resin 'lock-on' temperature during cure)
3.3 x 10⁻³
b, full thickness of outer 0- ply (mm) 0.5
d, half thickness of inner 90- ply (mm) I
70

Chapter 1
0
-0.0005
-0.001
-0.0015
0 -0.002-
-0 ' 0025 -
-0A03 t -4 -3 -2 -1 01234
Distance, mrn
Figure 5.16. Predicted strain profile in the 0' ply at a distance of 62.5 ýLrn from the 0/90
interface.
(a) (b)
0 -5
. 10
15
"6 -20 cc
-25
0
-5
-10
-15
-20
-25
-30 4ý -OV 1.535 1.54 1.645 1.55 1.555 1.56
1.535 1.54 1.545 1.55 1.555 1.56 Wavelength, pm Wavelength, pm
Figure 5.17. Predicted spectra using the accurate stress transfer predictions for (a) An = 0.0005, and
(b) An = 0.0002
(a) (b)
0-
-10
-15 &! zu
lý -25
. 30 L
1.535
0 -5
-15
-20
-25-
-30 t-ý
1.535
Figure 5.18. Predicted spectra using the modified Lorentzian fit (half amplitude) for
(a) An = 0.0005, and (b) An = 0.0002
MATRIX CRACKING DETECTION IN GFRP CROSS-PLY LAMINATE
-Accurate stress transfer prediction Lorentzian it to accurate prediction
-Modified Lorentzian fit vvitli half amplitude
71
1.54 1.545 1.55 1.555 1.56
Wavelength, isn 1.54 1.545 1.55 1.555 1.56 WavelengU% lim

Chapter 5 MATRIX CRACKING DETECTION IN GFRP CROSS-PLY LAMINATE
F-- I However, it has to be noted that the stress transfer model has calculated the value of
the strains at the position of the optical fibre core without taking into account (a) the
replacement of the reinforcing fibres (diameter, 16 jun) and matrix by the optical fibre itself
(diameter, 125 gm) and, (b) the possibility of matrix non-linearity. Both of these effects are likely to reduce the local strain magnification experienced by the CFBG sensor. Hence the
peak strain in the Lorentzian function was reduced by a factor of 2, while retaining as far as
possible the shape predicted by the stress transfer model (Figure 5.16), and the resulting
predicted spectrum is shown in Figure 5.18(a) for both index modulation of 0.0005 and 0.0002. The predicted reflection spectra is now in much better agreement with the
experimentally measured spectrum for both An = 0.0005 and An = 0.0002. Closer
agreement between the simulation and the experiment is found by reducing the value of the
peak strain to account for the likely reduction in the strain magnification and at the index
modulation of 0.0002. Hence, it appears likely that the detailed predictions of the stress
transfer model in the vicinity of the crack are at least as important as modifications to the
value of the index modulation, An, for an accurate simulation of the reflected spectra. To locate the position of the crack, the full width at half maximum (FWHM) is
taken as the reference. The FWHM corresponds to the physical length of the CFBG i. e. the
sensor length. As the prediction was made for a 15 min CFBG length with the crack located
at 5 min from the low wavelength end, the FWHM in the reflected spectrum corresponds to
15 mm and the 5 mm location is calculated from the low wavelength end which would
provide the exact location of the crack. In all cases of Lorentzian fit and modified Lorentzian fit, the crack position in the simulation (represented by dotted vertical line in all the reflection spectra) is found to be on the lower wavelength side of the deep valley in the
reflected spectra, corresponding to distances of up to I mm (Figure 5.18(b)). Hence, the
simulation confirms that the minimum in the spectrum does not correspond to the precise
physical location of the crack, but the cracks lie away from the minimum towards the low
wavelength. The prediction of uniform FBG reflected spectra was also carried out using the
modified half amplitude Lorentzian function and the index modulation of 0.0002. Figure
5.19 (a) shows the predicted reflected spectra of uniform FBG before any crack, and Figure
5.19 (b) shows the predicted FBG reflected spectra after the crack under 0% strain. The
crack was placed at the 5 mm in the 10 mm length FBG. The FBG reflected spectra before
crack development showed a single peak and are symmetrical. After the crack, the
72

Chapter 5 MATRIX CRACKING DETECTION IN GFRP CROSS-PLY LAMINATE F- I
predicted spectrum is asymmetrical with skewing at the higher wavelength end. The
resulting predicted FBG reflected spectrum before and after cracking was in good
agreement with the experimental spectrum (Figure 5.10).
0
-5 co -0 . 10
-15
-20
-25
0
-5
10
-20
-25
-304- 1540 1545 1550 1555 1560
Wavelength, nm
Figure 5.19. Predicted uniform FBG reflected spectra for coupon (a) before crack and
(b) after crack using the modified Lorentzian fit (half amplitude) and An = 0.0002
5.6. DISCUSSION:
5.6.1. Reflection spectra changes recorded by the uniform FBG:
Reflection spectra recorded for the 10 mm unifonn FBG at various strains due to
transverse cracking shows broadening on the longer wavelength side of the main peak, and
with additional peaks of weaker intensity on the longer wavelength side. The qualitative
explanation for these results follows the description given by Ussorio et al [25,93].
When the composite cross-ply laminates are fabricated, due to difference in thermal
coefficient of expansion between the 0' ply and 90' ply, thermal strains were locked in.
The 0' ply experiences thermal compressive strain, which shifts the reflection spectrum to
lower wavelength as shown in Figure 5.3. When the transverse cracks were grown, it
locally releases the thermal stresses developed during processing. As a result the
compressive thermal strain in the longitudinal ply is relaxed locally (as shown in the strain distribution from the stress transfer model in Figure 5.16). These strain changes due to
cracking were localized and occur typically over lengths of about one transverse ply
thickness on either side of the crack, in this case over a length of about 4 mm. of the Bragg
grating. For the remaining 6 rum of the Bragg grating, the grating period is undisturbed by
the strain field surrounding the crack. Hence the grating spacing of the FBG sensor
embedded in the 0' ply experiences, a) the local increase in strain in the vicinity of crack
and b) unchanged strain away from crack. The former contributes to the additional
reflections at high wavelengths, producing a skewing of the spectrum in the FBG reflection
73
-30 1....... 1540 1545 1550 1-555 1560
Wavelength, nm

Chapter 5 MATRIX CRACKING DETECTION IN GFRP CROSS-PLY LAMINATE
spectrum and the latter contributes to the main peak of the spectrum approximately at the
same wavelength as the peak for the undamaged coupon. This effect was accentuated when
a strain was applied to the composite, since the 0' plies see an enhanced local strain in the
plane of the crack because the transverse ply crack has lost its ability to carry load across
the crack plane. Hence the peak reflected wavelength remains in its position as in the
uncracked strained coupons but the reflection at high wavelength has moved to higher
wavelengths thereby broadening the spectrum
5.6.2. Reflection spectra changes recorded by the Chirped FBG:
In the vicinity of the crack, the reflection spectrum recorded by the CFBG
embedded in the composite laminate shows a sinusoidal shape change; first with a fall in
intensity followed by a rise and fall to the undisturbed value. This shape change occurs at a
particular location, corresponding to the location of the crack. The characteristic shape
change in the reflection spectrum is explained as follows.
The non-uniform residual strain distribution due to the crack in the transverse ply
produces a sharp narrow peak at the crack location as the compressive strain in the 0' ply is
released by the transverse crack in 90' ply, shown in Figure 5.16. This strain distribution
disrupts the linear increase of the pitch length of the chirped grating, causing the grating
period to change unevenly. This change in the grating period due to the crack (calculated
from the equations 3.13 and 3.14) is shown in Figure 5.20.
535
E 534 'i V o 533 0) CL
cn 532
531
530
529
distance along the CFBG, mm
Figure 5.20. Grating period calculated for the CFBG of 15 mm length from the axial strain before and after crack.
74
10 15
Chapter 5 MATRIX CRACKING DETECTION IN GFRP CROSS-PLY LAMINATE I F-
From Figure 5.20, it could be noted that the grating period at the vicinity of the
crack changes unevenly but away from the crack it remains the same. At the vicinity of the
crack, particular grating periods are lost at a few positions and particular grating periods are
gained at other positions compared to grating periods in uncracked specimens. As the
density of the grating period corresponds to intensity of the reflected spectrum, any
reduction in the grating period density leads to a reduction in the intensity of the reflected
spectrum at particular wavelengths and an increase in grating period density leads to an increase in the intensity of the reflected spectrum at other wavelengths. Far from the crack,
the strain field in the composite is not disturbed, so that the reflected spectrum retains its
undisturbed shape.
5.7. CONCLUSIONS
Uniform and chirped FBG se nsors have been embedded within the 00 ply of
transparent cross-ply GFRP composite coupons and changes to the reflected spectra as a function of strain and crack development have been studied. In the case of a uniform FBG,
the spectra of undamaged material have a single peak and a symmetrical shape. After the
formation of a crack, the spectra become skewed in shape, with a broadening of the spectra
on the higher wavelength side. Secondary peaks in the spectrum on the higher wavelength
side become more prominent with increasing applied strain. For the CFBG, a spectral band
of wavelengths are reflected and are shifted uniformly to higher wavelength values with increasing strain. For coupons containing a crack, a CFBG shows an approximately
sinusoidal variation of the intensity of the reflected spectrum at the position of the crack,
enabling both crack development and crack position to be identified. The changes in the
spectra of both types of FBG are due to enhanced local strains in the 0 ply due to the
development of a crack in the transverse ply. Simulations of the CFBG reflected spectra for the case of a coupon containing a matrix crack are in reasonable agreement with the
experimental results, particularly when the strain magnification predicted by a stress
transfer model is reduced to account for the presence of the optical fibre and possible
matrix non-linearity. Thus the main conclusions from this part of the study are
e The presence of a crack in a cross-ply laminate could be identified by the
embedded uniform FBG sensor at the 0/90 interface from the skewing and broadening of spectra towards the higher wavelength.
I F- 75

Chapter MATRIX CRACKING DETECTION IN GFRP CROSS-PLY LAMINATE
F- e The effect of identifying the crack in the composite laminate could be enhanced
by recording the reflection spectra at increasing strains.
* The presence of the crack could be identified by the chirped FBG from the
approximate sinusoidal shape in the reflection spectrum.
o In addition to identifying the cracks, the location of the crack could be predicted
with the use of a CFBG from the characteristic change in the CFBG reflected
spectnim.
* The location of the crack in the CFBG reflected spectrum is not the minimum of
the dip, but at a distance of about I mm from the position of the minimum
towards the low-wavelength end of the reflected spectrum.
o The spectrum could be predicted from the strain distribution obtained from a
stress transfer model with the aid of OptiGrating sofhvare and the predicted
results agree well with the experimental results.
5.8. SUMMARY
This chapter presented the results and discussion on the response of both unifonn
and chirped FBG's to matrix cracking. The advantage of using the chirped FBG lies in the
crack identification and crack location. The precise location of the crack in the composite laminate is identified from the reflection spectrum and hence this technique is a new
reliable approach for damage detection in composites. In the next chapter, the work was
extended to study the disbond detection in composite-composite bonded joints using CFBG
sensors. The forthcoming chapter will discuss the detection of disbond initiation and the
progression of the disbond when analysing the CFBG reflected spectra.
76
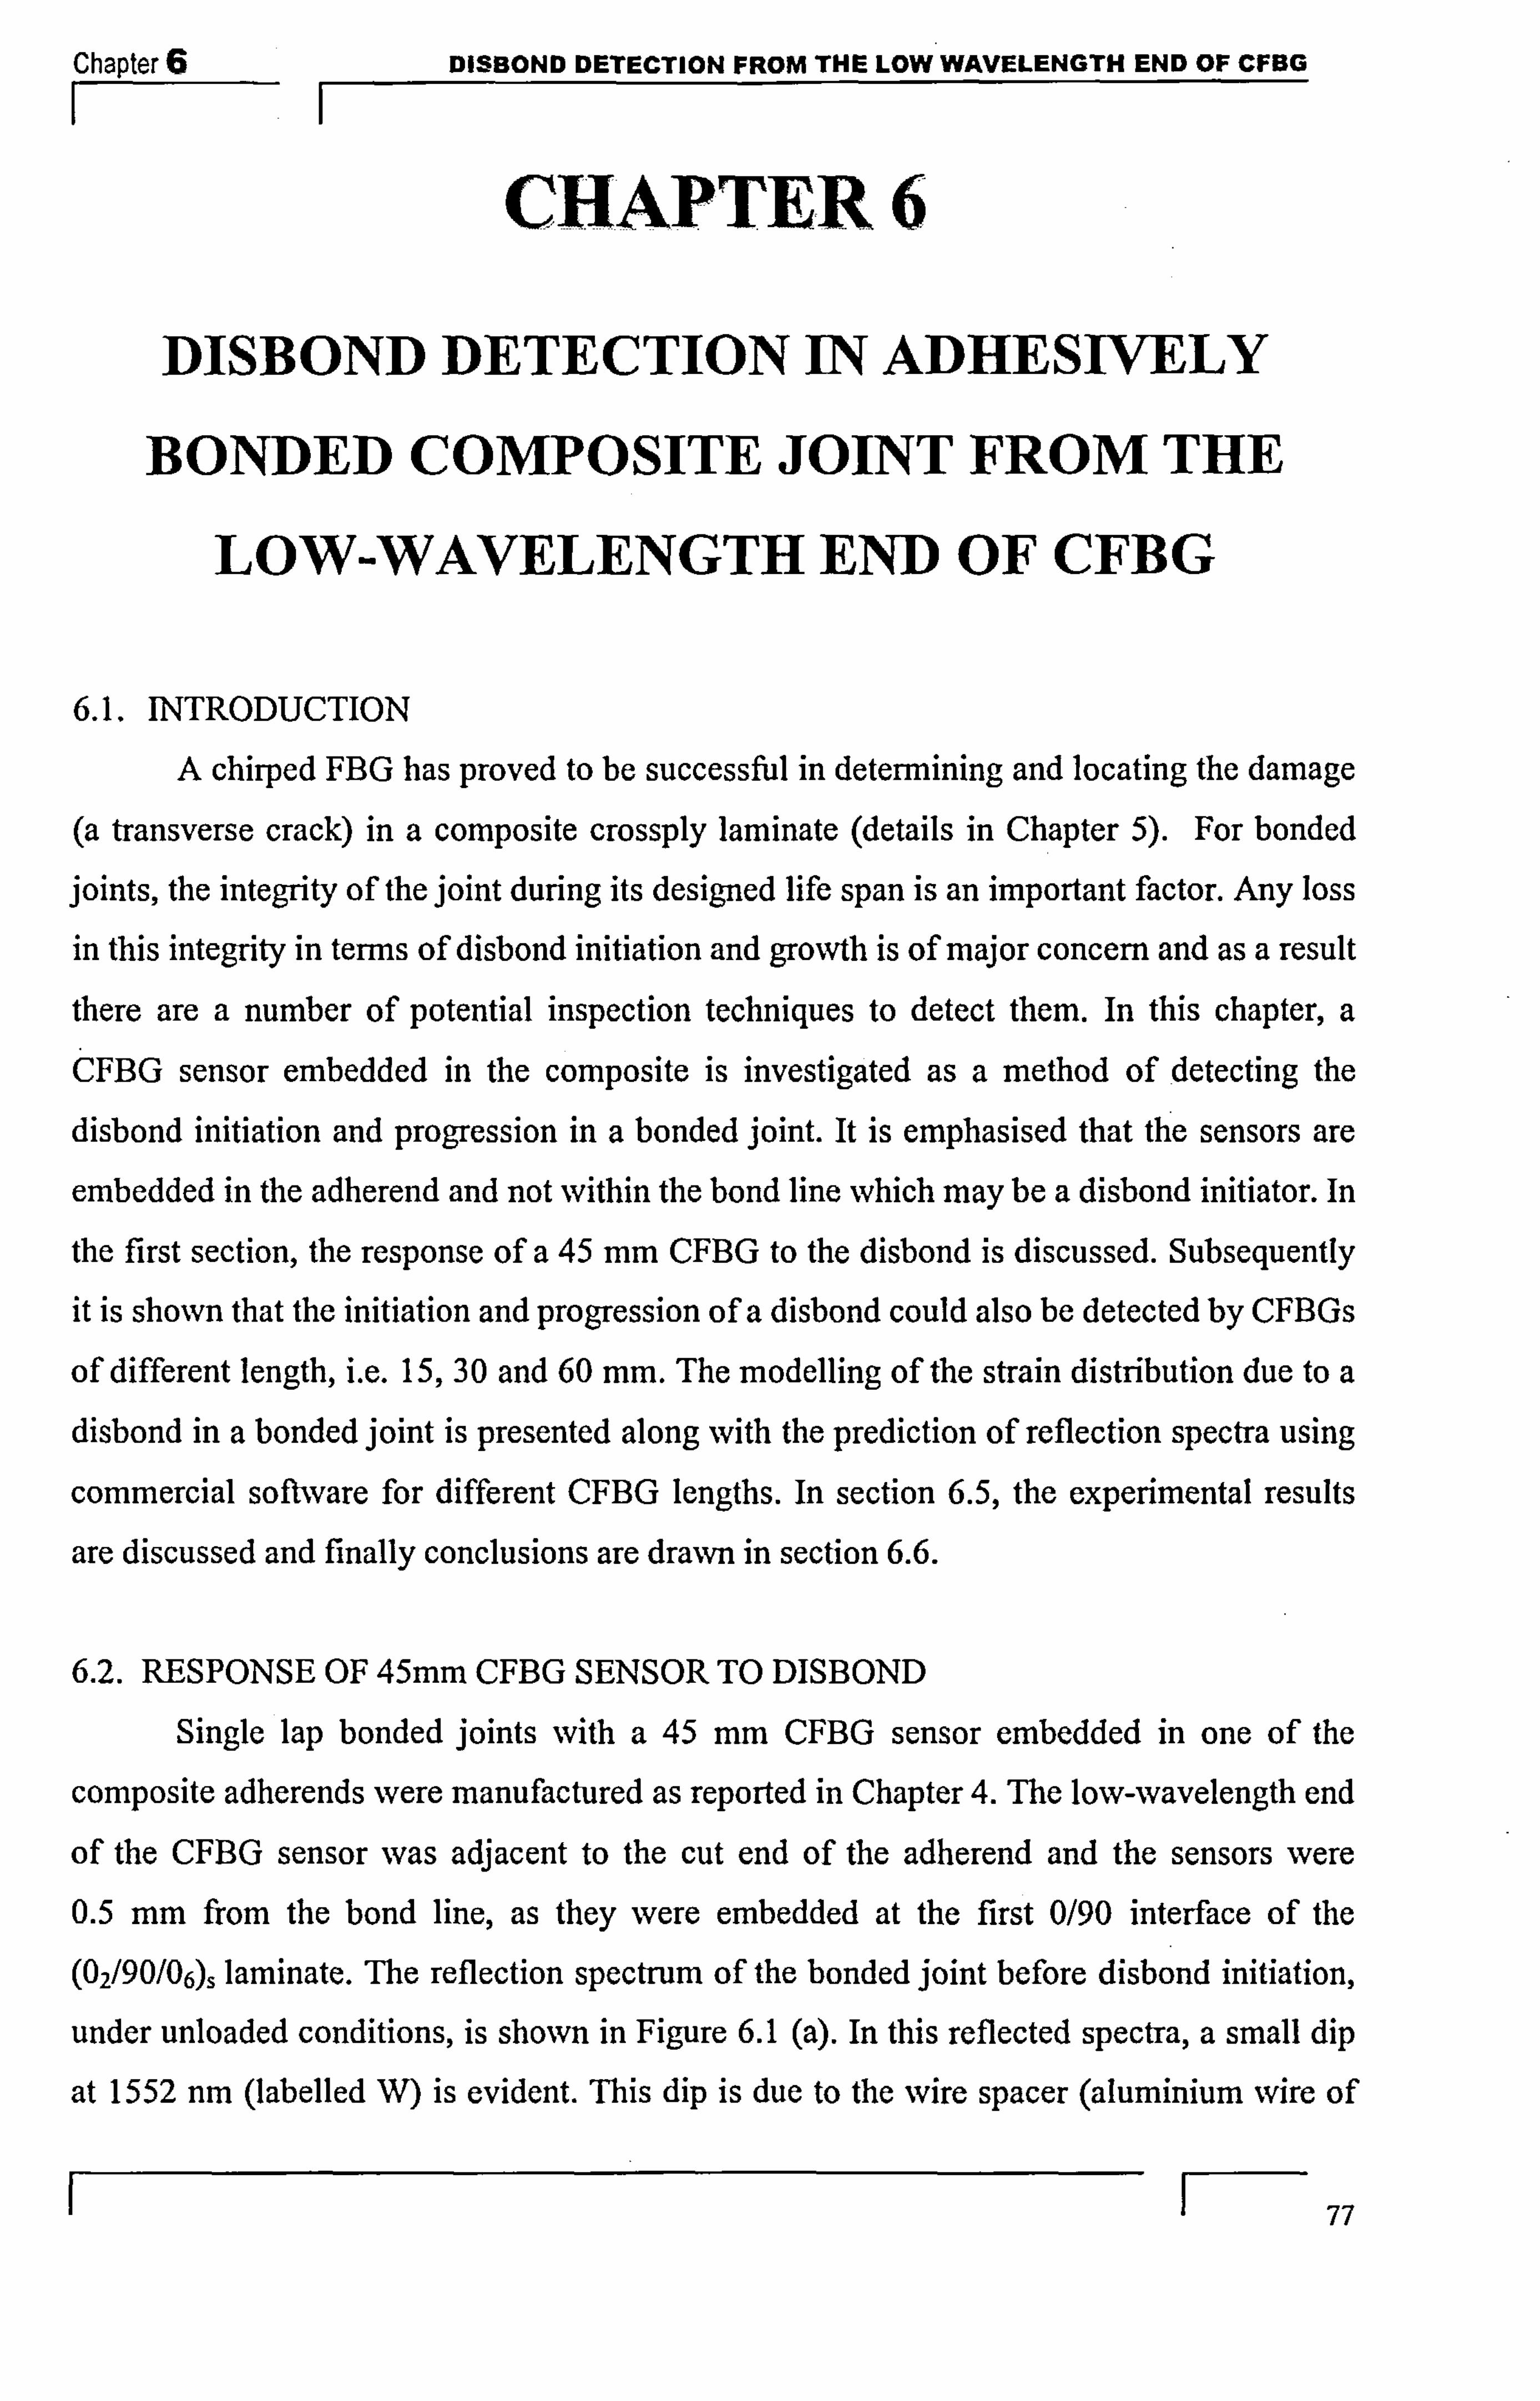
Chapter 6 DISBOND DETECTION FROM THE LOW WAVELENGTH END OF CFBG
CHAPTER 6
DISBOND DETECTION IN ADHESIVELY
BONDED COMPOSITE JOINT FROM THE
LOW-WAVELENGTH END OF CFBG
6.1. INTRODUCTION
A chirped FBG has proved to be successful in determining and locating the damage
(a transverse crack) in a composite crossply laminate (details in Chapter 5). For bonded
joints, the integrity of the joint during its designed life span is an important factor. Any loss
in this integrity in terms of disbond initiation and growth is of major concern and as a result
there are a number of potential inspection techniques to detect them. In this chapter, a CFBG sensor embedded in the composite is investigated as a method of detecting the
disbond initiation and progression in a bonded joint. It is emphasised that the sensors are
embedded in the adherend and not within the bond line which may be a disbond initiator. In
the first section, the response of a 45 mm CFBG to the disbond is discussed. Subsequently
it is shown that the initiation and progression of a disbond could also be detected by CFBGs
of different length, i. e. 15,30 and 60 mm. The modelling of the strain distribution due to a disbond in a bonded joint is presented along with the prediction of reflection spectra using
commercial software for different CFBG lengths. In section 6.5, the experimental results
are discussed and finally conclusions are drawn in section 6.6.
6.2. RESPONSE OF 45mm CFBG SENSOR TO DISBOND
Single lap bonded joints with a 45 mm. CFBG sensor embedded in one of the
composite adherends were manufactured as reported in Chapter 4. The low-wavelength end
of the CFBG sensor was adjacent to the cut end of the adherend and the sensors were 0.5 mm from the bond line, as they were embedded at the first 0/90 interface of the
(02/90/06). laminate. The reflection spectrum of the bonded joint before disbond initiation,
under unloaded conditions, is shown in Figure 6.1 (a). In this reflected spectra, a small dip
at 1552 nm (labelled W) is evident. This dip is due to the wire spacer (aluminium wire of
77

Chapter 6 DISSOND DETECTION FROM THE LOW WAVELENGTH END OF CFBG I F-- thickness 0.4 mm) placed to obtain a 0.4 mm. adhesive thickness. The reflection spectrum
under loaded conditions (5 kN) was recorded and is shown in Figure 6.1 (b). The
comparison of the reflection spectra before and after loading shows the shift in the spectra
to higher wavelengths due to the increase in all of the grating periods of the CFBG (see the
detailed discussion in Chapter 5). The bonded joints were then subjected to fatigue cycling
to initiate and grow a disbond. The cyclic loading was interrupted at increasing numbers of
cycles in order (a) to record the position of the growing disbond front in the transparent lap
joint using an in sint digital camera, and (b) to record the reflected spectrum of the CFBG
sensor with thejoint subjected to a constant load of 5 kN.
a)
-20
-25
0 -30 V 2F
. . 35
Z -40
-45
-20-
-25- co -30-
-35- r
-451
Figure 6.1. (a) CFBG reflected spectra from the bonded joint under unloaded condition. The dip (labelled W) at 1552 nm. represents the wire spacer kept from achieving the
adhesive thickness (b) Comparison of CFBG reflected spectra before and after load.
6.2.1. Detection of disbond initiation
The following section provides a typical example of disbond initiation detection. In
this joint, a disbond had initiated at the edge of the free end of the bonded joints after a few
thousand fatigue cycles (7500 cycles). The reflection spectrum recorded after the disbond
initiation (7500 cycles) and the digital image of the GFRP bonded joint at 7500 cycles with the disbond is shown in Figure 6.2. Comparison of the reflected spectra before disbonding
and after disbonding (Figure 6.2(b)) showed a shift in the low wavelength end of the
reflection spectrum to lower wavelengths. The other parts of the reflection spectra remain
unchanged.
F- 78
-50 i 1535 1540 1545 1550 1555 1560
Wavelength, nm
-SO , 1535 1540 1545 1550 1555 1560
Wavelength, nm
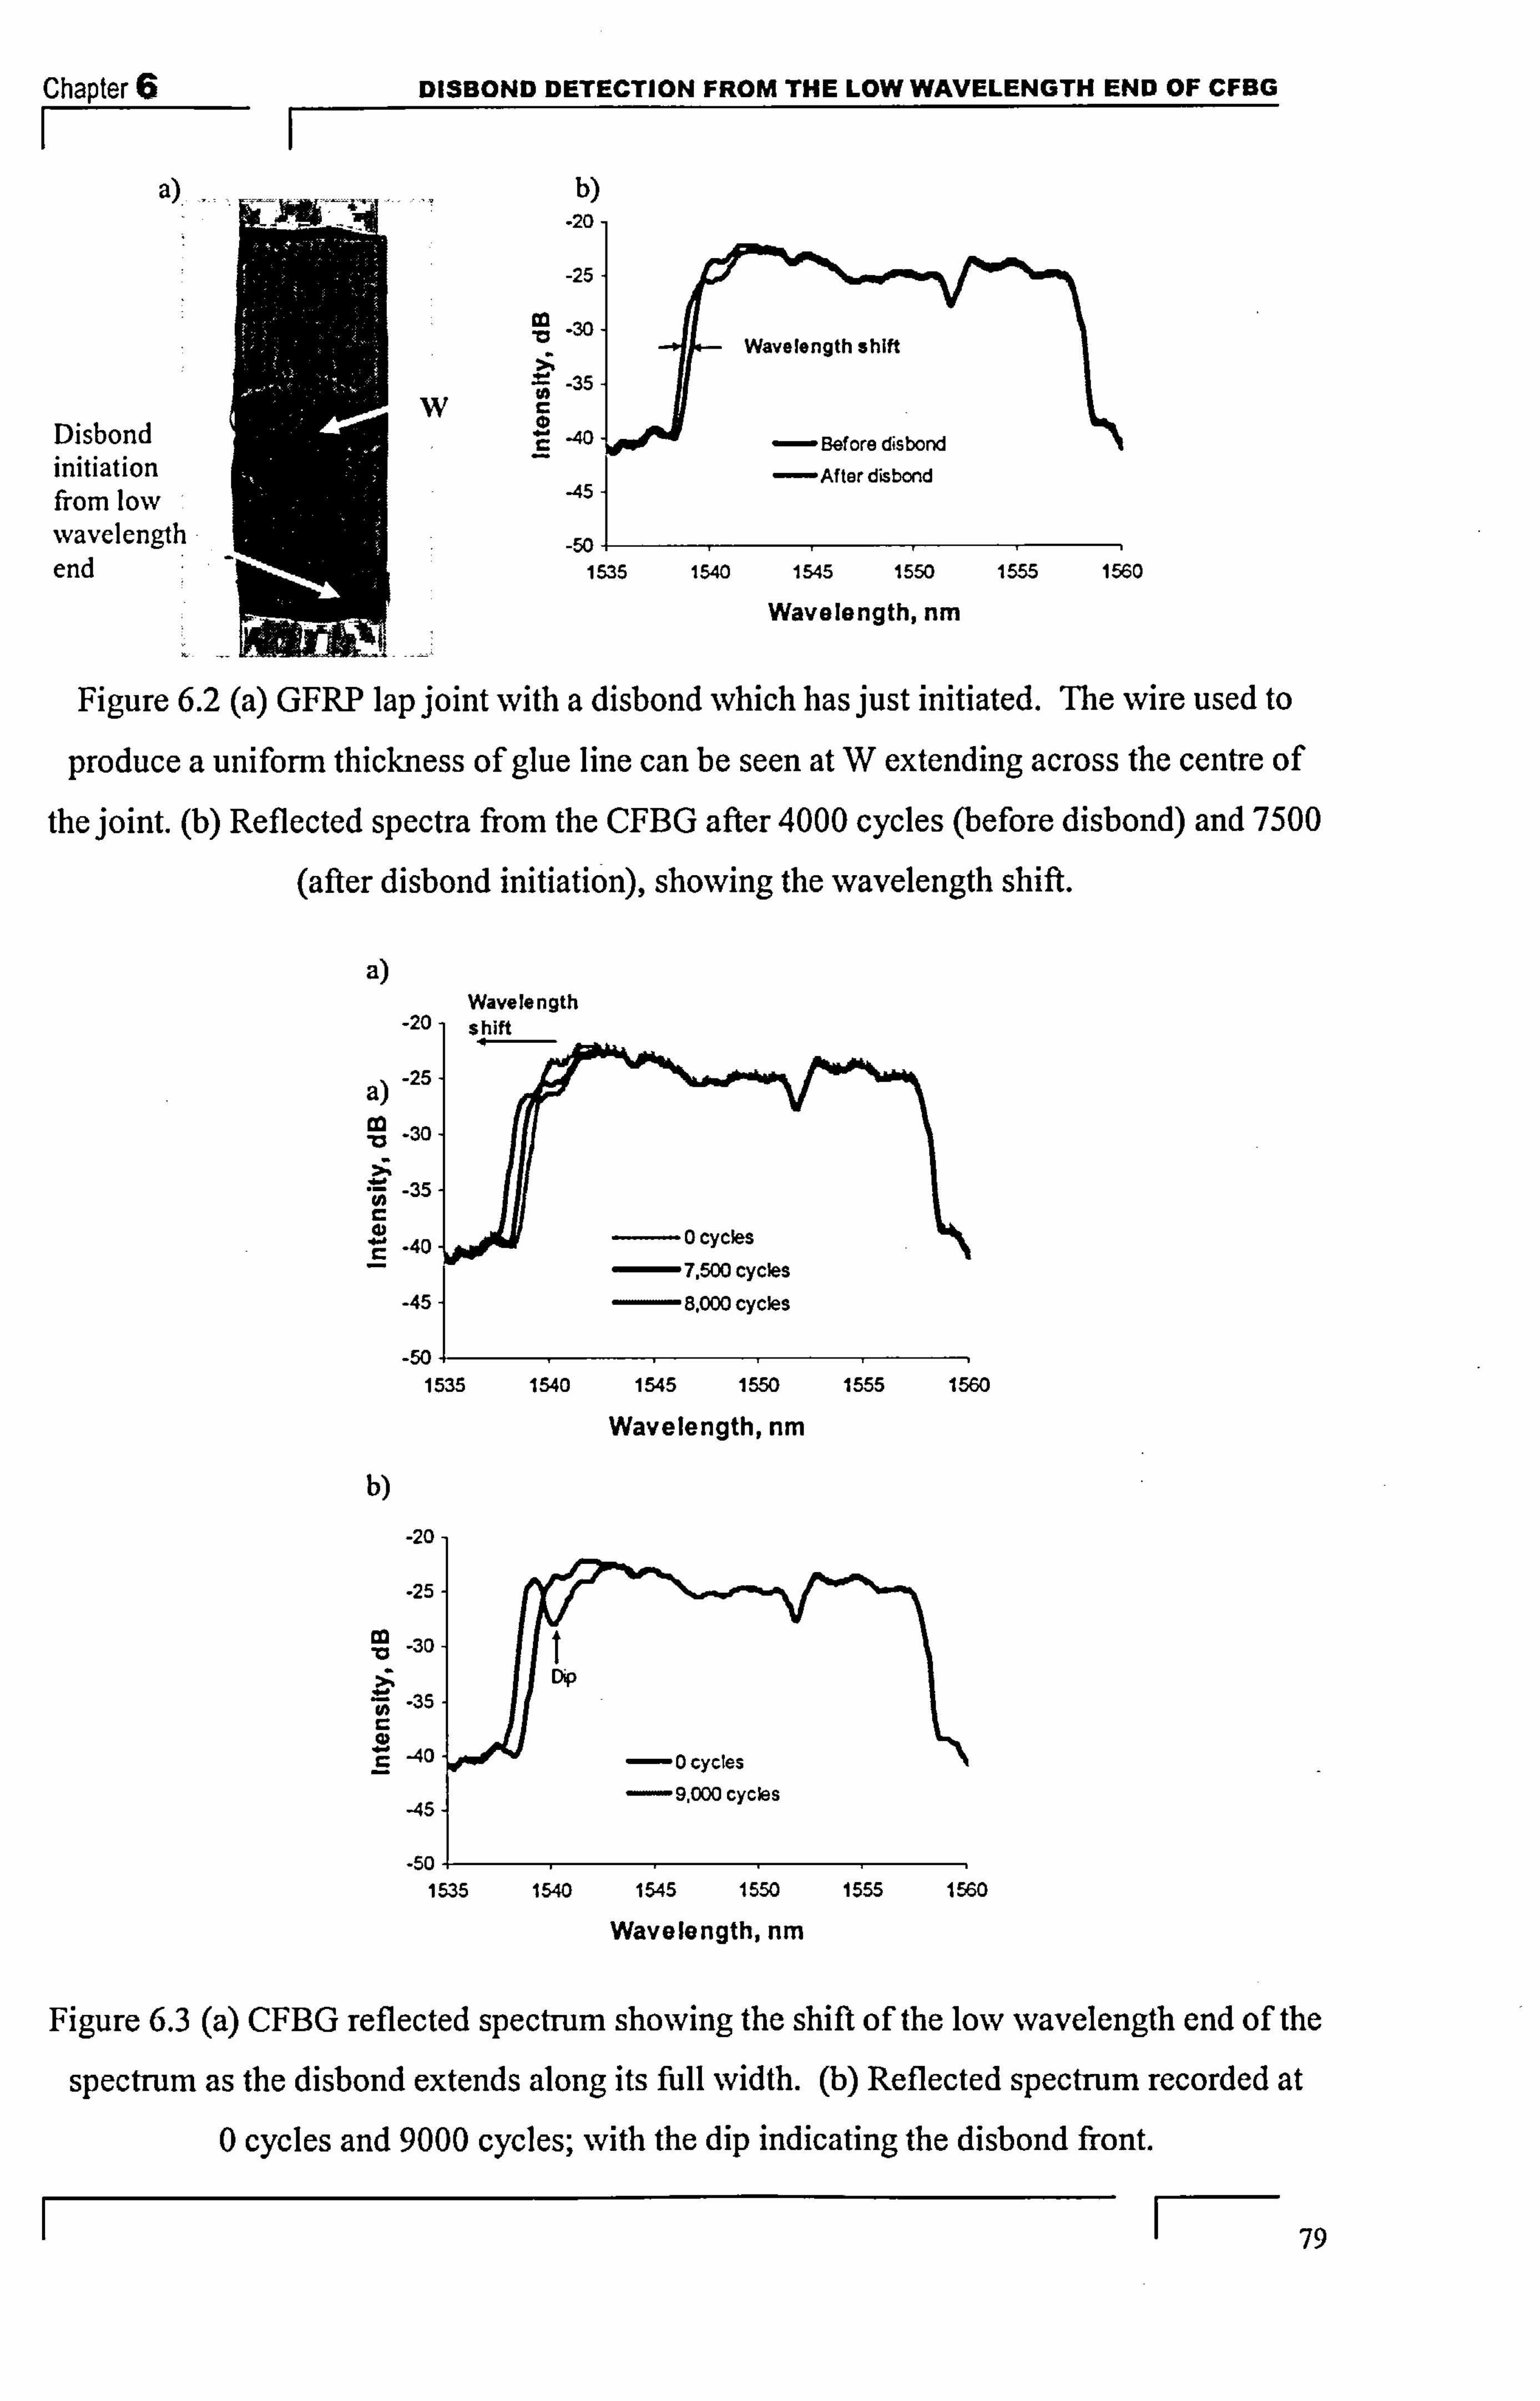
Chapter 6 DISBOND DETECTION FROM THE LOW WAVELENGTH END OF CFBG I F-
a) b)
-20
-30 Wavelength shift
Belo
-25 0" OP04,
-35 W Disbond fo -40 -Before disbond initiation
-45- After disbond
from low
wavelength -50 end bon 1535 1W 1545 1550 1555 1560
Wavelength, nm
Figure 6.2 (a) GFRP lap joint with a disbond which has just initiated. The wire used to
produce a unifonn thickness of glue line can be seen at W extending across the centre of
the joint. (b) Reflected spectra from the CFBG after 4000 cycles (before disbond) and 7500
(after disbond initiation), showing the wavelength shift.
a) Wavelength
-20 shift
a) -25
-30
-35 C 0-
f-
0 cycles C 40
-7,500 cycles
-45 8,000 cycles
-50
i
1535 1540 1545 1550 1555 1560
Wavelength, nm
-20
-25
-30
-35
-45
-50 1
Figure 6.3 (a) CFBG reflected spectrum showing the shift of the low wavelength end of the
spectrum as the disbond extends along its full width. (b) Reflected spectrum recorded at
0 cycles and 9000 cycles; with the dip indicating the disbond front.
I F- 79
Iw 1545 1550 1555 1560
Wavelength, nm
Chapter 6 DISBOND DETECTION FROM THE LOW WAVELENGTH END OF CFBG
At 7500 cycles, the disbond had initiated but not yet grown fully across the
specimen width. With increasing cycle number, the disbond grew across the width and at
these increasing numbers of fatigue cycles the low wavelength end of the spectra moved towards the lower wavelengths, as shown in Figure 6.3 (a). Once the disbond has fully
extended across the bond width, the shift in the spectrum towards lower wavelength was
complete. At this point, the end of the disbonding adherend is now fully relaxed and hence
the reflected spectrum for the lowest wavelengths (corresponding to the free edge of the
adherend) stabilises. In addition to this shift, perturbation or dip develops in the reflection
spectrum and Figure 6.3 (b) clearly demonstrates the additional feature (dip at the low
wavelength end) that appears on the reflected spectrum after 9000 cycles. The shape of the dip is approximately symmetrical.
6.2.2. Detection of disbond propagation: With further fatigue cycling, the disbond grew along the length of the bonded joint,
as shown in Figure 6.4. The figure shows the digital image of the transparent GFRP joint
with a disbond after 9,000,11,000,12,000 and 13,200 cycles, when the disbond had
extended to points A, B, C and D respectively. It is perfectly feasible for a disbond to initiate at the other end of the bonded joint and indeed such a disbond is evident in Figure
6.4. The reason this disbond had no effect on the reflected spectrum is simple. The CFBG is
45 mm long and is positioned at the lower end of the joint. As the other end of the joint is
60 mm away the disbond would need to progress some 15 mm to have any effect on the
spectrum. In this case the disbond from other end has not grown sufficiently for this to
occur (the response of the CFBG to disbonding adjacent to the high wavelength end of the
sensor will be discussed in Chapter 7). Figures 6.5 (a), (b), (c) and (d) shows the reflection
spectra obtained from the CFBG sensor of the disbonded specimen at 9,000 cycles, 11,000
cycles, 12,000 cycles and superposition of the CFBG reflected spectra for 9,000,11,000,
and 12,000 cycles with the disbond A, B and C respectively. The reflection spectra at increasing fatigue cycles shows the perturbation moving to the high wavelength end of the
reflection spectrum. From the superposition, the movement of the dip in the spectrum towards high wavelength is very clear.
r- 80

Chapter
Figure 6.4. GFR2 gf-, w-. -- of t: -a Csý:,, -s A, C and D after -, d to ý 9,000; 11,000; 12,000 and 13,200 c--z-es, respectively.
-2a
-26
-33
-35
-40
-45
-. 50 11,35
a)
-20
-25
'30
-36
-40
-45
-50 ---------- 1535 1540 1545 1550 1555 1530
WavalengZh, nn
-20 1 b)
-25-
'30-,
_35
S -40
-46
-50 1535
-20
-25
-3D A
-35
-40 9,00a
-45 i 1'300
-12,000
1535 1540 1545 1550 1555 156D
wavalongth, nm
Figure 6.5. CFBG spectra after (a". 9,000 cycles, (b) 11,000 cycles, (c) 12,000 cycles and (d)
superposition of 9,000,1 1,00C, --d 12,000 cycles spectra showing the MOVelnerlt of ýhe
perturbation in the ý, ) higher wavelengths as the disbond grows.
Initizily the minimum of the dip in- the reflected spectra was assum, ed to be the
position of the disbond fýont. Figure 6.6 shows a p. lot of the position of the disbond f-'--ont
r- , 31
1540 1545 1550 1555 1560
WawlG(vzh, m
1540 1645 1550 1660
Wawiength, nm

chapter S iý--TECTIDN FROM Tý-ý L- END OF CFBG
(fronn the CFBG Spec L-::, ̀ ý against the actual disbo-nd front position as nn,. --asured
id- indicated !, 1 5.6 directly from images of ine it bor
Lth the -sition o-' of t1-- represent the uncertainty in -ig bot a Che
reflected spectrum and the diffli---Ity of identifying the precise pos. -`on oL the disti-I-A front
from images such as those shown in Fig-arcs 6.2, and 6.4. Despite these 11. ncertaintles, it was C"
. IU- In 4 no+cd that the movement of the perturbation in the SpeCT disbond position. In order to check the assumption, the reflected ý, peclra were predicted theoretically for known disbond lengths of 5 rnm and 10 mm. The between the
perturbation in the reflected spectrum and the actual position of the disbond front as
physically measured on the transparent specimen was explored and is reported in section 6.4.
14
E 12
0 m 10 LL
J:, X4. M
0 ---- 02 12 14
Cis bond front (from photographs), mm
Figure 6.6. Disbond front measured from the position of the mininiam of the dip in flie
relflected CFBG spectra plotted against , the disbond ftont position measured fýom
photographs of tl ie J oint
After the modelling and the prediciion of the reflected spectra due to disbond of known lengths was cc. --.:? I_-ted, it was noted that the of the large dip is not tthe
actual -oosition ofthe --isbond ftont. The disl-, )nd ftont'3 `-, out 1.5 mm away from
the minimum in the reflected spectrum, -, ), ,--s -he low w-,,, _-Iength end of file CFBG
sensor (see later; section 6.4). The plot of th. - osition of the disbond front obtained frorn
tlý_- CFBG spectra, corrected for the acwal position of the disbond ftnt in relat; on to the
of the dip in the spectrum, against the measured positIon ol" the disbond front
F- 82

:. . Toi 'NG: ":.: : CFG
Obtair, ed from images ol the lbonded joimt is shown M Figure 6.7. From the --ig ,, ý', is
evident friat. fhe disbond front could be located to within about ±- 2 mm.
12
i0
4--
'o I,
04 2
0 02468 10 12
Disbond length (photographs), mm
Figure 6.7. Comparison of the disbond length obtained using ' the CFBG measurements
Ith the disbond length measured from photographs of the bonded (after the corrections) W4 j oint.
6.3. RESPONSE OF 15,30 AND 60 mm CFBG SENSORS TO DISBONDING
In the previous section, it was showr. that the disbond initiation and growth from
one end of the adherend could be detected usiný4 a 45 nim CFBG sensor embedded in one
of the adherends. In this section, the same experiments were performed on various CFBG
sensors witri lengths of 15,30 and 60 = and their responses to the disbond in the bonded
joints were studied. A fatigue load with a peak value of 8 k-N, R value M and frec... --acy of
5 Hz were applied. All of the CFBGs have fhe s,.:.. e bandw. c. 1h ol- 12ý1ý -: n whic'. ... s aat
. SC assed in ý: ý-r they have different chirp rates as d4
When the disbond occurs in -he bonded jo. 'at containing a 15 mm or 30 = or 60
mm CFBG Se-r-30T, the reflected spectra shows the shift in the low wavelength end ol the
reflected .3 lower waveiengths as re. -Icitted for the 45 mm sensor, discussed
V earlier. This t] he wavelength, is an ,j of disbond initiation. Figure 06.8 and
Figure 6.9 shows the comparison of reflected spectra from i5 mm CIFBG before and Otter
disbonding and the reflected spectra from 60 mm CFBG sensor before and after disbonding
res-pechvely.
83

Chapter 6 DISBOND DETECTION FROM THE LOW WAVELENGTH END OF CFBG I F- obtained from images of the bonded joint is shown in Figure 6.7. From the figure, it is
evident that the disbond front could be located to within about ±2 mm.
12-
10-
02468 10 12
Diabond length (photographs), mm
Figure 6.7. Comparison of the disbond length obtained using the CFBG measurements
(after the corrections) with the disbond length measured from photographs of the bonded
joint.
6.3. RESPONSE OF 15,30 AND 60 mm CFBG SENSORS TO DISBONDING
In the previous section, it was shown that the disbond initiation and growth from
one end of the adherend could be detected using a 45 mm CFBG sensor embedded in one
of the adherends. In this section, the same experiments were performed on various CFBG
sensors with lengths of 15,30 and 60 mm and their responses to the disbond in the bo nded
joints were studied. A fatigue load with a peak value of 8 kN, R value 0.1 and frequency of
5 Hz were applied. All of the CFBGs have the same bandwidth of 20 mn which means that
they have different chirp rates as discussed in Chapter 4.
When the disbond occurs in the bonded joint containing a 15 mm or 30 mm or 60
mm CFBG sensor, the reflected spectra shows the shift in the low wavelength end of the
reflected spectrum to lower wavelengths as reported for the 45 mm sensor, discussed
earlier. This shift in the wavelength is an indication of disbond initiation. Figure 6.8 and
Figure 6.9 shows the comparison of reflected spectra from 15 mm CFBG before and after disbonding and the reflected spectra from 60 mm CFBG sensor before and after disbonding
respectively.
1 83
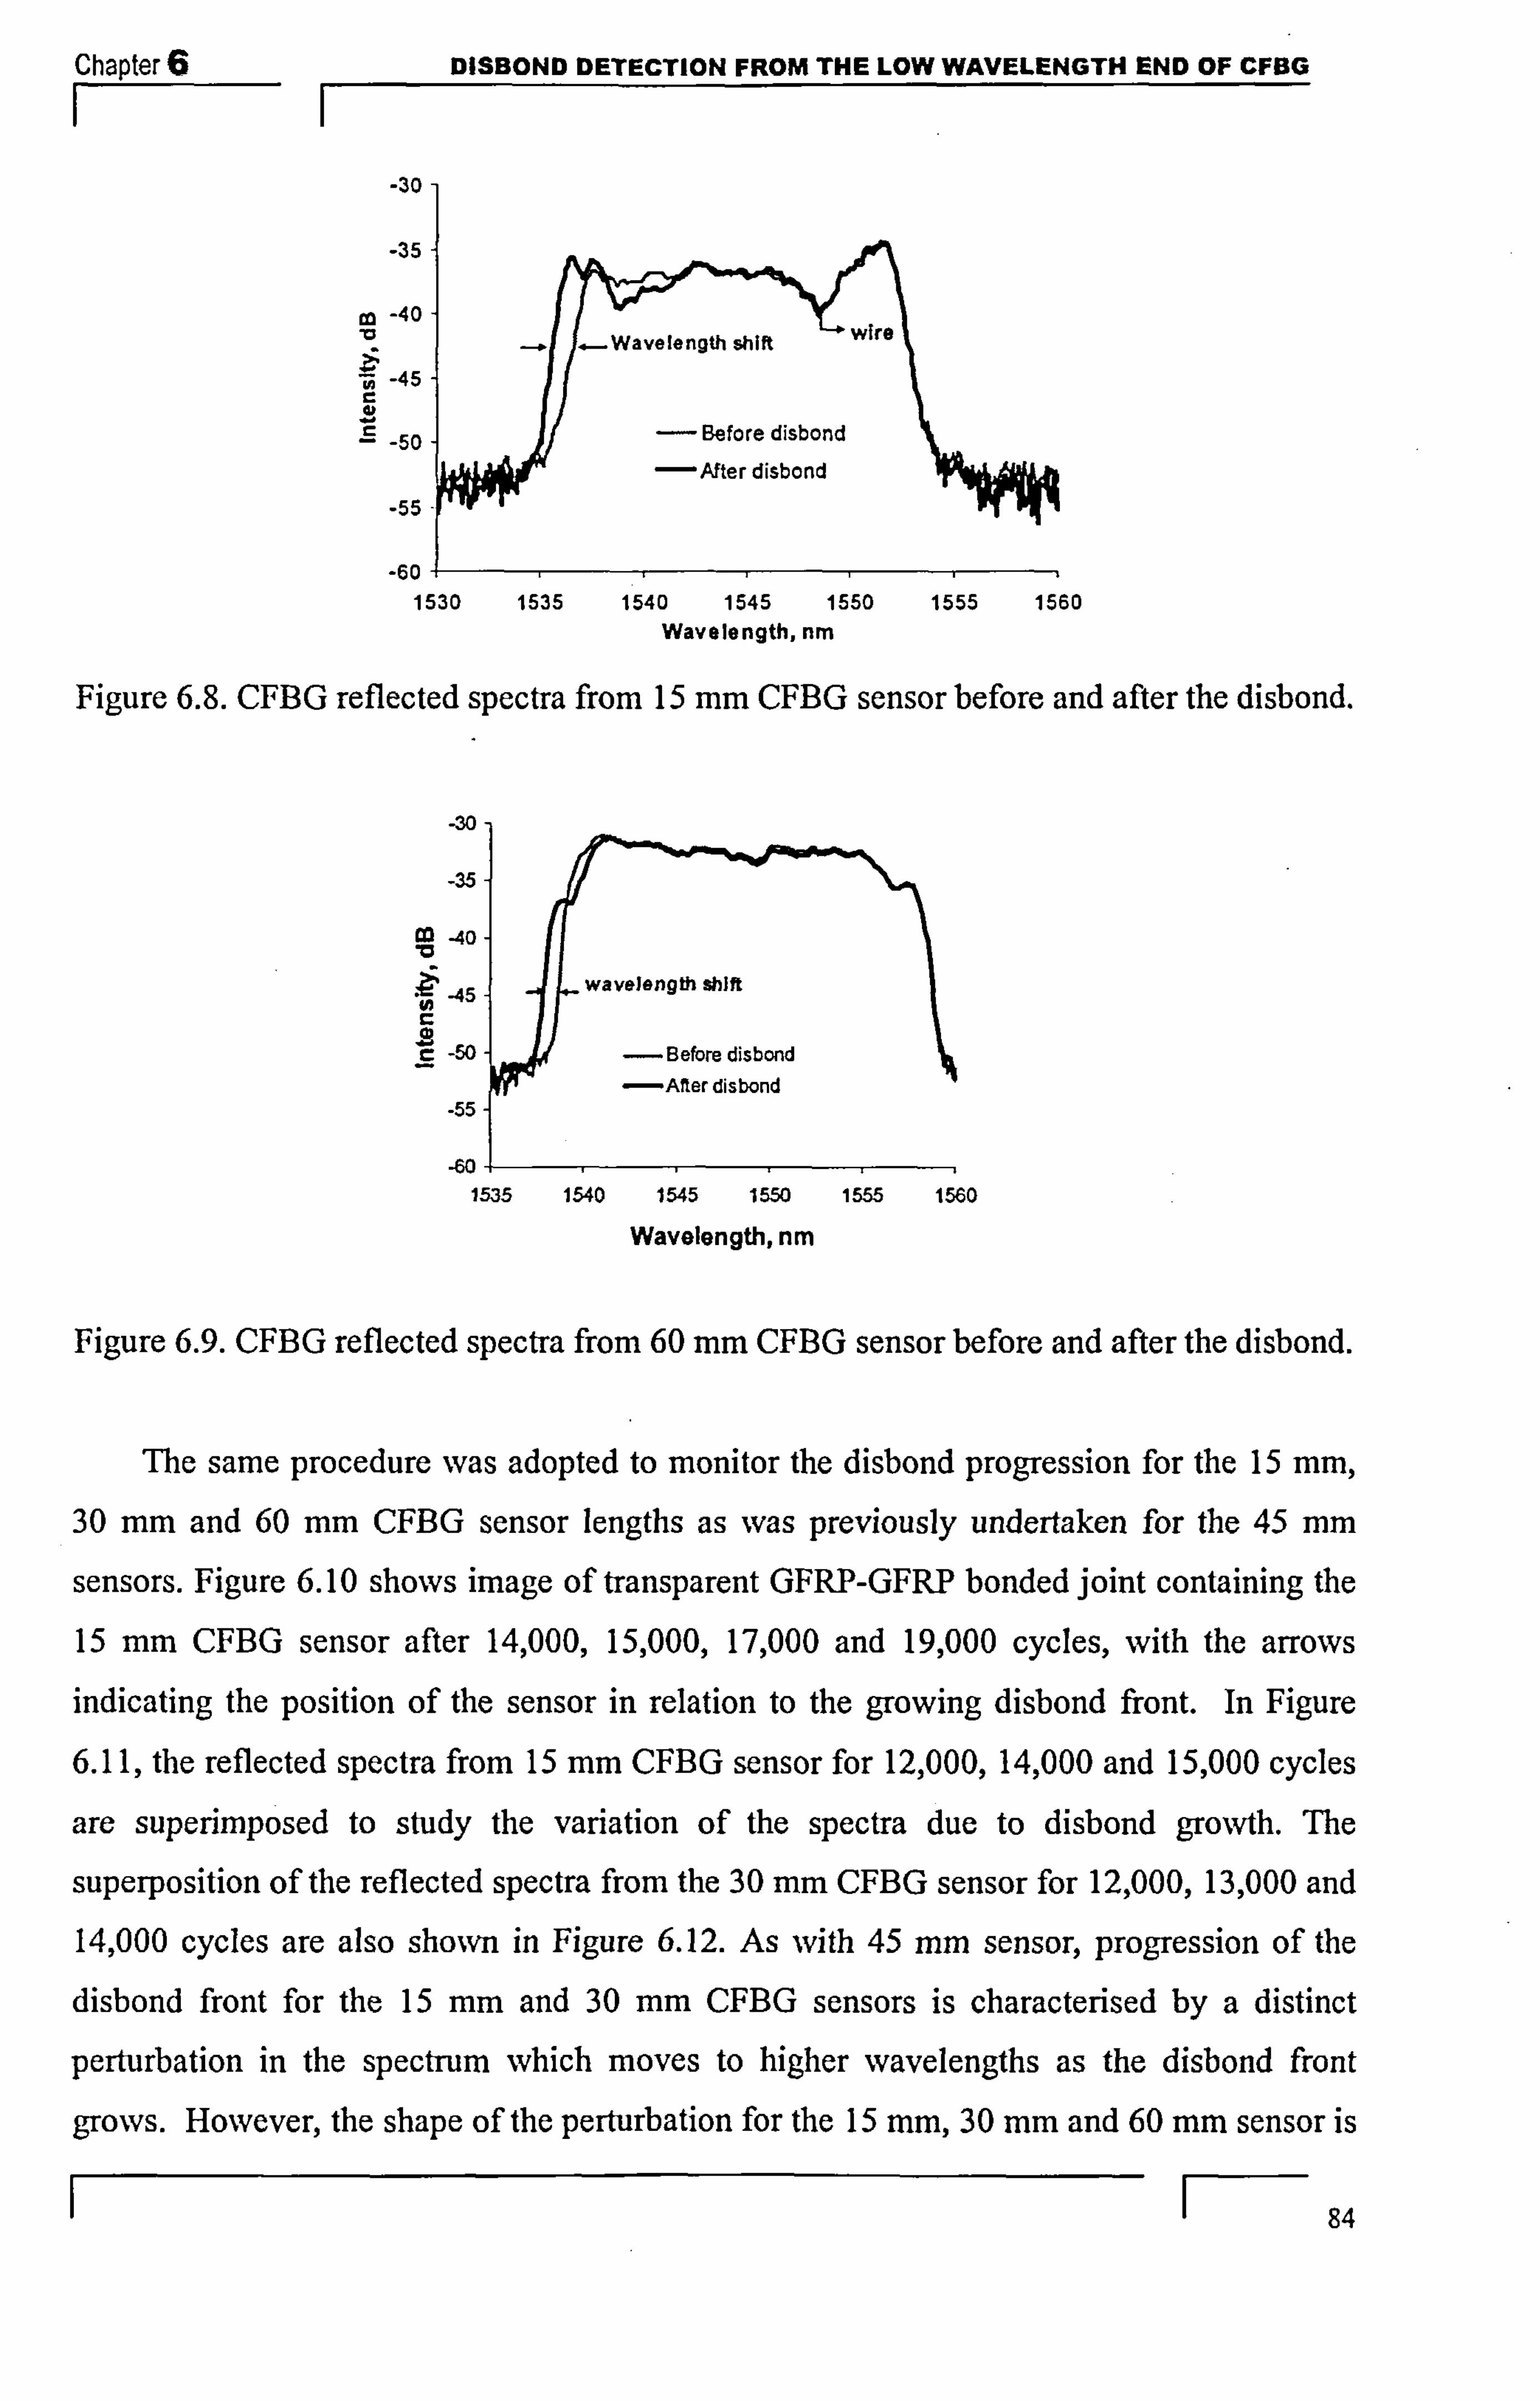
Chapter 6 DISBOND DETECTION FROM THE LOW WAVELENGTH END OF CFBG II
-30
-35
-40 L wire
-Wavelength shift
-45
-50 Before disbond
-After disbond
-55 -
-60 1530 1535 1540 1545 1550 1555 1560
Wavelength, nm
Figure 6.8. CFBG reflected spectra from 15 mm CFBG sensor before and after the disbond.
-30
-35
40-
wavelength shift 45- C -0
- so- Befbre disbond
-After disbond
_55-
. 60 p 1535 1540 1545 1550 1555 1560
Wavolongth, nm
Figure 6.9. CFBG reflected spectra from 60 mm CFBG sensor before and after the disbond.
The same procedure was adopted to monitor the disbond progression for the 15 mm, 30 mm and 60 mm CFBG sensor lengths as was previously undertaken for the 45 mm
sensors. Figure 6.10 shows image of transparent GFRP-GFRP bonded joint containing the
15 mm CFBG sensor after 14,000,15,000,17,000 and 19,000 cycles, with the arrows indicating the position of the sensor in relation to the growing disbond front. In Figure
6.11, the reflected spectra from 15 mm CFBG sensor for 12,000,14,000 and 15,000 cycles
are superimposed to study the variation of the spectra due to disbond growth. The
superposition of the reflected spectra from the 30 mm CFBG sensor for 12,000,13,000 and 14,000 cycles are also shown in Figure 6.12. As with 45 mm sensor, progression of the
disbond front for the 15 mm. and 30 mm. CFBG sensors is characterised by a distinct
perturbation in the spectrum which moves to higher wavelengths as the disbond front
grows. However, the shape of the perturbation for the 15 mm, 30 mm. and 60 mm sensor is
84

FROM THE L- -mGTH END OF CFSG
LLý -lie SýTnlnetric- L. -; ) he UrL for a 45 mm sensor. For the
sensor, Lhe perturbation appears as a sm,. 5-111 and then a gentler fall i-- ýhe Tef=Ltýd
intensit agair, C] for the . y, followed by a small rise. A
--y, ý, he shapes a:
30 mm and 60 mm CF130s, as is eVi-'ePt ": -
Figures 6.12.5.13 respec'vely. These
differences in the shape of in the reflected spectra for different sensor lengfris
are explored in Section 6.4.3, below.
A
Figure 6.10, Image oitranspareni G. FiýP-GFRPbondedjoint with 15 mm CFBG
sensor after 14,000, '1 5,000,17,000 and 19,000 cycles
-30
-35
-40 - 15,00-j C-. -S 14,000 cyc.,, s
-45 12,000 cycles
-50 -
-55
-60 11-- 1530 1535 1540 A5 550 1555 1560
W- Im
Figure 6.11. Reflected spectra from 15 mm. CFBG sensor due to disbonds corresponding to
14,000 and 15,000 cycles 12,000,
11 85

Chapter 6 DISBOND DETECTION FROM THE LOW WAVELENGTH END OF CFBG
F-- I -44
48
w
-52 . Ei
-56 ,I. ---. W- 1530 1535 1540 1545 1550 1555
Wavelength, nm
Figure 6.12. Reflected spectra from 30 mm CFBG sensor due to disbonds corresponding to
12,000,13,000 and 14,000 cycles
-35
-40
45
-50
-55
-60 11
1535 1540 1545 1550 1555 1560 1565
Wavelength, nm
Figure 6.13. Reflected spectra from 60 rum CFBG sensor showing the shape of the
perturbation due to disbond.
The prediction of the reflection spectra for the four different CFBG sensor lengths
(see section 6.4.3) also predicted the shape differences of the perturbations. The shapes of
the predicted spectra were in good agreement with the differences seen in the experimental
results for the different sensor lengths. In all cases, the actual position of the disbond front
is found to be slightly towards the low-wavelength end of the spectrum compared to the
position of the minimum of the perturbation. The actual positions of the disbond front were
corrected with the aid of the predictions and the CFBG sensor results and were plotted
against the measured disbond front from photographs. Figure 6.14 shows the comparison of
the in situ photographic measurement of disbond front position with the CFBG sensor deten-nination of disbond front position for sensor lengths of 15 mm, 30 mm, 45 mm and 60
1 86

Chapter 6 DISBOND DETECTION FROM THE LOW WAVELENGTH END OF CFBG II
mm. Overall, the disbond front position could be measured with an accuracy of about
±2 mm with the CFBG.
12-
E E 10- 1*"
8
A 0 6
A
4A CFBG 15 CFBG 30 CFBG 45 is 2-
13 CFBG 60
0
02468 10 12
Disbond front position (photographs), mm
Figure 6.14. Comparison of disbond front position obtained using CFBG sensors of various lengths (15,30,45,60 mm) with in sitz., photographic measurements of the disbond front.
The dotted line would be the line of perfect agreement between the two measurements.
6.4. MODELLING AND PREDICTION
6.4.1. FE modelling: A 2D finite-element (FE) modelling was undertaken by my colleague Yannick
Rech [private communication] using ABAQUS to predict the approximate longitudinal
strain distribution at the position of the sensor (0.5 mm from the bondline), %vhen a disbond
between the two adherends has grown to any given length. Using this strain profile, the
reflected spectra were predicted in order to understand the effect of disbond to CFBG
sensor. The optical fibre was not included explicitly in the model, but the strains have been
extracted from the FE model at the position of the sensor. The properties used in the
modelling are summarised in Table 4.4 (Chapter 4) and Table 5.1 (Chapter 5) for the
isotropic (adhesive) and orthotropic (composite) materials respectively. The mesh size used
'was 0.1 min x 0.1 mm. Figure 6.14 shows the FE strain distribution of the adhesively bonded joint at one end of the adherend (around the low strain region of the optical fibre)
loaded to 5 kN. The white bands are the 90' ply regions and the position of the optical fibre
is at the interface of the first 00 and 900 ply (near to the bondline). Hence, moving from the
lower 0190 interface in the upper adherend (shown arrowed in Figure 6.15), there is 0.5 mm
of the 00 ply (upper adherend), then the more compliant adhesive, then the 00 ply of the 1
87

Chapter G DISBOND DETECTION FROM THE LOW WAVELENGTH END OF CFBG
second adherend, before reaching the first 0/90 interface in the second adherend. It can be
seen from the colour plot and the colour key that the longitudinal direct strains (EI 1), at the
optical fibre position near the free end of the adherend, are low. As the load transfers from
the lower (loaded) adherend through the adhesive to the upper adherend, the strains in the
upper adherend begins to increase with increasing distance from the end of the adherend.
LW
Figure 6.15. Strain distribution in the region of the end of one adherend for a joint without a disbond. The white bands are the positions of the 90() plies
The strains along the centreline at the position of the optical fibre were extracted from the FE results and are plotted as shown in Figure 6.16. In Figure 6.16, the axial strain
along the 60 mrn joint with no disbond and when loaded to 5 kN, is shown. The strain is
shown as a function of distance from the end of the adherend which contains the embedded CFBG sensor. At the free end of the adherend the longitudinal strains are low. There is a
compressive strain at the start which may be due to the bending effect in the single lap
joint. As the load transfers from the lower (loaded) adherend through the adhesive to the
upper adherend, the strains in the upper adherend containing the sensor begin to increase
with increasing distance from the end of the adherend and reach a plateau region afler about 5 mm. The plateau region is, of course, the result of no load transfer at the centre of the long joint. The strains then increase again as the other end of the overlap is approached
and the load transfer process begins again with loads transferred from the lower adherend.
F- 88

Chapter 6 DISBOND DETECTION FROM THE LOW WAVELENGTH END OF CFBG II
CFBG COUL-n-IlL,
60 nun
3-OOE-03
2.50E-03
2. OOE-03
1.50E-03
I. ODE-03
5. OOE-04
O. OOE+00
-5. OOE-04 a
Figure 6.16. Strain experienced by thebonded joint of 60 mm overlap length, under no disbond and loaded (5 kN) condition.
The modelling was then extended to the 60 mm bonded joints including disbond
lengths of 5 mm and 10 mm. The 2D FE models were run with the disbond positioned on
the lower adhesive-adherend interface, which is consistent with the observed experimental disbond path. Figure 6.17 shows a schematic of the adherends (one of the adherends has the
embedded with the CFBG sensor) with a disbond used in the modelling and the
corresponding FE results for the strain distribution for the case of a 10 mm disbond. The
path of the optical fibre runs just below the marked 0/90 interface. The maximum strain
shown in the figure has been limited and the region coloured grey indicates strains above this set value. It can be seen that the right hand "free" part of the upper adherend
experiences low values of strain. This lower strain extends for the length of disbond region
except around the disbond ftont. Around the disbond ftont, there is a small rise and fall in
the strain (perturbation), before rising to a plateau value. Meshes with element sizes
significantly smaller than the distance of these perturbations from the overlap end (0.1 min
and 0.05 mm) showed that these perturbations were a characteristic feature of the strain field within the adherend. The perturbation in the disbonded cases was made more
complicated by the interaction of the disbond front strain field and the load transfer strain field.
1 89
Distance along the join% mm

Chapter G DISBOND DETECTION FROM THE LOW WAVELENGTH END OF CFBG
a) CFBG '==Disbond
b)
nd
Figure 6.17. Magnified view of the strain distribution towards the end of one adherend derived from the finite-element analysis
Figure 6.18 shows the strain distribution, extracted at the position of the optical fibre from the FE model, within the first 20 mm of the 60 mm overlap region for three
cases: no disbond, a disbond 5 mm in length and a disbond 10 mm in length. For the "no
disbond" case, the data show the trend described above, i. e. starting from a low stress near
the end of the adherend, increasing to a plateau region after about 5 mm and remaining
constant over the one-third of the other overlap end. For the two other cases, the 5 mm disbond and the 10 mm disbond, the trend was similar except for an increase in the
unstrained length of the adherend due to the disbond and a small perturbation in the strain distribution at the beginning for each case. The small perturbations for the 5 mm and 10 mm disbonds seen in the figure are not an artefact of the mesh size but are probably due
to the complexity of the strain from bending, and the interaction of the disbond strain field
with the load transfer field.
1 90
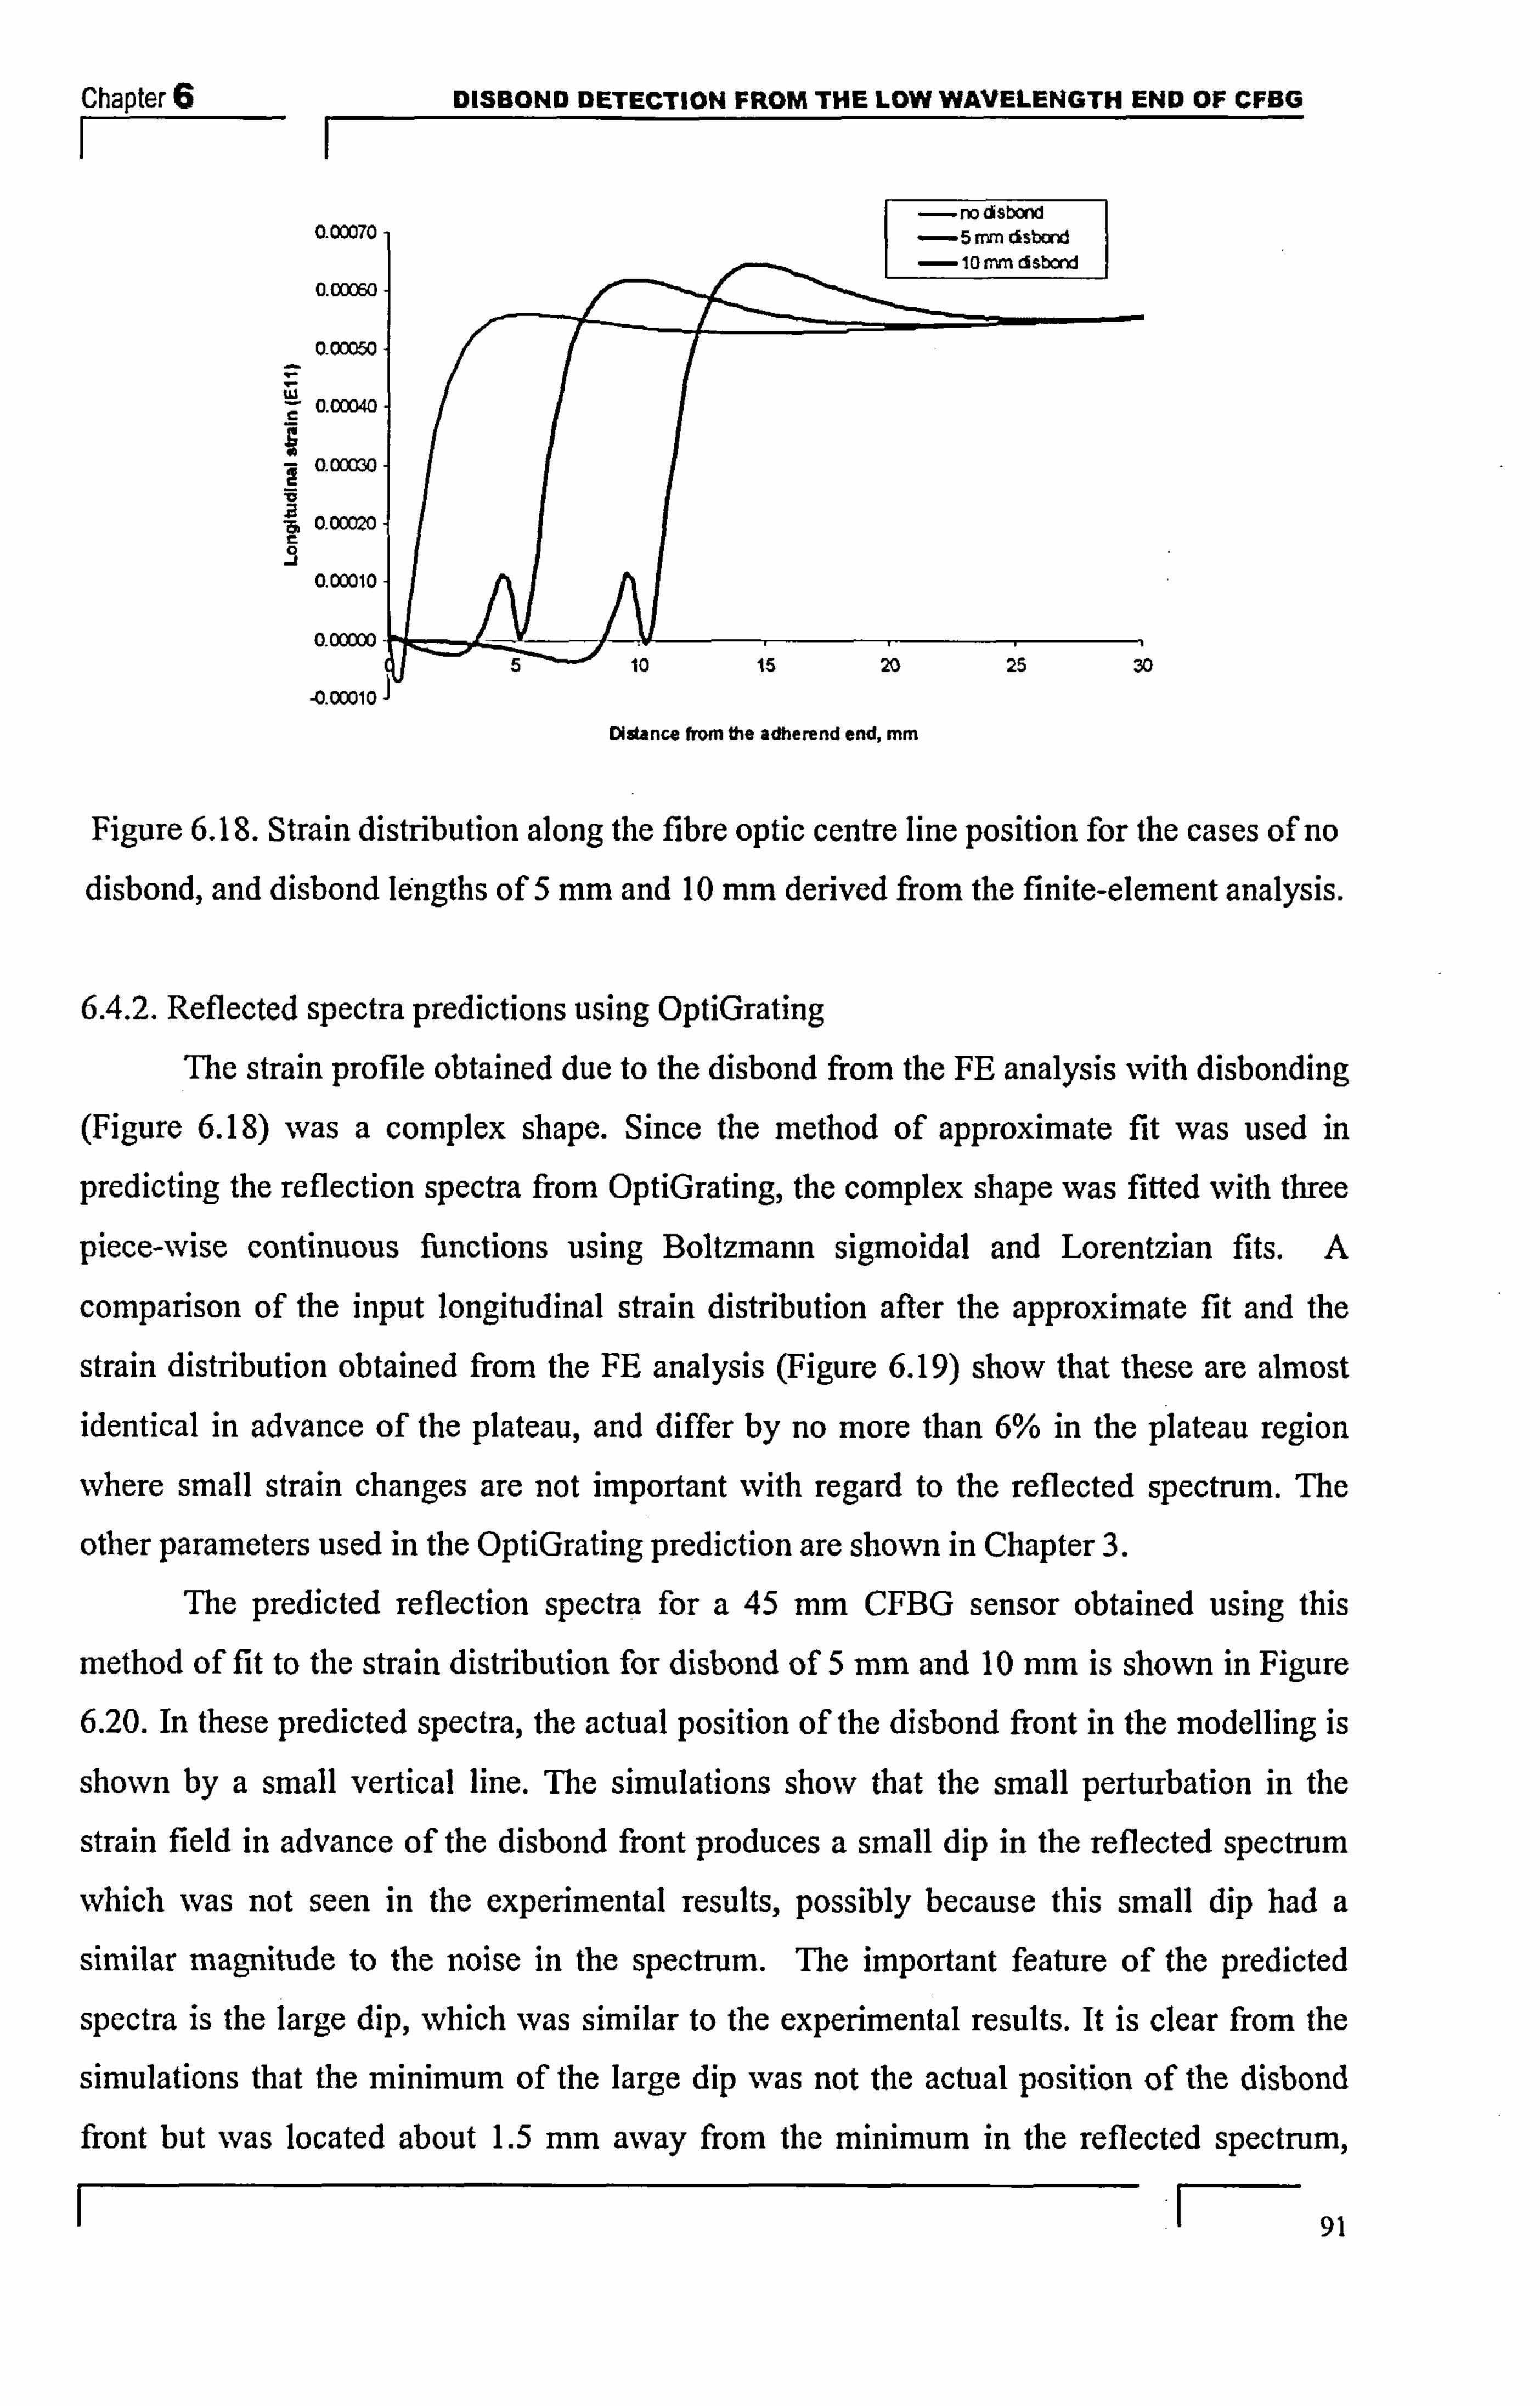
Chapter 6 DISSOND DETECTION FROM THE LOW WAVELENGTH END OF CFBG
F- I O-OD070
I- no cisbond ]
0.00060
0-00050
0.00040
- 00030
5 0.00020
0 0.00010
0.00000
-0.00010
Figure 6.18. Strain distribution along the fibre optic centre, line position for the cases of no disbond, and disbond lengths of 5 mm and 10 mm derived from the finite-element analysis.
6.4.2. Reflected spectra predictions using OptiGrating
The strain profile obtained due to the disbond from the FE analysis with disbonding
(Figure 6.18) was a complex shape. Since the method of approximate fit was used in
predicting the reflection spectra from OptiGrating, the complex shape was fitted with three
piece-wise continuous functions using Boltzmann sigmoidal and Lorentzian fits. A
comparison of the input longitudinal strain distribution after the approximate fit and the
strain distribution obtained from the FE analysis (Figure 6.19) show that these are almost identical in advance of the plateau, and differ by no more than 6% in the p lateau region
where small strain changes are not important with regard to the reflected spectrum. The
other parameters used in the OptiGrating prediction are shown in Chapter 3.
The predicted reflection spectra for a 45 mm CFBG sensor obtained using this
method of fit to the strain distribution for disbond of 5 mm. and 10 mm is shown in Figure
6.20. In these predicted spectra, the actual position of the disbond front in the modelling is
shown by a small vertical line. The simulations show that the small perturbation in the
strain field in advance of the disbond front produces a small dip in the reflected spectrum
which was not seen in the experimental results, possibly because this small dip had a
similar magnitude to the noise in the spectrum. The important feature of the predicted
spectra is the large dip, which was similar to the experimental results. It is clear from the
simulations that the minimum of the large dip was not the actual position of the disbond
front but was located about 1.5 mm away from the minimum in the reflected spectrum, F-
91
Distance from the adherend end, mm
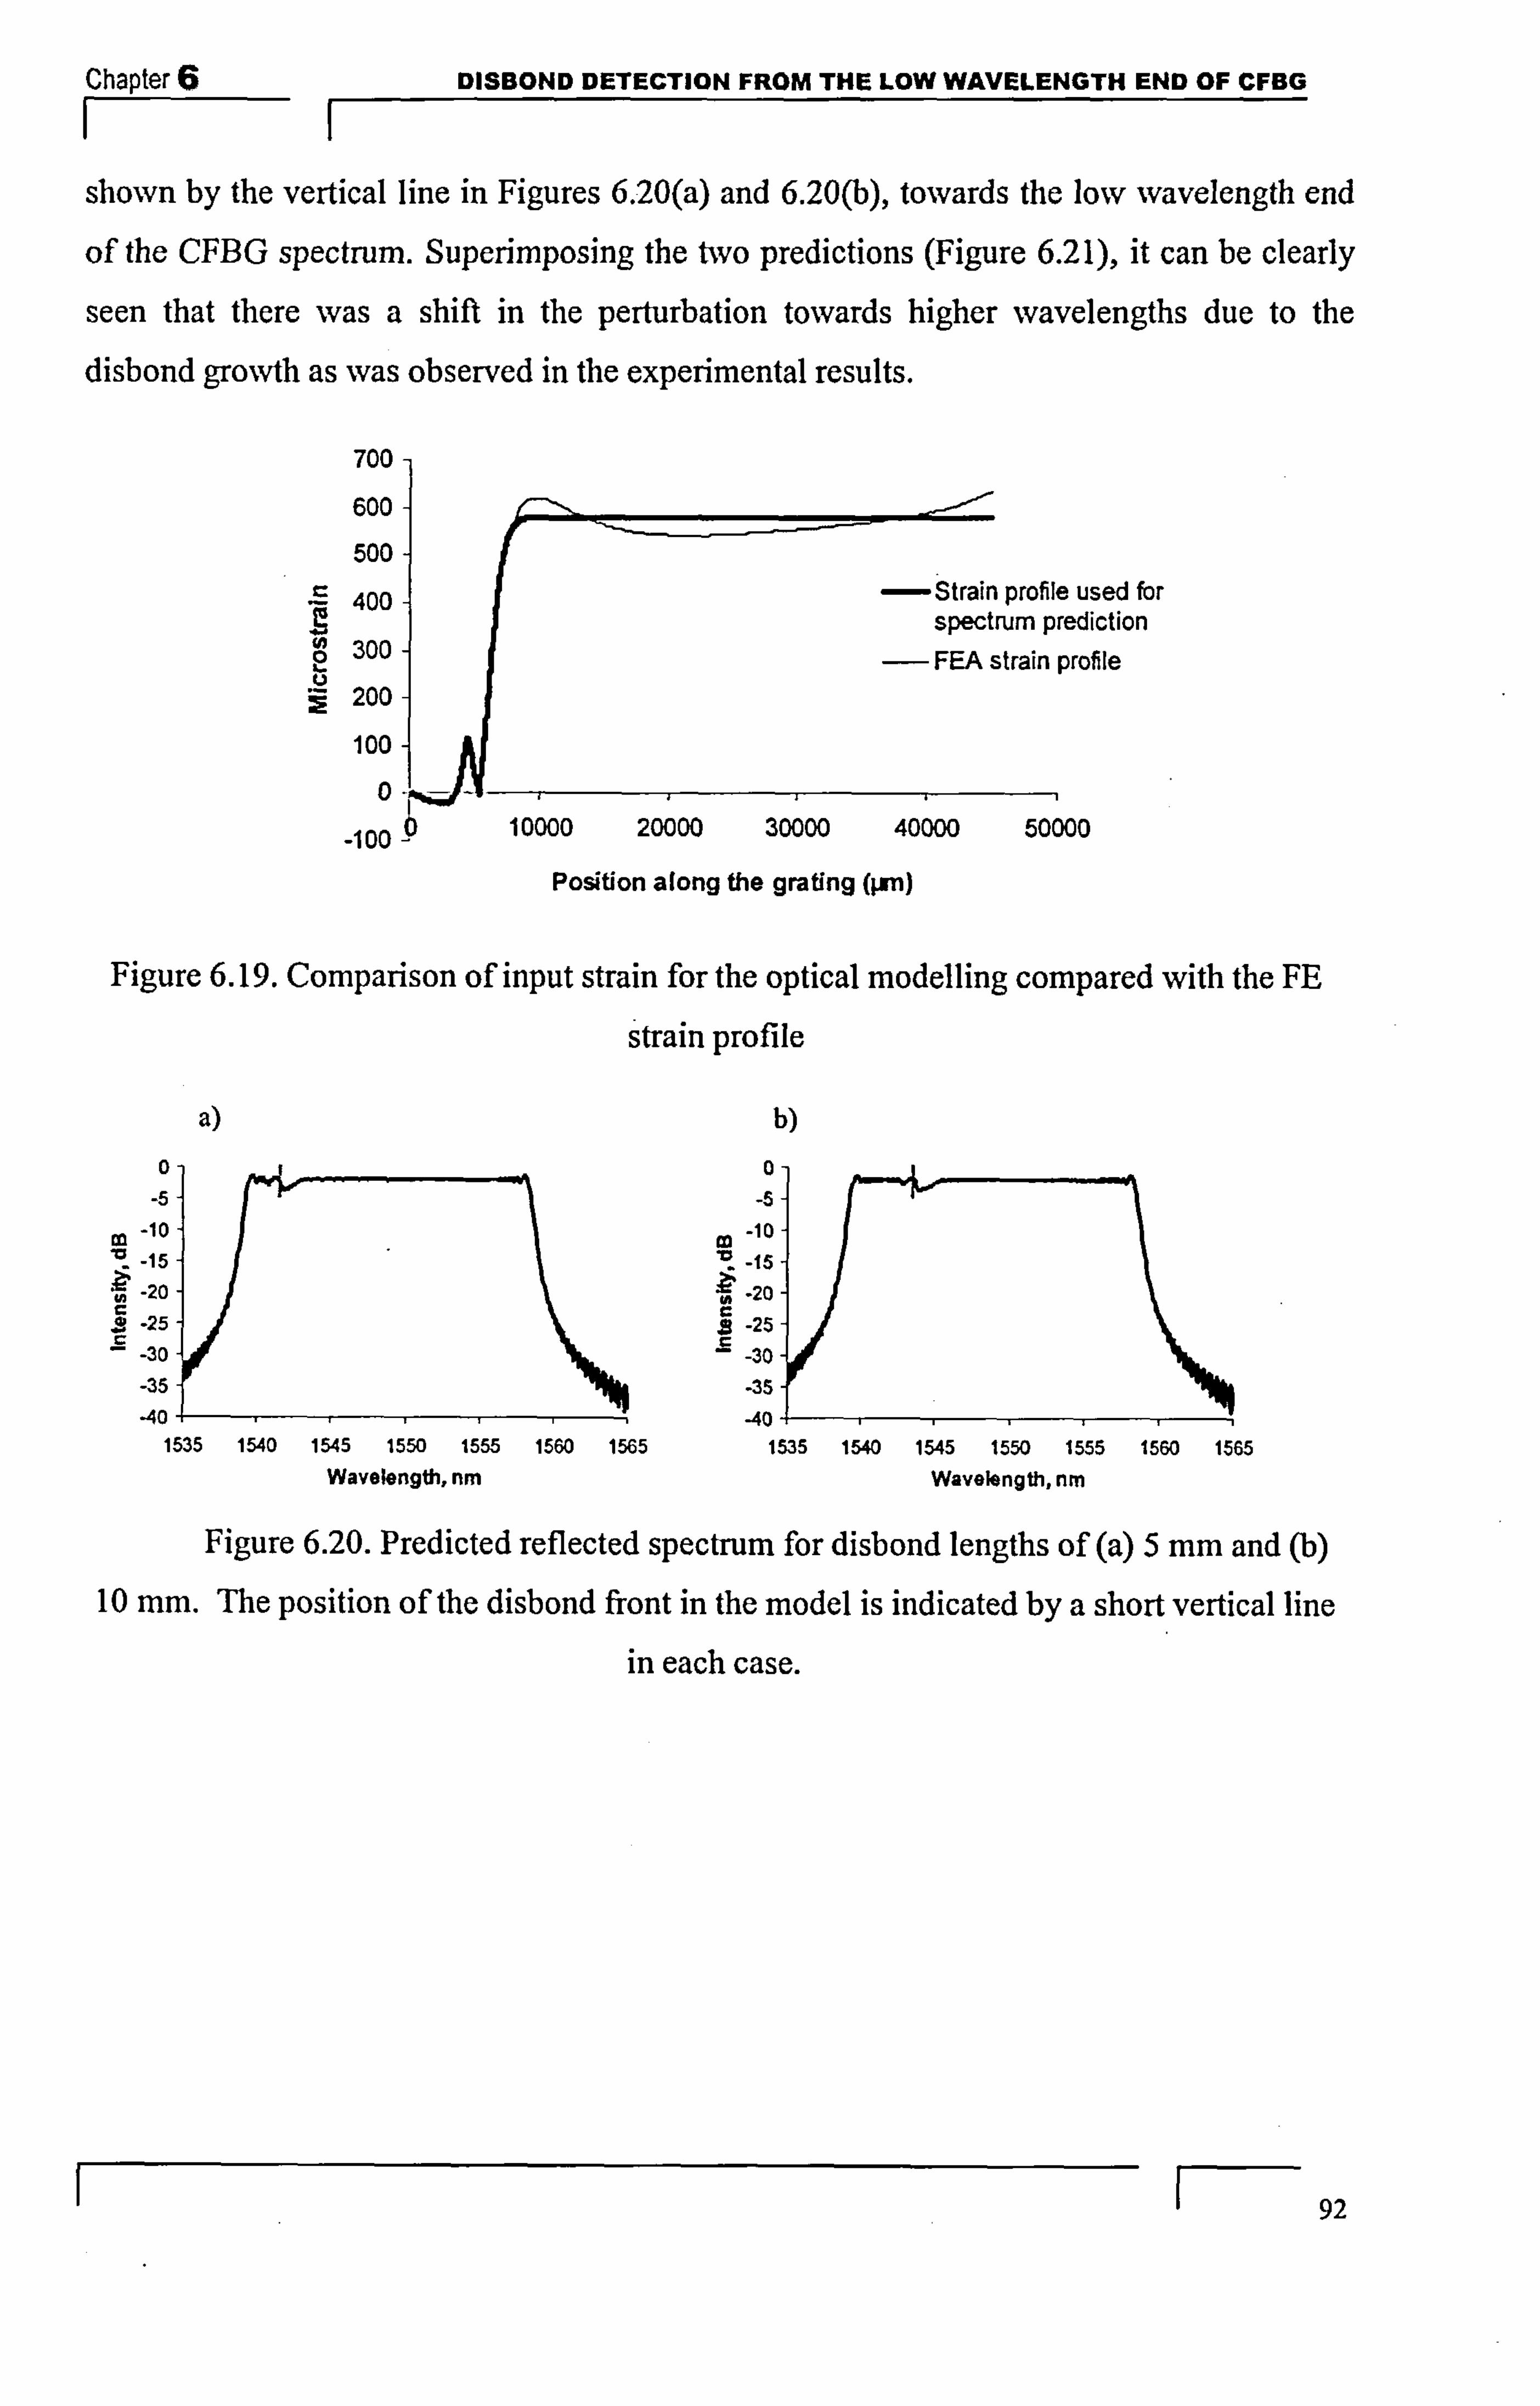
Chapter 6 DISSOND DETECTION FROM THE LOW WAVELENGTH END OF CFBG II
shown by the vertical line in Figures 6.20(a) and 6.20(b), towards the low 'wavelength end
of the CFBG spectrum. Superimposing the two predictions (Figure 6.21), it can be clearly
seen that there was a shift in the perturbation towards higher wavelengths due to the
disbond growth as was observed in the experimental results.
700-
600-
500-
400 - -Strain profile used for spectrum prediction
300 - FEA strain profile 200-
100-
0-
-100 10000 20000 30000 40000 50000
Position along the grating (pm)
Figure 6.19. Comparison of input strain for the optical modelling compared with the FE
strain profile
a) 0-
-5-
m -10-
-20 - c -25-
-30
-35
-40 1535 1540 1545 1550 1555 1560 M5
Wavelength, nm
0- -5-
-lo-
-20- C a -25- .E -30
-35 40
1535 1w 1545 1550 1555 1560 1565 Wavelength, nm
Figure 6.20. Predicted reflected spectrum for disbond lengths of (a) 5 mm and (b)
10 mm. The position of the disbond front in the model is indicated by a short vertical line
in each case.
r- 92

Chapter 6 DISSOND DETECTION FROM THE LOW WAVELENGTH END OF CFEG II
0-
-2 -4
Co
:; % -8 -
-lo - r o-12-
.E -14 -
5 mm disbond 0 - 10 mm disbond
ond 2bond
-16
1535
Wavelength, nm
Figure 6.2 1. Superposition of the predicted reflected spectra for disbond lengths of 5
mm and 10 mm; showing the shift of the perturbation to higher wavelength.
6.4.3. Shape of the perturbation for different CFBG chirp rates and sensor lengths.
6.4.3.1. Different chirp rates: The reflection spectra was predicted for the experimentally investigated CFBG
lengths of 15,30 and 60 mm using the strain profile predicted from the FE analysis for
disbonding. The sensors had different lengths but the same optical bandwidth was achieved by different chirp rates in the sensors. Figure 6.22 shows the reflected spectra predicted for
15,30,45 and 60 mm CFBG lengths when the joint has a5 mm disbond. It can be seen from the predicted spectra that the shape of the perturbation differs for each CFBG sensor lengths and comparison with figures 6.11,6.12 and 6.13 shows that there is good agreement between the shape of the predicated spectra and experimental reflection spectra. For each of
the CFBG lengths, the position of the disbond front in the modelling is shown by the short
vertical line in Figure 6.22 and in all cases, the position of the disbond front is away from
the minimum of the dip and towards the low wavelength end. However each spectrum
shows a different distance between the minimum of the dip and the actual position of the
disbond front, varying from about 0.5 mm for the 15 mm sensor, to about 1.5 mm for the 60
mm sensor.
1 93
1540 1545 1550 1555 1560

Chapter 6 DISBOND DETECTION FROM THE LOW WAVELENGTH END OF CFBG II
a) b) 0
-5 "0 ir 0 -10
C
-15
-
-5
-10 0, C
-15
AR -m
0
m
-10
-15
0
.5
ýw -10
-15
d) gn mm
Figure 6.22. Predicted reflection spectra for a5 mm disbond, for CFBG sensor lengths of (a)
15 mm, (b) 30 rum, (c) 45 mm, and (d) 60 mm (the spectral bandwidth is constant). The
position of the disbond front for each case is indicated by the short vertical line on the
spectrum.
6.4.3.2. Same chirp rate The strain profile obtained from the FE analysis at the position of the optical fibre
for a disbond of 5 mm was used within OptiGrating to determine the effect of keeping the
chirp rate, for the four different CFBG sensor lengths ( 15,30,45 and 60 min). Figure 6.23
shows predicted spectra for the 15,30,45 and 60 min CFBG sensors assuming the same
chirp rate of 3 nni/cm (as the chirp rate was maintained constant for each of the four
different lengths the optical bandwidth varied). In the figure the position of the disbond is
also indicated by the small vertical line. It can readily be seen ftorn Figure 6.23 that the
shape of the perturbation is identical for all four CFBG sensor lengths, demonstrating that it
is the chirp rate that determines and characterises the shape of the perturbation. Additionally, with a fixed chirp rate the location of the disbond front is constant.
I F- 94
-20 11. I 1535 1540 1545 1550 1555 1560 1565
Wavelength, nm
-20 111., 1535 1540 1545 1550 1555 1560 1565
Wavelength, nm
-20 1iI. 1535 1540 1545 1550 1555 1560 1565
Wavelength, nm
-20 111.. 1535 1540 1545 1550 1555 1560 1565
Wavelength, nm

Chapter 6 DISBOND DETECTJON FROM THE LOW W"ELENGTH END OF CFBG I-- I
a) 15 mm
-5 1 -10 -15 20
-25
. 30
-35
-40 - 1530 1535 1540 1545 1550 1555 1560 1565
Wavelength, nm
b) 30 mm 1-rýefizmm -iý ýlj
0. c) 45 mm 1- 5 rrzn disb
-5
- 10 co
-15 20
2 -25
-30
-35
. 40 1530 1535 1540 1545 1550 1555 1560 1565
Wavelength, nm
ndl
0 -5
'10 03 . 15
-20
-25
-30
-35
40 - WOO
- 1530 1535 1540 1545 1550 1555 1560 1565
Wavelength, nm
() d) 60 mm 1- 5 rnm disb
-S 10
-15
-20
-2S
-30
-35 40
1530 IS35 IS40 1S45 Isso 1555 1560 1565
Wavelength, nm
LnA
Figure 6.23. Predicted reflection spectra for a5 mm disbond for CFBG sensor lengths of (a) 15 mm, (b) 30 mm, (e) 45 mm, and (d) 60 mm (the chirp rate is constant; hence spectral bandwidth changes). The position of the disbond front is indicated by a short vertical line
on each spectrum.
6.5. DISCUSSION
The experimental observation of the CFBG reflection spectra due to a disbond in
composite-composite bonded joints showed four main results. These are; 1) The shift of the low wavelength end of the CFBG reflection spectrum to lower
wavelengths on disbond initiation.
2) A perturbation in the spectra associated with the disbond.
3) The movement of the perturbation to higher wavelengths as the disbond grows. 4) A different shape for the perturbation for different lengths of CFBG.
The reason for the shift to lower wavelengths is as follows. The consequence of the
onset of a disbond is that it unloads the free end of the adherend. Hence, the CFBG sensor is also unloaded locally to the disbond, which causes a relaxation of the grating spacing. Consequently, the grating spacing is decreased adjacent to the disbonded region, so that
reflections at lower wavelengths are seen. No changes occurred to the spectrum at higher
95

Chapter 6 DISSOND DETECTION FROM THE LOW W"ELENGTH END OF CFBG
wavelengths, and this is verified by the constant position of the dip in the spectrum due to
the position of the wire spacer. The perturbation in the spectra can be explained as follows. Figure 6.24 shows the
changes in grating period as a consequence of the strain distribution shown in Figure 6.18
for the 5 mm disbond. The density of the grating period at any position in the sensor is
related to the slope of the grating period/distance curve (Figure 6.24). The density is higher
when the slope is lower because the grating period is changing more slowly. The reflected intensity is proportional to the grating density. Hence, in the Figure 6.24, for the "after
disbond" case, the intensity is roughly constant up to about 4.5 mm and between 4.5 mm.
and 5 mm the intensity is enhanced. After 5 mm, the intensity falls because the slope is
lower than it was initially and the intensity increases to its plateau value at about 7.5 mm. Hence the intensity perturbation consists of a small rise followed by a dip and then an increase to the plateau value.
The disbond progression is characterised by the shift of the perturbation to higher
wavelengths. This is because, as the disbond increases in length, the strain distribution is
displaced to new positions corresponding to higher wavelength values in the reflected
spectrum and the perturbation moves to higher wavelength following the disbond
movement.
535
534
533
532
rn
531
530
Figure 6.24. Comparison of grating period change before and after disbond along the
length of grating for a5 mm disbond.
The different experimentally determined shapes of the perturbations for different
CFBG length values is related to the different chirp rate of the CFBG sensors which was 1
96
05 10 15 20
CFBG length, mm

Chapter 6 DISBOND DETECTION FROM THE LOW WAVELENGTH END OF CFBG
F- I confinned by the OptiGrating predictions. Different chirp rates provide different slope
gradient in the grating period/distance curve, thereby varying the density of the grating
period between 5 mm and 7.5 mm. Hence the perturbation in the reflection spectra is of different shape.
6.6. CONCLUSIONS
The main conclusions from this chapter are: 1) Disbonds occurring during service due to cyclic loading in a composite-composite
bonded joint can be detected by embedding a CFBG sensor in one of the composite
adherends close to the bondline (in this case 0.5 mm from the bondline) xvith the
CFBG sensor being embedded such that the low wavelength end is adjacent to the
free end of the adherend. 2) The shift of the low wavelength end of the reflection spectrum of the CFBG sensor
to lower wavelengths is an indication of disbond initiation from the free end of the
adherend. 3) The movement of the perturbation in the CFBG reflection spectra to higher
wavelengths is an indication of disbond growth from the end of the bonded joint.
4) A combination of finite-element modelling and commercial FBG software enables
the actual position of the disbond front to be related to the perturbation in the
reflected spectrum. The position of the disbond front does not coincide with the
minimum of the perturbation, but is located about 2 mm towards the low
wavelength end of the spectrum. 5) The chirp rate of the CFBG sensor plays an important role in the shape of the
perturbation. CFBG sensors of different chirp rate show different shapes for the
perturbation. CFBG sensors of different lengths but same chirp rate show the same
perturbation shape for the same strain distribution.
6) In all cases, despite the different chirp rates, the position of the disbond front is
located within about 2 mm, and this precision is likely to dependent on adherend
material and sensor location.
6.7. SUMMARY
In this chapter, disbond development from only one end of the bonded joint (from
the lower wavelength end of CFBG) has been considered. However, it is perfectly feasible
1 97

Chapter 6 DISSOND DETECTION FROM THE LOW WAVELENGTH END OF CFBG II
that the disbond could occur from either end, or indeed both ends, of the bonded joint. As a
result the next Chapter will consider the response of a CFBG sensor to a disbond from the
other end of the bonded joint (i. e. from the higher wavelength end) and additionally when a disbond occurs at both ends of the joint.
1 98
Chapter 7 DISBOND DETECTION FROM THE HIGH WAVELENGTH END OF CFBG
CHAPTER 7
DISBOND DETECTION IN ADHESIVELY
BONDED COMPOSITE JOINT FROM THE
HIGH WAVELENGTH END OF THE CFBG
7.1. INTRODUCTION
The disbond initiation and progression from one end of the bonded joint, i. e. from
the lower wavelength end of the CFBG, could be detected, ftorn the reflected spectra of the
CFBG (details in Chapter 6). As it is perfectly feasible that the disbond can occur from
either end of the bonded joint or indeed both ends of the joint, the work is extended to show
that disbond monitoring at either end or both ends of the overlap is possible with a single
embedded sensor. In the present chapter, the responses of the higher wavelength end of the
CFBG due to the disbond in its end and additionally at both ends are studied and the results
and the discussion are presented.
7.2. RESPONSE OF THE 60 mm CFBG SENSOR TO DISBOND
The GFRP-GFRP composite single lap bonded joints were manufactured with a 60
mm overlap as discussed in section 4.2.2. To detect the disbond from the other end using
the single CFBG sensor, the CFBG sensor length should extend the full length of the
overlap. Hence the 60 mm CFBG length sensor was used for the 60 mm overlap bonded
joint with the low wavelength end of CFBG terminating at the cut end of the adherend. Figure 7.1 shows the GFRP-GFRP composite bonded joint with a 60 mm CFBG sensor and
the position of the sensor with respect to its grating period. The CFBG reflected spectrum
was recorded before the disbond to form a reference spectrum. The bonded joints were then
subjected to fatigue loading and the reflection spectra were recorded after every 100 fatigue
cycles. The experimental procedures were similar to those employed for the disbond
detection from the low wavelength end of the CFBG. The fatigue parameters were the same
as those described in Chapter 4. The reflection spectra were all recorded at a load of 5 kN
1 99

Chapter 7 DISBOND DETECTION FROM THE HIGH WAVELENGTH END OF CFBG
F-- I and subsequently the images of the transparent GFRP were recorded using the in-situ
digital camera.
1111111111) II II II
Figure 7.1. Schematic of a lap joint with a 60 mra length chirped FBG embedded in
one adherend, with the low-wavelength end of the sensor adjacent to the adherend end.
After a few thousands cycles, disbonds could initiate at either end. The results of the
disbond initiation from the high wavelength end are presented first in this chapter. Figure
7.2 shows (a) the transparent GFRP after 21,000 cycles with the disbond initiated and
passing the sensor at the high wavelength end and (b) reflected spectra for a CFBG sensor
which extends the full length of a 60 mm bonded joint, both before and after disbond
initiation respectively. From the comparison of the reflected spectrum before fatigue
cycling (hence before any damage development) and after 21,000 fatigue cycles (by which
point a disbond had initiated adjacent to the high-wavelength end of the sensor) it could be
noted that there is a shift in the high wavelength end of the CFBG reflected spectrum to
higher wavelengths. This is a consequence of disbond initiation.
Disbond initiation from high wavelength end
-35
-40
-45 -
in -50-
-55 1
-60 4- 1530
Before cfisbond After cris bond
wavelength shift
1535 1540 1545 1550 1555 1560 Wavelength, nm
Figure 7.2. (a) Transparent GFRP-GFRP composite joint with the disbond at the high
wavelength end of CFBG (b) CFBG reflection spectra before and after the disbond
I
100

Ch,, pter 7 DISBOND DETECTION FROM THE HIGH WAVELENGTH END OF CFBG r- I
-35
-40 -
-45 -
wavelength -50 - 15,000 cycles shift
- 21,000 cycles
-55 ..... 23,000 cycles
- 25,000 cycles
-60 1530 1535 1540 1545 1550 1555 1560
Wavelength, nm
Figure 7.4. CFBG reflected spectra showing the shift in the high wavelength to higher
wavelength as the disbond extend across the width of the specimen
Disbond
-35
40
'o 45- 51,000 cycles
r_ 'S -50 44,000 cycles E
34,000 cycles
-55 25,000 cycles
-60 111 1530 1535 1540 1545 1550 1555 1560
Wavelength, nm
Figure 7.5. Recorded CFBG reflection spectra when a disbond grows adjacent to the high
wavelength end of the sensor after (a) 25000 cycles (b) 34000 cycles (c) 44000 cycles and (d) 5 1000 cycles. The dip in the spectrum caused by the disbond front is indicated by the
arrow; the dip moves to lower wavelengths as the disbond grows with continued fatigue
cycling.
In order to understand the effect of the disbond on the CFBG reflection spectrum,
modelling work was undertaken and is discussed in the next section (section 7.3). This
I- F--102

Chapter 7 DISBOND DETECTION FROM THE HIGH WAVELENGTH END OF CFBG
modelling was done using the FEA package ABAQUS (to predict the strain distribution in
a composite bonded joint due to disbond at the sensor position under loaded conditions) and the CFBG reflected spectra were predicted using OptiGrating. The modelling also
established the relationship between the dip in the spectrum and the actual position of the disbond front. It was observed in the prediction that the position of the disbond was not the
minimum of the dip in the reflection spectrum, but to the left of the dip and about 1.5 mm
away from the dip. This correction has been used to locate the position of the disbond front
from the CFBG spectra as the disbond front extends during fatigue cycling. The disbond
front position was taken from the in-situ image of the bonded joint at the location of the
optical fibre. Figure 7.6 shows the comparison of the position of the disbond front obtained from the CFBG reflection spectra with measurements of the disbond front position obtained directly from photographs, for two specimens. There is a good correlation between these
measurements, which suggests that the disbond front position at the high-wavelength end
can be measured to within about ±2 mm.
30 - E
25-
co LL
20-
0
15 - 0
10- 5 spedmen I M
a
0-
A specirmn 2 0 5-
5 10 15 20 25 30
Disbond front position (photographs), mm
Figure 7.6. Comparison of the disbond front position measured using a sensor of 60 mm
with the disbond front position measured directly from photographs. Here, the disbond is
growing adjacent to the high-wavelength end of the sensor. The dotted line would be the line of perfect agreement between these measurements.
In addition to the response of the CFBG sensors to the disbond from the high
wavelength end of the bonded joints, the simultaneous initiation of disbond at both ends of the bonded joint is shown in Figure 7.7. Figure 7.7 (a) shows the in-situ image of the GFRP
F-103

Chapter 7 DISBOND DETECTION FROM THE HIGH WAVELENGTH END OF CFBG II
bonded joint with a disbond propagating from both ends of the bonded joint and Figure
7.7(b) shows the CFBG reflected spectrum. As shown in chapter 6, when the disbond
initiates adjacent to the low wavelength end of the sensor, the low wavelength end of the
reflected spectrum shifts to lower wavelengths and a dip is also observed relating to the
disbond front. When the disbond initiates adjacent to the higher wavelength end of the
sensor, the high wavelength end of the reflected spectrum shifts to higher wavelengths.
Hence the initiation of debonding at both ends of the overlap can be detected.
a) b) -30
m -35
Before disbond
-S -40 After disbond from both ends
-45 1535 1540 1545 1550 1555 1560 1565
Wavelength, nm
Figure 7.7(a) insitu. image of the GFRP bonded joint with the disbond propagated from both
ends of the bonded joint (b) comparison of CFBG reflected spectra before disbond. and after
the disbond occurred at both ends of the bonded joint.
7.3. MODELLING AND PREDICTIONS
In Chapter 6, the reflected spectra predicted from OptiGrating with the aid of a 2-D
ABAQUS FE model for the disbond at one end of the bonded joint (i. e. the lower
wavelength end) were discussed. The FE modelling predicted the axial strain experienced
by the optical fibre with the bonded joint under a tensile load of RN as a consequence of
the disbond from the free end. Similar predictions of the reflected spectra for a disbond
growing adjacent to higher wavelength end were undertaken, as follows. The FE modelling
using ABAQUS with the disbond at the high wavelength end was carried by Capell [private
communication], and the longitudinal strain at the position of the optical fibre sensor has
been evaluated using an extension of the 2D analysis used previously [details in section
6.3]. Here the disbond was placed at the adherend-adhesive interface with the continuing
adherend containing the CFBG sensor (note the high wavelength end of the sensor is now
104

Chapter 7 DISBOND DETECTION FROM THE HIGH WAVELENGTH END OF CFBG I F- adjacent to the disbond). Figure 7.8 shows the FE model for a disbond of length 10 mm; the
location of the optical fibre is indicated by an arrow although the optical fibre is not included in the model. The longitudinal strain, (EI 1) occurring at the position of the centre line of the optical fibre, and parallel to the length of the optical fibre, was extracted from
the FE model and plotted as shown in Figure 7.9. The figure shows the strain distribution at
the position of the optical fibre (a) before disbonding, and (b) for a disbond of length 10
mm adjacent to the high-wavelength end of the sensor (the applied load for the FE analysis
was 5 kN, as in previous cases). The distance along the joint in figure is measured from the
low-wavelength end of the CFBG sensor which is adjacent to the cut end of the adherend,
with the disbond occurring at the high wavelength end of the bond overlap length.
For the "no disbond" case in Figure 7.9, the strain in the adherend at the position of
the sensor increases as load is transferred from the upper adherend, increasing to a plateau
region about 5 min from the end of the adherend. At the other end of the overlap length,
the strain in the same adherend increases as the load is shed from the termination of the
other adherend. It should be noted that the small perturbations in the strain are not artifacts
of the mesh size, but probably arise as a consequence of the complex strains induced by
bending of the asymmetric joint under load. For the disbond length of 10 mm adjacent to
the high wavelength end of the CFBG sensor, the strain at the lower and middle portion of
the overlap is similar to the strain in the "no disbond" case. However, as the higher end of
the overlap is approached the strain begins to increase and reaches a peak value adjacent to
the disbond front (at 50 mm). For the remaining portion of the overlap i. e. for remaining 10
mm, the strain reduces due to the disbond. Again, the complexity of the strain field is due to
the interaction between the flexure of the joint, the disbond strain field and the load transfer
strain field. However, it is the rapid change in strain due to the load-transfer between the
adherends which is the most important feature of the strain distribution with regard to the
reflected CFBG spectrum. The strain distribution shown in Figure 7.9 was used to predict the reflected spectra using the OptiGrating software and the method of modification of the
refractive index and grating period as a consequence of the strain profile. The parameters
used in the prediction are discussed in Chapter 3.
I F--105
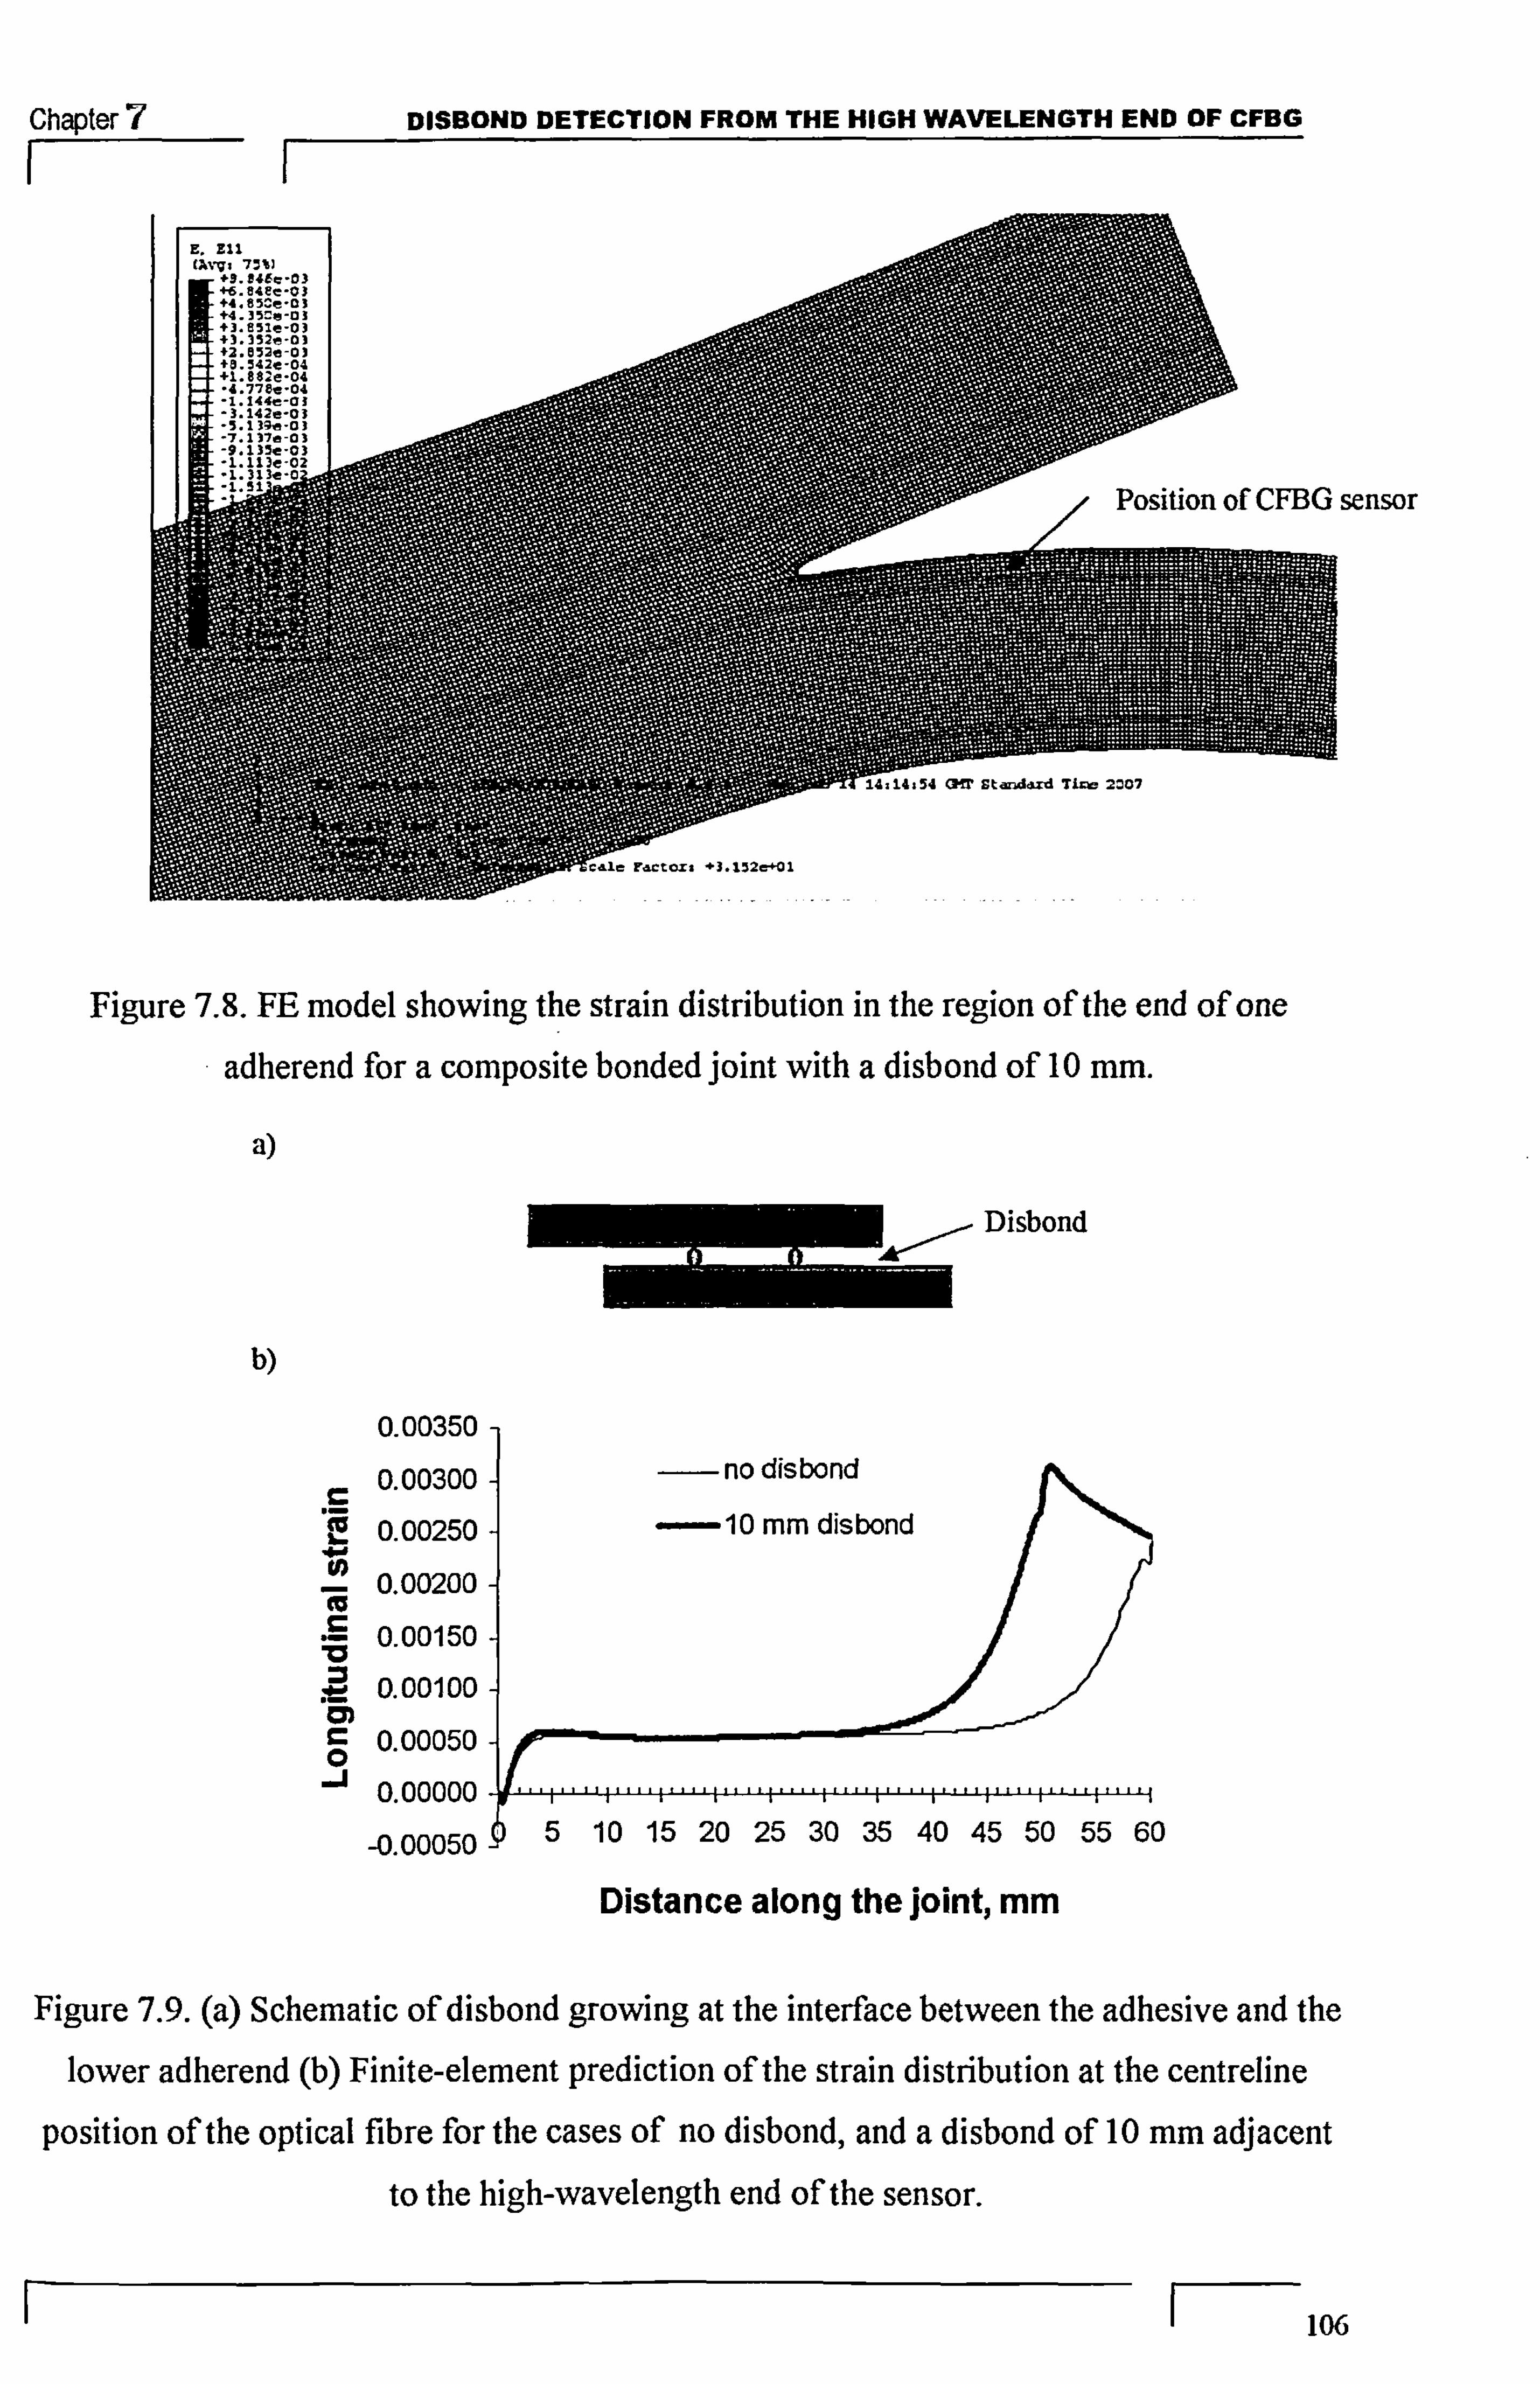
Chapter 7 DISBOND DETECTION FROM THE HIGH WAVELENGTH END OF CFBG
sensor
Figure 7.8. FE model showing the strain distribution in the region of the end of one
adherend for a composite bonded joint with a disb ond of 10 mm.
a)
M Disbond
b)
0.00350
c 0.00300- -no dis bond
, _0 0.00250 - -10 mm disbond '7
U) 0.00200-
0,00150
0.001001 CF) r- 0 00050
0.00000
_0.00050 p5 10 15 20 25 30 35 40 45 50 55 60
Distance along the joint, mm
Figure 7.9. (a) Schematic of disbond growing at the interface between the adhesive and the lower adherend (b) Finite-element prediction of the strain distribution at the centreline
position of the optical fibre for the cases of no disbond, and a disbond of 10 mm adjacent
to the high-wavelength end of the sensor.
1 106

Chapter 7 DISBOND DETECTION FROM THE HIGH WAVELENGTH END OF CFBG
0
10
-204- 1528 1533 1538 1543 1548 1553
Wavelength, nm
Figure 7.10. The predicted CFBG reflected spectrum for a disbond of length 10 mm,
adjacent to the high-wavelength end of the sensor. The position of the disbond front is
indicated by the short vertical line at about 1550 m-n.
Figure 7.10 shows the predicted reflected spectrum using the strain distribution for a disbond of 10 rum. The predicted spectrum has a sharp dip at the higher wavelength end
which is very similar in shape to the experimental results (see Figure 7.5). In Figure 7.10,
the position of the disbond ftont in relation to the reflected spectrum is indicated by a small
vertical line. It can be seen that the position of the disbond front corresponds to the
beginning of the dip in the reflection spectrum i. e. the position of the disbond front is,
again, not at the minimum of the perturbation but about 1.5 mm towards the low-
wavelength end of the sensor.
7.4. DISCUSSION
The shift of the high wavelength end of the CFBG reflected spectrum to the higher
wavelength end (Figure 7.4) can be explained as follows. For the disbond occurring
adjacent to the high wavelength end of the CFBG sensor, the disbond enhances the load
locally in the adherend which contains the embedded sensor. The consequence is that this
adherend experiences an enhanced strain, which leads locally to an increased spacing for
the gratings of the CFBG sensor near to the sensor end, and hence the reflected spectrum here shifts to higher wavelengths.
I F--107

Chapter
F- 540
538
E
536 0
CL 0 534 C
532
530
DISSOND DETECTION FROM THE HIGH W"ELENGTH END OF CFBG
Figure 7.11. Comparison of grating period change before and after disbond along the length
of grating
The dip in the spectrum is explained as follows. As mentioned earlier, the intensity
of the reflected spectrum of a chirped grating is related to the local density of the grating
period and Figure 7.11 shows the grating period changes along the sensor length before and
after disbonding. In the "before disbond" case the grating period changes gradually along
the distance thereby giving a constant intensity. For the "after disbond" case, the gating
period remains unchanged until 40 mm and there is an rapid increase in the gating period from about 40 mm to 50 mm corresponding to reduced intensity in the reflected spectrum
as the density of grating spacings at any particular wavelength decreases in front of the
disbond (i. e. when the joint is still bonded). Behind the disbond front the grating period
changes much more slowly and hence there is an enhanced intensity.
The movement of the dip in the reflected spectrum is due to the movement of
grating period density from high wavelength to low wavelength as the disbond propagates.
7.5. CONCLUSIONS
The main conclusions drawn from this chapter are
*A single chirped fibre Bragg grating sensor can be used to monitor the
disbond at either end, or both ends, of an adhesively bonded single-lap joint, with the
sensor embedded within one adherend, with the low-wavelength end of the sensor at the cut
end of the adherend and with the sensor extending the full length of the joint.
los
05 10 15 20 25 30 35 40 45 50 55 60
distance along the CFBG, mm

Chapter 7 DISBOND DETECTION FROM THE HIGH WAVELENGTH END OF CFBG
F- I m Disbond initiation adjacent to either the low-wavelength or high-wavelength
end of the sensor is indicated by a shift in the low wavelength end of the spectrum to lower
wavelengths (for disbonding adjacent to the low-wavelength end) or a shift in the high
wavelength end of the spectrum to higher wavelengths (for disbonding adjacent to the high-
wavelength end of the sensor).
e Disbond propagation from the high wavelength end is indicated by the
movement of a perturbation in the reflected spectrum to lower wavelengths which
corresponds to the progression of the disbond front and a combination of finite-element
modelling and commercial FBG software has enabled the position of the disbond front to
be related to the perturbation in the reflected spectrum.
@ In this work, the position of the disbond front can be located with a precision
of about 2 mm, but in general this is likely to depend both on the adherend materials and on the position of the sensor in relation to the disbond location.
7.6. SUMMARY
In this chapter, a novel optical technique using a single CFBG sensor for
monitoring the disbond from either end or both ends of the composite bonded joints has
been presented. In the next chapter the sensitivity of the sensor in locating the disbond front
in a bonded joint is explored.
I
log
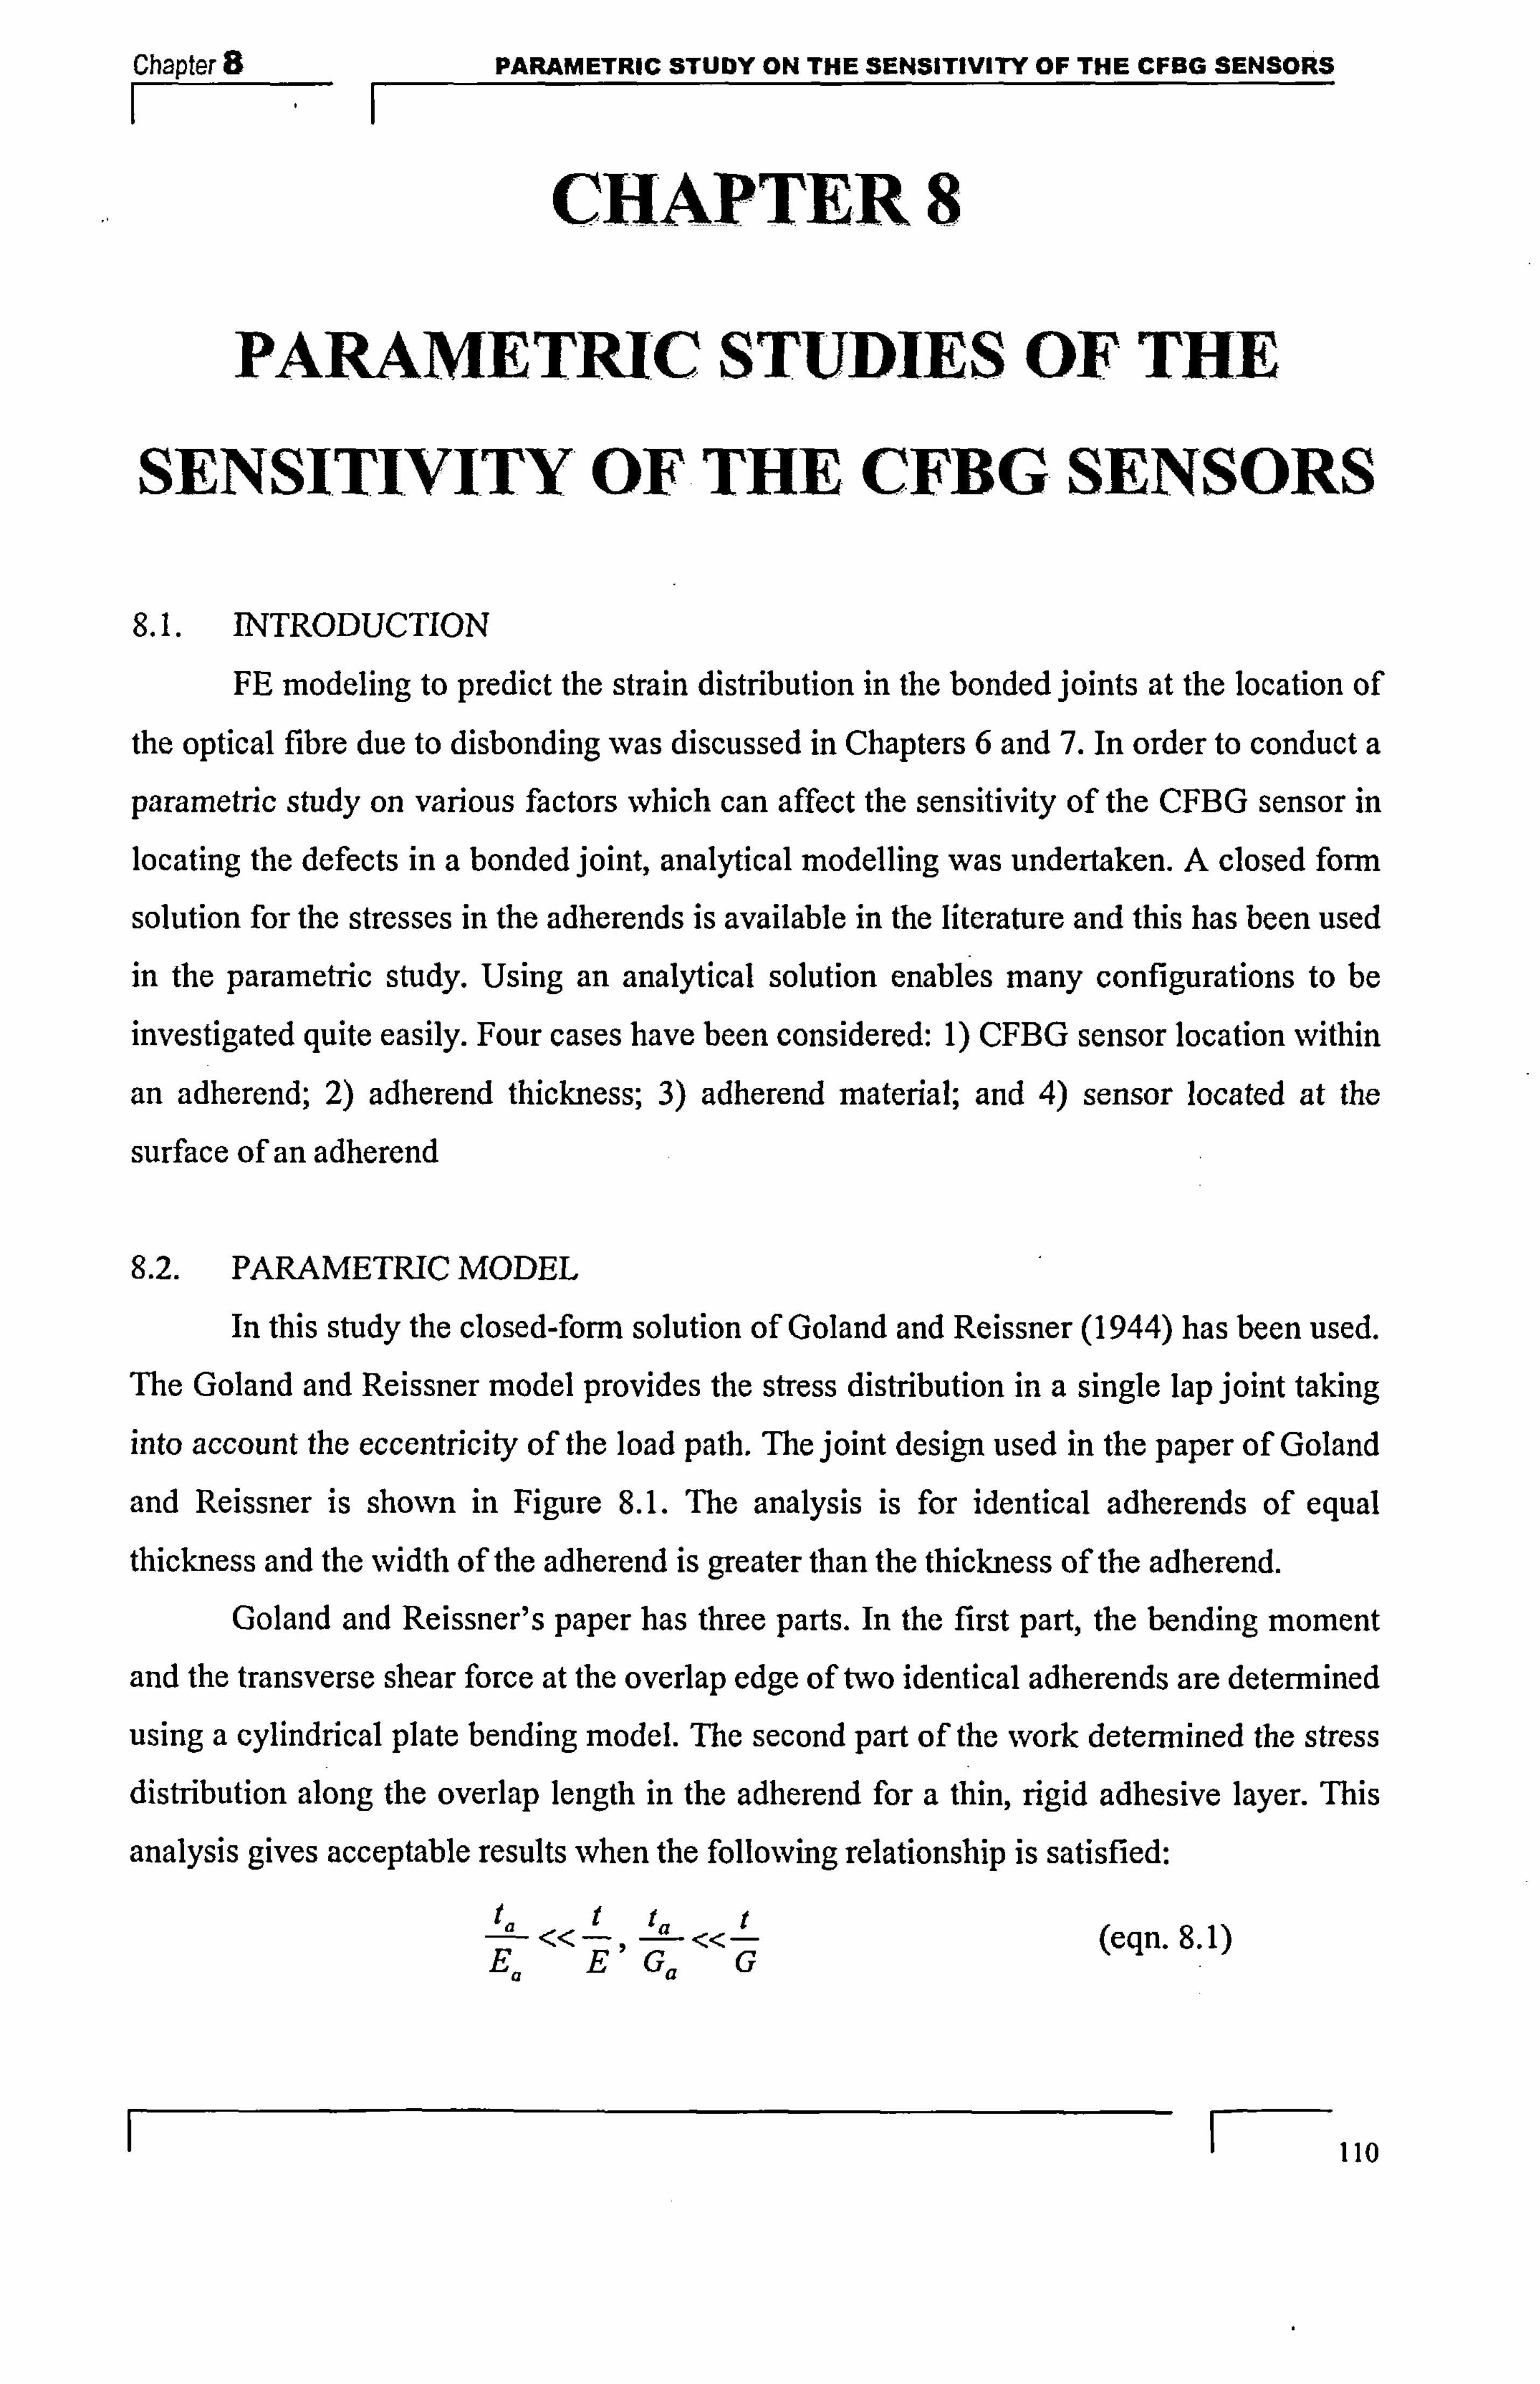
Chapter 8 PARAMETRIC STUDY ON THE SENSITIVITY OF THE CFBG SENSORS
CHAPTER 8
PARAMETRIC STUDIES OF THE
SENSITIVITY OF THE CFBG SENSORS
8.1. INTRODUCTION
FE modeling to predict the strain distribution in the bonded joints at the location of
the optical fibre due to disbonding was discussed in Chapters 6 and 7. In order to conduct a
parametric study on various factors which can affect the sensitivity of the CFBG sensor in
locating the defects in a bonded joint, analytical modelling was undertaken. A closed form
solution for the stresses in the adherends is available in the literature and this has been used in the parametric study. Using an analytical solution enables many configurations to be
investigated quite easily. Four cases have been considered: 1) CFBG sensor location within
an adherend; 2) adherend thickness; 3) adherend material; and 4) sensor located at the
surface of an adherend
8.2. PARAMETRIC MODEL
In this study the closed-form solution of Goland and Reissner (1944) has been used. The Goland and Reissner model provides the stress distribution in a single lap joint taking
into account the eccentricity of the load path. The joint design used in the paper of Goland
and Reissner is shown in Figure 8.1. The analysis is for identical adherends of equal
thickness and the width of the adherend. is geater than the thickness of the adherend. Goland and Reissner's paper has three parts. In the first part, the bending moment
and the transverse shear force at the overlap edge of two identical adherends are determined
using a cylindrical plate bending model. The second part of the work determined the stress distribution along the overlap length in the adherend for a thin, rigid adhesive layer. This
analysis gives acceptable results when the following relationship is satisfied: ta
<< t, ta
<< t
(eqn. 8.1) E. E G, G
110

Chapter 8 PARAMETRIC STUDY ON THE SENSITIVITY OF THE CFBG SENSORS
where t,, and Ea are the thickness and Young's modulus of the adhesive respectively; t and E
are thickness and Young's modulus of the adherend respectively; G" and G are the shear
modulus of adhesive and adherend respectively. In this approximation, it was considered
that when the adhesive layer is very thin, the stress distribution in the adhesive has no
significant effect on the stresses in the joint and hence the overlap is considered as a single deformed body with the same material properties as the adherends. The same assumption
was valid for a non-flexible rigid adhesive even when the adhesive layer is thick. The third
part of the study is the most widely used since it provides the stress distribution in the
adhesive layer of the joint when the adhesive layer is thick and flexible i. e. when the
following relation is satisfied.
t <<
t" ,t <<
t" (eqn. 8.2) E E, G G,
where ta and E,, are the thickness and Young's modulus of the adhesive respectively; t and E
are thickness and Young's modulus of the adherend respectively; G,, and G are the shear
modulus of adhesive and adherend respectively.
2c
I -4 -0 I- "I -fb -T
t
Figure 8.1. Joint considered by Goland and Reissner [1]
In our study, although - La
z -t , we have - La
<< -t , thereby the first approximation E,, E G,, G
condition is partly met. Moreover the other condition of relative thinness of adhesive layer
is completely met and hence the first approximation stress distribution results were
considered. The results for calculating the stress distribution in the adherend (not in the
adhesive) along the overlap length gives the axial stress in the adherend at a particular location:
0. =P+ (A,, + B,, ) fIe a(y-c)[a(c-y)+Il } cos ar (eqn. 8.3) y2 n=l 2
where x is a coordinate with its origin at the upper surface of the joint and in the direction
of joint thickness, y is the coordinate with its origin in the midpoint of the overlap length
I F-111

Chapter 8 PARAMETRIC STUDY ON THE SENSITIVITY OF THE CFBG SENSORS
and in the direction of the joint length, p is the tensile stress, 2c is the overlap length,
717r a =- and t is the thickness of the adherend (see Figure 8.2).
2t
The factor A,, + B, in the equation 8.3 is given by
4p 12k In A,, +B, = f(: Z-'---)[cos(ý-)-cosii; r]-(3k+l)sin(? "n) (eqn. 8.4)
117T 117C 22
where k (the bending moment factor) c t
Op
+y
C
Figure 8.2. Schematic of bonded joint with very thin adhesive layer, the notations used in the model are shown.
8.3. SCOPE OF THE PARAMETRIC ANALYSIS
The equation to calculate the axial stress (eqn. 8.3) was programmed into a
spreadsheet for rapid evaluation of the stress ay for the sum over n=1 to Go for particular
values of the other parameters (the visual basic macro is shown in Appendix 8 A). When
A, ý + Bn converged, the stresses are obtained. The stress obtained from the calculation is
then converted to strain, to obtain the strain distribution. The parameters used for the
calculations are shown in Table 8.1.
The strain distribution along the 60 mm. overlap of the joint at 4 mm from the
surface of the upper adherend when the bonded joint was loaded by 5 kN was calculated for
three cases: (1) no disbond; (2) 5 mm disbond; and (3) 10 mm disbond. The optical sensor is positioned 0.5 mm from the adhesive bond line and hence 4 mm from the surface of
upper adherend was taken. For the no disbond case, the overlap was taken to be 60 mm. However to calculate the strain profile for the disbonded SLJ (5 mm and 10 mm disbond)
the overlap was considered to be reduced by 5 mm. or 10 mm. respectively (i. e. the overlap (2c) was taken to be 50 mm and 40 mm respectively). The approximation appears justified
because the effect of the disbond is to unload the adherend in the disbonded region meaning that the overlap bonded length would be reduced.
p
112
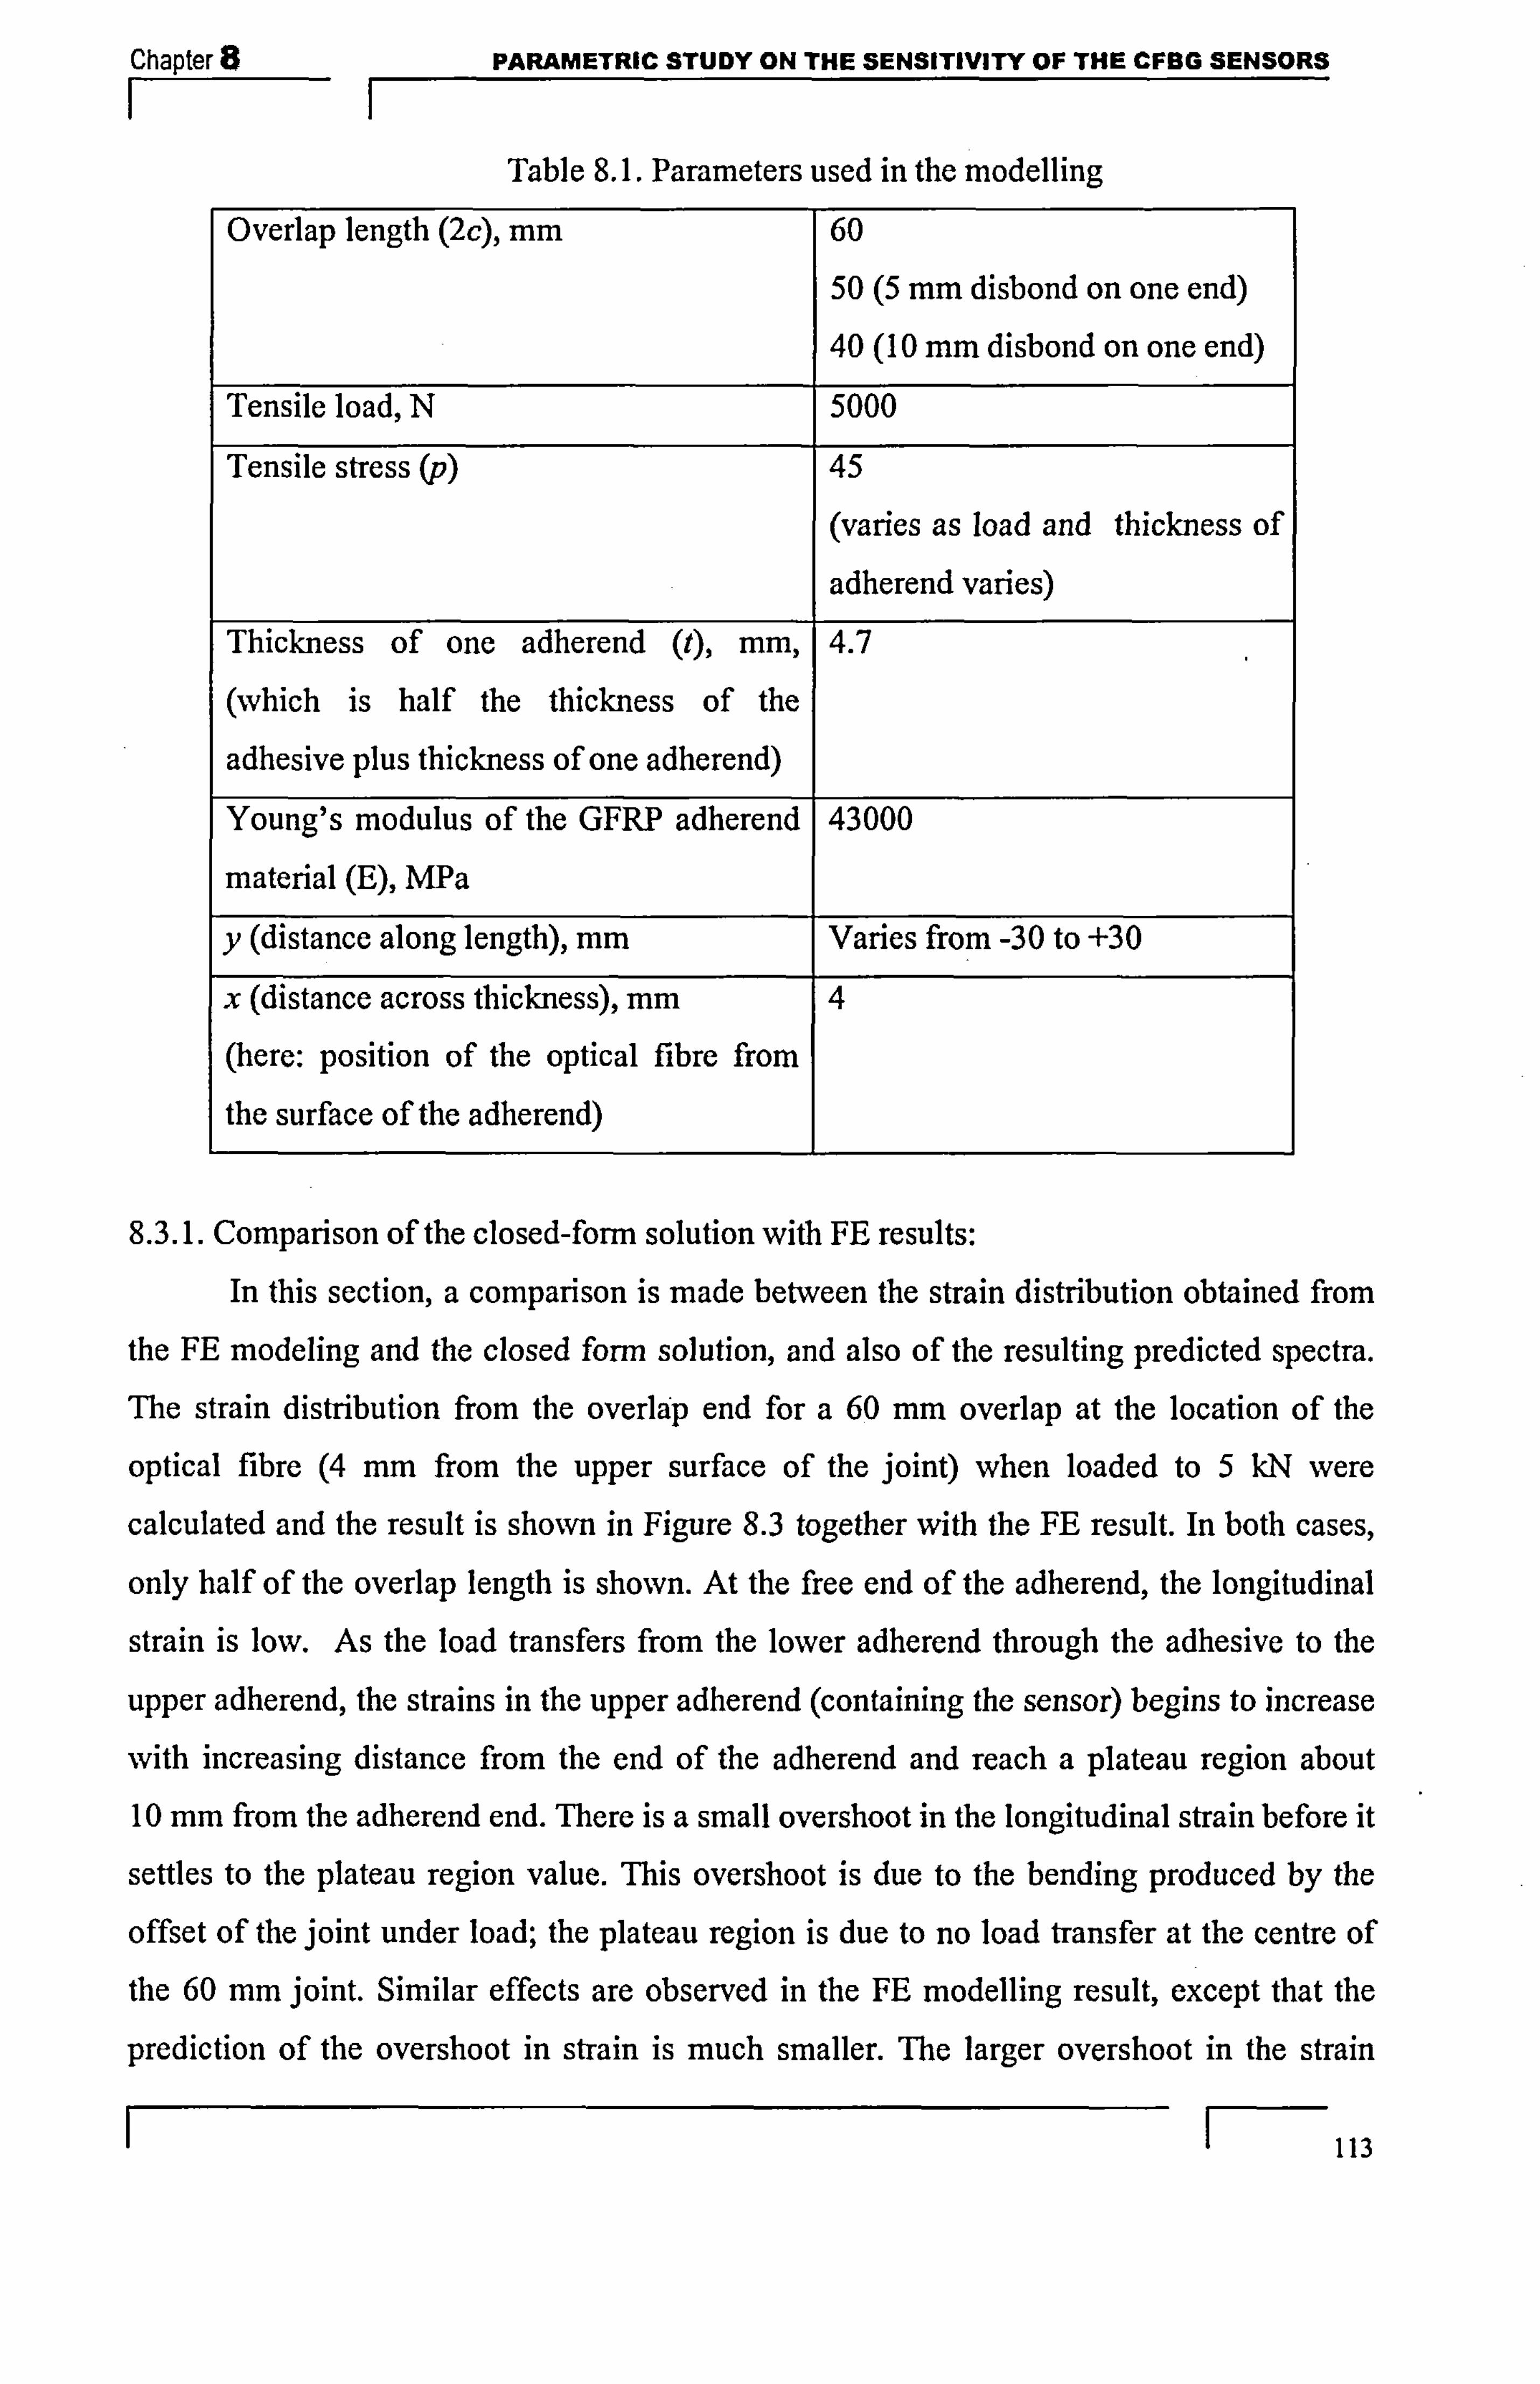
Chapter 8 PARAMETRIC STUDY ON THE SENSITIVITY OF THE CFBG SENSORS II
Table 8.1. Parameters used in the modelling Overlap length (2c), mm, 60
50 (5 mm. disbond on one end) 40 (10 mm disbond on one end)
Tensile load, N 5000
Tensile stress (p) 45
(varies as load and thickness of
adherend varies) Thickness of one adherend (t), mm, 4.7
(which is half the thickness of the
adhesive plus thickness of one adherend) Young's modulus of the GFRP adherend. 43000
material (E), MPa
y (distance along length), mm. Varies from -30 to +30
x (distance across thickness), mm 4
(here: position of the optical fibre from
the surface of the adherend)
8.3.1. Comparison of the closed-form solution with FE results: In this section, a comparison is made between the strain distribution obtained from
the FE modeling and the closed form solution, and also of the resulting predicted spectra. The strain distribution from the overlap end for a 60 mm overlap at the location of the
optical fibre (4 mm from the upper surface of the joint) when loaded to 5 kN were
calculated and the result is shown in Figure 8.3 together with the FE result. In both cases,
only half of the overlap length is shown. At the free end of the adherend, the longitudinal
strain is low. As the load transfers from the lower adherend through the adhesive to the
upper adherend, the strains in the upper adherend (containing the sensor) begins to increase
with increasing distance from the end of the adherend and reach a plateau region about 10 mm from the adherend end. There is a small overshoot in the longitudinal strain before it
settles to the plateau region value. This overshoot is due to the bending produced by the
offset of the joint under load; the plateau region is due to no load transfer at the centre of
the 60 mm joint. Similar effects are observed in the FE modelling result, except that the
prediction of the overshoot in strain is much smaller. The larger overshoot in the strain
113
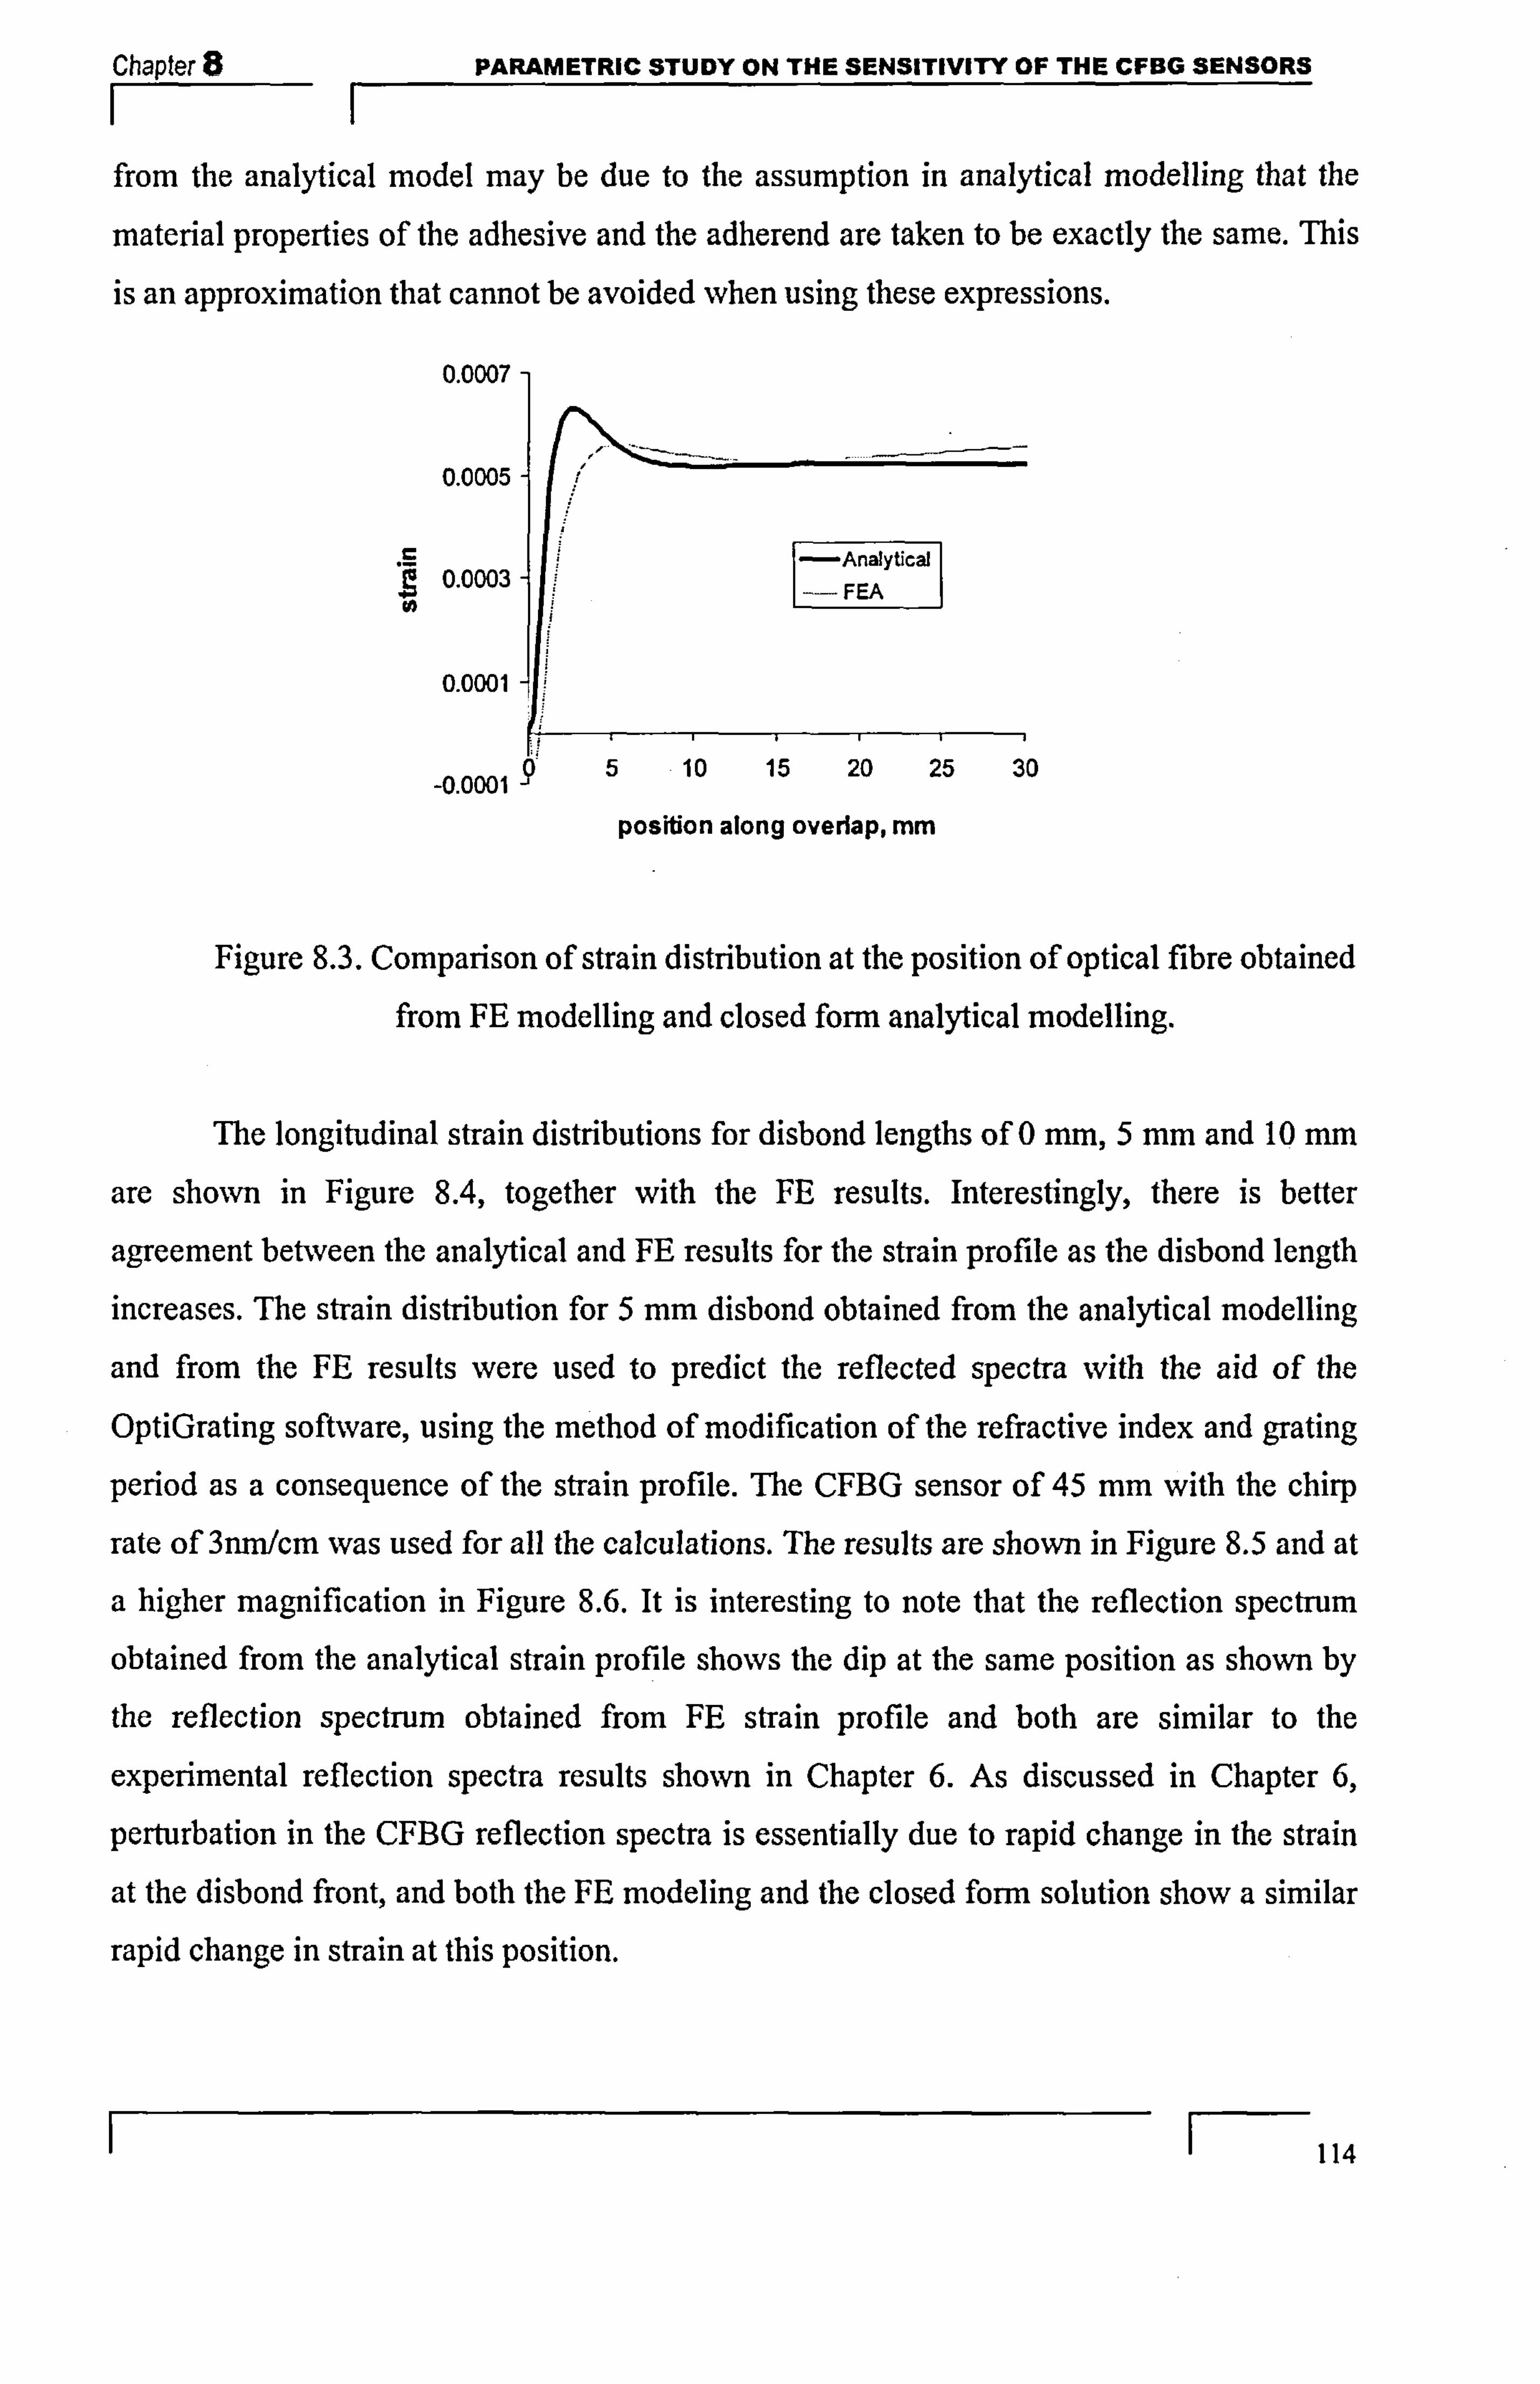
Chapter 8 PARAMETRIC STUDY ON THE SENSITIVITY OF THE CFBG SENSORS II
from the analytical model may be due to the assumption in analytical modelling that the
material properties of the adhesive and the adherend are taken to be exactly the same. This
is an approximation that cannot be avoided when using these expressions.
0.0007
0.0005
0.0003
0.0001
-0.0001 5 10 15 20 25 30
position along overlap, mm
Figure 8.3. Comparison of strain distribution at the position of optical fibre obtained from FE modelling and closed form analytical modelling.
The longitudinal strain distributions for disbond lengths of 0 mm, 5 mm and 10 mm
are shown in Figure 8.4, together with the FE results. Interestingly, there is better
agreement between the analytical and FE results for the strain profile as the disbond length
increases. The strain distribution for 5 mm disbond obtained from the analytical modelling
and from the FE results were used to predict the reflected spectra with the aid of the
OptiGrating software, using the method of modification of the refractive index and grating
period as a consequence of the strain profile. The CFBG sensor of 45 mm with the chirp
rate of 3mn/cm was used for all the calculations. The results are shown in Figure 8.5 and at
a higher magnification in Figure 8.6. It is interesting to note that the reflection spectrum
obtained from the analytical strain profile shows the dip at the same position as shown by
the reflection spectrum obtained from FE strain profile and both are similar to the
experimental reflection spectra results shown in Chapter 6. As discussed in Chapter 6,
perturbation in the CFBG reflection spectra is essentially due to rapid change in the strain
at the disbond front, and both the FE modeling and the closed form solution show a similar
rapid change in strain at this position.
F-114

Chapter 8 PARAMETRIC STUDY ON THE SENSITIVITY OF THE CFBG SENSORS II
0.0008
0.0006 A f\ 1
0.0004 FEA no disbond -FEA 5 mm disbond
FEA 10 mm disbond
0.0002 -analytical no disbond -analytical 5 mm dis bond analytical 10 mm disbon
0.0000 -P-1-4- fFIIII
05 10 15 20 25 30 35 40
postion along the overlap
Figure 8.4. Comparison of strain distribution at the position of optical fibre for
three cases, no disbond, 5 mm. disbond and 10 mm disbond obtained from FE
modelling and analytical modelling.
0-
*0 -15 - zý
-20-
-25-
-30
-35 -
-40 1535
Figure 8.5. Comparison of predicted CFBG reflection spectrum obtained by using
analytical modelling and FE modelling for a5 mm disbonded single lap joint.
F- 115
1540 1545 1550 1555 1560 1565
Wavelength, nm
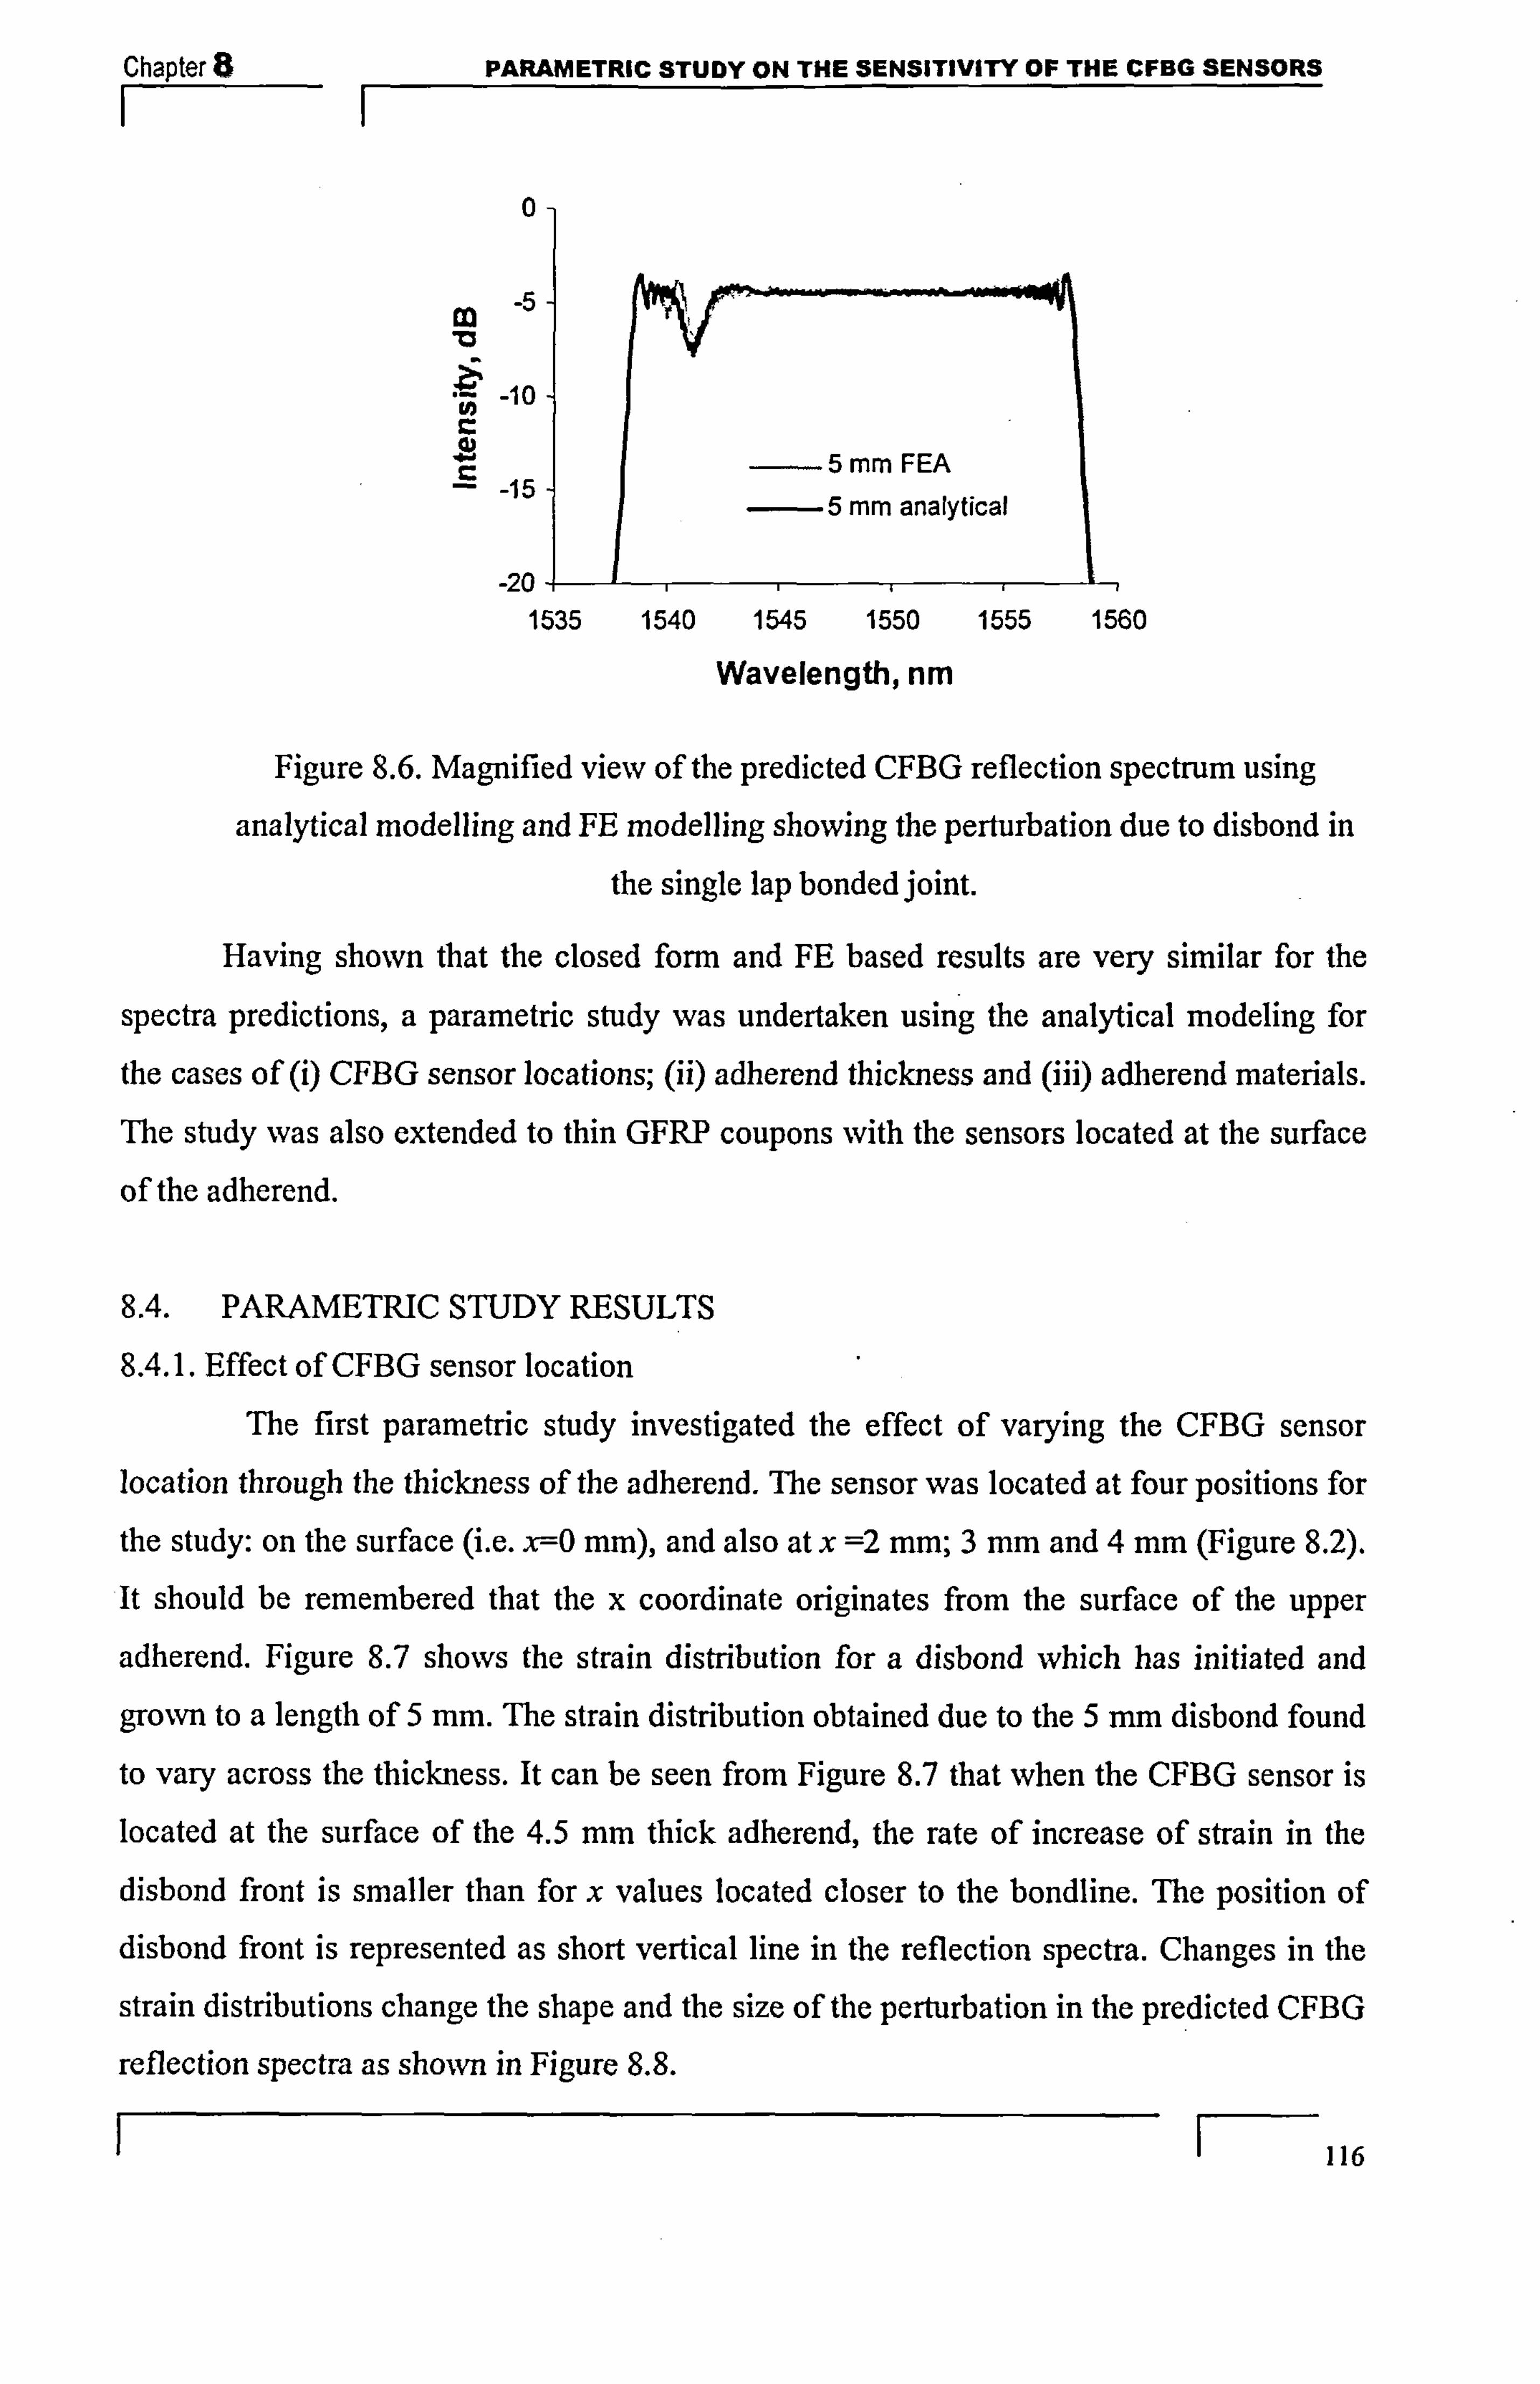
Chapter PARAMETRIC STUDY ON THE SENSITIVITY OF THE CFBG SENSORS
0
9? -5 m
10
-15
-204- 1535
Wavelength, nm
Figure 8.6. Magnified view of the predicted CFBG reflection spectrum using
analytical modelling and FE modelling showing the perturbation due to disbond in
the single lap bonded joint.
Having shown that the closed form and FE based results are very similar for the
spectra predictions, a parametric study was undertaken using the analytical modeling for
the cases of (i) CFBG sensor locations; (ii) adherend thickness and (iii) adherend materials. The study was also extended to thin GFRP coupons with the sensors located at the surface
of the adherend.
8.4. PARAMETRIC STUDY RESULTS
8.4.1. Effect of CFBG sensor location
The first parametric study investigated the effect of varying the CFBG sensor location through the thickness of the adherend. The sensor was located at four positions for
the study: on the surface (i. e. x--O mm), and also at x =2 mm; 3 mm, and 4 mm, (Figure 8.2).
It should be remembered that the x coordinate originates from the surface of the upper
adherend. Figure 8.7 shows the strain distribution for a disbond which has initiated and
grown to a length of 5 mm. The strain distribution obtained due to the 5 mm. disbond found
to vary across the thickness. It can be seen from Figure 8.7 that when the CFBG sensor is
located at the surface of the 4.5 mm thick adherend, the rate of increase of strain in the
disbond front is smaller than for x values located closer to the bondline. The position of disbond front is represented as short vertical line in the reflection spectra. Changes in the
strain distributions change the shape and the size of the perturbation in the predicted CFBG
reflection spectra as shown in Figure 8.8.
F-116
1540 1545 1550 1555 1560
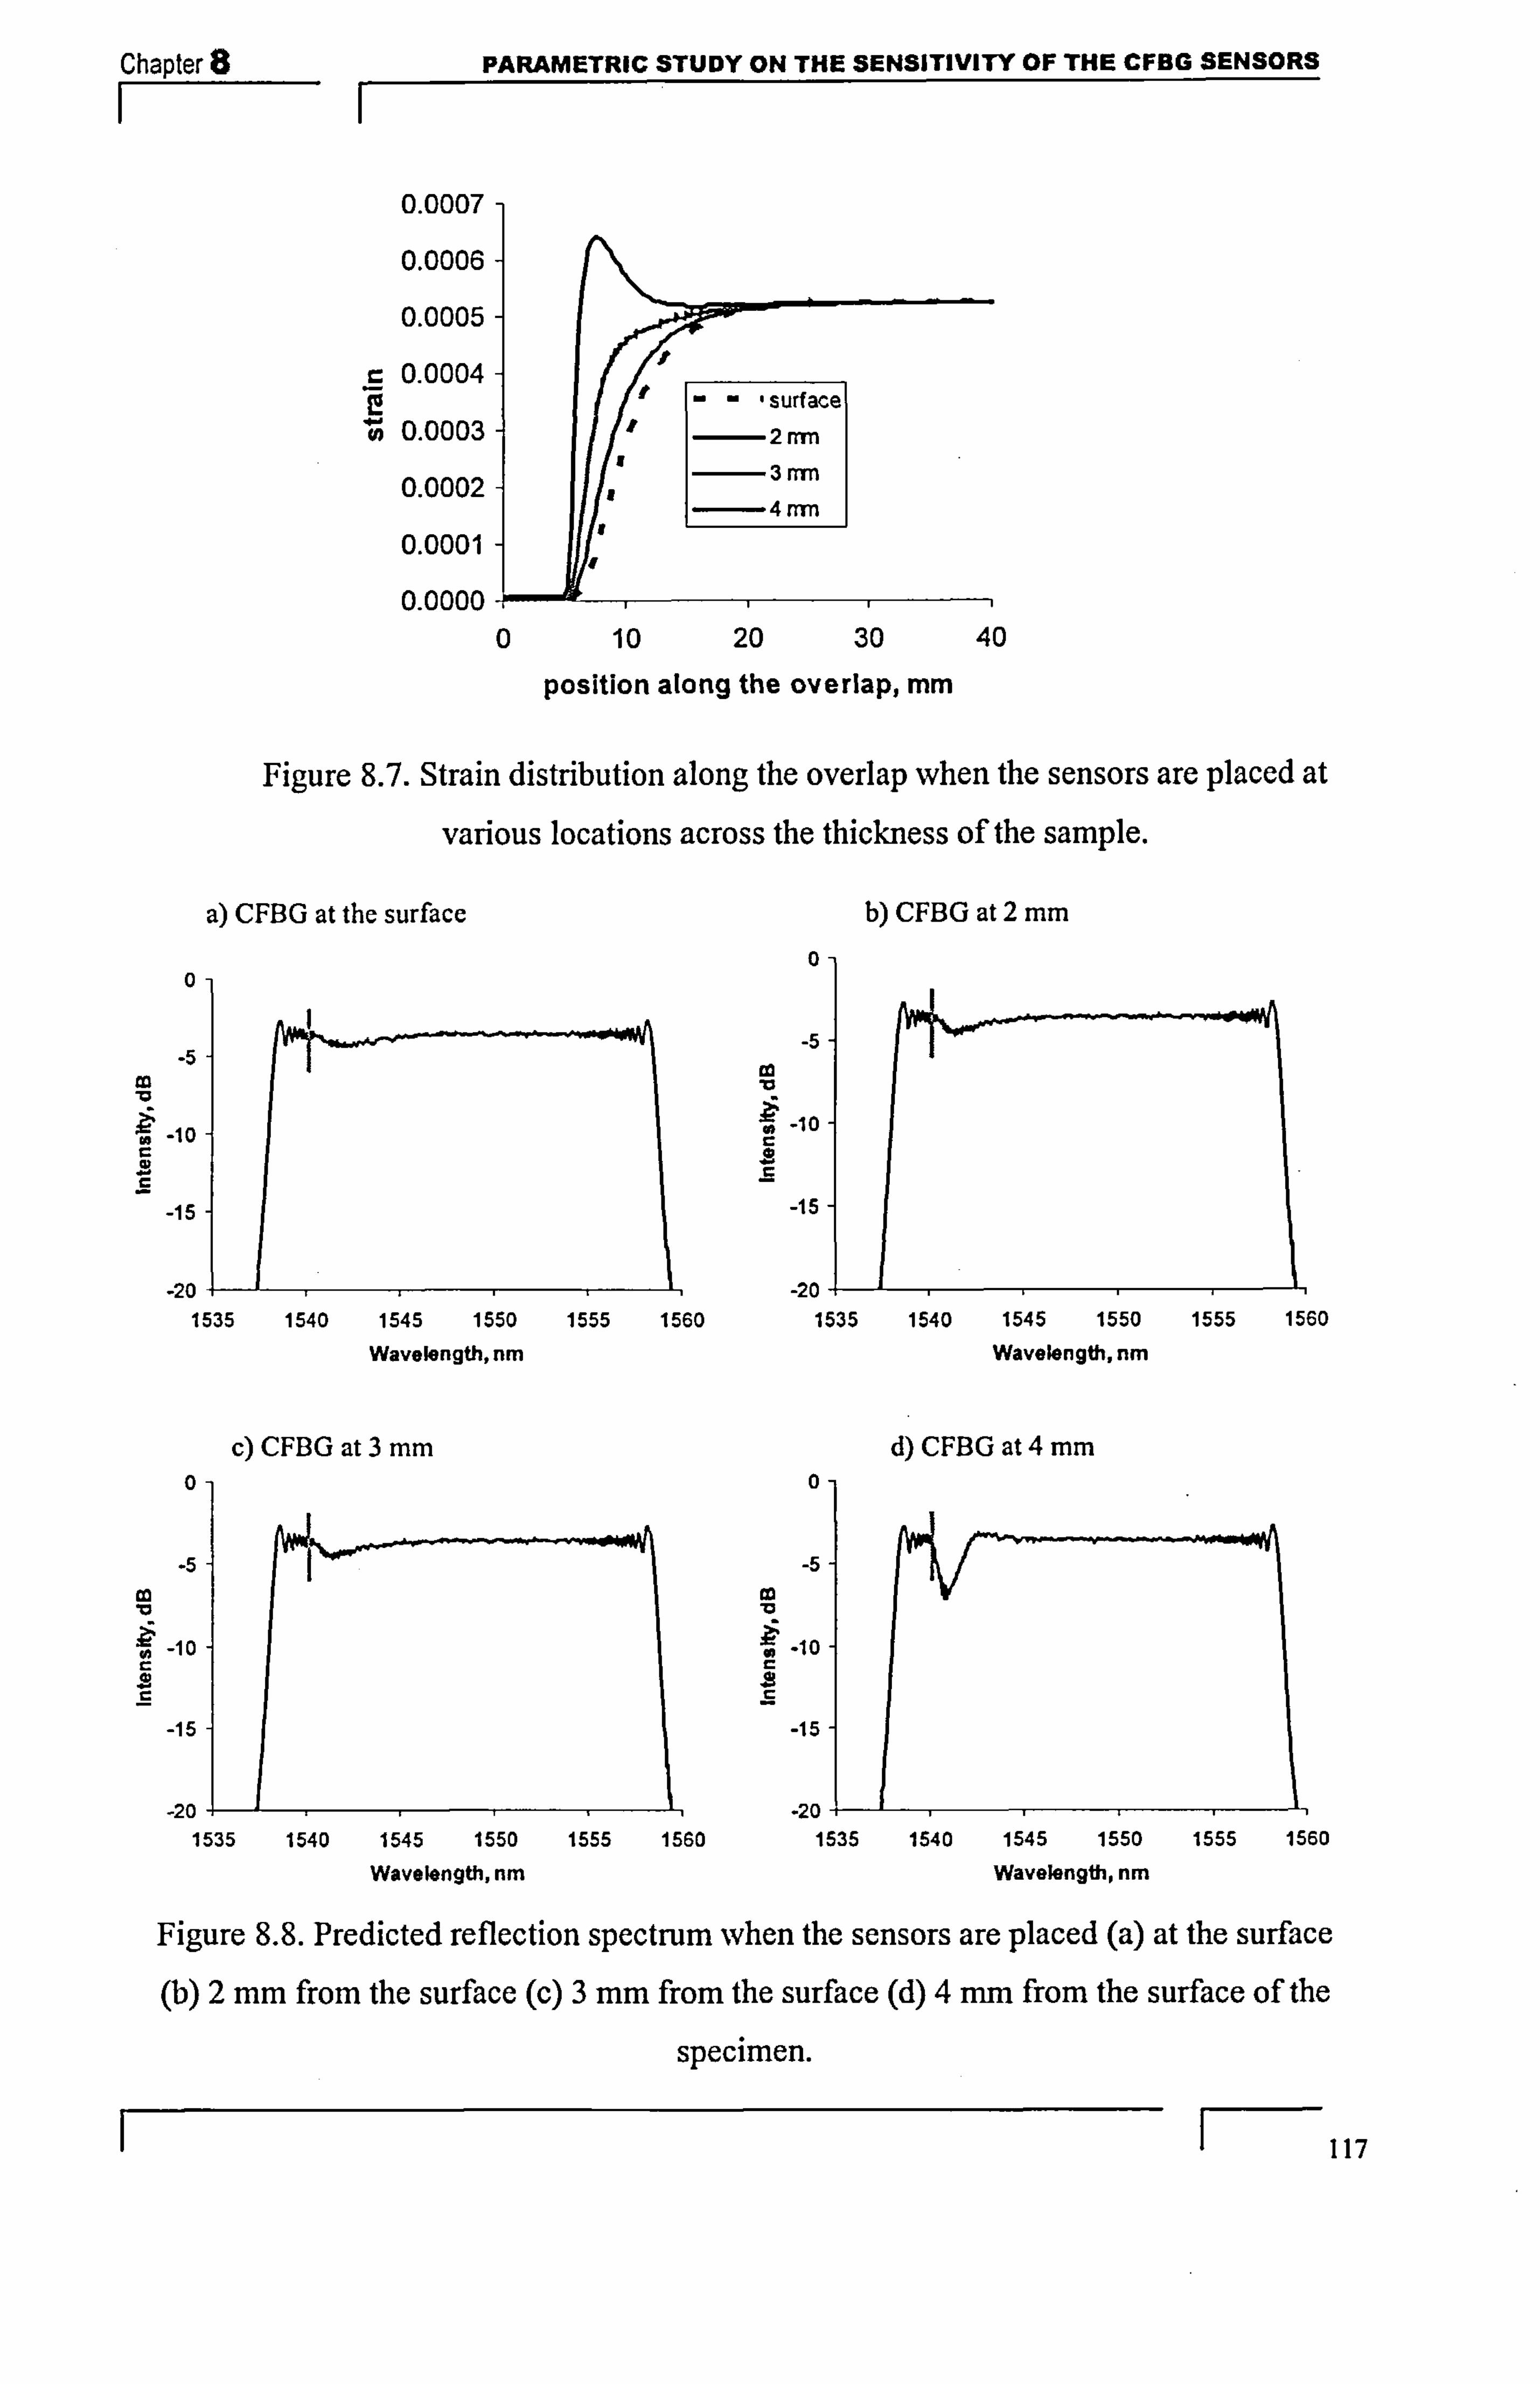
Chapter 8 PARAMETRIC STUDY ON THE SENSITIVITY OF THE CFBG SENSORS II
0.0007-
0.0006-
0.0005-
0.0004-
0 U. UUU"5 -
0.0002-
0.0001
0.0000 0
Figure 8.7. Strain distribution along the overlap when the sensors are placed at
various locations across the thickness of the sample.
a) CFBG at the surface
0 0
b) CFBG at 2 mm
-5
-10
-15
-20 1't 1535 1540 1545 1550 1555 1560
Wavelength, nm
0
.5
_10
-15
-5
: 9ý - , 10
-15
0
-5
P. 10 r
-15
-20 111. -20 1. I, 1535 1540 1545 1550 1555 1560 1535 1540 1545 1550 1555 1560
Wavelength, nrn Wavelength, nrn
Figure 8.8. Predicted reflection spectrum when the sensors are placed (a) at the surface (b) 2 mm from the surface (c) 3 mm. from the surface (d) 4 mrn from the surface of the
specimen.
F- 117
10 20 30 40
position along the overlap, mm
-20 1'. 1 1535 1540 1545 1550 1555 1560
Wavelength, nm
c) CFBG at 3 mm d) CFBG at 4 mm
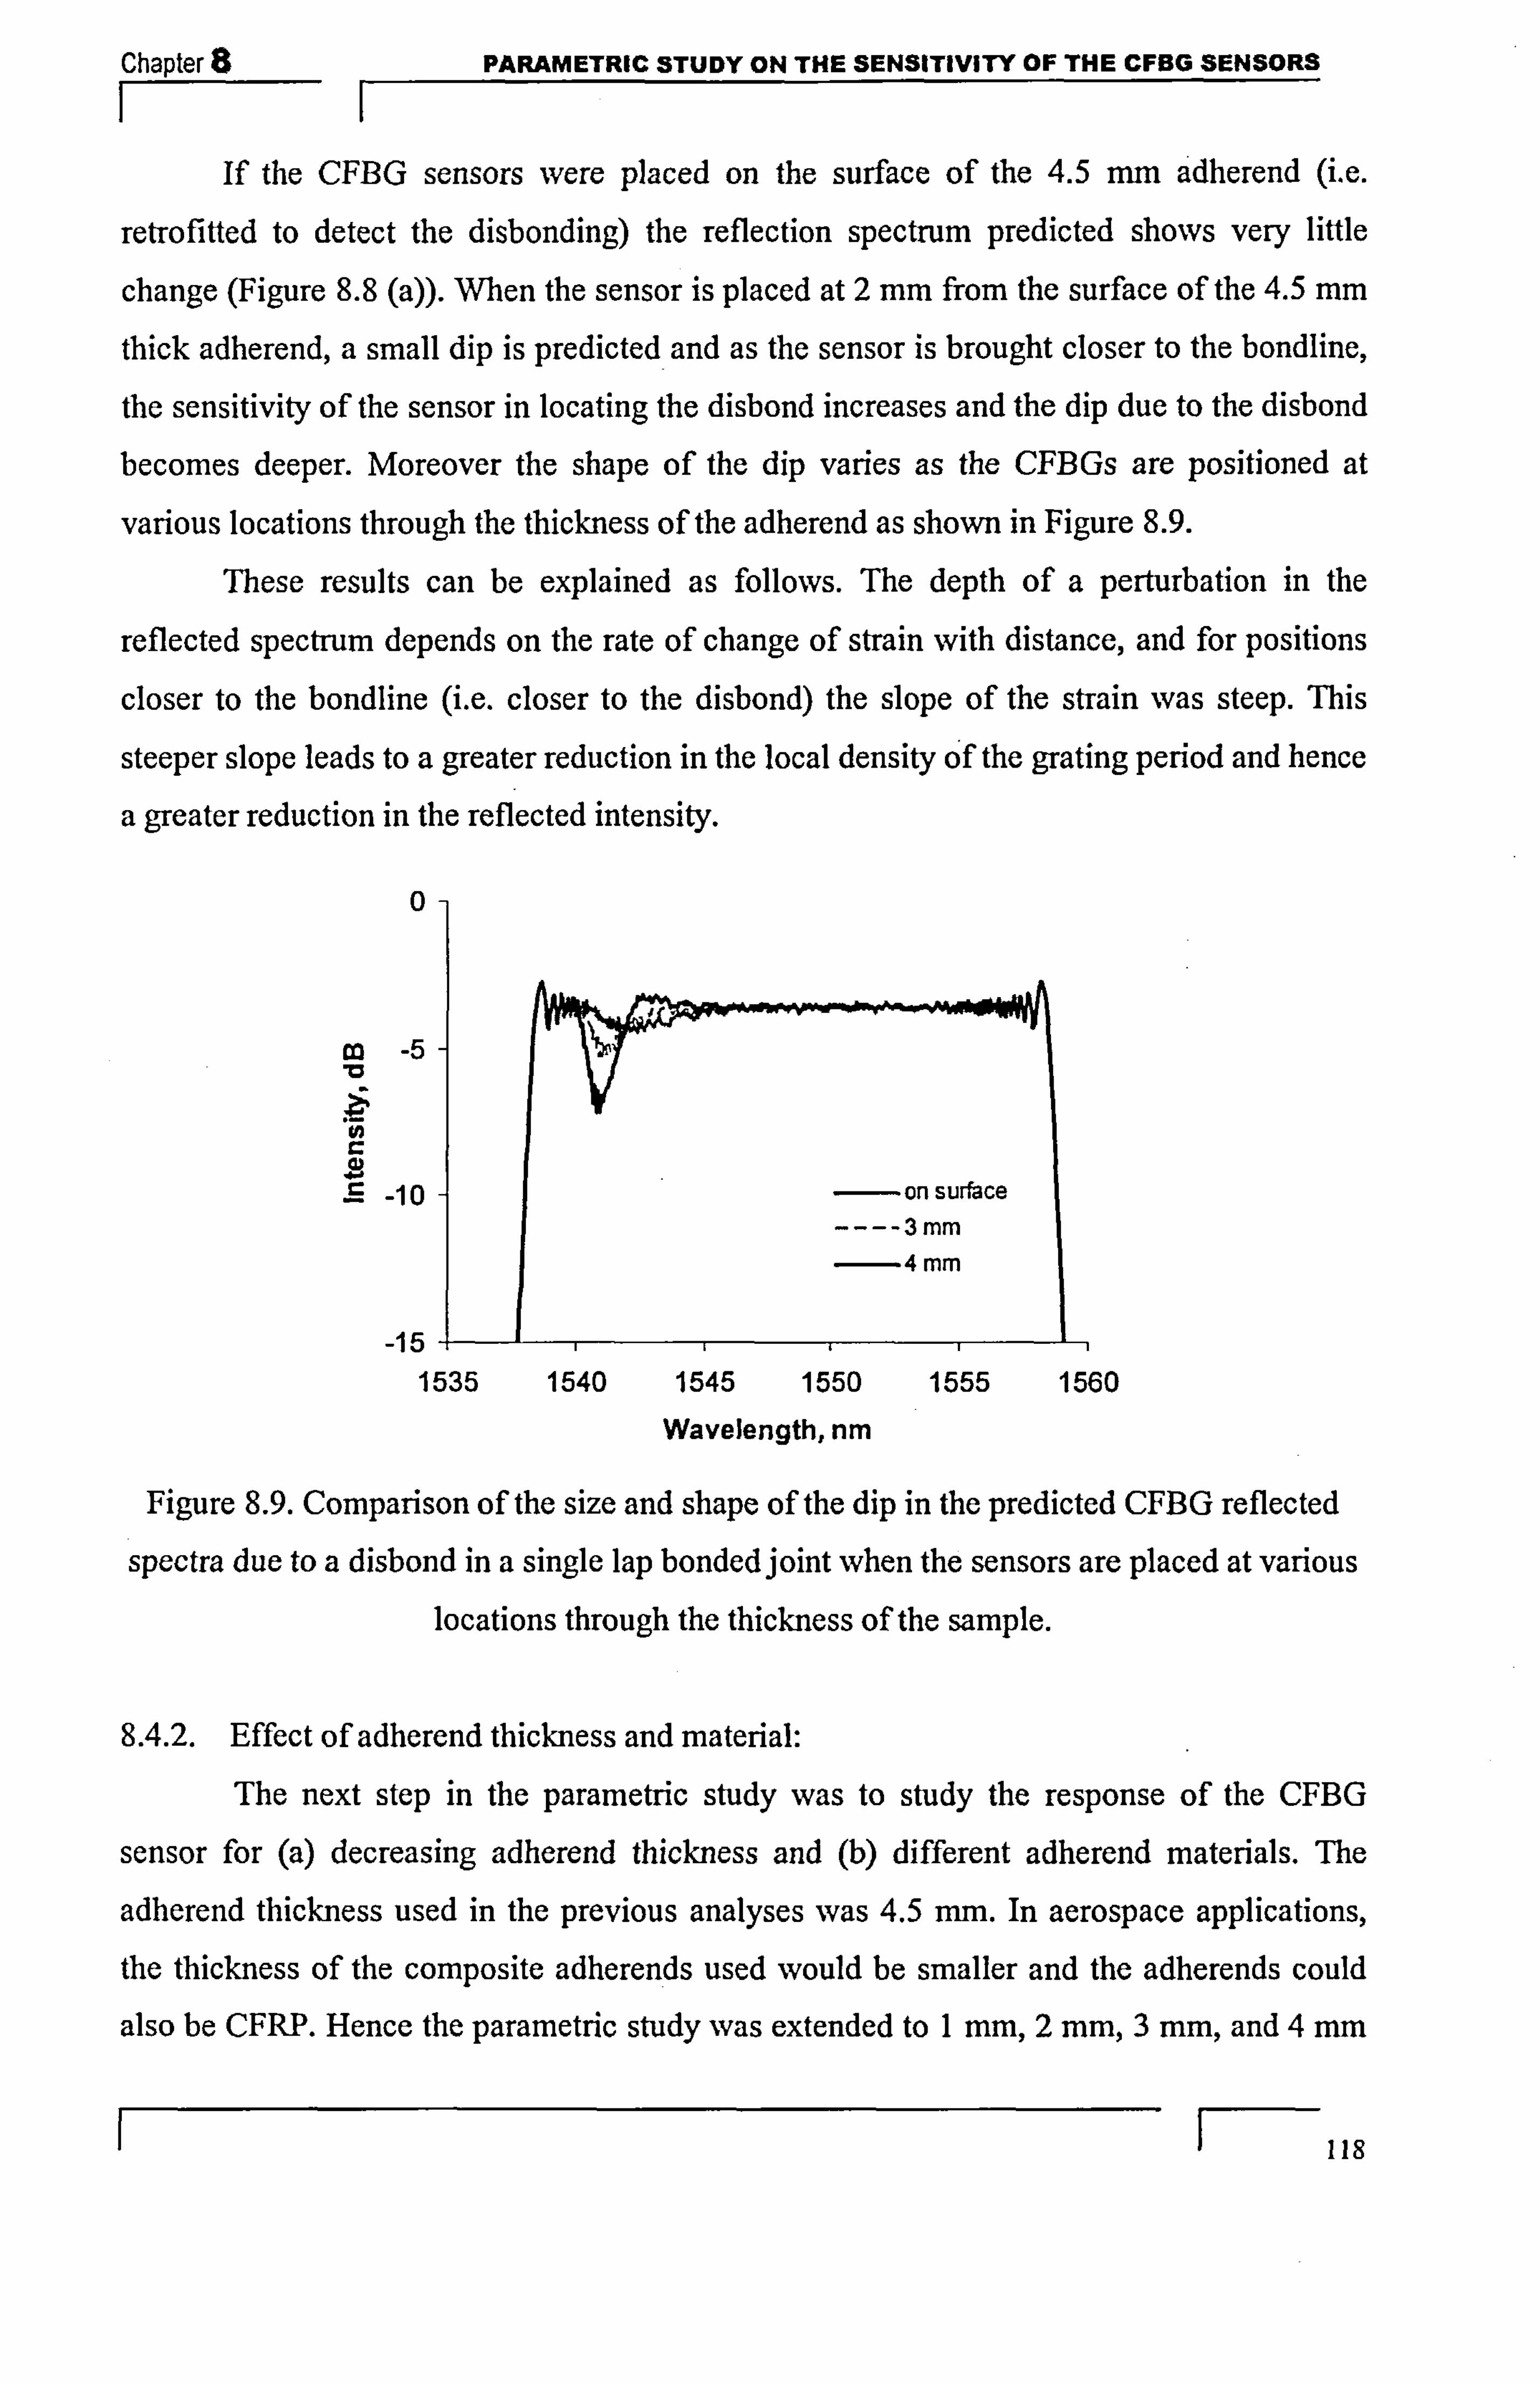
Chapter PARAMETRIC STUDY ON THE SENSITIVITY OF THE CFBG SENSORS
F- If the CFBG sensors were placed on the surface of the 4.5 mm adherend (i. e.
retrofitted to detect the disbonding) the reflection spectrum predicted shows very little
change (Figure 8.8 (a)). When the sensor is placed at 2 mm from the surface of the 4.5 mm
thick adherend, a small dip is predicted and as the sensor is brought closer to the bondline,
the sensitivity of the sensor in locating the disbond increases and the dip due to the disbond
becomes deeper. Moreover the shape of the dip varies as the CFBGs are positioned at
various locations through the thickness of the adherend as shown in Figure 8.9.
These results can be explained as follows. The depth of a perturbation in the
reflected spectrum depends on the rate of change of strain with distance, and for positions
closer to the bondline (i. e. closer to the disbond) the slope of the strain was steep. This
steeper slope leads to a greater reduction in the local density of the grating period and hence
a greater reduction in the refl ected intensity.
0
-5 Zý (I)
0 -10
-15 4- 1535
Wavelength, nm
Figure 8.9. Comparison of the size and shape of the dip in the predicted CFBG reflected
spectra due to a disbond in a single lap bonded joint when the sensors are placed at various locations through the thickness of the sample.
8.4.2. Effect of adherend thickness and material: The next step in the parametric study was to study the response of the CFBG
sensor for (a) decreasing adherend thickness and (b) different adherend materials. The
adherend thickness used in the previous analyses was 4.5 mm. In aerospace applications, the thickness of the composite adherends used would be smaller and the adherends could
also be CFRP. Hence the parametric study was extended to I mm, 2 mm, 3 mm, and 4 mm.
1 -- F-118
1540 1545 1550 1555 1560

Chapter 8 PARAMETRIC STUDY ON THE SENSITIVITY OF THE CFBG SENSORS II
thick GFRP adherends and then the use of a CFRP adherend was investigated.
0.0024
0.0020- t=l mm
-t=2 mm
0.0016- -t=3 mm
-t=4.5 mm 0.0012-
0.0008
0.0004
0.0000
-------------
05 10 15 20 25 30
postion along the overlap
Figure 8.10: Strain distribution in GFRP coupon of various thicknesses loaded at 5
kN and CFBG placed at 0.5 mm from the bondline
First, GFRP-GFRP bonded joints of various thicknesses were loaded to 5 kN and
the CFBG sensors were located 0.5 mm. from the bondline (i. e. for 1 mm, 2 mm, 3 mm, 4
mm and 4.5 mm thick adherends, the CFBG sensors are located at 0.5 mm, 1.5 nun, 2.5
mm, 3.5 mm and 4 mm from the free surface of the upper adherend respectively). The
strain distribution for the disbond length of 5 mm, obtained for these various thicknesses is
shown in Figure 8.10. Not surprisingly, the strain of the plateau in the distribution reduces
with increasing adherend thickness. In addition, the slope of the strain-distance distribution
became less steep as the thickness of the adherend was increased. The predicted reflection
spectra for theses distributions are shown in Figure 8.11. The CFBG sensor placed at 0.5
mm from the bondline in I mm. thick adherend shows a broad and deep dip at the position
of the disbond as shown in Figure 8.11 (a). For increasing adherend thickness, the dip in
the CFBG reflected spectra becomes less deep and also narrower (Figure 8.11 (b) and (c)).
The superposition of these CFBG reflection spectrums, as shown in Figure 8.11 (d), clearly
shows the change in the depth and width of the dip for various adherend thicknesses. It can be noted that the shape of the dip at all these thickness remained the same and symmetrical. The depth and the width of the dip in the reflection spectra depends on the slope and extent
of the slope along the distance respectively.
119

Chapter 1
0
-5
-15
PARAMETRIC STUDY ON THE SENSITIVITY OF THE CFBG SENSORS
a) I mm thick adhercnd 0
b) 2 mm thick adherend
-5
-10
-15
d) superposition of all thickness 0
.5
-10
-15
-204- 1535
0
.5 w
-10
-15
-20 1. 'L-A 1540 1545 IS50 1555 1560 1535 1540 1545 1550 1555 1560
Wavelength, nrn Wavelength, nrn
Figure 8.11. Predicted reflected spectrum for various thick adherend, all loaded at 5 kN and CFBG placed at 0.5 mm from the bondline.
Next, the possibility of detecting a disbond in high modulus CFRP materials was investigated. Initially a study on 4.5 mm thick CFRP adherend loaded to 5 kN was made as the experimental study are for 4.5 mm thick GFRP adherend loaded to 5M Unidirectional
T800IV3631 CFRP laminate with the Young's modulus of 148 GPa [Okabe et al, 2004]
was chosen for the study. The other parameters were maintained constant and a comparison
of the strain distributions for the GFRP and CFRP adherends are plotted in Figure 8.12.
Figure 8.12 shows the comparison of strain along the overlap length at the position 0.5 mm from bondline for a GFRP adherend and a CFRP adherend. Since the load was maintained
constant and the Young's modulus of the CFRP is higher than the GFRP, the plateau strain
over the length of the overlap was reduced. The CFRP strain distribution rises less steeply
with distance and as a result the reflection spectrum predicted from these strain distributions shows a smaller perturbation at the position of disbond for the CFRP coupon
120
-20 1.1 1535 1540 1545 1550 1555 15W
Wavelength, nm
-20 1' 1535 1540 1545 1550 1555 1560
Wavelength, nm
c) 3 mm thick adherend
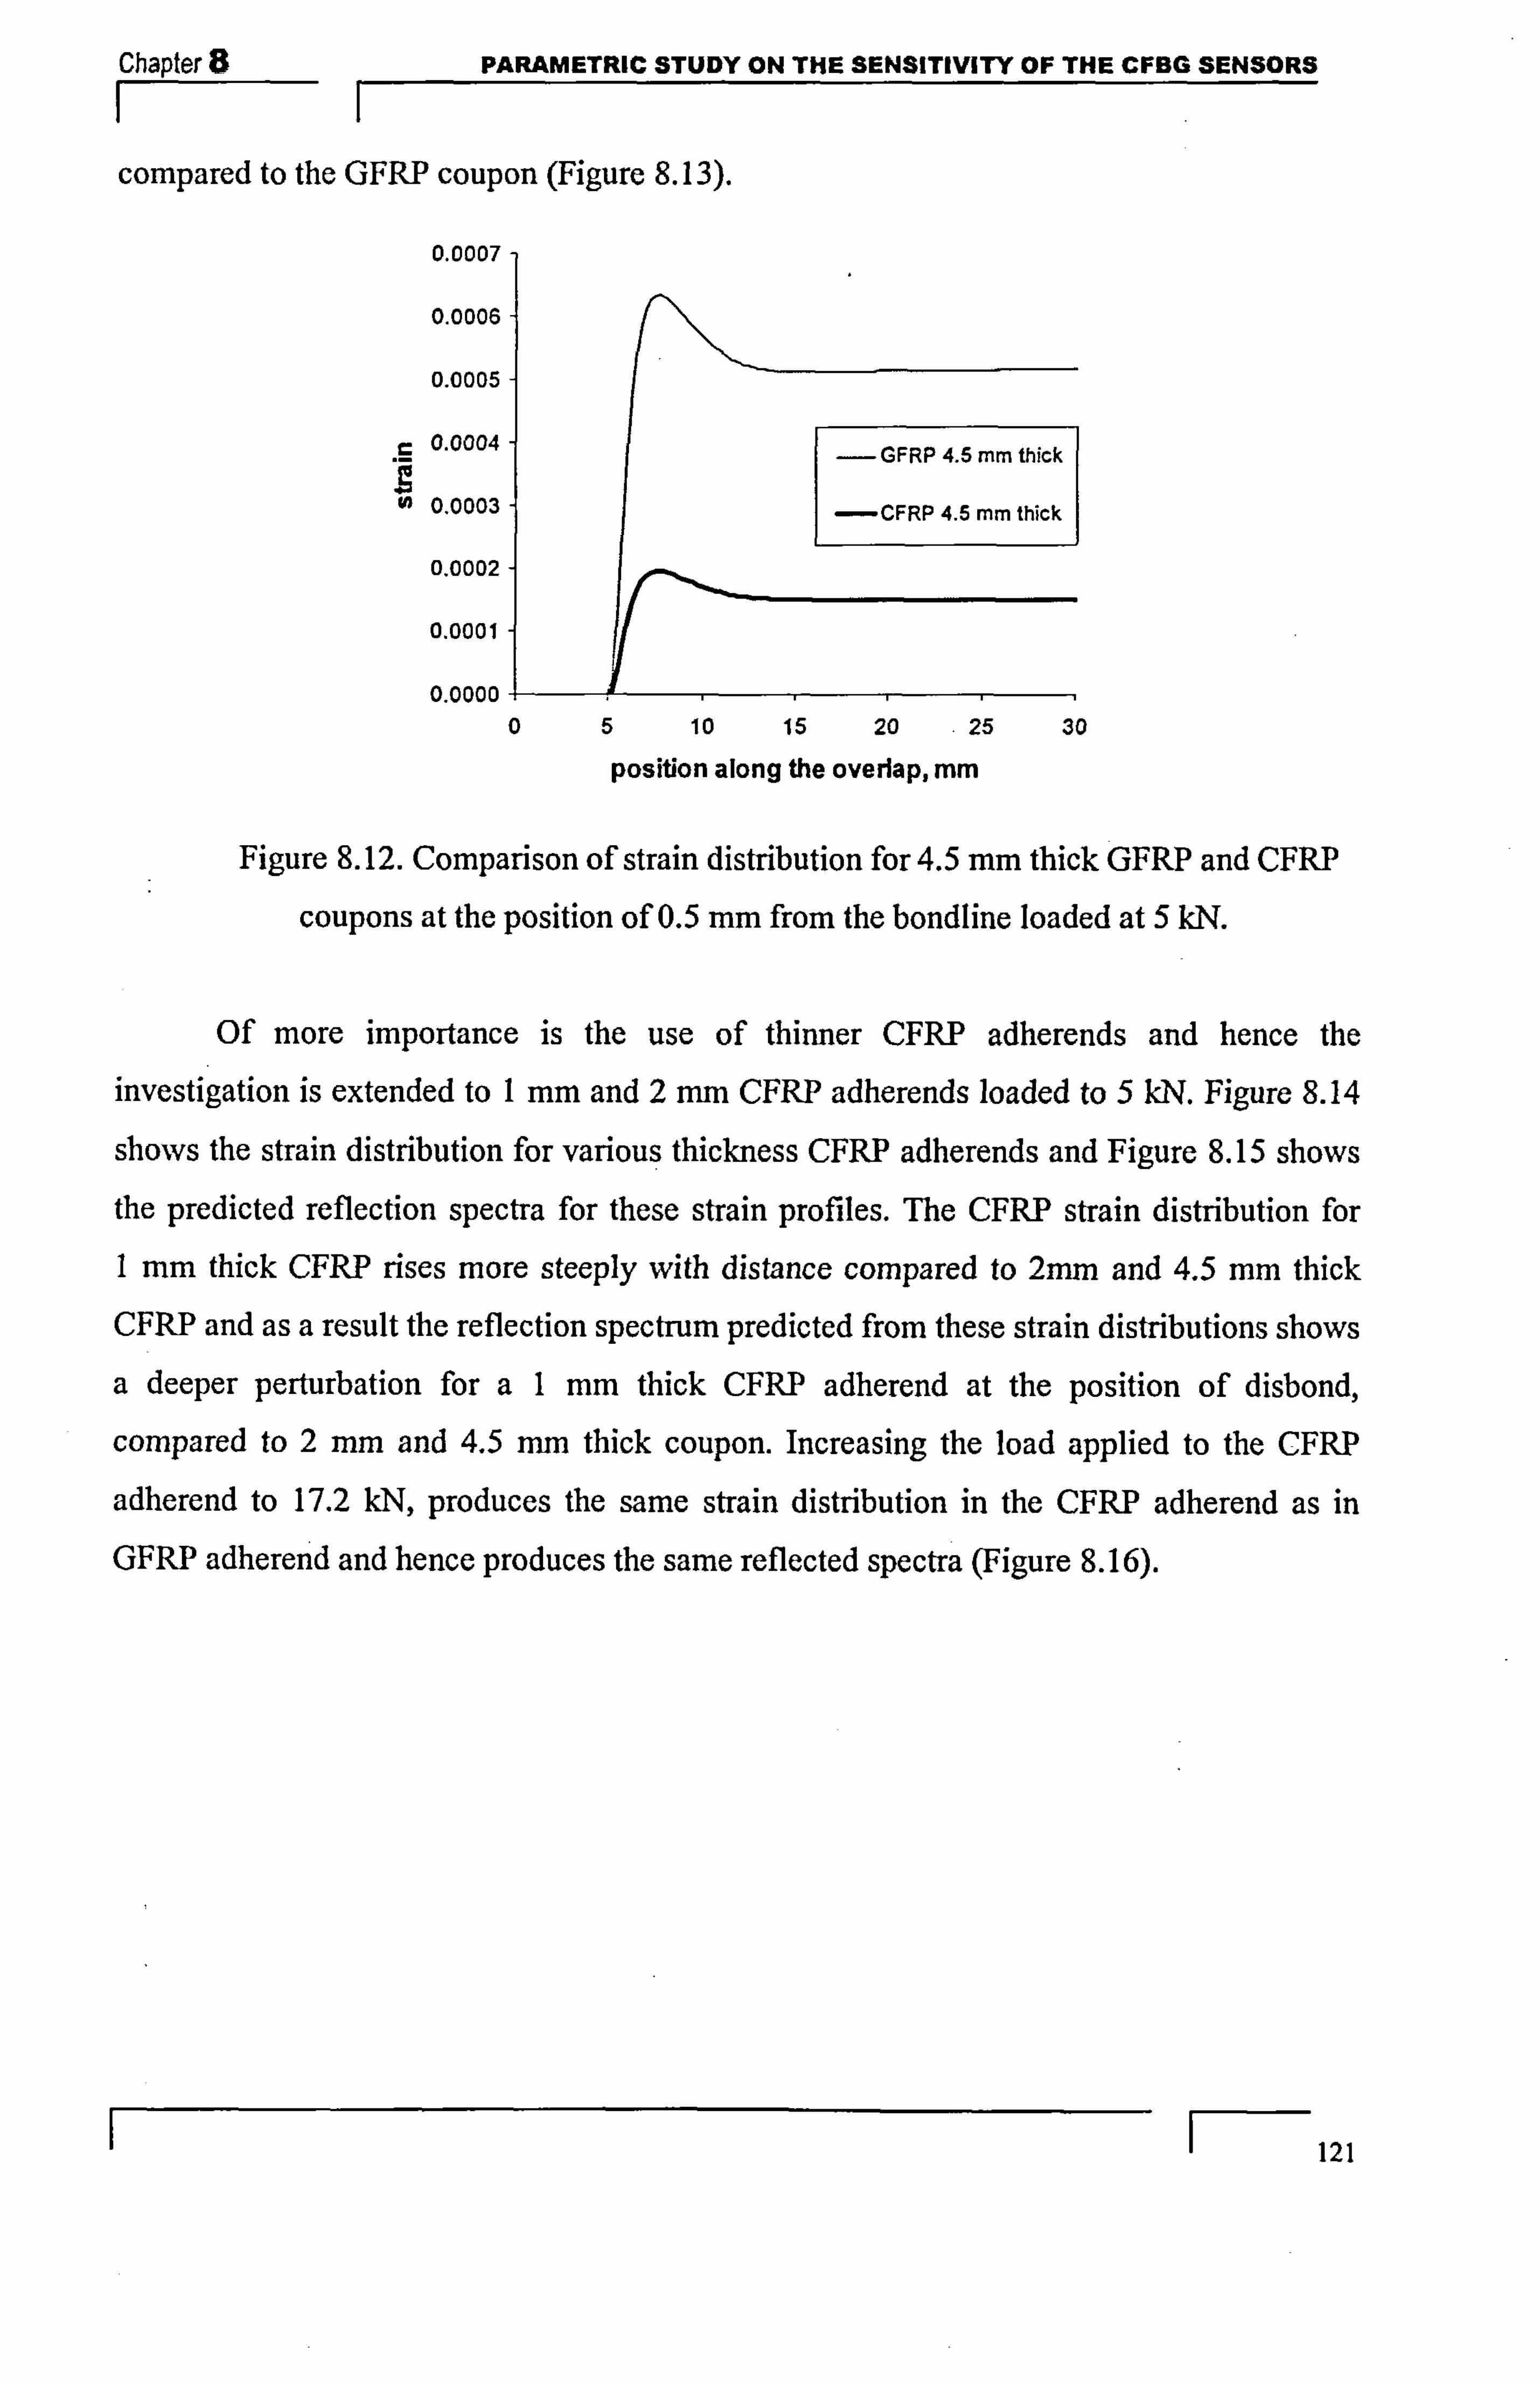
Chapter 8 PARAMETRIC STUDY ON THE SENSITIVITY OF THE CFBG SENSORS
compared to the GFRP coupon (Figure 8.13).
0.0007
0.0006
0.0005
r 0.0004
0.0003
0.0002
0.0001
0.0000
Figure 8.12. Comparison of strain distribution for 4.5 mm thick GFRP and CFRP
coupons at the position of 0.5 mm from the bondline loaded at 5 kN.
Of more importance is the use of thinner CFRP adherends and hence the investigation is extended to I mm. and 2 min CFRP adherends loaded to 5 W. Figure 8.14
shows the strain distribution for various thickness CFRP adherends and Figure 8.15 shows the predicted reflection spectra for these strain profiles. The CFRP strain distribution for
I mm. thick CFRP rises more steeply with distance compared to 2nim and 4.5 mm thick CFRP and as a result the reflection spectrum predicted from these strain distributions shows
a deeper perturbation for aI min thick CFRP adherend at the position of disbond,
compared to 2 min and 4.5 mm thick coupon. Increasing the load applied to the CFRP
adherend to 17.2 kN, produces the same strain distribution in the CFRP adherend as in
GFRP adherend and hence produces the same reflected spectra (Figure 8.16).
I F--121
05 10 15 20 25 30
position along the overlap, mm
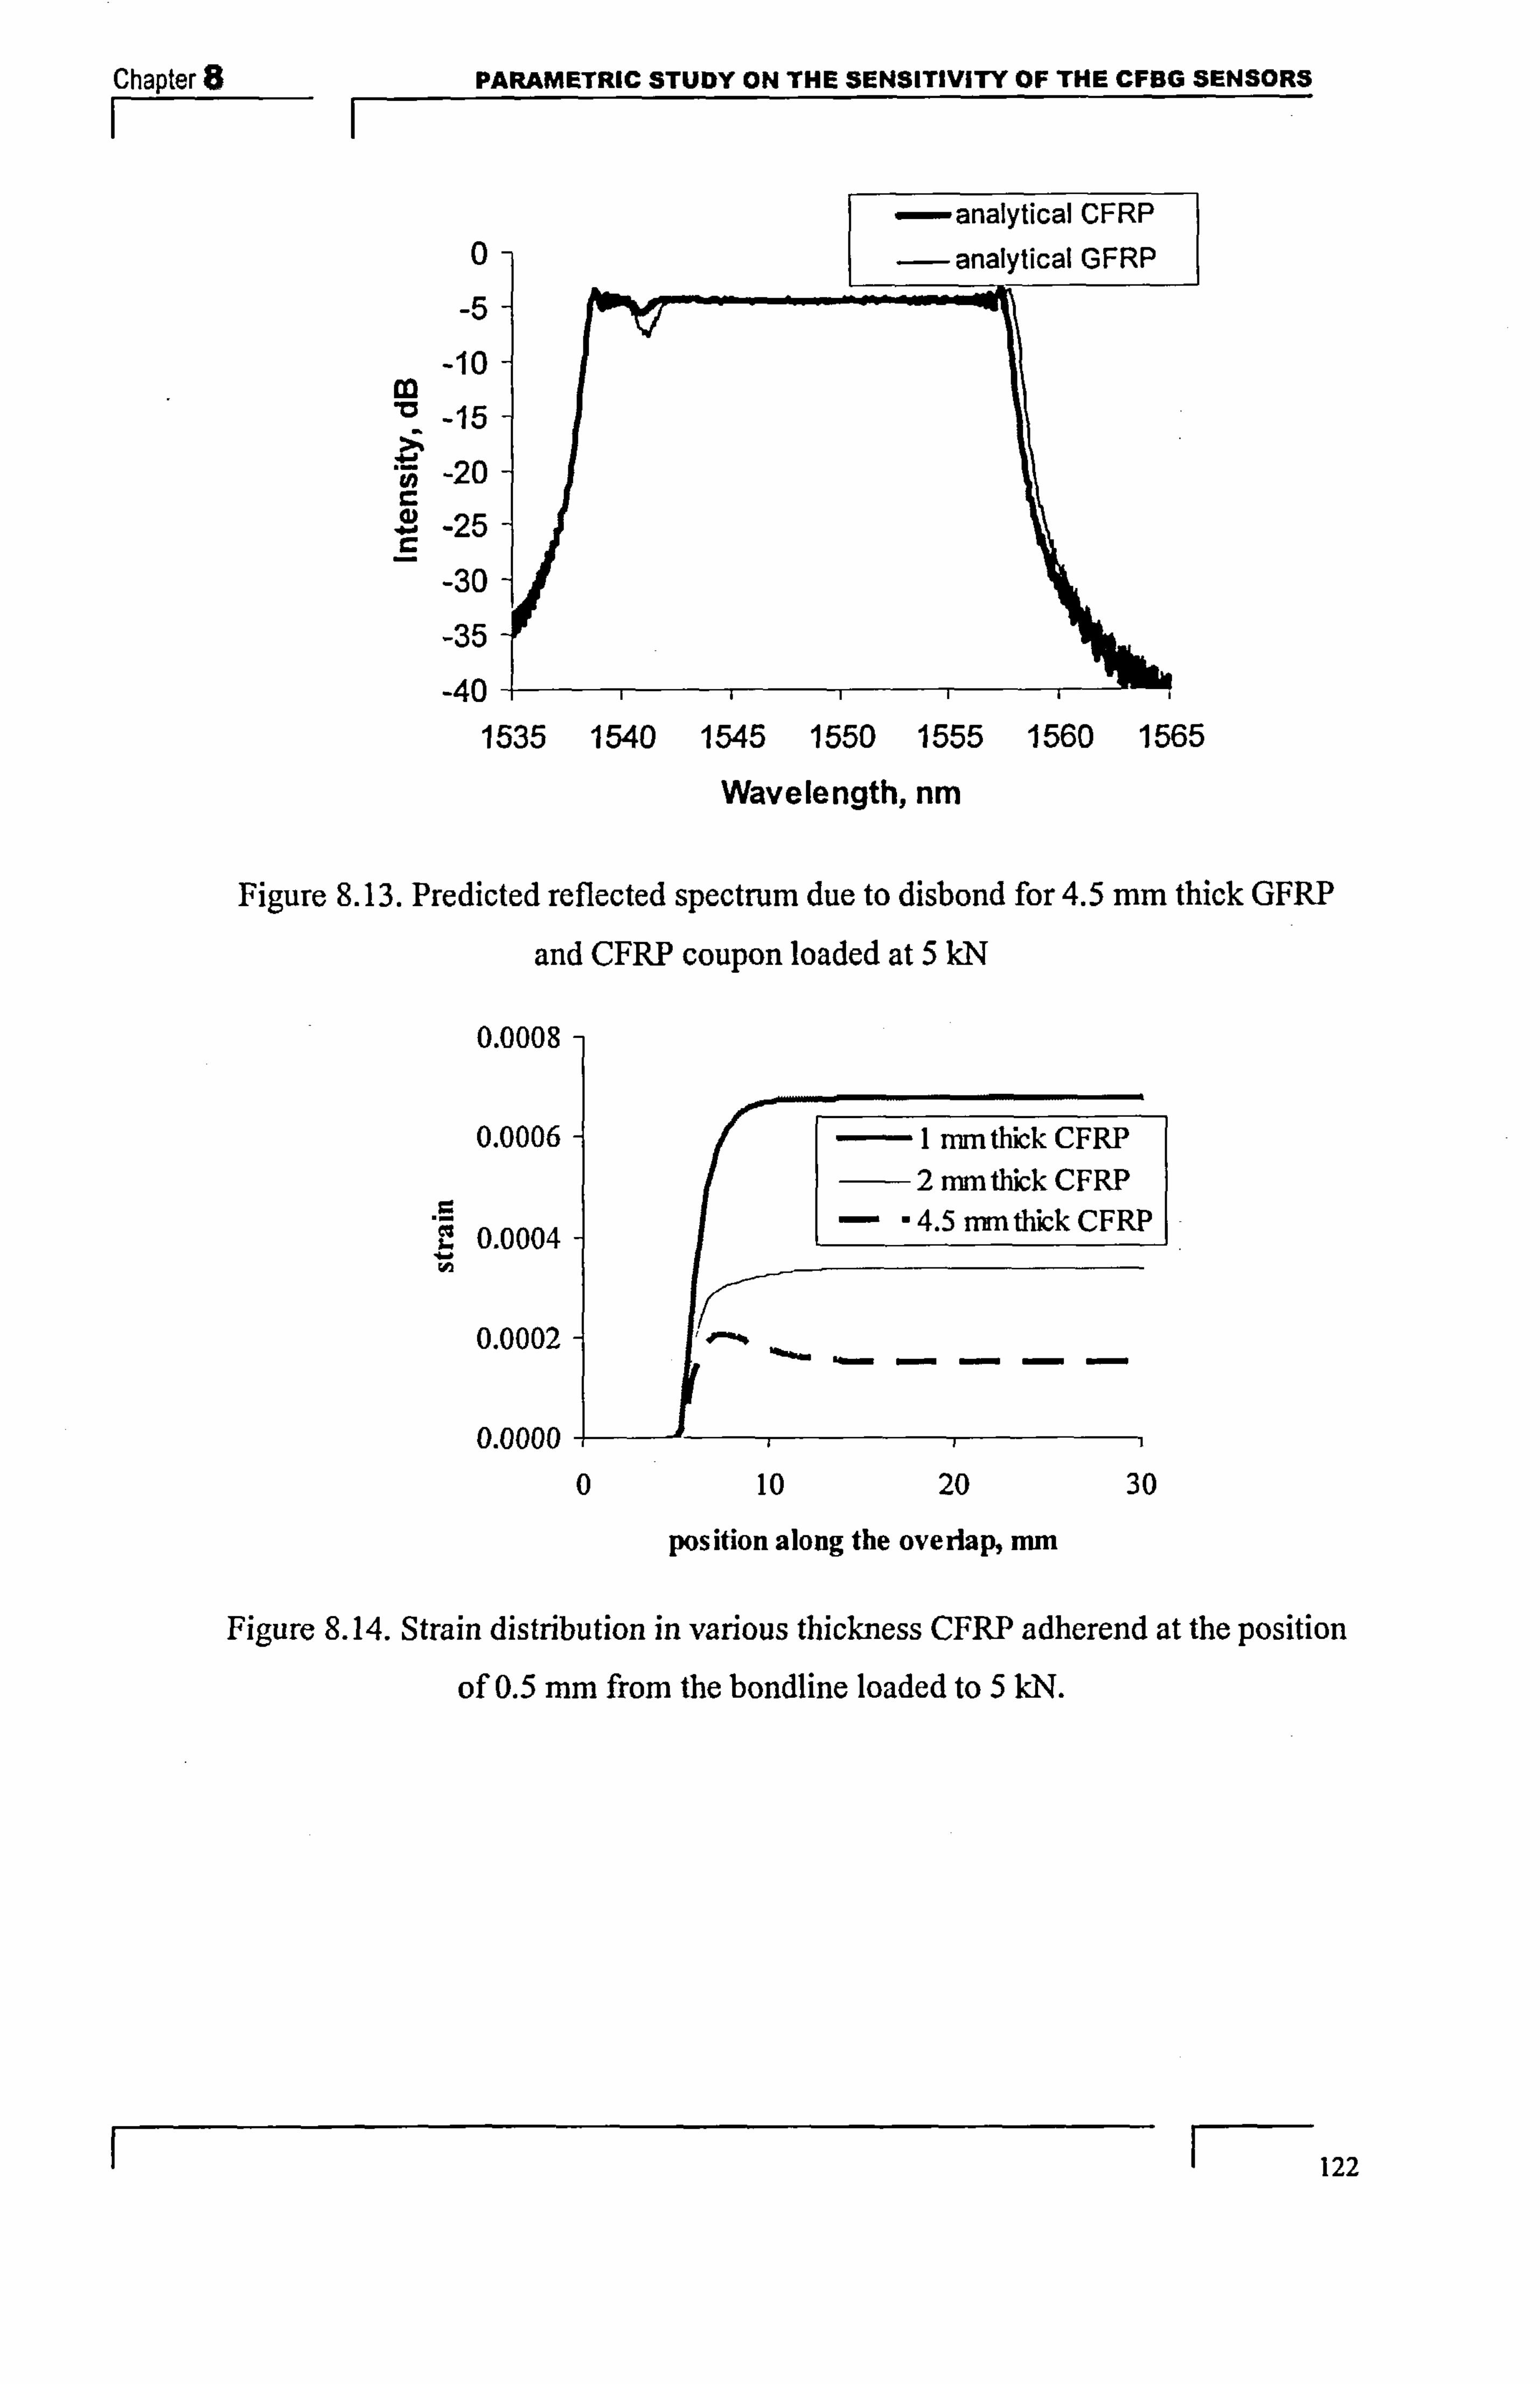
Chapter 8 PARAMETRIC STUDY ON THE SENSITIVITY OF THE CFBG SENSORS II
0-
' -15-
-20
-25-
-30 -
-35 -
-40-, 1535
Figure 8.13. Predicted reflected spectrum due to disbond for 4.5 mm thick GFRP
and CFRP coupon loaded at 5 kN
0.0008
0.0006 -I nan thick CFRP 2 mm thick CFRP
5 4.5 mm thick CFRP 0.0004 -
0.0002 1 li #-%
0.0000 0 10 20 30
position along the overiap, mm
Figure 8.14. Strain distribution in various thickness CFRP adherend at the position
of 0.5 mm from the bondline loaded to 5 kN.
F- 122
1540 1545 1550 1555 1560 1565
Wavelength, nm
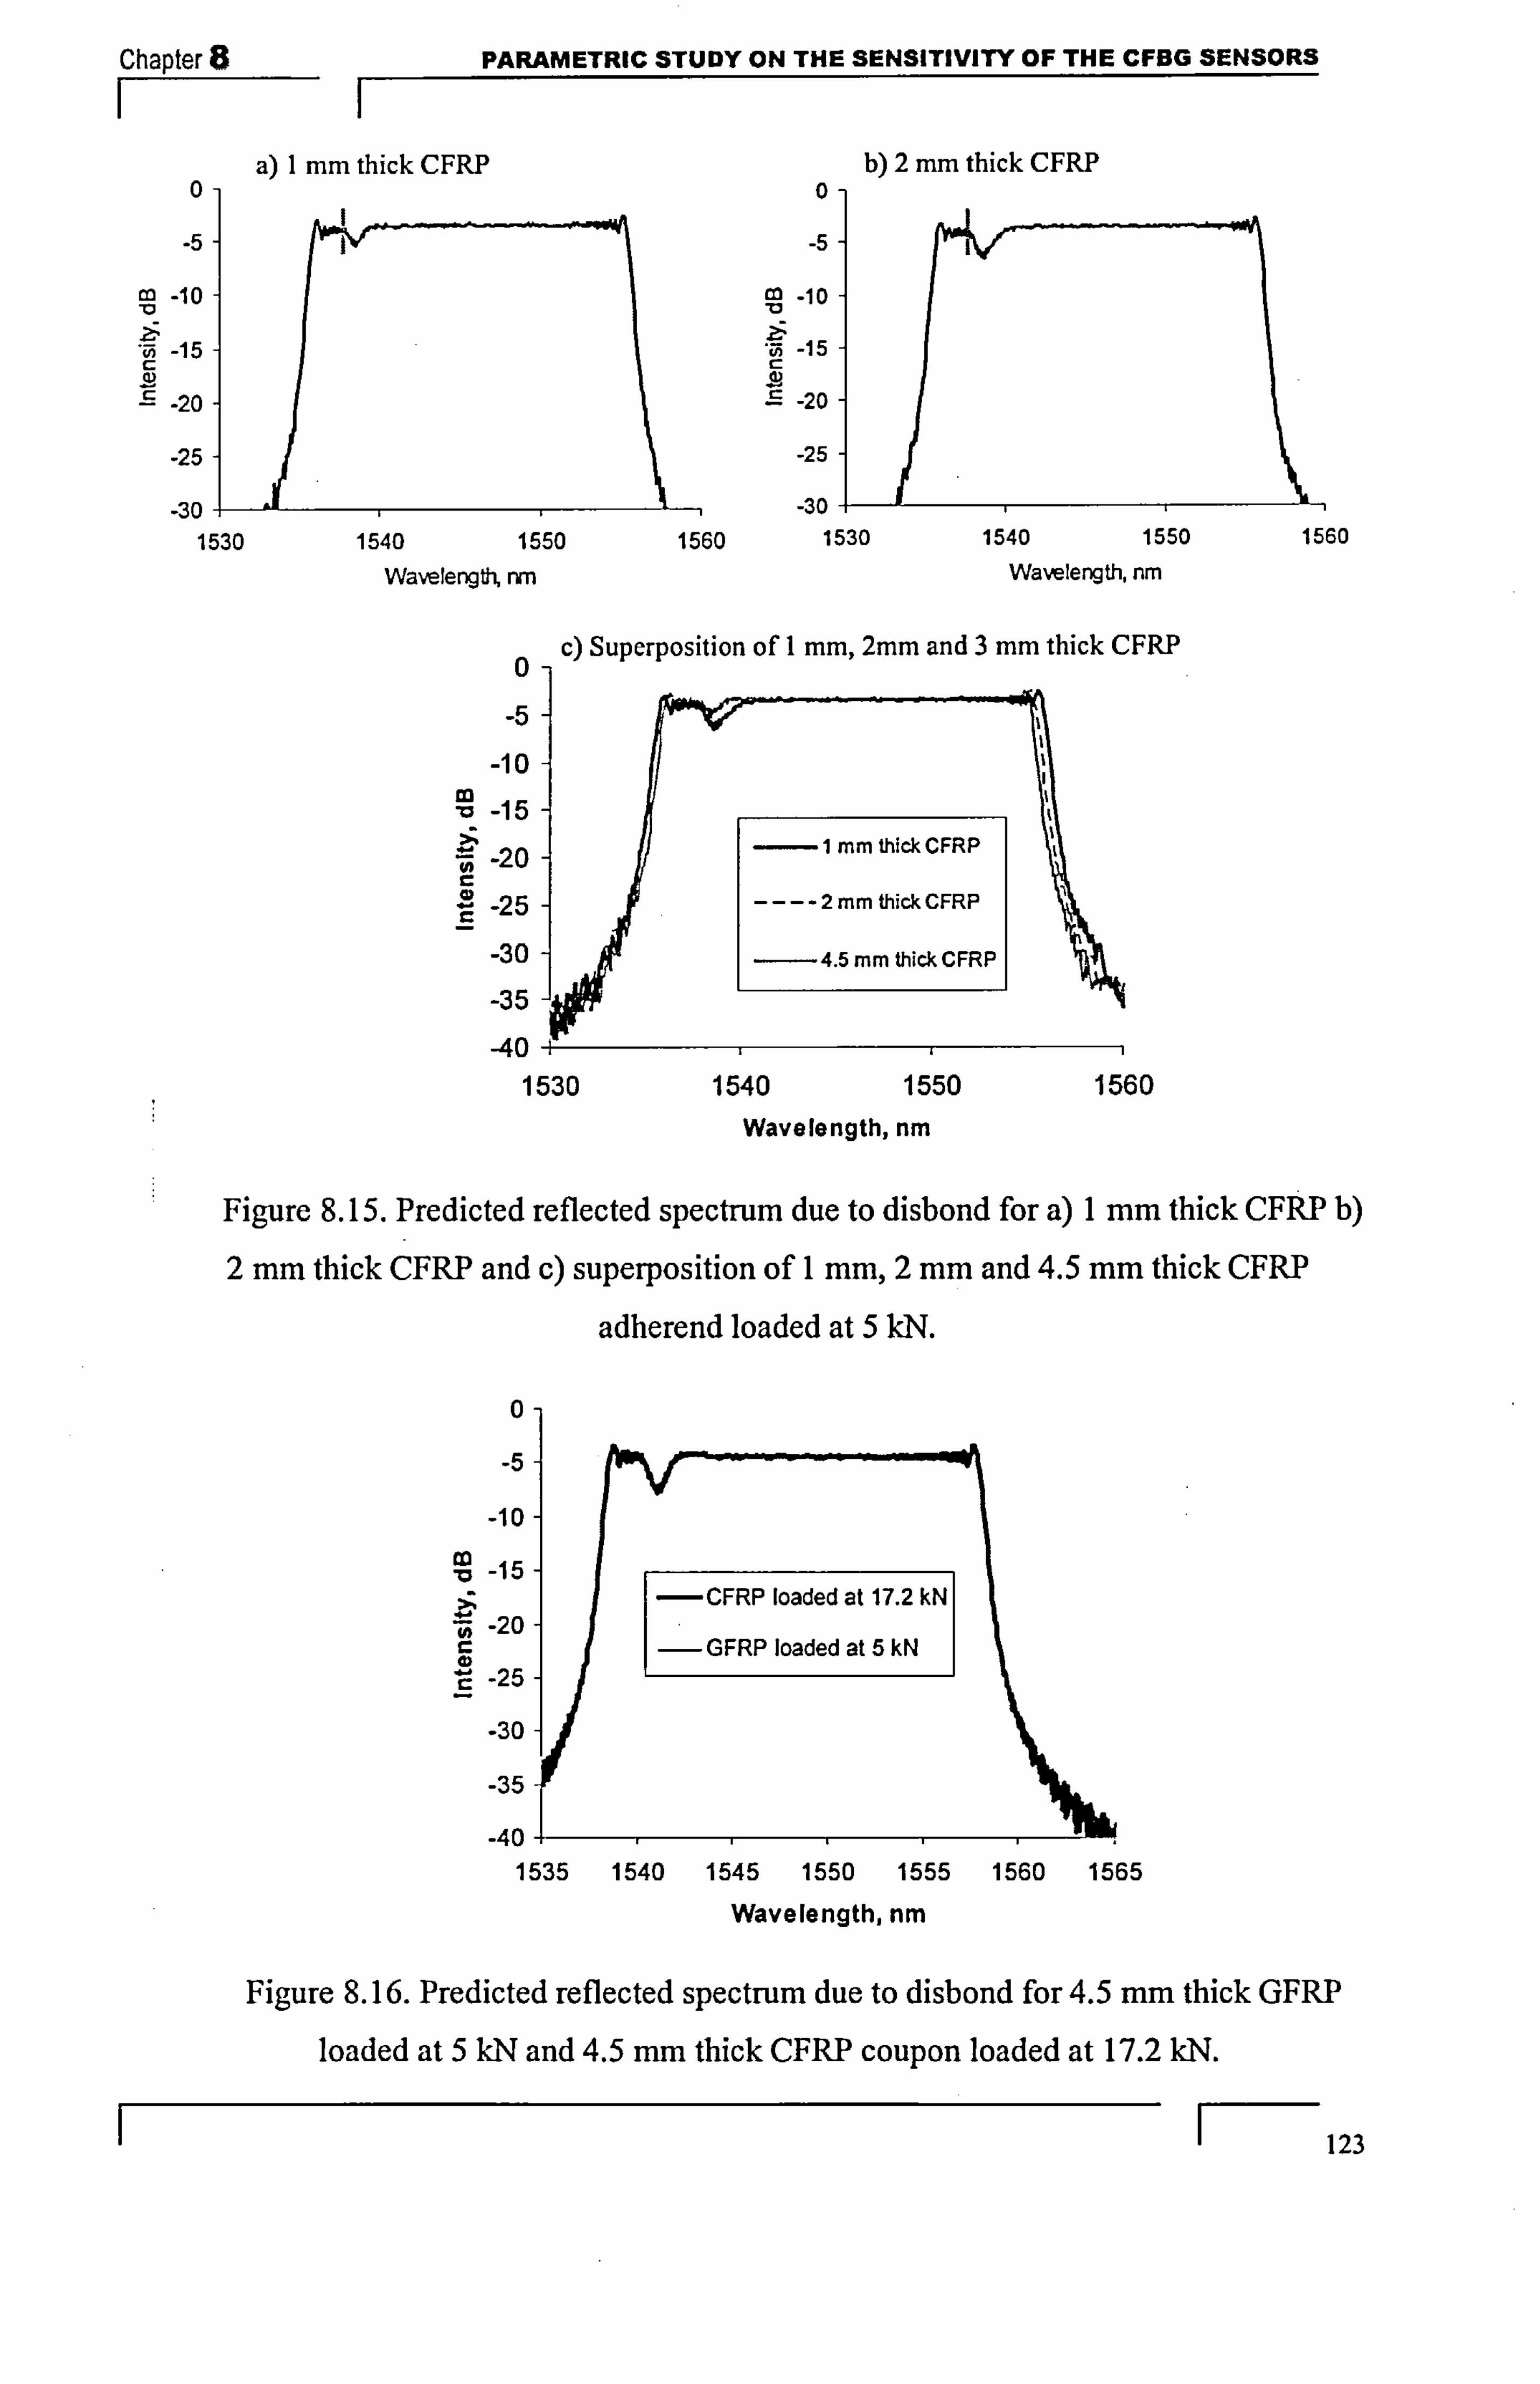
Chapter 8 PARAMETRIC STUDY ON THE SENSITIVITY OF THE CFBG SENSORS II
a) I mm thick CFRP b) 2 mm thick CFRP 0-
-5 -
-10
-15 -
-20 -
-25 -
-30 -- 1530
-5
-10
-15 -0
-20
-25
-30 1530
0 c) Superposition of I mm, 2mm and 3 mm thick CFRP
-5
-10 -
-15 1 mm thick CFRP
-20
5 -25 ----2 mm thick CFRP
-30 -4.5 mm thick CFRP
-35
-40-1 1530 1540 1550 1560
Wavelength, nm
Figure 8.15. Predicted reflected spectrum due to disbond for a) I mm thick CFRP b)
2 nun thick CFRP and c) superposition of I mm, 2 mm and 4.5 mm. thick CFRP
adherend loaded at 5 kN.
0-
-5-
-lo- co 15-
-CFRP loaded at 17.2 M R -20-
[ !: :
F
- GF P loaded at 5M R
-25-
-30-
-35
-40 1535 1540 1545 1550 1555 1560 1565
Wavelength, nm
Figure 8.16. Predicted reflected spectrum due to disbond for 4.5 mm thick GFRP
loaded at 5 kN and 4.5 mm thick CFRP coupon loaded at 17.2 kN.
F-123
1540 1550 1560 Wavelerqttý nn
1540 1550 1560
Wavelength, nm

Chapter 8 PARAMETRIC STUDY ON THE SENSITIVITY OF THE CFBG SENSORS
8.4.3. Surface mounting of CFBG sensor:
In section 8.4.1, the possibility of locating a disbond when a sensor was mounted on
the surface of a 4.5 mm GFRP adherend was investigated and it was found that the sensor
would provide no clear information on the disbond. In the next section (section 8.4.2), it
was noted that for a thin GFRP adherend, a CFBG placed close to the bondline could
clearly indicate the position of a disbond. Hence in this section, the possibility of mounting
the CFBG sensor on the surface is explored.
0.0024-
0.0020- t=l mm t=l mm t=2 mm t=2 mm
0.0016- _ t=3 mm -t=3 mm E- . t=4 mm --- t=4 mm
0.0012 1
0.0008
0.0004 11 //1
------------
0.0000 05 10 15 20 25 30
postion along the overlap, mm
Figure 8.17. Strain distribution at the surface of the adherend for I mm, 2 mm, 3 mm and 4
mm thick GFRP coupons with a disbond loaded at 5 kN.
An analytical model has been investigated for the CFBG placed on the surface ( i. e.
x--O mm) for aI mm, 2 mm, 3 mm and 4 mm thick GFRP adherend. In each case, the
adherend is loaded at 5 kN with a disbond of 5 mm. The other parameters are maintained
the same as shown in Table 8.1. Figure 8.17 shows the strain distribution along the length
of overlap at the surface of the adherend for the various adherend thicknesses. It can be
seen that the slope of the strain-distance curve, is steeper for thinner specimens. The CFBG
reflection spectra predicted using these strain profiles are shown in Figure 8.18 and the
thinner specimen shows a clear dip at the position of the disbond. Hence, these results
suggest that surface mounting of CFBG sensors is possible for disbond detection and is
most likely to be successful with thinner adherends.
F-124

Chapter 8 I
a) I mm
0
-20
-30
-4 1530
3 mm
0-
-10
0 -2
-30
-40-4
0
Co -lo 'lý e *ýi -20
-30
40 1 1530 1540 1550 1560 1570 1530 1540 1550 1560 1570
Wavelength, nrn Wavelength, nrn
Figure 8.18. Predicted reflected spectrum due to disbond when CFBG placed at the
surface of a) I mm adherend, b) 2 mm adherend, c) 3 mm adherend and d) 4 mm
adherend, loaded at 5 kN
8.5. CONCLUSIONS
The conclusions which can be drawn from this Chapter are as follows
1) The predicted CFBG reflection spectra obtained using Goland and Reissner solution for the adherend strains are similar to the predicted CFBG reflected spectra using from FE
strain modeling. 2). The sensitivity of the CFBG sensor to detect and locate the disbond with a thick
adherend depends on the position of the sensors through the thickness of the adherend. A
CFBG sensor placed closer to the bondline detects a disbond in a single lap bonded joint
more easily. 3) The sensitivity of the CFBG sensor to detect and locate the disbond depends mainly
on (i) the strain distribution in the adherend and (ii) the position of the sensor with respect to the bondline.
PARAMETRIC STUDY ON THE SENSITIVITY OF THE CFBG SENSORS
b) 2 mm
-20
-30
-40 1530
d) 4 mm
F- 125
1540 1550 1560 1570
Wavelength, nm
1540 1550 1560 1570
Wavelength, nm

Chapter PARAMETRIC STUDY ON THE SENSITIVITY OF THE CFBG SENSORS
4) Disbond in a thin adherend could be detected using a CFBG sensor mounted on the
surface. This would open up a new technology of retrofitting a CFBG sensor system for
disbond detection in thin bonded joints.
8.6. SUMMARY
In this Chapter a parametric study has been carried out on various parameters (adherend thickness, material and CFBG location) affecting the sensitivity of CFBG
sensors for detecting disbonds. In the next Chapter, the possibility of detecting
manufacturing defects using the CFBG sensor technique is explored.
1 126
Chapter 9 MANUFACTURING DEFECT DETECTION IN BONDED JOINT USING CFBG SENSOR
CHAPTER, 9 .X ý7
MANUFACTURING DEFECT DETECTION IN
AN ADHESIVELY BONDED COMPOSITE JOINT
USING THE CFBG SENSOR
9.1. INTRODUCTION
In Chapters 6 and 7 it was demonstrated that it is possible to detect a disbond that
initiates during fatigue loading and locate the disbond front using a CFBG sensor. In this
chapter, the possibility of detecting a defect, introduced during the manufacture of a bonded
joint is explored.
9.2. RESPONSE OF CFBG SENSOR TO MANUFACTURING DISBOND
GFRP-GFRP composite single lap bonded joints were manufactured with an artificial
disbond. The artificial Teflon insert with dimensions 12 mm long 0.25 mm thick which
extends across the full width of the joint was placed at the centre of the joint ( see Figure 9.1)
As usual, one of the adherends had an embedded CFBG sensor at the interface of the 00 and
90' plies closest to the bond line. CFBG sensors with a length of 60 mm (chirp rate: 2.25
nm/cm) were used with the low wavelength end of CFBG terminating at the cut end of the
adherend. The 60 mm. sensor extended the full length of the overlap (further fabrication
details are presented in Chapter 4).
The reflection spectrum from a 60 mm CFBG sensor recorded unloaded before and
after joint manufacture is shown in Figure 9.2. For this particular sensor, the reflected
spectrum increases in intensity from the low to the high wavelength end, but this is a
characteristic of this particular sensor which does not affect the results. The insert does not
process any variation in the reflection spectrum recorded unloaded after manufacture of the
bonded joint. The insert length and its position from the low wavelength end of CFBG were
measured directly since the bonded joint is transparent. The position of the insert with respect
to the reflected spectrum was calculated in the unloaded reflection spectrum using the
relationship between the optical bandwidth at full width at half maximum (FWHM) and a
11 127

Chapter 9 MANUFACTURING DEFECT DETECTION IN BONDED JOINT USING CFBG SENSOR
F- 1 60 mm sensor length. The location of the disbond length in the reflection spectrum of the
unloaded joint is shown in Figure 9.3. But the unloaded spectrum does not give a clear indication of position of disbond defect (shown between two small vertical lines).
Figure 9.1. Bondedjoint with 12 mm Teflon insert in the bondline at the centre of the joint.
-15
-20
im
-25
-30
-35
-15
-20
ra
-25
-30
-35
-40 -40 1530 1535 1540 1545 15M 1555 1560 1530 1535 1540 1545 1-550 1555 1560
Wavelength, nrn Wavelength, nrn
Figure 9.2. Unloaded reflection spectrum from 60 mm CFBG sensor (a) before bonded (b)
after bonded with the artificial disbond.
-15
-20 to
-25
-30
-35
-40 1 1530 1535 1540 1545 1550
Wavelength, nm
1555 1560
Figure 9.3. Location of the disbond length in the 60 mm CFBG reflection spectrum of
unloadedjoint.
1 128

Chapter! 9 MANUFACTURING DEFECT DETECTION IN BONDED JOJNT USING CFBG SENSOR
F- I The reflection spectra were then recorded with the bonded joint under tensile loads of
5 kN and 9 kN and these are shown in Figure 9.4 and Figure 9.5 respectively. When the
bonded joint with the artificial defect was loaded to 5 kN, the CFBG reflection spectrum developed a region of increased intensitywhich corresponds to the sensor position (see Figure
9.4). This region of increased intensity is clearer when the bonded joint is loaded to 9 kN, as
shown in Figure 9.5. It can be seen that the region of enhanced intensity in the reflection
spectrum corresponds approximately to the location of the defect. However, to understand the
effect of the manufacturing defect on the CFBG reflection spectrum, modelling was
undertaken which is discussed in the next section (section 9.3). The modelling was carried out
using FEA analysis (to predict the strain distribution in the composite bonded joint due to the
disbond) and the CFBG reflected spectra were predicted using OptiGrating.
-15-
-20- im
-25-
-30-
-351
-40
r
1530 1535 1540 1545 1550 1555 1560
Wavelength, nm
Figure 9.4. Reflection spectrum showing the location of the artifical. disbond for bonded joint
loaded at 5 kN
-15-
-20-
-25 -
-30 -
-35
40 1530 1535 1540 1545 1550 1555 1560
Wavelength, nm
Figure 9.5. Reflection spectrum showing the location of the artifical disbond for bonded joint
loaded at 9 kN
129
Chapter 9 MANUFACTURING DEFECT DETECTION IN BONDED JOINT USING CFBG SENSOR
F- I 9.3. MODELLING AND PREDICTIONS
The FE modelling of the strain distribution in the joint as a consequence of the
disbond was carried out by my colleague Capell (private communication). A 2D model of
GFRP-GFRP bonded joint with a bond defect was modelled in ABAQUS as a void at the
interface using the dimensions shown in Figure 9.1. The properties used for the composite
and the adhesive were the same as shown in Tables 5.1 and 4.4 respectively. The longitudinal
strain was extracted from the model for applied loads of 5 kN and 9 kN, along a line
corresponding to the position of the optical fibre within one of the adherends. Figure 9.6 and
9.7 shows the strain extracted from the FE model along the 60 mm overlap for loads of 5 kN
and 9 kN. The strain at the end of the overlap of the bondedjoint which is adjacent to the low
wavelength end of the sensor increases from zero as the load transfer occurs. The strain
reaches a plateau region of roughly constant strain as the load is shared equally between the
adherends. This plateau region continues until it is disturbed by the defect in the adhesive layer. As there is a void at the adhesive layer (i. e. there is no bond between the adherends),
the load cannot be shared equally at the disbond region and load transfer occurs at both
disbond ends. However, due to the bending produced by the offset of the joint (see Figure
9.8), the load distribution is complex and the strain experienced is slightly higher at the edge
of the disbond closer to the end of the adherend (at A) and lower at the edge of the disbond (at
B). This strain distribution is also seen at the same distance ftom the bondline in the other
adherend, except that the lower strain is now seen at A and higher strain is at B. Moving away from the disbond, the strain returns to its plateau value. Reflected spectra were predicted ftom
the strain distribution in Figure 9.6 and 9.7 using the method of modification of the refractive index and grating period as a consequence of the strain profile using the OptiGrating
software. Figure 9.9 shows the CFBG predicted spectra for the applied loads of 5 kN and 9
kN. In the predicted reflection spectra an increased intensity can be seen corre sponding to the
defect position. The rapid strain changes at the ends of the defect lead to decreased intensity
in the reflected spectra (small dips) which indicates the position of the defect reasonably well. The position of the defect was found to lie approximately 3 min away from the minimum of
the dip.
130

Chapter 9 MANUFACTURING DEFECT DETECTION IN BONDED JOINT USING CFBG SENSOR
F- I 0.0030
0.0025
0.0020
0.0015
0.0010
0.0005
0,0000
-0.0005 0
Figure 9.6. Strain distribution extracted from FE analysis at the position of optical fiber for the bondedjoint with artificial defect was loaded at 5 kN
0.0040
0.0035
0.0030
0.0025
0.0020
0 u. uuiö
0.0010
0.0005
0.0000
-0.0005 0
Figure 9.7. Strain distribution extracted from FE analysis at the position of optical fiber for the bonded joint with artificial defect was loaded at 9 kN
1 131
distance along joint mm
distance along joint mm
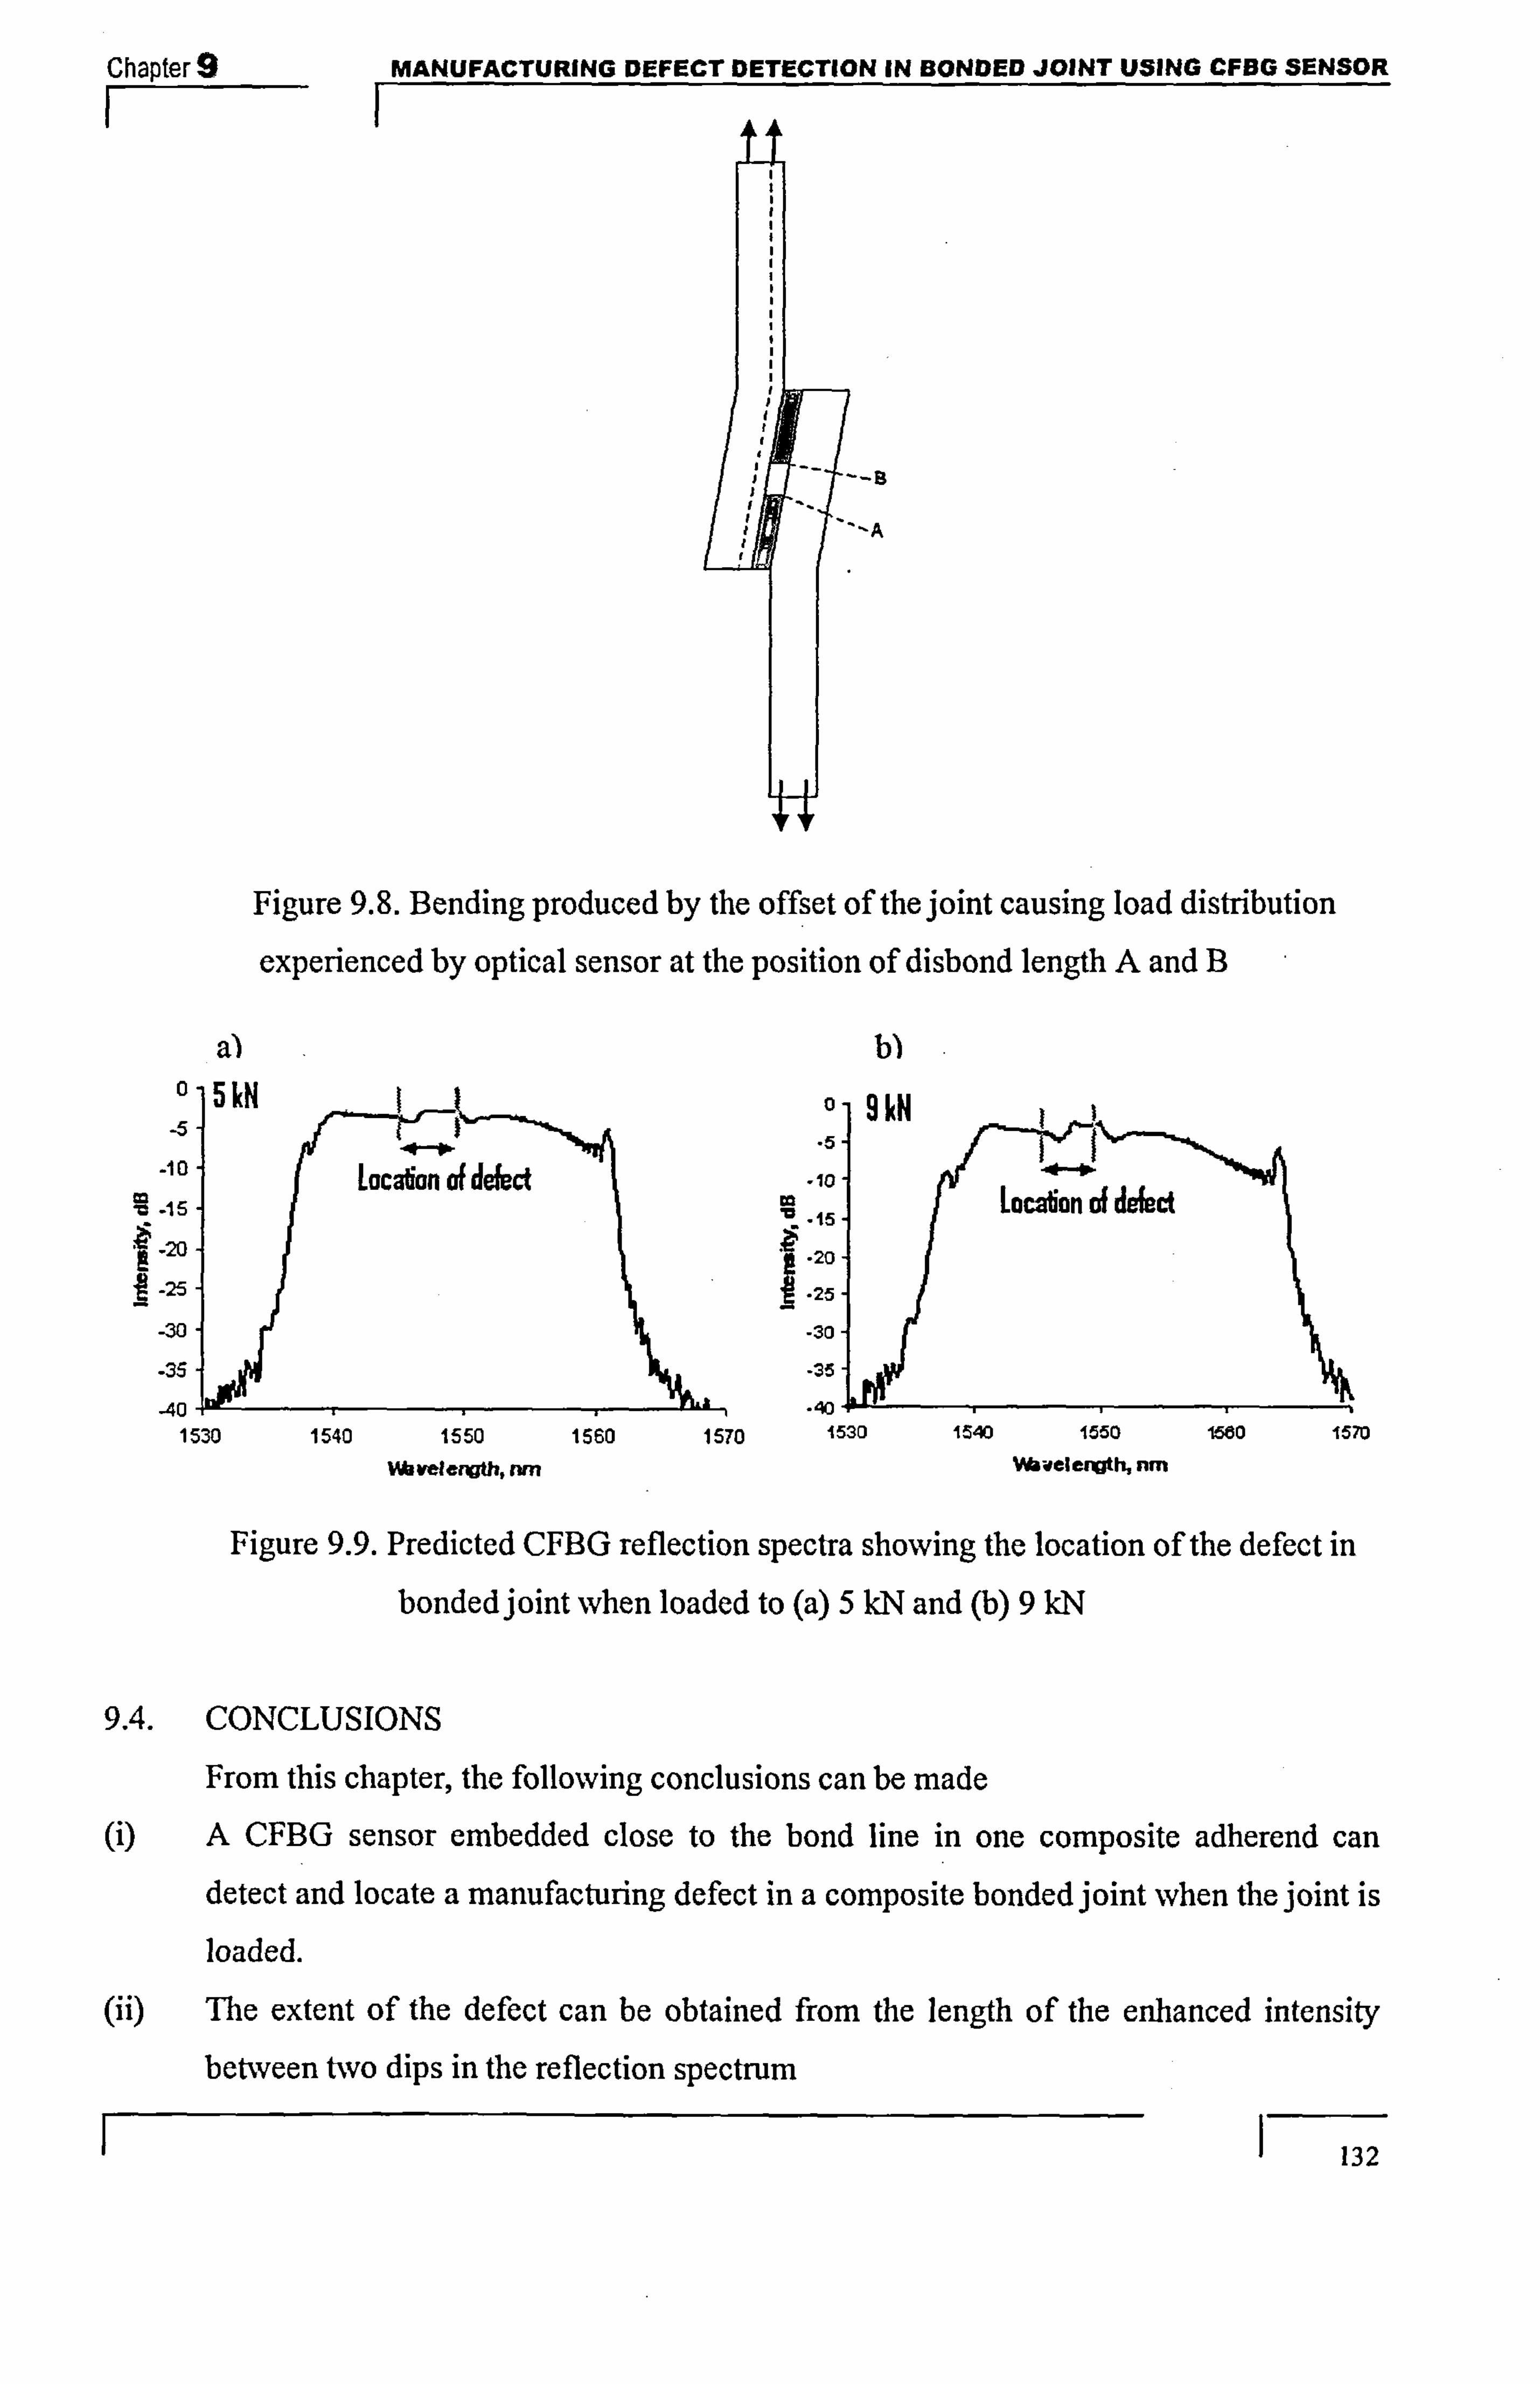
Chapter 9 MANUFACTURING DEFECT DETECTION IN BONDED JOINT USING CFBG SENSOR
AA
-8 'A
Figure 9. S. Bending produced by the offset of the joint causing load distribution
experienced by optical sensor at the position of disbond length A and B
a) 05M
-20 -
-25-
-30
-35
-40 1530
0- 9kN . 5.
ca
-20-
-25
30
-35
. ',
t2
1530
Figure 9.9. Predicted CFBG reflection spectra showing the location of the defect in
bondedjoint when loaded to (a) 5 kN and (b) 9 kN
9.4. CONCLUSIONS
From this chapter, the following conclusions can be made (i) A CFBG sensor embedded close to the bond line in one composite adherend can
detect and locate a manufacturing defect in a composite bonded joint -when the joint is
loaded.
(ii) The extent of the defect can be obtained from the length of the enhanced intensity
between two dips in the reflection spectrum
11 132
1540 1550 1560 1570 Wavelength, rwn
1540 1550 1500 1570
WavelerqtN nm

Chapter 9 MANUFACTURING DEFECT DETECTION IN BONDED JOINT USING CFBG SENSOR
A Combination of finite-element modelling and commercial FBG soffivare has
enabled the position of the manufacturing defect to be related to intensity changes in
the reflected spectra.
9.5. SUMMARY
In this chapter, it has been shown that a CFBG sensor can be used to detect and locate
a manufacturing defect in a composite bonded joint. Future work could investigate the
sensitivity of the technique for different geometric configurations.
9
1 133

Chapter 10 CONCLUSIONS AND FURTHER WORK
CHAPTER 10
CONCLUSIONS AND FURTHER WORK
10.1. CONCLUSIONS
10.1.1. Introduction:
An optical technique based on embedded chirped fibre Bragg grating sensors has
been investigated for matrix damage detection in composite laminates and disbond
detection (both manufacturing disbond and in-service disbond) in adhesively bonded
composite joints. The material system used in the experiments was an E-glass/epoxy
laminate with the sensor embedded in the 0' ply, near the 0/90 interface.
10.1.2. Matrix cracking damage detection in composite laminate:
FBG and CFBG sensors were embedded in cross-ply GFRP coupons and the
changes to the reflected spectra due to matrix crack development have been studied. The
conclusions drawn from this study are
*A single matrix crack gown within thd transverse ply of the GFRP cross-ply laminate produces an approximately sinusoidal perturbation in the CFBG reflection
spectrum. The physical location of the crack corresponding to the perturbation in the CFBG,
reflected spectrum is not at the minimum of the dip of the perturbation, but at a distance of
about I mm from the position of the minimum towards the low-wavelength end of the
reflected spectrum.
e The spectrum predicted with the aid of a strain distribution obtained from a
stress transfer model agrees'well with the experimental results.
10.1.3. In-service disbond detection in adhesively bonded joints
A CFBG sensor has been embedded in one GFRP adherend, closer to bond line
(about 0.5 mm ftorn the bond line) in a GFRP-GFRP bonded joint. The changes in the
CFBG reflected spectrum occurring during fatigue loading and disbond development have
been studied and the conclusions drawn from this study are:
F-134

Chapter 10 CONCLUSIONS AND FURTHER WORK II
An embedded CFBG sensor can be used to monitor disbonding at either end
of an adhesively bonded single-lap joint, with the low-wavelength end of the sensor
positioned at the cut end of one adherend. Disbond initiation adjacent to either the low-
wavelength or high-wavelength end of the sensor is indicated by a shift in the low
wavelength end of the spectrum to lower wavelengths (for disbonding adjacent to the low-
wavelength end) or a shift in the high wavelength end of the spectrum to higher
wavelengths (for disbonding adjacent to the high-wavelength end of the sensor). Disbond
propagation is indicated by the movement of a perturbation in the reflected spectrum which
corresponds to the progression of the disbond front: for disbonding from the low-
wavelength end, the perturbation moves towards higher wavelengths, and for disbonding at
the high-wavelength end, the perturbation moves to lower wavelengths. In all cases, the
reflection spectrum is recorded with the joint under a small load (in practice, this could be
the self weight of the structure).
e The detailed shape of the perturbation depends upon the CFBG chirp rate, but in all cases a combination of finite-element modelling and commercial FBG software
enabled the position of the disbond front to be related to the perturbation in the reflected
spectrum. In general, the position of the disbond front could be located with a precision of
about 2 mm, but this is likely to depend both on the adherend materials and on the position
of the sensor in relation to the disbond location.
e The sensitivity of the embedded CFBG sensor, predicted using OptiGrating
with the aid of a closed form analytical solution of strain distribution available in the
literature was investigated in a parametric study. The sensitivity was found to depend on
the location of the sensor in the adherend with respect to the bond line and the strain distribution in the adherend (which depends upon adherend material and adherend thickness). The study suggested that surface mounted CFBG sensors could detect disbonds
in thin adherend, which opens up the possibility of retrofitting a CFBG sensor system for
disbond detection in bonded joints with thin adherends.
10.1.4. Manufacturing defect detection in adhesively bonded composite joint
An artificial manufacturing defect was introduced into bonded joint using Te. flon
inserts and the possibility of detecting the defect using CFBG sensors was studied. The
following conclusions can be drawn from this work:
F--135

Chapter
F- CONCLUSIONS AND FURTHER WORK
a With the joint under load an enhanced intensity in the reflection spectrum
indicates the presence of manufacturing defect and the length of the enhanced intensity
between two dips in the spectrum provides an indication of the extent of the defect.
9 The reflection spectrum predicted from a combination of FE modelling of
the strain distribution and OptiGrating agrees well with the experimental results and has
enabled the position of the manufacturing defect to be related to the intensity changes in the
reflected spectra.
10.2. FURTHER WORK
In this work, the response of embedded CFBG sensors for locating disbond in GFRP-
GFRP bonded joints is studied. The work could be extended to study the response of
embedded CFBG sensors in both CFRP-CFRP bonded joints and in composite-metal
bonded joints. Both of these types of joints are of interest in aerospace applications (e. g. a
stringer-stiffened panel or carbon-titanium bonded joint). The response of CFBG sensors in
other types of joints such as double-lap, scarf joint could be investigated. More complex joints may produce more complex spectra, and it will be important to determine whether a
combination of FE modelling of the strain distribution and OptiGrating spectrum prediction
still produces theoretical predictions which are in good agreement with experimental
measurements. With regards to the manufacturing disbond, probably the most important
manufacturing defect is when the disbond is at the end of the adherend overlap and the
ability of the CFBG sensor to detect disbonds in this case should be investigated for GFRP-
GFRP, CFRP-CFRP and composite-metal adhesively bonded joints.
I F-136

REFERENCES
REFERENCESS
Adams RD and Wake W C, "Structural Adhesive joints in Engineering", Elsevier Applied
science Publishers, First edition, (1984).
Adams RD and Drin1water B W, "Nondestructive testing of adhesively bonded joints",
NDT &E Intemational, 30/2, (1997), 93-98
Adams RD and Comyn F, "Joining using adhesives", . 4ssembly autonzation, 20/2, (2000),
109-117
Ashcroft I A, Wahab MMA, Crocombe A D, Hughes DJ and Shaw S J, "The effect of
environment on the fatigue of bonded composite joints. Part 1: testing and fractography",
Composites Part A, 32/1, (2001), 45-58.
Badcock RA and Fernando G F, "An intensity based optical fibre sensor for fatigue
damage detection in advanced fibre-reinforced composites", Sinart Materials and Structures, 4, (1995), 223-230.
Baker A A, Dutton S, Kelly D, Composite Materials for Aircraft Structures: 2d edition (2004), AIAA Education.
Barnes TA and Pashby I R, "Joining techniques for aluminium space frames used in
automobiles Part H- adhesive bonding and mechanical fasteners", Journal of Materials
Processing Technology, 99, (2000), 72- 79.
Bassam F, Boniface L, Jones K and Ogin S. L "On the behaviour of the residual strain
produced by matrix cracking in cross-ply laminates", Composites Part A, 29/11 (1998),
1425-1432.
Benchekchou B and Ferguson N S, "The effect of embedded optical fibres on fatigue
behaviour of composite plates", Composite Stnictures, 41/2 (1998) 113-120.
F--137

REFERENCES
Berglund L A, Varna J and Yuan J, "Transverse Cracking and Local Delamination in
[04/90n], and [90t^ls Carbon Fiber/Toughened Epoxy Laminates", Jounial of Reinforced
Plastics and Composites, 11/6, (1992), 643-660 .
Berthelot J M, Leblond P, Mahi A El and Corre LJF, "Transverse cracking of crossply
laminates: part 1. Analysis", CoinpositesPart, 4,27 A, (1996), 989-1001.
Berthelot J M, Mahi A El and Leblond P, "Transverse cracking of crossply laminates: part 2. Progressive width wisecracking", Composites Part A, 2/10, (1996), 1003-1010.
Berthelot J M, "Transverse cracking and delamination in cross-ply glass-fiber and carbon- fiber reinforced plastic laminates: static and fatigue loading", Applied Mechanics Reviews,
5611, (2003), 111-147.
Betz D C, Staudigel L, Trutzel MN and Kehlenbach M, "Structural Monitoring Using
Fiber-Optic Bragg Grating Sensors, Structural Health Monitoring, 2/2, (2003), 145-152
Boniface L and Ogin S L, "Application of the Paris Equation to the Fatigue Growth of Transverse Ply Cracks", Journal of Composite Materials, 23/ 7, (1989), 735-754.
Boniface L, Ogin SL and Smith P A, "Fracture Mechanics Approaches to Transverse Ply
Cracking in Composite Laminates", Composite Materials: Fatigue and Fracture vol 3 ed T
K O'Brien ASTM STP1110 (USA: American Society for Testing and Materials) , 1991,
9-29
Botsis J, Humbert L. Colpo F and Giaccari P, "Embedded fiber Bragg grating sensor for
internal strain measurements in polymeric materials", Optics and Lasers in Engineering,
43, (2005), 491-510.
Broughton W R, Mera RD and Hinopoulos G, "Cyclic Fatigue Testing of Adhesive Joints.
Test Method Assessment", NPL Report, CMMT(A) 191, (1999).
Chiu W& Galea S C, Koss LL and Raj ic N, "Damage detection in bonded repairs using
piezoceramics", Smart Materials and Structures, 9/4 (2000), 466-475.
F-138

Crocombe A D, Ong C Y, Chan C M, Wahab MA and Ashcroft I A, "Investigating fatigue
damage evolution in adhesively bonded structures using backface strain measuremenf', 77te
Journal of Adhesion, 78/9, (2002), 745-776.
Crossman F WWarren W J,. Wang ASD, and Law G E, "Initiation and Growth of Transverse Cracks and Edge Delamination in Composite Laminates, Part 2. Experimental
Correlation, " Journal of Composite Materials Supplement, 14, (1980), 88-108.
Culshaw B, Michie C, Gardiner P and McGown A, "Smart structures and application in
civil engineering", IEEE, 84/1, (1996), 78-86.
Cusano, A, Capoluongo P, Cutolo A and Giordano M, "Chirped fiber-Bragg grating as self- temperature referenced strain sensor in non isothermal thermoset processing", IEEE
Sensors Journal, 6 /1, (2006), Ill - 117.
EATS 2007 training report (www. halldale. com/ Assets/ Files/ EATS%202007/
Proceedings/ Leatherland_v2. ppt) .
Erdogan T, "Fiber Grating Spectra", Journal of Lightwave and Technology, 15/, 8 (1997),
1277-1294
Garrett KW and Bailey JE, "Multiple transverse fracture in 90' cross-ply laminates of a
glass fibre reinforced polyester ", Journal ofMaterials Science, 12, (1977), 157-168.
Gebremichael Y M, Li W, Meggit B T, Boyle WJ0, Grattan K. T V, McKinley B,
Fernando G F, Kister G, Winter D, Cunning L and Luke S, "Integration and assessment of fibre Bragg grating sensors in an all-fibre reinforced polymer composite road bridge",
Journal ofSensors and Actuators A: Physical, 118/1, (2005), 78-85.
Gillooly A M, Chisholm K E, Zhang L and Bennion 1, "Chirped fibre Bragg grating optical
wear sensoe,, Measurenzent Science and Technolog , V, 15, (2004), 885-888.
Goland M and Reissner E, "The Stresses in Cemented Joints", ASME Trans., Journal of Applied Mechanics, 11, (1944), 17-27.
Gorman, M. R., "Ultrasonic Polar Backscatter Imaging of Transverse Matrix Cracks, "
Journal of Composite Materials, 25, (1991), 1499-1514.
r- 139
REFERENCES
Guemes JA and Menendez J M, "Response of Bragg grating fibre optic sensors when
embedded in composite laminates", Composites Science and Technology, 62/7, (2002),
959-966.
Guild F J, Ogin SL and Smith P A, "Modelling of 90' Ply Cracking in Crossply
Laminates, Including Three-Dimensional Effects", Jounial of Composite Materials, 27/7,
(1993), 646-667.
Herzsberg I, Li HCH, Dharmawan. F, 'Mouritz A P, Nguyen M, Bayandor J, "Damage
assessment and monitoring of composite ship joints", Composite Structures, 67, (2005),
205-216
Jin L, Zhang W, Zhang H, Liu B, Zhao J, Tu Q, Kai G and Dong X, "An embedded FBG
sensor for simuItaneous measurement of stress and temperature", IEEE Photonics
Technology Letters, 18/1, (2006), 154-156
Jones R and Galea S, "Health monitoring of composite repairs and joints using optical fibres", Coniposite Structures, 58/3, (2002), 397403.
Jong H J, "Transverse Cracking in a Cross-ply Composite Laminate - Detection in
Acoustic Emission and Source Characterization", Journal of Composite Materials, 4011,
(2006), 37-40,
Kageyama Y,, Kimpara 1, Suzuki T, Ohsawa 1, Murayama H and Ito K, " Smart marine
structures: an approach to the monitoring of ship structures with fiber optic sensors", Smart
Materials and Structures, 7, (1998), 472478.
Kersey A D, Davis M A, Patrick H J, LeBlanc M, Koo K P, Askins C G, Putnam MA and Friebele E J, "Fiber Grating sensors", Journal ofLight wave and Technology, 15/8, (1997),
1442-1463.
King M H, "Smart structures through embedding optical fibre strain sensing", Smart
Materials Bulletin, 2001/ 5, (2001), 7-10.
Koh Y L, Chiu W K, Rajic N, Galea S C, "Detection of Disbond Growth in a Cyclically
Loaded Bonded Composite Repair Patch Using Surface-mounted Piezoceramic Elements",
Structural Health Monitoring, 2/4, (2003), 327-339.
1 140

REFERENCES
Kuang K. S C, Kenny R, Whelan M P, Cantwell WJ and Chalker P R, "Embedded fibre
Bragg grating sensors in advanced composite materials", Composites Science and Technology, 61/10, (2001), 1379-1387.
Laser safety training, "Introduction to laser safety management", March 2007, University
of Surrey.
Lau K, Chan C, Zhou L and Jin W, "Strain monitoring in composite-strengthened concrete
structures using optical fibre sensors", Composites Part B, 32, (2001), 3345.
Lau K, Yuan L and Zhou L, "Thermal effects on an embedded grating sensor in an FRP
structure", Smart Materials and Structures, 10, (2001), 705-712.
Lee B, "Review of the present status of optical fiber sensors", Optical Fibre Technology
9/ 2, (2003), 57-79.
Lee D C, Lee JJ and Yun S J, "The mechanical characteristics of smart composite
structures with embedded optical sensors", Composite Structures, 32, (1995) 39-50.
Lee D C, Lee J J, KNvon IB and Seo D C, "Monitoring of fatigue damage of composite
structures by using embedded intensity based optical fibre sensors", Smart Materials and Structures, 10, (2001), 285-292.
Li HCH, Herzsberg 1, Mouritz A P, Davis CE and Galea SC "Sensitivity of embedded fibre optic Bragg grating sensors to disbonds in bonded composite ship joints. " Composite
Structures, 66, (2004), 239- 248.
Lowe MJS, Challis R E, Chan C W, "The transmission of Lamb waves across adhesively bonded lap joints", Yhe Journal of the Acoustical Society ofAmerica, 107/3, (2000), 1333-
1345.
Mahi A El, Berthelot JM and Brillaud J, "Stiffness reduction and energy release rate of
cross-ply laminates during fatigue tests", Composite Structures, 30/ 2, (1995), 123-130.
Marcadona V, Nadota Y, Royb A, Gacougnollea JL "Fatigue behaviour of T-joints for
marine applications", International Journal ofAdhesion &Adhesives, 26, (2006), 481-489
I F-141
REFERENCES
Marioli-Riga Z, Karanika A, Panagiotopoulous S, Tsamapshyros G J, Fourriarakis N K,
Kanderakis G N, "Structural Health monitoring of composite patch repairs using embedded fiber Bragg grating sensors", 5th GRACM Inteniational Congress on Computational
Mechanics, Limassol, June 2005.
Maslov K, Kim R Y, Kinra, VK and Pagano N J, "A new technique for the ultrasonic detection of internal transverse cracks in carbon-fibre/bismaleimide composite laminates" , Composites Science and Technology, 60/12-13, (2000), 2185-2190.
Matta F, Rizzo P, Karbhari V M, and Scalea F L, "Acoustic Emission Damage Assessment
of SteeUCFRP Bonds for Rehabilitation", Journal of Composites for Construction , 10
(2006), 265-274.
McCartney L N, "Predicting transverse crack formation in cross-ply laminates resulting from micro-cracking", Coinposite Science and Technology, 58, (1998), 1069-1081.
McKenzie 1, Jones R, Marshall IH and Galea S "Optical fibre sensors for health
monitoring of bonded repair systems", Composite Structures, 5014, (2000), 405416.
Meola C, Bruzzone A, Giorleo L, Morace RE And Vitiello A, "Application of lock-in
thermography in nondestructive evaluation of adhesively-bonded aluminum joints",
Journal of Adhesion Science and Technology, 18/ 6, (2004), 63 5-654.
Merzbacher C 1, Kersey AD and Friebele E J, "Fiber optic sensors in concrete structures: a
review", Smart Materials Structures, 5, (1996) 196-208.
Minakuchi S, Okabe Y and Takeda N, "Real-time Detection of Debonding between
Honeycomb Core and Facesheet using a Small-diameter FBG Sensor Embedded in
Adhesive Layer", Journal ofSandwich Structures and Materials, 9/1, (2007), 9-33
Moyo P, BroNvnjohn JMW, Suresh R, Tjin S C, "Development of fiber Bragg grating
sensors for monitoring civil infrastructure", Engineering Structures, 27, (2005), 1828-
1834
Murayarna H, Kageyama Y., Naruse H, Shimada A and Uzawa K, " Application of fiber-
optic distributed sensors to health monitoring for full-scale composite structures", Journal
ofIntellegent Material Systenis and Structures, 14, (2003) ,3 -13. 11
142

REFERENCES
Nand A, Kitcher D J, Wade S A, Nguyen T B, Baxter G W, Jones R and Collins SF,
"Detennination of the position of a localized heat source within a chirped fibre Bragg
grating using a Fourier transfonn technique", Measurement Science and Technology, 17
(2006), 1436-1445
Nand A, Kitcher D J, Wade S A, Jones R, Baxter G W, and Collins S F, "Localized
strain measurement using an integration method to process intensity reflection spectra from
a chirped FB G, SPIE 6619,66191114,2,007
National Transportation Safety Board Aircraft Accident Report 2004: In-Flight Separation
of Vertical Stabilizer, American Airlines Flight 587, National Transportation Safety Board,
Washington, DC, PB2004-910404
Nob. J, Whitcomb J, Oh B, Lagoudas D C, Maslov K, Ganpatye A, and Kinra. V, "Numerical
Modeling, Thermomechanical Testing, and NDE Procedures for Prediction of Microcracking Induced Permeability of Cryogenic Composites" Fifth Conferenc e on Aerospace Materials, Processing, and Environmental Technology (AMPET), H11 ntsville, September 2002.
Surnmerscales J (Editor), Non-destructive testing of Fibre -Reinforced plastics composites, Chapter 2, Volume 2, Elsevier Applied Science, 1990.
Ogin S L, Smith PA and Beaumont PWR, "Matrix cracking and stiffness reduction during
the fatigue of a (0/90)s GFRP laminate , Composites Science and Technology, 22, (1985),
23-31.
Okabe Y, Yashiro S, Kosaka T and Takeda N, "Detection of transverse cracks in CFRP
composites using embedded fiber Bragg grating sensors", Smart Materials and Structures,
9, (2000), 832-838.
Okabe Y, Tanaka N and Takeda N, "Effect of fiber coating on crack detection in carbon fiber reinforced plastic composites using fiber Bragg grating sensors", Smart Materials
andStnictures, ll, (2002), 892-898.
143

REFERENCES
I-I
Okabe Y, Mizutani T, Yashiro S and Takeda N, "Detection of microscopic damages in
composite laminates with embedded small-diameter fiber Bragg grating sensors" Composites Science and Technology, 62, (2002), 951-958.
Okabe Y, Tsuji R and Takeda N, "Application of chirped fiber Bragg grating sensors for
identification of crack locations in composites", Composites A, 35, (2004), 59-65
OptiGrating , User's reference and tutorials, integrated and fiber optical gratings design
software, (version 4.2), Optiwave Corporation, Canada.
Othonos A, "Fibre Bragg gratings: review article", Review ofScientific Instruments, 68/12,
(1997), 4309-4341.
Papini M, Femlund G and Spelt J K, "The Effect of Geometry on the Fracture of Adhesive
Joints, " Inteniational Journal ofAdhesion and Adhesives, 14 (1994), 5-13.
Park J W, Ryu C. Y, Kang HK and Hong C S, "Detection of Buckling and Crack Growth in
the Delaminated Composites Using Fiber Optic Sensor", Jounial of Composite Materials,
34/ 19, (2000), 1602-1623.
Parvizi A, Garrett KW and Bailey JE, "Constrained cracking in glass fiber reinforced epoxy
cross-ply laminates, Journal ofMaterials Science, 13, (1978), 195-201.
Prosser W H, Jackson K E, Kellas S, Smith B T, McKeon J, and Friedman A, "Advanced,
Waveform Based Acoustic Emission Detection of Matrix Cracking in Compositee',
Materials Evaluation, 53/9, (1995), 1052-1058.
Prosser W H, Jackson K E, Kellas S, Smith B T, McKeon J, and Friedman A, "Detection
and location of transverse matrix cracks in cross-ply Gr/Ep Composites using Acoustic
emission", ASNT spring conference andfourth annual research symposium , Las vegas, March 20-24,1995,213-215.
QinetiQ report, State of the Art Review - Structural Health Monitoring, 2006
Rao Y J, "Review article: InfiberBragg gating sensors", Measurement Science and Technology, 8, (1997), 355-375.
I F-144

REFERENCES
Rao Y J, "Recent progress in applications of in-fibre Bragg grating sensors", Optics and laser in Engineering, 31/4, (1999) 297-324.
Schindel D W, Forsyth D S, Hutchins D A, Fahr A, "Air-coupled ultrasonic NDE of bonded aluminum lap joints", Ultrasonics, 35, (1997), 1-6.
Seattlepi news (http. scattlepi. nwsource. com/boeing/787/787primer. asp, viewed onlOth oct 2007)
Steward A and Carman G, "Nondestructive evaluation technique utilizing embedded
thermal fiber optic sensor", Journal of Composite Materials, 37/24, (2003), 2197-2206
Sun Z, Daniel IM and Luo J J, "Modeling of fatigue damage in a polymer matrix
composite", Materials Science andEngineering, A 361, (2003), 302-311.
Swart P L, Lacquet BM and Chtcherbakov A A, "Chirped fiber Bragg grating sensor for
pressure and position sensing", Optical Engineeting, 44/ 5, (2005), 054402(1-4).
Takeda N, Kosaka T and Ichiyama T, "Detection of transverse cracks by embedded plastic
optical fiber in FRP laminates", SPIE 3670, (1999), 248-255
Takeda S, Okabe Y and Takeda N,. "Monitoring of Delamination Growth in CFRP
Laminates using Chirped FBG Sensors", Jounial of Intelligent Material Systenis and Structures, (2007)
Takeda S, Yamamoto T, Okabe Y, Takeda N, "Debonding monitoring of a composite
repair patch using small diameter FBG sensors", Smart Structures and Materials, SPIE
5390, (2004), 495-504.
Takeda S, Okabe Y and Takeda N, "Delamination detection in CFRP laminates with
embedded small-diameter fiber Bragg grating sensors", Composites Part A, 33/7, (2002),
971-980.
Takeda S, Okabe Y and Takeda N, "Application of chirped FBG sensors for detection of local delamination in composite laminates", Smart Sensor Technology and Measurement
Systems, Proceedings ofthe SPIE, 5050 (2003), 171-178.
F- 145

REFERENCES
Tennyson R C, Mufti A A, Rizkalla S, Tadros G and Bemnokrane B, "Structural health
monitoring of innovative bridges in Canada with fiber optic sensors", Smart Materials and Structures, 10 ) (2001), 560-573
Thomas R L, Han X, and. Favro L D, "Thermal Wave Imaging of Aircraft for Evaluation of
Disbonding and Corrosion", 7th European Conference on Non-destnictive Testing
Proceedings, (1998), 126-130.
Tjin S C, Mohanty L and Ngo N Q, "Pressure sensing with embedded chirped fibre
grating", Optics Communications, 216 (2003), 115-118.
Tong J, Guild F J, Ogin SL and Smith P A, "On matrix crack growth in quasi-isotropic laminates-1. Experimental investigation", Composite Science and Technology, 57/11,
(1997), 1527-1535.
Ussorio M, "Development of Matrix cracks in crossply laminates under bending and their
detection using FBG sensors", M. Phil thesis, University of Surrey, 2004
Ussorio M, Wang H, Ogin S L, Thorne A M, Reed G T, Tjin SC and Suresh F,
"Modifications to FBG sensor spectra due to matrix cracking in a GFRP composite", Construction and Building Materials, 20, (2006), 111-118.
Wang ASD, "Fracture mechanics of sublaminate cracks in composite materials", Composites Technology Review, 6, (1984), 45-62.
Wang H, Ogin S L, Thorne AM and Reed G T, "Interaction behveen optical fibre sensors
and matrix cracks in cross-ply GFRP laminates. Part 2: Crack detection", Composites
Science and Technology, 66, (2006), 2367-2378.
Xu Y, Christopher LKY, Tong P, Yi J, Stephen K L, Tong Z Y, Jang K K, "Interfacial
debonding detection in bonded repair with a fiber optical interferometric sensor", Composites Science and Technology, 65, (2005), 1428-1435.
Yashiro S, Takeda N, Okabe T and Sekine H, "A new approach to predicting multiple damage states in composite laminates with embedded FBG sensors", Composites Science
and Technology, 65/3, (2005), 659-667.
F- 146

REFERENCES
I
Yashiro S, Okabe T, Toyama N and Takeda N, Monitoring damage in holed CFRP
laminates using embedded chirped FBG sensors, International Journal of Solids and
Sh-uctures , 44/ 2, (2007), 603 -613
Zhang AP and Tai X M, "Effects of microstructures of smart fiber composites on
embedded Fiber Bragg grating sensors", Journal of Reinforced Plastics and Coinposites,
2/14, (2003), 1320-1329.
147

Appendix 4A
Safety operating procedure in Stripping, Cleaving and Splicing
Do not operate the fiber cleaver or fusion splicer unless you have been properly
trained
9 Safety glasses must be worn at all times while cleaving fiber.
9 The cut ends of optical fiber are dangerous. They are basically glass needles that
will penetrate flesh then break off and become nearly impossible to remove. Once
in your body it will likely become infected.
9 If broken the splinters or scraps can penetrate the skin, and they can be extremely difficult to find and remove. If the fibers enter the eye, they may have to be
removed by a doctor
e Find and dispose of all cut fiber fragments immediately after cutting. Proper
disposal means placing them in an approved fiber disposal unit (not a trash can).
e Handle cut fiber fragments with tweezers only.
* It is the operator's responsibility to ensure that no fiber fragments 'escape' and injure someone. If you lose a fiber fragment you must look until you find it or it
is sure to stick someone (maybe you a few minutes later).
* Fiber fragments can stick to the cover of the cleaver. Move slowly when opening
the cover. Always look on the inside of the cover if you don't see your fragment
on the shelf. Fragments can also fall down by the diamond wheel.
* If you can't find your fragment, get more light on the subject and work area. Do
not move the cleaver until the fragment has been found. Use a magnifying glass if you need to but find that fragment.
* Do not drop them on the floor where they will stick in carpets or shoes and be
carried elsewhere.
e Avoid touching your eyes at any time
9 Keep your work area clean.
* Do not eat or drink anywhere near the work area.
148

Appendix 4B High Power Broadband Light source: A. Laser product specifications:
1) Wavelength range: 1500-1600 mn (invisible mid infrared region) 2) Beam size: The beam is safely confined within single-mode optical fibre with a
mode field diameter of about 9 pm. 3) Beam Divergence: If the output optical cable is not connected, and the beam is
allowed to escape into the free space, its divergence is given by the NA(numerical
aperture) about 120 mrad (half angle) 4) Maximum power: Less than 80 mW
B. Laser Beam Hazards:
The Eye
The eye is the most sensitive organ . and is easily injured by laser beams. The type of injury depends upon the intensity of light, its wavelength, and the tissue being exposed. Damage is by high temperature or photochemical effects. Acute exposures may result in
comeal or retinal bums. Cataract formation and retinal damage may result from chronic
exposures to- laser light. Retinal damage from exposure to wavelengths in the visible and
near infrared region is of concern. Incoherent light can be viewed safely because the light reaching the eye is about a fraction of the output energy and is spread over the entire retina. But the laser radiation is
a coherent light. The beam passes through the pupil and focuses on a very small spot on
the retina, depositing all its energy in this area. Only visible and near infrared radiation is
focused on the retina. Damage to the retina may result in limited or total blindness if the
optic nerve or macula region is injured.
The Skin
Skin is also damaged by laser beams. Acute exposure may cause injuries ranging from
mild reddening to blistering and charring. Skin cancers may result from chronic exposure
to ultraviolet light. The extent and type of damage depends on the amount of energy
149

deposited and the wavelength of the light. Unlike injury to the eye, acute damage to the
skin is usually repairable.
The following chart outlines the biological effects to the eyes and skin at a variety of
wavelengths [ Laser training course, 2007]
Spectral Eye Skin Wavelength
Actinic I IV: Erythema (sunburn) Ultraviolet C Cornea: photokeratitis Skin cancer (100-290 nin) Aging of skin
Actinic U'%? ': Ultraviolet B Cornea: photokeratitis Increased pigmentation (280-315 nm)
Near UV: Lens: photochemical cataracts Pigment darkening Ultraviolet A Retina: blue light injury Skin bums (315 - 400 mn)
Visible Retinal bums: thermal injury Pigment darkening (400 nm -700 nm) Photosensitive reactions
Skin burns Infrared A Cataracts and retinal bums Skin bums
(760-1400 mn ) Infrared B Comea:. bums Skin bums
(1400-3000 nm) Aqueous ffiare (fluorescence) I Lens: cataracts
Infrared C I Cornea: burns Skin burns (3000 im-1.000 mm)
From the following table, it could be noted that our broadband source is Infrared B and it
affects comea and lens of the eye and causes skin bums, if improperly used.
C. Laser safety calculations: The following parameters have to be calculated for the safety use of laser.
1) MPE (Maximum Permissible Exposure):
It is the radiation level of laser to which a person may be exposed without hazardous
effects or adverse biological changes in eye or skin. It is expressed in Irradiance (W/mý) or Radiant Exposure (J/m2). MPE values for direct viewing of the beam and exposure to skin are
150

tabulated in British standard BS EN60825-1: 1994 in table 6 and 8 respectively. Higher the MPE, lower the hazard. It determines the extent of the NOHD.
Depends on:
* Wavelength
Exposure duration
Target Organ (separate MPE limits for skin or eye)
2) NOHD (Nominal Ocular Hazard Distance): distance along the unobstructed beam
from the laser to the eye, beyond which the applicable MPE is not exceeded. For Eye:
Basic infon-nation:
Broadband laser source of wavelength 1500 -1600 nm, 30 mW output power, initial beam
diameter is 9 pm, Beam divergence is 120 milliradians (half angle)
The MPE of eye to laser radiation at 1500-1600 nm is found to be 1000 Wnf2, when the
exposure time is 10 s [Laser safety trairfing, 2007)
ower
NOHD H* MPE - initialbeamdiameter beamdivergence
where NOHD is in meters, radiant power is in watts, NTE in Wnf2, initial beam diameter
is in meters and beam divergence is in full angle radians.
Taking the datas, F4 -* -0.0 3
NOHD=-V, I*1000 -0-000009 0.240
=0.025 m=2.5 cm
Therefore, if the laser is viewed directly from above 0.025 m, the person is considered
safe for the viewing conditions specified.
151

For Skin:
The MPE of skin to laser radiation at 1500-1600 mn is also found to be 1000 WM-2' when
the exposure time is 10 s[ Laser safety training, 2007 ). Hence HD (hazard distance) for
the above datas are also 0.025 m.
D. Safety procedures followed:
1) Access Restriction: As this is a Class IIIb laser, access restrictions are followed to
prevent unauthorized personnel from entering the area when the laser is in use. Doors are kept closed when the laser is in operation.
2) Laser Use Area Control: Area control measures are used to minimize laser
radiation hazards. The area is posted with the appropriate signage which includes
a sign at the doorway indicating the status of a laser system whether it is used or
not. Only authorized personnel who have been appropriately trained are allowed
to operate the laser.
3) Personal Protective Equipment (PPE):
Eye Protection
Eye protection is used for Class Illb When the lasers are used within the NOHD zone. The laser protective eyewear is used during alignment procedures since most laser
accidents occur during this process. Protective eyewear are labeled with the
absorption wavelength and optical density (OD) rating at that wavelength. Skin Protection
For skin protection lab coats and gloves are used when working below the HD zone.
E. SOP ( Standard Operating Procedure).
An SOP is written and followed accordingly and is pasted near the laser system for further infonnation. The below details the SOP
152

Safe Operating Procedure:
The lasers are only to be used by authorised personnel and are housed in a room which
requires a 4-digit code access. Occasionally undergraduate project students may also use the laboratory if their project requires. Undergraduates will be assessed for competence before using the equipment; they can be unsupervised though in voice contact, or visited hourly.
Laser and light Sources to be used in the Laboratory:
One broadband source is currently used in the laboratory. When new devices are introduced, the guidelines and the Safe Operating Procedure will be reviewed to ensure that it is still appropriate, and amended if necessary.
Light Source Name Wavelength
(I'm)
Output Power
(M. W)
Class
AFC broadband source 1530 80 3B
General Guidelines:
The following general guidelines, as well as the specific safe operating procedure
outlined below are followed:
Protective glasses must be worn by anyone in the laboratory at any time
that a laser/light source is active. No-one must work alone in the laboratory outside office hours.
(iii) All experimental set-ups should be organised to minimise the distance
between components of the experiment, to minimise the risk of exposure of the user or others to an exposed light beam.
(iv) All experimental set-ups should be configured to minimise the risk of
exposure to either a direct beam, or a reflected beam.
(V) When aligning an experimental set-up, all users should always ensure that low
power is used to minimise the risk of accidental exposure to dangerous levels
of optical power.
153

(vi) All users should be aNvare of the Safe Operating Procedure.
(Vii) Any user introducing a visitor(s) must ensure that the visitor(s) is/are aNvare of
the Safe Operating Procedure.
(viii) Never look directly into a laser/light source emission point, whether the beam
is emitted into free space or into fibre.
(ix) Never look directly at the reflection of a laser/ligbt source, whether that
reflection is produced deliberately by a mirror, or unintentionally by reflection from a surface or device.
(X) Take care when handling/cutting/preparing fibres that you do not accidentally
endanger eyes or penetrate skin. Take care when handling/cutting/preparing fibres that fragments are not left
where they can accidentally endanger eyes or penetrate skin. (Xii) Laser eyewear is easily damaged. Inspection for damage before use should
include checking for scratches, pits and previous laser damage, which may
show up as bleaching or scorching. If eyewear is known or suspected to
heave been exposed to excess laser radiation, or if any damage is found on inspection, the eyewear must be replaced. Inspection of the frame and sidepieces should ensure that they provide at least
the same protection as the lens.
Specific Safe Operating Procedure:
9 Before switching on a laser or light source, ensure that the "Laser in Use" sign is displayed on the door.
* The user should then select and put on protective eye glasses before turning on
any laser or light emission system.
e The user should check that their experimental arrangement is set up in accordance
with the general guidelines above, prior to switching on the laser or light source.
e The user should ensure that any other persons in the room are wearing protective
eye glasses prior to turning on the laser or light source.
& The user should warn any other persons in the room that a Laser/light source is
about to be switched on, prior to switching on.
154

" No Laser/light source should be left active unnecessarily.
" If it is necessary to leave a Laser/light source active for extended periods, 'when
the user may not be present, (for example, an experiment that runs overnight), then a warning message must always be left indicating that an experiment is in
progress.
" Should it be necessary to adjust the components of an experiment in the path of an
optical beam, always deactivate* the beam prior to carrying out the adjustment.
" Where an experiment is conducted with optical fibre, ensure that the risk of fibre
fracture is minimised. Should fibre fracture occur, ensure that the laser/light
source is immediately deactivated* whilst the fibre is replaced, taking care not to
expose any user to fragments of broken fibre.
* Deactivation of the beam means that the beam is removed from the area under
consideration, perhaps by a beam stop or equivalent, and does not necessarily mean that
power to the laser1light source is removed.
Accidents:
Any laser incident or accident must be reported to the Laser Safety Officer and the
School Safety Adviser who will report to the Safety Office. Following an incident/accident any equipment must be isolated pending investigation. If ocular
exposure has occurred, a full investigation into the cause and nature of the exposure must be undertaken and recorded in full. If there is suspected injury to the eye, the injured
person should see a specialist ophthalmologist at the Royal Surrey County
Hospital within 24 hours. The injured person should not drive.
The Laser Safety Officer must report any injury to the Occupational Health Department
to ensure follow up for the injured person.
If an ophthalmologist is not available at the RSCH, the injured person should be sent
within 24 hours to Moorfields Eye Hospital where the medics are experienced in dealing
with laser eye injuries.
155

Details of the laser beam should accompany the casualty to hospital. These should include type of laser system, classification, wavelength and power.
Royal Surrey County Hospital
Accident and Emergency Department open 24 hours a day
Address: Egerton Road, Guildford, GUI
Telephone Number: 01483 571122
Moorfields Eye Hospital
Accident and Emergency Department open 24 hours a day
Address: 162 City Road, London EClV 12PD
Telephone: 0207253 4696
Location and directions to A&E department available at
Nv-, vw. moorfields. co. uk/Locations/CityRoad
156

Appendix 8A In this Appendix, the visual basic macro written for the rapid evaluation of the closed form solution of Goland and Reissner's model is given. Apostrophe (') represents the
comments for our understanding, and is not the part of the programme.
The programme is:
Sub stressanalysis( cstressanalysis is the name given to the macro'
x= ActiveCell. Row
cactive cell to be selected to start the analysis'
y=x-4 ccell to input for the analysis'
z=x+ 887
ccell till the end of analysis' Do While Cells(x, 1). Value <> ....
'start from the active cell and do till it reaches a blank cell' Cells(y, 3). Value = Cells(x, 1). Value
'input the value to other cell' Cells(x, 3). Value = Cells(z, 22). Value
'take the cell value to the other cell'
X=X+I c go to the next row' Loop
'loop continuation' End Sub
'end program'
157
Top Related