


Languages
Pages
Legal


THE INFLUENCE OF TREE TRAITS AND STORM EVENT CHARACTERISTICS ON STEMFLOW PRODUCTION FROM
ISOLATED DECIDUOUS TREES IN AN URBAN PARK
by
Julie Taylor Schooling
B.Sc., University of Toronto, 1993 B.L.A., University of Toronto, 1993
A THESIS SUBMITTED IN PARTIAL FULFILLMENT OF THE REQUIREMENTS FOR THE DEGREE OF
MASTER OF SCIENCE IN ENVIRONMENTAL SCIENCES
Thompson Rivers University Kamloops, British Columbia, Canada
August, 2014
Thesis Examining Committee:
Darryl Carlyle-Moses (PhD), Thesis Supervisor and Associate Professor and Chair, Department of Geography & Environmental Studies,
Thompson Rivers University
Lauchlan Fraser (PhD), Professor and Canada Research Chair in Community and Ecosystem Ecology, Department of Natural Resource Science,
Thompson Rivers University
Sharon Brewer (PhD), Associate Professor, Department of Physical Sciences and Engineering, Thompson Rivers University
Delphis Levia (PhD), External Reader, Professor of Ecohydrology and Director, Environmental Science and Environmental Studies, Department of Geography,
University of Delaware
© Julie Taylor Schooling, 2014

ii
Thesis Supervisor: Dr. Darryl Carlyle-Moses
ABSTRACT
Urban tree canopy processes affect the volume and biogeochemistry of inputs to the
hydrological cycle in cities. We studied stemflow in isolated deciduous trees in a semi-
arid climate dominated by small precipitation events. To clarify the effect of canopy traits
on stemflow thresholds, rates, yields, percent, and funneling ratios, we analyzed branch
angles, bark relief, tree size, cover, leaf size, and branch and leader counts. High branch
angles promoted stemflow in all trees, while bark relief influenced stemflow differently
for single- and multi-leader trees. The association between stemflow and numerous
leaders deserves further study. Among meteorological variables, rain depth was strongly
correlated with stemflow yields; intra-storm break duration, rainfall intensity, rainfall
inclination, wind speed, and vapour pressure deficit also played roles. Greater stemflow
was associated with leafless canopies and with rain or mixed events versus snow. Results
can inform climate-sensitive selection and siting of urban trees towards integrated
rainwater management.
Keywords: stemflow, canopy water balance, urban hydrology, urban forestry,
stormwater management, deciduous trees, branch angles, bark relief

iii
ABSTRACT .................................................................................................................................... ii LIST OF FIGURES ......................................................................................................................... v LIST OF TABLES ........................................................................................................................ vii GLOSSARY OF ACRONYMS ..................................................................................................... ix ACKNOWLEDGMENTS .............................................................................................................. xi CHAPTER 1 INTRODUCTION ................................................................................................... 1
1.1 URBAN HYDROLOGY CONTEXT ................................................................................................ 1 1.2 TREE CANOPY PROCESSES ....................................................................................................... 1 1.3 STEMFLOW IN CONTEXT ........................................................................................................... 2 1.4 FACTORS INFLUENCING STEMFLOW QUANTITY AND QUALITY ................................................. 2 1.4.1 Tree Morphology ........................................................................................................................................ 2 1.4.2 Storm Meteorology and Seasonal Effects ........................................................................................ 3 1.4.3 Stemflow Chemistry .................................................................................................................................. 3
1.5 OBJECTIVES ............................................................................................................................. 4 1.6 REFERENCES ............................................................................................................................ 5
CHAPTER 2 THE INFLUENCE OF RAINFALL DEPTH CLASS AND DECIDUOUS TREE TRAITS ON STEMFLOW PRODUCTION IN AN URBAN PARK ........................ 7 2.1 INTRODUCTION ........................................................................................................................ 7 2.2 METHODS .............................................................................................................................. 11 2.2.1 Study Area .................................................................................................................................................. 11 2.2.2 Precipitation and Stemflow Measurement .................................................................................. 12 2.2.3 Tree Selection and Trait Measurement and Derivation ........................................................ 12 2.2.4 Data Analysis ............................................................................................................................................ 15
2.3 RESULTS ................................................................................................................................ 16 2.3.1 Precipitation ............................................................................................................................................. 16 2.3.2 Study Tree Characteristics .................................................................................................................. 16 2.3.3 Stemflow for Individual Trees as a Percentage of Rainfall .................................................. 17 2.3.4 Stemflow Funneling Ratios for Individual Trees ....................................................................... 25 2.3.5 Stemflow Percent and Funneling Ratios as a Function of Morphological Traits ....... 26
2.4 DISCUSSION ........................................................................................................................... 27 2.4.1 Tree Size, Canopy Dimensions, and Branch Metrics ................................................................ 28 2.4.2 Cover Metrics ............................................................................................................................................ 29 2.4.3 Leader and Branch Characteristics ................................................................................................ 30 2.4.4 Bark Relief .................................................................................................................................................. 32 2.4.5 Leaf Size ...................................................................................................................................................... 33 2.4.6 Assessment of Predicted Patterns on an Individual Tree Basis .......................................... 33
2.5 CONCLUSION .......................................................................................................................... 35 2.6 REFERENCES .......................................................................................................................... 38
TABLE OF CONTENTS

iv
CHAPTER 3 TREE TRAITS AND METEOROLOGICAL FACTORS INFLUENCING THE INITIATION AND RATE OF STEMFLOW FROM ISOLATED DECIDUOUS TREES ......................................................................................... 44 3.1 INTRODUCTION ...................................................................................................................... 44 3.2 STUDY AREA AND METHODS ................................................................................................. 47 3.2.1 Study Area ..................................................................................................................... 47 3.2.2 Tree Selection and the Measurement and Derivation of Tree Traits ......................... 48 3.2.3 Precipitation and Stemflow Measurement .................................................................. 50 3.2.4 Measurement and Derivation of Meteorological Variables ........................................ 51 3.2.5 Data Analysis ................................................................................................................. 53
3.3 RESULTS ................................................................................................................................ 55 3.3.1 Precipitation Profile ..................................................................................................... 55 3.3.2 Influence of Canopy Characteristics ............................................................................ 56 3.3.3 Influence of Meteorological and Seasonal Factors ...................................................... 58
3.4 DISCUSSION ........................................................................................................................... 63 3.4.1 Canopy Traits Influencing Stemflow from Rain in Leaf-‐on Condition ........................ 63 3.4.2 Stemflow Initiation Threshold ..................................................................................... 63 3.4.3 Stemflow Rate ............................................................................................................... 64 3.4.4 Stemflow Percent .......................................................................................................... 68 3.4.5 Funneling Ratios ........................................................................................................... 69 3.4.6 Influence of Leaf Condition on Stemflow from Rain .................................................... 70 3.4.7 Meteorological Influences on Stemflow from Rain for Various Leaf Conditions ........ 70 3.4.8 Stemflow from Snow and Mixed Events Compared to Rain ........................................ 73
3.5 CONCLUSION .......................................................................................................................... 74 3.6 REFERENCES .......................................................................................................................... 76
CHAPTER 4 CONCLUSIONS AND RECOMMENDATIONS .............................................. 82 4.1 SYNTHESIS: TRAIT AND METEOROLOGICAL FACTORS IN STEMFLOW GENERATION ................ 82 4.2 APPLICABILITY OF FINDINGS IN THE CONTEXT OF STORMWATER MANAGEMENT ................... 86 4.3 LESSONS LEARNED ................................................................................................................ 88 4.4 FUTURE RESEARCH ................................................................................................................ 89
APPENDIX A SUPPLEMENTARY TABLES .......................................................................... 90
APPENDIX B SUPPLEMENTARY MAPS, PHOTOGRAPHS, AND VIDEOS .................. 99

v
LIST OF FIGURES
Figure 2.1 Rain depth frequency distribution during the study period compared to Canadian Climate Normals 1981–2010 for station Kamloops A* (Environment Canada, 2014) .............................................................................. 17
Figure 2.2a Boxplots for stemflow % for single-leader (Group A) trees by rain depth class: I (< 2 mm), II (2 to < 5 mm), III (5 to < 10 mm), and IV (≥ 10 mm) ...... 20
Figure 2.2b Boxplots for stemflow % for multi-leader (Group B) trees by rain depth class: I (< 2 mm), II (2 to < 5 mm), III (5 to < 10 mm), and IV (≥ 10 mm) ...... 21
Figure 2.2c Boxplots for funneling ratio for single-leader (Group A) trees by rain depth class: I (< 2 mm), II (2 to < 5 mm), III (5 to < 10 mm), and IV (≥ 10 mm) ...... 22
Figure 2.2d Boxplots for funneling ratio for multi-leader (Group B) trees by rain depth class: I (< 2 mm), II (2 to < 5 mm), III (5 to < 10 mm), and IV (≥ 10 mm) ...... 23
Figure 3.1 Climograph for the Meteorological Service of Canada’s “Kamloops A*” climate station (50° 42' 08" N, 120° 26' 31" W) (1981–2010 normals; Environment Canada, 2014) .............................................................................. 49
Figure 3.2. Frequency of precipitation events by type and depth class ................................ 56
Figure 3.3 Comparison of stemflow volume (L) produced from rain events less than 3 mm by trees in full leaf () vs. leafless () conditions .................................. 59
Figure 3.4 Graphs of measured SF generated from rain events () and from snow–water equivalent (SWE) depths for snow () and mixed () precipitation events. ............................................................................................ 62
Figure 4.1 Range of stemflow colours observed for May 21−23, 2013 rain event (32.7 mm) ............................................................................................................. 87

vi
LIST OF FIGURES (cont’d)
APPENDICES
Figure B.1 Map showing location of study trees, the meteorological station, and manual rain gauges within McArthur Island Park on the north shore of the Thompson River. The inset shows Kamloops in the context of British Columbia and the Pacific Northwest .............................................. 100
Figure B.2 Aerial view of McArthur Island Park taken from the northwest ................ 101 Figure B.3 Meteorological station complete with tipping bucket rain gauge
(middle) and separate manual rain gauge (left) .......................................... 101 Figure B.4 Stemflow collection system ........................................................................ 102 Figure B.5 Screen capture of a portion of leafless canopy. Deduction of selected
sky pixels from total pixels in Adobe Photoshop® CC yielded canopy cover (%) and wood cover (%) ................................................................... 102
Figure B.6 Bark with measured bark relief index, BRI, values (from left to right) of
1.00, 1.20, and 1.43 .................................................................................... 103 Figure B.7 Project sign produced by the City of Kamloops and attached to large
maps at key access points around the park ................................................. 103 Video B.1 Pin oak ........................................................................................................ 103 Video B.2 Silver maple ................................................................................................ 103 Video B.3 American beech .......................................................................................... 103 Video B.4 American beech (close-up) ......................................................................... 103

vii
LIST OF TABLES
Table 2.1 Single-leader (Group A) and multi-leader (Group B) study trees listed in ascending order of diameter at breast height, DBH, with associated overall height, H, average canopy width, CW, and projected canopy area, PCA ...................................................................................................... 18
Table 2.2 List of selected tree and canopy metrics indicating mean (range) values within Group A (n = 20) and Group B (n = 17) .......................................... 19
Table 2.3 Multiple regression equations for stemflow percentages and funneling ratios as functions of tree morphological traits (all coefficients significant at p ≤ 0.05), generated for single-leader (Group A, n = 20) and multi-leader trees (Group B, n = 17) in three rain depth classes .......... 27
Table 3.1 Multiple regression equations for stemflow initiation thresholds (P”), flow rates post-initiation (QSF), and flow rates per unit projected canopy area (QSF PCA-‐1, L mm-‐1 m-‐2) as functions of tree morphological traits, generated for single-leader (Group A, n = 20) and multi-leader trees (Group B, n = 17) ........................................................................................ 57
Table 3.2 Summary of meteorological variables significantly (p ≤ 0.10) related to stemflow volume during leaf-on (square), transitional (circle), and leaf-off (triangle) conditions per individual-tree regression equations presented in Tables A.6, A.7, and A.8 ......................................................... 60
Table 3.3 Summary of means and standard deviations for canopy traits of trees grouped by whether or not each meteorological variable was significant (“occurred”, p ≤ 0.10) in the individual tree’s stemflow volume regression equation (between-group differences analyzed via one-way ANOVA, p ≤ 0.10) ....................................................................................................... 61

viii
LIST OF TABLES (cont’d)
APPENDICES
Table A.1 Derived values for stemflow initiation threshold, P" (mm), rate, QSF (L mm-1), and rate per unit projected canopy area,QSF PCA-1 (L mm-1 m-2), along with measured values for an array of canopy traits for individual single-leader (Group A) study trees (see Glossary for definition of acronyms and units) .............................................. 91
Table A.2 Derived values for stemflow initiation threshold, P" (mm), rate, QSF (L mm-1), and rate per unit projected canopy area,QSF PCA-1 (L mm-1 m-2), along with measured values for an array of canopy traits for individual multi-leader (Group B) study trees (see Glossary for definition of acronyms and units) .............................................. 92
Table A.3 Regression coefficients for stemflow, SF, volume (L) as a function of rainfall depth, P (mm), for study trees in leaf-on condition ........................... 93
Table A.4 Regression coefficients for stemflow, SF, volume (L) as a function of rainfall depth, P (mm), and actual canopy cover, ACC (%) for study trees in transitional leaf condition ................................................................. 94
Table A.5 Regression coefficients for stemflow, SF, volume (L) as a function of rainfall depth, P (mm), for study trees in leaf-off condition .......................... 95
Table A.6 Multiple regression equations for stemflow, SF, volume (L) as a function of meteorological variables, generated for single-leader (Group A, n = 20) and multi-leader trees (Group B, n = 17) for n rain events during leaf-on condition .............................................................. 96
Table A.7 Multiple regression equations for stemflow, SF, volume (L) as a function of meteorological variables, generated for single-leader (Group A, n = 20) and multi-leader trees (Group B, n = 17) for rain events during transitional leaf condition ................................................ 97
Table A.8 Multiple regression equations for stemflow, SF, volume (L) as a function of meteorological variables, generated for single-leader (Group A, n = 20) and multi-leader trees (Group B, n = 17) for rain events during leaf-off condition .............................................................. 98

ix
GLOSSARY OF ACRONYMS
AAF Average branch angle, full canopy average (deg. from horizontal)
AAU Average branch angle, upper canopy average (deg. from horizontal)
ACC Actual canopy cover during leaf transition (%)
AIF Angle of branch intersection, full tree average (deg. from horizontal)
AIU Angle of branch intersection, upper canopy average (deg. from horizontal)
BA Basal area (cm2) of trunk at breast height (1.3 m)
BRI Bark relief index (dimensionless)
Bn Branch count
CC Canopy cover (%)
CH Canopy height (m)
CW Canopy width (m)
DB Total duration of rain-free within-event breaks of ≥ 30 minutes (h)
DBH Diameter at breast height (cm), measured at 1.3 m height
DR Total duration of rain (not including breaks) (h)
FD Frequency of discontinuity in branch drainage (dimensionless)
FR Funneling ratio, the ratio of stemflow volume at the base of a tree to the volume of incident rain that would have accumulated in a gauge with an opening area equal to the tree’s basal area (dimensionless)
H Tree height (m)
HWR Height-to-width ratio of canopy (dimensionless)
Ic Canopy interception loss, the proportion of intercepted precipitation that is stored on canopy surfaces and evaporates during or shortly after the event ends
Imax5 Five-minute maximum rainfall intensity (mm h-1)
Iwt5 Five-minute weighted average rainfall intensity (mm h-1)
Ln Leader count

x
GLOSSARY OF ACRONYMS (cont’d)
MIP McArthur Island Park (study site)
MLS Median leaf size (cm2)
P Depth of precipitation (rain or snow-water equivalent) (mm)
P” Threshold rain depth (mm) required to initiate stemflow
PCA Projected canopy area (m2), the area of foliated canopy extending to the dripline and including within-canopy gaps
Pinc Rainfall inclination angle (deg. from vertical)
PWA Projected wood area (m2), the product of PCA and percent wood cover
QSF Flow rate (L mm-1) once threshold depth has been satisfied
QSF PCA-‐1 Flow rate per m2 of projected canopy area (L mm-1 m-2)
SF Stemflow, the proportion of intercepted precipitation channeled through a tree canopy to the base of the trunk
SF % Stemflow volume as a percentage of the total volume of precipitation incident on a canopy area
TBRG Tipping bucket rain gauge
TF Throughfall, the proportion of precipitation that either passes through gaps in a tree’s canopy or drips from woody or leafy parts
VolC Canopy volume (m3)
VolW Wood volume (m3)
VPD Vapour pressure deficit (kPa)
WC Wood cover (%)
Wwt5 Five-minute weighted average wind speed (m s-1)

xi
ACKNOWLEDGEMENTS For their generous advisory, logistical, and/or financial support, I thank:
• Dr. Darryl Carlyle-Moses, my valued and fully engaged supervisor; • Advisory Committee members Tony Bradwell (Urban Systems), Dr. Sharon
Brewer (TRU), Dr. Lauch Fraser (TRU), and Dr. Valentin Schaefer (University of Victoria);
• TRU faculty Dr. John Church, Dr. Kingsley Donkor, Dr. Nancy Flood, Dr. Tom Dickinson, Dr. Will Garrett-Petts, Dr. John Karakatsoulis, Dr. Walt Klenner, Dr. Shane Rollans, Jacque Sorensen, Dr. Joanne Rosvick, and Peggy-Jo Broad;
• Dr. Del Levia and Dr. David Legates (University of Delaware); • Our dedicated Research Assistants Kyle Bondarchuk, Scott Borden, Allison James,
Stefanie McBride, Megan Osmond-Jones, Will Plommer, Andreas Porman, Jen Powers, and Nikki Willier;
• Volunteers Margaret Graham (for exceptional contribution) as well as Beth and Dennis Andrucson, Shannon Gadsby, Janis Goad, Michelle Gunnlaugson, Alexis Karakatsoulis, Marguerite Machell, Chris McCuaig, Andy Raniseth, and Mandy Schmidt;
• The City of Kamloops’ Greg Houghton, a champion throughout, Shawn Cook, Mike de Cicco, Jim Hiebert, Barry Manderson, Garrett Lacey, and Joe Vetere as well as Paul de Zeeuw, Ken Studer, Lisa Hodgkiss, and Joe Luison;
• TRU staff Lincoln Smith and Jerri-Lynne Cameron, Caroline Whitelaw, Johanna Norman, Primo Podorieszach, and Laurel Wale;
• The Kamloops Naturalist Club, especially Jean Crowe, Paul Johansen, and Ken Lipinski, and the Big Little Science Centre’s Susan Hammond and Gord Stewart;
• Ray Visser, for mentoring and encouragement; • The Partnership for Water Sustainability in BC, especially Kim Stephens and
Dr. Charles Rowney; • Environment Canada’s Jim Steele (retired); • Norman and Diana Kopek, hosts of our weather station; • McArthur Island Lawn Bowling Club for accommodating our equipment; and • Royal Canadian Mounted Police, Kamloops Detachment, for eyes on the site.
Every dollar received was precious, and allowed us to focus on the project without financial constraint. Thanks to: Golder Associates and the Natural Sciences and Engineering Research Council of Canada (Industrial Post-graduate Scholarship); the Real Estate Foundation of British Columbia; TD Friends of the Environment Foundation; and the Kamloops Foundation. I thank my many faithful friends—especially Shelley Church, Shannon Gadsby, and Chris McCuaig—and my deeply appreciated family: Roz Isaac, Robyn Brandt, Edward and Janet Taylor, and the resourceful father–son team of Shane and Anthony Schooling.

CHAPTER 1 INTRODUCTION
1.1 URBAN HYDROLOGY CONTEXT
In response to the ecological and socio-economic issues associated with ongoing
urbanization, policy makers, resource managers, and urban designers (among others) are
exploring ways to preserve, enhance, construct, and maintain “green infrastructure.” For
example, urban vegetation can play an important role in rainwater capture and detention
as well as filtration of stormwater (Girling and Kellett, 2005). In a study looking at five
cities in the United States, McPherson et al. (2005) estimated that the value of benefits
per urban tree ranged from $31 to $89 USD (net benefit $1.37 to $3.09 USD per dollar
invested in management annually). This reflected energy savings, atmospheric CO2
reductions, air-quality benefits, aesthetics and property-value enhancements, and
stormwater-runoff reductions. Applied to the City of Kamloops, British Columbia
(population ~100,000), which manages over 15,000 trees on public land, this yields an
estimated total annual benefit ranging from $434,000 to $1.25 million USD. Like many
municipalities, the City of Kamloops (2010) has concerns about flooding and erosion;
water quality, including quality of stormwater which is not treated prior to entering
watercourses; expansion of impervious surfaces; and the cost of new and upgraded
stormwater infrastructure. Site- and neighbourhood-level stormwater best management
practices are being implemented in new developments. In recognition of increased
percentages of impervious surfaces associated with urban and suburban development,
stormwater managers have identified source controls as one strategy to minimize water
quantity- and quality-related impacts on nearby ecosystems (Xiao et al., 2007).
1.2 TREE CANOPY PROCESSES
Trees are a potential source control (i.e., via canopy interception), but species that
effectively funnel rainfall to the base of their trunks as stemflow, SF, may contribute
1

concentrated input to the terrestrial hydrological cycle and soil chemistry (e.g., Levia and
Herwitz, 2005). Interception loss, Ic (direct evaporation from canopies) and throughfall,
TF (whereby rain falls through gaps in the canopy or drips from leaves and branches), are
the other components into which incident rainfall is partitioned (Crockford and
Richardson, 2000). Trees can contribute to soil moisture and groundwater recharge
(Návar, 2011; Tanaka, 2011), but in areas of soil instability, compaction, or paving, SF
can exacerbate the water quality and quantity issues associated with urban or suburban
runoff. A better understanding of SF processes in urban environments is needed as the
basis of planning, design, and management of urban forests.
1.3 STEMFLOW IN CONTEXT
Globally, SF has been studied far less than TF, likely because percentage-wise it is
a relatively small proportion of incident rain (typically 3−10 % vs. 70−80 % for TF in
broadleaved deciduous forests). Of the growing number of studies published, most are at
the forest-stand scale in rural or agricultural contexts. Over the past decade, a few studies
have focused on urban situations (e.g., Xiao and McPherson, 2011; Livesley et al., 2014),
single-tree processes (e.g., David et al., 2006; Guevara-Escobar et al., 2007; Levia et al.,
2013), meteorological effects (e.g., Van Stan et al., 2014), and seasonal influences (e.g.,
Levia, 2004; Staelens et al., 2008) on SF. Given the high variability associated with SF
yields, more work is needed to discern how urban tree canopy processes differ from those
in forests, as they apparently do (Xiao et al., 2000; Asadian and Weiler, 2009).
1.4 FACTORS INFLUENCING STEMFLOW QUANTITY AND QUALITY
1.4.1 Tree Morphology
Stemflow yields, initiation thresholds, and rates are influenced by canopy traits that
can differ greatly between species and between age/size classes within a given species.
Based on characteristics identified by other researchers as important, this study explored
2

the effect of size metrics including diameter at breast height, tree height, and canopy
width; bark relief; canopy and wood cover fraction; branching angles; and the number of
branches and leaders present.
1.4.2 Storm Meteorology and Seasonal Effects
Canopy traits and meteorological variables interact in complex ways to influence
SF initiation threshold rainfall depth, P”, flow rates, and volumes. Research shows that
rainfall depth and intensity, wind speed and direction, rainfall inclination angle, and
vapour pressure deficit can influence SF processes (Van Stan et al., 2014). Exposure of an
isolated canopy to the elements, whether in an urban or rural situation, changes the
dynamics of interacting tree traits and storm meteorology, as does the absence of leaves
in the dormant season (Staelens et al., 2008; Van Stan et al., 2014).
1.4.3 Stemflow Chemistry
Many of the trait and meteorological variables listed above play a role in SF
chemistry, often reflecting residence time in the canopy (Levia and Herwitz, 2002;
Staelens et al., 2007; André et al., 2008). In urban areas, airborne pollutants deposited on
tree canopies can result in higher concentrations of pollutants as well as the nutrients
commonly found in SF (Xiao and McPherson, 2011). Detailed examination of SF
chemistry was beyond the main scope of this study, but results of an exploratory satellite
investigation of SF chemistry for 12 trees over nine rainfall events may be published at a
later date.
3

1.5 OBJECTIVES
To address gaps and priorities identified in the literature, this research aimed to:
1. analyze the contribution of diverse canopy traits to threshold rainfall depth and
post-initiation rate of SF for isolated trees in an urban park in Kamloops, British
Columbia, Canada;
2. for this same sample of trees, explore the influence of various storm meteorological
characteristics on SF volume, SF as a percent of incident rainfall, and funneling
ratios as well as relationships between meteorological and trait variables; and
3. based on synthesized results, provide guidelines to support application of these
findings by urban foresters, landscape architects, stormwater managers, and allied
professionals.
4

1.6 REFERENCES
André, F., Jonard, M., Ponette, Q., 2008. Effects of biological and meteorological factors on stemflow chemistry within a temperate mixed oak-beech stand. Science of the Total Environment 393, 72–83.
Asadian, Y., Weiler, M., 2009. A new approach in measuring rainfall interception by urban trees in coastal British Columbia. Water Quality Research Journal of Canada 44, 16–25.
City of Kamloops, 2010. Sustainable Kamloops Plan: Information Package on Water (Final Version). City of Kamloops.
Crockford, R.H., Richardson, D.P., 2000. Partitioning of rainfall into throughfall, stemflow and interception: Effect of forest type, ground cover and climate. Hydrological Processes 14, 2903–2920.
David, T.S., Gash, J.H.C., Valente, F., Pereira, J.S., Ferreira, M.I., David, J.S., 2006. Rainfall interception by an isolated evergreen oak tree in a Mediterranean savannah. Hydrological Processes 20, 2713–2726.
Girling, C., Kellett, R., 2005. Skinny Streets and Green Neighbourhoods. Island Press, Washington, DC.
Guevara-Escobar, A., González-Sosa, E., Véliz-Chávez, C., Ventura-Ramos, E., Ramos-Salinas, M., 2007. Rainfall interception and distribution patterns of gross precipitation around an isolated Ficus benjamina tree in an urban area. Journal of Hydrology 333, 532–541.
Levia, D.F., 2004. Differential winter stemflow generation under contrasting storm conditions in a southern New England broad-leaved deciduous forest. Hydrological Processes 18, 1105–1112.
Levia, D.F., Herwitz, S.R., 2002. Winter chemical leaching from deciduous tree branches as a function of branch inclination angle in central Massachusetts. Hydrological Processes 16, 2867–2879.
Levia, D.F., Herwitz, S.R., 2005. Interspecific variation of bark water storage capacity of three deciduous tree species in relation to stemflow yield and solute flux to forest soils. Catena 64, 117–137.
Levia, D.F., Michalzik, B., Näthe, K., Bischoff, S., Richter, S., Legates, D.R., 2013. Differential stemflow yield from European beech saplings: The role of individual canopy structure metrics. Hydrological Processes 2–9.
Livesley, S.J., Baudinette, B., Glover, D., 2014. Rainfall interception and stem flow by eucalypt street trees – The impacts of canopy density and bark type. Urban Forestry & Urban Greening 13, 192–197.
5

McPherson, G., Simpson, J., Peper, P., Maco, S., Xiao, Q., 2005. Municipal forest benefits and costs in five US cities. Journal of Forestry 103, 411–416.
Návar, J., 2011. Stemflow variation in Mexico’s northeastern forest communities: Its contribution to soil moisture content and aquifer recharge. Journal of Hydrology 408, 35–42.
Staelens, J., De Schrijver, A., Verheyen, K., 2007. Seasonal variation in throughfall and stemflow chemistry beneath a European beech (Fagus sylvatica) tree in relation to canopy phenology. Canadian Journal of Forest Research 37, 1359–1372.
Staelens, J., De Schrijver, A., Verheyen, K., Verhoest, N.E.C., 2008. Rainfall partitioning into throughfall, stemflow, and interception within a single beech (Fagus sylvatica L.) canopy: Influence of foliation, rain event characteristics, and meteorology. Hydrological Processes 22, 33–45.
Tanaka, T., 2011. Effects of the canopy hydrologic flux on groundwater, in: Levia, Delphis F., Carlyle-Moses, D.,Tanaka, T. (Eds.), Forest Hydrology and Biochemistry: Synthesis of Past Research and Future Directions. Springer, Dordrecht, pp. 499–518.
Van Stan, J.T., Van Stan, J.H., Levia, D.F., 2014. Meteorological influences on stemflow generation across diameter size classes of two morphologically distinct deciduous species. International Journal of Biometeorology 1–11.
Xiao, Q., McPherson, E., 2011. Rainfall interception of three trees in Oakland, California. Urban Ecosystems 14, 755–769.
Xiao, Q., McPherson, E., Simpson, J., Ustin, S., 2007. Hydrologic processes at the urban residential scale. Hydrological Processes 21, 2174–2188.
Xiao, Q., McPherson, E.G., Ustin, S.L., Grismer, M.E., Simpson, J.R., 2000. Winter rainfall interception by two mature open-grown trees in Davis, California. Hydrological Processes 14, 763–784.
6

CHAPTER 2 THE INFLUENCE OF RAINFALL DEPTH CLASS AND
DECIDUOUS TREE TRAITS ON STEMFLOW PRODUCTION IN AN URBAN PARK
2.1 INTRODUCTION
Urban trees have been found to be associated with disservices, including
maintenance costs, infrastructure damage, health problems (e.g., asthma), and light
attenuation (Gorman, 2004; Lohr et al., 2004; Roy et al., 2012). However, trees in urban
and suburban environments also provide an array of social, economic, health, and
environmental services (Miller, 1997; Tyrväinen et al., 2005; Roy et al., 2012), and these
benefits have been found to outweigh associated costs (Peper et al., 2007, 2008; Soares et
al., 2011). Specifically, trees in urban areas increase aesthetics and property values
(McPherson et al., 1999; Sander et al., 2010), enhance human health (Tzoulas et al.,
2007), reduce noise and air pollution (Dwyer et al., 1992; McPherson et al., 1997; Nowak
et al., 2006), diminish carbon dioxide concentrations (Liu and Li, 2012; Nowak et al.,
2013), lessen energy costs (Akbari et al., 2001; Soares et al., 2011), provide wildlife
habitat (Goddard et al., 2010; Stagoll et al., 2012), and decrease stormwater runoff
(Sanders, 1986; Soares et al., 2011). The value of stormwater runoff diminution by urban
trees and green spaces may not be inconsequential. Soares et al. (2011), for example,
found that urban trees in Lisbon, Portugal captured and subsequently evaporated an
average of 4.5 m3 of water annually from their crowns and this was equated to a benefit
of $48 USD per tree per year, or $1.97 million USD annually when all trees in the city
are considered. McPherson et al. (2011) suggest that 8 % of the total economic benefit
($1.33 to $1.95 billion USD) of the Million Trees Los Angeles initiative—a plan which
would see an additional one million trees planted in that city over a 35-year period—
would be derived from stormwater runoff reduction.
The decrease in stormwater runoff production by trees in the urban environment
has been estimated from the volumetric importance of canopy interception loss (Soares
7

et al., 2011; Inkiläinen et al., 2013; Pothier and Millward, 2013). Canopy interception
loss is the interception, storage, and subsequent evaporation of precipitation by tree
crowns and accounts for 10−50 % of annual or season-long rainfall from natural forest
systems (Carlyle-Moses and Gash, 2011). Although much less studied within the urban
environment, the results available to date suggest that canopy interception loss from city
trees is also appreciable and may even be greater than that from natural forests. For
example, at the crown scale, Xiao and McPherson (2011) found that canopy interception
loss in Oakland, California was 14.3 % of rainfall for an 8.8 m tall sweet gum
(Liquidambar styraciflua L.) tree, 25.2 % for a 2.9 m tall lemon (Citrus limon (L.)
Burm. f.) tree, and 27.0 % for a 13.5 m tall ginkgo (Ginkgo biloba L.) tree. Guevara-
Escobar et al. (2007) concluded that crown-scale canopy interception loss from 19 storms
totaling 152 mm was 59.5 % from a single 5.9 m tall weeping fig (Ficus benjamina L.) in
Queretaro City, Mexico. Asadian and Weiler (2009) derived average interception loss
values of 49.1% for three Douglas-fir (Pseudotsuga menziesii (Mirb.) Franco) and 60.9%
for three western redcedar (Thuja plicata Donn ex. D. Don) individuals in North
Vancouver, British Columbia for seven selected events. Enhanced canopy interception
loss from individual urban trees compared to forested sites may be a consequence of the
relatively large structural units (e.g., canopy volume) associated with open-grown
canopies (Brooks et al., 2003; Asadian and Weiler, 2009), greater evaporation rates
attributable to the urban heat island effect (Asadian and Weiler, 2009), and/or the
enhanced influence of wind due to the canopies being isolated from one another rather
than being sheltered as in a forest scenario (Xiao et al., 2000b; Asadian and Weiler, 2009;
Inkiläinen et al., 2013).
Canopy interception loss is estimated indirectly by taking the difference between
precipitation incident upon the canopy and the understory precipitation input to the
ground below (Carlyle-Moses and Gash, 2011; Saito et al., 2013; Peng et al., 2014).
Understory precipitation takes two forms: throughfall, TF, the proportion of precipitation
that either passes through gaps in the canopy or drips from foliar and wood components
of the canopy; and stemflow, SF, the fraction of precipitation that is intercepted by the
8

tree cover and subsequently flows down the tree bole to the base of the tree (Levia et al.,
2011). Interception loss studies conducted within natural forests have often found that TF
is the dominant volumetric understory rainfall input, with SF usually accounting for
< 5 % of precipitation at the plot-scale or beyond (Zhongjie et al., 2010; Levia et al.,
2011; Carlyle-Moses et al., 2014). However, the proportion of rainfall partitioned into SF
has been found to greatly exceed 5 % in certain forests. Wei et al. (2005), for example,
found that SF represented 15.5 % of growing-season rainfall from a Mongolian oak
(Quercus mongolica Fisch. ex Turcz.) forest in northern China, while Ford and Deans
(1978) found that SF accounted for 27 % of the 1639 mm annual rainfall input to a
14-year-old Sitka spruce (Picea sitchensis (Bong.) Carr.) plantation in southern Scotland.
Stemflow studies conducted on individual trees in forest settings have also found
relatively high proportions of rain being partitioned into SF (e.g., Johnson and Lehmann,
2006; Liang et al., 2009), with some values being as great as 64 % of rainfall on a crown-
projection-area basis (Masukata et al., 1990). A review of the interception loss literature
suggests that canopy interception loss studies conducted in urban systems typically do not
measure SF and either consider this input to be negligible (e.g., Asadian and Weiler,
2009) or to be a small and fixed fraction of rainfall based on the results of studies in
natural forests (Inkiläinen et al., 2013). However, the aforementioned findings of
relatively high SF proportions from forests and lone trees in forests, as well as certain
studies conducted on isolated trees in urban areas (e.g., Xiao et al., 2000b), suggest that
large errors in interception loss estimates may result if SF is ignored or assumed to be a
small portion of rainfall.
There is growing recognition of the hydrological and biogeochemical importance of
SF in non-urban forests and plant communities (Levia et al., 2011; Frost and Levia,
2013). Stemflow in these environments has been found to 1) greatly increase soil
moisture around and deep beneath the base of the tree or plant, creating a reservoir of
water on which the tree or plant can draw in times of need, a phenomenon known as the
“nursing effect” (Goodall, 1965; Li et al., 2008); 2) create “fertile islands” where soil
nutrients are found in greater concentrations at the tree/plant base than in other areas
9

(Whitford et al., 1997; Li et al., 2008); 3) be an important point source of groundwater
recharge (Tanaka et al., 1996; Taniguchi et al., 1996; Tanaka, 2011); 4) result in localized
overland flow (Herwitz, 1986); and 5) even be responsible, at least in part, for the rapid
stream response to rainfall inputs under certain conditions (Crabtree and Trudgill, 1985).
The potential importance of SF in urbanized areas has received little study in either
volumetric or biogeochemical terms, despite indications that pollutants concentrate in SF
(Michopoulos, 2011; Xiao and McPherson, 2011). Given that SF is a concentrated point
source of water rather than a diffuse source like TF, we suggest that SF may, in
conjunction with canopy interception loss and when infiltration is promoted, serve a role
in diverting precipitation from becoming stormwater runoff. Additionally, we suggest
that SF may also be important from a management perspective because it may lessen tree
irrigation water demand. Thus, study is required to determine the quantitative importance
of SF and to assess the influence rain depth and tree traits have on SF production in urban
environments so that the role of individual trees in stormwater mitigation in areas of
differing rainfall regimes can be more fully understood.
The objective of this study was to determine if SF was an important component of
the canopy water balance and/or an important point source of water at the base of
deciduous trees under full-leaf conditions in an urban park. Specifically, we aimed to:
1. determine the relationship between tree-scale SF volume and event-scale rainfall
depth;
2. derive the proportion (%) of rain partitioned into SF and the SF funneling ratios
associated with these trees for differing rain depth classes (< 2 mm, 2 to < 5 mm,
5 to < 10 mm, and ≥ 10 mm); and
3. define which tree traits influenced the proportion of rain partitioned into SF and the
magnitudes of SF funneling ratios under the differing rain depth classes.
Meeting these objectives will, in part at least, inform stormwater managers and
urban foresters of the potential quantitative importance of SF when deriving canopy
10

interception loss estimates and in determining if SF serves stormwater management
and/or supplemental irrigation roles (Vico et al., 2014). Additionally, meeting the stated
objectives will provide information regarding which tree traits and rainfall regimes
influence SF production in the urban environment.
2.2 METHODS
2.2.1 Study Area
This study was conducted within McArthur Island Park (MIP) in the City of
Kamloops, British Columbia, Canada (50° 41’ 43” N, 120° 22’ 38” W) at an elevation of
344 m a.m.s.l. (Figure B.1). McArthur Island Park is a 51-ha multi-use sport and leisure
area bounded to the south by the Thompson River and on other sides by a slough (Figure
B.2). Green space at MIP includes several tree stands, including fairly continuous tree
and shrub cover in the riparian zone encircling the park. In the more manicured centre of
the site, many trees are isolated, meaning that all trees had an unobstructed field of view
at least 35° from vertical, centred where the lowest branch met the bole. Although
coniferous tree species are present at MIP, including white spruce (Picea glauca
(Moench.) Voss), most trees are deciduous, including cultivated species of maple (Acer
spp.), oak (Quercus spp.), and ash (Fraxinus spp.).
Based on climate normals (1981–2010) for Environment Canada’s “Kamloops A*”
climate station, situated 4.4 km west-north-west of the study site at an elevation of 345 m
a.m.s.l,, mean annual temperature for this location is 9.3°C, while mean monthly
temperatures range from –2.8°C in January to 21.5°C in July. Mean annual precipitation
is 277.6 mm with approximately 224.3 mm (81%) falling as rain and the remainder as
snow. Kamloops’ mid-latitude, semi-arid steppe climate (BSk Köppen climate type) is
modified to a moist, temperate climate (Cwb Köppen climate type) at the study site due
to extensive irrigation in the spring and summer months that sustains tournament-
standard turf and cultivated, non-native trees.
11

2.2.2 Precipitation and Stemflow Measurement
Precipitation and SF were measured on an event basis from June 12, 2012 to
November 3, 2013. Rainfall depth, P, was measured using an Onset® tipping-bucket rain
gauge (Model # S-RGB-M002) connected to an Onset® Hobo® U-30 USB data logger
(Model # U30-NRC) (Figure B.3). The tipping bucket (resolution 0.2 mm tip-1) was
situated 1 m off the ground on private property immediately north of MIP.
Accompanying the tipping bucket rain gauge was a manually read polyethylene gauge
(diameter 29 cm, depth 36 cm), again positioned at a height of 1 m. The tipping bucket
and manually read rain gauge were between 80 and 770 m from the study trees. Eight
other manually read gauges were placed within MIP resulting in gauge density of
approximately 0.04 km2 gauge-1 and a maximum gauge-to-study-tree distance of
approximately 215 m.
We collected SF using black corrugated polyethylene hose of two diameters:
3.2 cm for 32 trees and 3.8 cm for the five largest trees (Figure B.4). After removal of a
lengthwise section of hose, the collar was wrapped twice around the tree at an angle
sufficient to ensure flow and one edge was stapled to the trunk. The seam and staples
were sealed with 100 % silicone to prevent leaks; collection collars were regularly
inspected and repaired throughout the study. The outlet of each open-topped collar was
inserted and secured with electrical tape to an intact length of hose which directed SF into
a 17-L polyethylene pail set within a 114-L lidded polyethylene tote to provide overflow
capacity; elastic cord securing PVC plastic over the lid prevented contamination of SF by
rain, and two 4-L water-filled polyethylene jugs in each tote anchored the reservoir to
prevent displacement by high winds.
2.2.3 Tree Selection and Trait Measurement and Derivation
Study trees were: i) deciduous trees in good condition; ii) trees representing a range
of canopy characteristics; iii) trees of diverse sizes, but with a minimum diameter-at-
breast-height, DBH, of 10 cm; and iv) “isolated” trees as defined above.
12
Basic Tree Size Metrics: Diameter at breast height (cm) was measured using a Lufkin®
Metric Diameter Tape and tree height, H (m), was measured using a Suunto PM5/SPC
clinometer. Dripline radius in eight directions was found using a periscope-style
instrument with 5 x 5 dot grid in the viewfinder; the average of these was doubled to
calculate average canopy width, CW (m). Areas were calculated using each cardinal-
direction dripline radius, and averaged to yield projected canopy area, PCA (m2).
Projected wood area, PWA (m2) was the product of PCA and percent wood cover (see
below). Side-view leaf-on photographs, also used for side-area calculation (see below),
were used to calculate canopy height, scaled in Photoshop® CC using an item of known
dimension; canopy height-to-width ratio, HWR (dimensionless), was determined using
canopy height and CW. To calculate canopy volume, VolC (m3), side-view leaf-on area
(including gaps; see below) for the view corresponding to the chosen side-view leaf-off
tracing was divided by CW to yield average canopy height; this was then multiplied by
PCA to give volume. Wood volume, VolW (m3), was calculated in the same way.
Side Area Leaf and Side Area Wood: Side-view leaf-on and leaf-off photographs were
taken from eight consistent directions at similar heights using a pole-mounted, remotely
controlled GoPRO Hero3 camera (7MP resolution, medium field of view). The clearest
pair of leaf-on and leaf-off photographs was traced by hand and scanned. Photoshop® CC
was used to select canopy (leaf-on, including gaps) and wood (leaf-off) areas, and pixels
were converted to m2 using an item of known dimension in each photo.
Canopy Cover (CC) and Wood Cover (WC): Beneath-canopy skyward photographs of
both leaf-on and leaf-off canopies were taken using a Nikon 7100D with lens set to
70 mm focal length mounted on an Optex® T25 tripod with level. Six photos were taken
at a mount height of 0.3 m along transects extending in each cardinal direction at the
following distances relative to the known dripline radius: 0.15 (adjacent to bole), 0.25,
0.5, 0.75, 0.875 (to reflect high variability at this distance), and 1.0 (dripline). Photoshop®
CC was used to select either cover or open areas within the canopy (Figure B.5), yielding
leaf-on CC (%) and leaf-off WC (%) values.
13

Leader and Branch Characteristics: To sample branch angles, we photographed each
“feeder” branch greater than 20 mm diameter that intersected the leader judged to be
most central and/or vertical. The number of sizeable secondary leaders was noted (and
used to calculate total number of leaders, Ln, at the base of the canopy) and counts (but
not angles) of branches intersecting secondary leaders were used to generate a total
branch count (Bn) for the tree. Therefore, unless the tree had a single leader, the branch
angles calculated are for a subset of feeder branches. Photographs were taken
perpendicular to the initial direction of the branch and two angles were determined using
ImageJ software: 1) angle of intersection of the branch and leader and 2) average
(overall) angle from intersection to furthest extent of the branch (one or both of these
could be negative). Canopies were divided into upper, mid-, and lower sections, and
average intersection (upper, AIU; mid, AIM; and lower, AIL) and overall angles (upper,
AAU; mid, AAM; and lower, AAL) were found for each section as well as for the full tree
(intersection, AIF; and average, AAF). In addition, the inner, mid, and outer third of each
feeder branch was classified as either “continuous” (positive flow towards the bole) or
“discontinuous” (flow towards the dripline); if an inner- or mid-canopy segment was
discontinuous, so were all further segments of that branch, and if two of three segments
drained away from the bole, the branch was given an overall “discontinuous” rating. For
each tree, an overall frequency of discontinuous branch segments (FD) was calculated.
Bark Relief Index (BRI): We calculated a quantitative bark relief index using the ratio
of the furrowed circumference of the tree to the surface (unfurrowed) circumference at
breast height (1.3 m, or slightly higher or lower to avoid branches and deep scars) (Figure
B.6). The surface circumference was measured using a flexible measuring tape, while the
furrowed circumference was the length of a ribbon pushed into furrows and other surface
features around the bole at that same height. This measure is based on the same principles
and methods pioneered by Yarranton (1967) and Van Stan et al., (2010) to measure bark
microrelief. Overall bark roughness reflects bark relief in conjunction with other
characteristics (e.g., bark thickness, texture, and storage capacity; Levia and Herwitz,
2005; Van Stan and Levia, 2010) that were not quantified in this study.
14

Median Leaf Size (MLS): Samples of between 13 and 49 leaves were taken from each
tree (representing a gradient from canopy edge to interior) and were sorted in order of
size. The median leaf for each sample was scanned and its area calculated using
Photoshop® CC to yield MLS.
2.2.4 Data Analysis
Using exploratory cluster analysis (K-means method; IBM® SPSS® Statistics
Version 22, hereafter SPSS®) of 34 independent trait variables (not including Ln), the 37
study trees were assigned to clusters that corresponded to two general canopy
morphologies: single-leader (main stem with feeder branches intersecting it) and multi-
leader (two or more leaders converging at the base of the canopy, each of these
intersected by feeder branches). Given observations that SF drains to and along the
undersides of upright branches (e.g., Herwitz, 1987), it makes intuitive sense that SF
production processes might differ in trees with single, vertical trunks vs. multiple major
leaders. We therefore separated trees into Group A (single leader, n = 20) and Group B
(multi-leader, n = 17) for analysis.
Two measures are commonly used to describe the magnitude and efficiency of SF
concentration at the base of a tree. Stemflow volume as a percentage of rain incident on
the entire PCA can be interpreted along with TF and interception loss in the context of
canopy water balance (Rutter et al., 1975; Guevara-Escobar et al., 2007):
𝑆𝐹 % =𝑆𝐹
𝑃 ∙ 𝐶𝑃𝐴
where SF is in L, P is in mm, and PCA is in m2. The second measure, SF funneling ratio,
FR (Herwitz, 1986), is the ratio between SF volume collected at the base of the tree and
the volume that would have accumulated in a gauge the same area as the trunk basal area,
BA (m2):
𝐹𝑅 =𝑆𝐹
𝑃 ∙ 𝐵𝐴
15

Funneling ratio is independent of PCA, meaning that broad and narrow trees of similar
DBH and SF with similar FR could have very different SF % values. For each of these
measures of SF concentration, data was grouped into four rain-depth classes: I) < 2 mm,
II) 2 to < 5 mm, III) 5 to < 10 mm, and IV) ≥ 10 mm. Differences within and between
groups were analyzed in SPSS® using a one-way ANOVA with Tukey HSD post-hoc
(Tukey, 1953; see Zar, 1984). Data was tested for outliers (Grubbs, 1950) as well as
normality, and linearity of relationships between dependent and independent variables
was assessed. Where justified to improve normality or linearity, one of the following
transformations was applied: x2, x3, ln(x), x -1, or . Stepwise-up multiple regression
(Smith’s Statistical Package, hereafter SSP) was then used to explore the influence of tree
morphological traits for both SF % and FR for rain depth classes II, III, and IV (given the
sparsity of data in class I). Prior to finalizing each regression equation, we confirmed that
there was no unacceptable multicollinearity among independent variables (i.e., r2 < 0.64;
Hair et al., 1998).
2.3 RESULTS
2.3.1 Precipitation
A total of 327.9 mm of rain fell during 86 events recorded between June 12, 2012
and November 2, 2013, of which over 80 % were < 5 mm, consistent with climate
normals for Kamloops (Figure 2.1).
2.3.2 Study Tree Characteristics
The 37 isolated trees selected for this study represented 21 commonly used
ornamental species of diverse habits and sizes with DBH ranging from 10.2–68.7 cm
(Table 2.1). Mean measured or calculated values for the trait variables described above
are presented in Table 2.2 along with the range of each value for single- and multi-leader
trees. These 37 trees represent almost all isolated deciduous trees in the park; by
16

Figure 2.1. Rain depth frequency distribution during the study period compared to Canadian Climate Normals 1981–2010 for station Kamloops A* (Environment Canada, 2014).
calculating rainfall inclination angles and wind directions (section 3.2.4), we verified that
rain throughout the research period fell unobstructed on study tree canopies.
2.3.3 Stemflow for Individual Trees as a Percentage of Rainfall
Boxplots of both SF % and FR data are presented in Figures 2.2a–d. Grubbs’ test
was used to verify that none of the mean SF % or FR values were significant (p ≤ 0.05)
outliers within each tree group for each rain class (Grubbs, 1950).
The percentage of rainfall diverted by the canopies of the 37 study trees into SF
was largely negligible for events < 2 mm, with 10 of the 20 single-leader and 13 of the
17 multi-leader trees generating no more than < 0.1 % SF for any event in this small rain
depth class. The smallest rain depth to generate SF ≥ 0.1 % from single-leader trees was
1.0 mm, which produced 1.5 % SF from tree A-1. With the exception of A-1, single-
leader trees that produced SF did so only during the second largest (1.4 mm) and/or
largest (1.6 mm) rain event(s) in the rain depth class. Mean SF % for SF-producing
single-leader trees for these two rainfall events was 0.5 % (SD = 0.4 %) ranging from
17

Table 2.1. Single-leader (Group A) and multi-leader (Group B) study trees listed in ascending order of diameter at breast height, DBH, with associated overall height, H, average canopy width, CW, and projected canopy area, PCA.
1 of 1
ID Latin name Common name ��� (cm)
��(m)
�� (m)
������(m2)
A-1 Cercidiphyllum japonicum Katsuratree 10.2 5.7 3.7 11.1A-2 Cercis canadensis Eastern Redbud 10.5 4.9 4.0 13.5A-3 Quercus rubra Red Oak 11.4 6.3 5.1 17.6A-4 Prunus virginiana 'Shubert' Shubert Chokecherry 12.7 7.2 4.5 19.5A-5 Robinia pseudoacacia 'Purple Rain' Purple Rain Bl. Locust 14.6 7.9 6.9 34.1A-6 Gleditsia triacanthos Honeylocust 15.1 9.9 6.4 46.1A-7 Acer saccharinum Silver Maple 15.9 9.6 5.1 20.2A-8 Tilia cordata Littleleaf Linden 17.2 8.1 4.6 17.5A-9 Fraxinus pennsylvanica Green Ash 19.0 10.5 6.0 27.3
A-10 Acer rubrum columnar Columnar Red Maple 19.0 11.3 5.2 22.4A-11 Fraxinus pennsylvanica Green Ash 19.7 10.6 5.6 25.5A-12 Quercus rubra Red Oak 20.3 10.1 7.3 44.0A-13 Quercus macrocarpa Bur Oak 21.5 9.8 7.5 37.2A-14 Quercus robur columnar English Columnar Oak 23.5 14.6 2.8 6.3A-15 Acer x freemanii 'Armstrong' Armstrong Freeman Maple 24.1 13.1 3.5 11.1A-16 Aesculus hippocastanum Horsechestnut 31.0 10.8 5.8 27.7A-17 Prunus padus var. commutata Mayday Cherry 34.3 9.6 8.5 50.3A-18 Quercus palustris Pin Oak 43.0 14.1 13.6 149.1A-19 Quercus palustris Pin Oak 52.7 13.8 13.7 150.6A-20 Quercus palustris Pin Oak 60.7 24.7 14.2 164.8
B-1 Salix babylonica Weeping Willow 15.2 8.1 5.9 28.9B-2 Sorbus quercifolia Oak-leaf Mountain Ash 18.3 6.3 4.4 15.9B-3 Prunus virginiana 'Shubert' Shubert Chokecherry 18.8 8.5 6.6 35.2B-4 Gleditsia triacanthos 'Sunburst' Sunburst Honeylocust 21.0 8.7 7.8 52.5B-5 Acer platanoides Norway Maple 24.6 8.7 8.1 54.2B-6 Acer platanoides 'Crimson King' Crimson King Maple 26.0 8.9 5.3 23.4B-7 Fraxinus pennsylvanica Green Ash 28.9 12.6 7.5 43.5B-8 Acer platanoides Norway Maple 36.9 10.3 10.1 84.7B-9 Fagus grandifolia American Beech 38.8 11.0 9.3 65.8
B-10 Aesculus hippocastanum Horsechestnut 41.3 8.3 7.5 46.5B-11 Acer platanoides 'Crimson King' Crimson King Maple 43.0 12.0 10.7 99.7B-12 Tilia cordata Littleleaf Linden 46.0 11.2 7.6 43.5B-13 Fraxinus pennsylvanica Green Ash 51.8 13.0 14.2 163.8B-14 Robinia pseudoacacia Black Locust 54.3 10.5 11.2 103.0B-15 Catalpa speciosa Northern Catalpa 58.0 14.2 9.5 79.5B-16 Eleagnus angustifolia Russian Olive 66.8 16.8 15.1 206.6B-17 Acer saccharinum Silver Maple 68.7 18.6 16.7 214.5
18

Table 2.2. List of selected tree and canopy metrics indicating mean (range) values within Group A (n = 20) and Group B (n = 17).
0.2 % for A-5, A-7, and A-11 to 1.4 % for A-1. The smallest single rain depth to generate
SF > 0.1 % from multi-leader trees was 0.9 mm, for which SF from trees B-3 and B-9 was
1.0 % and 0.9 %, respectively. The other two multi-leader trees to generate SF in this rain
depth class (B-2 and B-5) did so for only the largest rain event (1.6 mm), with both trees
partitioning 1.0 % of rain into SF. Stemflow accounted for 2.3 % of this 1.6 mm rain for
trees B-3 and B-9.
With the exception of A-14 and A-15, no significant (p ≤ 0.05) difference in mean
SF % was found among single-leader trees across the three rain depth classes greater than
Table __. List of selected tree and canopy metrics indicating mean (range) values within group A (n = 20) and group B (n = 17).
Tree Trait Group A (single-leader) Group B (multi-leader) Mean Range Mean Range
Basic Tree DBH (cm) 23.8 (10.2–60.7) 38.7 (15.2–68.7) Size Metrics Tree Height, H (m) 10.6 (4.9–24.7) 11.1 (6.3–18.6)
Canopy Dimension
Canopy width, CW (m) 6.7 (2.8–14.2) 9.3 (4.4–16.7) Canopy height-to-width ratio, HWR 1.49 (0.79–4.13) 1.12 (0.71–1.47)
Metrics Projected canopy area, PCA (m2) 44.8 (6.3–164.8) 80.1 (15.9–214.5) Projected wood area, PWA (m2) 11.3 (1.4–54.9) 34.1 (2.6–109.4) Canopy volume, VolC, (m3) 371.2 (28.3–1801.2) 803.6 (56.9–3872.0) Wood volume, VolW (m3) 28.4 (1.0–183.5) 120.8 (3.1–551.4) Cover Metrics Canopy cover, CC (%) 89.3 (74.9–99.6) 92.4 (80.7–98.8)
Wood cover, WC (%) 23.1 (10.5–41.0) 37.8 (14.7–68.4) Branch and Branch count, Bn (no. branches) 28.2 (12–52) 59.3 (27–85)
Bark Metrics Leader count, Ln (no. leaders) 1.0 (1–1) 3.6 (2–6) Intersection angle, full tree avg, AIF (°) 43.6 (14.3–68.1) 44.8 (25.0–60.2) Intersection angle, upper 1/3 avg, AIU (°) 48.0 (20.4–75.1) 46.0 (22.6–58.8)
Average angle, full tree avg, AAF (°) 43.3 (18.2–77.0) 41.3 (6.5–66.2) Average angle, upper 1/3 avg,,AAU (°) 49.5 (13.5–83.0) 43.8 (-3.3–66.2) Frequency of discontinuity, full tree, FD 0.17 (0.00–0.48) 0.18 (0.00–0.59) Bark relief index, BRI (ratio) 1.08 (1.00–1.23) 1.18 (1.00–1.43) Leaf Size Median leaf size, MLS (cm2) 26.8 (1.4–92.2) 23.2 (1.8–71.6)
!
19

Figure 2.2a. Boxplots for stemflow % for single-leader (Group A) trees by rain depth class: I (< 2 mm), II (2 to < 5 mm), III (5 to < 10 mm), and IV (≥ 10 mm).
20

Figure 2.2b. Boxplots for stemflow % for multi-leader (Group B) trees by rain depth class: I (< 2 mm), II (2 to < 5 mm), III (5 to < 10 mm), and IV (≥ 10 mm).
21

Figure 2.2c. Boxplots for funneling ratio for single-leader (Group A) trees by rain depth class: I (< 2 mm), II (2 to < 5 mm), III (5 to < 10 mm), and IV (≥ 10 mm).
22
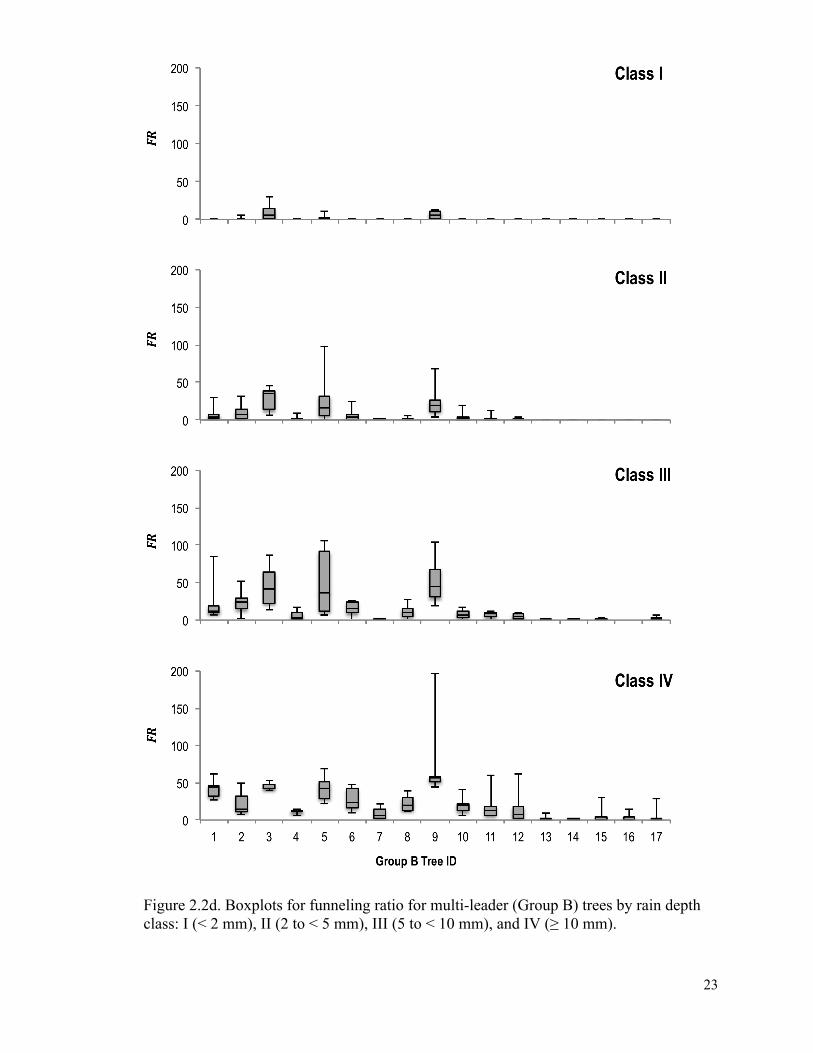
Figure 2.2d. Boxplots for funneling ratio for multi-leader (Group B) trees by rain depth class: I (< 2 mm), II (2 to < 5 mm), III (5 to < 10 mm), and IV (≥ 10 mm).
23

< 2 mm. Mean average rain depth class SF for these 18 trees was 0.7 ± 0.5 %, 1.7 ± 1.1 %,
and 2.3 ± 1.3 % for the 2 to < 5 mm, 5 to < 10 mm, and ≥ 10 mm classes, respectively.
Although mean SF % for A-14 for the 2 to < 5 mm class (2.5 ± 5.9 %) was not
significantly (p ≤ 0.05) greater than for other single-leader trees, it was for all but three
trees for the 5 to < 10 mm class (11.8 ± 9.1 %), and for all trees with the exception of A-15
for the ≥ 10 mm class (12.3 ± 8.4 %). A-15 partitioned a significantly (p ≤ 0.05) greater
percentage of rainfall into SF (3.6 ± 4.8 %) than six other single-leader trees for the 2 to
< 5 mm rain depth class, all trees with the exception of A-14 for the 5 to < 10 mm class
(12.0 ± 10.1 %), and 11 of the 19 other single-leader trees for the ≥ 10 mm rain depth class
(8.1 ± 4.1 %). At the individual rain-event scale, SF % was found to be quite large for A-
14 and A-15 for certain events. For example, A-14 generated 18.0, 21.7, and 22.8 % SF for
22.4, 8.8, and 25.6 mm rainfall events, respectively, while A-15 generated 12.3, 12.5, and
27.9 % SF for 7.8, 32.7, and 5.2 mm events, respectively. Stemflow % was also found to
be highly variable for A-14 and A-15, even for rainfalls of similar depths. A-14, for
example, although producing 13.1 % SF for a 4.6 mm rain event, did not partition any
rainfall to SF for a 5.6 mm event, while A-15 partitioned 11.1 % of a 2.9 mm rain event
into SF, but none of a 3.1 or 3.2 mm rainfall.
Under the 2 to < 5 mm rain depth class, multi-leader trees B-3 (2.3 ± 1.2 %), B-5
(2.2 ± 2.5 %), and B-9 (4.3 ± 3.6 %) had significantly (p ≤ 0.05) greater mean SF % than
4, 10, and 14 other multi-leader trees, respectively. Excluding B-3, B-5, and B-9,
average mean SF % for the 2 to < 5 mm rain depth class was 0.4 ± 0.5 %, ranging from
< 0.1 ± < 0.1 % for the five largest DBH trees in this tree group (B-13–B-17) to
1.4 ± 1.9 % for B-6. For the 5 to < 10 mm rain depth class, SF % (9.6 ± 6.7 %) for B-9
was significantly (p ≤ 0.05) greater than for 13 other multi-leader trees whose average
mean SF % was 1.1 ± 1.1 %. Mean SF % values for trees B-2 (4.0 ± 3.2 %), B-3
(3.6 ± 2.6 %), and B-5 (4.4 ± 4.0 %) were not significantly (p ≤ 0.05) greater than these
13 trees, nor were they significantly smaller than B-9 SF %. In the largest rain depth
class, ≥ 10 mm, B-9 SF % was significantly (p ≤ 0.05) larger than all other multi-leader
trees (9.9 ± 1.4 %), while B-6 partitioned a greater percentage (p ≤ 0.05) of rainfall into
24

SF (5.9 ± 3.4 %) than eight other trees in this group, including B-4 (0.7 ± 0.2 %), B-7
(1.2 ± 0.7 %), B-11 (1.7 ± 0.8 %), and the four largest DBH trees in this group (B-14–
B-17) whose SF % values ranged from 0.1 ± 0.1 % for B-16 to 0.7 ± 0.6 % for B-15. In
addition to the aforementioned statistically differing SF % values for this largest rain
depth class, B-13 SF % (0.2 ± 0.1 %) was also found to be significantly (p ≤ 0.05) lower
than that of B-2 (4.3 ± 3.5 %), B-3 (3.8 ± 0.6 %), and B-10 (4.1 ± 1.9 %), while B-16 and
B-17 (0.2 ± 0.2 %) SF % values were found to be significantly (p ≤ 0.05) lower than that
of B-2, and SF % for B-17 was significantly (p ≤ 0.05) lower than B-10. At the individual
rain-event scale, some notably large SF % values from multi-leader trees included 12.1
and 18.7 % from B-9 associated with 4.6 and 8.8 mm rain events, respectively, as well as
11.0 % SF from B-6 during a 32.7 mm event and 9.4 % SF from B-5 from a 9.7 mm
event.
2.3.4 Stemflow Funneling Ratios for Individual Trees
Event-scale FR values from single-leader trees in the < 2 mm rain depth class
ranged from zero for the 10 trees that did not produce SF in the class to 21.5 from A-5
during a 1.4 mm rain event. The 1.0 mm rain event that produced SF from A-1 had an
associated FR value of 20.6. Mean FR values for the two largest rain events in this class
(1.4 and 1.6 mm) from the 10 SF-producing single-leader trees in this rain depth class
were 4.8 ± 8.6 and 9.4 ± 6.4, respectively. For the multi-leader trees that produced SF for
events < 2 mm, B-3 and B-9 had FR values of 12.5 and 5.6, respectively, during a
0.9 mm rainfall, while for the 1.6 mm event, B-3 and B-9 had FR values of 30.8 and 13.5,
respectively, and B-2 and B-5 had values of 6.4 and 11.1.
For the 2 to < 5 mm rain depth class, the mean FR value of A-1 was found to be
20.8 ± 14.5 and was significantly (p ≤ 0.05) greater than that of A-11 (2.4 ± 5.7), A-12
(1.4 ± 3.0), and the five largest-DBH single-leader trees, whose mean FR values ranged
from 0.7 ± 1.6 for A-19 to 3.4 ± 3.9 for A-17. The mean FR value associated with A-5
(31.5 ± 20.9) for the 2 to < 5 mm rain depth class was significantly (p ≤ 0.01) larger than
all single-leader trees with the exception of A-1 and A-2. Funneling ratios for the multi-
25

leader trees in this rain depth class averaged 6.4 and ranged from < 0.1 ± < 0.1 for trees
B-14 and B-16, to 28.6 ± 15.0 for B-3. At the individual event scale for rain depths
5 to < 10 mm, FR values were found be as high as 56.4 from single-leader trees (A-1, 4.6
mm event) and 96.8 from multi-leader trees (B-5, 4.6 mm event). Although the range in
mean FR values for single-leader and multi-leader trees was large for the 5 to < 10 mm
rain depth class (3.2 ± 2.4 for A-19 to 50.7 ± 33.6 for A-1; < 0.1 ± < 0.1 for B-16 to 53.4
± 37.1 for B-9), the small number of events (n = 6) combined with the large variability of
FR in this rain depth class (mean coefficient of variation = 78.0 % for single leader trees,
106 % for multi-leader trees) meant that no significant (p ≤ 0.05) differences in FR were
found among the single-leader or multi-leader trees. For rain events > 10 mm, A-5 had a
mean FR value (58.6 ± 12.0) that was significantly greater than 12 of the 19 other single
leader trees, while A-12 had a significantly (p ≤ 0.05) greater mean FR value (38.4 ±
18.6) than did A-13 (4.8 ± 5.5). For multi-leader trees, with the exception of B-1 (49.4 ±
22.7), B-3 (45.1 ± 5.2), and B-5 (42.9 ± 18.6), B-9 (81.3 ± 64.9) had a mean FR that was
significantly (p ≤ 0.05) greater than the other 13 multi-leader trees, which averaged 13.4
and ranged from 1.1 ± 1.3 (B-14) to 28.1 ± 16.6 (B-6). Notable FR values for individual
events ≥ 10 mm include 117.8 by A-3 during a 9.7 mm event and 196.9 for B-9 during a
25.6 mm event.
2.3.5 Stemflow Percent and Funneling Ratios as a Function of Morphological Traits
As noted above, we observed high variability in event-scale SF % and FR within
and between tree Groups A (single-leader) and B (multi-leader) as well as for individuals
and groups between rain depth classes. Results of multiple regressions (Table 2.3)
indicate that different tree traits were associated with SF % vs. FR and with smaller vs.
larger rain depth classes, both within and between groups.
26

Table 2.3. Multiple regression equations for stemflow percentages and funneling ratios as functions of tree morphological traits (all coefficients significant at p ≤ 0.05), generated for single-leader (Group A, n = 20) and multi-leader trees (Group B, n = 17) in three rain depth classes.
2.4 DISCUSSION
It is well established that complex meteorological as well as tree morphological
factors contribute to observed variation in stemflow, SF (Levia and Frost, 2003; Van Stan
et al., 2011; Pypker et al., 2011). Chapter 3 will explore the role of both canopy traits and
storm meteorology on stemflow initiation thresholds, P”, and flow rates, QSF, as well as
seasonal aspects of this 37-tree study. This chapter analyzes the influence of canopy traits
on variation in SF % and FR.
Group A – Single leader Group B – Multi-leader
SF#%, 2 to < 5 mm
!(!.!"!!!"!!.!" !" !"#!!!!.!")!SEE!=!0.330,!r2!=!0.901
!(!!.!"!!"#!!.!"!!"#!!.!"!!!!!.!") SEE!=!1.229,!r2!=!0.882!
SF#%, 5 to < 10 mm
!(!.!!!!"#!!.!"!!"!!.!"!!!"!!.!") #
SEE!=!0.357,!r2!=!0.873!(7.39! 1
!"# +!0.03!!! ! + 0.06!!"# − 0.03!!"# − 9.19)!
SEE!=!0.333,!r2!=!0.881!SF#%, ≥ 10 mm!
!(!.!"!!"#!!.!"!!!!!.!"!!"#!!.!")#SEE!=!0.296,!r2!=!0.890#
(−0.18!!" + 0.0002!!!! − 2.55!!"# + 0.41!!!! + 4.31)! SEE#=!0.263,!r2!=!0.921!
FR, 2 to < 5 mm#
!(!!.!" !" !"#!!.!"!!"#!!.!"!!"#!!.!"!!!!!.!")##
SEE#=!0.402,!r2!=!0.886#74.87 1
!"# − 57.65
SEE!=!7.542,!r2!=!0.438!FR, 5 to < 10 mm#−14.56 ln!"# − 0.68!!! + 0.58!!"# + 97.86#
#SEE!=!8.498,!r2!=!0.729#
−990.10! 1!"# + 151.11 1
!"# − 91.20
SEE!=!12.906,!r2!=!0.573!FR, ≥ 10 mm#
646.86!!! − 10.45 ln!"# + 118.25!!"# − 97.83#SEE!=!7.902,!r2!=!0.676#
(−12.99!!"# + 0.16!!"# + 125.95! 1!"# + 9.18)!
SEE!=!1.066,!r2!=!0.792!!
27

2.4.1 Tree Size, Canopy Dimensions, and Branch Metrics
Numerous studies have found that diameter at breast height, DBH, positively
predicts SF volume. For example, Germer et al. (2010) found that SF yields in two
tropical tree species were correlated with DBH, but only for size classes > 10 cm.
Likewise, Park and Hattori (2002) showed that greater basal area, BA, was associated
with higher SF yields in a deciduous broad-leaved forest in central Japan. However, in
our study, when DBH was a significant (p ≤ 0.05) factor influencing Group B SF % for
2 to < 5 mm, it was negatively related. (The negative correlation of FR with DBH for all
three rain classes reflects that BA is in the denominator of the formula for FR). For
smaller rain events typical of the study region, the storage capacity, P”, of our largest
trees was rarely met (André et al., 2008; Valente et al., 1997); consequently, higher SF
yields for small rain events were generally associated with smaller trees and a suite of
size- and age-related variables correlated with lower DBH. When moderately sized trees
produced SF at low rain depths (e.g., 0.9 % SF was generated by B-9 for a 0.9 mm event),
we could often identify one or more conducive traits such as smooth bark, multiple
leaders, or upright branching habit as discussed in more detail below. For our study trees,
DBH was significantly correlated (Spearman’s r ≤ 0.05) with canopy width, tree height,
projected canopy area, canopy volume, wood cover, and bark relief index. These
variables appeared to work together in the larger study trees, limiting penetration of small
rainfalls to the SF-conducting woody infrastructure and promoting obstruction and
absorption of potential SF over the height and width of trees with deeply furrowed bark as
well as greater wood area and volume (Ford and Deans, 1978; Aboal et al., 1999).
However, the same combination of traits was associated with relatively higher SF
production for large rain events that more completely saturated the canopy: broader,
taller, denser canopies tend to capture more rainfall, particularly in windy conditions
(Xiao et al., 2000a; Van Stan et al., 2011), but whether this potential SF is efficiently
funneled to the base of the bole depends on factors other than size as discussed below
(Van Stan and Levia, 2010; Pypker et al., 2011).
28

While size-related variables clearly influence SF production, so did canopy shape
for small rain events in our study. The height-to-width ratio, HWR, was significantly
(p ≤ 0.05) inversely correlated with Group A funneling ratio, FR (negatively), and Group
B SF % (positively) for 2 to < 5 mm rain depths. The opposing relationships may reflect
that broader crowns (lower HWR) facilitate funneling from a broader area relative to BA
(higher FR) while columnar trees (high HWR) efficiently concentrate flow generated over
smaller areas (higher SF %), at least in part due to highly inclined branch angles (Levia
et al., 2013). A possible mechanism for this is the increased effective crown projection
area (Xiao et al., 2000a) presented by relatively tall, narrow trees to wind-driven rain
which can penetrate to the branches and bole more readily than in broader canopies (Van
Stan et al., 2011). This pattern was echoed in the ≥ 10 mm rain class where SF % was
inversely related to canopy width, CW, such that narrower canopies were associated with
higher SF yields on a per-canopy-area basis. As an example, the columnar form of A-15
may have contributed to a high event SF % value of 27.9 % from a 5.2 mm rainfall.
Group A SF % in the smallest rain class only was significantly (p ≤ 0.05) inversely
correlated with canopy volume, VolC, consistent with size-related patterns noted above.
Given lower P” values associated with smaller trees, our finding likely reflects that trees
with larger VolC generate little or no SF at rain depths < 5 mm. Few studies have found
relationships with VolC in trees (particularly isolated trees), but our finding is in contrast
with observations by Martinez-Meza and Whitford (1996) that SF volume was directly
related to canopy volume of Larrea tridentata, a desert shrub, leading them to suggest
that larger canopies in that species more efficiently redistribute limited rainwater to the
roots as a drought-resistance mechanism.
2.4.2 Cover Metrics
As noted above, wood cover, WC, was correlated with DBH and higher WC values
predicted greater SF % for one rain class each for single- and multi-leader trees. This is
consistent with recent findings by Levia et al. (2013) that higher SF yields in European
29

beech saplings were associated with higher total dry woody biomass and much higher
woody-to-foliar biomass ratios. Although canopy cover, CC, was not correlated with
DBH, it was significantly (p ≤ 0.05) positively related to Group A SF % for the largest
rain depth class and Group B SF % for 5 to < 10 mm events; however, CC was inversely
related to Group A FR for the latter rain depth class, suggesting that canopy density
interacts in complex ways with DBH, branch angles, and bark relief index, BRI. A
consistent finding in the literature is that leafless canopies produce more SF than those in
full leaf (e.g., Xiao and McPherson, 2011), and appear to be more sensitive to an array of
meteorological influences such as wind speed, rainfall intensity, and vapour pressure
deficit, VPD (Van Stan et al., 2014). In a detailed study of a single beech canopy,
Staelens et al. (2008) found that the defoliated condition was associated with lower
interception loss, higher SF yields, and lower SF initiation thresholds (1.5 mm for leafless
vs. 2.1 mm for leafed).
2.4.3 Leader and Branch Characteristics
The number of leaders, Ln, was significantly (p ≤ 0.05) positively correlated with
SF % for 2 to < 5 mm and ≥ 10 mm suggesting that, despite greater surface areas
associated with multiple leaders, they may play an important role in the convergence of
SF at the base of the canopy, particularly for smooth-barked trees. An example of this
combination of traits is the American beech (B-9) in our study that had six leaders and a
BRI of only 1.04; this tree produced SF at low rain depths and in consistently high
volumes relative to other trees of its size. For example, SF % values for B-9 for 4.6 mm
and 8.8 mm events were 12.1 % and 18.7 %, respectively. Variables with which Ln was
significantly (p ≤ 0.05) correlated included upper-canopy intersection angles, AIU, full-
tree intersection angles, AIF, and branch count, Bn (all positive) and frequency of
drainage discontinuity, FD (negative), reinforcing the importance of woody biomass and
high branch inclination angles (Levia et al., 2013) and suggesting that optimal funneling
30

of rain to SF is seen in smooth-barked, multi-leader trees with many inclined branches
draining continuously to the bole.
Branch count was a significant (p ≤ 0.05) factor for FR in single-leader trees
(inversely for class II and positively for class IV rain depth classes), but was not
significant for either SF % or FR in multi-leader trees or SF % in single-leader trees. For
small events, high Bn may increase P” due to increased woody surface area, but for larger
events when canopies are approaching saturation, additional branches serve as
infrastructure for flow to the bole. While branch count was not significantly correlated
with any other traits for multi-leader trees, it was correlated (p ≤ 0.05) with BRI and FD
(positively) and AIU, AIF, and CW (negatively) for single-leader trees, illustrating that for
this group of trees, plentiful branches may be associated with SF-enhancing and/or SF-
suppressing characteristics for storms of various rain depths. Levia et al. (2013) found
that higher SF was associated with higher primary and secondary branch counts in beech
saplings while Návar (1993) demonstrated this trend for semi-arid shrubs with the
number of branches angled at > 80° and mean branch angle both contributing to the best
predictive model. As noted before, this variable interacts with many others, and is likely
more important in conjunction with other factors than alone.
Positively correlated AIF explained more variation in SF % than any other trait for
single-leader trees (all rain depth classes), while upper-canopy average angle, AAU, was
positively related to SF % for class III events and AIU was positively related to FR for
Class II and III rain depths (p ≤ 0.05). For these trees, including some markedly columnar
individuals, steeper branch angles appeared to promote flow, a finding that is well
supported in the literature (Herwitz and Levia, 1997a; Herwitz, 1987; Xiao and
McPherson, 2011). For multi-leader trees, AIU was significantly (p ≤ 0.05) positively
correlated with SF % for class III events and on FR for class III and IV events; AIF,
however, was inversely related to SF % for class III events and to FR for the largest rain-
depth class. It is possible that when high-angle upper branches are efficiently conducting
SF, lower branches (intersecting the bole at lower angles) best contribute by collecting SF
31

at the dripline, making sense of the relationship between lower AIF and higher SF.
Individual trees with high branch angles in this study often had the highest mean and/or
event SF % and FR values; for example, A-14 generated 22.8 % SF from a 25.6 mm event
while A-1 had a mean FR of 20.8 ± 14.5 for 2 to < 5 mm rain depths and an event FR of
56.4 for a 4.6 mm event. In synthesizing findings on this topic, Pypker et al. (2011) point
out the trade-off between capture efficiency and SF generation as influenced by branch
angle, projected branch area, and total branch area, a trade-off that varies vertically
within individual trees as well as between individuals and species. Návar (1993)
documented that dominant branches in the upper canopies of three semi-arid shrub
species conducted a disproportionate quantity of SF, a result also found for trees. For
example, Hutchinson and Roberts (1981) concluded that 98 % of SF was generated in the
upper half of Douglas-fir canopies while Levia and Wubbena (2006) suggested that part
of the explanation may be smoother upper-bole bark water storage capacities that can be
half those of the lower bole.
2.4.4 Bark Relief
Bark relief had a variable effect depending on rain depth class and single- vs. multi-
leader form, a departure from patterns noted in other studies (Levia and Herwitz, 2005;
Van Stan and Levia, 2010; Livesley et al., 2014). The fact that higher BRI was associated
with higher SF % and FR in single-leader trees for the largest rain depth class suggests
that, once saturated, the increased surface area of more deeply fissured bark may enhance
SF. However, this pattern was reversed for multi-leader trees for all except SF % for the
smallest rain depth class, implying that smooth bark works with other characteristics
associated with multiple leaders (e.g., greater wood volume and area) to promote SF. For
rain events < 2 mm in our study, the two trees with the highest FR value in their
respective groups were A-5 (21.5 from a 1.4 mm event) and B-3 (30.8 from a 1.6 mm
event), likely reflecting the contribution of their smooth bark to funneling efficiency.
32

2.4.5 Leaf Size
Median leaf size was not significant (p ≤ 0.05) for either tree group in any of the
rain depth classes, which is not surprising given that this factor is only rarely reported in
the literature. In a study of six species in a laurel forest, Aboal et al. (1999) theorized that
relatively high SF efficiency of Erica arborea may have been due, in part, to its much
smaller leaf size.
2.4.6 Assessment of Predicted Patterns on an Individual Tree Basis
Among single-leader trees, SF % values for two trees stood out: A-14 and A-15. In
examining their traits relative to those in the regression equations, it is clear that they are
unremarkable in some aspects (DBH, BRI), but represent extremes of other traits. Their
height-to-width ratios are 4.1 (A-14) and 2.9 (A-15) compared to a group mean of 1.5 and
consequently their AAU, AIU, and AIF values are among the highest of Group A trees and
their canopy volumes are the lowest. Canopy cover measures are the highest in the group,
while WC values are in the upper end of the range. These two trees do illustrate a
seemingly optimal interaction of these traits, which have varying effects at different rain
depth classes, when calculated per PCA. On the other hand, FR is calculated per BA,
eliminating the “advantage” of tall, narrow trees. Figure 2.2c illustrates that FR, for A-14
and A-15, was significantly (p ≤ 0.05) greater than for other individuals, making it clear
that SF % and FR are distinct measures of SF efficiency, emphasizing the contribution of
a canopy relative to the tree’s PCA or BA, respectively ( Návar, 1993).
For multi-leader trees, B-9 had the greatest mean SF % values in all rain depth
classes as well as the highest event percentages, 12.1% for a 4.6 mm event and 18.7 %
for an 8.8 mm event. In the 2 to < 5 mm depth class, SF % was correlated with DBH
(inversely) as well as HWR and Ln (positively); the only trait for which B-9 departs from
the group average is the number of leaders (6 compared to Group B average of 3.6).
While BRI was not significant (p ≤ 0.05) at this rain depth, it is in the 5 to < 10 mm
category and, in combination with above-average AIU and below-average AIF, the
33
smooth bark of B-9 (BRI = 1.04) may have contributed to group-maximum values for this
American beech.
High FR values were observed for three single-leader trees at various rain depths:
A-1, A-3, and A-5. For the 2 to < 5 mm rain depth class, the smallest tree (A-1, 10.2 cm
DBH) had the highest mean FR (20.8 ± 14.5) and event FR (56.4 for a 4.6 mm event),
reflecting the importance of DBH and HWR (both inverse) and AIU (relatively high for
A-1 at 58.7°); given a value of Bn close to the group average, this tree’s small, smooth
branches were likely of secondary importance. For rain depths from 5 to < 10 mm, A-3
had a group-maximum FR of 117.8 from a 9.7 mm event; this tree’s small DBH (18.8 cm)
and slightly above-average AIU were conducive to SF production, but the other
significant (p ≤ 0.05) trait for this rain depth class, CC, was above average for this tree,
whereas the regression indicated that lower CC was associated with higher FR. We
suggest that the exceptionally smooth bark of B-3 (BRI 1.01) magnified the importance of
other conducive traits. Finally, the highest event FR for multi-leader trees for rain depths
< 2 mm was 21.5 for a 1.4 mm event for A-5, which also had the highest mean FR of
58.6 ± 12.0 for the ≥ 10 mm category. For both small (2 to < 5 mm) and the largest depth
classes, FR was inversely related to DBH (relatively small at 14.6 cm for A-5); at small
depths, the small HWR, high AIU, and very low Bn of A-5 explain its high SF production,
whereas at depths ≥ 10 mm, its small DBH is the only significant (p ≤ 0.05) variable
associated with high FR. Its semi-smooth bark (BRI 1.07) and low Bn should not promote
SF, but this may be a case where the interaction of smooth bark with other traits results in
patterns that don’t fully reflect the regression equations based on group data.
For multi-leader trees, high mean and event FR was noted for three trees: B-3, B-5,
and B-9. At the smallest rain depths, an event high FR of 30.8 was recorded for a 1.6 mm
event for B-3; this same tree had a mean FR of 28.6 ± 15.0 for the 2 to < 5 mm depth
class. The only factor that was significant (p ≤ 0.05) for Group B FR in that depth class
was BRI, explaining such high production from B-3 (BRI = 1.01). In this same depth
class, B-5 had a FR of 96.8 from a 4.6 mm event; BRI was moderate in this tree (1.10),
34

but the presence of four leaders and above-average branching angles may explain this
high FR (as may the trend in single-leader trees of high SF % and FR for trees with
deeply furrowed bark during large events). Once again, B-9 emerged as a high producer
with a FR mean of 81.3 ± 64.9 for events ≥ 10 mm and an event maximum of 196.9 for a
25.6 mm event. The very smooth bark of this tree (BRI = 1.04), its high AIU (54.5 vs.
group average of 46.0), and its low AIF (36.8 vs. group average of 44.8) support the
relevance of variables identified as significant (p ≤ 0.05) in the regression equation for
this depth category.
2.5 CONCLUSION
This systematic investigation of the influence of various canopy traits on
stemflow percent and funneling ratio has generally confirmed the importance of some
deciduous tree characteristics found by other researchers to be correlated with increased
stemflow, including small diameter at breast height (primarily for single-leader funneling
ratios) and high branch angles. An exception to the latter trend in our study was the
inverse relationships between 1) full-canopy average branch angles and stemflow percent
for rain depths of 5 to < 10 mm and 2) full-canopy intersection angles and funneling
ratios for rain depths ≥ 10 mm for multi-leader trees.
By identifying inconsistencies in some patterns, our study has emphasized the
importance of understanding the differential importance of certain traits for various rain
depth classes and in trees of different forms. For example, bark relief index was directly
correlated with stemflow percent and funneling ratio for rain depths ≥ 10 mm, but only
for single-leader trees; however, higher stemflow percent and funneling ratio in multi-
leader trees were correlated with smoother bark. To our knowledge, this is the first study
that has found the number of leaders converging at the base of a canopy to be
significantly (p ≤ 0.05) correlated with stemflow production; we look forward to future
research on this morphological trait.
35

As found in virtually all stemflow studies to date, the variability in stemflow yields,
stemflow percentages, and funneling ratios is high, even when a relatively uniform
sample of trees is available. Chapter 3 will address meteorological characteristics that
tend to interact with canopy structure differently in each season as well as potential
stemflow yield patterns associated with different precipitation types. Based on
generalized findings of this and other studies, we recommend the following in order to
promote stemflow production and minimize stormwater runoff in urban environments:
• Ensure that sufficient infiltration capacity is available at the base of trees for
stemflow volumes estimated with the region’s storm regime and tree’s mature size
in mind. Spatially concentrated stemflow has the potential to be more readily
managed than highly dispersed throughfall.
• In climates with mostly small rain events, select trees that will stay small as they
tend to produce stemflow at lower rain depths and in greater quantities than large
trees. If large rain events are frequent, larger canopies tend to produce more
stemflow once they are saturated.
• In combination with other traits, canopy and wood cover were positively associated
with stemflow production. Prepare for potentially greater stemflow yields from
leafless canopies in the dormant season, particularly if mixed precipitation is
common in your region.
• Select trees with multiple leaders or many major branches converging at the base of
the canopy; this trait was correlated with high stemflow production for a range of
rain depths, particularly in concert with high branch angles and smooth bark.
• Select trees with relatively high branch intersection angles as this trait promotes
stemflow at all rain depths.
• In general, select trees with smooth bark as they tend to have lower storage
capacities (and thus lower stemflow initiation thresholds) and higher stemflow
yields. However, if planting or managing single-leader trees, be aware that deeply
36

furrowed bark was correlated with efficient stemflow production for rain events
≥ 10 mm, possibly reflecting enhanced conduction over a greater saturated surface
area.
Further research is needed on stemflow as well as throughfall and interception-loss
in isolated cultivated trees, both deciduous and coniferous, in urban areas representing a
wide range of climatic conditions. Evidence is growing that canopy water balance in
these solitary urban trees reflects different interactions of canopy traits and storm
characteristics than those observed in closed-canopy forests.
37

2.6 REFERENCES
Aboal, J., Morales, D., Hernández, M., Jiménez, M., 1999. The measurement and modelling of the variation of stemflow in a laurel forest in Tenerife, Canary Islands. Journal of Hydrology 221, 161–175.
Akbari, H., Pomerantz, M., Taha, H., 2001. Cool surfaces and shade trees to reduce energy use and improve air quality in urban areas. Solar Energy 70, 295–310.
André, F., Jonard, M., Ponette, Q., 2008. Influence of species and rain event characteristics on stemflow volume in a temperate mixed oak–beech stand. Hydrological Processes 22, 4455– 4466.
Asadian, Y., Weiler, M., 2009. A new approach in measuring rainfall interception by urban trees in coastal British Columbia. Water Quality Research Journal of Canada 44, 16–25.
Brooks, K., Ffolliott, P., Gregersen, H., DeBano, L., 2003. Hydrology and the Management of Watersheds, 2nd ed. Iowa State Press, Ames, IA.
Carlyle-Moses, D.E., Gash, J.H.C., 2011. Rainfall interception loss by forest canopies, in: Levia, D.F., Carlyle-Moses, D., Tanaka, T. (Eds.), Forest Hydrology and Biochemistry: Synthesis of Past Research and Future Directions, Ecological Studies. Springer Netherlands, Dordrecht, pp. 407–424.
Carlyle-Moses, D.E., Lishman, C.E., McKee, A.J., 2014. A preliminary evaluation of throughfall sampling techniques in a mature coniferous forest. Journal of Forestry Research 25, 407–413.
Crabtree, R., Trudgill, S., 1985. Hillslope hydrochemistry and stream response on a wooded, permeable bedrock: The role of stemflow. Journal of Hydrology 80, 161–178.
Dwyer, J., McPherson, E., Schroeder, H., Rowntree, R., 1992. Assessing the benefits and costs of the urban forest. Journal of Arboriculture 18, 227–234.
Environment Canada. 2014. Canadian Climate Normals. Station Name: Kamloops A*. Webpage. URL http://climate.weather.gc.ca/climate_normals/index_e.html (accessed June 1, 2014).
Ford, E., Deans, J., 1978. The effects of canopy structure on stemflow, throughfall and interception loss in a young Sitka spruce plantation. Journal of Applied Ecology 15, 905–917.
Frost, E.E., Levia, D.F., 2013. Hydrologic variation of stemflow yield across co-occurring dominant canopy trees of varying mortality. Ecohydrology. doi: 10.1002/eco.1397.
Germer, S., Werther, L., Elsenbeer, H., 2010. Have we underestimated stemflow? Lessons from an open tropical rainforest. Journal of Hydrology 395, 169–179.
38

Goddard, M., Dougill, A., Benton, T., 2010. Scaling up from gardens: Biodiversity conservation in urban environments. Trends in Ecology & Evolution 25, 90–98.
Goodall, D., 1965. Plot-less tests of interspecific association. Journal of Ecology 53, 197–210.
Gorman, J., 2004. Residents’ opinions on the value of street trees depending on tree location. Journal of Arboriculture 30, 36–44.
Grubbs, F., 1950. Sample criteria for testing outlying observations. The Annals of Mathematical Statistics 21, 27–58.
Guevara-Escobar, A., González-Sosa, E., Véliz-Chávez, C., Ventura-Ramos, E., Ramos-Salinas, M., 2007. Rainfall interception and distribution patterns of gross precipitation around an isolated Ficus benjamina tree in an urban area. Journal of Hydrology 333, 532–541.
Hair, J., Anderson, R., Tatham, R., Black, W., 1998. Multivariate Data Analysis, 5th edition. Prentice Hall, Upper Saddle River, NJ.
Herwitz, S., Levia, D., 1997. Mid-winter stemflow drainage from bigtooth aspen in central Massachusetts. Hydrological Processes 11, 169–175.
Herwitz, S.R., 1986. Infiltration-excess caused by stemflow in a cyclone-prone tropical rainforest. Earth Surface Processes and Landforms 11, 401–412.
Herwitz, S.R., 1987. Raindrop impact and water flow on the vegetative surfaces of trees and the effects on stemflow and throughfall generation. Earth Surface Processes and Landforms 12, 425–432.
Hutchinson, I., Roberts, M.C., 1981. Vertical variation in stemflow generation. Journal of Applied Ecology 18, 521–527.
Inkiläinen, E.N.M., McHale, M.R., Blank, G.B., James, A.L., Nikinmaa, E., 2013. The role of the residential urban forest in regulating throughfall: A case study in Raleigh, North Carolina, USA. Landscape and Urban Planning 119, 91–103.
Johnson, M.S., Lehmann, J., 2006. Double-funneling of trees: Stemflow and root-induced preferential flow. Ecoscience 13, 324–333.
Levia, D., Carlyle-Moses, D., Tanaka, T. (Eds.), 2011. Forest Hydrology and Biogeochemistry: Synthesis of Past Research and Future Directions, Ecological Studies. Springer Science+Business Media.
Levia, D., Frost, E., 2003. A review and evaluation of stemflow literature in the hydrologic and biogeochemical cycles of forested and agricultural ecosystems. Journal of Hydrology 274, 1–29.
Levia, D.F., Frost, E.E., 2006. Variability of throughfall volume and solute inputs in wooded ecosystems. Progress in Physical Geography 30, 605–632.
39

Levia, D.F., Herwitz, S.R., 2005. Interspecific variation of bark water storage capacity of three deciduous tree species in relation to stemflow yield and solute flux to forest soils. Catena 64, 117–137.
Levia, D.F., Michalzik, B., Näthe, K., Bischoff, S., Richter, S., Legates, D.R., 2013. Differential stemflow yield from European beech saplings: The role of individual canopy structure metrics. Hydrological Processes 2–9.
Levia, D.F., Wubbena, N.P., 2006. Vertical variation of bark water storage capacity of Pinus strobus L. (Eastern White Pine) in Southern Illinois. Northeastern Naturalist 13, 131–137.
Li, X.-Y., Liu, L.-Y., Gao, S.-Y., Ma, Y.-J., Yang, Z.-P., 2008. Stemflow in three shrubs and its effect on soil water enhancement in semiarid loess region of China. Agricultural and Forest Meteorology 148, 1501–1507.
Liang, W.-L., Kosugi, K., Mizuyama, T., 2009. A three-dimensional model of the effect of stemflow on soil water dynamics around a tree on a hillslope. Journal of Hydrology 366, 62–75.
Liu, C., Li, X., 2012. Carbon storage and sequestration by urban forests in Shenyang, China. Urban Forestry & Urban Greening 11, 121–128.
Livesley, S.J., Baudinette, B., Glover, D., 2014. Rainfall interception and stem flow by eucalypt street trees – The impacts of canopy density and bark type. Urban Forestry & Urban Greening 13, 192–197.
Lohr, V.I., Pearson-Mims, C.H., Tarnai, J., Dillman, D.A., 2004. How urban residents rate and rank the benefits and problems associated with trees in cities. Journal of Arboriculture 30, 28–35.
Martinez-Meza, E., Whitford, W.G., 1996. Stemflow, throughfall and channelization of stemflow by roots in three Chihuahuan desert shrubs. Journal of Arid Environments 32, 271–287.
Masukata, H., Garden, B., Science, F., 1990. Throughfall, stemflow and interception of rainwater in an evergreen broadleaved forest. Ecological Research 5, 303–316.
McPherson, E., Nowak, D., Heisler, G., Grimmond, S., Souch, C., Grant, R., Rowntree, R., 1997. Quantifying urban forest structure, function, and value: The Chicago Urban Forest Climate Project. Urban Ecosystems 1, 49–61.
McPherson, E., Simpson, J., Peper, P., Xiao, Q., 1999. Benefit-cost analysis of Modesto’s municipal urban forest. Journal of Arboriculture 25, 235–248.
McPherson, E.G., Simpson, J.R., Xiao, Q., Wu, C., 2011. Million trees Los Angeles canopy cover and benefit assessment. Landscape and Urban Planning 99, 40–50.
Michopoulos, P., 2011. Biogeochemistry of urban forests, in: Levia, D.F., Carlyle-Moses, D., Tanaka, T. (Eds.), Forest Hydrology and Biogeochemistry: Synthesis of Past Research and Future Directions. Springer Netherlands, pp. 341–353.
40

Miller, R.W., 1997. Planning and Urban Forestry, in: Urban Forestry: Planning and Managing Urban Greenspaces. Prentice Hall, pp. 167–185.
Návar, J., 1993. The causes of stemflow variation in 3 semiarid growing species of northeastern Mexico. Journal of Hydrology 145, 175–190.
Nowak, D., Crane, D., Stevens, J., 2006. Air pollution removal by urban trees and shrubs in the United States. Urban Forestry & Urban Greening 4, 115–123.
Nowak, D.J., Hirabayashi, S., Bodine, A., Hoehn, R., 2013. Modeled PM2.5 removal by trees in ten U.S. cities and associated health effects. Environmental Pollution 178, 395–402.
Park, H.-T., Hattori, S., 2002. Applicability of Stand Structural Characteristics to Stemflow Modeling. Journal of Forest Research 7, 91–98.
Peng, H., Zhao, C., Feng, Z., Xu, Z., Wang, C., Zhao, Y., 2014. Canopy interception by a spruce forest in the upper reach of Heihe River basin, Northwestern China. Hydrological Processes 28, 1734–1741.
Peper, P., McPherson, E., Simpson, J., Gardner, S., Vargas, K., Xiao, Q., 2007. New York City Municipal Forest Resource Analysis. New York City, New York.
Peper, P., McPherson, E., Simpson, J., Vargas, K., Xiao, Q., 2008. City of Indianapolis Municipal Forest Resource Analysis. Indianapolis, Indiana.
Pothier, A., Millward, A., 2013. Valuing trees on city-centre institutional land: An opportunity for urban forest management. Journal of Environmental Planning and Management 56, 1380–1402.
Pypker, T., Levia, D., Staelens, J., Van Stan, J., 2011. Canopy structure in relation to hydrological and biogeochemical fluxes, in: Levia, Delphis F., Carlyle-Moses, DE, Tanaka, T. (Ed.), Forest Hydrology and Biochemistry: Synthesis of Past Research and Future Directions. Springer, Dordrecht, pp. 371–388.
Roy, S., Byrne, J., Pickering, C., 2012. A systematic quantitative review of urban tree benefits, costs, and assessment methods across cities in different climatic zones. Urban Forestry & Urban Greening 11(4), 351–363.
Rutter, A., Morton, A., Robin, P., 1975. A Predictive Model of Rainfall Interception in Forests. II. Generalization of the Model and Comparison with Observations in Some Coniferous and Hardwood Stands. The Journal of Applied Ecology 12, 367–380.
Saito, T., Matsuda, H., Komatsu, M., Xiang, Y., Takahashi, A., Shinohara, Y., Otsuki, K., 2013. Forest canopy interception loss exceeds wet canopy evaporation in Japanese cypress (Hinoki) and Japanese cedar (Sugi) plantations. Journal of Hydrology 507, 287–299.
Sander, H., Polasky, S., Haight, R.G., 2010. The value of urban tree cover: A hedonic property price model in Ramsey and Dakota Counties, Minnesota, USA. Ecological Economics 69, 1646–1656.
41

Sanders, R.A. 1986. Urban vegetation impacts on the hydrology of Dayton, Ohio. Urban Ecology 9, 361–376.
Soares, A.L., Rego, F.C., McPherson, E.G., Simpson, J.R., Peper, P.J., Xiao, Q., 2011. Benefits and costs of street trees in Lisbon, Portugal. Urban Forestry & Urban Greening 10, 69–78.
Staelens, J., De Schrijver, A., Verheyen, K., Verhoest, N.E.C., 2008. Rainfall partitioning into throughfall, stemflow, and interception within a single beech (Fagus sylvatica L.) canopy: Influence of foliation, rain event characteristics, and meteorology. Hydrological Processes 22, 33–45.
Stagoll, K., Lindenmayer, D.B., Knight, E., Fischer, J., Manning, A.D., 2012. Large trees are keystone structures in urban parks. Conservation Letters 5, 115–122.
Tanaka, T., 2011. Effects of the canopy hydrologic flux on groundwater, in: Levia, Delphis F., Carlyle-Moses, D.,Tanaka, T. (Eds.), Forest Hydrology and Biochemistry: Synthesis of Past Research and Future Directions. Springer, Dordrecht, pp. 499–518.
Tanaka, T., Taniguchi, M., Tsujimura, M., 1996. Significance of stemflow in groundwater recharge. 2. A cylindrical infiltration model for evaluating the stemflow contribution to groundwater recharge. Hydrological Processes 10, 81–88.
Taniguchi, M., Tsujimura, M., Tanaka, T., 1996. Significance of stemflow in groundwater recharge. 1: Evaluation of the stemflow contribution to recharge using a mass balance approach. Hydrological Processes 10, 71–80.
Tukey, J.W. 1953. The problem of multiple comparisons. Department of Statistics, Princeton University, Princeton, NJ. Unpublished report.
Tyrväinen, L., Pauleit, S., Seeland, K., Vries, S. De, 2005. Benefits and Uses of Urban Forests and Trees, in: Konijnendijk, C., Nilsson, K., Randrup, T., Schipperijn, J. (Eds.), Urban Forests and Trees: A Reference Book. Berlin, pp. 81–114.
Tzoulas, K., Korpela, K., Venn, S., Yli-Pelkonen, V., Kaźmierczak, A., Niemela, J., James, P., 2007. Promoting ecosystem and human health in urban areas using Green Infrastructure: A literature review. Landscape and Urban Planning 81, 167–178.
Valente, F., David, J.S., Gash, J.H.C., 1997. Modelling interception loss for two sparse eucalypt and pine forests in central Portugal using reformulated Rutter and Gash analytical models. Journal of Hydrology 190, 141–162.
Van Stan, J., Jarvis, M., Levia, D., 2010. An automated instrument for the measurement of bark microrelief. IEEE Transactions on Instrumentation and Measurement 59, 491–493.
42

Van Stan, J., Levia, D., 2010. Inter- and intraspecific variation of stemflow production from Fagus grandifolia Ehrh. (American beech) and Liriodendron tulipifera L. (yellow poplar) in relation to bark microrelief in the eastern United States. Ecohydrology 3, 11–19.
Van Stan, J.T., Siegert, C.M., Levia, D.F., Scheick, C.E., 2011. Effects of wind-driven rainfall on stemflow generation between codominant tree species with differing crown characteristics. Agricultural and Forest Meteorology 151, 1277–1286.
Van Stan, J.T., Van Stan, J.H., Levia, D.F., 2014. Meteorological influences on stemflow generation across diameter size classes of two morphologically distinct deciduous species. International Journal of Biometeorology (online) 1–11.
Vico, G., Revelli, R., Porporato, A., 2014. Ecohydrology of street trees: Design and irrigation requirements for sustainable water use. Ecohydrology 7, 508–523.
Wei, X., Liu, S., Zhou, G., Wang, C., 2005. Hydrological processes in major types of Chinese forest. Hydrological Processes 19, 63–75.
Whitford, W.G., Anderson, J., Rice, P.M., 1997. Stemflow contribution to the “fertile island” effect in creosotebush, Larrea tridentata. Journal of Arid Environments 35, 451–457.
Xiao, Q., McPherson, E., 2011. Rainfall interception of three trees in Oakland, California. Urban Ecosystems 14, 755–769.
Xiao, Q., McPherson, E.G., Ustin, S.L., Grismer, M.E., 2000a. A new approach to modeling tree rainfall interception. Journal of Geophysical Research 105, 29173–29188.
Xiao, Q., McPherson, E.G., Ustin, S.L., Grismer, M.E., Simpson, J.R., 2000b. Winter rainfall interception by two mature open-grown trees in Davis, California. Hydrological Processes 14, 763–784.
Yarranton, G., 1967. An instrument for measuring the microrelief of bark. Canadian Journal of Botany 45, 1173–1178.
Zar, J.H. 1984. Biostatistical Analysis. 2nd edition. Prentice-Hall Inc. Englewood Cliffs, NJ. 718 pp.
Zhongjie, S., Yanhui, W., Lihong, X., Wei, X., Pengtao, Y., Jixi, G., Linbo, Z., 2010. Fraction of incident rainfall within the canopy of a pure stand of Pinus armandii with revised Gash model in the Liupan Mountains of China. Journal of Hydrology 385, 44–50.
43
CHAPTER 3 TREE TRAITS AND METEOROLOGICAL FACTORS
INFLUENCING THE INITIATION AND RATE OF STEMFLOW FROM ISOLATED DECIDUOUS TREES
3.1 INTRODUCTION
Given the hydrological implications of vegetation-related planning and
management decisions in forested, agricultural, and urban settings, it is critical to refine
our understanding of the processes at this interface of the atmospheric and terrestrial
hydrological cycles. Tree canopy water balances have been most actively studied and
modelled since the 1970s (Rutter et al., 1971; Gash, 1979) from single-tree (David et al.,
2006; Guevara-Escobar et al., 2007) to stand scales (Carlyle-Moses and Price, 1999,
2007), in semi-arid (Návar, 2011) and arid (Llorens and Domingo, 2007) to tropical
ecosystems (Herwitz, 1985; Germer et al., 2010), and from the varied perspectives of
canopy architecture (Park and Cameron, 2008), meteorology (Van Stan et al., 2011),
biogeochemistry (Neary and Gizyn, 1994; Michopoulos, 2011), and groundwater
recharge (Taniguchi et al., 1996).
Precipitation incident on vegetation canopies is partitioned into 1) interception loss,
the portion directly evaporated from leaf and wood surfaces; 2) throughfall, TF, which
reaches the ground directly through gaps or drips from the canopy; and 3) stemflow, SF,
which is funneled to the base of the plant via the branch infrastructure and bole (Helvey
and Patric, 1965; Valente et al., 1997). In broadleaf deciduous forests, understory
precipitation in the form of TF and SF can represent from 70–80 % and 3–10 % of rain
incident on the canopy, respectively (Llorens and Domingo, 2007; Van Stan et al., 2011).
However, compared to the dispersed nature of TF inputs to the forest floor, the
concentration of SF in a much smaller area means that this volumetrically minor quantity
can have a disproportionate impact on the terrestrial hydrological cycle (Levia and Frost,
2003; Staelens et al., 2007; Germer et al., 2010; Levia et al., 2010). As in natural and
managed forests, areas at the base of urban tree trunks can constitute hot spots (and hot
44

moments) of hydrological and biogeochemical enrichment (e.g., McClain et al., 2003;
Staelens et al., 2007). Implications of this concentrated flux are intensified in urban
landscapes characterized by impervious surfaces, compacted and constrained soils, and
high pollutant levels (Xiao and McPherson, 2011). Extremes of drought and flood are
common outcomes of meteorological variability in cities, making trees appealing as
potential rainfall interceptors (Xiao et al., 2007; Inkiläinen et al., 2013; Livesley et al.,
2014). Trees of certain forms in some climates (e.g., Germer et al., 2010) may funnel
sufficient SF to create water quantity and quality issues in urban conditions. In conducive
planting sites, however, high SF producers have the potential to self-irrigate and self-
nourish (Levia and Frost, 2003), to direct pollutants from canopies to soils for
biofiltration (Xiao et al., 2007), and even to recharge groundwater via preferential
pathways along roots (Tanaka, 2011).
There is some evidence that SF processes in urban trees, particularly those isolated
from their neighbours, differ from those observed in natural forest stands (Xiao et al.,
2000; Guevara-Escobar et al., 2007), meaning that findings from forested environments
cannot necessarily be applied in single-tree situations (Livesley et al., 2014). The
empirically based model developed by Xiao et al. (2000) confirms the relevance of three
broad influences on SF: 1) magnitude and duration of rain; 2) meteorological conditions
during the storm; and 3) canopy characteristics of the tree. Research on these factors in
non-urban forests around the world is now readily available (e.g., Staelens et al., 2008;
Levia et al., 2011), but fewer studies have been done in urban settings and for isolated
trees (Xiao et al., 2000; Guevara-Escobar et al., 2007; Livesley et al., 2014).
Rain depth is commonly the dominant meteorological predictor of SF volume
(Germer et al., 2010; Návar, 2011), but there is evidence that other meteorological factors
can play a role, including storm duration (Levia, 2004), rainfall intensity (Calder, 2001;
Price and Carlyle-Moses, 2003), wind speed (André et al., 2008b) and direction (Van
Stan et al., 2011), rainfall inclination angle (Van Stan et al., 2011), and vapour pressure
deficit, VPD (Van Stan et al., 2014b). Little study has been done on the importance of
within-storm break duration; however, André et al. (2008a) found, for a temperate oak-
45

beech forest in Belgium, that both storage capacities and SF initiation thresholds were
affected by the ratio of cumulated potential evaporation for the dry period preceding the
storm to volume of rainfall associated with the previous storm event.
In general, studies focusing on canopy traits point to the collective importance of a
tree’s SF-conducting infrastructure (Pypker et al., 2011; Levia et al., 2013). Diameter at
breast height, DBH, is usually a strong predictor of SF production (Deguchi et al., 2006;
André et al., 2008b; Šraj et al., 2008; Germer et al., 2010; Van Stan and Levia, 2010), but
studies showing high yields for small trees (Germer et al., 2010; Levia et al., 2013) are
stimulating further research.
Other factors influencing SF production include effective canopy area, which is
greater for columnar trees where inclined rainfall is common (Xiao et al., 2000; Guevara-
Escobar et al., 2007), particularly in sparse forests and for isolated trees (Herwitz and
Slye, 1995). Canopy cover fraction, canopy volume, and leaf area index, LAI, have been
explored (e.g., Marin et al., 2000; Park and Hattori, 2002; Xiao and McPherson, 2011),
but their influence cannot be generalized across species, ecosystems, or rainfall regimes
(Pypker et al., 2011).
Wood cover fraction and the volume of wood within the tree canopy have
implications for SF, particularly during seasonal defoliation; increased SF in leaf-off
condition has often been observed (André et al., 2008b; Dunkerley, 2013). Recently,
Levia et al. (2013) measured woody as well as foliar biomass for 10 European beech
saplings, concluding that greater SF yields were associated with both higher woody
surface area per unit projected canopy area, PCA, and higher ratios of woody to foliar
biomass; other influential metrics included branch count per unit PCA and mean branch
inclination angle. Increasing branch inclination is conducive only to a point as nearly
vertical branches present minimal surface area to rain and drip TF while being subject to
greater drip loss themselves; Herwitz (1987) observed linear (dry branches) then
logarithmic (saturated branches) increases in detention of droplets, with > 80 % of
rainfall captured at inclinations above 60°.
46

Bark relief is one trait that clearly limits SF through at least two mechanisms:
increased storage capacity per unit area (Herwitz, 1985; Levia and Herwitz, 2005) and
greater surface areas associated with deeply furrowed bark (Van Stan and Levia, 2010).
Leaf size has been studied less than composite canopy measures, although
hydrophobicity and inclination angles have been explored (Holder, 2012). In their model,
Xiao et al. (2000) found high sensitivity of SF to increases in leaf zenith angles.
In general, research to date suggests that, for trees of comparable size, SF
production tends to be greater if a tree has a moderately dense canopy, high woody-to-
foliar biomass ratio, highly inclined branching angles, and smooth bark, acknowledging
that different meteorological regimes can enhance or diminish the importance of these
characteristics. Such generalizations are based on numerous different studies of diverse
species from different climatic regions, making definite conclusions on the role of
individual traits and meteorological factors problematic. This study took a systematic
approach, focusing on diverse and detailed canopy traits at a relatively contained site
(ensuring that all trees were subject to similar meteorological forces). Specific objectives
of the study were to:
1. derive, for each tree, the threshold rain depth, P”, and the flow rate once P” has been
satisfied, QSF ;
2. characterize relationships between canopy traits and SF threshold, rate, and yield; and
3. identify meteorological and seasonal variables that influence SF yield.
3.2 STUDY AREA AND METHODS
3.2.1 Study Area
McArthur Island Park (MIP) in the City of Kamloops, British Columbia, Canada
(50° 41’ 43” N, 120° 22’ 38” W, elevation 344 m a.m.s.l.), is a 51-ha multi-use sport and
leisure facility on the north shore of the Thompson River (Figures B.1 and B.2). The site
47

encompasses several tree stands, including fairly continuous tree and shrub cover in the
riparian zone of the slough that borders the park on the east, north, and west. However,
many trees within the perimeter access road at MIP are isolated, which, for the purpose of
this study, refers to those trees with no obstructions, including other tree canopies,
extending into a field of view 35° from vertical and centred where the lowest branch
meets the bole. (Methods described below were used to verify that no inclined rainfall
was obstructed by neighbouring trees during this study.) Most trees at MIP are deciduous,
including cultivated species of maple (Acer spp.), ash (Fraxinus spp.), and oak (Quercus
spp.).
Environment Canada’s “Kamloops A*” climate station, located approximately
4.4 km west-north-west of MIP at an elevation of 345 m a.m.s.l,, has an associated mean
annual (1981–2010) temperature of 9.3°C and mean monthly temperatures ranging from
–2.8°C (January) to 21.5°C (July). Of mean annual precipitation (277.6 mm), rain
accounts for 81 % (224.3 mm) and snow for the remainder. A climograph for the
“Kamloops A*” station is provided in Figure 3.1. The area has an average of 101.1 rain-
days per year; approximately 83.3 (82 %) of the rain-days have associated rain depths
between 0.2 and < 5 mm. On average, 4.3 rain-days per year have associated rain depths
of between 10.0 and < 25.0 mm, while rain-days with depths ≥ 25.0 mm occur, on
average, once every 5 years. MIP is extensively irrigated to meet tournament-standard
turf conditions and sustain cultivated, non-native tree species. As a result, the study site’s
climate is more aligned with a moist continental Cwb Köppen climate type than its native
mid-latitude, semi-arid steppe climate (BSk Köppen climate type; Ross, 2013).
3.2.2 Tree Selection and the Measurement and Derivation of Tree Traits
Using the City of Kamloops’ ArcGIS inventory and on-site evaluation, study trees
were selected according to criteria outlined in section 2.2.3. Trait terminology is defined
below; section 2.2.3 provides a more detailed methodology of trait measurement and
derivation.
48

Figure 3.1. Climograph for the Meteorological Service of Canada’s “Kamloops A*” climate station (50° 42' 08" N, 120° 26' 31" W) (1981–2010 normals; Environment Canada, 2014).
For each study tree, we measured DBH (cm), tree height, H (m), and average
canopy width, CW (m), then calculated projected canopy area, PCA (m2), projected wood
area, PWA (m2), canopy height-to-width ratio, HWR (dimensionless), canopy volume,
VolC (m3), and wood volume, VolW (m3).
Beneath-canopy skyward photographs were used to calculate leaf-on canopy cover,
CC (%), and leaf-off wood cover, WC (%), values for the full canopy (adapted from
Korhonen and Heikkinen, 2009).
-50
-40
-30
-20
-10
0
10
20
30
0
5
10
15
20
25
30
35
40
45
50
J F M A M J J A S O N D
Tem
pera
ture
(°C)
Prec
ipita
tion
(mm
)
Rain Snow Daily Average Temperature
49

The number of secondary leaders was noted (and used to calculate total number of
leaders, Ln, at the base of the canopy); counts (but not angles) of branches intersecting
secondary leaders were used to generate a total branch count, Bn, for the tree while angles
of “feeder” branches intersecting only the primary leader were calculated. Four angles
were used in final analyses: the angle of intersection of the branch and leader in the upper
third of the canopy, AIU (mean, deg. from horizontal), and in the full canopy, AIF (mean,
deg. from horizontal); and average (overall) angle from intersection to furthest extent of
the branch in the upper, AAU (mean, deg. from horizontal), and full canopy, AAF (mean,
deg. from horizontal). For each tree, an overall frequency of discontinuous branch
segments, FD, was calculated by assigning a branch a “discontinuous” rating if the inner
or mid-third of the branch drained away from the bole.
A quantitative bark relief index, BRI, was calculated using the ratio of the furrowed
circumference of the tree bole to the surface (unfurrowed) circumference at breast height
(1.3 m, or slightly higher or lower to avoid branches and deep scars). This measure
essentially represents bark microrelief as discussed in section 2.2.3.
A sample of leaves or leaflets (13 to 49 per tree) was sorted by size and the median
leaf was scanned. Its area was calculated using Photoshop® CC to yield median leaf size,
MLS (cm2), for each tree.
3.2.3 Precipitation and Stemflow Measurement
Measurement of precipitation and stemflow, SF, was made on an event basis from
June 12, 2012 to November 3, 2013. An Onset® tipping bucket rain gauge (Model # S-
RGB-M002) connected to an Onset® Hobo® U-30 USB data logger (Model # U30-NRC)
recorded rainfall depth and intensity. The opening of the tipping bucket (receiving
diameter 15.4 cm, resolution 0.2 mm tip-1) was 1 m off the ground. Accompanying the
tipping bucket rain gauge (TBRG) in the unobstructed yard of a private residence directly
north of MIP was a manually read polyethylene gauge (diameter 29 cm, depth 36 cm,
opening height 1 m). The tipping bucket and adjacent manually read rain gauge were
50

between 80 and 770 m from the study trees. In addition to these gauges, eight manually
read gauges were distributed throughout MIP (gauge density ~ 0.04 km2 gauge-1). The
furthest distance between a manually read gauge and a study tree was approximately 215 m.
Stemflow collection collars were fabricated using black corrugated polyethylene
hose (diameter of 3.2 cm for 32 trees and 3.8 cm for the five largest trees). After a
lengthwise section of hose was removed, the collar was wrapped twice around the tree at
an angle to promote drainage to the reservoir (collar lengths 1.2–5.2 m). One edge was
stapled to the trunk and 100 % silicone was used to seal the seam and staples; collars
were inspected and repaired regularly. Each collar drained through an intact section of
hose to a 17-L polyethylene pail inside a 114-L lidded polyethylene tote to accommodate
overflow; to guard against strong winds and contamination of collected SF by rain, each
tote was weighted and its PVC plastic cover secured with elastic cord.
3.2.4 Measurement and Derivation of Meteorological Variables
In addition to logging rain depth via the tipping bucket rain gauge, the data logger
reported the following variables every minute (equipment by Onset Computer
Corporation):
• wind speed (m s-1) and maximum 3-second gust speed (m s-1; S-WSA-M003);
• wind direction (degrees clockwise from 0° = north; S-WDA-M003);
• solar radiation (W m-2; SOLAR-RS3);
• barometric pressure (mbar; S-BPB-CM50), and
• temperature (°C) and relative humidity (%) (S-THB-M003).
Event and 5-minute averages were calculated for each of these, and the latter two were
used to derive event and 5-minute averages for vapour pressure deficit, VPD (kPa), as
follows:
VPD = SVP – AVP where
51

𝑆𝑉𝑃 = 0.611 ∙ 𝑒𝑥𝑝 !".!" !!"#.!!! and
𝐴𝑉𝑃 =𝑅𝐻100 ∙ 𝑆𝑉𝑃
where SVP is saturated vapour pressure (kPa), AVP is actual vapour pressure (kPa), T is
average temperature (°C) and RH is relative humidity (%). Since net radiant energy has
been shown to be a minor contributor to evaporation of wetted canopies (see Carlyle-
Moses and Gash, 2011), an introduced evaporation coefficient, E, based on the
aerodynamic approach to estimating evaporation from wetted surfaces (Dalton, 1802; see
Ward and Robinson, 2000), was calculated based on VPD and wind speed:
𝐸 =𝑊 ∙ 𝑉𝑃𝐷
where W is wind speed (m s-1). Average wind directions and standard deviations were
calculated through vector decomposition as described by Van Stan et al. (2011).
Tipping bucket records were used to identify the start and end of each rain event;
for the purposes of this study, events were separated by rain-free breaks of at least 12
hours. By the same method, timing and duration of breaks (≥ 30 minutes without a tip)
were documented, yielding the total duration of intra-storm breaks, DB (h) and total rain
duration, DR (h). Two measures of intensity were calculated: 1) 5-minute maximum
intensity, Imax5, (mm h-1), the maximum intensity that occurred in any 5-minute period of
the event and 2) 5-minute weighted intensity, Iwt5 (mm h-1). To derive 5-minute weighted
averages, 5-minute (unweighted) averages were multiplied by the depth of rain that fell in
those 5 minutes (yielding zero for rain-free 5-minute periods); these values were totalled
then divided by total rainfall depth to give averages that more accurately reflect
conditions during precipitation.
Event and 5-minute average rainfall inclination angles were also calculated using
rainfall intensity, wind speed, and relationships with drop size and terminal fall velocity
52

(Herwitz and Slye, 1995). The Laws and Parsons (1943) best-fit equation is the basis for
droplet size:
𝐷 = 2.23 (0.03937 𝑃𝐼) !.!"#
where D is median raindrop diameter (mm) and PI is rainfall intensity (mm h-1). The
following empirical best-fit equation (Gunn and Kinzer, 1949) yields terminal fall
velocity:
𝑈! = 3.378 𝑙𝑛 𝐷 + 4.213
where Uv is terminal velocity (m s-1) of any droplet of diameter D. Substituting this value
and wind speed allows for calculation of inclination angle:
𝑡𝑎𝑛𝑃!"# =𝑊!"!𝑈!
where Pinc is rainfall inclination angle (degrees from vertical), Wwt5 is 5-minute weighted
average wind speed (m s-1), and Uv is terminal fall velocity (m s-1).
3.2.5 Data Analysis
As described in section 2.2.4, we used exploratory cluster analysis to assign the 37
study trees to clusters reflecting two general canopy morphologies: single-leader (n = 20)
and multi-leader (n = 17). Herwitz (1987) and others have documented that SF drains to
and along the undersides of upright branches, suggesting that SF production processes
might differ in trees with single trunks vs. multiple major leaders.
The TBRG rainfall depths were evaluated against those collected in the adjacent
manually read rain gauge using double mass analysis (Searcy and Hardison, 1960). The
double mass analysis found that, respectively, the slope and intercept of the regression of
TBRG depth vs. manual gauge depth were not significantly different (α = 0.05) than
unity or zero prior to April 1, 2013; however, and although the cause is not clear, the
53

slope and intercept of the TBRG depth vs. manual gauge depth were found to be
significantly (p ≤ 0.05) different for the period after April 1, 2013. Thus, the following
correction factor was applied to all recorded TBRG depths after that date:
𝑇𝐵𝑅𝐺!"## = 1.112 ∙ 𝑇𝐵𝑅𝐺!"#$ − 0.142
where TBRGcorr is the corrected event rain depth value and TBRGmeas is the value
originally logged by the TBRG.
For all valid rainfall events for each study tree in full leaf, transitional, and leaf-off
condition, rainfall depths (mm) and corresponding SF volumes (L) were sorted from
smallest to largest rainfall depth. Data for events with rain depths equal to or greater than
the first event that yielded SF ≥ 0.01 L, even if some of these larger events produced no
SF, were plotted (P in mm vs. SF in L). Linear regression yielded the threshold of SF
initiation, P” (absolute value of the intercept divided by the slope), and the flow rate once
P” had been satisfied (slope, QSF).
There is precedent in the SF literature for using multiple regression to analyze the
influences of both trait and meteorological variables (e.g., Staelens et al., 2008; Van Stan
et al., 2014b). We elected to use stepwise-up multiple regression to identify the major
variables influencing the dependent variables (Armstrong and Hilton, 2010), and
addressed concerns regarding multicollinearity between independent variables by
ensuring that r2 < 0.64 (Hair et al., 1998). All multiple linear regressions (stepwise-up)
were run in Smith’s Statistical Package (SSP) following transformations of dependent
and independent variables (if necessary) as described in section 2.2.4. To facilitate
comparison of QSF for trees of widely varying sizes, leaf-on multiple regression analyses
at the group level were done for flow rate per unit PCA, QSF PCA-‐1 (L mm-1 m-2), as well as
for P” and QSF. Using a total of 18 trait variables, we identified those which significantly
(p ≤ 0.05 and p ≤ 0.10) explained variation in P”, QSF, and QSF PCA-‐1 for each of the tree
groups. Group A analyses used 17 variables as Ln was constant.
54

On an individual tree basis, we explored the role of actual canopy cover, ACC,
during spring and fall using multiple regression (SSP) of SF volume on P and ACC,
calculated as:
𝐴𝐶𝐶 =𝑊𝐶 + 𝐿𝐹(𝐶𝐶 −𝑊𝐶)
where LF = observed leaf fraction at event date. The influence of storm meteorology on
SF volume was also analyzed at the tree level with multiple regression yielding an
equation of significant (p ≤ 0.10) meteorological variables (out of 8 potential variables
for leaf-on and leaf-off condition or 9 variables including ACC for transitional leaf
condition). Occurrence or non-occurrence of a significant (p ≤ 0.10) meteorological
variable in each tree’s equation formed the basis of a full-sample analysis (both groups
combined) using a one-way ANOVA with Tukey HSD post-‐hoc (Tukey, 1953; see Zar,
1984) in IBM® SPSS® Statistics Version 22 (hereafter SPSS®) to detect associations
between meteorological variables and canopy characteristics of trees for which they were
influential.
3.3 RESULTS
3.3.1 Precipitation Profile
Between June 12, 2012 and November 2, 2013, 101 events with precipitation
depths ≥ 0.2 mm were recorded; frequencies of depth by precipitation type are presented
in Figure 3.2. A total of 394.4 mm fell: 327.9 mm as rain (86 events), 9.3 mm as mixed
(4 events), and 57.2 mm as snow (11 events). We collected 89.8 % of this total depth and
estimated the remainder (primarily snow) using Environment Canada data for the nearby
“Kamloops A*” station. Frequency of rain by depth class approximated 1981–2010
normals for Kamloops (in parentheses): 80.7 % (82.4 %) for 0.2 to 5 mm, 10.2 %
(13.4 %) for 5 to < 10 mm, and 9.1 % (4.3 %) for ≥ 10 mm. The higher frequency of
larger events reflects that the study extended through two summers: July and August have
the highest rain-day values for storms ≥ 10 mm.
55

3.3.2 Influence of Canopy Characteristics
In total, 37 isolated trees of 21 cultivated species were chosen (10.2–68.7 cm DBH,
Table 2.1). Table 2.2 summarizes means and ranges for these trait metrics for each group.
Derived values for P”, QSF, and QSF PCA-‐1 for individual Group A and B leaf-on trees are
provided for reference in Tables A.1 and A.2, respectively, along with measured and
calculated trait variables. Leaf-on, transitional, and leaf-off P” and QSF values are listed in
Tables A.3, A.4, and A.5. Results of multiple regressions of P”, QSF, and QSF PCA-‐1 for
Group A and B trees on canopy trait variables are presented in Table 3.1.
Figure 3.2. Frequency of precipitation events by type and depth class.
For rain events < 3 mm while trees were either in full leaf or completely leafless,
SF volume was plotted against rain depth. Figure 3.3 depicts, for four variously sized
trees (two each from Groups A and B), the patterns that were evident for most trees.
56

Table 3.1. Multiple regression equations for stemflow initiation thresholds, P” (mm), flow rates post-initiation, QSF (L mm-‐1 ) and flow rates per unit projected canopy area QSF PCA-‐1, (L mm-‐1 m-‐2) as functions of tree morphological traits, generated for single-leader (Group A, n = 20) and multi-leader trees (Group B, n = 17).
Stemflow from leafless trees generally started at lower threshold rain depths than
when leaves were present, and when it was produced, volumes were often higher for
leafless trees at a given rain depth. For rain depths > 2 mm, the pattern was less
consistent with SF production from leafed canopies occasionally exceeding that for
leafless trees.
Table __. Multiple regression equations for stemflow initiation thresholds (P”), flow rates post-initiation (QSF), and flow rates per unit CPA!(QSF/CPA,(l/m2) as functions of tree morphological traits, generated for single-leader (group A, n = 20) and multi-leader trees (group B, n = 17). !Equation R2( SEE( p(≤!P”!!Group A ( (
−18.10! 1!"# + 1.34!"#!+2.56 0.528 0.69 0.05
−11.85! 1!"# − 313.76! 1!! + 1.57!!"#
! + 32.19! 1!"# 0.660 0.62 0.10
P”! Group B
−10.63! 1!"# + 2.34 ln!! 0.546 1.31 0.05
−9.11! 1!"# + 2.72 ln! − 0.010!!!! 0.632 1.22 0.10
QSF!!Group A!
(0.23! ! + 2.62!!"# − 0.015!!! + 0.12 ln!"#! − 0.47!1
!"# − 2.64!)! 0.860 0.16 0.05
QSF Group B
! !.!"!!!!!.!"!!!"!!"!!!.!"!!"#!!!!".!"! !!"#!!.!!!"!!"!
0.952 0.22 0.05
QSF!CPA11 Group A
! !.!!!"!!"#!!!!!.!"!! !!"#!!!!.!"!!
!"#!!.!" 0.853 0.33 0.05
! !.!!!"!!"#!!!!!.!"!!!"!!"!!!.!"! !!"#!–!!.!"!!!"!!!!!!.!"!!!"!!"#!!!.!!! !
!"# 0.931 0.25 0.10
QSF!CPA11 Group B(
−0.062 ln!" + 1.48! − 07!"! − 0.10!!"# + 1.15! − 07!!"#! + 0.0004!!!! + 0.25 0.901 0.013 0.05
!!
57

3.3.3 Influence of Meteorological and Seasonal Factors
For leafed and leafless trees with data for ≥ 9 rain events, SF volume was regressed
on eight core meteorological variables; a ninth variable, ACC, was used for trees in leaf
transition with ≥ 10 events. Table 3.2 indicates if meteorological variables were
significantly positively or inversely related to SF volume for all leaf conditions. Squares,
circles, and triangles, in columns beneath each meteorological variable, represent leaf-on,
leaf-transition, and leaf-off conditions, respectively; solid symbols indicate a positive
correlation, while open symbols reflect an inverse relationship. Where an “x” symbol is
shown, this variable was not significant (p ≤ 0.10) in the regression. Finally, blank cells
indicate that there was insufficient data to run the regression for that tree in that leaf
condition. Corresponding regression equations for individual trees are provided in Tables
A.6, A.7, and A.8.
For each leaf condition, at least one meteorological variable’s presence in a group
of trees’ regression equations was associated with a significantly (p ≤ 0.10) different trait
mean compared to the group for which that variable was absent. Table 3.3 summarizes
these relationships between meteorological and trait variables for our study trees.
Figure 3.4 presents graphs for a subset of trees (representative of most study trees)
showing the general tendency for SF volumes to be greatest for mixed precipitation,
intermediate for rain, and least for snow events. For example, for tree A-2, less than
0.4 mm of SF each was measured for 5.8-mm (SWE) and 6.4-mm (SWE) snow events
while a 5.3-mm (SWE) mixed event produced 2.84 L and a 6.7-mm rain event produced
3.33 L of SF. For A-7, the highest volume of SF for events < 2.2 mm was 4.83 L for a
1.6-mm (SWE) mixed event. All other rain events in this depth range produced ≤ 2.59 L
of SF (less than 54 % of the mixed-event volume). In even greater contrast, a 3.2-mm
(SWE) snow event produced no SF for B-2 whereas 4.0 mm (SWE) of mixed
precipitation generated 5.76 L of SF. However, the same tree produced only 0.22 L of SF
from a larger 5.3-mm (SWE) mixed event.
58

Figure 3.3. Comparison of stemflow volume (L) produced from rain events less than 3 mm by trees in full leaf () vs. leafless () conditions.
59

Table 3.2. Summary of meteorological variables significantly (p ≤ 0.10) related to stemflow volume during leaf-on (square), transitional (circle), and leaf-off (triangle) conditions per regression equations presented in Tables A.6, A.7, and A.8.
Tree ID P DR DB Iwt5 Imax5 Pinc Wwt5 VPD11 ACCA-1 !" ### ## ## ### ### !## ###
A-2 !" ### #$# ### ### ### !## !## #
A-3 !" ### ### ### ### ## ### ###
A-4 !"# ### #$# ### #$# !## #" !## $
A-5 !" ### $## ### ### !# ### !## $
A-6 !" ### %# ### ## !## ## !## $
A-7 !" ### ### ### ### !## ## ###
A-8 !" ### ### ### ### ### ## ###
A-9 !" ### ## ### ## !## ## !##
A-10 !" ### #$# ### ## !## #" ### $
A-11 !" ### ### ### ### !" ### !##
A-12 !" ## ## ## ## ## ## #$ $
A-13 ! # # # # ! # !
A-14 !" ### ### ### %# !## !" !##
A-15 !" ### ### ### ### ### !# ##
A-16 !"# ### ### ### ## ### ## ## #
A-17 !" ## #$ ## #$ !# ## ## $
A-18 ! # # # # # # !
A-19 #" !## #$# ### !$# ### ## ## $
A-20 !" ## # # # # ! !
B-1 #"# !## ### ## #"# !## ### ### #
B-2 !" ### ### ### ### !# ### !##
B-3 !" ### %# !# !## ### !## !## $
B-4 !" ### ### ### ### ## #"# ### #
B-5 !" ### ## ### ### ### !## ###
B-6 !" ### ### ### ### ### ## ### #
B-7 ! # ! ! # # # !
B-8 ! # # # # ! # !
B-9 !" ### % # ### ### ### !# !"
B-10 !" ### ### ### ### ### ## % #
B-11 !" ### ### ### ### # !" !##
B-12 ! # # # # # # #
B-13 ! # # ! ! # # #
B-15 " ## ## ## ## ## ## ##
B-17 ! # # # # # ! !
Legend for occurrence and sign of regression coefficients (significance level per individual equations, see Tables A.6, A.7, and A.8): Leaf-on: ! = positive, % = negative, #= non-occurrence Leaf transition: " = positive, $ = negative, # = non-occurrence Leaf-off: = positive, = negative, # = non-occurrence Blanks reflect trees and leaf conditions for which there was insufficient data for regression analysis (e.g., too few events were available for analysis of B-14, B-15, and B-16 in any leaf condition).
60

Table 3.3. Summary of means and standard deviations for canopy traits of trees grouped by whether or not each meteorological variable was significant (“occurred”, p ≤ 0.10) in the individual tree’s SF volume regression equation (between-group differences analyzed via one-way ANOVA, p ≤ 0.10).
Meteorological Variable (sign indicates positive/ negative relationship with stemflow volume)
Trait Variable Non-occurrence group mean ± SD
(n)
Occurrence group mean ± SD (n)
p-value
LEAF-ON CONDITION + Rainfall intensity (5-min weighted average)
Bark relief index 1.10 ± 0.08 (32) 1.26 ± 0.22 (2) 0.018 Frequency (discontinuity) 0.15 ± 0.15 (32) 0.36 ± 0.33 (2) 0.081
+ Rainfall inclination angle (5-min weighted average)
DBH (cm) 32.9 ± 16.9 (21) 20.4 ± 7.4 (13) 0.018
Average canopy spread (m)
8.4 ± 4.0 (21) 6.1 ± 1.9 (13) 0.054
Canopy volume (m3) 690.4 ± 895.6 (21) 214.8 ±158.5 (13) 0.068 Wood volume (m3) 75.9 ± 103.4 (21) 15.2 ± 18.2 (13) 0.045 Intersection angle, full tree (deg. above horizontal)
41.9 ± 13.0 (21) 49.0 ± 9.9 (13) 0.100
Branch count 46.9 ± 20.8 (21) 32.2 ± 15.2 (13) 0.035 + Wind speed (5-min weighted average)
Canopy volume (m3) 382.6 ± 408.6 (26) 917.7 ± 1322.1 (8) 0.074 Wood volume (m3) 35.7 ± 46.0 (26) 107.8 ± 152.4 (8) 0.037 Median leaf size (cm2) 21.6 ± 13.4 (26) 35.7 ± 26.4 (8) 0.050
+ Inverse vapour pressure deficit (variable transformed)
Average angle, full tree (deg. above horizontal)
47.6 ± 18.2 (18) 37.1 ± 14.2 (15) 0.080
TRANSITIONAL LEAF CONDITION – Total break duration (h) No. branches, full tree 42.7 ± 21.4 (6) 25.3 ± 9.7 (6) 0.100
No. leaders at canopy base
1.83 ± 1.0 (6) 1.0 ± 0.0 (6) 0.065
LEAF-OFF CONDITION + Rainfall inclination angle (5-min weighted average)
Wood cover (%) 27.0 ± 10.3 (20) 14.6 ± 2.7 (5) 0.015
+ Inverse vapour pressure deficit (variable transformed)
DBH (cm) 21.7 ± 12.0 (21) 36.7 ± 12.3 (4) 0.032
Tree height (m) 9.1 ± 2.5 (21) 12.2 ± 1.5 (4) 0.027 Wood cover (%) 22.8 ± 10.3 (21) 33.4 ± 7.0 (4) 0.062
61

Figure 3.4. Graphs of measured SF generated from rain events () and from snow–water equivalent (SWE) depths for snow () and mixed () precipitation events.
62

3.4 DISCUSSION
3.4.1 Canopy Traits Influencing Stemflow from Rain in Leaf-on Condition
Derived measures of stemflow—SF as a percentage of incident rain on a projected
canopy area, PCA, basis, SF %, and the SF funneling ratio, FR (Herwitz, 1986)—are
commonly used to report and compare SF production (e.g., Levia and Frost, 2003;
Carlyle-Moses et al., 2010; Germer et al., 2010). Prior to discussing our findings in these
terms, we examine the influence at the tree group level of canopy traits on threshold rain
depth for SF initiation, P” and post-initiation SF rate, QSF (the combination of which
determines SF volume), as well as on QSF standardized per m2 PCA (QSF PCA-‐1).
3.4.2 Stemflow Initiation Threshold
Examination of the multiple regression equations in Table 3.1 reveals some
common factors within and between groups for different dependent variables. Firstly, P”
was directly related to diameter at breast height, DBH, but only for single-leader trees; on
the other hand, bark relief index, BRI, was positively related to P” for both single- and
multi-leader trees. The influence of BRI is apparent when comparing P” for Group A and
B trees of similar size whereby smoother bark (in concert with other traits) is associated
with lower P” :
• A-6 (DBH = 15.1 cm, BRI = 1.01, P” = 2.0 mm) vs. B-1 (DBH = 15.2 cm,
BRI = 1.22, P” = 3.6 mm)
• A-9 (DBH = 19.0 cm, BRI = 1.09, P” = 3.7 mm) vs. B-3 (DBH = 18.8 cm,
BRI = 1.01, P” = 1.3 mm)
• A-18 (DBH = 43.0 cm, BRI = 1.15, P” = 3.9 mm) vs. B-11 (DBH = 43.0 cm,
BRI = 1.25, P” = 3.8 mm)
For Group A, additional trait variables were significant at the p ≤ 0.10 level:
canopy cover, CC (positive) and angle of branch intersection in the upper canopy, AIU
63

(negative, such that higher P” was associated with lower branch angles as measured from
horizontal). Neither of these variables was significant (p ≤ 0.10) for multi-leader P” while
tree height was a factor only for Group B trees. Finally, the number of leaders was
inversely related to P” for the multi-leader trees.
In this study, the smallest events to generate SF ≥ 0.1 % of incident rainfall were
1.0 mm for A-1 and 0.9 mm for B-3 and B-9. These compare to mean SF initiation
thresholds of 3.4 ± 0.3 mm for beech and 10.9 ± 1.2 mm for oak in a temperate mixed
forest (André et al., 2008b), > 1 mm and > 4 mm for urban Eucalyptus saligna and E.
nichollii trees, respectively (Livesley et al., 2014), and 1.4−4.8 mm for six species in a
laurel forest in the Canary Islands (Aboal et al., 1999a). Study trees with the lowest
derived thresholds included A-1 (small DBH with smooth bark and numerous, steeply
inclined branches), A-3 (small, smooth bark, high CC), B-3 (small, smooth, with
numerous branches), and B-9 (medium-sized but extremely smooth-barked with many
leaders). These examples serve to confirm the importance of conducive traits identified
by others including smooth bark (Levia and Herwitz, 2005; Van Stan and Levia, 2010)
and high branch inclination angles (Herwitz, 1987; Xiao et al., 2000; Levia et al., 2013).
As we did for single-leader trees, André et al. (2008) found that lower P” (reflecting
lower apparent storage capacity) was associated with smaller DBH trees; for our multi-
leader trees, tree height, H, was highly correlated with DBH (Spearman r ≤ 0.01), and
may have been acting as a proxy for the latter size-related variable. The fact that the
number of leaders converging at the base of the canopy, Ln, was inversely related to P”
for Group B suggests that the benefits of having multiple major SF flowpaths to the base
of the canopy outweighed the disadvantages associated with increased wood area to be
saturated, particularly for smooth-barked trees.
3.4.3 Stemflow Rate
While QSF was significantly (p ≤ 0.05) correlated with BRI in both Group A and B
trees, it was positively correlated for single-leader trees, but inversely related for multi-
64
leader trees. This implies that, for single-leader trees, more deeply furrowed (now
saturated) bark may contributes to higher SF rates, particularly if furrows are linear rather
than diamond-shaped or forked (Levia and Herwitz, 2005). In fact, the five highest QSF
values among Group A trees (1.97–3.61 L mm-1) were for trees with moderate bark relief
(BRI ranging from 1.15–1.20) and bark with linear furrows. The highest QSF PCA-‐1 value
was for A-14, an English columnar oak with linearly furrowed bark of moderate relief.
Others have documented the promotion of SF production (and resistance to evaporative
forces) by such linear microrelief, despite its association with higher normative bark
water storage and delay of SF initiation (Levia and Herwitz, 2005).Our findings confirm
that, certainly for single-leader trees, bark with moderate relief and linear furrows was
associated with high QSF. Most smooth- and flaky-barked trees had lower rates, although
two of the highest QSF PCA-‐1 values were for trees with extremely low BRI, suggesting
that other traits (such as high branch angles) in association with bark relief may
contribute to high rates on a per-canopy-area basis.
It is possible that greater wood surface areas associated with multi-leader trees may
result in a gradual increase in QSF during the time between satisfaction of P” (SF begins)
and full saturation, but as discussed below, Ln appeared to be more important than any
other factor for Group B trees. Tree height explained more variability in QSF (57 %) than
any other factor for Group A trees, though it was not significant (p ≤ 0.10) for Group B
trees and is not identified frequently in the literature (e.g., Germer et al., 2010). It is
possible that H was acting as a proxy for DBH (as discussed above) or other closely
correlated size-related variables in this study. Branch count, Bn, was inversely related to
QSF in single-leader trees only. Reduced SF with more branches was also found by
Herwitz (1985), who attributed this effect to increased storage capacities, but Návar
(1993), Aboal et al., (1999b), and Levia et al. (2013) all found higher Bn to promote SF.
Specifically, Levia et al. (2013) concluded that woody biomass, branch count (both per
unit PCA), and mean inclination angles were the most important factors governing SF
PCA -1 in their study of European beech saplings. For Group A trees, higher canopy
65

volume, VolC , was associated with higher QSF, which is consistent with the findings of
Martinez-Meza and Whitford (1996) for certain desert shrubs, Crockford and Richardson
(1990) for pine and eucalypts (crown size per DBH), and Aboal et al. (1999b) for a laurel
forest. Aboal et al. (1999b) also noted that small leaves contributed to more efficient SF
production, counter to the positive relationship between median leaf size, MLS, and QSF
for our Group A study trees. For Group B trees, Ln explained 52 % of variation in QSF
while WC was also positively related; given that Ln has not been examined to our
knowledge (although both factors are consistent with findings of Levia et al. [2013] that
woody biomass is associated with high SF), we recommend further study to refine
understanding of its potential role. The regression equation for Group B QSF suggests that
Ln may be of particular importance when a tree also has smooth bark and high full-
canopy intersection angles, AIF, and when canopy width, CW, is relatively small
(minimizing the distance that SF needs to travel to reach the bole). Few specific results
are published on CW, but many authors corroborate the importance of associated traits
such as high branch inclination angles for SF in trees and shrubs (Martinez-Meza and
Whitford, 1996; Crockford and Richardson, 2000; Barbier et al., 2009; Levia et al., 2013;
Van Stan et al., 2014b). Herwitz (1987) observed that > 80 % of impacting rain became
branchflow for branch angles > 60° in the laboratory, but there is a “tipping point” at
which the benefits of high branch angles in conducting SF will be offset by a tree’s
smaller projected canopy area (Pypker et al., 2011; Levia et al., 2013).
Derived QSF for single-leader trees ranged from 0.33 L mm-1 (A-3: small, smooth,
relatively few branches) to 3.61 L mm-1 (A-20: tallest study tree, large volume, moderate
BRI, disproportionately low branch count). For multi-leader trees, QSF ranged from
0.48 L mm-1 (B-4: moderate BRI, only one secondary leader, low wood cover, WC, and
AIF, relatively high CW for its size) to 7.45 L mm-1 (B-9: very smooth bark, many
leaders, moderate WC, relatively low branch angles, average CW). The low P” and high
QSF for B-9 contribute to exceptional SF % and FR values as discussed below despite
moderate branch angles and a broad canopy. This tree’s early and voluminous SF
66

production in this study is consistent with findings of others studying beech species (e.g.,
Levia et al., 2013, 2010; Staelens et al., 2008; Van Stan et al., 2014b). Based on
observations of SF on the study tree’s trunk (Videos B.1–B.4), it is possible that the bark
may be not only smooth but hydrophobic, a condition that may have been enhanced by
the presence of water-repellent lichen (Shirtcliffe et al., 2006) which we observed along
preferential flowpaths on the trunk of B-9 (and other study trees). Water repellency in
Acacia bark has been linked to presence of a waxy substance called suberin (Borgin and
Corbett, 1974), which has also been extracted from beech bark (Perra et al., 1993).
For comparison, a sample of SF rates observed by others includes 0.08 ± 0.04 L mm-1
for oak and 0.09 ± 0.02 L mm-1 for beech in a mixed stand (André et al., 2008b), and a
range of 0.070 ± 0.011 to 0.172 ± 0.013 L mm-1for five tropical tree species (Park and
Cameron, 2008). The derived rate for B-9 in our study is over 43 times greater than the
highest rate calculated by Park and Cameron (2008), which even the lowest rates for our
study trees exceed. Researchers in urban environments have long been aware that SF
rates and yields tend to be greater for isolated trees (e.g., Xiao et al., 2000; David et al.,
2006; Guevara-Escobar et al., 2007) though the magnitude of this effect depends on
climate, rainfall depth, and storm meteorology, as well as tree species and size. In
general, gains due to unobstructed precipitation from all directions more than offset
losses from an open-grown canopy to evaporative forces (Gash et al., 1995) and direct
wind that can dislodge potential SF from leaves and woody surfaces.
For QSF PCA-‐1, BRI was again positively related for Group A trees and inversely
related for Group B trees; standardizing the QSF rate per unit PCA did not remove these
effects. Angle of intersection (full tree) explained over 73 % of variation in QSF PCA-‐1 for
Group A and was also a positive factor for Group B; this once again agrees with the
results of many studies cited above (e.g., Levia et al., 2013), and confirms that this factor
remains highly influential once rate is standardized per unit PCA. Remaining factors for
Group A were MLS and WC (both positive) and Bn and DBH (both inverse) of which WC
was inversely related to QSF PCA-‐1 for Group B (WC appears to promote SF when there’s
67

a primary bole, but suppresses it when multiple leaders convey flow to the base of the
canopy). The inverse relationship between DBH and QSF PCA-1 indicates that single-leader
trees with lower basal areas tended to have higher rates per PCA, as well as lower P”,
meaning that for small events especially, they are likely to out-produce larger-DBH trees.
Canopy width explained 38 % of variability in QSF PCA-‐1 for Group B trees; given that it
was inversely related, this likely reflects that traits associated with narrower trees (e.g.,
high branch angles and CC) promote SF in multi-leader trees. The final positive factor for
Group B trees, one also significant (p ≤ 0.10) for P” and QSF, was Ln: more leaders meant
higher yields due to both lower thresholds and higher rates. Highest derived QSF PCA-‐1 for
Group A trees was 0.202 L mm-1 m-2 for A-14 (the tightly columnar oak with relatively
high BRI and WC as well as exceptionally high branch angles) and for Group B was
0.113 L mm-1 m-2 for B-9 (the American beech with very low BRI and numerous leaders
but moderate values for other conducive traits).
3.4.4 Stemflow Percent
Mean SF % values for Group A trees for the 2 to < 5 mm, 5 to < 10 mm, and
≥ 10 mm rain depth classes were 0.9 ± 0.9 %, 2.8 ± 3.3 %, and 3.1 ± 2.8 % while for
Group B trees, mean SF % values for these rain depth classes were 0.8 ± 1.2 %,
2.0 ± 2.5 %, and 2.7 ± 2.6 %, respectively. The highest mean SF % values for individual
Group A trees for the 2 to < 5 mm, 5 to < 10 mm, and ≥ 10 mm rain depth classes were
3.6 ± 4.8 % (A-15), 12.0 ± 10.1 % (A-15), and 12.3 ± 8.4 % (A-14). For Group B, the
highest means in the same depth classes were 4.3 ± 3.6 %, 9.6 ± 6.7 %, and 9.9 ± 1.4 %,
all for B-9. Event maximum SF % for the single-leader and multi-leader groups, respect-
ively, were 27.9 % for A-15 for a 5.2-mm event and 18.7 % for B-9 for an 8.8-mm event.
For context, Livesley et al. (2014) observed average SF % values of 0.2−0.3 % and
1.5−1.7 % for E. nichollii and E. saligna, respectively, over three years in Melbourne,
Australia. Guevara-Escobar et al. (2007) measured SF % of 0−5.7 % (mean 2.20 %)
beneath a Ficus benjamina tree in Queretaro City, Mexico. Levia et al. (2013) reported an
68

average SF % of 2.4 ± 1.5 % for the European beech saplings in east-central Germany,
while Staelens et al. (2008) found SF % ranging from 3.3 % for precipitation depths of
2 to < 5 mm to 8.9 % for depths of 15−35 mm with an average of 6.4 % for a dominant
beech tree in Belgium. Van Stan et al. (2014a) found mean SF % of 0.9 % for yellow
poplar in contrast to 5.3 % for American beech in the northeastern United States, a
difference they attributed primarily to steeper branch angles and smoother bark (i.e.,
lower canopy storage capacity) of beech canopies. High branch angles (> 67°) were
measured for both A-14 (English columnar oak) and A-15 (Armstrong Freeman maple)
(these two trees had by far the greatest height-to-width ratios in our study); A-15 was
smooth-barked, but A-14 had convoluted bark with linear furrows, an illustration of the
apparent advantage of furrowed bark once P” is satisfied. Once again, the American
beech (B-9) out-produced all Group B trees in terms of SF % means and event
maximums, reflecting the combination of conducive traits noted above including smooth
bark and many leaders fed by moderately angled branches.
3.4.5 Funneling Ratios
The highest mean FR values for individual trees for the 2 to < 5 mm, 5 to < 10 mm,
and ≥ 10 mm rain depth classes were, respectively, 31.5 ± 20.9 (A-5), 50.7 ± 33.6 (A-1),
and 58.6 ± 12.0 (A-5) for Group A trees and 24.1 ± 19.9, 53.5 ± 37.1, and 81.3 ± 64.9, all
for B-9. These compare to means of 13.0 ± 1.3 and 53.0 ± 4.0 for two American beech
trees with DBH 74.9 cm and 10.3 cm, respectively (Levia et al., 2010) and a maximum
mean FR of 47.2 for five intermediate-sized beech trees over 10 months (Van Stan and
Levia, 2010). Gómez et al. (2002) documented funneling ratios of 51, 60, and 85 over
12 rain events for three olive trees. Event maximum FR values for Group A and B trees,
respectively, were 117.8 for A-3 for a 9.7-mm event and 196.9 for B-9 for a 25.6-mm
event, exceeding values reported in the literature for trees which include 100.6 for a
10.3 cm DBH beech during a 2.5-mm rain event (Levia et al., 2010) and 71 for small
palm trees (Germer et al., 2010). A detailed discussion of factors influencing SF % and
FR is provided in Chapter 2. Once again, we expect that the absence of neighbouring
69

canopies for our study trees enhanced the effects of conducive canopy architecture and
exposure to wind-driven rainfall as discussed below.
3.4.6 Influence of Leaf Condition on Stemflow from Rain
The tendency of leafless trees in both groups to produce SF at smaller rain depths
and in greater quantities for a given rain depth < 3 mm compared to full leaf condition
(Figure 3.3) is consistent with the significance (p ≤ 0.10) of actual canopy cover, ACC, in
regression equations for over half of the study trees analyzed in transitional leaf states
(Table A.7): SF volume varied inversely with ACC for these trees in our climate. While
many researchers have observed this pattern (Helvey and Patric, 1965; Xiao et al., 2000;
André et al., 2008; Staelens et al., 2008), others have found the reverse (Liang et al.,
2009b) or no significant difference between seasons (Deguchi et al., 2006). The observed
pattern of increased SF yields from defoliated trees was less distinct as rain depth
increased, implying that storm characteristics and other canopy traits may supersede ACC
in importance. For example, Van Stan et al. (2014b) found that 1) presence of leaves
increased direct associations between SF and rainfall intensity for yellow poplar and
American beech; 2) a positive relationship between SF and wind speed for leafed
canopies switched to an inverse one for leafless canopies; 3) beech exhibited
strengthened differences between leaf states for SF−rainfall depth and SF−wind speed
associations; and 4) relationships were further modified by DBH class.
3.4.7 Meteorological Influences on Stemflow from Rain for Various Leaf Conditions
Table 3.2 shows the dominant influence of rain depth, P, on SF volume for
individual trees: in only two cases did rain duration (usually closely correlated with
depth) supercede P. This finding is supported by most studies including André et al.
(2008b) for oak and beech and Levia et al. (2010) and Van Stan et al. (2014b) for beech
and yellow poplar. Xiao et al. (2000) made the distinction that SF for saturated canopies
was tightly controlled by P while SF from unsaturated canopies reflected storage capacity
70

and the various morphological and meteorological factors associated with wetting-up.
Carlyle-Moses and Price (2006) found that FR increased with greater rain depths up to a
threshold for a growing-season mixed deciduous forest; once this level of saturation was
reached, the authors speculated that flowpaths were overloaded and more intercepted rain
was diverted to throughfall, TF.
Break duration was inversely related to SF (except for B-7), and was significant
(p ≤ 0.10) for various trees and leaf conditions. While some studies have explored intra-
storm variability of SF (e.g., Levia et al., 2010), very few have quantified the influence of
storm breaks. For an oak−beech stand, André et al. (2008b) did discern that while SF rate
was not significantly affected by meteorological conditions preceding a storm event,
storage capacity and rainfall threshold appeared to increase with the ratio of potential
dry-period evaporation to preceding rain volume. In light of our findings, this relationship
may also apply to intra-storm breaks.
Weighted 5-minute rainfall intensity was positively related to SF for only the
smallest single-leader tree in leaf-off condition, but was significant (p ≤ 0.10) for a few
multi-leader trees in all except transitional leaf states. Maximum 5-minute intensity was
inconsistent, being positively and inversely related to SF for trees in both groups and in
all leaf conditions. According to Levia and Frost (2003) and exemplified by Carlyle-
Moses and Price (2006) for red oak, sugar maple, and American beech, SF is often found
to vary inversely with rainfall intensity; on the other hand, Van Stan et al. (2014b)
observed positive correlations between SF and rainfall intensity for American beech and
yellow poplar, but emphasize that tree size, bark relief, and other meteorological factors
interact with intensity in complex ways. The variability in our results with respect to 5-
minute weighted and maximum intensity likely reflects the morphological diversity of
our study trees (37 individuals of 21 species and widely ranging sizes) and
meteorological variability associated with our semi-arid climate.
When it was significant (p ≤ 0.10), rainfall inclination angle, Pinc, was always
positively correlated with SF, occurring frequently for Group A trees and occasionally for
71

Group B trees in leaf-on and leaf-off but not transitional states. Herwitz and Slye (1995)
found differential SF generation from rain inclined > 19° from vertical across varying
storm depths, durations, and intensities. Using this angle to categorize rainfall as inclined
or not, Van Stan et al. (2011) found significant correspondences between wind-driven
inclined rain and SF production in American beech and yellow poplar for almost all storm
events. They observed preferential SF generation in both species when winds were from
particular directions, and noted that the vertically deeper canopy (i.e., greater effective
canopy area) of beech trees enhanced efficiency of inclined rainfall capture and funneling
as SF. Among our trees, Pinc was a significant (p ≤ 0.10) factor for SF volume for highly
columnar A-14 in leaf-on condition, but there was no consistent association with greater
height-to-width ratios. In our study, event average Pinc was ≥ 20° for only 3 of 60 rain
events (5 %), 10° to < 20° for 20 % of events, 5° to < 10° for 30 % of events, and < 5° for
45 % of events: the significance (p ≤ 0.10) of Pinc for many trees in leafed and leafless
conditions suggests that SF in isolated deciduous trees may be sensitive to rain falling at
less inclined angles (from vertical) than observed in forest studies.
With two exceptions, 5-minute weighted average wind speed, Wwt5, was always
positively related to SF ; it occurred more commonly for leaf-on and leaf-off than
transitional conditions. This is in agreement with findings of Xiao et al. (2000) for
isolated oak and pear trees and André et al. (2008b) that higher wind speeds during rain
enhanced SF production for oak and beech, apparently by reducing SF initiation
thresholds. This direct association was strongly demonstrated by Van Stan et al. (2014b)
for three size classes of American beech and yellow poplar during the growing season;
for leafless canopies (particularly smaller ones), however, SF was inversely related to
wind speed, possibly reflecting increased evaporation from bark in the absence of shelter
from leaves.
After P, inverse vapour pressure deficit, VPD (i.e., transformed to enhance linearity
for regressions), was the second-most common factor influencing SF volume, certainly
for leaf-on trees; since the inverse variable influenced SF positively, higher values of
72

VPD were associated with lower SF volumes. Staelens et al. (2008) documented this
relationship for a beech forest while Van Stan et al. (2014b) confirmed the inverse effect
of VPD for leafed American beech and yellow poplar, noting that the effect was enhanced
for taller trees.
3.4.8 Stemflow from Snow and Mixed Events Compared to Rain
Figure 3.4 shows actual SF volumes measured from four selected trees for four
mixed and 11 snow events graphed along with SF generated by rain events in the same
depth range using snow-water-equivalent (SWE) on the x-axis. The sample size is small
and there is high variability in the actual SF values from mixed and snow events, but,
with few exceptions, more SF was generated from mixed events (over three times more
for some events) and less from snow events (not uncommonly zero or close to it). While
data is limited, it seems that mixed precipitation in our climate may have properties
relating to air and bark temperature that optimize adhesion (as opposed to snow that is
less likely to adhere and subject to being dislodged by wind). Herwitz and Levia (1997)
found substantial mid-winter SF drainage from bigtooth aspen in the northeastern United
States (5−10 % of incident precipitation per PCA, despite below-zero temperatures),
particularly when snow events coated bare trees in icy glaze; they theorized that the
bark’s low albedo promotes melting and drainage of intercepted snow and ice, a process
subject to much lower VPD than in warmer seasons. Consistent with our findings, they
also noted that SF from snow did not reliably increase with precipitation depth (as for
rain), a lack of predictability that was even more pronounced for seven trees of three
different deciduous species in Massachusetts (Levia, 2004). For a northern red oak
examined in detail by Levia (2004), funneling ratios associated with snow events were
significantly lower than for other precipitation types (as in our study), yet mean ratios
(± 1 SE) overlapped for rain, rain-to-snow, and snow-to-rain, suggesting that
precipitation type was less influential than other meteorological factors, particularly
duration and intensity of precipitation in concert with high wind speeds. Our observation
that mixed events often resulted in more SF than comparable rain and snow events is
73

consistent with findings of Levia (2003) who related low levels of SF chemical
enrichment for rain, sleet, and snow events to short residence times (for all three) as well
as low interception for sleet and snow, a factor that we suggest is particularly limiting for
small trees.
Based on observations that larger trees in our study retained more snow than small
ones, canopy architecture can be important. For example, we noted that smaller trees had
minimal reservoirs at branch intersections, limited branch surface area, smaller projected
bole area in the face of wind-driven snow, and smoother bark (which decreases storage
capacity and also limits snow retention associated with rougher bark). Enhanced SF was
observed for upright bigtooth aspen branches (Herwitz and Levia, 1997). Though they are
beyond the scope of the current study, a number of hypotheses and conceptual models
were proposed by Levia and Underwood (2004) related to snowmelt-induced SF, a
process potentially influenced by 1) albedo of snow-covered and snow-free wood
surfaces, 2) snow-to-rain nature of the precipitation (vs. pure snow), and 3) longwave
radiative flux within the canopy.
3.5 CONCLUSION
This study of isolated deciduous park trees confirms the volumetric importance of
stemflow and the influence of various canopy traits and meteorological characteristics on
stemflow initiation thresholds and stemflow rates. Smooth bark and steeply inclined
branch angles are among traits previously associated with high stemflow yields; we also
found that stemflow initiation threshold rain depth decreased and stemflow rate increased
with higher numbers of leaders converging at the base of a canopy. These traits were
apparent in the sole American beech in our study that exhibited the lowest stemflow
initiation threshold, highest stemflow rate, and highest mean and event stemflow % and
funneling ratio values among multi-leader trees. Single-leader trees tended to have higher
stemflow yields if they had 1) high branch angles, 2) low diameter at breast height and
canopy cover (associated with lower thresholds), 3) greater tree height, bark relief index
74

(particularly when furrows are linear), canopy volume, and median leaf size, and 4) fewer
branches (associated with higher stemflow rates). Given that bark relief increased both
the stemflow initiation threshold and rate for single-leader trees, resultant stemflow yield
depended on rainfall depth, duration, and other storm and trait variables.
Despite the diversity of study tree species and size, patterns emerged regarding
event meteorology including 1) the dominance of rainfall depth, 2) the influence of
inclined rainfall at smaller angles from vertical than previously observed, and 3) the
already-established relationships between SF yield and wind speed (positive) and vapour
pressure deficit (inverse). The effects of intra-storm break duration and rainfall intensity
were less clear and warrant further study. Like others, we found a seasonal pattern of
enhanced stemflow from leafless canopies, especially at low rain depths; for eight of 13
study trees in transitional leaf states, stemflow yield was significantly (p ≤ 0.10) inversely
related to actual canopy cover. We observed, as other researchers have, very high
variability for non-rain events, but in general, for small events, stemflow yield was
greatest for mixed precipitation followed by rain then snow.
Among the many reasons our findings may depart from earlier results are
differences in climate, tree species, and event profiles, but the primary one in most cases
is likely our focus on isolated trees in an urban park situation. We expect that our trees’
canopies were subject to influences undetectable (or at least complicated) in a forest
setting. What is clear is that stemflow, in the volumes we measured, must be managed in
an urban setting, either as a resource in the form of supplemental irrigation where
infiltration is possible, or as a hazard if excess stemflow becomes runoff on polluted
impervious surfaces. While interception loss by urban trees is substantial, stemflow can
no longer be dismissed as insignificant; in fact, planting trees that divert intercepted rain
to stemflow could reduce throughfall, which typically falls on paving. Future work
should address stemflow quantity and quality (nutrients and pollutants) for isolated
deciduous and coniferous trees of diverse ages and sizes in a range of climates and urban
conditions. This body of knowledge will provide valuable guidance as we respond to the
need for urban trees and their ecosystem services in ever-densifying cities.
75

3.6 REFERENCES
Aboal, J., Jiménez, M., Morales, D., Hernández, J., 1999a. Rainfall interception in laurel
forest in the Canary Islands. Agricultural and Forest Meteorology 97, 73–86. Aboal, J., Morales, D., Hernández, M., Jiménez, M., 1999b. The measurement and
modelling of the variation of stemflow in a laurel forest in Tenerife, Canary Islands. Journal of Hydrology 221, 161–175.
André, F., Jonard, M., Ponette, Q., 2008a. Influence of species and rain event characteristics on stemflow volume in a temperate mixed oak–beech stand. Hydrological Processes 22, 4455– 4466.
André, F., Jonard, M., Ponette, Q., 2008b. Effects of biological and meteorological factors on stemflow chemistry within a temperate mixed oak-beech stand. Science of the Total Environment 393, 72–83.
Barbier, S., Balandier, P., Gosselin, F., 2009. Influence of several tree traits on rainfall partitioning in temperate and boreal forests: A review. Annals of Forest Science 66, 602 (11 pp.).
Borgin, K., Corbett, K., 1974. The hydrophobic and water-repellent properties of wattle bark extractives. Wood Science and Technology 8, 138–147.
Calder, I.R., 2001. Canopy processes: Implications for transpiration, interception and splash induced erosion, ultimately for forest management and water resources. Plant Ecology 153, 203–214.
Carlyle-Moses, D., Price, A., 1999. An evaluation of the Gash interception model in a northern hardwood stand. Journal of Hydrology 214, 103–110.
Carlyle-Moses, D., Price, A., 2006. Growing-season stemflow production within a deciduous forest of southern Ontario. Hydrological Processes 20, 3651–3663.
Carlyle-Moses, D., Price, A., 2007. Modelling canopy interception loss from a Madrean pine-oak stand, Northeastern Mexico. Hydrological Processes 21, 2572–2580.
Carlyle-Moses, D.E., Gash, J.H.C., 2011. Rainfall interception loss by forest canopies, in: Levia, D.F., Carlyle-Moses, D., Tanaka, T. (Eds.), Forest Hydrology and Biochemistry: Synthesis of Past Research and Future Directions, Ecological Studies. Springer Netherlands, Dordrecht, pp. 407–424.
Carlyle-Moses, D.E., Park, A.D., Cameron, J.L., 2010. Modelling rainfall interception loss in forest restoration trials in Panama. Ecohydrology 3, 272–283.
Crockford, R.H., Richardson, D.P., 1990. Partitioning of rainfall in a eucalypt forest and pine plantation in southeastern Australia: II Stemflow and factors affecting stemflow in a dry sclerophyll eucalypt forest and a Pinus radiata plantation. Hydrological Processes 4, 145–155.
76

Crockford, R.H., Richardson, D.P., 2000. Partitioning of rainfall into throughfall, stemflow and interception: Effect of forest type, ground cover and climate. Hydrological Processes 14, 2903–2920.
Dalton, J., 1802. Experimental essays on the constitution of mixed gases. Manchester Literary and Philosophical Society Memoirs 5, 535–602.
David, T.S., Gash, J.H.C., Valente, F., Pereira, J.S., Ferreira, M.I., David, J.S., 2006. Rainfall interception by an isolated evergreen oak tree in a Mediterranean savannah. Hydrological Processes 20, 2713–2726.
Deguchi, A., Hattori, S., Park, H.-T., 2006. The influence of seasonal changes in canopy structure on interception loss: Application of the revised Gash model. Journal of Hydrology 318, 80–102.
Dunkerley, D., 2013. Stemflow on the woody parts of plants: Dependence on rainfall intensity and event profile from laboratory simulations. Hydrological Processes (online), 1–14.
Environment Canada. 2014. Canadian Climate Normals. Station Name: Kamloops A*. Webpage. URL http://climate.weather.gc.ca/climate_normals/index_e.html (accessed June 1, 2014).
Gash, J., Lloyd, C., Lachaud, G., 1995. Estimating sparse forest rainfall interception with an analytical model. Journal of Hydrology 170, 79–86.
Gash, J.H.C., 1979. An analytical model of rainfall interception by forests. Quarterly Journal of the Royal Meteorological Society 105, 43–55.
Germer, S., Werther, L., Elsenbeer, H., 2010. Have we underestimated stemflow? Lessons from an open tropical rainforest. Journal of Hydrology 395, 169–179.
Gómez, J., Vanderlinden, K., Giráldez, J., Fereres, E., 2002. Rainfall concentration under olive trees. Agricultural Water Management 55, 53–70.
Guevara-Escobar, A., González-Sosa, E., Véliz-Chávez, C., Ventura-Ramos, E., Ramos-Salinas, M., 2007. Rainfall interception and distribution patterns of gross precipitation around an isolated Ficus benjamina tree in an urban area. Journal of Hydrology 333, 532–541.
Hair, J., Anderson, R., Tatham, R., Black, W., 1998. Multivariate Data Analysis, 5th edition. Prentice Hall, Upper Saddle River, NJ.
Helvey, J.D., Patric, J.H., 1965. Canopy and litter interception of rainfall by hardwoods of eastern United States. Water Resources Research 1, 193–206.
Herwitz, S., Levia, D., 1997. Mid-winter stemflow drainage from Bigtooth Aspen (Populus grandidentata Michx.) in central Massachusetts. Hydrological Processes 11, 169–175.
Herwitz, S., Slye, R., 1995. Three-dimensional modeling of canopy tree interception of wind-driven rainfall. Journal of Hydrology 168, 205–226.
77

Herwitz, S.R., 1985. Interception storage capacities of tropical rainforest canopy trees. Journal of Hydrology 77, 237–252.
Herwitz, S.R., 1986. Infiltration-excess caused by stemflow in a cyclone-prone tropical rainforest. Earth Surface Processes and Landforms 11, 401–412.
Herwitz, S.R., 1987. Raindrop impact and water flow on the vegetative surfaces of trees and the effects on stemflow and throughfall generation. Earth Surface Processes and Landforms 12, 425–432.
Holder, C.D., 2012. The relationship between leaf hydrophobicity, water droplet retention, and leaf angle of common species in a semi-arid region of the western United States. Agricultural and Forest Meteorology 152, 11–16.
Inkiläinen, E.N.M., McHale, M.R., Blank, G.B., James, A.L., Nikinmaa, E., 2013. The role of the residential urban forest in regulating throughfall: A case study in Raleigh, North Carolina, USA. Landscape and Urban Planning 119, 91–103.
Korhonen, L., Heikkinen, J., 2009. Automated analysis of in situ canopy images for the estimation of forest canopy cover. Forest Science 55, 323–334.
Laws, J.O., Parsons, D.A., 1943. The relation of raindrop-size to intensity. Transactions, American Geophysical Union 24, 452–460.
Levia, D., Frost, E., 2003. A review and evaluation of stemflow literature in the hydrologic and biogeochemical cycles of forested and agricultural ecosystems. Journal of Hydrology 274, 1–29.
Levia, D.F., 2003. Winter stemflow leaching of nutrient-ions from deciduous canopy trees in relation to meteorological conditions. Agricultural and Forest Meteorology 117, 39–51.
Levia, D.F., 2004. Differential winter stemflow generation under contrasting storm conditions in a southern New England broad-leaved deciduous forest. Hydrological Processes 18, 1105–1112.
Levia, D.F., Herwitz, S.R., 2005. Interspecific variation of bark water storage capacity of three deciduous tree species in relation to stemflow yield and solute flux to forest soils. Catena 64, 117–137.
Levia, D., Keim, R., Carlyle-Moses, D., Frost, E., 2011. Throughfall and stemflow in wooded ecosystems, in: Levia, D., Carlyle-Moses, D., Tanaka, T. (Eds.), Forest Hydrology and Biochemistry: Synthesis of Past Research and Future Directions. Springer, Dordrecht, pp. 426–443.
Levia, D.F., Michalzik, B., Näthe, K., Bischoff, S., Richter, S., Legates, D.R., 2013. Differential stemflow yield from European beech saplings: The role of individual canopy structure metrics. Hydrological Processes 2–9.
78

Levia, D.F., Underwood, S.J., 2004. Snowmelt induced stemflow in northern hardwood forests: A theoretical explanation on the causation of a neglected hydrological process. Advances in Water Resources 27, 121–128.
Levia, D.F., Van Stan, J.T., Mage, S.M., Kelley-Hauske, P.W., 2010. Temporal variability of stemflow volume in a beech-yellow poplar forest in relation to tree species and size. Journal of Hydrology 380, 112–120.
Liang, W.-L., Kosugi, K., Mizuyama, T., 2009. Characteristics of stemflow for tall stewartia (Stewartia monadelpha) growing on a hillslope. Journal of Hydrology 378, 168–178.
Livesley, S.J., Baudinette, B., Glover, D., 2014. Rainfall interception and stem flow by eucalypt street trees – The impacts of canopy density and bark type. Urban Forestry & Urban Greening 13, 192–197.
Llorens, P., Domingo, F., 2007. Rainfall partitioning by vegetation under Mediterranean conditions. A review of studies in Europe. Journal of Hydrology 335, 37–54.
Marin, C.T., Bouten, W., Sevink, J., 2000. Gross rainfall and its partitioning into throughfall, stemflow and evaporation of intercepted water in four forest ecosystems in western Amazonia. Journal of Hydrology 237, 40–57.
Martinez-Meza, E., Whitford, W.G., 1996. Stemflow, throughfall and channelization of stemflow by roots in three Chihuahuan desert shrubs. Journal of Arid Environments 32, 271–287.
McClain, M.E., Boyer, E.W., Dent, C.L., Gergel, S.E., Grimm, N.B., Groffman, P.M., Hart, S.C., Harvey, J.W., Johnston, C.A., Mayorga, E., McDowell, W.H., Pinay, G., 2003. Biogeochemical hot spots and hot moments at the interface of terrestrial and aquatic ecosystems. Ecosystems 6, 301–312.
Michopoulos, P., 2011. Biogeochemistry of urban forests, in: Levia, D.F., Carlyle-Moses, D., Tanaka, T. (Eds.), Forest Hydrology and Biogeochemistry: Synthesis of Past Research and Future Directions. Springer Netherlands, pp. 341–353.
Návar, J., 1993. The causes of stemflow variation in 3 semiarid growing species of northeastern Mexico. Journal of Hydrology 145, 175–190.
Návar, J., 2011. Stemflow variation in Mexico’s northeastern forest communities: Its contribution to soil moisture content and aquifer recharge. Journal of Hydrology 408, 35–42.
Neary, A., Gizyn, W., 1994. Throughfall and stemflow chemistry under deciduous and coniferous forest canopies in south-central Ontario. Canadian Journal of Forest Research 24, 1089–1100.
Park, A., Cameron, J.L., 2008. The influence of canopy traits on throughfall and stemflow in five tropical trees growing in a Panamanian plantation. Forest Ecology and Management 255, 1915–1925.
79
Park, H.-T., Hattori, S., 2002. Applicability of Stand Structural Characteristics to Stemflow Modeling. Journal of Forest Research 7, 91–98.
Perra, B., Haluk, J.-P., Metche, M., 1993. Extraction of suberin and lignin from beech barks (Fagus sylvatica L.). Holzforschung 47, 486–490.
Price, A., Carlyle-Moses, D., 2003. Measurement and modelling of growing-season canopy water fluxes in a mature mixed deciduous forest stand, southern Ontario, Canada. Agricultural and Forest Meteorology 119, 69–85.
Pypker, T., Levia, D., Staelens, J., Van Stan, J., 2011. Canopy structure in relation to hydrological and biogeochemical fluxes, in: Levia, Delphis F., Carlyle-Moses, DE, Tanaka, T. (Eds.), Forest Hydrology and Biochemistry: Synthesis of Past Research and Future Directions. Springer, Dordrecht, pp. 371–388.
Ross, S., 2013. Weather and Climate. Oxford University Press, Don Mills, Ontario. Rutter, A.J., Kershaw, K.A., Robins, P.C., Morton, A.J., 1971. A predictive model of
rainfall interception in forests, 1. Derivation of the model from observations in a plantation of Corsican pine. Agricultural Meteorology 9, 367–384.
Searcy, J., Hardison, C., 1960. Double mass curves. Manual of hydrology: Part 1. General surface water techniques, Water-Supply Paper.
Shirtcliffe, N.J., Pyatt, F.B., Newton, M.I., McHale, G., 2006. A lichen protected by a super-hydrophobic and breathable structure. Journal of Plant Physiology 163, 1193–1197.
Šraj, M., Brilly, M., Mikoš, M., 2008. Rainfall interception by two deciduous Mediterranean forests of contrasting stature in Slovenia. Agricultural and Forest Meteorology 148, 121–134.
Staelens, J., De Schrijver, A., Verheyen, K., 2007. Seasonal variation in throughfall and stemflow chemistry beneath a European beech (Fagus sylvatica) tree in relation to canopy phenology. Canadian Journal of Forest Research 37, 1359–1372.
Staelens, J., De Schrijver, A., Verheyen, K., Verhoest, N.E.C., 2008. Rainfall partitioning into throughfall, stemflow, and interception within a single beech (Fagus sylvatica L.) canopy: Influence of foliation, rain event characteristics, and meteorology. Hydrological Processes 22, 33–45.
Tanaka, T., 2011. Effects of the canopy hydrologic flux on groundwater, in: Levia, Delphis F., Carlyle-Moses, D.,Tanaka, T. (Eds.), Forest Hydrology and Biochemistry: Synthesis of Past Research and Future Directions. Springer, Dordrecht, pp. 499–518.
Taniguchi, M., Tsujimura, M., Tanaka, T., 1996. Significance of stemflow in groundwater recharge. 1: Evaluation of the stemflow contribution to recharge using a mass balance approach. Hydrological Processes 10, 71–80.
80
Tukey, J.W. 1953. The problem of multiple comparisons. Department of Statistics, Princeton University, Princeton, NJ. Unpublished report.
Valente, F., David, J.S., Gash, J.H.C., 1997. Modelling interception loss for two sparse eucalypt and pine forests in central Portugal using reformulated Rutter and Gash analytical models. Journal of Hydrology 190, 141–162.
Van Stan, J., Levia, D., 2010. Inter- and intraspecific variation of stemflow production from Fagus grandifolia Ehrh. (American beech) and Liriodendron tulipifera L. (yellow poplar) in relation to bark microrelief in the eastern United States. Ecohydrology 3, 11–19.
Van Stan, J.T., Levia, D.F., Jenkins, R.B., 2014a. Forest canopy interception loss across temporal scales: Implications for urban greening initiatives. The Professional Geographer 00 (online), 1–11.
Van Stan, J.T., Siegert, C.M., Levia, D.F., Scheick, C.E., 2011. Effects of wind-driven rainfall on stemflow generation between codominant tree species with differing crown characteristics. Agricultural and Forest Meteorology 151, 1277–1286.
Van Stan, J.T., Van Stan, J.H., Levia, D.F., 2014b. Meteorological influences on stemflow generation across diameter size classes of two morphologically distinct deciduous species. International Journal of Biometeorology (online) 1–11.
Ward, R., Robinson, M., 2000. Principles of Hydrology, 4th edition. McGraw-Hill Publishing Company, London, UK.
Xiao, Q., McPherson, E., 2011. Rainfall interception of three trees in Oakland, California. Urban Ecosystems 14, 755–769.
Xiao, Q., McPherson, E., Simpson, J., Ustin, S., 2007. Hydrologic processes at the urban residential scale. Hydrological Processes 21, 2174–2188.
Xiao, Q., McPherson, E.G., Ustin, S.L., Grismer, M.E., Simpson, J.R., 2000. Winter rainfall interception by two mature open-grown trees in Davis, California. Hydrological Processes 14, 763–784.
Zar, J.H. 1984. Biostatistical Analysis. 2nd edition. Prentice-Hall Inc. Englewood Cliffs, NJ. 718 pp.
81

CHAPTER 4 CONCLUSIONS AND RECOMMENDATIONS
4.1 SYNTHESIS: TRAIT AND METEOROLOGICAL FACTORS IN STEMFLOW GENERATION
The breadth and depth of this study have allowed us to test the relevance of key
variables identified in past studies on stemflow, SF, while identifying factors not
previously investigated. For the precipitation regime in Kamloops, British Columbia, and
for this sample of 20 single-leader (Group A) and 17 multi-leader (Group B) isolated
deciduous trees, we found the following tree traits to influence SF processes and yields.
• Branch Angles: With only one exception (Group B funneling ratio, FR, for events
≥ 10 mm), full-canopy intersection angle, AIF, was positively correlated with SF,
including for 1) Group A SF %, 2) Group B stemflow rate, QSF, and 3) Group A and
B rate per m2 projected canopy area, QSF PCA-‐1. Also, upper-canopy intersection
angle, AIU, was positively correlated with Group A and B funneling ratio, FR, and
inversely correlated with SF initiation threshold rain depth, P” (thus contributing to
a lower threshold), while upper-canopy average angle, AAU, was a positive factor
for Group A SF %. We conclude that, except for cases where lower branching
angles are associated with a broader canopy and smooth bark, high branch angles
were associated with greater SF production.
• Bark Relief: Intuitively, smoother bark should promote SF, and for multi-leader
trees in our study, it tended to. It was also inversely related to P”, which supports
many other observations that rougher bark requires greater rain depths to become
saturated. However, we found that bark relief index, BRI, was positively correlated
with SF %, FR, QSF, and QSF PCA-‐1 for single-leader trees, particularly for greater
rain depths. Our study quantified bark relief, or topography, in the form of the BRI
rather than the storage capacity of each tree’s bark, and we suggest that greater
surface areas associated with high BRI may promote SF production, particularly for
82
higher rain depths that have largely saturated the bark and for trees with linearly
furrowed bark and high branch angles. We conclude that it is unwise to make
assumptions that trees with deeply furrowed bark will produce less SF, and
recommend that other climatic and trait factors be considered.
• Cover Metrics: Both canopy cover, CC, and wood cover, WC, were positively
correlated with SF % for Group A and B trees, though for the 5 to < 10 mm rain
depth class, CC was inversely related to Group A FR. There was a positive
correlation between CC and P” for Group A trees, reflecting that most denser trees
require more rain depth to saturate. Finally, WC was positively associated with QSF
for Group B trees and with QSF PCA-‐1 for both groups. We conclude that, while CC
interacted unpredictably with other factors, WC was consistently positively
correlated with SF, reflecting the importance of woody infrastructure to the
funneling of SF through a canopy.
• Size Metrics: For Group A trees, diameter at breast height, DBH, was directly
related to P”, in agreement with past research. For Group B trees, DBH was
inversely related to SF % in the smallest rain class; the same relationship was seen
for Group A trees with FR across all rain depth classes, and with QSF PCA-‐1,
confirming that smaller trees tend to produce more SF, at least early in a storm
event. Canopy volume, VolC, was inversely correlated with SF % in Group A trees
and positively related to QSF, suggesting that there are trade-offs whereby too great
a volume results in higher P” and too small a volume minimizes capture area. Shape
of a canopy can interact with its volume: in our study, we found that height-to-
width ratio, HWR, was positively correlated with SF % for Group B trees and
inversely related to FR for Group A trees, both for the smallest rain depth class.
Tree height, H, was directly related to QSF for Group A trees and to P” for Group B
trees, which may reflect that taller multi-leader trees tend to be broader as well. In
fact, canopy width, CW, was inversely related to SF %, QSF, and QSF PCA-‐1 for
83

Group B trees, supporting the theory that too much breadth in multi-leader trees
tends to be counter-productive in terms of SF generation.
• Leader and Branch Counts: The number of leaders, Ln, was consistently positively
associated with SF (SF %, QSF, and QSF PCA-‐1) and inversely related to P”. We
therefore conclude that the benefits of many multiple leaders converging at the base
of a tree’s canopy more than compensate for the additional surface area and storage
capacity associated with this woody infrastructure. For Group A trees, branch
count, Bn, was positively related to FR for events ≥ 10 mm and inversely related to
QSF and QSF PCA-‐1, possibly reflecting that high Bn conferred an advantage only
once a tree was fully saturated. We suggest that this is an example of a trait that
varies in its relationship with SF depending on other morphological and
meteorological factors.
The following meteorological variables were influential, and particularly so for
groups of trees with lower or higher values for certain trait metrics.
• Rain Depth and Duration: For all except two trees (for which rain duration, DR ,
was most important), this variable explained the most variability in SF volume.
• Break Duration: In general, this factor was inversely related to SF volume, likely
reflecting the relatively dry climate of the study region. When it occurred during the
leafed season, DB was associated with trees having lower CC and thus being more
exposed to the influence of other meteorological variables. During leaf transition,
the influence of DB was associated with lower Ln and Bn, suggesting that smaller
trees with less wood infrastructure dry out faster during intra-storm breaks.
• Rainfall Intensity: When 5-minute weighted average rainfall intensity, Iwt5,
influenced SF volume, it tended to be in trees with more convoluted bark and more
discontinuously draining branches (leaf-on) or lower CC (leaf-off) and it was always
positively related to SF. There was no clear pattern associating 5-minute maximum
84

rainfall intensity, Imax5, positively or negatively with SF, and no tree traits were
associated with the influence of this variable.
• Rainfall Inclination Angle: When it was a factor for leaf-on or leaf-off SF, rainfall
inclination angle, Pinc, was always positively related to SF volume. Its influence was
associated with small, narrow, trees with relatively high branch angles and few
branches (leaf-on) or with trees having high WC (leaf-off), a reasonable profile of a
tree exposed to inclined rain by virtue of its effective crown projection area.
• Wind Speed: As found in past studies, wind speed positively influenced SF
generation in study tree canopies in all leaf conditions. For leafed canopies,
5-minute weighted average wind speed, Wwt5, was influential for trees with high
canopy and wood volumes and larger leaves. Leafless trees influenced by wind
speed tended to have wider canopies and higher WC, implying that large, broad,
dense trees respond to windy conditions with increased SF.
• Vapour Pressure Deficit: Commonly, VPD was inversely related to SF volumes in
leafed canopies, and occasionally in leafless canopies. It was influential in leafed
trees with higher full-canopy average branch angles, AAF, and in leafless canopies
with lower DBH, WC, and tree height.
Finally, we found the following patterns related to seasonal conditions of the
canopy and different types of precipitation:
• Leaf-on vs. Leaf-off Condition: As numerous other researchers have found, SF
tended to start at lower rain depths when trees were leafless and SF volume, for
small events at least, was generally greater for leafless canopies than those in full
leaf. Our findings highlight the need to account for potentially increased SF
generated by urban deciduous trees in the dormant season.
• Precipitation Type: Though variability was high, the general pattern for individual
trees of both Groups A and B was that, for a given depth, the most SF volume was
85
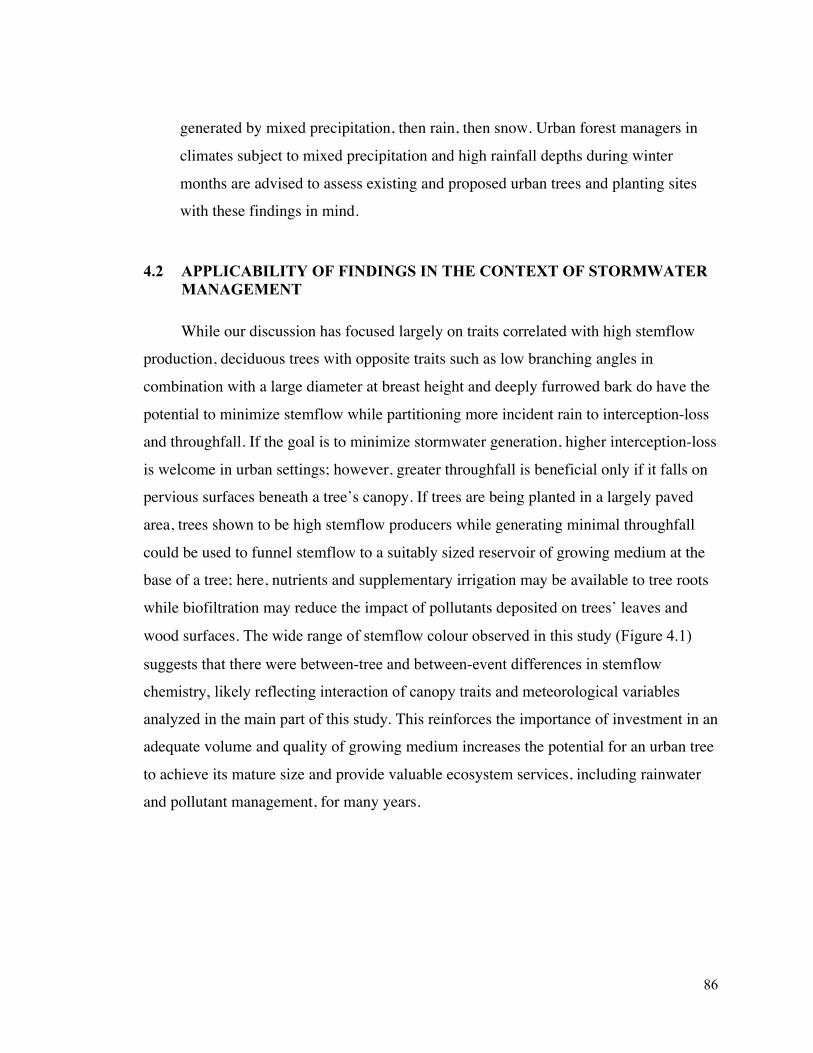
generated by mixed precipitation, then rain, then snow. Urban forest managers in
climates subject to mixed precipitation and high rainfall depths during winter
months are advised to assess existing and proposed urban trees and planting sites
with these findings in mind.
4.2 APPLICABILITY OF FINDINGS IN THE CONTEXT OF STORMWATER MANAGEMENT
While our discussion has focused largely on traits correlated with high stemflow
production, deciduous trees with opposite traits such as low branching angles in
combination with a large diameter at breast height and deeply furrowed bark do have the
potential to minimize stemflow while partitioning more incident rain to interception-loss
and throughfall. If the goal is to minimize stormwater generation, higher interception-loss
is welcome in urban settings; however, greater throughfall is beneficial only if it falls on
pervious surfaces beneath a tree’s canopy. If trees are being planted in a largely paved
area, trees shown to be high stemflow producers while generating minimal throughfall
could be used to funnel stemflow to a suitably sized reservoir of growing medium at the
base of a tree; here, nutrients and supplementary irrigation may be available to tree roots
while biofiltration may reduce the impact of pollutants deposited on trees’ leaves and
wood surfaces. The wide range of stemflow colour observed in this study (Figure 4.1)
suggests that there were between-tree and between-event differences in stemflow
chemistry, likely reflecting interaction of canopy traits and meteorological variables
analyzed in the main part of this study. This reinforces the importance of investment in an
adequate volume and quality of growing medium increases the potential for an urban tree
to achieve its mature size and provide valuable ecosystem services, including rainwater
and pollutant management, for many years.
86

Figure 4.1. Range of stemflow colours observed for May 21−23, 2013 rain event (32.7 mm).
Using the City of Kamloops as a case study, and assuming 1) typical frequencies of
rain depth classes (midpoint depth used), 2) mean stemflow % values based on this study
for Group A and B trees (representing a wide range of sizes) for each rain depth class,
and 3) mean PCA for each group, estimated annual stemflow from 11,200 City-managed
deciduous trees ranges from 2,575 m3 to 3,585 m3 for single- and multi-leader trees,
respectively. The volumetric and biogeochemical concentration of these quantities at the
base of trees justifies careful evaluation of existing and potential tree planting sites and
proactive management of potential infiltration and/or runoff.
It is essential to consider a tree’s contribution to urban hydrology at all stages of its
lifecycle. The mature form of the species may play a very different role in terms of
canopy water balance compared to a newly established specimen. Canopy traits evolve
with time, as do their interactions with meteorological variables. Climate matters:
different tree species will be associated with more or less stemflow production depending
on a region’s storm regime.
87

4.3 LESSONS LEARNED
The innovative methodologies described above are applicable in most contexts, but
it was the public park setting that presented the greatest logistical challenges for our
research. We offer these recommendations to prepare researchers who may be working in
heavily used parks or streetscapes for the first time.
• Collaborate early and often: It is critical to establish expectations and channels of
communication with all groups that will benefit from or be impacted by research at
an urban site. In the case of McArthur Island Park, this meant co-ordination with
the City of Kamloops (use permits, pruning, turf maintenance, irrigation, signage,
and our project website), the McArthur Island Lawn Bowling Club (equipment
storage), an adjacent private property owner (secure site for our weather station),
local police (vandalism prevention), and local media (project updates).
• Prepare to be in the public eye: Answering countless questions from curious
onlookers took time but paid dividends as regular users started to watch out for the
research equipment and let us know of vandalism. Provide links to information
about the project as well as contacts via on-site signage (Figure B.7).
• Budget for vandalism: If there’s public use of a project site, there will be abuse as
well, particularly just after installation. We repaired and replaced stemflow collars,
manual rain gauges, collection reservoirs, and water-filled jugs used to weight the
reservoirs. Local police responded to our requests for increased patrols around the
site during the study, and we suspect that this contributed to a relatively low rate of
vandalism.
• Discourage urban wildlife: Species such as crows, deer, and bears had various
impacts on our installations. One bear completely destroyed a tote and punctured
the water-filled jugs; deer detached sections of collars with their antlers; and
countless crows pecked holes in the black plastic used to cover each tote. We
suspect that the behaviour of the bear and crows reflects repeated rewards of food
88

in black garbage bags (though clear bags weren’t immune). We recommend
alternate configurations or materials if possible.
• Weight or anchor everything: Prepare for above-average winds by anchoring
collection equipment into the ground (e.g., bases for manual rain gauges) or placing
weights within reservoirs.
• Provide adequate reservoir capacity: During larger rain events, we had to check
high-producing trees and take interim measurements to prevent overflow. Even
reservoirs of more than 100 L were no match for trees like our American beech that
produced 224 L of stemflow during a 32.7 mm rain event!
4.4 FUTURE RESEARCH
The knowledge base regarding stemflow quantity and quality in natural and
managed closed-canopy forests has expanded, particularly in the past decade, but
research is needed to better understand and predict canopy interception processes in
urban environments and for isolated trees. While our research focused on cultivated
deciduous species, more work is needed on stemflow and throughfall in conifer species
commonly used in urban landscapes. Our findings highlight the need to better distinguish
stemflow processes according to rainfall depth and other meteorological variables,
requiring systematic study of similar species in contrasting climates and pollutant
regimes. Findings from such studies have the potential to support proactive management
of urban stemflow as a resource in terms of supplementary irrigation and nourishment
rather than as a potential stormwater source.
89

APPENDIX A SUPPLEMENTARY TABLES
Table A.1. Derived values for stemflow initiation threshold, P" (mm), rate, QSF (L mm-1),
and rate per unit projected canopy area,QSF PCA-1 (L mm-1 m-2), along with measured values for an array of canopy traits for individual single-leader (group A) study trees (see Glossary for definition of acronyms and units).
Table A.2. Derived values for stemflow initiation threshold, P" (mm), rate, QSF (L mm-1),
and rate per unit projected canopy area,QSF PCA-1 (L mm-1 m-2), along with measured values for an array of canopy traits for individual multi-leader (group B) study trees (see Glossary for definition of acronyms and units).
Table A.3. Regression coefficients for stemflow, SF, volume (L) as a function of rainfall
depth (P, mm) for study trees in leaf-on condition. Table A.4. Regression coefficients for stemflow, SF, volume (L) as a function of rainfall
depth (P, mm) and actual canopy cover (ACC, %) for study trees in transitional leaf condition.
Table A.5. Regression coefficients for stemflow, SF, volume (L) as a function of rainfall
depth (P, mm) for study trees in leaf-off condition. Table A.6. Multiple regression equations for stemflow, SF, volume (L) as a function of
meteorological variables, generated for single-leader (group A, n = 20) and multi-leader trees (group B, n = 17) for n rain events during leaf-on condition.
Table A.7. Multiple regression equations for stemflow, SF, volume (L) as a function of
meteorological variables, generated for single-leader (group A, n = 20) and multi-leader trees (group B, n = 17) for rain events during transitional leaf condition.
Table A.8. Multiple regression equations for stemflow, SF, volume (L) as a function of
meteorological variables, generated for single-leader (group A, n = 20) and multi-leader trees (group B, n = 17) for rain events during leaf-off condition.
90

Tree ID P" QSF QSF CPA-‐1 DBH H CW HWR Volc Volw CC WC Ln Bn AIF AAF AIU AAU FD BRI MLS
A-1 1.42 0.36 0.032 10.2 5.7 3.66 1.28 28.3 1.6 76.0 15.1 1 26 45.8 62.0 58.7 72.4 0.00 1.06 12.14
A-2 2.96 0.48 0.036 10.5 4.9 4.00 1.09 52.2 1.0 90.6 10.5 1 23 45.6 37.0 51.1 45.8 0.13 1.08 92.22
A-3 1.62 0.33 0.019 11.4 6.3 5.12 1.11 85.9 1.7 94.2 11.7 1 20 40.2 38.8 50.4 54.6 0.10 1.00 30.89
A-4 3.11 0.46 0.023 12.7 7.2 4.50 1.24 103.3 3.6 83.3 18.6 1 23 37.3 33.5 34.9 42.5 0.26 1.00 17.65
A-5 2.72 1.66 0.049 14.6 7.9 6.89 1.17 206.5 5.7 84.6 12.1 1 12 57.9 59.6 69.0 65.5 0.00 1.07 9.54
A-6 1.95 0.53 0.012 15.1 9.9 6.36 1.31 320.6 6.0 74.9 12.4 1 20 42.9 34.3 39.5 40.7 0.25 1.01 1.37
A-7 2.98 1.28 0.063 15.9 9.6 5.13 1.56 120.2 5.5 91.7 19.6 1 18 60.5 61.8 68.0 70.4 0.00 1.00 33.89
A-8 3.74 0.51 0.029 17.2 8.1 4.57 1.40 90.4 6.1 97.9 24.1 1 27 47.7 38.7 55.0 61.4 0.22 1.00 33.42
A-9 3.75 1.76 0.065 19.0 10.5 5.99 1.52 244.3 13.0 95.3 24.0 1 31 46.6 47.5 54.3 61.5 0.13 1.09 9.15
A-10 3.82 1.28 0.057 19.0 11.3 5.24 1.72 167.4 6.0 95.4 20.3 1 26 52.8 60.6 55.3 13.5 0.00 1.02 22.54
A-11 4.51 1.97 0.077 19.7 10.6 5.58 1.53 172.3 8.6 94.6 17.3 1 21 43.5 58.4 30.4 65.2 0.00 1.15 15.91
A-12 4.13 0.42 0.010 20.3 10.1 7.26 1.25 311.7 12.8 88.2 21.2 1 52 14.3 23.7 20.4 39.3 0.48 1.09 30.87
A-13 4.09 2.27 0.061 21.5 9.8 7.49 1.10 271.4 16.7 92.3 23.6 1 39 47.9 32.3 53.0 44.7 0.26 1.20 56.72
A-14 3.70 1.28 0.202 23.5 14.6 2.79 4.13 51.6 8.6 99.6 39.8 1 36 68.1 77.0 75.1 83.0 0.00 1.15 21.59
A-15 2.13 1.26 0.114 24.1 13.1 3.50 2.87 81.7 8.6 98.4 32.1 1 19 66.8 75.2 66.2 76.5 0.00 1.08 23.05
A-16 3.85 0.95 0.034 31.0 10.8 5.83 1.74 280.5 18.1 95.9 33.0 1 28 38.6 18.2 45.2 27.6 0.29 1.04 27.49
A-17 2.78 1.27 0.025 34.3 9.6 8.48 0.94 290.6 41.6 90.3 41.0 1 26 35.4 25.1 32.0 30.6 0.42 1.02 12.72
A-18 3.89 1.99 0.013 43.0 14.1 13.59 0.79 1015.0 114.4 81.3 25.6 1 50 17.7 25.7 27.2 38.1 0.40 1.15 30.67
A-19 4.63 2.15 0.014 52.7 13.8 13.71 0.99 1801.2 105.6 83.6 26.0 1 42 24.9 32.0 39.1 40.3 0.29 1.23 25.57
A-20 4.12 3.61 0.022 60.7 24.7 14.21 1.04 1728.1 183.4 76.7 34.1 1 24 36.6 24.8 35.8 16.6 0.17 1.15 27.89
Avg. 3.29 1.29 0.048 23.8 10.64 6.69 1.49 371.2 28.4 89.2 23.1 1 28.2 43.6 43.3 48.0 49.5 0.17 1.08 26.76Min. 1.42 0.33 0.010 10.2 4.95 2.79 0.79 28.3 1.0 74.9 10.5 1 12.0 14.3 18.2 20.4 13.5 0.00 1.00 1.37
Max. 4.63 3.61 0.202 60.7 24.75 14.21 4.13 1801.2 183.4 99.6 41.0 1 52.0 68.1 77.0 75.1 83.0 0.48 1.23 92.22
Table A.1. Derived values for stemflow initiation threshold, P" (mm), rate, QSF (L mm-1), and rate per unit projected canopy area, QSF PCA-1
(L mm-1 m-2), along with measured values for an array of canopy traits for individual single-leader (group A) study trees.
91

Tree ID P" QSF QSF CPA-‐1 DBH H CW HWR Volc Volw CC WC Ln Bn AIF AAF AIU AAU FD BRI MLS
B-1 3.64 1.37 0.047 15.2 8.1 5.92 0.91 129.2 14.3 86.0 31.2 3 53 57.0 59.7 56.7 63.6 0.00 1.22 7.43
B-2 3.51 1.26 0.079 18.3 6.3 4.37 1.32 56.9 3.0 91.2 17.2 3 58 37.8 27.1 40.8 25.2 0.32 1.00 25.68
B-3 1.33 1.49 0.042 18.8 8.5 6.57 1.44 352.9 15.1 83.5 23.0 3 76 34.9 42.4 38.8 50.9 0.12 1.01 9.39
B-4 3.13 0.48 0.009 21.0 8.7 7.81 1.04 334.4 10.4 84.4 14.7 2 27 39.9 25.8 44.1 31.5 0.29 1.17 1.77
B-5 1.74 2.75 0.051 24.6 8.7 8.08 1.06 381.0 19.6 95.9 18.5 4 56 47.0 53.5 50.4 51.9 0.00 1.10 50.56
B-6 4.12 2.20 0.094 26.0 8.9 5.35 1.46 173.8 19.2 98.8 43.5 3 54 60.2 64.8 53.6 61.7 0.00 1.17 30.43
B-7 5.37 0.97 0.022 28.9 12.6 7.54 1.47 416.0 56.6 94.7 39.8 2 50 32.5 18.9 22.6 24.5 0.59 1.10 9.49
B-8 4.02 4.03 0.048 36.9 10.3 10.14 0.89 657.6 65.5 97.3 37.1 5 56 49.3 52.3 52.2 61.1 0.11 1.18 28.49
B-9 1.58 7.45 0.113 38.8 11.0 9.31 1.09 588.5 103.4 96.5 42.8 6 65 36.8 50.2 54.5 54.0 0.05 1.04 13.45
B-10 3.20 2.65 0.057 41.3 8.3 7.48 1.15 360.6 22.2 97.2 25.0 5 67 52.8 66.2 50.4 66.2 0.00 1.13 45.30
B-11 3.78 2.68 0.027 43.0 12.0 10.74 0.94 845.0 215.1 98.7 41.0 5 85 51.2 49.6 50.6 53.9 0.04 1.25 34.46
B-12 5.27 2.94 0.068 46.0 11.2 7.57 1.25 414.1 77.8 98.8 61.0 3 68 59.2 51.5 58.8 49.6 0.00 1.18 10.80
B-13 7.22 0.61 0.004 51.8 13.0 14.20 0.71 1284.2 183.1 93.8 41.1 4 74 44.6 37.4 44.9 45.0 0.13 1.42 8.90
B-14 4.97 0.32 0.003 54.3 10.5 11.21 0.99 947.5 162.8 96.2 68.4 2 49 25.0 6.5 34.1 11.9 0.55 1.43 5.55
B-15 6.83 1.34 0.017 58.0 14.2 9.51 1.31 860.9 115.6 92.2 39.0 4 66 48.7 35.0 58.6 49.2 0.29 1.33 71.58
B-16 7.23 0.72 0.003 66.8 16.8 15.10 1.02 1987.3 551.4 85.2 51.8 3 52 43.5 47.9 36.2 47.4 0.10 1.16 5.93
B-17 3.85 0.85 0.004 68.7 18.6 16.72 1.05 3872.0 418.3 80.7 47.2 4 52 41.5 13.1 34.4 -3.3 0.40 1.19 35.69
Avg. 4.17 2.01 0.041 38.7 11.05 9.27 1.12 803.6 120.8 92.4 37.8 3.6 59.3 44.8 41.3 46.0 43.8 0.18 1.18 23.23Min. 1.33 0.32 0.003 15.2 6.29 4.37 0.71 56.9 3.0 80.7 14.7 2.0 27.0 25.0 6.5 22.6 -3.3 0.00 1.00 1.77
Max. 7.23 7.45 0.113 68.7 18.64 16.72 1.47 3872.0 551.4 98.8 68.4 6.0 85.0 60.2 66.2 58.8 66.2 0.59 1.43 71.58
Table A.2. Derived values for stemflow initiation threshold, P" (mm), rate, QSF (L mm-1), and rate per unit projected canopy area, QSF PCA-1
(L mm-1 m-2), along with measured values for an array of canopy traits for individual multi-leader (group B) study trees.
92

Tree ID
QSF(L mm-1)
SE p-‐value Intercept SE p-‐
value R2 SEE n P"(mm)
A-1 0.36 0.03 0.00 -0.51 0.33 0.07 0.847 1.26 27 1.4
A-2 0.48 0.04 0.00 -1.43 0.35 0.00 0.924 1.02 18 3.0
A-3 0.33 0.06 0.00 -0.54 0.63 0.20 0.605 2.18 26 1.6
A-4 0.46 0.03 0.00 -1.42 0.35 0.00 0.927 1.10 21 3.1
A-5 1.66 0.13 0.00 -4.51 -1.38 0.00 0.907 3.94 18 2.7
A-6 0.53 0.05 0.00 -1.04 0.46 0.02 0.874 1.33 22 2.0
A-7 1.28 0.11 0.00 -3.81 1.24 0.00 0.858 4.31 25 3.0
A-8 0.51 0.05 0.00 -1.89 0.55 0.00 0.876 1.66 20 3.7
A-9 1.76 0.22 0.00 -6.60 2.29 0.00 0.788 6.07 20 3.7
A-10 1.28 0.13 0.00 -4.90 1.56 0.00 0.840 4.94 21 3.8
A-11 1.97 0.15 0.00 -8.86 1.74 0.00 0.906 5.36 21 4.5
A-12 0.42 0.06 0.00 -1.73 0.58 0.00 0.721 1.66 21 4.1
A-13 2.27 0.19 0.00 -9.29 2.52 0.00 0.901 6.72 18 4.1
A-14 1.28 0.11 0.00 -4.73 1.36 0.00 0.886 4.04 20 3.7
A-15 1.26 0.11 0.00 -2.69 1.35 0.03 0.853 4.47 23 2.1
A-16 0.95 0.06 0.00 -3.64 0.71 0.00 0.931 2.18 21 3.9
A-17 1.27 0.08 0.00 -3.54 0.88 0.00 0.938 2.79 20 2.8
A-18 1.99 0.13 0.00 -7.74 1.53 0.00 0.921 4.78 23 3.9
A-19 2.15 0.32 0.00 -9.94 4.07 0.01 0.729 11.69 19 4.6
A-20 3.61 0.30 0.00 -14.84 3.01 0.00 0.908 7.90 17 4.1
B-1 1.37 0.20 0.00 -4.98 1.97 0.01 0.719 5.83 21 3.6
B-2 1.26 0.13 0.00 -4.41 1.42 0.00 0.818 4.85 24 3.5
B-3 1.49 0.07 0.00 -1.99 0.76 0.01 0.950 2.92 26 1.3
B-4 0.48 0.04 0.00 -1.52 0.43 0.00 0.913 1.08 17 3.1
B-5 2.75 0.27 0.00 -4.79 2.71 0.04 0.802 10.62 27 1.7
B-6 2.20 0.22 0.00 -9.08 2.77 0.00 0.851 8.11 19 4.1
B-7 0.97 0.10 0.00 -5.22 1.35 0.00 0.878 3.50 15 5.4
B-8 4.03 0.31 0.00 -16.23 3.01 0.00 0.907 8.64 19 4.0
B-9 7.45 0.35 0.00 -11.74 3.57 0.00 0.945 14.51 28 1.6
B-10 2.65 0.20 0.00 -8.49 2.24 0.00 0.901 7.51 22 3.2
B-11 2.68 0.13 0.00 -10.12 1.57 0.00 0.958 4.89 20 3.8
B-12 2.94 0.26 0.00 -15.51 3.51 0.00 0.900 8.98 16 5.3
B-13 0.61 0.04 0.00 -4.39 0.60 0.00 0.962 1.12 12 7.2
B-14 0.32 0.21 0.10 -1.57 3.04 0.31 0.312 4.28 7 5.0
B-15 1.34 0.24 0.00 -9.16 3.42 0.02 0.821 4.96 9 6.8
B-16 0.72 0.08 0.00 -5.20 1.14 0.00 0.944 1.58 7 7.2
B-17 0.85 0.16 0.00 -3.29 1.73 0.04 0.636 4.54 18 3.9
Table A.3. Regression coefficients for stemflow, SF, volume (L) as a function of rainfall depth, P (mm) for study trees in leaf-on condition.
93
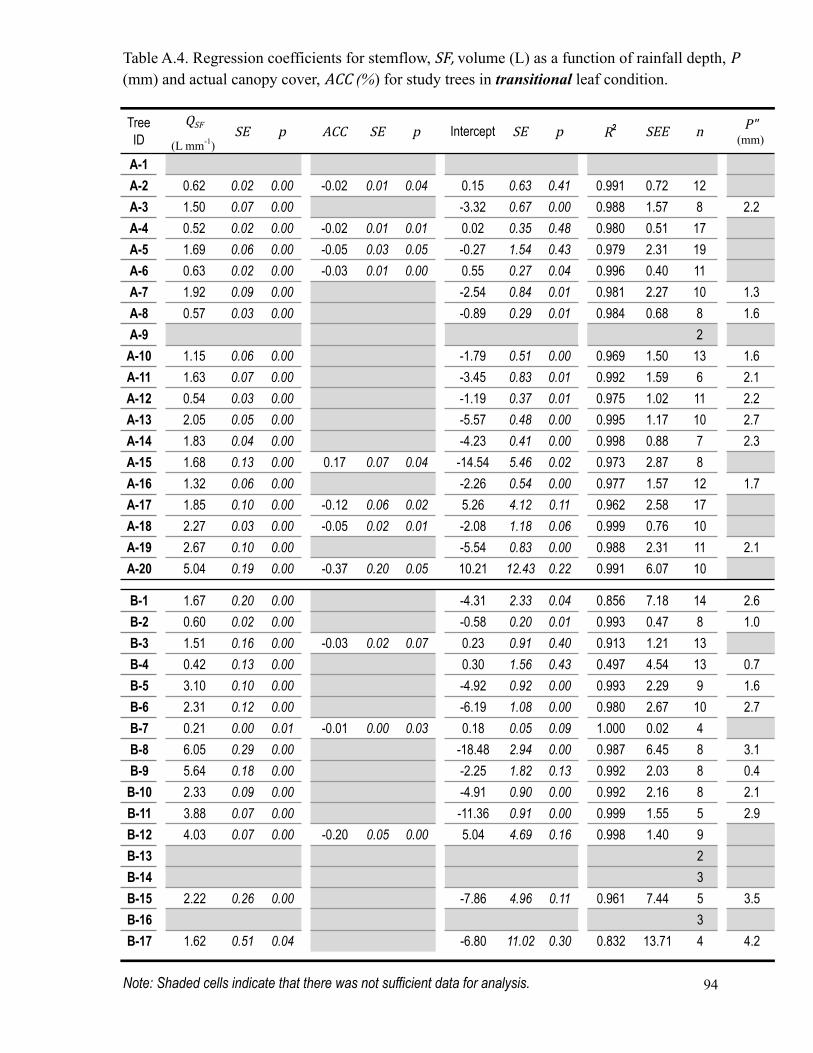
Tree ID
QSF(L mm-1)
SE p ACC SE p Intercept SE p R2 SEE n P"(mm)
A-1A-2 0.62 0.02 0.00 -0.02 0.01 0.04 0.15 0.63 0.41 0.991 0.72 12
A-3 1.50 0.07 0.00 -3.32 0.67 0.00 0.988 1.57 8 2.2
A-4 0.52 0.02 0.00 -0.02 0.01 0.01 0.02 0.35 0.48 0.980 0.51 17
A-5 1.69 0.06 0.00 -0.05 0.03 0.05 -0.27 1.54 0.43 0.979 2.31 19
A-6 0.63 0.02 0.00 -0.03 0.01 0.00 0.55 0.27 0.04 0.996 0.40 11
A-7 1.92 0.09 0.00 -2.54 0.84 0.01 0.981 2.27 10 1.3
A-8 0.57 0.03 0.00 -0.89 0.29 0.01 0.984 0.68 8 1.6
A-9 2
A-10 1.15 0.06 0.00 -1.79 0.51 0.00 0.969 1.50 13 1.6
A-11 1.63 0.07 0.00 -3.45 0.83 0.01 0.992 1.59 6 2.1
A-12 0.54 0.03 0.00 -1.19 0.37 0.01 0.975 1.02 11 2.2
A-13 2.05 0.05 0.00 -5.57 0.48 0.00 0.995 1.17 10 2.7
A-14 1.83 0.04 0.00 -4.23 0.41 0.00 0.998 0.88 7 2.3
A-15 1.68 0.13 0.00 0.17 0.07 0.04 -14.54 5.46 0.02 0.973 2.87 8
A-16 1.32 0.06 0.00 -2.26 0.54 0.00 0.977 1.57 12 1.7
A-17 1.85 0.10 0.00 -0.12 0.06 0.02 5.26 4.12 0.11 0.962 2.58 17
A-18 2.27 0.03 0.00 -0.05 0.02 0.01 -2.08 1.18 0.06 0.999 0.76 10
A-19 2.67 0.10 0.00 -5.54 0.83 0.00 0.988 2.31 11 2.1
A-20 5.04 0.19 0.00 -0.37 0.20 0.05 10.21 12.43 0.22 0.991 6.07 10
B-1 1.67 0.20 0.00 -4.31 2.33 0.04 0.856 7.18 14 2.6
B-2 0.60 0.02 0.00 -0.58 0.20 0.01 0.993 0.47 8 1.0
B-3 1.51 0.16 0.00 -0.03 0.02 0.07 0.23 0.91 0.40 0.913 1.21 13
B-4 0.42 0.13 0.00 0.30 1.56 0.43 0.497 4.54 13 0.7
B-5 3.10 0.10 0.00 -4.92 0.92 0.00 0.993 2.29 9 1.6
B-6 2.31 0.12 0.00 -6.19 1.08 0.00 0.980 2.67 10 2.7
B-7 0.21 0.00 0.01 -0.01 0.00 0.03 0.18 0.05 0.09 1.000 0.02 4
B-8 6.05 0.29 0.00 -18.48 2.94 0.00 0.987 6.45 8 3.1
B-9 5.64 0.18 0.00 -2.25 1.82 0.13 0.992 2.03 8 0.4
B-10 2.33 0.09 0.00 -4.91 0.90 0.00 0.992 2.16 8 2.1
B-11 3.88 0.07 0.00 -11.36 0.91 0.00 0.999 1.55 5 2.9
B-12 4.03 0.07 0.00 -0.20 0.05 0.00 5.04 4.69 0.16 0.998 1.40 9
B-13 2
B-14 3
B-15 2.22 0.26 0.00 -7.86 4.96 0.11 0.961 7.44 5 3.5
B-16 3
B-17 1.62 0.51 0.04 -6.80 11.02 0.30 0.832 13.71 4 4.2
Note: Shaded cells indicate that there was not sufficient data for analysis.
Table A.4. Regression coefficients for stemflow, SF, volume (L) as a function of rainfall depth, P (mm) and actual canopy cover, ACC (%) for study trees in transitional leaf condition.
94

Tree ID
QSF(L mm-1)
SE p Intercept SE p R2 SEE n P"(mm)
A-1 0.40 0.01 0.00 -0.21 0.08 0.01 0.977 0.35 22 0.5
A-2 0.54 0.05 0.00 -0.54 0.10 0.00 0.909 0.26 16 1.0
A-3 0.32 0.03 0.00 -0.23 0.07 0.00 0.871 0.19 16 0.7
A-4 0.19 0.07 0.40 0.13 0.11 0.13 0.009 0.13 9 0.7
A-5 1.28 0.16 0.00 -0.50 0.37 0.08 0.863 0.87 12 0.4
A-6 0.81 0.02 0.00 -0.54 0.14 0.00 0.986 0.56 21 0.7
A-7 0.79 0.16 0.00 0.05 0.33 0.44 0.618 0.94 17 0.1
A-8 0.37 0.06 0.00 -0.25 0.13 0.03 0.773 0.31 15 0.7
A-9 1.54 0.05 0.00 -2.14 0.29 0.00 0.977 1.26 25 1.4
A-10 0.09 0.35 0.40 0.50 0.49 0.16 0.01 0.64 13 5.7
A-11 0.59 0.08 0.00 -0.63 0.17 0.00 0.815 0.44 15 1.1
A-12 0.32 0.09 0.01 -0.01 0.26 0.49 0.776 0.42 6 0.0
A-13 1
A-14 0.33 0.17 0.05 0.21 0.42 0.32 0.317 0.91 10 0.6
A-15 0.71 0.57 0.12 0.20 0.82 0.40 0.11 1.46 15 0.3
A-16 -0.02 0.20 0.47 0.25 0.29 0.21 0.00 0.36 9 14.7
A-17 0.13 0.17 0.23 0.00 0.24 0.50 0.08 0.29 9 0.0
A-18 1.11 0.09 0.00 -1.16 0.22 0.00 0.958 0.47 9 1.0
A-19 1.21 0.17 0.00 -0.97 0.39 0.02 0.840 0.91 12 0.8
A-20 1.78 0.22 0.00 -1.56 0.56 0.01 0.902 1.18 9 0.9
B-1 -0.01 0.03 0.35 0.05 0.05 0.15 0.02 0.06 12 3.7
B-2 0.51 0.08 0.00 -0.30 0.18 0.06 0.777 0.44 14 0.6
B-3 2.11 0.05 0.00 -2.18 0.35 0.00 0.994 1.14 14 1.0
B-4 0.37 0.04 0.00 -0.42 0.09 0.00 0.861 0.23 15 1.1
B-5 2.22 0.21 0.00 -2.05 0.47 0.00 0.902 1.16 14 0.9
B-6 0.65 0.14 0.00 -0.37 0.32 0.13 0.63 0.80 14 0.6
B-7 0.93 0.06 0.00 -3.36 0.70 0.00 0.977 1.41 7 3.6
B-8 5
B-9 5.14 0.41 0.00 -2.66 0.84 0.00 0.913 2.40 17 0.5
B-10 0.16 0.73 0.41 0.93 1.03 0.19 0.00 1.35 12 5.7
B-11 1.38 0.19 0.00 -1.70 0.46 0.00 0.860 0.95 11 1.2
B-12 1.15 0.17 0.00 -1.87 0.54 0.01 0.92 0.76 6 1.6
B-13 1.00 0.09 0.00 -4.51 1.31 0.04 0.98 1.82 4 4.5
B-14 0
B-15 0.13 0.02 0.00 -0.14 0.04 0.00 0.88 0.08 12 1.1
B-16 1
B-17 0.10 0.02 0.00 -0.08 0.06 0.10 0.724 0.12 9 0.9
Note: Shaded cells indicate that there was not sufficient data for analysis.
Table A.5. Regression coefficients for stemflow, SF, volume (L) as a function of rainfall depth, P (mm) for study trees in leaf-off condition.
95

Table A.6. Multiple regression equations for stemflow, !", volume (L) as a function of meteorological variables, generated for single-leader (group A, n = 20) and multi-leader trees (group B, n = 17) for rain events during leaf-on condition. !
!Note: B-14, B-15, and B-16 were not analyzed due to an insufficient number of events# 96

Table A.7. Multiple regression equations for stemflow, !", volume (L) as a function of meteorological variables, generated for single-leader (group A, n = 20) and multi-leader trees (group B, n = 17) for rain events during transitional leaf condition. !
!Note: A-1, 3, 7, 8, 9, 11, 13, 14, 15, 18, and 20 as well as B-2, 5, 6, 7, 8, 9, 10, 11, 12, 13, 14, 15, 16, and 17 were not analyzed due to an insufficient number of events# !!
97

Table A.8. Multiple regression equations for stemflow, !", volume (L) as a function of meteorological variables, generated for single-leader (group A, n = 20) and multi-leader trees (group B, n = 17) for rain events during leaf-off condition. !
!Note: A-12, 13, 17, and 18 as well as B-7, 8, 12, 13, 14, 16 and 17 were not analyzed due to an insufficient number of events# !!
98

APPENDIX B SUPPLEMENTARY MAPS, PHOTOGRAPHS, AND VIDEOS
Figure B.1. Map showing location of study trees, the meteorological station, and manual
rain gauges within McArthur Island Park on the north shore of the Thompson River. The inset shows Kamloops in the context of British Columbia and the Pacific Northwest.
Figure B.2. Aerial view of McArthur Island Park taken from the northwest. Figure B.3. Meteorological station complete with tipping bucket rain gauge (middle)
and separate manual rain gauge (left). Figure B.4. Stemflow collection system. Figure B.5. Screen capture of a portion of leafless canopy. Deduction of selected sky
pixels from total pixels in Adobe Photoshop® CC yielded canopy cover (%) and wood cover (%).
Figure B.6. Bark with measured bark relief index, BRI, values (from left to right) of
1.00, 1.20, and 1.43. Figure B.7. Project sign produced by the City of Kamloops and attached to large maps at
key access points around the park. VIDEO DOCUMENTATION OF STEMFLOW Video B.1. Pin oak Video B.2. Silver maple Video B.3. American beech Video B.4. American beech (close-up)
99

!!!!!!!!!!!!!!!!!!!!!!!!!!
Figure B.1. Location of study trees, meteorological station, and manual rain gauges within McArthur Island Park. The inset shows Kamloops in the context of British Columbia and the Pacific Northwest.
!
!
!
!!
!
!
!
!
!
!
!
!
!
!
!
!
! ! !
!
!
!
!
!
!!!
!
!
!
!
! !
!!
!
!
X
#
#
#
#
#
#
#
#
Thompson River
A-6
A-14
B-8
A-15
B-6
B-12
A-19 B-10 B 16 B-4
B-14
B-17
A-9
A-18B-15
B-7
B-3
A-13
A-8
B-2
A-12
B-5
A-3
A-10
B-13A-7
A-16
B-1
A-20
B-9
B-11
A-1
A-11
A-5
A-2
A-4
A-17
1
8
2
3
6
7
9
4
.
0 75 150 22537.5Meters
Legend! Study Trees
#
Rain Gauge
X Meteorological Station
Legend ! Study Tree ! Rain Gauge ! Meteorological Station
! X!XX! B
X!10
McArthur Island Park
100

Figure B.2. Aerial view of McArthur Island Park taken from the northwest.
Figure B.3. Meteorological station complete with tipping bucket rain gauge (middle) and separate manual rain gauge (left).
101

Figure B.4. Stemflow collection system.
Figure B.5. Screen capture of a portion of leafless canopy. Deduction of selected sky pixels from total pixels in Adobe Photoshop® CC yielded canopy cover (%) and wood cover (%).
102
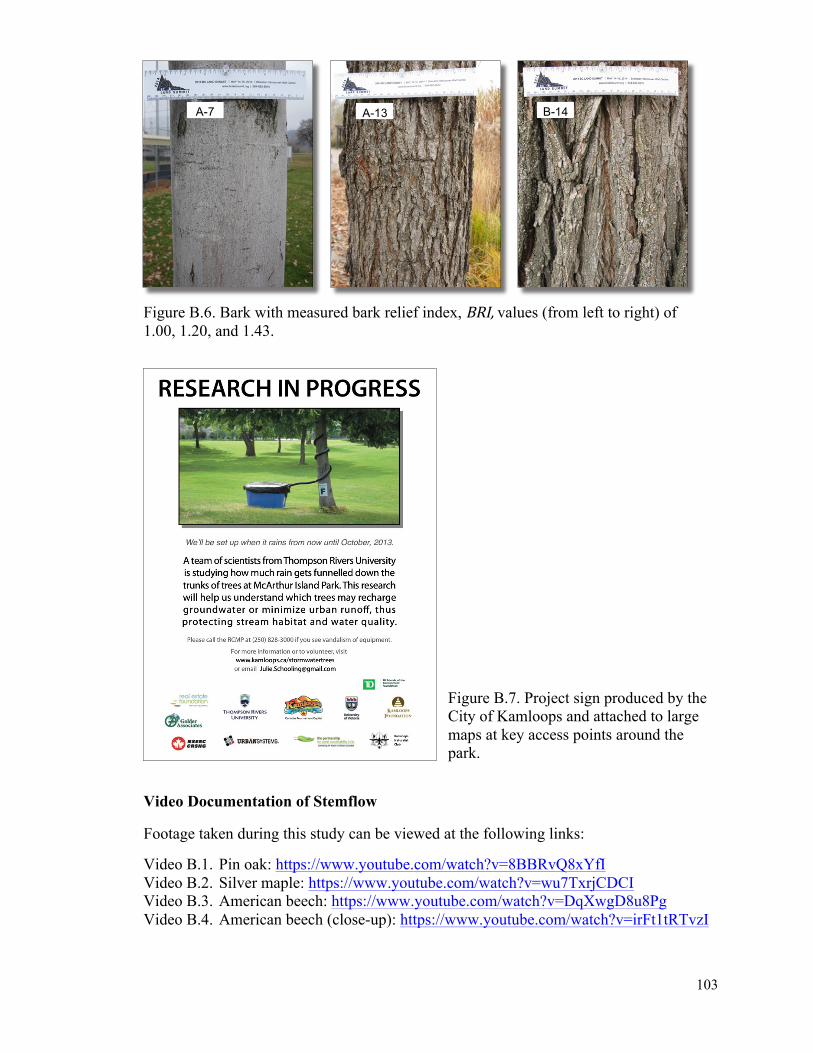
Figure B.6. Bark with measured bark relief index, +,-'&values (from left to right) of 1.00, 1.20, and 1.43.
Figure B.7. Project sign produced by the City of Kamloops and attached to large maps at key access points around the park.
Video Documentation of Stemflow Footage taken during this study can be viewed at the following links: Video B.1. Pin oak: https://www.youtube.com/watch?v=8BBRvQ8xYfI Video B.2. Silver maple: https://www.youtube.com/watch?v=wu7TxrjCDCI Video B.3. American beech: https://www.youtube.com/watch?v=DqXwgD8u8Pg Video B.4. American beech (close-up): https://www.youtube.com/watch?v=irFt1tRTvzI
A-13 A-7 B-14 A-13
103
Top Related