


Languages
Pages
Legal

A Superior Alternative for Global Markets: Growth, Competition and Stockholder ValueGrowth, Competition and Stockholder Value
NASDAQ OMX & ICE Proposal to Acquire NYSE EuronextApril 1, 2011

DisclaimerForward-Looking StatementsForward-Looking StatementsInformation set forth in this communication contains forward-looking statements that involve a number of risks and uncertainties. NASDAQ OMX and the Intercontinental Exchange, Inc. (“ICE”) caution readers that any forward-looking information is not a guarantee of future performance and that actual results could differ materially from those contained in the forward-looking information. Such forward-looking statements include, but are not limited to (i) projections about future financial results, growth, trading volumes, tax benefits and achievement of synergy targets, (ii) statements about the implementation dates and benefits of certain strategic initiatives, (iii) statements about integrations of recent acquisitions, and (iv) other statements that are not historical facts. Forward-looking statements involve a number of risks, uncertainties or other factors beyond NASDAQ OMX’s and ICE’s control. These factors include, but are not limited to, NASDAQ OMX’s and ICE’s ability to implement its strategic initiatives, economic, political and market conditions and fluctuations, government and industry regulation, interest rate risk, U.S. and global competition, and other factors detailed in each of NASDAQ OMX’s and ICE’s filings with the U.S. Securities Exchange Commission (the “SEC”), including (i) NASDAQ OMX’s annual reports on Form 10-K and quarterly reports on Form 10-Q that are available on NASDAQ OMX’s website at http://nasdaqomx.com and (ii) ICE’s annual reports on Form 10-K and quarterly reports on Form 10-Q that are available on ICE’s website at http://theice.com. NASDAQ OMX’s and ICE’s filings are also available on the SEC website at www.sec.gov. Risks and uncertainties relating to the proposed transaction include: NASDAQ OMX, ICE and NYSE Euronext will not enter into any definitive agreement withavailable on the SEC website at www.sec.gov. Risks and uncertainties relating to the proposed transaction include: NASDAQ OMX, ICE and NYSE Euronext will not enter into any definitive agreement with respect to the proposed transaction; required regulatory approvals and financing commitments will not be obtained on satisfactory terms and in a timely manner, if at all; the proposed transaction will not be consummated; the anticipated benefits of the proposed transaction will not be realized; and the integration of NYSE Euronext’s operations with those of NASDAQ OMX or ICE will be materially delayed or will be more costly or difficult than expected. NASDAQ OMX and ICE undertake no obligation to publicly update any forward-looking statement, whether as a result of new information, future events or otherwise.
Important Information About the Proposed Transaction and Where to Find It: Subject to future developments, additional documents regarding the transaction may be filed with the SEC. This material is not a substitute for the joint proxy statement/prospectus or any other documents NASDAQ OMX, ICE and NYSE Euronext would file with the SEC. Such documents, however, are not currently available. INVESTORS ARE URGED TO CAREFULLY READ THE PROXY STATEMENT/PROSPECTUS REGARDING THE PROPOSED TRANSACTION AND ANY OTHER DOCUMENTS NASDAQ OMX, ICE AND NYSE EURONEXT WOULD FILE WITH THE SEC, IF AND WHEN THEY BECOME AVAILABLE, BECAUSE SUCH DOCUMENTS WILL CONTAIN IMPORTANT INFORMATION. Investors will be able to obtain a free copy of the joint proxy statement/prospectus, if and when py j p y p psuch document becomes available, and other relevant documents filed by NYSE Euronext, ICE and/or NASDAQ OMX, without charge, at the SEC’s website (http://www.sec.gov). Copies of the final proxy statement/prospectus, if and when such document becomes available may be obtained, without charge, by directing a request to NASDAQ OMX at One Liberty Plaza, New York, New York 10006, Attention: Investor Relations, in the case of NASDAQ OMX’s filings, or ICE, at 2100 RiverEdge Parkway, Suite 500, Atlanta, Georgia, 30328, Attention: Investor Relations; or by emailing a request to [email protected], in the case of ICE’s filings.
This communication shall not constitute an offer to sell or the solicitation of an offer to buy any securities, nor shall there be any sale of securities in any jurisdiction in which such offer, solicitation or sale would be unlawful prior to registration or qualification under the securities laws of any such jurisdiction. No offering of securities shall be made except by means of a prospectus meeting the requirements of Section 10 of the U.S. Securities Act of 1933, as amended.
Non-GAAP InformationIn addition to disclosing results determined in accordance with GAAP, NASDAQ OMX and ICE also disclose certain non-GAAP and pro forma non-GAAP results of operations, including net income, diluted earnings per share, operating expenses, and operating income that make certain adjustments or exclude certain charges and gains that are described in the reconciliation table of GAAP to non-GAAP and pro forma non-GAAP information provided in the appendix to this presentation. Management of each company believes that this non-GAAP and pro forma non-GAAP information provides investors with additional information to assess NASDAQ OMX's and ICE’s operating performance by making certain adjustments or excluding costs or gains and assists investors in comparing our operating performance to prior periods. Management of each company uses this non-GAAP and pro forma non-GAAP information, along with GAAP information, in evaluating its historical operating performance. The non-GAAP information is not prepared in accordance with GAAP and may not be comparable to non-GAAP information used by other companies. The non-GAAP information should not be viewed as a substitute for, or superior to, other data prepared in accordance with GAAP.
Participants in the Solicitation: NASDAQ OMX, ICE, and their respective directors, executive officers and other employees may be deemed to be participants in the solicitation of proxies in respect of the proposed transaction. You can find information about NASDAQ OMX and NASDAQ OMX’s directors and executive officers in NASDAQ OMX’s Annual Report on Form 10-K, filed with the SEC on February 24, 2011, NASDAQ OMX’s proxy statement, filed with the SEC on April 16, 2010 for its 2010 annual meeting of stockholders, and NASDAQ OMX’s current reports on Form 8-K, filed on February 14, 2011 and February 24, 2011. You can find information about ICE and ICE’s directors and executive officers in ICE’s Annual Report on Form 10-K, filed with the SEC on February 9, 2011, ICE’s current report on Form 8-K filed on March 7, 2011 and in ICE’s proxy statement for its 2010 annual meeting of stockholders, filed with the SEC on April 5, 2010. Additional information about the interests of potential participants will be included in the joint prospectus/proxy statement, if and when it becomes available, and the other relevant documents filed with the SEC.
Website Disclosure
2
Website Disclosure We intend to use each of our websites, www.nasdaqomx.com and www.theice.com as a means for disclosing material non-public information and for complying with SEC Regulation FD and other disclosure obligations. These disclosures will be included on our website under “Investor Relations – Events and Presentations.”
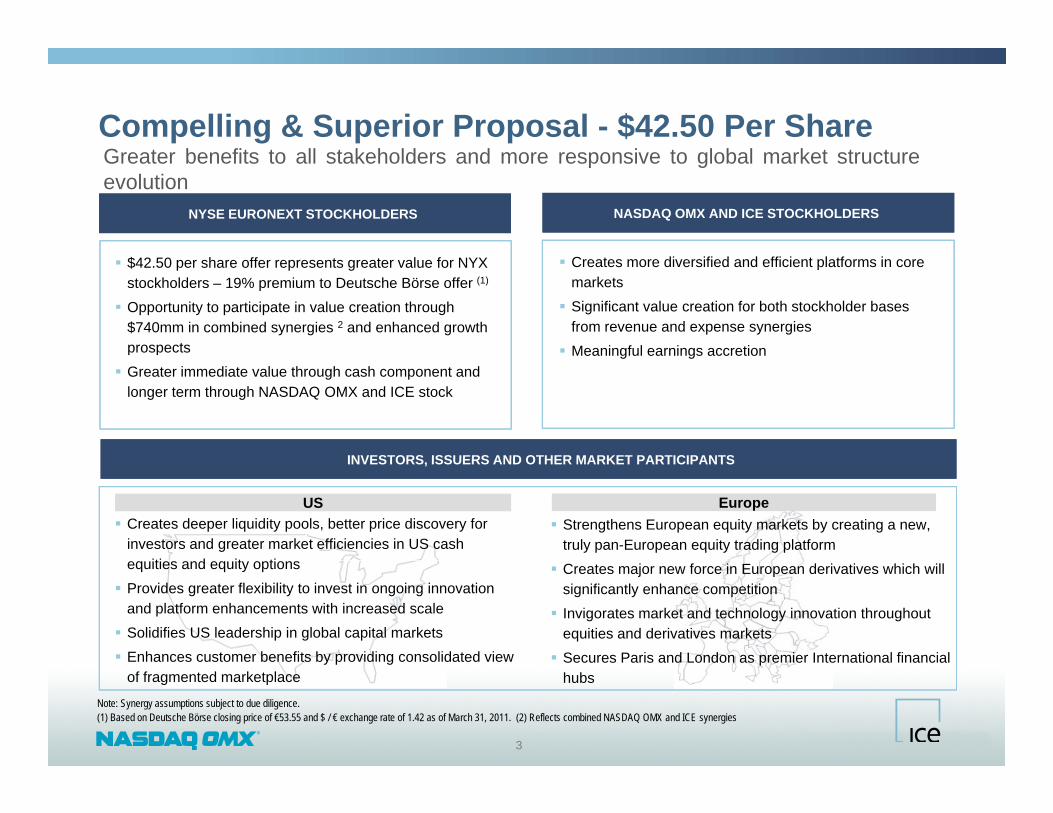
G t b fit t ll t k h ld d i t l b l k t t tCompelling & Superior Proposal - $42.50 Per Share Greater benefits to all stakeholders and more responsive to global market structureevolution
NYSE EURONEXT STOCKHOLDERS NASDAQ OMX AND ICE STOCKHOLDERS
$42.50 per share offer represents greater value for NYX stockholders – 19% premium to Deutsche Börse offer (1)
Opportunity to participate in value creation through $740mm in combined synergies 2 and enhanced growth prospects
Creates more diversified and efficient platforms in core markets Significant value creation for both stockholder bases
from revenue and expense synergies Meaningful earnings accretion
Greater immediate value through cash component and longer term through NASDAQ OMX and ICE stock
Meaningful earnings accretion
INVESTORS ISSUERS AND OTHER MARKET PARTICIPANTS
Strengthens European equity markets by creating a new, truly pan-European equity trading platform
Europe
INVESTORS, ISSUERS AND OTHER MARKET PARTICIPANTS
US Creates deeper liquidity pools, better price discovery for
investors and greater market efficiencies in US cash iti d it ti Creates major new force in European derivatives which will
significantly enhance competition Invigorates market and technology innovation throughout
equities and derivatives markets Secures Paris and London as premier International financial
equities and equity options Provides greater flexibility to invest in ongoing innovation
and platform enhancements with increased scale Solidifies US leadership in global capital markets Enhances customer benefits by providing consolidated view
3
phubs
Note: Synergy assumptions subject to due diligence.(1) Based on Deutsche Börse closing price of €53.55 and $ / € exchange rate of 1.42 as of March 31, 2011. (2) Reflects combined NASDAQ OMX and ICE synergies
y p gof fragmented marketplace
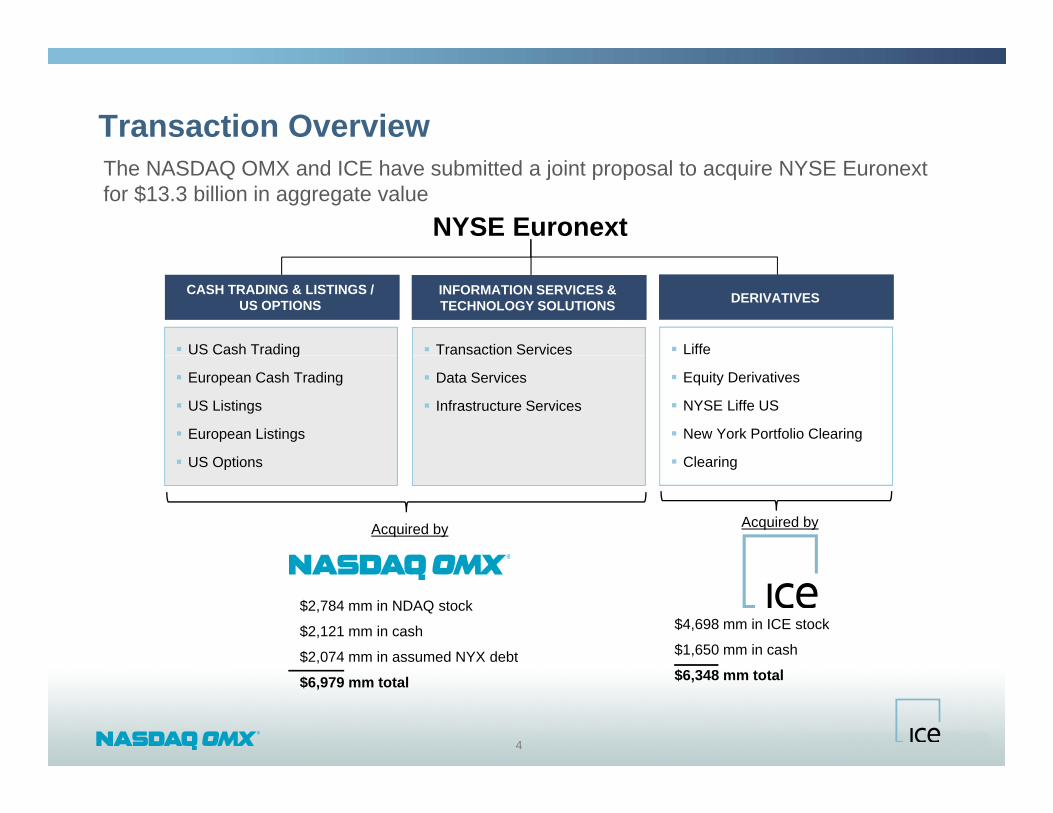
Transaction Overview The NASDAQ OMX and ICE have submitted a joint proposal to acquire NYSE Euronextfor $13.3 billion in aggregate value
NYSE Euronext
Liffe US Cash Trading Transaction Services
DERIVATIVESCASH TRADING & LISTINGS /US OPTIONS
INFORMATION SERVICES &TECHNOLOGY SOLUTIONS
Equity Derivatives
NYSE Liffe US
New York Portfolio Clearing
Cl i
g
European Cash Trading
US Listings
European Listings
US O ti
Data Services
Infrastructure Services
Clearing US Options
Acquired byAcquired by
$4,698 mm in ICE stock
$1,650 mm in cash
$2,784 mm in NDAQ stock
$2,121 mm in cash
$2,074 mm in assumed NYX debt
4
$6,348 mm total$ ,
$6,979 mm total
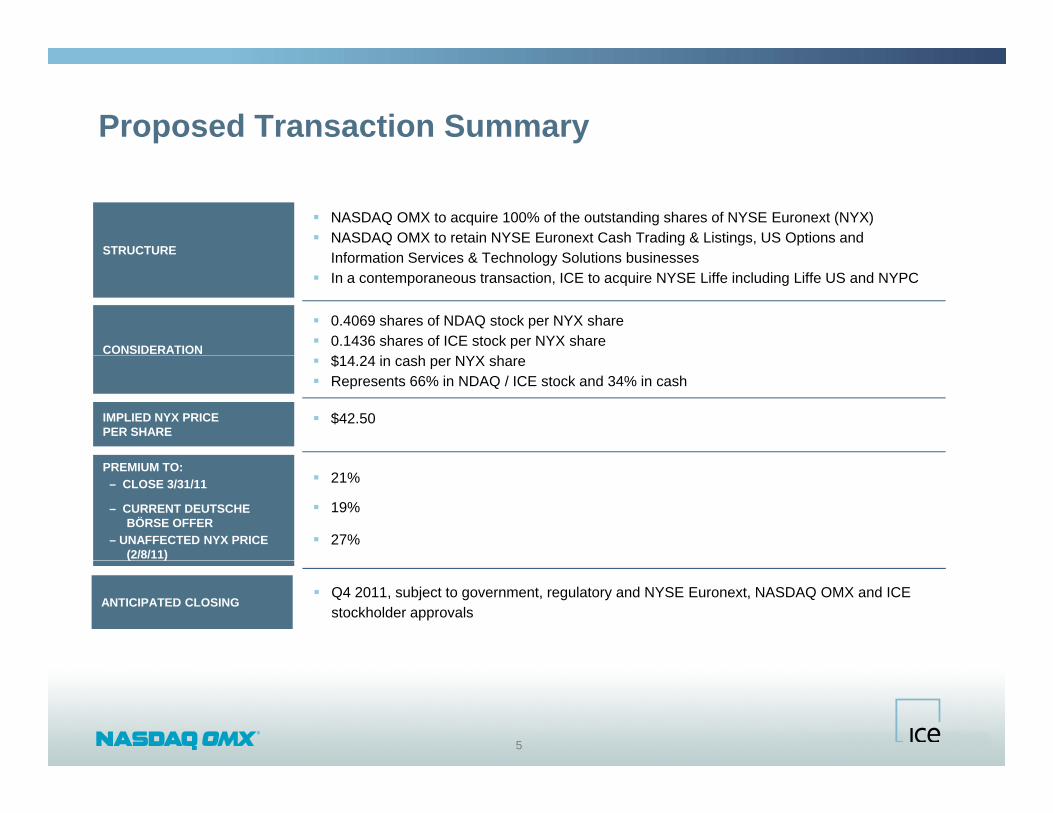
Proposed Transaction Summary
STRUCTURE
NASDAQ OMX to acquire 100% of the outstanding shares of NYSE Euronext (NYX) NASDAQ OMX to retain NYSE Euronext Cash Trading & Listings, US Options and
I f ti S i & T h l S l ti b iSTRUCTURE
CONSIDERATION
Information Services & Technology Solutions businesses In a contemporaneous transaction, ICE to acquire NYSE Liffe including Liffe US and NYPC
0.4069 shares of NDAQ stock per NYX share 0.1436 shares of ICE stock per NYX share
$1 2
IMPLIED NYX PRICEPER SHARE
$14.24 in cash per NYX share Represents 66% in NDAQ / ICE stock and 34% in cash
$42.50
PREMIUM TO:– CLOSE 3/31/11
– CURRENT DEUTSCHE BÖRSE OFFER
– UNAFFECTED NYX PRICE (2/8/11)
21%
19%
27%( )
ANTICIPATED CLOSING Q4 2011, subject to government, regulatory and NYSE Euronext, NASDAQ OMX and ICE
stockholder approvals
5
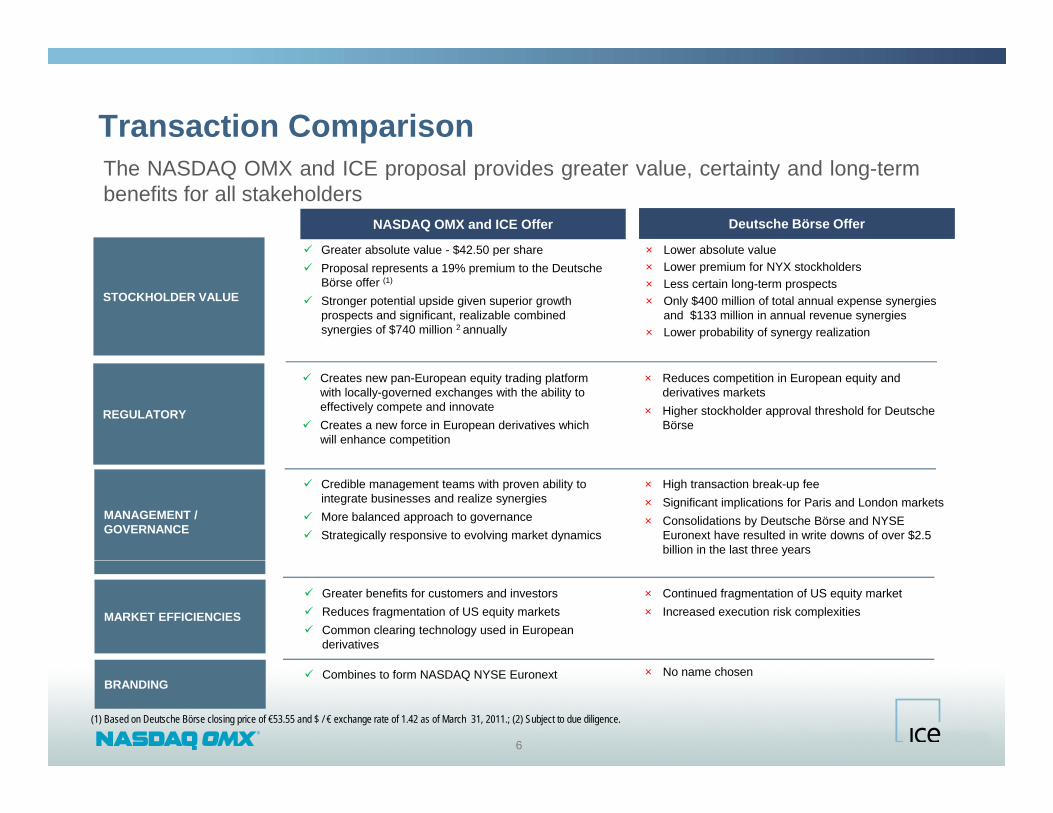
Transaction ComparisonThe NASDAQ OMX and ICE proposal provides greater value, certainty and long-termbenefits for all stakeholders
NASDAQ OMX and ICE OfferNASDAQ OMX and ICE Offer Deutsche Börse OfferDeutsche Börse Offer
Greater absolute value - $42.50 per share × Lower absolute value
STOCKHOLDER VALUE
Greater absolute value $42.50 per share Proposal represents a 19% premium to the Deutsche
Börse offer (1)
Stronger potential upside given superior growth prospects and significant, realizable combined synergies of $740 million 2 annually
Lower absolute value× Lower premium for NYX stockholders× Less certain long-term prospects× Only $400 million of total annual expense synergies
and $133 million in annual revenue synergies× Lower probability of synergy realization
REGULATORY
Creates new pan-European equity trading platform with locally-governed exchanges with the ability to effectively compete and innovate
Creates a new force in European derivatives which will enhance competition
× Reduces competition in European equity and derivatives markets
× Higher stockholder approval threshold for Deutsche Börse
MANAGEMENT / GOVERNANCE
Credible management teams with proven ability to integrate businesses and realize synergies
More balanced approach to governance Strategically responsive to evolving market dynamics
× High transaction break-up fee× Significant implications for Paris and London markets× Consolidations by Deutsche Börse and NYSE
Euronext have resulted in write downs of over $2.5 billion in the last three years
MARKET EFFICIENCIES
Greater benefits for customers and investors Reduces fragmentation of US equity markets Common clearing technology used in European
derivatives
× Continued fragmentation of US equity market× Increased execution risk complexities
6
BRANDING Combines to form NASDAQ NYSE Euronext × No name chosen
(1) Based on Deutsche Börse closing price of €53.55 and $ / € exchange rate of 1.42 as of March 31, 2011.; (2) Subject to due diligence.

Global Reach With Local GovernanceEquities and derivatives markets will benefit from enhanced competition and innovation, as well as local governance and brands
Retains iconic NYSE brand name
Combined headquarters in New York
Expands New York’s
Enhances leadership position in derivatives across geographies and asset classes
London remains a premier
Local governance Reinvigorates Paris as a
leading European equity market
OMX remains center of excellence for technology
Stockholm remains Nordic headquarters
Expands New York s position as global financial center
pderivatives financial market
EUROPEAN MARKETS
ICE NASDAQ NYSE
US MARKETS
ICE NASDAQ NYSE
7
Paris Amsterdam Brussels Lisbon
Stockholm Copenhagen Helsinki Iceland
Riga Tallinn Vilnius Armenia
ICE Liffe ICE
Futures Europe
NASDAQ NYSE NASDAQ Options
Market PHLX
PSX Amex BX
ICE ICE
Futures US ICE OTC Liffe US
NASDAQ NYSE NASDAQ Stock
Market NYSE Arca
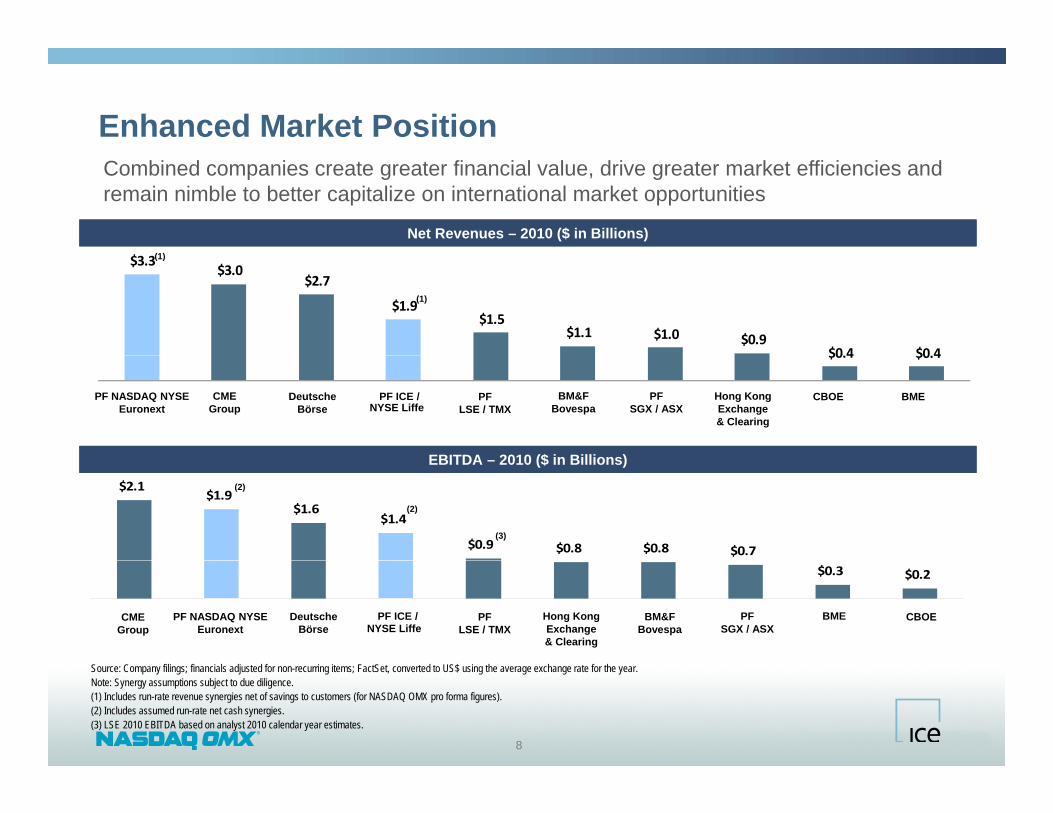
Enhanced Market PositionCombined companies create greater financial value, drive greater market efficiencies and remain nimble to better capitalize on international market opportunities
Net Revenues – 2010 ($ in Billions)Net Revenues – 2010 ($ in Billions)(1)$3.3
$3.0 $2.7
$1.9 $1.5
$1.1 $1.0 $0.9 $0 4 $0 4
(1)
(1)
$0.4 $0.4
NYSE LiffeDeutsche
BörsePF
LSE / TMXPF ICE /
EBITDA 2010 ($ in Billions)EBITDA 2010 ($ in Billions)
CME Group
BM&F Bovespa
PFSGX / ASX
Hong Kong Exchange & Clearing
CBOE BMEPF NASDAQ NYSEEuronext
$2.1$1.9
$1.6$1.4
$0.9 $0.8 $0.8 $0.7
EBITDA – 2010 ($ in Billions)EBITDA – 2010 ($ in Billions)
(3)
(2)
(2)
$0.3 $0.2
PF ICE /NYSE Liffe
CME Group
Deutsche Börse
PFLSE / TMX
Hong Kong Exchange & Clearing
BM&F Bovespa
PF SGX / ASX
BME CBOEPF NASDAQ NYSEEuronext
8
Source: Company filings; financials adjusted for non-recurring items; FactSet, converted to US$ using the average exchange rate for the year.Note: Synergy assumptions subject to due diligence.(1) Includes run-rate revenue synergies net of savings to customers (for NASDAQ OMX pro forma figures).(2) Includes assumed run-rate net cash synergies.(3) LSE 2010 EBITDA based on analyst 2010 calendar year estimates.
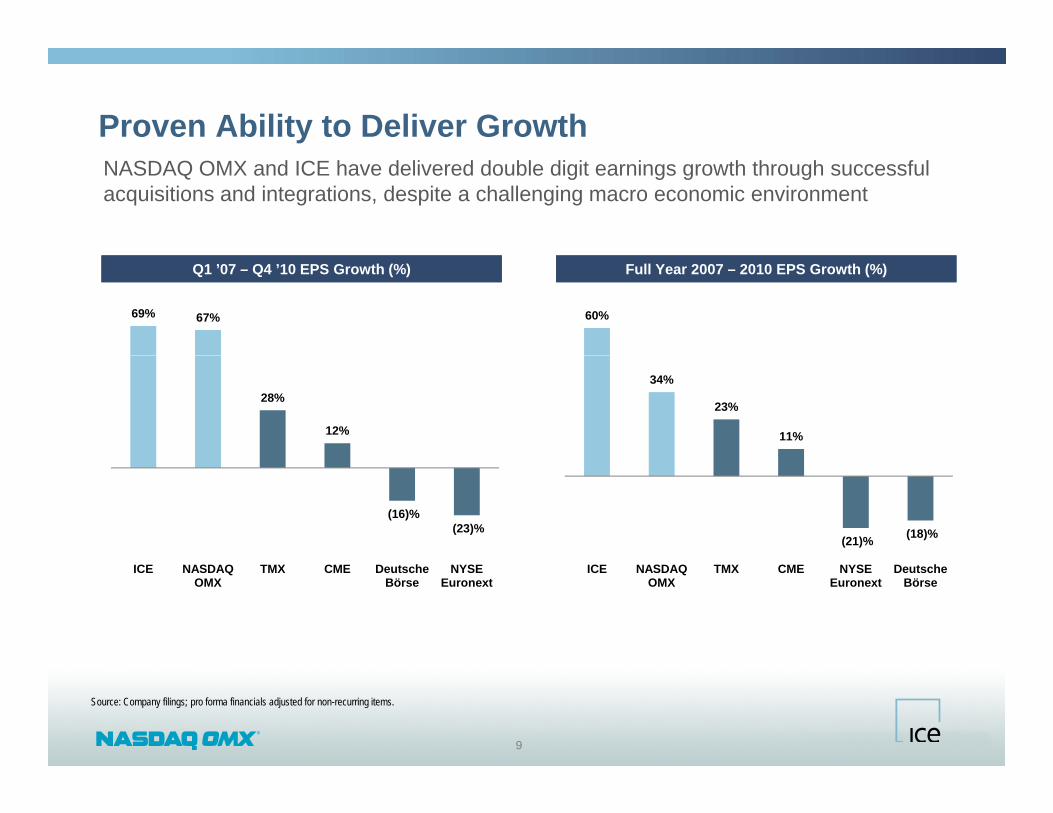
Proven Ability to Deliver GrowthNASDAQ OMX and ICE have delivered double digit earnings growth through successful acquisitions and integrations, despite a challenging macro economic environment
Q1 ’07 – Q4 ’10 EPS Growth (%)Q1 ’07 – Q4 ’10 EPS Growth (%) Full Year 2007 – 2010 EPS Growth (%)Full Year 2007 – 2010 EPS Growth (%)
69% 67% 60%
28%
12%
34%
23%
11%
(16)%(23)%
(21)% (18)%
ICE NASDAQ OMX
TMX CME Deutsche Börse
NYSE Euronext
ICE NASDAQ OMX
TMX CME NYSE Euronext
Deutsche Börse
9
Source: Company filings; pro forma financials adjusted for non-recurring items.

Pro Forma NASDAQ OMX – A Leading Global Exchange
10
Q g g
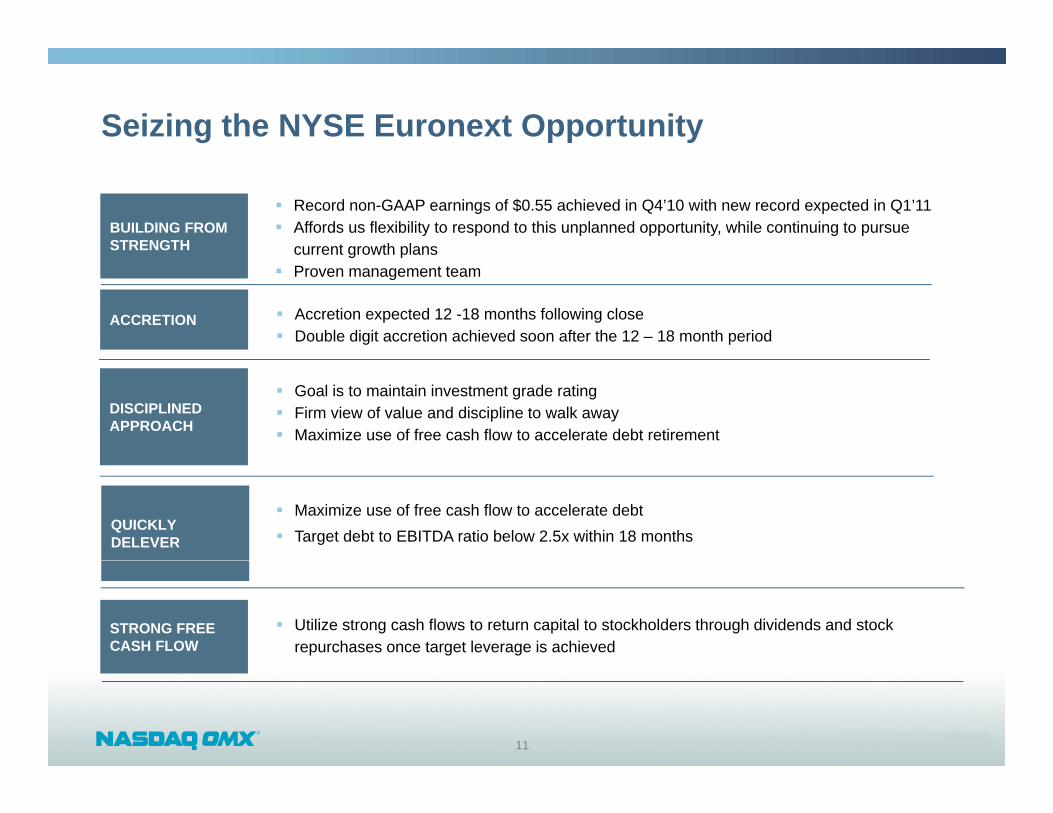
Seizing the NYSE Euronext Opportunity
BUILDING FROM STRENGTH
Record non-GAAP earnings of $0.55 achieved in Q4’10 with new record expected in Q1’11 Affords us flexibility to respond to this unplanned opportunity, while continuing to pursue
current growth plans
ACCRETION Accretion expected 12 -18 months following close Double digit accretion achieved soon after the 12 – 18 month period
current growth plans Proven management team
DISCIPLINED APPROACH
Goal is to maintain investment grade rating Firm view of value and discipline to walk away Maximize use of free cash flow to accelerate debt retirement
QUICKLY DELEVER
Maximize use of free cash flow to accelerate debt Target debt to EBITDA ratio below 2.5x within 18 months
STRONG FREE CASH FLOW
Utilize strong cash flows to return capital to stockholders through dividends and stock repurchases once target leverage is achieved
11
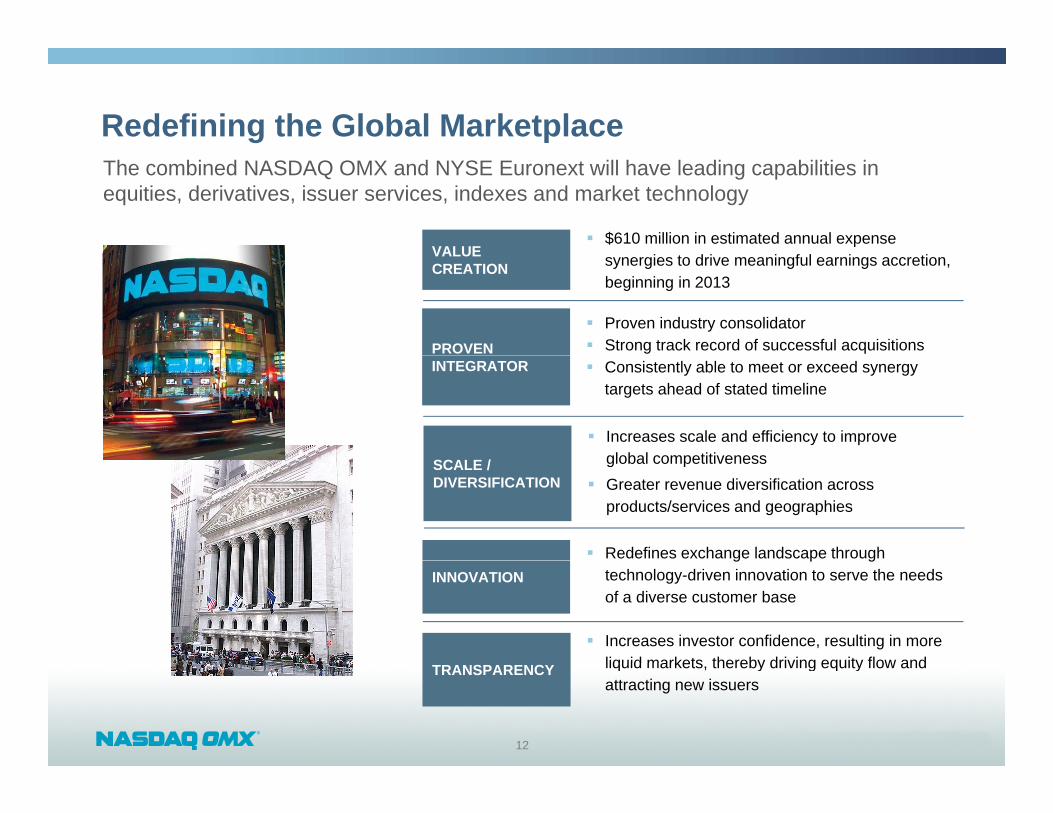
Redefining the Global MarketplaceThe combined NASDAQ OMX and NYSE Euronext will have leading capabilities in equities, derivatives, issuer services, indexes and market technology
VALUE $610 million in estimated annual expense
VALUECREATION synergies to drive meaningful earnings accretion,
beginning in 2013
PROVEN Proven industry consolidator Strong track record of successful acquisitions
Increases scale and efficiency to improve global competitiveness
INTEGRATOR Consistently able to meet or exceed synergy targets ahead of stated timeline
SCALE / DIVERSIFICATION
global competitiveness Greater revenue diversification across
products/services and geographies
Redefines exchange landscape through INNOVATION
g p gtechnology-driven innovation to serve the needs of a diverse customer base
Increases investor confidence, resulting in more liquid markets thereby driving equity flow and
12
TRANSPARENCY liquid markets, thereby driving equity flow and attracting new issuers
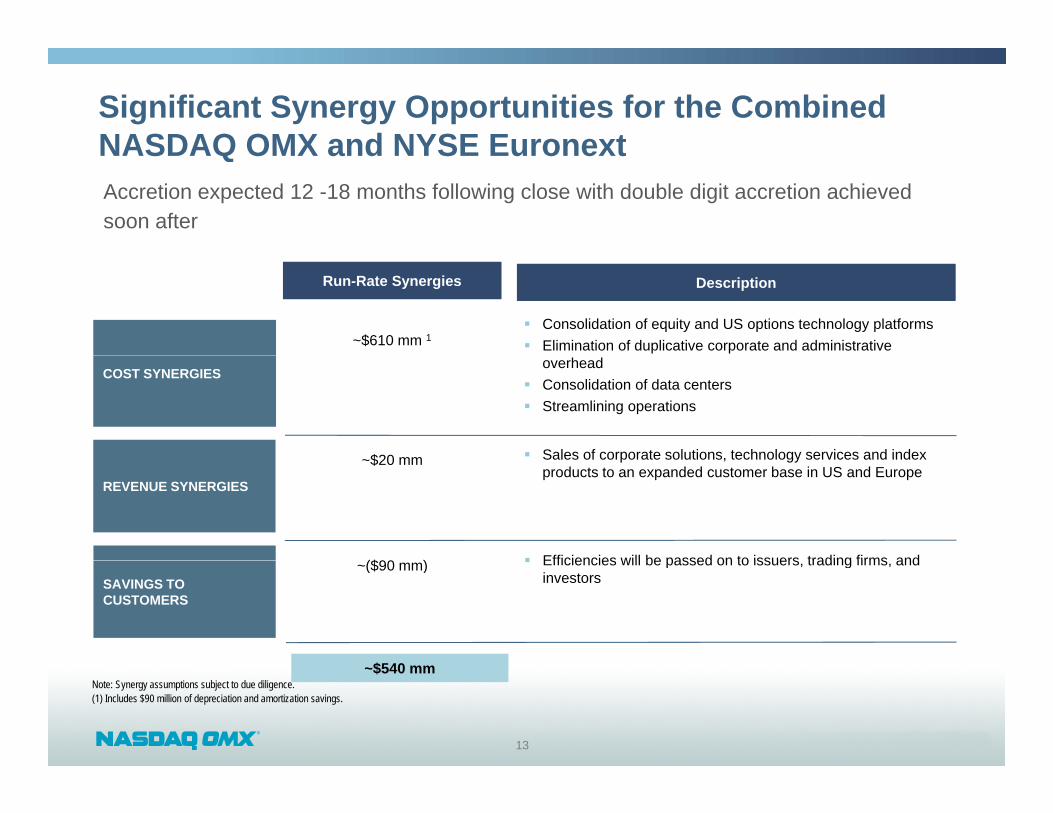
Significant Synergy Opportunities for the Combined NASDAQ OMX and NYSE EuronextAccretion expected 12 -18 months following close with double digit accretion achieved soon after
NASDAQ OMX and NYSE Euronext
Consolidation of equity and US options technology platforms Elimination of duplicative corporate and administrative
Run-Rate SynergiesRun-Rate Synergies DescriptionDescription
~$610 mm 1
COST SYNERGIESoverhead
Consolidation of data centers Streamlining operations
Sales of corporate solutions technology services and index$20 mm
REVENUE SYNERGIES
Sales of corporate solutions, technology services and index products to an expanded customer base in US and Europe
~$20 mm
Efficiencies will be passed on to issuers trading firms and($90 )SAVINGS TO CUSTOMERS
Efficiencies will be passed on to issuers, trading firms, and investors
~($90 mm)
$540
13
~$540 mmNote: Synergy assumptions subject to due diligence.(1) Includes $90 million of depreciation and amortization savings.
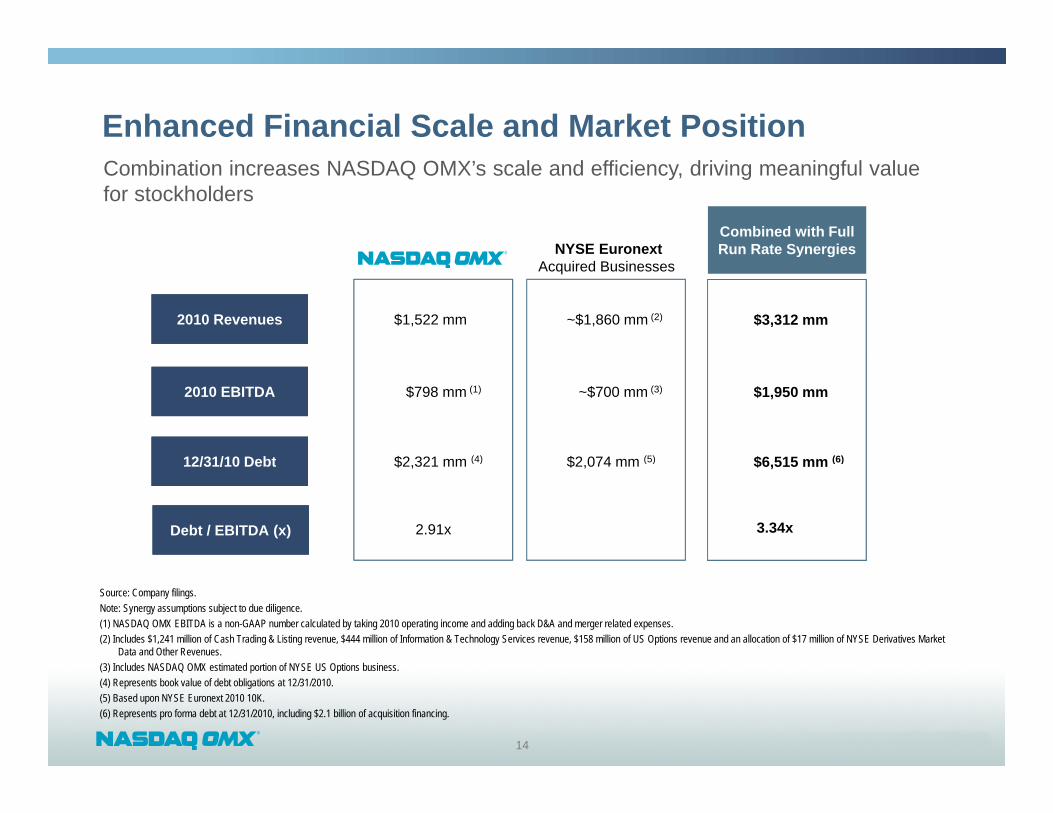
Enhanced Financial Scale and Market PositionCombination increases NASDAQ OMX’s scale and efficiency, driving meaningful valuefor stockholders
Combined with Full Run Rate SynergiesNYSE Euronext
2010 Revenues2010 Revenues $1,522 mm ~$1,860 mm (2)
Run Rate Synergies
$3,312 mm
NYSE Euronext Acquired Businesses
2010 EBITDA2010 EBITDA
12/31/10 D bt12/31/10 D bt
$798 mm (1)
$2 321 (4)
~$700 mm (3)
$2 074 (5)
$1,950 mm
$6 515 (6)12/31/10 Debt12/31/10 Debt
Debt / EBITDA (x)Debt / EBITDA (x)
$2,321 mm (4)
2.91x
$2,074 mm (5) $6,515 mm (6)
3.34x
Source: Company filings. Note: Synergy assumptions subject to due diligence.(1) NASDAQ OMX EBITDA is a non-GAAP number calculated by taking 2010 operating income and adding back D&A and merger related expenses.(2) Includes $1,241 million of Cash Trading & Listing revenue, $444 million of Information & Technology Services revenue, $158 million of US Options revenue and an allocation of $17 million of NYSE Derivatives Market
Data and Other Revenues.
14
(3) Includes NASDAQ OMX estimated portion of NYSE US Options business.(4) Represents book value of debt obligations at 12/31/2010. (5) Based upon NYSE Euronext 2010 10K.(6) Represents pro forma debt at 12/31/2010, including $2.1 billion of acquisition financing.

Proven Track Record of Successful Acquisitions Consistently able to meet or exceed synergy
targets ahead of timeline
OMX acquisition delivered $100mm in expense synergies in 10 months, 14 months ahead of schedule
2010: Acquisition of FTEN Real-Time Risk Management
Acquisition of NYSE Euronext Cash equities
and options in
PHLX acquisition was accretive to stockholders within the first quarter of transaction close
2005: Acquisition of INET Leverageable and low-cost
trading platform 2008 A i iti f
2008: Acquisition of PHLX Premier options trading
platform
the US and Europe
Scale and diversification play
trading platform Improved trade execution
2008: Acquisition of OMX European footprint Derivatives Market technology
2008
2010
2009
2004: Acquisition of BRUT
20062007
2008
2005
Deepen liquidity pool Improved FIX connectivity 2010: Acquisition of SMARTS
Market surveillance solutions
2008: Acquisition of Nord Pool Commodities
2008: Majority investment in IDCG Clearing for interest rate swaps and
other fixed income derivatives
(1)
(1)2005 2006 2007 2008 2009 2010 PF 2010E (1)
R $526 $687 $812 $1 460 $1 453 $1 522 $3 312
15
Source: Company filings.Note: Synergy assumptions subject to due diligence.(1) Pro Forma for acquisition of NYSE Euronext and run-rate synergies.
Revenue: $526 $687 $812 $1,460 $1,453 $1,522 $3,312
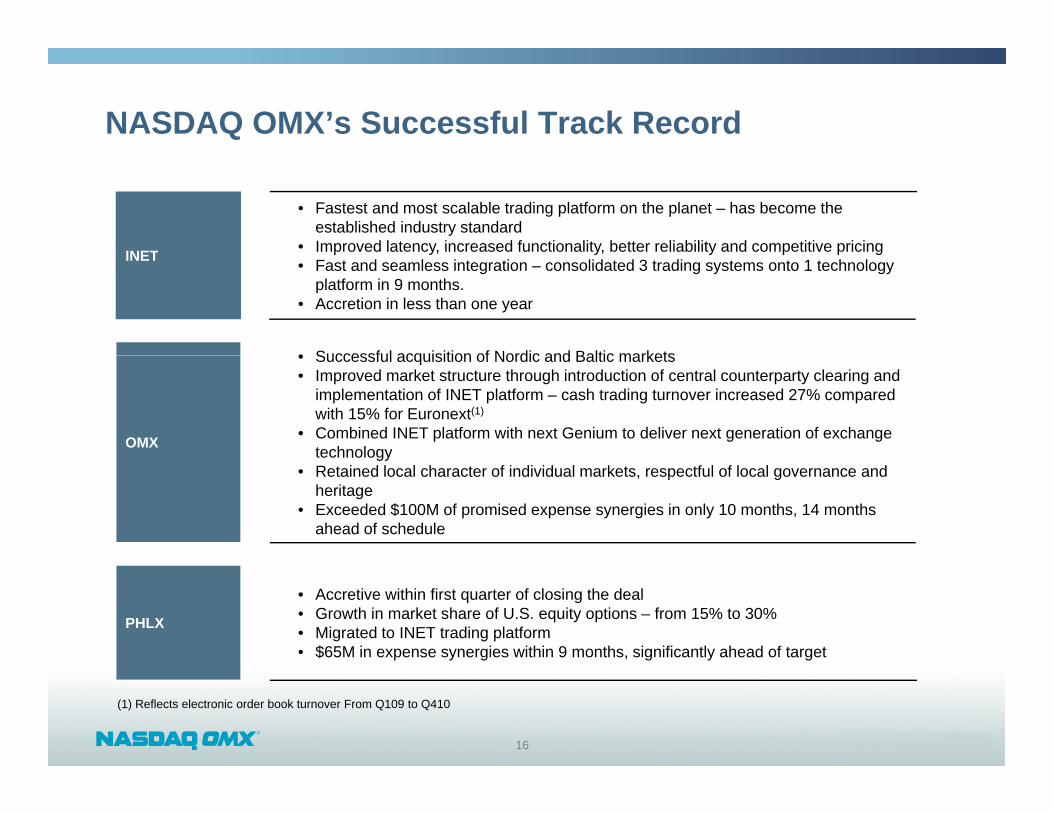
NASDAQ OMX’s Successful Track Record
INET
• Fastest and most scalable trading platform on the planet – has become the established industry standard
• Improved latency, increased functionality, better reliability and competitive pricingINET p y, y, y p p g• Fast and seamless integration – consolidated 3 trading systems onto 1 technology
platform in 9 months. • Accretion in less than one year
• Successful acquisition of Nordic and Baltic markets
OMX
• Successful acquisition of Nordic and Baltic markets• Improved market structure through introduction of central counterparty clearing and
implementation of INET platform – cash trading turnover increased 27% compared with 15% for Euronext(1)
• Combined INET platform with next Genium to deliver next generation of exchange technologygy
• Retained local character of individual markets, respectful of local governance and heritage
• Exceeded $100M of promised expense synergies in only 10 months, 14 months ahead of schedule
PHLX
• Accretive within first quarter of closing the deal• Growth in market share of U.S. equity options – from 15% to 30% • Migrated to INET trading platform• $65M in expense synergies within 9 months, significantly ahead of target
16
(1) Reflects electronic order book turnover From Q109 to Q410
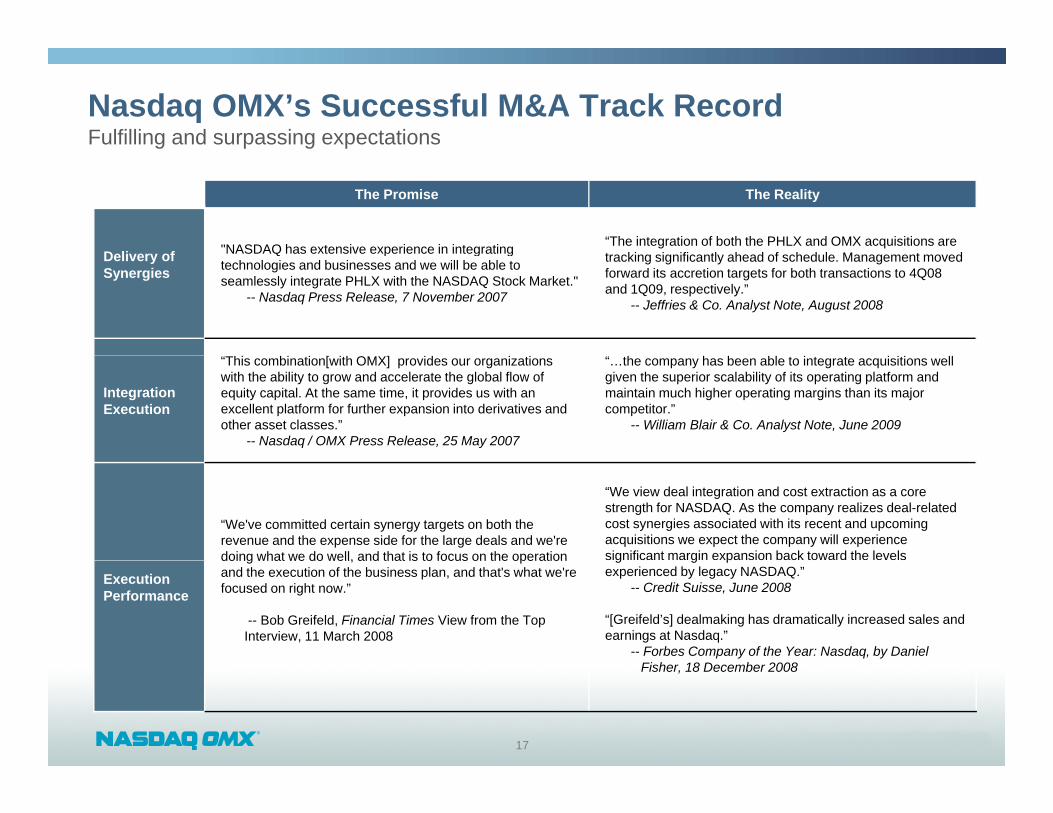
Nasdaq OMX’s Successful M&A Track RecordFulfilling and surpassing expectations
The Promise The Reality
D li f "NASDAQ has extensive experience in integrating “The integration of both the PHLX and OMX acquisitions are t ki i ifi tl h d f h d l M t dDelivery of
SynergiesNASDAQ has extensive experience in integrating
technologies and businesses and we will be able to seamlessly integrate PHLX with the NASDAQ Stock Market."
-- Nasdaq Press Release, 7 November 2007
tracking significantly ahead of schedule. Management moved forward its accretion targets for both transactions to 4Q08 and 1Q09, respectively.”
-- Jeffries & Co. Analyst Note, August 2008
Integration Execution
“This combination[with OMX] provides our organizations with the ability to grow and accelerate the global flow of equity capital. At the same time, it provides us with an excellent platform for further expansion into derivatives and other asset classes.”
-- Nasdaq / OMX Press Release, 25 May 2007
“…the company has been able to integrate acquisitions well given the superior scalability of its operating platform and maintain much higher operating margins than its major competitor.”
-- William Blair & Co. Analyst Note, June 2009
“We've committed certain synergy targets on both the revenue and the expense side for the large deals and we're doing what we do well, and that is to focus on the operation
“We view deal integration and cost extraction as a core strength for NASDAQ. As the company realizes deal-related cost synergies associated with its recent and upcoming acquisitions we expect the company will experience significant margin expansion back toward the levels
Execution Performance
doing what we do well, and that is to focus on the operation and the execution of the business plan, and that's what we're focused on right now.”
-- Bob Greifeld, Financial Times View from the Top Interview, 11 March 2008
g g pexperienced by legacy NASDAQ.”
-- Credit Suisse, June 2008
“[Greifeld’s] dealmaking has dramatically increased sales and earnings at Nasdaq.”
-- Forbes Company of the Year: Nasdaq, by Daniel Fi h 18 D b 2008
17
Fisher, 18 December 2008

NYSE Euronext’s Integration History
• $275M in expense synergies targeted in 3 yearsOperating Income & Net Income
Performance
Synergies
$ p y g g y– didn’t deliver as promised
• $100M in promised revenue synergies never realized
33%
20%
30%
40%
2007 vs. 2010 1
Declining EPS & Margins
• From 2007 to 2010:– Revenues are off 9%– Operating Income is down 25%– Net Income decreased 22%
22%
0%
10%
20%
Net Income decreased 22% – Margins declined from 40% to 33 %
-25%-22%
-30%
-20%
-10%
Operating Income Net Income
Value Destruction
• $1.6 billion impairment charge taken in Q408 to reflect failure to deliver promised returns for acquisition
Operating Income Net Income
NYSE Euronext NASDAQ OMX
18
1. Source: • NASDAQ OMX results; company website: ir.nasdaq.com. 2007 reflects pro forma non-GAAP results and are adjusted to include the results of OMX and PHLX for the period reported, and excludes
certain items that are non-recurring in nature. 2010 reflects non-GAAP results and excludes certain items that are non-recurring in nature. • NYSE Euronext : 2007 results reflect pro forma non-GAAP results reported in earnings release dated February 5, 2008. 2010 results reflect non-GAAP results reported in earnings release dated
February 8, 2011

NYSE Euronext’s Integration History
The Promise The Reality
“ revenue synergies estimated at $375 million Of this“…NYSE predicted that the deal would ‘globally redefine the marketplace for trading cash and derivatives securities
Integration Delays
…revenue synergies estimated at $375 million. Of this amount, approximately $250 million result from the overall rationalisation of the combined group's IT systems and platforms.”
-- NYSE Press Release, 1 June 2006
marketplace for trading cash and derivatives securities, producing significant benefits for shareholders, issuers, and users.’ Four years later the NYSE and Euronext haven't even integrated their trading platforms.”
-- “NYSE and Deutsche Börse: Bigger Does Not Always Mean Better,” Fortune, 9 March 2011
Value Destruction
“This merger…will deliver significant shareholder value from substantial, quantified and deliverable synergies.”
-- NYSE Press Release, 1 June 2006
“NYSE has a long way to go before benefits are fully realized. Investors should not expect significant EPS growth in the near term.”
-- Deutsche Bank Analyst Note, 11 February 2009
“The company will also be well positioned to leverage both the NYSE and Euronext brands including LIFFE to expand
“The Euronext platform…has seen its market share of Euronext stocks dwindle to 65 5 percent of overall tradingMarket Share
Declinethe NYSE and Euronext brands, including LIFFE, to expand and broaden existing businesses into areas of future growth.”
-- NYSE Letter to Euronext N.V., 22 May 2006
Euronext stocks dwindle to 65.5 percent of overall trading from 97.5 percent in early 2008, ThomsonReuters data shows…”
-- “In German Deal, Will Wall Street Rule?” Reuters, 22 February 2011
19

Deutsche Börse’s Integration History
• $2.8 billion purchase of ISE in 2007F il d t i t t t h l l tf 3
25%
30%
35%
40%
80
100
120
ISE
IntegrationDifficulties
• Failed to integrate technology platforms 3 years following transaction – ISE still powered by NASDAQ OMX Technology
0%
5%
10%
15%
20%
0
20
40
60
DecliningB i
• Significant loss in market share, falling from ~ 30% in 2007 to 20 % in 2010 (PHLX is up from 15% to
Volume Share
NASDAQ OMX PHLX
Business in 2007 to 20 % in 2010 (PHLX is up from 15% to 30%)
10%
15%
20%
25%
30%
35%
40
60
80
100
120
Value Destruction
• Multiple impairment charges realized on ISE acquisition– €416 million impairment charge taken in Q409– €450 million impairment charge taken in Q410
0%
5%
0
20
Volume Share
20
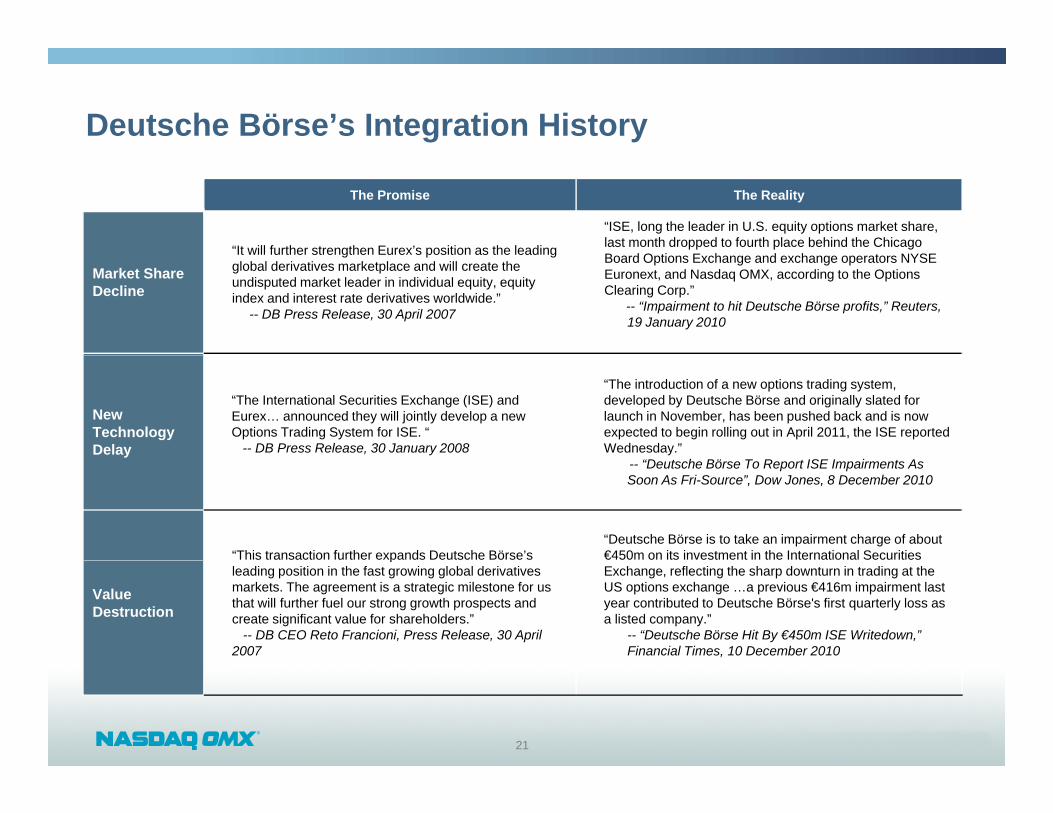
Deutsche Börse’s Integration History
The Promise The Reality
“It will further strengthen Eurex’s position as the leading
“ISE, long the leader in U.S. equity options market share, last month dropped to fourth place behind the Chicago
Market ShareDecline
It will further strengthen Eurex s position as the leading global derivatives marketplace and will create the undisputed market leader in individual equity, equity index and interest rate derivatives worldwide.”
-- DB Press Release, 30 April 2007
Board Options Exchange and exchange operators NYSE Euronext, and Nasdaq OMX, according to the Options Clearing Corp.”
-- “Impairment to hit Deutsche Börse profits,” Reuters,19 January 2010
New Technology Delay
“The International Securities Exchange (ISE) and Eurex… announced they will jointly develop a new Options Trading System for ISE. “
-- DB Press Release, 30 January 2008
“The introduction of a new options trading system, developed by Deutsche Börse and originally slated for launch in November, has been pushed back and is now expected to begin rolling out in April 2011, the ISE reported Wednesday.”
-- “Deutsche Börse To Report ISE Impairments As Soon As Fri-Source”, Dow Jones, 8 December 2010
“This transaction further expands Deutsche Börse’s“Deutsche Börse is to take an impairment charge of about €450m on its investment in the International Securities
Value Destruction
pleading position in the fast growing global derivatives markets. The agreement is a strategic milestone for us that will further fuel our strong growth prospects and create significant value for shareholders.”
-- DB CEO Reto Francioni, Press Release, 30 April 2007
Exchange, reflecting the sharp downturn in trading at the US options exchange …a previous €416m impairment last year contributed to Deutsche Börse's first quarterly loss as a listed company.”
-- “Deutsche Börse Hit By €450m ISE Writedown,” Financial Times, 10 December 2010
21
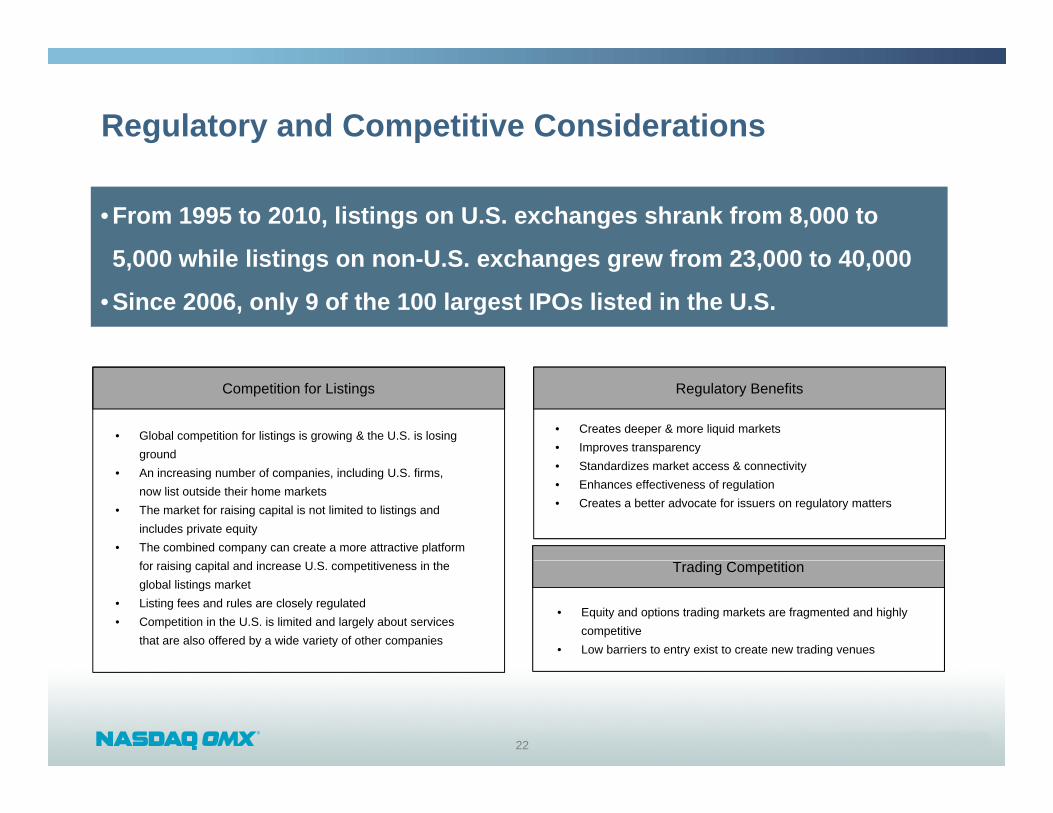
Regulatory and Competitive Considerations
• From 1995 to 2010, listings on U.S. exchanges shrank from 8,000 to
5 000 hil li ti U S h f 23 000 t 40 0005,000 while listings on non-U.S. exchanges grew from 23,000 to 40,000
• Since 2006, only 9 of the 100 largest IPOs listed in the U.S.
Competition for Listings
• Creates deeper & more liquid markets• Improves transparency
• Global competition for listings is growing & the U.S. is losing ground
Regulatory Benefits
• Standardizes market access & connectivity• Enhances effectiveness of regulation• Creates a better advocate for issuers on regulatory matters
ground• An increasing number of companies, including U.S. firms,
now list outside their home markets• The market for raising capital is not limited to listings and
includes private equity• The combined company can create a more attractive platform
for raising capital and increase U.S. competitiveness in the global listings market
• Listing fees and rules are closely regulated• Competition in the U.S. is limited and largely about services
that are also offered by a wide variety of other companies
• Equity and options trading markets are fragmented and highly competitive
• Low barriers to entry exist to create new trading venues
Trading Competition
22

Highly Diversified Pro Forma Revenue CompositionSignificant diversification across multiple business lines and geographies
Combined NASDAQ NYSE EuronextCo b ed S Q S u o e t2010 Total Pro Forma Net Revenues $3,312 mm (1)
Cash EquitiesTrading
Other Well diversified revenue base with no significant concentrations
10%
14%21%
Trading
Technology
concentrations
Highly synergistic and complementary lines of business
21%
21%
13%Derivatives
Market Data
Strong competitive positions across all major business lines
Attractive mix of 21%
Issuer Services
Attractive mix of transaction and fee-based revenues results in a strong cash flow business
23
(1) Recategorized NASDAQ OMX Global Index as Market Data.
Pro Forma ICE – A Leading Innovator in Global Derivatives Markets
24

Compelling Strategic RationaleUnique opportunity to significantly enhance ICE’s position as a leading operator ofintegrated futures exchanges and over-the-counter (OTC) markets, clearing houses,trade processing and data services for the global derivatives markets
Significantl e pands prod ct offering ith Liffe’s leading interest rate f t res compleUNIQUE OPPORTUNITY TO ENHANCE GLOBAL DERIVATIVES FRANCHISE
Significantly expands product offering with Liffe’s leading interest rate futures complex Adds greater diversification and distribution capabilities Enhances position across multiple asset classes spanning energy, commodities, interest rates,
credit and foreign exchange Superior solution for European derivatives market – enhances competition and innovation
COMPELLING VALUE CREATION
Greater value creation - opportunistic approach to unlocking value for ICE stockholders, as well as market participants Modestly GAAP EPS dilutive in year 1 and accretive to ICE stockholders in year 2 Capitalizes on ICE’s leadership in derivatives, innovation and positioning markets for growth in
EuropeL Liff ’ t bli h d d b d t di if hi ll
SIGNIFICANT
Leverages Liffe’s established presence and brand to diversify geographically Maintains substantial financial flexibility to pursue additional strategic opportunities or other
existing organic growth initiatives
Approximately $200 million in run-rate synergies expected Opportunities to consolidate technology platforms and eliminate other overlapping expenses
SYNERGIES
PROVEN INDUSTRY CONSOLIDATOR
Opportunities to consolidate technology platforms and eliminate other overlapping expenses Clearing synergies through internalization of clearing services currently provided by others
Proven track record of successful acquisitions and integrations Consistent ability to execute and create significant value for stockholders and market
participants
25
CONSOLIDATOR participants Disciplined approach to acquisitions with proven record of enhancing stockholder value
Note: Synergy assumptions subject to due diligence.

Leading Innovator in Global Derivatives MarketsAn ICE and Liffe combination creates a leading global, end-to-end derivatives franchise spanning energy, commodities, interest rates, credit and foreign exchange
Further expansion into the European marketsS
EXPANSIVE PRODUCT OFFERING
New entry into European and U.S. interest rates products Expansion of ICE’s financial futures offering Augments ICE’s leading OTC franchise Complementary agricultural product sets
Leverages ICE’s core technology platform to create greater economies of scale andLEADING TECHNOLOGY PLATFORM
Leverages ICE s core technology platform to create greater economies of scale and market efficiencies Opportunity for significant cost savings by replacing Liffe Connect technology platform
Greater scale of operations in London market and increased exposure to European customer base
LEVERAGE EXISTING EUROPEAN FOOTPRINT
customer base Utilizes ICE’s existing London based clearinghouse - first new clearinghouse in London in
over a century ICE and Liffe already share common clearing technology which is currently owned and
operated by NYSE Euronext Greater market efficiencies gained by eliminating outsourcing of clearing functions
INNOVATION LEADERSHIP
Greater market efficiencies gained by eliminating outsourcing of clearing functions
Proven ability to stimulate growth through market and technology innovation Creation of OTC energy clearing Establishment of leading CDS clearing house
26
Development of most successful new product suite in recent history

Greater Product and Geographic Diversification
F
Market Data &
CDS OTC9%
InterestEnergy Futures
Ags4%
Other2%
Pro Forma Business Mix – Net Revenues (%)Pro Forma Business Mix – Net Revenues (%)Pro Forma Product Mix –Volumes (1) (%)Pro Forma Product Mix –Volumes (1) (%)
Futures 61% (2)
Global
Other11%
Interest Rates38%
O C
Equity Derivatives
21%
Futures13%
2010Revenues
2010Volumes
OTC20%
OTC Energy
22%
21%
Pro Forma Geographic Mix – Net Revenues (%)Pro Forma Geographic Mix – Net Revenues (%)
2010 Total Pro Forma Net Revenues: $1.8bn
Pro Forma Geographic Mix – Volumes (1) (%)Pro Forma Geographic Mix – Volumes (1) (%)
2010 Pro Forma Contracts: 1.5bn (1)
US34%
US29%
Canada<1%
20102010
Non-US66%
Europe71%
2010Revenues
2010 T t l P F N t R $1 8b
2010Volumes
2010 P F C t t 1 5b (1)
27
Source: Company filings. (1) Excludes ICE OTC CDS volumes and Bclear.(2) Liffe Futures revenues include revenues from Bclear.
2010 Total Pro Forma Net Revenues: $1.8bn2010 Pro Forma Contracts: 1.5bn (1)
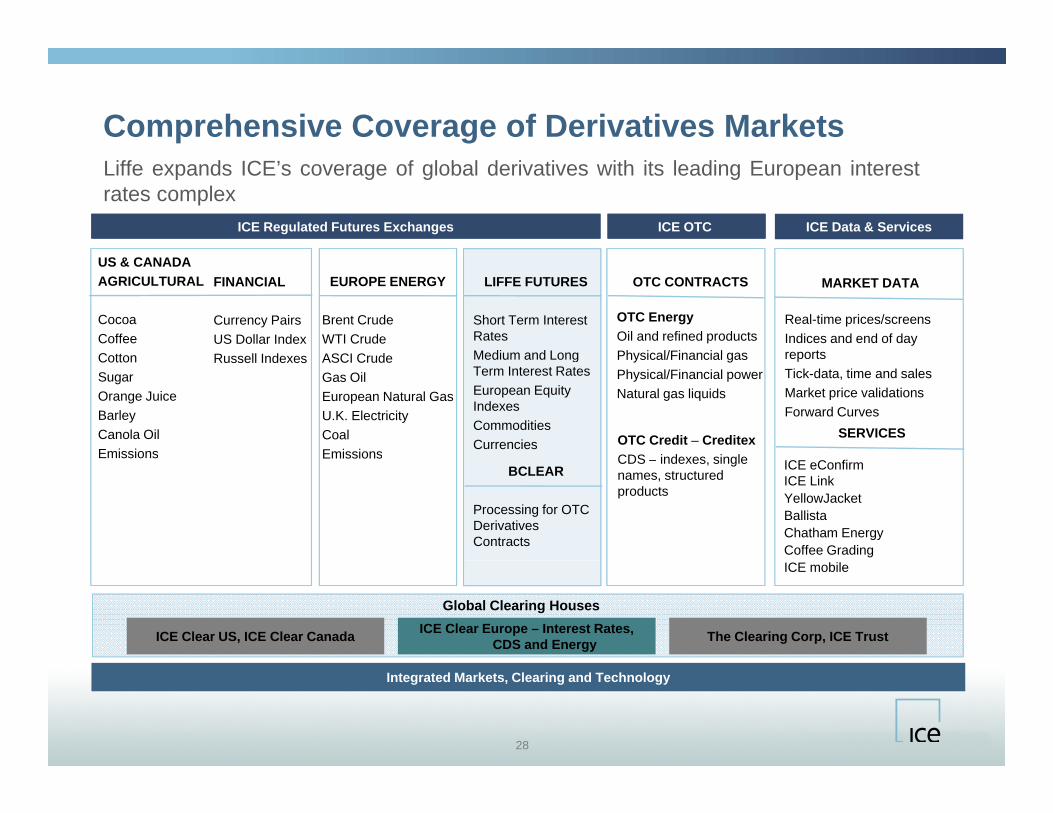
Comprehensive Coverage of Derivatives MarketsLiffe expands ICE’s coverage of global derivatives with its leading European interestrates complex
ICE Regulated Futures Exchanges ICE OTC ICE Data & ServicesICE Data & Services
EUROPE ENERGY
Brent CrudeWTI CrudeASCI C d
OTC CONTRACTS
OTC Energy Oil and refined productsPhysical/Financial gas
US & CANADAAGRICULTURAL
CocoaCoffeeCotton
FINANCIAL
Currency PairsUS Dollar IndexR ll I d
MARKET DATA
Real-time prices/screensIndices and end of day reports
LIFFE FUTURES
Short Term Interest RatesMedium and LongASCI Crude
Gas OilEuropean Natural GasU.K. ElectricityCoalEmissions
Physical/Financial gasPhysical/Financial powerNatural gas liquids
CottonSugarOrange JuiceBarleyCanola OilEmissions
Russell Indexes reportsTick-data, time and salesMarket price validationsForward Curves
SERVICESOTC Credit – CreditexCDS indexes single
Medium and Long Term Interest RatesEuropean Equity IndexesCommoditiesCurrencies
EmissionsEmissionsICE eConfirmICE LinkYellowJacketBallistaChatham EnergyCoffee Grading
CDS – indexes, single names, structured products
BCLEAR
Processing for OTC Derivatives Contracts
ICE mobile
ICE Clear US, ICE Clear Canada ICE Clear Europe – Interest Rates, CDS and Energy The Clearing Corp, ICE Trust
Global Clearing Houses
28
Integrated Markets, Clearing and Technology
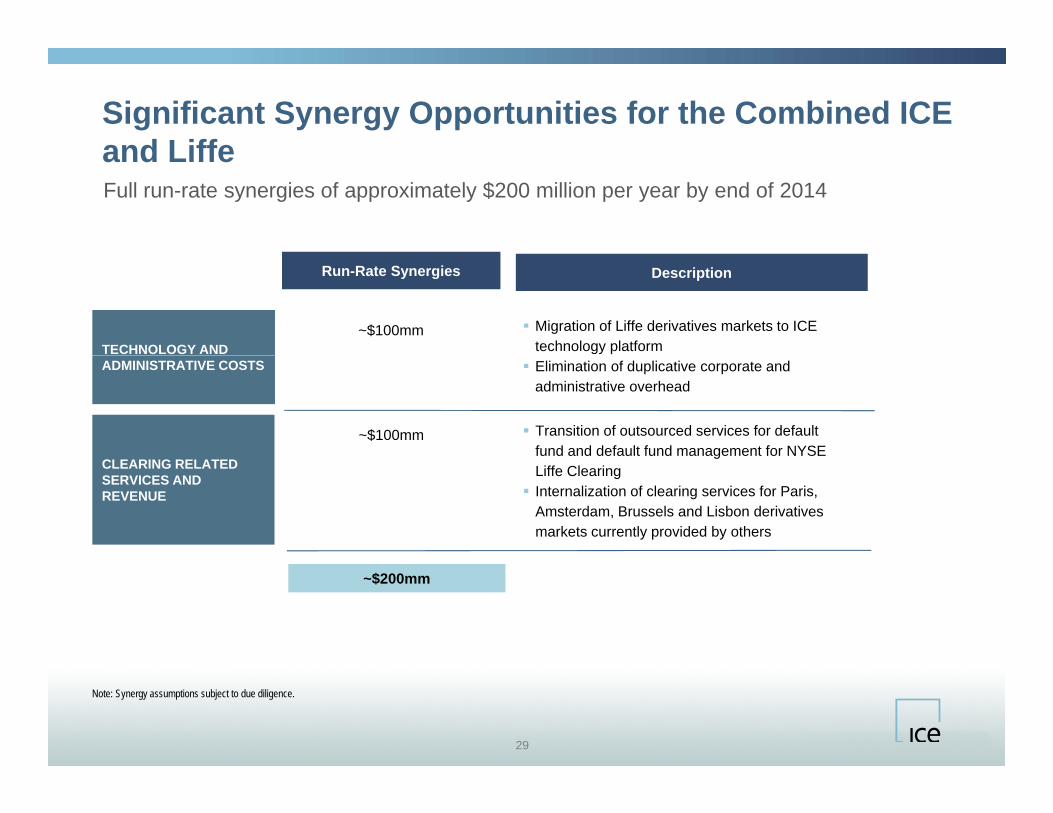
Significant Synergy Opportunities for the Combined ICE and LiffeFull run-rate synergies of approximately $200 million per year by end of 2014
and Liffe
TECHNOLOGY AND
Migration of Liffe derivatives markets to ICE technology platform
Run-Rate SynergiesRun-Rate Synergies DescriptionDescription
~$100mm
ADMINISTRATIVE COSTS Elimination of duplicative corporate and administrative overhead
Transition of outsourced services for default fund and default fund management for NYSE
~$100mm
CLEARING RELATED SERVICES AND REVENUE
gLiffe Clearing Internalization of clearing services for Paris,
Amsterdam, Brussels and Lisbon derivatives markets currently provided by others
~$200mm
29
Note: Synergy assumptions subject to due diligence.

Increased Financial StrengthCombination increases ICE’s financial scale while maintaining significant flexibility topursue other strategic opportunities and organic growth initiatives
Combined Combined with SynergiesNYSE Liffe
2010 Revenues2010 Revenues
2010 EBITDA2010 EBITDA
$1,800 mm
$1,193 mm
$1,150 mm
$783 mm (1)
~$650 mm (2)
~$410 mm (3)
$1,860 mm
$1,381 mm
12/31/10 Debt12/31/10 Debt $2,229 mm$579 mm – $2,229 mm
Source: Company filings. Note: Synergy assumptions subject to due diligence.(1) ICE EBITDA is a non GAAP number calculated by taking 2010 operating income and adding back D&A and merger related expenses which is calculated as follows: $783M EBITDA = $652 M Operating Income +
Debt / EBITDA (x)Debt / EBITDA (x) 1.9x0.7x 0.0x 1.6x
30
(1) ICE EBITDA is a non-GAAP number calculated by taking 2010 operating income and adding back D&A and merger related expenses, which is calculated as follows: $783M EBITDA = $652 M Operating Income + $121M D&A + $10M Merger Related Expenses.
(2) Includes NYSE Liffe net revenues of $583 million and NYSE Derivatives Market Data and Other Revenues of $83 million allocated between NYSE Liffe and US Options by net revenue contribution. (3) NYSE Liffe EBITDA estimated assuming an EBITDA margin of ~63%. Excludes ICE estimated portion of NYSE Euronext’s derivatives segment attributable to US Options business.

Strong Commitment to European MarketsA combined ICE and Liffe will enhance European competition and foster greaterinnovation to the benefit of the European markets
GOVERNANCE AND REGULATION
Combination of ICE and Liffe will create a new force in European derivatives and will strengthen competition in the European derivatives sector No change in regulators
EUROPEAN OPERATIONS AND BRANDING
ICE’s European derivatives business will continue to be based in London Consolidation of technology platforms will create greater market and operating efficiencies
CLEARING
Continue to use ICE’s existing clearinghouse in London Post-trade and clearing technology already shared by ICE and Liffe Clearing European derivatives will continue to be cleared in London
INNOVATION
Proven track record of bringing innovation and investment to European markets Transformed ICE Futures Europe through introduction of electronic trading ICE Clear Europe was first derivatives clearinghouse to be established in London for over 100 years
31
Led clearing of credit default swaps in Europe

Proven Track Record of Successful Acquisitions
History of realizing synergies on or ahead of schedule
Demonstrated ability to efficiently and effectively integrate acquisitions
2008/2009: Acquisition of the Clearing Corp and launched CDS clearing in U.S. & Europe
Acquisition of NYSE Liffe
e ect e y teg ate acqu s t o s
Proven record of driving further growth and generating premium value for all stockholders
Disciplined approach to acquisitions
2007: Acquisition &
2008: Acquisition of Creditex
Superior solution for European derivatives market
2010
2008
2009
2001: Acquisition of International Petroleum Exchange ICE’s business expands
globally into futures with acquisition of London-based
2007: Acquisition & Electronification of NYBOT
20042005
2006
2003
2007q
IPE
2008: Acquisition of Yellow Jacket
2010: Acquisition of Climate Exchange
2003 2004 2005 2006 2007 2008 2009 2010 PF 2010E (1)
2005: ICE IPO 2007: Acquisition of Winnepeg
Revenue: $94 $108 $156 $314 $574 $813 $995 $1 150 $1 860
32
Revenue: $94 $108 $156 $314 $574 $813 $995 $1,150 $1,860Source: Company filings.Note: Synergy assumptions subject to due diligence.(1) Pro Forma for acquisition of NYSE and run-rate synergies.
Summary
33

G t b fit t ll t k h ld d i t l b l k t t tCompelling & Superior Proposal - $42.50 Per Share Greater benefits to all stakeholders and more responsive to global market structureevolution
NYSE EURONEXT STOCKHOLDERS NASDAQ OMX AND ICE STOCKHOLDERS
$42.50 per share offer represents greater value for NYX stockholders – 19% premium to Deutsche Börse offer (1)
Opportunity to participate in value creation through $740mm in combined synergies 2 and enhanced growth prospects
Creates more diversified and efficient platforms in core markets Significant value creation for both stockholder bases
from revenue and expense synergies Meaningful earnings accretion
Greater immediate value through cash component and longer term through NASDAQ OMX and ICE stock
Meaningful earnings accretion
INVESTORS ISSUERS AND OTHER MARKET PARTICIPANTS
Strengthens European equity markets by creating a new, truly pan-European equity trading platform
Europe
INVESTORS, ISSUERS AND OTHER MARKET PARTICIPANTS
US Creates deeper liquidity pools, better price discovery for
investors and greater market efficiencies in US cash iti d it ti Creates major new force in European derivatives which will
significantly enhance competition Invigorates market and technology innovation throughout
equities and derivatives markets Secures Paris and London as premier International financial
equities and equity options Provides greater flexibility to invest in ongoing innovation
and platform enhancements with increased scale Solidifies US leadership in global capital markets Enhances customer benefits by providing consolidated view
34
phubs
Note: Synergy assumptions subject to due diligence.(1) Based on Deutsche Börse closing price of €53.55 and $ / € exchange rate of 1.42 as of March 31, 2011. (2) Reflects combined NASDAQ OMX and ICE synergies
y p gof fragmented marketplace
Top Related