


Languages
Pages
Legal


A study on the EU oil shale industry – viewed in the light of the Estonian experience
A report by EASAC to the Committee on Industry, Research and Energy of the European Parliament
May 2007

EASAC
EASAC – the European Academies Science Advisory Council – is formed by the national science academies
of the EU Member States to enable them to collaborate with each other in providing advice to European
policy-makers. It thus provides a means for the collective voice of European science to be heard.
Its mission reflects the view of academies that science is central to many aspects of modern life and that
an appreciation of the scientific dimension is a pre-requisite to wise policy-making. This view already
underpins the work of many academies at national level. With the growing importance of the European
Union as an arena for policy, academies recognise that the scope of their advisory functions needs to
extend beyond the national to cover also the European level. Here it is often the case that a trans-
European grouping can be more effective than a body from a single country. The academies of Europe
have therefore formed EASAC so that they can speak with a common voice with the goal of building
science into policy at EU level.
Through EASAC, the academies work together to provide independent, expert, evidence-based advice
about the scientific aspects of public policy to those who make or influence policy within the European
institutions. Drawing on the memberships and networks of the academies, EASAC accesses the best of
European science in carrying out its work. Its views are vigorously independent of commercial or political
bias, and it is open and transparent in its processes. EASAC aims to deliver advice that is comprehensible,
relevant and timely.
EASAC covers all scientific and technical disciplines, and its experts are drawn from all the countries of the
European Union. It is funded by the member academies and by contracts with interested bodies. The
expert members of project groups give their time free of charge. EASAC has no commercial or business
sponsors.
EASAC's activities include substantive studies of the scientific aspects of policy issues, reviews and advice
about policy documents, workshops aimed at identifying current scientific thinking about major policy
issues or at briefing policy-makers, and short, timely statements on topical subjects.
The EASAC Council has 24 individual members – highly experienced scientists nominated one each by the
national science academies of every EU Member State that has one, the Academia Europaea and ALLEA. It
is supported by a professional secretariat based at the Royal Society in London. The Council agrees the
initiation of projects, appoints members of project groups, reviews drafts and approves reports for
publication.
To find out more about EASAC, visit the website – www.easac.eu - or contact Fiona Steiger, EASAC
Secretariat [e-mail: [email protected]; tel +44 (0)20 7451 2697].

A study on the EU oil shale industry – viewed in the light of the Estonian experience
A report by EASAC to the Committee on Industry, Research and Energy of the European Parliament March 2007

ii
'An early settler in the Valley of Parachute Creek in Western Colorado built a log cabin, and made the
fireplace and chimney out of the easily cut, locally abundant black rock. The pioneer invited a few
neighbours to a house warming. As the celebration began, he lit a fire. The fireplace, chimney, and
ultimately the whole cabin caught fire, and burned to the ground. The rock was oil shale. It was a
sensational house warming!' (Youngquist, 1998)
With these words Walter Youngquist starts his essay titled 'Shale oil - the elusive energy'. The opening
paragraph was meant to show that oil shales can have unanticipated potentials. However, throughout
Youngquist's study it becomes clear that oil shales are by no means an easy source of energy. If they had
been so, they would have been exploited on a wide scale already.
The sceptical title used by Youngquist refers to the various efforts that have been undertaken and the
huge amounts of money that have been spent to unlock the energy buried in oil shales. It serves as a
warning that oil shales do not readily surrender their riches.
Note:
When reading this report, it is vital that the reader distinguishes between oil shale (OS) and
shale oil (SO). A full definition of the two substances is found in Annex B. Oil shale is
sedimentary rock containing up to 50% organic matter. Once extracted from the ground, the
rock can either be used directly as a power plant resource, or be processed to produce shale oil
and other chemicals and materials.
.

iii
Summary
Oil shale is sedimentary rock containing up to 50% organic matter. Once extracted from the ground, the
rock can either be used directly as fuel for a power plant, or be processed to produce shale oil and other
chemicals and materials. It is widely distributed around the world – some 600 deposits are known, with
resources of the associated shale oil totalling almost 500 billion tonnes, or approximately 3.2 trillion
barrels. Yet, with a few exceptions, these deposits are little exploited – competition from gas and liquid
oil, environmental considerations and other factors make exploitation of oil shales relatively unattractive.
Oil shales of different deposits differ by, for example, genesis, composition, calorific value and oil yield.
There is currently no comprehensive overview of oil shale resources and their distribution around the
world, so it is not possible to reach detailed conclusions that apply to oil shales as a whole. For example,
while the organic matter content of oil shales can be as high as 50% in some very high grade deposits
such as the Estonian Kukersites, in most cases it varies between 5 and 25%. Because of that the heating
value of oil shale is highly variable, but in most cases is substantially less than 3000 kcal/kg. Compared to
other traditional solid fuels, the heating value of oil shale is limited. In the best cases, it is comparable to
that of brown coal or average forest residues, but less than half of that of average bituminous coal.
Within the EU, oil shales are found in 14 Member States. While some areas of the EU – eg France and
Scotland – have had long experience of exploiting oil shales at earlier periods of their history, currently
only Estonia is actively engaged in exploitation on a significant scale. The Estonian oil shale deposit
accounts for just 17% of all deposits in the EU, but Estonia generates over 90% of its power from oil
shale, and the oil shale energy sector accounts for 4% of Estonian GDP. At a time of increasing concern
with energy policy in general, and self-sufficiency and security of supply in particular, policy-makers must
consider all possible sources of energy. It was against that background that the Industry, Technology,
Research and Energy Committee of the European Parliament commissioned EASAC to prepare this brief
report.
Our report begins with an analysis of known oil shale reserves and resources (deposits that are thought to
be recoverable but are not yet commercially viable) and a summary of the technical issues affecting the
mining and processing of shales. The latter include the relative merits of open-pit and underground
mining and the environmental challenges associated with each, the various approaches to processing
shales to extract oil and other chemicals, and current experiments to extract oil and chemicals by
processing shales in-situ, without bringing them to the surface first. Results so far on the latter are
promising, but have yet to be extended to a commercial scale. The major issues are to reduce costs and to
minimise environmental impacts. The report surveys current and potential developments in various parts
of the world, especially the USA and Estonia.
We identify a series of broad policy issues. The first of these is economic – interplay between world prices
for 'ordinary' oil and for shale oil in the event of a major expansion of shale oil production; foreseeable
reductions in the costs of extraction and processing due to technological improvements; impacts on
employment (the shale oil industry accounts for about 1% of national employment in Estonia). One
important conclusion is that the price competitiveness of electricity produced from shale oil, and also by
direct combustion of oil shale, is very sensitive to the price attributed to CO2 emissions.
The environmental policy issues are complex and significant. First, all mining has strong environmental and
land use consequences. Mining and processing of oil shales has particularly challenging consequences
because the waste material after processing occupies a greater volume than the material extracted and
therefore cannot be wholly disposed underground. Production of a barrel of shale oil can generate up to
1.5 tons of spent shale, which may occupy up to 25% greater volume than the original shale. Where this

iv
cannot be used in, for example, the construction industry, the extra volume at least has to be disposed
above ground. Second, the use of oil shale for electricity generation is currently estimated to produce a
higher level of harmful atmospheric emissions than coal, but the introduction of planned new production
methods is expected to reduce this to about the same level as coal or biomass. A third environmental
issue is to prevent noxious materials leaching from spent shale into the water supply. This applies equally
to coal, but is a bigger problem with shale (eg per unit electricity generated) because of the greater
volume of waste associated with shale.
Whether oil shales constitute a strategically significant resource depends on a number of criteria: (i)
whether they are to be used as a source of oil and other raw materials or directly as fuel for a power
station; (ii) the basic cost of extraction and processing; (iii) environmental costs – safeguarding the
environment (water, air, ecosystems) during extraction and processing, land reclamation after use,
disposal of residual waste, opportunity costs, taxes intended to reflect environmental issues; (iv) the
premium a country may be willing to pay to ensure a sufficiency of energy and materials; and (v) the
premium a country may be willing to pay to secure independence from external sources. Some of these
criteria are essentially political or social judgements, and as such outside our competence as scientific
academies. All of them also have a comparative quality – whether oil shales have advantages over other
routes to the same goal.
Some of these criteria can be better understood in the light of further research. Our report therefore
highlights the strong need for research in a number of relevant areas, including:
• the response of local flora and fauna to ecosystem loss or damage;
• research including mathematical modelling, laboratory tests, and field monitoring on the nature and
long-term environmental fate of leachate from spent shale and the impacts on water quality of in-situ
and surface retorting;
• land use and reclamation.
Such research should be funded from a number of sources, including the 7th Framework Programme.
The strategic significance of the EU's oil shale deposits, then, is not susceptible to a simple yes/no. This is
partly because the issue has so many dimensions, often involving political and social judgements as well as
scientific evidence and analysis. It is also because, within the EU, the only well studied oil shale deposits
are in Estonia, and they account for just 17% of total EU shale oil resources. Oil shales of different
deposits in the EU differ in the composition and properties of organic and mineral parts. For this reason,
the model of Estonian oil shale utilization, in spite of the power of analogy, is not likely to be directly
applicable to all EU shales. What we can conclude, in the light of the scientific and economic evidence we
have presented and the remaining uncertainties we have highlighted, is that oil shales are a potentially
useful source of energy, of oil and of other important chemicals, and that the EU should support efforts to
overcome the hurdles that currently inhibit fuller exploitation of this potential.

v
Contents
Page
Summary iii
1 Oil shale resources 1
1.1 Introduction 1
1.2 Reserves 1
1.3 Resources 2
1.4 Strategic significance 2
1.5 Global and European resources 3
2 The technology of processing oil shale 6
2.1 Introduction 6
2.2 Mining 6
2.3 Thermal processing of oil shale 7
2.4 Oil shale retorting techniques 8
2.5 Future trends 10
3 The past and future development of oil shales 12
3.1 Introduction 12
3.2 USA 12
3.3 Estonia 14
3.4 Scotland 15
3.5 Rest of the world 17
4 Policy issues 18
4.1 Economic issues 18
4.2 Environmental issues 23
4.3 Research and innovation issues 30
5 Conclusion 32
Annexes
A Working group 34
B Definitions 35
C Classification of oil shales 38
D Quality of oil shales 40
E Estonian oil shale 43
F Technological issues related to the processing of oil shale 47
G The Scottish oil shale industry: reclamation issues 51
H Bibliography 54
Figures
1 Global shale oil resources
2 European shale oil resources
3 Production of oil shale in million tonnes from selected oil shale deposits, 1880 – 2000
4 Overview of the processes involved in OS exploitation and of the main products and residues
5a Economic evaluation for existing installations and legend
5b Economic evaluation for new installations (3% net discount rate).
5c Economic evaluation for new installations (8% net discount rate).

vi
6a Contributions of coal and oil shale electricity production systems to climate change
6b Contributions of different electricity production systems to climate change
7 General scheme for hydrocarbon generation of a typical source rock
8 Hutton classification schema for oil shales
9 Calorific value of selected oil shales compared with the range in calorific values of lignite, sub-
bituminous and bituminous hard coal
10 Grade of the global oil shale deposits
11 Estonian oil shale reserves by fields
12 Principle flow sheet of the Kiviter process
13 Principle flow sheet of the Galoter process
14 The Central Scotland (West Lothian) oil shale field
15 Greendykes and Five Sisters, two of the remaining bings in West Lothian
16 Calcareous grassland on the summit of Greendykes and some examples of rare flora, fauna and
habitats recorded on the bings
Tables
1 The development of thermal processing of oil shale in Estonia
2 Overview of the world’s commercial oil shale retorting technologies
3 Advances in oil shale retorting technology
4 Carbon dioxide emissions
5 Characteristics of Estonian oil shale
6 Development of power and heat production from oil shale in Estonia
7 Emissions from oil shale fired power plants

1
1 Oil shale resources
1.1 Introduction
Oil shale (OS) is a sedimentary rock containing organic matter rich in hydrogen, known as kerogen. Oil
shales of different deposits differ by, for example, genesis, composition, calorific value and oil yield. There
is currently no comprehensive overview of oil shale resources and their distribution around the world. Few
overarching geological studies have been performed, and there are difficulties with the classification of
solid combustible resources. According to the data of the 27th International Geological Congress, the
world oil shale resources in 1984 were approximately 11.5 trillion tonnes.
Oil shales are widely distributed around the world – more than 600 deposits are known, with resources of
the associated shale oil totalling almost 500 billion tonnes, or approximately 3.2 trillion barrels. Oil shale
also contains a material rich in mineral matter: both marine and terrestrial oil shales have been found.
The oil shale industry started in Scotland where, in 1694, oil was produced by heating Shropshire oil shale.
The direct combustion of oil shale to produce hot water, steam, and, finally, electricity has developed in
accordance with the general trends in solid fuel combustion technology. At the beginning of the 19th
century, industrialized countries became more interested in obtaining oil and gas from coal pyrolysis (the
decomposition or transformation of the kerogen organic matter into hydrocarbons by heat).
Oil shale pyrolysis was developed in France, where in 1832, a method for producing lighting oil was
realised. However, the plants were later closed because of the rapid development of the crude oil
industry. Data from 1860 indicate that oil shale from the Volga basin in Russia was industrially mined and
used as fuel. During the 19th century oil shale thermal processing factories also operated in Australia, the
United States, Brazil, Germany, and Scotland. During the 20th century oil shale processing factories were
built in several countries, including China and Israel. However, later most of them were closed. In Estonia
and Germany oil shale has been used also in cement production both as a fuel and as a constituent of the
clinkers.
Today, considerable quantities of oil shale are mined in Estonia, Russia, China, Brazil, Australia, and
Germany. Estonia's oil shale industry is currently the most developed in the world.
Oil shale can be used for several purposes: to obtain heat by direct combustion (for example, in the
generation of electricity); to produce shale oil (SO); and as a source of other valuable chemicals. For
example, from 1 tonne of Estonian oil shale it is possible to produce 850kWh of electricity or 125kg of
shale oil (39 800 kJ/kg) and 35 m³ of retort gas (46 800kJ/m³) (Veiderma, pers.comm.). The efficiency of
new FBC (fluidised bed combustion) boilers is on the same level as has been reached in the best
condensation atmospheric pressure power plants based on the combustion of coal – 35-36% (net).
Annex B gives an explanation of the composition of the different fossil fuels, Annex C explains how the
different oil shales are classified and Annex D discusses how the quality of oil shales is measured.
1.2 Reserves
Only those oil shale deposits that either are being economically exploited, or are being developed for
economic exploitation, are included here as reserves. The stringent economic criterion is based on the
definition of reserves used by the Society of Petroleum Engineers (SPE): 'Reserves are those quantities of

2
petroleum [or another commodity such as SO] anticipated to be commercially recoverable from known
accumulations from a given date forward under defined conditions. Reserves must satisfy four criteria:
they must be discovered, recoverable, commercial, and remaining based on the development project(s)
applied. Reserves are further subdivided in accordance with the level of certainty associated with the
estimates and their development and production status.'
1.3 Resources
The SPE defines contingent resources as 'those quantities of petroleum [or another commodity such as
SO] estimated, as of a given date, to be potentially recoverable from known accumulations, but which are
not currently considered commercially recoverable. Contingent resources may include, for example,
projects for which there are no current viable markets, or where commercial recovery is dependent on
technology under development, or where evaluation of the accumulation is still at an early stage.
Contingent resources are further subdivided in accordance with the level of certainty associated with the
estimates and may be sub-classified by the status of the applied development project(s).'
Contingent resources are differentiated from unrecoverable resources by the fact that the latter are
'estimated, as of a given date, not to be recoverable from naturally occurring accumulations. A portion of
these remaining in-place quantities may become recoverable in the future as commercial circumstances
change and/or technological advances are made'.
In line with these definitions, the amounts of shale oil contained in all the explored oil shale deposits that
are not reserves, are here classified as resources. Part of these resources may never be exploitable,
however, owing to geological, technical or economical circumstances.
1.4 Strategic significance
The available resource estimates, both for the EU and on a worldwide basis, are incomplete and differ in
methodology. This makes direct comparison between estimates difficult. A more systematic assessment
taking into account the specific properties and the potential by-products of the different OS deposits, as
well as an assessment of the potential use and exploitation technique(s), is needed in order reliably to
assess the economic and strategic significance of OS in the EU.
Oil shales are a very diverse group of organic-rich deposits (see Annex C). Therefore the best use will differ
from deposit to deposit. Depending on the composition of the kerogen and the presence of other
valuable resources, different types of fuels and by-products can be produced from them. Therefore, it is
impossible to come up with a unifying methodology to assess the overall economic and strategic potential
of oil shales (either as a source of energy products or for the production of other resources). A thorough
assessment should start with a detailed examination of the geology, composition and potential of the
individual deposits.
Based on the amount of explored resources both in EU and worldwide, total OS resources are thought to
be considerable. However, most of the deposits are of low to moderate grade. To unlock these resources
in an economic and environmentally sound way, new extraction technologies are needed. This requires
research (both basic to understand the impact of the kerogen and rock properties on the production of
SO, and field-test). Local development of high grade deposits is already economically possible. The
exploitations often have a large impact on the environment. New extraction technologies may help to
reduce this impact.

3
Shale oil is now widely used in Estonia as a fuel for boiler houses. In 2004, c.330 Kt of shale oil was
produced in Estonia. About 50% of this production of shale oil is exported. With the rise of oil prices in
the world market the shale oil selling price has increased (300 Euro/t in November 2006) and much
exceeds its production cost (Veiderma, pers.comm.). The production of shale oil has become profitable.
1.5 Global and European resources
SO resources for selected deposits are listed in Figures 1 and 2. The main sources for this inventory are the
study on the geology and resources of some world oil-shale deposits published last year by the US
Geological Survey (Dyni, 2006), the inventory by the World Energy Council (2001), and the resource
assessment by Duncan and Swanson (1966).
The reserve and resource figures are reported as US barrels, or as tonnes, of SO in place. If available, the
average oil yield and the calorific value of the deposits are listed. SO yields are reported in litres per tonne
of OS. Calorific values are given in kcal/kg. The reliability of the data ranges from excellent to poor,
depending on the vigour by which the deposits have been explored.
The total SO resource shown in Figure 1 amounts to 3.2 trillion US barrels. This figure should be seen as a
minimum because numerous potential oil shale deposits have not yet been explored and were not
included in the inventory. Moreover, many oil shale deposits may still be discovered. Starting from the
organic-rich shales in the Earth's crust, Duncan and Swandon (1966) estimated the discovered and
undiscovered SO resources in high grade deposits as 17 trillion barrels (at yields of 25 to 100
gallons/tonne) and in low to moderate grade oil shales as 325 trillion barrels (at yields of 10 to 25
gallons/tonne).
The distribution of the resources within the selected oil shale deposits grouped per continent is shown in
Figure 1. Two-thirds of the listed resources are located in North America. By far the largest single oil shale
deposit is the Green River Formation in Colorado, Utah and Wyoming. This deposit contains an estimated
SO resource of up to 1.47 trillion US barrels (Dyni, 2006). Europe and Australia both account for
approximately 12% of the inventoried resources.
Figure 1 Global shale oil resources (million US barrels)
Source: US Geological Survey (Dyni, 2006), World Energy Council (2001), Duncan and Swanson (1966).
3,170,000
159,00084,000
372,000 372,000
2,100,000
83,000
0
500,000
1,000,000
1,500,000
2,000,000
2,500,000
3,000,000
3,500,000
Global Africa Asia Australia Europe North America South America
Shal
e oil
reso
urc
es (m
illio
n U
.S. b
arre
ls)

4
About two-thirds of the listed European resources are located in Russia (Figure 2). Most of the remaining
resources are located in Italy (20%) and Estonia (5%).
Figure 2 European shale oil resources (million US barrels)
Source: US Geological Survey (Dyni, 2006), World Energy Council (2001), Duncan and Swanson (1966).
The Sicilian Tripoli Formation contains by far the largest SO resource within the EU. The SO resources
within these shales and marls are estimated at 63 billion barrels. The Tripoli Formation is part of the
evaporite sequence that was deposited during the Messinian Mediterranean Salinity Crisis. The thickness
of the oil shale beds varies from almost nothing to 100 m. The oil yields in the non-weathered marls and
shales vary between a low 20 l/t and 125 l/t (Dyni, 1988). The only known SO production came from a
small mine near Serradifalco. The mine was operated for 2 years by German forces during the Second
World War. Other large OS deposits within the EU are the oil shale and Dyctionema shale in Estonia, the
Swedish Alum Shale and marine Jurassic shales and claystones that are widespread in the western and
central European sedimentary basins.
According to the definitions in Annex B, less than 0.25% of the OS resources tabulated in Figure 1 can be
categorised as reserves. Within the EU, the only true OS reserves are located in Estonia. Under the
conditions mentioned above, the Estonia OS reserves are estimated at 1.5 billion tonnes, about 30% of
total Estonian resources (Veiderma, 2003).
Other countries where OS are utilised on an industrial scale include China (production of SO and
electricity; Moaming and Fushun deposits) and Brazil (production of SO; Irati Formation). Russia also
reports the utilisation of OS (WEC, 2001). Most of the production in Russia is concentrated in the St.
Petersburg region, where a lateral continuation of the Estonia deposits is being mined. The annual output
of oil shale is estimated at 2 Mt, most of which was until recently exported to the power station in Narva,
Estonia. A further small processing plant with an annual throughput of less than 50 Kt of shale is still in
operation near Syzran, Russia (WEC, 2001).
247883
73000
18686
7000 6988 6114 4193 3500 2000 675 690 305 280 125 56 48 8 60
50000
100000
150000
200000
250000
300000
Russia Ita
ly
Estonia
Franc
e
Belaru
s
Sweden
Ukrain
e
United
King
dom
Ger
man
y
Luxe
mbo
urg
Yugos
lavia
Armen
ia
Spain
Bulgar
ia
Hunga
ry
Polan
d
Austri
a
Czech
oslov
akia
Sh
ale
oil
reso
urc
es (
mill
ion
U.S
. bar
rels
)

5
In addition to these active OS operations, Southern Pacific Petroleum and Suncor Energy Inc. performed
tests to develop a commercial SO plant 10 km north of Gladstone in Queensland (Australia). The oil shales
would be mined from the Stuart deposit by open pit, and the shale oil would be extracted by the Alberta-
Taciuk Processor retort technology. In 2003 - 2004, production tests were run, which resulted in a
production of 702,000 barrels of SO with a peak production of 3,700 barrels per day (Johnson et al,
2004b). The operation was shut down in July 2004. After an evaluation period, in December 2004,
Queensland Energy Resources advised Australian officials that it wished to discontinue the environmental
impact statement process for the proposed Stage 2 development because it was not economically viable.
The plant had three phases, with the first stage at 4000 barrels/day (b/d) and the third stage at 200 000
b/d (reduced at 65 000 b/d). The plant was unable to reach the 4000 b/d level. Suncor left in 2000
(claiming that they have better areas to invest, but admitting in 2005 that it was not commercially viable),
writing off the plant investment. Although it is possible that this project could be resurrected, it is now
suspended. (Johnson et al, 2004b; Snyder, 2004)
Dyni (2002) compiled a figure showing the oil shale production from several countries over the past
120 years (Figure 3, overleaf). World production peaked in 1980 when 47 Mt of OS were mined. During
the last decades, more than 70% of the global OS production took place in Estonia. Besides, significant
amounts of OS were produced in China (Moaming and Fushun deposits) and Brazil (Irati oil shale).
Figure 3 Production of oil shale in million metric tons from selected oil shale deposits from 1880
to 2000 (Dyni, 2003)

6
2 The technology of processing oil shale
2.1 Introduction
Oil shale can be exploited either by surface processing techniques or by in-situ technologies (Figure 4).
Surface processing basically includes three steps: (1) mining of the oil shale and ore preparation, (2)
thermal processing or retorting, and (3) processing of the shale oil to obtain a refinery feedstock and
value-added by-products. Mining of the OS also results in important investments in waste disposal and
site reclamation. By in-situ techniques, the OS is not, or only partly, mined and the pyrolysis is conducted
underground. The pyrolysis products are pumped to the surface and upgraded into fuel chemical by-
products. Depending on the underground heating process and the type of kerogen, the obtained oil has
to be stabilised and upgraded before further refinement or can be directly used as a refinery feedstock.
Figure 4 Overview of the processes involved in OS exploitation and of the main products and
residues
Source: after Johnson et al, 2004b & Bartis et al, 2005
2.2 Mining
At present, oil shales are extracted by one of two methods: open-pit mining or underground mining. In
both cases, the OS is excavated and transported to a processing plant where it is crushed, sometimes
upgraded and then heated to produce SO or put into ovens for heat or power generation.

7
Both extraction methods have a large impact on the environment and use large amounts of water (both
for the operations and as groundwater has to be pumped off to prevent flooding of the mines).
Moreover, underground mining is not very efficient, as approximately one-third of the resources are left
behind in pillars and/or unmined areas. In case of deep, thick, homogeneous sequences of OS, the
recovery factor will be even lower. For example, Miller (1987) estimated the recovery of room-and-pillar
mining of the Green River OS in the central Piceance Basin at less than 20%. For surface mining, recovery
can be close to 100%, but the applicability of the technique strongly depends on land use restrictions as
well as on the thickness of the overburden and thickness and quality of the underlying OS. In case of the
Estonia deposits, the commercial depth for open-pit mining lies at around 30 m with a ratio of
overburden over OS ore of 10:1. In case of the Green River OS, a favourable stripping ratio would be 1:2
(Bartis et al, 2005).
Efforts have been made to extract SO using in-situ techniques. Occidental Petroleum developed an
underground extraction method that involved excavating small rooms to provide space for SO rubble
formed by blasting. The rubble was set alight, causing the temperature to rise above 500°C and the
cracking of the kerogen. The hydrocarbons thus produced were drained from the rubble pile into a sump
(Murray, 1974). Although large-scale in-situ extraction proved not to be economic, small amounts of oil
and gas have been produced from OS worldwide, usually as a side-activity in coal production.
In the past few years, Shell began experimental field-work to test and develop a new method of in-situ
cracking called In-situ Conversion Process (ICP). The goal of the Mahogany Research Project is to heat the
OS deep underground, releasing the oil and natural gas from the kerogen matrix. The free hydrocarbons
are then pumped to the surface and refined into fuel. Although huge amounts of energy are needed to
heat the shales and to freeze the boundary to prevent the migration of the liberated hydrocarbons outside
the production field and avoid water entering the production zone so reducing the efficiency of the
process, Shell claims that over the lifecycle of a production field approximately three units of energy can
be produced for each unit of energy used. If the tests prove to be successful, this type of in-situ cracking
could have significant advantages over traditional mining methods both in terms of environmental impact
and in the amount of oil that can be extracted from the deposits. It remains to be proven, however, that
the technology can be scaled up to a commercial production.
More information about Shell’s ICP is in Annex F.
2.3 Thermal processing of oil shale
Compared with coal, the oil shale kerogen contains more hydrogen and can, therefore, be subjected to
thermal conversion into oil and gas. The yield then depends mainly on the hydrogen content in the
convertible solid fuel. From the standpoint of shale oil as a substitute for petroleum products, its
composition is of great importance. Oils of paraffin types are similar to paraffin petroleum. However, the
composition of the kukersite shale oil of Estonia is more complicated and very specific – it contains
abundant oxygen compounds, particularly phenols, that can be extracted from oil. The oil cannot serve
directly as raw oil for high-quality engine fuel, but is well used as heating fuel. It has some specific
properties as lower viscosity and pour point, and relatively low sulphur content, making it suitable for
other uses such as marine fuel.
The thermal processing of oil shale to oil has quite a long history and various facilities and technologies
have been used. In principle, there are two ways of the thermal processing:
• low-temperature processing by heating the oil shale up to about 500°c – semi-coking or retorting;
• high-temperature processing by heating up to 1000°c -1200°c – coking.

8
The coking of oil shale for production of town gas was used in Estonia in 1950-1960s. Nowadays only the
low-temperature processing is used in the oil shale industry.
In-situ retorting is the technology for processing oil shale in-situ underground. This process obviates the
problems of mining, handling, and disposing of large quantities of material, which occurs for above-
ground retorting. In-situ retorting offers the potential of recovering deeply deposited oil shale. Laboratory
and field experiments of in-situ recovery of Green River shale oil in the US were conducted by industry
especially during the 1970s and 1980s, a period of intense oil shale activity in western Colorado. Currently
the Shell Company has again developed in-situ oil shale processing pilot tests in Colorado.
Attempts at in-situ gasification of oil shale in Estonia in the 1950s were not successful. The development
of oil shale thermal processing in Estonia is presented in Table 1.
Table 1 The development of thermal processing of oil shale in Estonia
Low-temperature (500–550 ºC) thermal processing
The use of lumpy oil shale (25–125mm)
1924 to date Internally heated vertical retorts,
(Pintsch retorts →Kiviter process)
10t → 40t →100t →200t →1000t (→ 1500t,
designed) oil shale per day
1928–1960s Tunnel ovens (horizontal, internally heated)
400t oil shale per day
1931–1961 The Davidson rotary retorts (horizontal, externally
heated)
25t oil shale per day
The use of fine-grained oil shale (<25mm)
1980 to date Galoter process with solid heat carrier
3000t oil shale per day
High-temperature (> 700 ºC) thermal processing of lumpy oil shale (25–125mm)
1948–1970 Chamber ovens for gasification of oil shale 400
million m3 gas per year
Source: Veiderma, M. 2003. Estonian oil shale – resources and usage. Oil Shale 20(3), 295-303 (page
299)
2.4 Oil shale retorting technologies
There are two main industrial retort technologies for oil shale processing – using retort gas as a gaseous
heat carrier or semicoke as a solid heat carrier. Both are used in Estonia. The first one is represented in
Estonia by the Kiviter Process and also is used China, Russia and Brazil; the second is represented by the
Galoter Process. The ATP process, used for example in Canada and Queensland, belongs to the solid heat
carrier category.
Details of the Kiviter, Galoter and other retort processes are given in Annex F.
The Kiviter process is suitable for retorting of high-calorific oil shale (over 15% of Fischer assay oil).
Besides Estonia, substantial experience in developing and operating vertical retorts for processing oil shale

9
has been also gained in Russia, China, Brazil. The equipment of the Kiviter process is notable by
compactness, but the process is connected with the formation of harmful residue-semicoke. The Galoter
process is suitable for more fine-grained shales, and uses a horizontal rather than a vertical retort.
The Galoter process has substantial advantages in comparison with the Kiviter process.
• the use of fine-grained (size up to 25mm) and lower quality (calorific value 9.0 MJ/kg) oil shale which
simplifies the mining and fuel preparation processes;
• It has a higher production efficiency (85-90%) and generates gas of higher calorific value;
• the solid residual (ash) is less environmentally hazardous.
At the same time, the Galoter process is associated with more complicated multistage technological
scheme and apparatuses. The ATP process, used successfully for processing of oil sands in Canada, is of
interest also for the retorting of Estonian oil shale and should be studied more thoroughly.
The connection of oil shale retorting by the Galoter process with the Narva power plant in Estonia has the
important advantage that it enables the gas generated to be used for both heat and power production,
and the oil generated to be used for starting the boilers.
Table 2 gives an overview of the world’s commercial oil shale retorting technologies.
Table 2 Overview of the world’s commercial oil shale retorting technologies
Source: Qian, J., Wang, J. World oil shale retorting technologies. International Conference on Oil Shale:
“Recent Trends In Oil Shale”, 7 -9 November 2006, Amman,Jordan.
One of the main hindrances to oil shale becoming a widely exploited resource is the difficulty of extracting
and processing it. Consequently energy companies have been focusing on developing more efficient
retorting technologies. Table 3 below summarises recent developments in retorting technology.
Retort Chinese
retort
Kiviter Galoter Petrosix Alberta Taciuk
(ATP)
Country China Estonia Estonia Brazil Australia
Location Fushun Kohtla-Jarve,
Kivioli
Narva Sao Mateus
do Sul
Stuart
Configuration of retort Vertical Vertical Horizontal Vertical Horizontal
Heat carrier Gas Gas Ash Gas Ash
Size of oil shale, mm 10-75 10-125 0-25 6-50 0-25

10
Table 3 Advances in oil shale retorting technology
Process Type Advances Status Project
Conventional • Shale pre-heating increases gas and oil
yields; extracts intermediate products
before high temperature pyrolysis
• Combusting carbon residue on pyrolized
shale generates process heat; reduces
emissions and spent shale carbon content
• Recirculation of gases and capture of
connate water from shale minimizes
process water requirements.
• Lower heat rates reduce plasticization of
kerogen-rich shales
Demonstrated
at pilot scale in
ATP
Stuart Shale
Slower heating increases oil and hydrocarbon
gas yield and quality.
Proven at field
scale
Recovery of deeper resources enabled by
heating technology
Indicated
In-situ
Improved ability to control heat front by
controlling heaters and back pressure
Proven
Shell ICP
Supercritical extraction processes Concept
Higher heating rates Research
Shorter 'residence' durations Proven
'Scavengers' (hydrogen or hydrogen transfer/
donor agents)
Research
Solvent extraction of kerogen from ore Research
Novel processes
Thermal solution processes Research
ATP
Source: Johnson et al., 2004b
The new processes used by Shell and at the Stuart Shale plant are both proving viable at field testing level.
However, neither has yet been extended on a commercial level. As mentioned elsewhere in this study,
Shell is very optimistic about its new technique, though they are not yet in a position to decide if ICP can
be commercially applied. Their Chief Finance Officer recently said that unconventional projects have to be
viable at a crude oil price of above $30/bbl. However, the full environmental impact of ICP is still being
assessed.
New retorting methods are key to any future viability of oil shale, both in terms of lower production costs
and less environmental aggressive impact.
2.5 Future trends
An increase in use of the total energy and chemical potential of oil shales, and diminishing losses and
pollutant emissions, are crucial in achieving sustainable shale oil production. This means implementation
of the Best Available Technique (BAT) in this branch of industry. A problem of major importance is how to
make the solid residue from the process less hazardous for the environment and how to dispose of it in
accordance with regulations. For further improvement of the industry competitiveness, it is also important
to work out and to realize in production new methods of shale oil processing (extraction, hydrogenisation

11
etc) to obtain more valuable products (motor fuels, chemicals). Studies and development must be directed
to the improvement of efficiency of production and protection of the environment in all stages of oil shale
utilisation.
New technologies for reclamation and reforestation of exhausted opencast areas are progressing. The
difficulties in the mining complex are connected with losses of oil shale at mining and enrichment,
voluminous dewatering, changes in the hydrogeological conditions, and later setting of the surface above
closed mines. In this area research and new technologies could bring improvements.
Ash residues from power plants have been used for production of construction materials (cement,
concrete elements), and the limestone as a by-product of mining for obtaining gravel and road material.
The improvement of these secondary processes also should be a topic for research and development.
Any future trends in the EU will depend significantly on the research and development and the total
energy resources available worldwide and on the EU’s energy policy and politics.

12
3 The past and future development of oil shales
3.1 Introduction
Crude oil and other products have been extracted from oil shale at an industrial scale since the first
industrial plant was set up in France in 1837. An improved, large-scale industrial process was developed in
Scotland in 1850. On a global scale, oil extraction plants were built in Australia, Brazil and the United
states of America by the late 19th century, and by the early 20th century, China (Manchuria), Estonia, New
Zealand, South Africa, Spain, Sweden and Switzerland were all producing oil from shale. Most production
stopped by mid-century because of the discovery of large supplies of crude oil in the Middle East,
although Estonia and Manchuria still operate commercial oil shale extraction.
Throughout the latter part of the 20th century, attempts have been made to modernise and revive the
industry, for example with the development of in-situ extraction methods. These have, on the whole,
been too costly (in comparison to other sources of oil), technically unsuccessful, or not on a commercial
scale, and most research and development stopped in the 1980s. In the first years of the 21st century,
however, oil shale has received increasing interest, particularly in the US owing to the uncertainty of the
long-term availability of crude oil from domestic, and Middle East, suppliers. Only in Estonia has oil shale
utilisation been well developed during the last 80 years and new technologies for oil extraction and power
production continuously realised in the industry.
Although oil shale deposits are found in 14 EU Member States, only Estonia has extended and continuing
experience of working them. Both France and Scotland started significant oil shale industries in the 19th
century, but closed them down in 1957 and 1962 respectively. The main focus of this report is, therefore,
Estonia. The environmental aspects of the Scottish experience are instructive, and are detailed in Annex G.
We begin this chapter with the USA, where much the largest oil shale resources are found.
3.2 USA
3.2.1 Production to date
The United States has significant oil shale resources within the Green River Formation in the tri-state area
of Colorado, Utah and Wyoming. The oil shale fields cover 4 million hectares and contain approximately
70% of the world resource of shale oil; variously estimated as somewhere between 800 billion (Bartis et
al, 2005) and 1.47 trillion barrels (CERA, 2006) of extractable oil.
Oil shale has a long and mixed history in the US, from the hazardous experiences of the early settler
described by Youngquist, through the creation of the US Naval Oil Shale Reserve in 1909 to the present
day, but there has been no continuous large-scale oil production so far. Oil shale lands were 'claim staked'
almost immediately and the first shale oil retort kiln was established in 1917 in DeBeque, Colorado. The
first oil shale boom began with over 30,000 mining claims and lasted until 1925. A test retort at Rulison
stopped production in 1929 after extracting 3,600 barrels of shale oil, when free-flowing oil was
discovered in California, Texas and Oklahoma.
In 1944 the U.S Synthetic Fuels Act provided $18 million for experiments at Anvil Points but operations
ceased in 1956 after testing three experimental retort processes. In the 1950s the Gulf and Shell oil
companies purchased oil shale lands in the Green River Formation.

13
The next major interest in oil shales was in the early 1970s when the stability of oil prices and reserves was
in doubt. At this time Shell began research into in-situ steam injection processes to extract shale oil, a
consortium of 17 companies leased the Anvil Points facility (building and operating a 24 tonne/day pilot
plant) and Occidental Petroleum began the first of six in-situ oil shale experiments. Various planning and
investment projects continued into the late 1980s and early 1990s, but by then oil demand had fallen and
crude oil prices had collapsed. Exxon, Unocal, Shell and other companies deferred work on an economic
basis. Since 2000 interest has grown again in the oil shale lands and their potential (Laherrere, 2005).
3.2.2 The present day
In 2005 a major report on oil shale development in the United States was prepared for the National
Energy Technology Laboratory of the US Department of Energy (Bartis et al, 2005). The report 'describes
the oil shale resources; the suitability, cost and performance of available technologies; and the key energy,
environmental, land-use and socioeconomic policy issues that need to be addressed by government
decision-makers in the near future.'
The report concluded that traditional methods of mining and surface retorting (using either room-and-
pillar deep mining or open cast surface mining) would require major building and design developments to
incorporate new technologies developed since the 1980s. Full scale operations would require process
testing at large but still sub-commercial scales. Mine, retorting plant, upgrading plant, supporting utilities
and spent shale reclamation are unlikely to be profitable unless real crude oil prices reach $70-$95 per
barrel (costed in 2005 by escalating 1980s projects and design studies).
However, the 2005 report also concludes that in-situ retorting, based on successful small-scale field tests
by the Shell Oil Company, will be competitive at crude oil prices in the mid $20s per barrel. The company
is still developing the process, however, and costs could increase as more detailed designs become
available (Bartis et al, 2005).
Unconfirmed 'green' technology from American Oil Production is said to be able to recover '18,000
barrels per day per plant', extract 99% of the oil from shale where there is more than 7%, generate
cement as a by-product, and cost between $13 and $24 per barrel (Future Pundit, 2005).
Recently (14 November 2006), CERA (the Cambridge [Massachusetts, US] Energy Research Associates are
an independent advisor to international energy companies and governments) has been reported as saying
that improvements in technology would result in 3.74 trillion barrels of oil being available from oil shale
(US News, 2006). The Interior Department of the Federal Government has authorised research and
development projects in northwest Colorado for Shell Frontier Oil & Gas Co., Chevron USA and EGL
Resources. The companies must submit detailed development plans, monitor groundwater and protect air
and water quality (San Diego Union Tribune, 2006). The Colorado Bureau of Land Management has listed
12 oil shale research, development and demonstration plans by these companies (BLM Colorado, 2006).
There is no evidence that the US is looking at production of resources other than oil from their oil shale
reserves. This is unfortunate as most of the polluting by-products can be recycled economically into a wide
range of products. The incorporation of other processes could considerably reduce the cost of oil
production especially as nearly all plant will have to be designed and built from scratch.

14
3.3 Estonia
Estonia is unique in the world in that more than 80% of its mined oil shale is used for production of
electricity. Estonia has between 0.5 and 1% of the world oil shale reserves, a tiny proportion of the US
stocks, but has a history of full-scale production since 1921. The oil shale field covers roughly 3,000km2.
Peak oil shale production was in the early 1980s (30 Mt per year) but production of oil shale has been
continuously decreasing since that time (Levine, 1997). In 2005 about 14.8 Mt of oil shale was mined. The
industrial complex (mining, power and oil production) employs 7500 people – about 1% of national
employment – and accounts for 4% of Estonian GDP (Laherrere, 2005).
Estonia is a recent entrant into the European Union. As part of the unification negotiations the European
Commission agreed to give oil shale a temporary status, thus postponing implementation of some
relevant EU directives1 (Veiderma, 2003); including the reconstruction of ash handling systems and
bringing ash landfills in compliance with landfill directive until 2009, sulphur dioxide total emissions have
to be decreased to 25 Kt/year by 2012, the Large Combustion Plant directive requirements have to be
applied to power plants by 2016.
Using oil shale to produce power is long established in Estonia. However the old boilers of the power
plants based on pulverized combustion of oil shale are nearly at the end of their working life and they
need to be replaced by boilers using fluidised bed combustion. The first two energy blocks (at 215 MW)
with these kind of boilers have shown their net efficiency in production (36.6% instead of the 30%
achieved by the old boilers) and have reduced SO2 emissions nearly to zero (Kinnunen, 2003). By EU
directives all old pulverized combustion boilers have to be closed by 2015. The future tasks connected
with power generation consist of using higher efficiency boilers with supercritical parameters, making
harmless the ash handling and disposing system, and elaborating the clean CO2-free and integrated
gasification combined cycle technologies.
Power from oil shale is competitive in the Baltic power market; oil shale based power production costs are
€26.5/MWh against nuclear power in Finland at €25.9/MWh and €23.8/MWh in Lithuania. The purchase
price of wind and biopower for the grid company in Estonia is €73.7/MWh. These prices include 2006
environmental costs (Veiderma, pers.comm., see also Tenno & Laur 2003).
Large-scale investments for reconstruction of power plants and also the increase of environmental taxes
will impact on electricity prices. In 2005 oil shale based power constituted over 90% of electrical power
production in Estonia. By the power section development strategy adopted by the Estonian Parliament in
2006, it should decrease to 68% by 2015.
In Estonia the price formation of oil shale is regulated by the Estonian Environmental Charges Act. The
price of mined oil shale, used for electricity production, is regulated by the Energy Market Inspectorate,
which takes into account the costs for mining, resource and water taxes, reasonable return etc. The price
for mined oil shale used for other purposes (including shale oil) is subject to negotiations. Resource and
water taxes are enforced by the Government, periodically they are reviewed.
1 Directive 2004/74/EC of 29 April 2004 amending Directive 2003/96/EC as regards the possibility of certain Member States to apply, in respect of energy products and electricity, temporary exemptions or reductions in the levels of taxation Directive 2004/85/EC amending Directive 2003/54/EC of the European Parliament and of the Council (Electricity market) as regards the application of certain provisions to Estonia

15
In 2006 the primary energy balance of Estonia was 55% oil shale, 15% natural gas from Russia, 11%
renewables, 17% liquid fuels and 2% other internal resources. (Veiderma, pers.comm)
The energy market is generally liberalized, but the electricity market is only partly liberalized due to the
need for refurbishment of oil shale based power facilities. Transition to a fully liberalized electricity market
should be complete by 2013.
The remaining 20% of Estonian oil shale is currently processed for production of oil, gas and cement
(Veiderma, 2003). The Kiviter and Galoter retorting processes (see chapter 2) are used, and in 2004
c.330Kt of shale oil were produced, of which 50% was exported. The producers of shale oil aim to
increase the production to 1.5 Mt by 2015. The main tasks in improving retorting practice consist in
making semicoke harmless or suitable for use, increasing the value of products (motor fuels, chemicals
instead of only heating oil), and optimising ways for the use of retort gas (heating, power production, gas
for chemical synthesis). The selling price of shale oil is lower than of crude oil in European market, but in
spite of this its production is profitable. Shale oil is foremost used as a heating oil (replacing the import of
oil, also, in extreme situations, the supply of gas from Russia) and a component of special oil mixes, mainly
for shipping and the navy. Studies and developments directed for obtaining transport motor fuels (as an
alternative to imported fuel) from OS are in progress.
The economic potential for generation of non-energy products and increased oil manufacture should be
investigated in the light of new and improving technologies. In the 1990s oil-coke, phenols, resins, glues,
impregnates, tanning agents, mastic, road bitumen and other products were manufactured. The viability
of incorporating the production of these and other products, as part of the development of new oil shale
production plants, should be researched carefully.
There is some debate in Estonia about the development of industries generating non-energy products
from oil shale. And some reluctance among some sections of society towards the increased volume of
excavation/mining of oil shale in Estonia by private companies just for production of non-energy products
instead of energy. At present the draft of the OS utilization strategy 2007-2015 has been prepared with
the aim of determining the amount of mining and direction of OS use, taking into consideration all
influencing factors (economic, energy security, environmental, social). After expert opinion and discussion
at different levels in the standard democratic way (including local authorities) it will be presented to the
Parliament for approval. As said elsewhere in the report, the Estonian government has also committed to
making oil shale a less dominant part of it energy resource (Long-term Public Fuel and Energy Sector
Development Plan until 2015, 2004)
Reforestation of exhausted areas successfully developed over three or four decades has been perfected by
directed shaping of landscape in the purpose of its diversification, recreation of the natural environment,
setting up water zones and leisure areas for people. Intensive development works are underway by
drawing in foreign specialized expert organizations to ensure ash transport and disposals correspond with
the EU waste directive (for more information see paragraph 4.2.1).
3.4 Scotland
3.4.1 Production to date
The central Scotland oil shale field is only a tenth the size of the Estonian oil shale field

16
(194 km2) with 7 main oil bearing seams. Remaining resources are calculated at 1,100 million tonnes
(Cameron & McAdam, 1978). Scotland has a history of full-scale shale oil production from 1850-1962 and
was a key developer of many of the technologies still used in the above ground retorting process.
All oil shale production was from deep mined seams and was primarily processed to produce crude oils, in
the form of paraffin (which was a brand name). In 1850 full scale commercial processes to retort and
refine oil products from oil shale were developed by James 'Paraffin' Young. The oil was extracted using a
horizontal gas retort that typically held and retorted about 50kg per day. However, within two years a
vertical retort was introduced that gave increased yield and better quality oil. The two types of retort
worked in tandem for many years because the horizontal retort produced burning oil for lighting and the
crude oil did not need to be distilled before refining.
The Scottish retort was perfected by 1895 (when the Pumpherston retort was developed by engineers
from the Pumpherston Oil Company) and consisted of 'an externally heated continuous vertical retort of
cast iron and firebrick construction; it was the only type in use by 1938. No other retort was as efficient at
giving maximum yield of oil and ammonia from Scottish shale' (Kerr, 1994). A new development in which
air as well as steam was introduced into the base of the retort began to be evaluated around 1937. Oil
quantity and quality were not affected but there was a reduction in the yield of ammonia, production of
which was vital to keep down costs in the Scottish industry.
Steam, oil and gas were drawn off the retorts. Heat was recovered from the gases via exchangers heating
boiler feed water, suction being maintained by a steam driven turbine exhauster. The condensed crude oil
and ammonia liquor passed through separators into separate storage. The gases were scrubbed with
water to remove any remaining ammonia then with light shale oil to remove solvent naptha (3 gallons of
the light naptha hydrocarbons were removed per ton of shale). The stripped gas was used to supplement
gas from coal to power the retorts. By 1865 the ammonia waste was being used to produce ammonium
sulphate fertiliser that was exported around the world.
The spent shale was typically about 75% of the weight of the raw shale and was tipped onto shale bings
(spoil heaps) up to 95 metres high. This was used to produce bricks in the Scottish Oils Plant at
Pumpherston and by 1938 production reached 30 million bricks per year, many of them used to build Oil
Company housing. Young’s other major contribution was to the refining processes. Paraffin wax was
produced during distillation along with various grades of fuel: naptha (or petroleum spirit) 6%, burning oil
(kerosene) 23%, wax and lubricating oil 56%, the remaining heavy residue, sent to the coking stills, 15%.
The first practical air compression refrigerator in the world was developed in 1858 for the cooling process
that allowed the paraffin to crystallize out of the oil (these refrigeration units were made in Glasgow and
exported all over the world for ice-making). Cracking processes (heating oils under pressure) were
patented in 1865 to increase lamp oil production and developed in the 1920s to increase petrol
production (these same processes are used in the modern refining industry).
Candles were a major wax product and by 1902 Young’s Addiewell plant was producing 100 tons of
candles per week. Other uses of the wax included waterproof papers, wound dressings (like Vaseline) and
in matches. A third of Britain’s paraffin wax supply continued to come from West Lothian until the
industry closed down in1962.
Oil shale products included: lubricating oils, burning oil (for light and heat), lighthouse and long burning
oil (for railway signals), paraffin wax, fuel oil (for furnaces), gas oil (for gas manufacture and enrichment),
solvent naptha, paraffin coke (smokeless fuel), motor spirit (petrol), diesel fuel, agricultural grade
ammonium sulphate, sulphuric acid, detergent; and from the spent shale came bricks, and hard core
foundation for roads and other building construction.

17
3.4.2 Reclamation
Waste disposal and reclamation policy and regulation were almost non-existent during the lifetime of the
Scottish oil shale industry, apart from the Clean Air Act. The industrial processes to extract oil were not
pollution threats by the standards of the time, mainly because so many of the waste products were
utilised and recycled within the refining and retorting plants. The greatest 'pollutant' was the waste
material that can still be seen in the massive bings scattered across the county of West Lothian (see Annex
G).
3.5 Rest of the world
Oil shale production in the rest of the world is mostly historical, the main exceptions being Brazil and
China.
Oil shale production in China (Manchuria Fushun) was started by the Japanese in 1929. In 1961 China
was producing one third of its total oil from shale oil, but it is very difficult to find any reliable data on
production over a long period. A graph produced in 2005 suggests that China is the largest producer in
the world of shale for oil and chemicals (almost 4 million tonnes per year). In its quest to find advanced
retorting techniques, China has recently reported a joint programme with the Shell ICP in-situ project
(Laherrere, 2005).
Brazil started production in 1881 and developed the world’s largest surface oil shale pyrolysis reactor (the
Petrosix 11 m vertical shaft Gas Combustion Retort). The production of oil shale has dropped between
1999 and the present day (Dyni, 2003).
A demonstration plant in Queensland, Australia produced 703,000 barrels of oil, 62,860 barrels of light
fuel oil and 88,040 barrels of ultra-low sulphur naphtha between 2001 and 2003. It was closed down
after Greenpeace raised concerns over greenhouse emissions (Calvert, 2005).
France was the first country to start producing oil from shale but production was stopped in 1957.
Research by coring in the 1970s means that there is a good inventory of oil shale resources in France but
the conclusion was that production would not be economical at that time. Until this year a similar
message was coming from a wide range of sources. For example:
• 10th Annual oil & gas conference, Kuala Lumpur, 13th June 2005 (Caruso, 2005): ' Oil shales. A huge
in-place kerogen resource… but the technology to economically produce large quantities of synthetic
oil from them does not exist and is not likely to in the next decades.'
• Germany 2004 (Gerling, 2004): 'Oil shale has high potential but is currently absolutely out of
economic interest.'
• Youngquist (1998b) ‘Shale oil is the fuel of the future and always will be!'
The motivation to re-investigate whether shale oil can be an economically viable source of oil has
appeared again in the US and in Europe. Those who wish to make certain that this is possible need to
look at the total capability of the raw oil shale, including the utilisation of its by-products and potential as
an energy source in power generation.

18
4 Policy issues
4.1 Economic issues
4.1.1 Impact on world oil prices
Although the resources of oil shale are huge, it is currently unclear what proportion can be recovered. If at
a certain point in the future shale oil can be produced efficiently and at a high enough rate, the extra
amount of oil generated could in principle help to reduce global oil prices. The impact would depend on
the reaction of the conventional oil producers to the increase in supply, on the demand and on the actual
oil price. In an evaluation of the strategic significance of shale oil for the US, Bartis et al (2005) estimate
that an oil shale production of 3 million barrels/day could result in a 3 to 10% reduction of global oil
prices in 2030. The estimate was based on a price elasticity of demand of -0.3 to -0.6, a total
conventional oil production of 110 million barrels/day and a nominal oil price of $50 per barrel.
The question however remains whether it is realistic to assume that a production of 3 million barrels/day
could be reached by 2030. From the inventory given in chapter 1 it can be concluded that no constraints
exist on the side of the resources. Restrictions on production depend on uncertainties related with the
production technologies. Today only mining in combination with surface retorting are proven
technologies. Technically it is perfectly possible to set up a mining and surface retorting facility with a
capacity of 50 000 barrels/day (eg the Colony project, Piceance Basin, U.S., which was designed for a
production of 47 000 barrels/day but was never built). Bartis et al (2005) however assume that the
development of large-scale processing plants (at least 100 000 barrels/day) will at least take another 12
years. In their development scenario, at least 20 years will pass in order to raise production to 1 million
barrels/day, and closer to 30 years to reach 3 million barrels/day.
4.1.2 The price of shale oil
The next question is at what price shale oil can be produced. Price estimates for mining and surface
retorting can be derived from projects in the US during the 1970s & 1980s and from the Stuart project
(Gladstone, Australia). Based on the American test, Bartis et al (2005) estimate the price for 1 barrel of
low sulphur light oil from a first-of-a-kind large production plant to be at least $70 to $95. This includes
mine development, capital and operation costs. Once commercial plants are in operation and experience-
based learning takes place, costs are expected to decline to $35 – $48 per barrel after 12 years. After
production of 1000 million barrels, costs are estimated to decline further to $30 – $40 per barrel.
These figures are substantially higher than those reported for the Stuart project (Schmidt, 2003). At full
scale, the production costs for one barrel of light, sweet crude (48° API, 0.01%) is projected to be in the
range of $11.3 to $12.4, including capital costs and operation costs at a 30 years projected life-time
(Schmidt, 2003). In that case shale oil would be highly compatible with crude oil at a price of $25 per
barrel or more. However, the Stuart project has been postponed for an undefined period of time. It is
unclear whether this is due to strong lobbying of local population and environmental NGOs against the
expected environmental impact of the project, to economical reasons or both.
The price evaluations indicate that under current conditions, shale oil is not competitive with crude oil.
However, if the efficiency of surface retorting can be increased or if up-scaling of in-situ processing turns
out to be possible, shale oil production can become a profitable business at oil prices well below the
current levels assured by the Estonian practice. This is the main cause of the present revival of the interest

19
for oil shales all over the world. Moreover, the experience in Estonia is that oil shale as a whole (as distinct
from the oil that can be extracted from it) is already profitable.
The price for oil shale produced in a first-of-a-kind industrial scale surface retorting plan is comparable
with the recent estimates of the break-even price for biodiesel ($71.60) and slightly lower than the break-
even price for bioethanol ($107.37) produced in the EU (Schnepf, 2006). If the necessary technological
innovations could be made and the anticipated price evolution is realised, shale oil could become a
competitive fuel source. However, when considering the price of oil shale as an energy source the
environmental costs must always be included. As more research is needed (see paras 4.2.2 and 4.3) on
the environmental impact of oil shale use a meaningful economic costing cannot be included in this brief
report.
This price evaluation does not take into account valuable by-products generated during retorting or shale
oil upgrading. Depending on their properties, many of the by-products can be upgraded to base products
for the manufacturing of solvents, detergents, pesticides, anti-bacterial products, photovoltaic receptors
or asphalt additives. These products can add significantly to the value of the OS exploitation. Although the
markets for this kind of product are limited, a small, diverse shale oil business can be a direct source for
organic compounds that now are extracted or synthesised from crude oil or biofuels.
4.1.3 Impact on employment
Besides the indirect impact on the world oil prices, large-scale shale oil production would also generate
direct income for the countries where the production is located. Most of the production would be located
in the US, as this country has by far the largest resources. Production within the EU would be limited, and
possibly restricted to Italy and Estonia. Besides income from taxes, the oil shale industry will also create
additional employment. Due to the current lack of large-scale oil-shale production, it is impossible to give
verified figures on the impact on employment. The RAND study (Bartis et al, 2005) estimates that direct
employment related to mining and surface retorting will be around 800 direct jobs per production of
50,000 barrels per day. The number of indirect jobs could be two to three times higher.
Additionally, Estonian expertise and technology serve as the base of co-operation agreements with other
countries with OS deposits – USA, Jordan. Morocco, China and Kazakhstan. This has created some
additional jobs (Veiderma, pers.comm.).
4.1.4 Economic evaluation: electricity cost price comparison
Oil shale can be used directly as solid fuel for the production of steam or heat, or it can be distilled to
obtain shale oil. According to Vedierma (pers.comm, Tenno & Lenno 2003) the production cost of
electricity directly from oil shale is about 26.5€/MWh including environmental costs. However, Estonia is
unusual in that it produces electricity directly from the oil shale. Virtually everywhere else in the world oil
shale is converted into shale oil and then used. This obviously makes a marked difference to the cost of
oil shale as a fuel source and should be borne in mind when comparing production costs.
A study currently being carried out by the Belgian Government compares the production cost of electricity
for different technologies:
1. Thermal with oil from oil shale (surface retorting)
2. Thermal with oil from oil shale (in-situ retorting)
3. Thermal with heavy fuel oil (from conventional crude oil)
4. Thermal with co-combustion of wood and coal (25 % of wood)

20
5. Thermal with coal
6. Thermal combined cycle, STAG
7. Wind off shore
8. Wind on shore
9. Nuclear
In the study most assumptions are derived from technologies described by Van Regemorter D et al (2006)
and Bartis. J et al (2005). With funding from the Belgian Science Policy (federal administration), an energy
model has been built with Markal/Times code that is used for climate policy in Belgium. The data for the
economic evaluation is the data used in that model. A study for the U.S. Department of Energy gives
some good economic insight in surface retorting and in-situ retorting. A calibration with this data has
been performed and an exchange rate of 1.25 $/€ is assumed.
The Belgian study makes the following assumptions for the production of oil from oil shale:
Throughput Investment cost Variable costs Life
Bbls per day M$ $/bbl Years
Surface retorting 50 000 6000 23 30
In-situ retorting 50 000 1000 23 30
With these data, the study suggests that the average cost is comparable to that in Bartis et al (2005) and
projects could be economically viable (for required return on investment of 10% after tax) when the price
of a barrel of oil is $30 and $80 for in-situ processes and surface retorting respectively., However,
corporation taxes or profits are not taken into account in Bartis, J et al (2005). It is assumed that there is
no differentiation for the different technologies (all companies subjected to same margins/corporation
taxes).
The assumptions in the Belgian study for electricity power plants are:
Investment cost Variable costs Life Efficiency
€/kWe €/MWh Years %
Oil shale 1000 3 40 33
Heavy Fuel Oil 1000 3 40 40
Coal 1229 4 40 37
Steam and Gas 477 1 25 55
Wind on shore 1000 10 20 /
Wind off shore 2000 22 20 /
Nuclear 1900 6 40 35
When co-combustion is applied so that wood is burned in the coal power plant, an extra investment cost
of 200 €/kWe (kilowatt electrical) is assumed. Utilization rates are all approximately 70% (6000 working
hours), except for wind on shore and off shore, which have full load working hours of 2000 and 3200
respectively. No costs are assumed for balancing and reserve capacity. Large differences in prices or
working hours can be caused by geological differences or specific working conditions.
In Figures 5a, 5b and 5c the results are shown. The price of a tonne of CO2 varies from 5 up to 80 €/ton.
An implicit price is allocated to the emissions from the power plant, during transportation and production
of the fuels. It is assumed that the latter price is two times higher for oil shale than for conventional oil,
coal or gas.

21
Figure 5a Economic evaluation for existing installations and legend
20
40
60
80
100
120
140
0 20 40 60 80CO2 taks (€/ton)
€/M
Wh
Figure 5b Economic evaluation for new installations (3% net discount rate).
20
40
60
80
100
120
140
0 20 40 60 80CO2 taks (€/ton)
€/M
Wh
Oil Shale (surface) Coal Heavy fuel oil (HFO) Coal (25% wood) Steam and gas (STAG)
Oil shale (surface)
Oil shale (in-situ) Coal HFO Coal (25% wood) STAG Wind Off shore Wind On shore Nuclear

22
Figure 5c Economic evaluation for new installations (8% net discount rate).
20
40
60
80
100
120
140
0 20 40 60 80CO2 taks (€/ton)
€/M
Wh
Source for 5a, 5b, 5c: Ben Laenen 2007
These data lead to the following conclusions:
• Producing electricity with oil produced by surface retorting is expensive, certainly when CO2 prices are
important.
• The in-situ technique could compete with electricity produced from Heavy Fuel Oil (HFO) when CO2
prices are lower than 30 €/ton.
• Of all the cases studied, the cost of electricity produced with shale oil is most dependent on CO2 taxes.
This is due to the large amounts of energy needed to produce the shale oil.
• The price for electricity produced by direct combustion of oil shale is estimated at approximately 50 €/MWh, or more than two times the Estonian figure. As CO2 emissions per MWh for oil shale are the
highest of all cases studied, this price will most strongly be affected by the price of CO2.
Generally, the discrepancies between the Belgian and the Estonian data highlight the difficulty in making
consistent comparisons in the face of differing assumptions about what to include in the calculations, and
in the face of varying local geological and regulatory conditions and local technologies.
We can draw the following conclusions from the results so far available:
• Direct combustion of oil shale for electricity production has shown its economic efficiency as one of the
cheapest kinds of power in the Baltic region.
• Producing electricity with oil produced by surface retorting of oil shale is expensive, certainly when there is a high cost attached to CO2 emissions.
Oil shale (in-situ) Coal HFO Coal (25% wood) Wind Off shore STAG Wind On shore Nuclear
Oil shale (surface)

23
• The in-situ technique could compete with electricity produced from Heavy Fuel Oil (HFO) when CO2
prices are lower than 30 €/ton.
• Of all the cases studied, the cost of electricity produced with shale oil is most dependent on CO2 taxes.
This is due to the large amounts of energy needed to produce the shale oil.
4.2 Environment
4.2.1 Land use, ecological impact and waste
Probably the most striking impact of the oil shale industry is the disruption to land use. Mining, processing
and waste disposal require land to be withdrawn from traditional uses such as agriculture, residential
areas or recreation. The original ecosystem diversity with habitats supporting a variety of plants and
animals is reduced. Although efforts can be made to return land to other use once extraction and
processing have ceased, this takes time and cannot necessarily re-establish the original biodiversity.
To set up a full scale processing plant with an output of 100 000 bbl/day, approximately 50 million tonnes
of moderate grade oil shales have to be mined. If quarried in open pits, the mining operation would be
similar in size to the largest brown-coal mines in Germany, for example. The impact on the land will
therefore be large. In addition to the mining, extraction, ore preparation and retorting produce large
amounts of displaced rock and spent shale, e.g. a 100 000 bbl/day processing plant will produce at least
32million m3 of spent shale (Laenen pers. comm.). Harney (1983) states that roughly 1.2 to 1.5 tons of
spent shale result from each barrel of oil produced by surface retorting. Crushing and the heat treatment
result in a volume increase of 15 - 25% on average. Therefore, the volume of spent shale and replaced
material will be larger that the volume of the mine. Removal of large volumes of earth and rocks overlying
the oil shale adds on to the spent shale to be disposed of. Even if in-mine disposal is applied, the volume
increase over raw shale requires at least some surface disposal. In-situ retorting appears to be less
disruptive to the landscape, but the drilling, pipelines and other technical operations will cause at least a
few decades-long changes in the land use. Even after reclamation of the mine area, mine dumps will
remain.
The impact of sub-surface mining on the surroundings will be less than for open pit mines. However, to
produce 50 Mton of shale a year would need the development of a mining industry that surpasses the
total hard coal production in Germany. To save costs and to facilitate operations, the spent shale and part
of the rocks removed to drive the access shafts and stone drifts are likely to be disposed at the surface.
Even if case disposal in the mines is chosen or imposed, some of the mined material will have to be placed
on a mine dump due to the volume increase. Sub-surface mining also causes subsidence of the surface.
This is due to the collapse of mined-out area and abandoned stone drifts. Surface subsidence can be
strongly reduced by using appropriate techniques to fill and work-off mined areas, but can never be
totally avoided. Besides damage to buildings and other construction works, subsidence can have an
impact on the water runoff pattern of the area affected. In some cases, ground water has to be pumped
off to avoid flooding of certain areas.
In-situ retorting seems less disruptive to the landscape. The techniques however will involve the drilling of
a large number of wells. Due to the poor flow conditions within the shale, the wells will have to be drilled
close to each other (the actual spacing depending on the permeability of the shale and the anticipated
production rates). The wells have to be connected to an SO and gas treatment plant by a network of
pipelines. These installations will be in operation for 15 to 25 years.
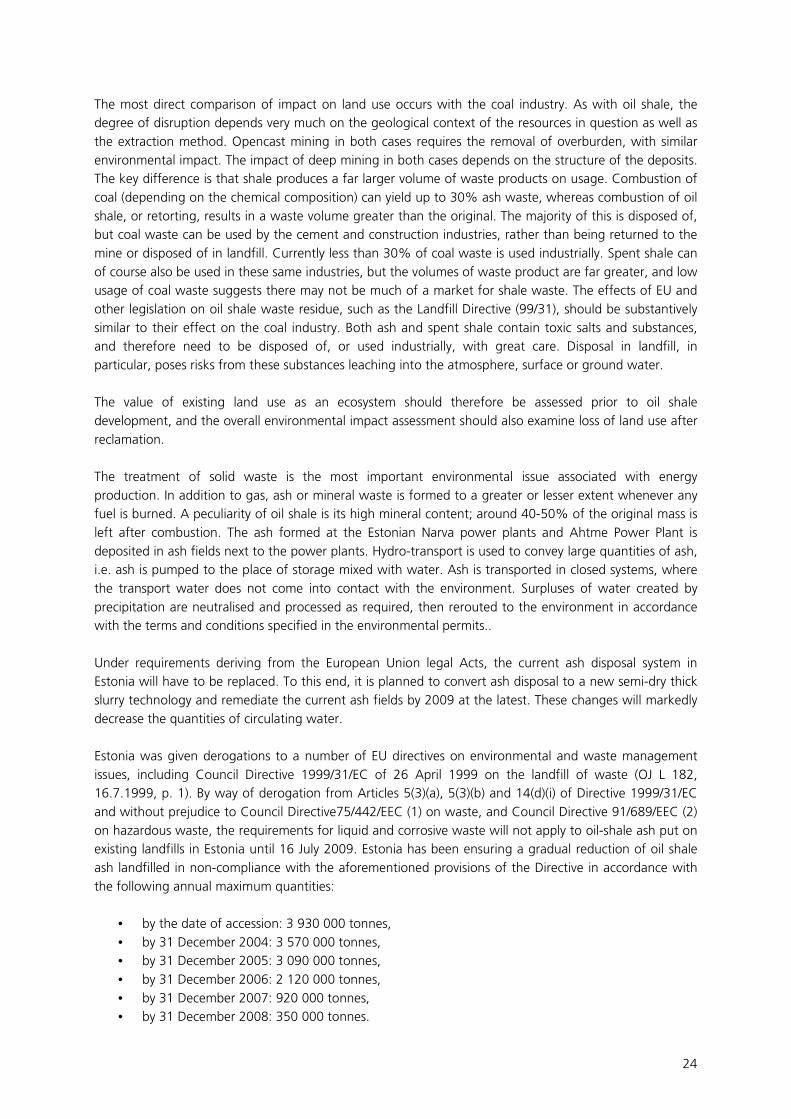
24
The most direct comparison of impact on land use occurs with the coal industry. As with oil shale, the
degree of disruption depends very much on the geological context of the resources in question as well as
the extraction method. Opencast mining in both cases requires the removal of overburden, with similar
environmental impact. The impact of deep mining in both cases depends on the structure of the deposits.
The key difference is that shale produces a far larger volume of waste products on usage. Combustion of
coal (depending on the chemical composition) can yield up to 30% ash waste, whereas combustion of oil
shale, or retorting, results in a waste volume greater than the original. The majority of this is disposed of,
but coal waste can be used by the cement and construction industries, rather than being returned to the
mine or disposed of in landfill. Currently less than 30% of coal waste is used industrially. Spent shale can
of course also be used in these same industries, but the volumes of waste product are far greater, and low
usage of coal waste suggests there may not be much of a market for shale waste. The effects of EU and
other legislation on oil shale waste residue, such as the Landfill Directive (99/31), should be substantively
similar to their effect on the coal industry. Both ash and spent shale contain toxic salts and substances,
and therefore need to be disposed of, or used industrially, with great care. Disposal in landfill, in
particular, poses risks from these substances leaching into the atmosphere, surface or ground water.
The value of existing land use as an ecosystem should therefore be assessed prior to oil shale
development, and the overall environmental impact assessment should also examine loss of land use after
reclamation.
The treatment of solid waste is the most important environmental issue associated with energy
production. In addition to gas, ash or mineral waste is formed to a greater or lesser extent whenever any
fuel is burned. A peculiarity of oil shale is its high mineral content; around 40-50% of the original mass is
left after combustion. The ash formed at the Estonian Narva power plants and Ahtme Power Plant is
deposited in ash fields next to the power plants. Hydro-transport is used to convey large quantities of ash,
i.e. ash is pumped to the place of storage mixed with water. Ash is transported in closed systems, where
the transport water does not come into contact with the environment. Surpluses of water created by
precipitation are neutralised and processed as required, then rerouted to the environment in accordance
with the terms and conditions specified in the environmental permits..
Under requirements deriving from the European Union legal Acts, the current ash disposal system in
Estonia will have to be replaced. To this end, it is planned to convert ash disposal to a new semi-dry thick
slurry technology and remediate the current ash fields by 2009 at the latest. These changes will markedly
decrease the quantities of circulating water.
Estonia was given derogations to a number of EU directives on environmental and waste management
issues, including Council Directive 1999/31/EC of 26 April 1999 on the landfill of waste (OJ L 182,
16.7.1999, p. 1). By way of derogation from Articles 5(3)(a), 5(3)(b) and 14(d)(i) of Directive 1999/31/EC
and without prejudice to Council Directive75/442/EEC (1) on waste, and Council Directive 91/689/EEC (2)
on hazardous waste, the requirements for liquid and corrosive waste will not apply to oil-shale ash put on
existing landfills in Estonia until 16 July 2009. Estonia has been ensuring a gradual reduction of oil shale
ash landfilled in non-compliance with the aforementioned provisions of the Directive in accordance with
the following annual maximum quantities:
• by the date of accession: 3 930 000 tonnes,
• by 31 December 2004: 3 570 000 tonnes,
• by 31 December 2005: 3 090 000 tonnes,
• by 31 December 2006: 2 120 000 tonnes,
• by 31 December 2007: 920 000 tonnes,
• by 31 December 2008: 350 000 tonnes.

25
Under the industrial pollution control and risk management Directive 2001/80/EC of the European
Parliament and of the Council of 23 October 2001 on the limitation of emissions of
certain pollutants into the air from large combustion plants power will be subject to the requirements of
the EU Council Directive 2001/80/EEC on air emissions from large combustion plants (the LCP Directive).
The Directive applies to new power plants from 2002 and existing plants from 2008 and allows limited
operation of non-compliant existing plants until 2015. Estonia was given derogations from Article 4(3)
and part A of Annexes III andVII of Directive 2001/80/EC, the emission limit values for sulphur dioxide and
dust shall not apply in Estonia until 31 December 2010 for the combustion plant at Ahtme, or until 31
December 2015 for the combustion plants at Narva (Eesti and Balti) and Kohtla Järve.
However, at Narva (Eesti and Balti) 4 boilers were in compliance with the Directive by 31 December 2004
and a further 4 boilers by 31 December 2010. By 1 January 2008, all boilers of type ‘TP-17’ of the Balti
power plant will be closed. During the transitional period, these plants will achieve a minimum rate of
desulphurisation of 65 % and the emission limit values for dust will not exceed 200mg/Nm3. By 1 January
2008, Estonia will have presented to the Commission a plan, including an investment plan, for gradual
alignment of the remaining
non-compliant boilers at Narva (Eesti and Balti) and at Kohtla Järve for the period between 2010 and
2015. Estonia has to make all efforts to ensure that in 2012 sulphur dioxide emissions from oil shale fired
combustion plants do not exceed 25 000 tonnes and progressively decrease thereafter.
Compliance with the requirements of this Directive requires investments of more than 10 billion kroons
(0.64 billions Euro) and is related to the Chapter on regional policy and coordination of structural
instruments in the accession treaty. According to the opinions presented in accession negotiations, Estonia
wishes to use the support from the Cohesion Fund to finance environmental projects concerning power
engineering. The projects which concern the following topics: storage of oil shale ash, new technologies
reducing air pollution and investments in renewable energy, qualify to receive the specified support.
Additionally, the state environmental objectives in the energy sector are:
• further reduction of sulphur emissions, by 35 per cent by 2005 and by 40 per cent by 2010,
based on the level of 1980;
• limitation of emission of pollutants as of 2010 to 100 000 tonnes regarding sulphur dioxide, 60
000 tonnes regarding nitrogen oxide and 49 000 tonnes regarding volatile organic compounds;
• bringing filling stations and terminals into compliance with the environmental requirements
regarding volatile organic compounds by 2007;
• limitation of the annual emissions of sulphur dioxide from oil shale power stations to 25 000
tonnes as of 2012;
• reduction of the permitted sulphur content of petrol and diesel fuel to less than 50 mg/kg by
2005, and less than 10 mg/kg by 2009.
In addition to the renovation of combustion plants, up to five billion kroons (0.32 billion Euros) must be
invested in order to bring the ash depositories of power stations and other enterprises which use oil shale
as fuel and raw material into conformity with the requirements of the Directive 1999/31/EC on the landfill
of waste. In enterprises producing shale oil using the Kiviter technology, two problems which require large
investments are to be solved in recent years: storage of the semi-coke generated in the technological
process and prevention of emission of sulphur compounds contained in the producer gas to the
atmosphere (Estonian government, 2004).

26
4.2.2 Air quality and greenhouse gas emissions
As a fossil fuel, combustion of oil shale and shale oil produces carbon dioxide – a principal greenhouse
gas. Data on emissions and control options, eg Harney (1983), suggest that air emissions from shale oil
production on the scale of a few hundred thousand barrels per day could probably be controlled to meet
EU existing air quality regulations. Oil shale operations also result in emissions of sulphur oxides, nitrogen
oxides, particulates, ozone precursors, and carbon monoxide, which are designated in the USA by the
Environmental Protection Agency (EPA) as criteria pollutants. In addition, small amounts of non-criteria
pollutants are produced, such as arsenic, mercury, cadmium and selenium compounds.
The comparison of coal and oil shale emissions (current and after replacing of all PC boilers by FBC boilers)
production systems to climate change is presented in Figure 6a, and comparison between coal and other
energy sources for electricity generation is given in Figure 6b. Under current electricity production
methods oil shale contributes more to climate change than coal. However, with new production
methods, it would fall to the same level as coal (Kinnunen, 2003 & Bsieso, 2003). It is worth noting that
coal is traditionally seen as one of the most greenhouse-gas producing fuels so this still means a high level
of emissions. Further innovations, such as carbon capture and storage (CCS) technologies could further
reduce these (effective CCS is estimated to be able to reduce coal emissions to as little as 140 kg/MWh).
Figure 6a Contributions of coal and oil shale electricity production systems to climate change
(http://www.energia.ee/OSELCA/files/ComparisonTask2_FINAL_210605%20pr.pdf also
http://www.energia.ee/OSELCA/eng/index.php)

27
Figure 6b Contributions of different electricity production systems to climate change
Carbon footprints of power generation methods
0
100
200
300
400
500
600
700
800
900
1000
Coal(conv)
Coal(gasified)
Oil NaturalGas
Biomass Photovoltaics
Marine Hydro Wind Nuclear
kg C
O2/
MW
h
Source: Parliamentary Office of Science and Technology, UK, Postnote October 2006, number 268
Heating oil shale during retorting is associated with fossil fuel combustion and carbon dioxide emissions.
Additional production of this greenhouse gas is due to high temperature decomposition of mineral
carbonates contained in oil shale. Retorting of oil shale also produces another greenhouse gas, methane.
Increasing public concern about the adverse consequences of global warming may lead to opposition to
oil shale development.
Preservation of air quality is an important prerequisite of sustainable economic growth. The natural
background and man-induced quantities of criteria and non-criteria air pollutants need to be evaluated to
reflect the current level of processing technologies and monitoring tools. Air quality modelling studies
should be commissioned to understand the dynamics of air quality impacts and take into consideration
future growth in production. Methods need to be developed to implement results of air quality impacts
on leasing decisions. Strategies are needed for reducing emissions of greenhouse gases associated with oil
shale development in an economically efficient way. In particular, more work should be done on
developing carbon sequestration technology appropriate for oil shale, to improve the carbon footprint. It
may be preferable to shift the related costs and decisions on whether to go forward with a particular oil
shale development to the producers and consumers of shale oil in a market-based approach.
During direct combustion of the Estonian Kukersites, approximately 106 kg of CO2 is emitted per GJ
(Veiderma, 2003). This corresponds to 2.4 moles of CO2 per MJ. As can be seen from Table 4, this figure is
significantly higher than that of other sources of fossil fuel. The high CO2-emission of the Estonian
Kukersites is explained by the relative low calorific value of the shales and by the thermal decomposition
of carbonates within the shales. As both the mineral composition and the calorific value of oil shales vary
widely, the CO2 emissions due to direct combustion will also vary widely. Due to the type of kerogen
within the shales, the CO2-emissions are expected to be comparable with those of brown coal at the best
(2.15 moles CO2/MJ). An increase of the carbonate content of the shales by 1%wt will result in an increase
in CO2-emissions by 0.1 mol/kg shale (Laenen, pers.comm.)

28
Table 4 Carbon dioxide emissions (sources: Veiderma, 2003; International Energy Outlook 2006)
mol CO2/MJ (thermal)
oil 1.4 – 1.55
natural gas 1.25
coal 2 – 2.25
oil shale (Estonian Kukersite) 2.4
biomass* 2.1 – 2.3
* No fossil fuel. Combustion of biomass does not result in an increase in atmospheric CO2 concentrations.
Large amounts of energy are needed for the production of oil shale, independent of the technique used.
Even the ICP-technique developed by Shell, an equivalent of 1/3th of the energy extracted from the
deposit is needed for the shale oil production and for freezing the boundary of the production site
(www.shell.com/US/mahogony). With this figure in mind, it can be estimated that the total CO2-emission
be at least one-third higher that the total emissions caused to produce and burn the same amount of oil.
4.2.3 Water
Threats to water quality associated with oil shale operations depend on the technical approach employed,
ie mining and surface retorting or in-situ retorting. The primary threat to water quality is generally
considered to be leachate from spent, ie retorted, oil shale (Harney, 1983), which includes salts and some
toxic substances such as arsenic and selenium. Typically oil shale retorting results in the generation of
slightly over one tonne of spent shale per barrel of shale oil. An industry producing 3 million barrels of
shale oil per day would annually generate over a billion tons of spent shale per year (Bureau of
Reclamation, 2005). There remain some uncertainties about the long-term effect of spent shale leaching
from mine refills and thermally conductive in-situ conversion sites, especially once extraction operations
are terminated and groundwater is allowed to re-enter the site and contact the spent shale.
As suggested previously, the threat to water quality from oil shale mining, use and landfill is comparable
in nature to the threat from coal, but due to the greater quantity of waste product from oil shale, the
level of the threat will be enhanced.
Oil shale mining, in common with most other forms of mining, is accompanied by a lowering of the
water level and the discharge of mine water into bodies of surface water due to the need to constantly
pump out water which seeps into the active mine. The source of this drained water is precipitation water
(rain, etc, which falls into open-cast mines), surface water, subsoil water (unconfined groundwater) and
confined groundwater which seep into mines. Mine water is therefore actually a part of the natural cycle
of water. Mining activities have a direct influence on groundwater quality due to the use of machinery,
mining by-products becoming dissolved in the water, and minerals formed when the rock is exposed to air
becoming dissolved in the water.
After mines are closed, step-by-step restoration of the natural conditions of groundwater filling the mines
starts – sulfates are carried out, and the effect of atmospheric oxygen on the mineable seams that used to
be pumped out disappears. As a result, oxidation of pyrite diminishes, and the mineral content of the
drained water decreases. Quality studies of mine water have shown that within five years of the closure of
a mine the content of sulfates and iron decreases below the maximum permitted level in drinking water.
The highest permitted content of iron in first-class drinking water is 0.2 mg/l and that of sulfates 250
mg/l. Water in NE Estonia meets these requirements.

29
The analysis of the water situation is complicated by the fact that the chief oil shale region in Estonia is
also the location of power engineering and chemical industry. It is often impossible to distinguish the
effect of mine waters on ecosystems as a large number of other factors are involved.
Presently no deterioration of groundwater quality in the Cambrina-Vendian aquifer system in NE Estonia
can be observed. In connection with new requirements on the quality of drinking water, set by the EU
Water Framework Directive 2000/60/EC, the Geological Survey of Estonia (EGS) recalculated in 2005 that
the groundwater reserves of the Cambrian–Vendian aquifer system fully satisfy the requirements of the
Directive. There is some risk due to a relatively high content of radionucleids, but this problem will be
solved by mixing (diluting) deep waters with fresh waters from the Vasavere glaciofluvial aquifer. Building
of two pumping stations is planned.
The water in this aquifer system has historically been over-exploited. Compared with the early 1990s
(when the total withdrawal was over 60,000 m3/day), the withdrawal of groundwater has now decreased
by a factor of more than three (in 2004, 17,065 m3/day). Whereas there was a risk that, due to the falling
water table, intrusion of sea water might occur, the potentiometric surface has continuously risen since
1990.
The forecasts based on the hydrodynamic model, developed in the EGS and Tallinn University of
Technology show that during the prognostication time (until 2035) no intrusion of salty water will occur.
Of course, in parallel with water consumption it is necessary to continuously monitor the quantitative and
chemical status of groundwater so that measures could be taken if any negative trends were observed.
As the Cambrian–Vendian aquifer system has been declared a transboundary groundwater body,
improved co-operation with Russia in monitoring its status and using its water reserves is necessary.
Presently a unified groundwater model of Estonian–Russian border areas is being compiled under the
initiative of the French Geological Survey, which comprises a 200×200 km area north from Lake Peipsi.
(Perens et al, 2006)
Estonia has an oversupply of fresh water and drainage of wetlands, forests and the rehabilitated open-
cast shale mining areas is the main concern. The power station cooling water is not contaminated and is
actually used in fish farming. Ironically, at the same time, there is evidence that the decreasing amount of
pumped out mine water has had a negative influence on the quality of the water of some rivers due to
the decreasing amount of water in them.

30
4.2.4 Socio-economic impacts
Rapid population changes and local social and fiscal impacts may be expected in connection with
production-growth phase of oil shale development or shutdowns of the operations. About 44,000 new
residents are estimated to move to areas of production in the US in connection with the production of
200,000 barrels of oil from shale per day (OTA 1980a). This affects the ability of local communities to
provide necessary public services and amenities, including fire, police, water and sanitation, roads, health
care, housing, schools, and recreational opportunities.
In order to avoid significant opposition to oil shale operations because of social, fiscal, and environmental
concerns, governments should therefore consider fostering the creation of a regionally based organization
dedicated to planning, oversight and advice, and public participation in oil shale development.
4.2.5 Possible research and innovation needs and costs (and possible funding)
It is highly desirable to support EU level research projects dealing with environmental impacts of oil shale
development using different new technologies such as burning mix, carbon capture and storage, in-
ground gasification etc. Progress may be achieved by application of integrated computer simulations to
test alternative scenarios with variable natural (oil shale quality, air and water pollution), industrial
(technologies, energy efficiency), and socio-economic (manpower, education, infrastructure) inputs and
the dynamics of their evolution over time. The research should target development of new prediction
tools for risk assessment under different political and economic climates. The research funding should
come from both the EU and industry.
4.3 Research and innovation issues
The previous sections have identified a number of research issues related mainly to environmental effects
from oil shale exploitation. The key issues are:
• the response of local flora and fauna to ecosystem loss or damage before national energy
demand reaches such a critical point that exploitation of oil shales becomes necessary;
• research including mathematical modelling, laboratory tests, and field monitoring on the nature
and long-term environmental fate of leachate from spent shale and the water quality impacts of
in-situ and surface retorting. It is necessary to evaluate whether recent methods used to reclaim
spent shale piles are applicable to the amount of spent shale anticipated from commercial-size
retorting plants. This kind of research should precede by at least 6-8 years the decision-making on
permitting commercial oil shale operations;
• land use and reclamation. More than 80% of the land disturbed by oil shale mining has been
successfully reclaimed in former sites worldwide; mainly to forestry owing to difficulties in
removing, handling and replacing overburdened horizons from open-cast and strip mining. The
potential exists to reclaim large areas for appropriate agricultural crops and grasses – this is
another area where research and new technologies could bring improvements.
One important additional issue is the scientific dimension of reclamation. For example, in the US changes
in environmental regulations, pollution control and mining and process technologies mean that many of
the analyses from studies in the 1980s are no longer relevant. Land use and environmental impacts of
both mining and in-situ retorting will cause extensive disturbance that could result in permanent

31
topographical changes, long-term displacement of existing land uses and impacts on the flora and fauna.
Large-scale research will be needed to update reclamation strategies if recent developments and interest
in oil shale lands and production of shale oil are to continue. Reclamation strategies have to be specific to
the local conditions of each exploited deposit, so this research will be of concern to all exploitation
initiatives.
The sudden increase in research and development by oil companies that has recently been announced in
the Green River Formation oil shale fields in the US should lead to rapid updating of the technical,
environmental and financial implications of producing oil fuel products. Unfortunately there does not
seem to be any research into the commercial manufacture and use of secondary materials produced and
how this can be incorporated into the development of modern refining and distillation plants. This will be
of key interest to anyone seeking to develop oil shales.
The Framework Programme is the European Union's main instrument for funding research and
technological development. FP7 will begin on 1 January 2007 and will run for seven years. Research into
improved oil shale extraction and the retorting of shale-oil and other products falls not only into the
'Energy' remit of FP7 as might be expected (CO2 capture, smart energy etc), but also into the
'Nanosciences, nanotechnologies, materials and new production technologies'.
The energy remit of FP7 covers the following areas:
• Hydrogen and fuel cells
• Renewable electricity generation
• Renewable fuel production
• Renewables for heating and cooling
• CO2 capture and storage technologies for zero emission power generation
• Clean coal technologies
• Smart energy networks
• Energy efficiency and savings
The Nanosciences, Nanotechnologies, Materials and new Production Technologies remit covers:
• Nanosciences and nanotechnologies
• Materials
• New production
• Integration of technologies for industrial applications
• Knowledge for energy policy making
Many of these categories are relevant to the exploitation of oil shales, and we hope they will be used to
support the research that must underpin the future development of this resource.

32
5 Conclusion
Oil shales are, clearly, a potential source not only of a range of oils of various types but also of many other
products, from relatively high value chemicals to hard core for the construction industry. They are also a
direct source of fuel. Oil shales are found in many parts of the EU in very substantial quantities. Only one
major deposit is currently being actively exploited and only a few have been exploited on a large scale in
the past, so there is only limited evidence on which to base an assessment of strategic importance in
practice of oil shales. Whether any particular deposit is worth developing will, of course, depend on many
factors, including the comparative cost of alternative sources for the materials sought, environmental
costs and opportunities, and the value placed on self-sufficiency and security of supply.
The price of crude oil on the international market will be a key governing factor in the viability of oil shale.
Whether it can be economically viable, even given the current high cost of conventionally recovered
petroleum, is still unclear. As was noted in the CRS report Oil shale: history, incentives and policy
(Andrews 2006), oil shale will always seem economically questionable until there is a public sector or
industry led long-term project to attempt to exploit oil shale.
As we have mentioned in the report, it is not possible to say yet what quality of oil shale or shale oil will
be produced from the various deposits around the EU. Exploratory investigations will involve a signficant
cost, not to mention the cost of setting up a extraction and processing plant.
The balance of these factors will vary over time as costs change, technology advances and the political
landscape alters. By comparison with the gas and liquid oil industries, the oil shale industry is a modest
undertaking at the EU level. That is unlikely to change in the foreseeable future, but oil shales could still
be a useful part of an overall EU policy on energy and chemical feedstocks. Estonia is unusual in using so
much of its oil shale directly in power production, other countries seek to utilise the potential of shale oil
and it is unlikely the EU more generally would seek to use oil shale for power generation. But any research
into the viability of the EU’s oil shale resources, either for use as oil shale or shale oil, must be
accompanied by research into the environmental and socio-economic impact of any extraction.
A quantitative assessment of this potential would be a major undertaking, well beyond the scope of this
report. It would need to accommodate not only detailed analyses of the overall economic and political
context but also geological analyses of the individual deposits, since they vary so much from location to
location. This would be a worthwhile exercise.
The 2005 study Oil Shale Development in the United States: Prospects and Policy Issues (Rand 2005),
indicates that oil production based on older oil shale mining and retorting technologies would not be
profitable unless crude oil prices consistently stay above at least $70 to $95 per barrel.
There are reports that Shell, on the other hand, has estimated that ICP could be competitive with oil prices
at about less than half that price.
It may be that the EU decides exploratory investigations and preliminary R+D work on processing and
refining oil shale should be funded. However, worldwide consensus seems to be that oil shale is not
currently worth mining.
If the price of crude oil rises higher than the peak of 2006 then it may be that the EU decides oil shale
becomes worth exploiting. At that point, there are other policy areas as identified in the Green Car
Congress article in September 2005, that will need to be considered on the environmental front,
including:

33
• “Land use. Large tracts of public land would need to handed over to the production and
processing of oil shale. There would be the concomitant requirements of infrastructure: roads,
power supply and distribution systems, pipelines, water storage and supply facilities, construction
staging areas, hazardous materials handling facilities, and buildings.
• Air quality (criteria pollutants) and greenhouse gas emissions. As well as high levels of emissions
from the burning of oil shale, the immediate environ of an oil shale processing plant is often
affected by pollution.
• Water quality. For mining and surface retorting, potential sources of water pollution include mine
drainage; point-source discharges from surface operations associated with solids handling,
retorting, upgrading, and plant utilities; and leachate from spent (i.e., retorted) oil shale. For in-
situ processing, there is little understanding of the long-term impact on groundwater flow and
quality. The Shell freezing study was only a very small initial step in that direction.
• Water consumption. Estimated water requirements for mining and retorting range from 2.1 to
5.2 barrels of water per barrel of shale oil product. In-situ processing eliminates or reduces a
number of these water requirements, but still will require considerable use (oil and natural gas
extraction, post-extraction cooling, products upgrading and refining, environmental control
systems, and power production).”
Strategies are needed for reducing emissions of greenhouse gases associated with oil shale development
in an economically efficient way. It may be preferable to shift the related costs and decisions on whether
to go forward with a particular oil shale development to the producers and consumers of shale oil in a
market-based approach.
The key areas for research are:
• Viability of oil shale deposits in the EU for commercial extraction,
• The environmental impact of oil shale waste on the environment and water supply
• New methods for extraction and processing oil shale to minimise environmental impact and cost
• Reclamation strategies
• Manufacture of secondary products

34
Annex A Working group
This report is based on the contributions and input of the following expert working group. The members
were identified by the member Academies of EASAC and worked on a volunteer basis. This report is
written from an academic perspective.
Dr Juraj Francu, Geochemistry and Basin Modelling, Czech Geological Survey
Dr Barbra Harvie, School of Geosciences, University of Edinburgh
Dr Ben Laenen, Materials Department, Flemish Institute of Technical Research
Professor Andres Siirde, Department of Thermal Engineering, Tallinn University of Technology
Professor Mihkel Veiderma, Estonian Academy of Sciences
Secretariat
Dr Peter Collins, Executive Secretary EASAC
Ms Fiona Steiger, EASAC Secretariat
The report was reviewed on behalf of EASAC Council by Professors Brian Heap, Jan van Hinte and Dietrich
Welte.
We would like to extend our warmest thanks and appreciation to the working group members and
reviewers.
We would also like to extend our warm thanks to Dr Harold Vinegar of Shell Technology and Innovations
for his advice on the Shell In-situ Conversion Process and Dr James Bartis of the Rand Corporation for his
advice.
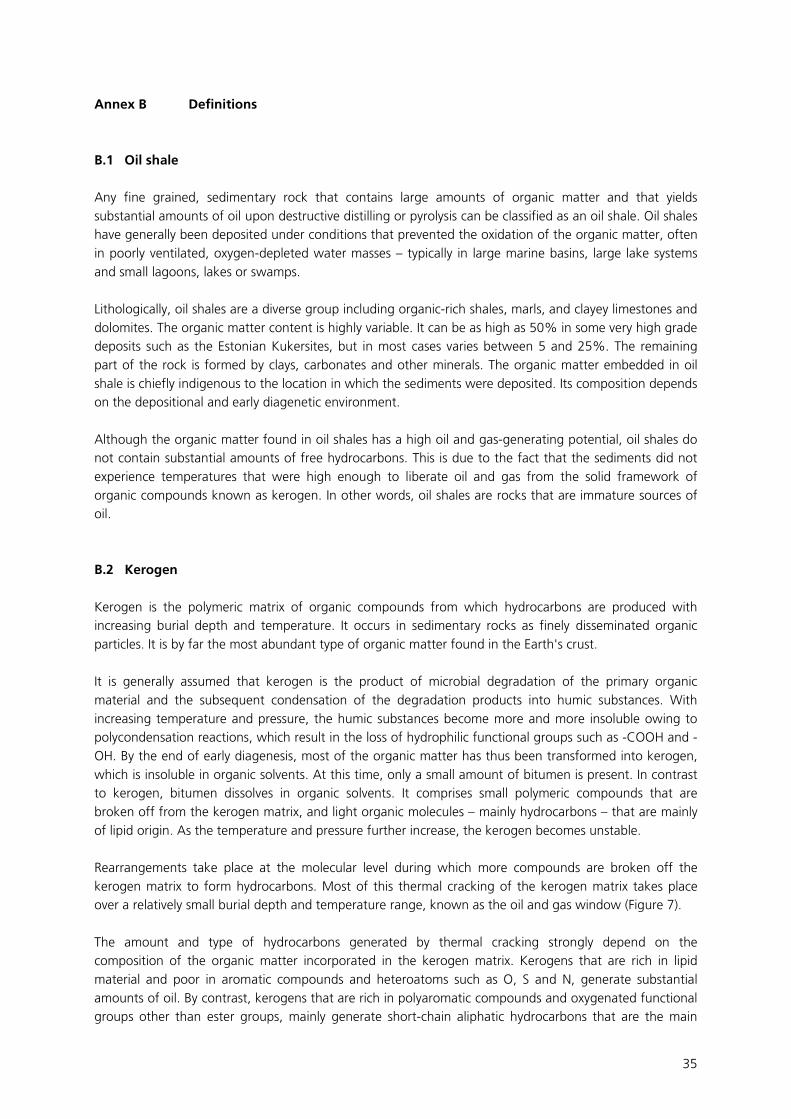
35
Annex B Definitions
B.1 Oil shale
Any fine grained, sedimentary rock that contains large amounts of organic matter and that yields
substantial amounts of oil upon destructive distilling or pyrolysis can be classified as an oil shale. Oil shales
have generally been deposited under conditions that prevented the oxidation of the organic matter, often
in poorly ventilated, oxygen-depleted water masses – typically in large marine basins, large lake systems
and small lagoons, lakes or swamps.
Lithologically, oil shales are a diverse group including organic-rich shales, marls, and clayey limestones and
dolomites. The organic matter content is highly variable. It can be as high as 50% in some very high grade
deposits such as the Estonian Kukersites, but in most cases varies between 5 and 25%. The remaining
part of the rock is formed by clays, carbonates and other minerals. The organic matter embedded in oil
shale is chiefly indigenous to the location in which the sediments were deposited. Its composition depends
on the depositional and early diagenetic environment.
Although the organic matter found in oil shales has a high oil and gas-generating potential, oil shales do
not contain substantial amounts of free hydrocarbons. This is due to the fact that the sediments did not
experience temperatures that were high enough to liberate oil and gas from the solid framework of
organic compounds known as kerogen. In other words, oil shales are rocks that are immature sources of
oil.
B.2 Kerogen
Kerogen is the polymeric matrix of organic compounds from which hydrocarbons are produced with
increasing burial depth and temperature. It occurs in sedimentary rocks as finely disseminated organic
particles. It is by far the most abundant type of organic matter found in the Earth's crust.
It is generally assumed that kerogen is the product of microbial degradation of the primary organic
material and the subsequent condensation of the degradation products into humic substances. With
increasing temperature and pressure, the humic substances become more and more insoluble owing to
polycondensation reactions, which result in the loss of hydrophilic functional groups such as -COOH and -
OH. By the end of early diagenesis, most of the organic matter has thus been transformed into kerogen,
which is insoluble in organic solvents. At this time, only a small amount of bitumen is present. In contrast
to kerogen, bitumen dissolves in organic solvents. It comprises small polymeric compounds that are
broken off from the kerogen matrix, and light organic molecules – mainly hydrocarbons – that are mainly
of lipid origin. As the temperature and pressure further increase, the kerogen becomes unstable.
Rearrangements take place at the molecular level during which more compounds are broken off the
kerogen matrix to form hydrocarbons. Most of this thermal cracking of the kerogen matrix takes place
over a relatively small burial depth and temperature range, known as the oil and gas window (Figure 7).
The amount and type of hydrocarbons generated by thermal cracking strongly depend on the
composition of the organic matter incorporated in the kerogen matrix. Kerogens that are rich in lipid
material and poor in aromatic compounds and heteroatoms such as O, S and N, generate substantial
amounts of oil. By contrast, kerogens that are rich in polyaromatic compounds and oxygenated functional
groups other than ester groups, mainly generate short-chain aliphatic hydrocarbons that are the main

36
constituents of natural gas. The latter type of kerogen is typically derived from vascular plants, whereas
the former results from the selective accumulation of algal or bacterial material.
The depositional environment not only affects the composition of the kerogen, it also has a strong impact
on the mineral content and the inorganic chemical composition of an oil shale. As oil shales have been
deposited in a wide range of environments, large differences in mineral and chemical composition occur.
For example, changes in water supply and evaporation level during its depositional history led to the
accumulation of sodium and sodium-aluminium carbonates alongside the Green River oil shale. These
minerals have value for the production of sodium ash and alumina (Dyni, 2006).
Figure 7 General scheme for hydrocarbon generation of a typical source rock
(from Killops & Killops, 1993)
The Alum shales of Sweden and the Dyctionema shales found in Estonia are marine clay deposits that are
locally enriched in uranium. In certain beds, the uranium content is in excess of 200 ppm. In the Soviet
era, about 22.5 tonnes of elemental uranium were extracted from the Dyctionema shale from an
underground mine in the vicinity of Sillamäe. Hence, it should be clear that in certain cases, valuable
secondary resources can make a significant contribution to the economic exploitation of the oil shale
deposits.

37
As oil shales are compositionally diverse, the products that can be derived from them as well as the
composition of the obtained SO will vary from deposit to deposit.
B.3 Coal
Coals are divided in two broad classes: humic coals and sapropelic coals. Humic coals are primarily formed
by the accumulation of vesicular plant remains that went through a peat stage. During this stage, the
decaying organic matter is converted in a more or less stable humus fraction, which is subsequently
converted into brown coal, hard coal and finally anthracite mainly by the action of pressure and heat. The
major organic components found in humic coals are derived from wood tissue. The amount of non-
organic material, known as mineral matter, usually is less that 25%. Humic coal is typically well bedded
and has a brown to black, lustrous appearance.
Sapropelic coals or cannel coals are formed from fine grained, organic-rich muds that were deposited in
oxygen-depleted pools and lakes. They usually occur in close proximity to humic coals. The organic matter
consists of a mixture of autochthonous algal remains and decay products of peat swamp plants. In
contrast to humic coals, sapropels usually do not go through a peat stage. Sapropelic coals tend not to be
macroscopically stratified and have a dull appearance.
According to the above definition, sapropelic coals are also classified as oil shales. Humic coals are not,
although some type of oil shale often occurs in close proximity with humic coal deposits.
Bituminous is part of the ranking system of coal: bituminous coal is a relatively hard coal containing a tar-
like substance called bitumen. It is of higher quality than lignite coal but of poorer quality than anthracite
coal
B.4 Oil sands
Oil sands, tar sands or bituminous sands are synonyms for sand and sandstone deposits that are
impregnated with heavy oil, known as bitumen. The bitumen found in an oil sand is the degradation
products of oil that has been expelled from oil shales, known as source rocks, and migrated though
permeable carrier beds into the present host rock. The organic matter embedded in an oil sand hence is
primarily foreign to the deposit.
The degraded bitumen is too viscous to be pumped from a well in its natural stage. In order to produce it,
the sand must be mined and treated by some kind of chemical or thermal process. Alternatively, the heavy
oil can be produced by in-situ techniques such as underground heating or some other kind to tertiary oil
recovery. The amount of bitumen typically is in the range of 10 to 20%. The remaining 90 to 80% is
mineral matter such as quartz and clays, and water.
B.5 Shale oil
Shale oil refers to any synthetic oil obtained by in-situ extraction techniques or by destructive retorting of
an oil shale. During the extraction process, the stable organic matter embedded in the shale is thermally
cracked and converted into oil, combustible gases and a solid ash and char residue. The composition of
the SO will depend on the extraction technique used, the composition of the kerogen and the presence of
non-organic phases such as sulphur, phosphate or nitrates.

38
Annex C Classification of oil shales
Oil shales are deposited in a wide range of sedimentary environments going from terrestrial swamps and
pools, over large lakes, the transitional zone between land and sea to deep marine basins. The origin of
the deposits is the base of the classification schema developed by Hutton (1987) (Figure 8). The
classification also reflects differences in the composition of the organic matter and of the hydrocarbons
that can be produced from it. This should not surprise as there is a close relationship between the organic
matter found in a sediment and the environment in which it was deposited.
Figure 8 Hutton classification schema for oil shales
Source: Hutton, A.C, 1987. Petrographic classification of oil shales. International Journal of Coal Geology
8: 203-231.
Terrestrial oil shales or cannel coals are deposited in stagnant, oxygen-depleted waters on land. They are
usually rich in oil-generating lipid organic matter derived from plant resins, pollen, spores, plant waxes
and the corky tissues of vascular plants. The individual deposits usually are small in size, but they can be of
a very high grade.
The latter also holds for lacustrine oil shales. This group of oil shales was deposited in freshwater, brackish
or saline lakes. The size of the organic-rich deposits can be small, or they can occur over tens of thousands
of square kilometres, as is the case for the Green River Formation in Colorado, Utah and Wyoming. The
main oil-generating organic compounds found in these deposits are derived from algae and/or bacteria. In
addition, variable amounts of higher plant remains can be present as well.
Marine oil shales can have been deposited in any marine environment in which a high influx of organic
matter is combined with good preservation conditions and sediment accumulation rates that allow the
concentration of the organic matter. These conditions can be met in the transition zone between land and
sea, in wide, shallow epicontinental seas as well as in poorly ventilated deep oceanic basins such as the
Black Sea. Many of the large oil shale deposits explored so far belong to this group. However, the grade

39
of the deposits usually is low to moderate. The main oil-generating, lipid organic matter found in marine
oil shales originated from algae, unicellular planktonic organisms and dinoflagellates.
The viability of oil shale is dictated by its quality – at Annex D is a detailed description of how oil shale is
assessed and its likely yield.

40
Annex D Quality of oil shales
Depending on the application, the quality of an oil shale is either expressed by its heating value or by the
amount of shale-oil that can be derived from it. The heating value is useful in order to assess the
applicability of the oil shale for direct burning, eg in a power plant. It can be determined using a
calorimeter and reported in one of several thermal units. The most widely used are British Thermal Units
(Btu), kcal/kg or the SI unit J/kg.
The heating value of oil shales is highly variable, but in most cases is substantially less than 3000 kcal/kg.
Compared to other traditional solid fuels, the heating value of oils shale is limited. In the best cases, it is
comparable to that of brown coal or average forest residues, but less than half of that of average
bituminous coal.
Figure 9 Calorific value of selected oil shales compared with the range in calorific values of
lignite and sub-bituminous and bituminous hard coal
Source: Bouchta, 1984; Duncan and Swanson, 1966; Dyni, 2006; Guthrie & Klosky, 1951; ; Jaffé 1962;
Parker, 1962; Thorne and Kreamer 1950; Veiderma, 2001; WEC, 2001
The shale-oil potential can be assessed by retorting on a laboratory scale. The most commonly used
technique is the modified Fisher assay (American Society for Testing and Materials method D-3904-80).
This standard test does not necessarily report the maximal amount of oil that can be distilled from a shale;
nor does it assess the total amount of energy contained in it, as it does not account for the amount of
combustible gasses formed during the retorting process; nor does it determine the calorific value of the
ashes or tarry components left behind. Some newer methods allow a more complete assessment of the
shale-oil potential, eg Rock Eval and material balanced Fisher assay, but the modified Fisher assay is widely
used in oil shale exploration and is therefore well suited for comparison between different deposits. The

41
quality classification of the oil shale resources discussed below therefore has been based on standard
Fisher assay data.
As for the calorific value, the explored deposits reveal a wide range in shale-oil yields (Figure 9). Based on
the average amount of shale-oil that can be produced by retorting, the deposits are grouped in four
categories. Shales that yield less than 45l of shale-oil per tonne are classified as marginal resources. These
oil yields most probably are too low to justify future exploitation.
Shales with a shale-oil potential of 45 to 90l/tonne are classified as low grade deposits. Exploitation of
these deposits may be possible with existing technologies or with one of the advanced technologies that
are currently being developed. Under certain conditions, exploitation is possible today. An example is the
Chinese Fushun oil shale, which is mined by surface methods together with coals from the underlying
Gushengzi Formation (Johnson, 1990).
Shales that on average yield between 90 and 150l/tonne are classified as moderate grade. As with low
grade deposits, most of these deposits cannot be commercially exploited nowadays, but it is anticipated
that a large part of these resources may become exploitable with higher oil prices and/or when advanced
extraction techniques become available. At least one of the moderate grade deposits, the Stuart oil-shale
deposit in eastern Queensland, Australia is under development. At the end of stage 1, the project has
been postponed for an undefined period of time, for a throughout evaluation of the results. Points to be
assessed are the environmental impact and the economy of the retorting process. Furthermore, Shell and
Chevron are running tests in order to unlock the vast resources contained in the Green River Formation in
Colorado, Utah and Wyoming using advanced extraction techniques.
Rich oil shale deposits yield more than 150l of shale-oil per tonne. Exploitation of many of these deposits
may be possible with presently available technologies and under current conditions. An example is the
Baltic Kukersite deposits. Oil shales of the Estonia Formation are mined by open pit mines and in
underground room-and-pillar mines in northeast Estonia and in the adjacent St. Petersburg region
(Russia). More than 80% of the shales is used as a solid fuel in power plants. The remaining 20% is used
for the production of shale-oil, heat and cement.
According to Estonian standards, active reserves have to comply with four criteria. First of all, the deposit
should lie in an area with no environmental restrictions. Moreover, the energy rating should be at least
35GJ/m2 and the calorific value of the commercial oil shale beds should be at least 8MJ/kg for shales used
for power generation and heating, and 11MJ/ton for shale-oil retorting (Veiderma, 2003). Finally, the
commercial depth of open-pit mines lies near 30 m. For underground mines, the present commercial
depth-range is 60 m.
The contribution of each of the four quality groups to the total resources listed in chapter 1.5 is shown in
Figure 10. More than two-thirds of the resources are of marginal or low grade, ie yield is less than 90l per
tonne of oil shale. The high grade deposits account for only 1% of the inventoried deposits. In the light of
the abundance of marginal to low grade deposits, it can be concluded that the current potential for the
economic exploitation of the resources is limited. This may change in the future as new exploitation
techniques become available or as the socio-economic/environmental conditions change.

42
Figure 10 Grade of the global oil shale deposits in litres per tonne
Source: Bouchta, 1984; Duncan and Swanson, 1966; Dyni, 2006; Guthrie & Klosky, 1951; ; Jaffé 1962;
Parker, 1962; Thorne and Kreamer 1950; Veiderma, 2001; WEC, 2001
Grade of the global oil shale depositsTotal shale-oil resource: 3.170 billion barrels
< 45 l/t25%
45 - 90 l/t43%
90 - 150 l/t31%
> 150 l/t1%
< 45 l/t
45 - 90 l/t
90 - 150 l/t
> 150 l/t

43
Annex E Estonian oil shale
E.1 Estonian oil shale deposits and mining
Estonian oil shale is a sedimentary rock, containing hydrogen-rich organic matter – kerogen – springing
from lower organisms of Upper Ordovician waters. The kukersite oil shale has to be distinguished from
the graptolite argillite, known as the Dictyonema shale, from Lower Ordovician, also widely distributed in
Estonia. The latter was proved as a raw material for uranium.
The reserves of the Estonian deposit lying in the area of about 2000 km2 make nearly 5 Gt, including 1.5
Gt of active reserves (in the areas with no environmental restrictions, the energy rating is at least
35GJ/m2). Southward and westward the depth of oil shale bed increases, its thickness decreases and
quality becomes lower. The reserves located between 35 and 25GJ/m2 lines form passive reserves (in the
amount of 2 Gt). The map of Estonian oil shale deposits is presented in Figure 11.
Figure 11 Estonian oil shale reserves by fields and structure of the layer
a) 1 – outcrop line of the shale bed; 2 – exhausted areas; 3 – operating mines and opencasts; 4 – mine
field boundary; 5 – county boundary; 6 – boundaries of parts of Estonia deposit; 7 – southern boundary of
Estonia deposit; 8 – active reserve; 9 – passive reserve
b) 1- limestone, 2 – limestone kerogeneous, 3 – oil shal, thickness of the layer 2-3m
Source: Vello Kattai et. al., Eesti Põlevkivi (Estonian Oil Shale), 2000
The Estonian oil shale forms a peculiar class among the world oil shale resources. The organic matter of oil
shale (kerogen) represents a mixture of high-molecular polyfunctional organic compounds, the real
structure of which is yet a subject of studies. Specific for Estonian oil shale is the relatively high content of
oxygen and chlorine. Usually the content of kerogen in the oil shale bedrock is 30–40%. The mineral part
of oil shale consists of carbonates, sandy-clayey minerals, pyrites, and others. The characteristics of
Estonian oil shale are presented in Table 5.
a) b)

44
Table 5 Characteristics of Estonian oil shale
Oil shale kerogen Shale oil
Carbon, % 76.5–77.5 81.7
Oxygen, % 9.0–11.5 6.8
Hydrogen, % 9.4–9.9 10.5
Sulphur,% 1.2–2.0 0.7
Nitrogen,% 0.2–0.5 0.3
Chlorine, % 0.5–0.9
Calorific value , MJ/kg 37.2 36–40
Oil yield, % 67.8
Commercial oil shale
Kerogen, % dry basis 30–50
Mineral part, % dry basis 50–70
Moisture, % 10–15
Calorific value, MJ/kg 8.7
Source: Veiderma, M. (2003) Estonian oil shale – resources and usage. Oil Shale 20(3), 295-303
The quality characteristics of commercial oil shale depend on the composition of the oil shale bed, mining
technology (bed as whole or selective mining, impoverishment by rock of neighbouring layers, etc.),
results of enrichment and the purpose of oil shale use.
The quality of Estonian oil shale may be rated as one of the best in the world, but preserving the quality
level in the longer perspective will become still more difficult because the mining activities will advance
towards the peripheral part of the deposit. To date, 1 Gt of oil shale has been mined in Estonia. The
mining activities reached a maximum (30 Mt per year) in the early 80s. In 2004 the production of oil shale
was 14 Mt.
When the quality of mined oil shale does not correspond to the requirements of consumers, oil shale is
enriched by either jigging or beneficiation in heavy suspensions. Recultivation and reforestation of
exhausted opencast areas is progressing. The problems and difficulties in the mining complex are
connected with big losses of oil shale at mining and enrichment (20-30%), voluminous dewatering (25m3
water per tonne of oil shale) and changes in the hydrogeological condition of surroundings, later setting
of the surface above closed mines.
More than 80% of mined oil shale is used in power production, the rest for processing to oil. The ratio of
oil shale mined in underground mines and opencasts (at a depth up to 30m) is about 50:50 with a
decreasing tendency towards opencasts in the future conditioned by the increase of the oil shale bed
depth. The selling price of oil shale is 133 EEK/t (8.5 EUR/t)

45
E.2 Power production from Estonian oil shale
Estonia is the only country in the world that uses oil shale to generate electricity. It started in the 1940s
with middle-pressure pulverised combustion, introduced high-pressure pulverised combustion (PC) at the
end of the 1950s and commissioned a circulated fluidised bed (CFB) plant in 2005. As of the end of 2005,
the installed electric capacity of Estonian power plants using oil shale was 2 380MW. Thanks to the high
Ca/S ratio in Estonian oil shale, part of the SO2 formed by combustion is bound by ash – 80% of the SO2
in the case of pulverized combustion, and almost 100% in the case of fluidised bed combustion.
Implementation of two fluidized-bed combustion reduced SO2 emissions from 80 Kt/yr in the early 2000s
to 55 Kt/yr in 2005. Fluidized bed combustion block is characterized also by higher efficiency (net 36.6%),
compared with 30% for pulverized combustion block. Carbon dioxide emission of oil shale combustions is
the highest among primary fuels (0.106 Kt CO2/TJ). Utilisation of ash (for the production of cement,
autoclaved concrete elements, neutralizing of acid soils, etc.) has decreased and now accounts for a small
part of the ash output, mainly for the efficiency and quality reasons. Storing and making harmless huge
amounts of alkaline ash is a complicated and as yet unresolved problem.
Electricity production reached its peak in 1980 (18.9 TWh). From that time it has been gradually
decreasing and stabilized in the early 2000s. Currently oil shale-based electricity production is about 9.5
TW, which guarantees self-sufficient electricity supply at a temperate price for Estonia. Oil shale covers
60% of the country’s primary energy demand and more than 90% of electricity production. The
production cost of oil shale based electricity has stayed in the last years on the level 410 EEK/MWh (26.2
EUR/MWh). An increase in environmental and recourse taxes is planned.
Oil shale power is competitive in the Baltic region. Estonia continues to develop the technology for the
production of electricity from oil shale and launches sales to the Finnish electricity market in 2007. The
developments and forthcoming plans of power and heat production from oil shale in Estonia are
presented in Table 6 and emissions from oil shale fired power plants are presented in Table 7.
Table 6 Development of power and heat production from oil shale in Estonia
Construction date Plant MW electricity MW heat
1930s Tallinn 11
1949–1967 Kohtla-Järve 39 534
1952–1957 Ahtme 20 338
1959–1971 Balti
1624
inc. 4 blocks at 200 MWe
and 8 blocks at 100 MWe
pulverized firing boilers
686
1969–1973 Eesti 1610
inc. 8 blocks at 200 MWe
pulverized firing boilers
84
1995 renovation of turbines, extra repairs of boilers, new electrostatic
precipitators, demolition of old blocks
2004 two 215 MW Circulated Fluidized Bed (CFB) units commissioned in
Balti and Eesti Power Plant

46
Forthcoming
2009 Reconstruction of ash handling systems and bringing ash landfills in
compliance with landfill directive
2012 2 x 300 MW CFB blocks to be commissioned
2012 SO2 total emissions have to be decreased to 25 Kt/year
2016 LCP directive requirement has to be applied power plants
Source: Veiderma, M. (2003) Estonian oil shale – resources and usage. Oil Shale 20(3), 295-303
Table 7 Emissions from oil shale fired power plants
Pulverized combustion boilers Circulated fluidized burning
boilers
SO2 bound 80 % almost 100 %
SO2 emissions 2000 mg/m3 0 – 20 mg/m3
NOx emissions 300 mg/m3 90 – 170 mg/m3
Fly ash emissions < 200 mg/m3 < 30 mg/m3
Source: Hotta, A., Parkkonen, R., Hiltunen, M., Arro, H., Loosaar, J., Parve, T., Pihu, T., Prikk, A., Tiikma T.
Experience 0f Estonian oil shale combustion based on CFB technology ´at Narva Power Plants. Oil Shale,
22 (.4s), 381-397
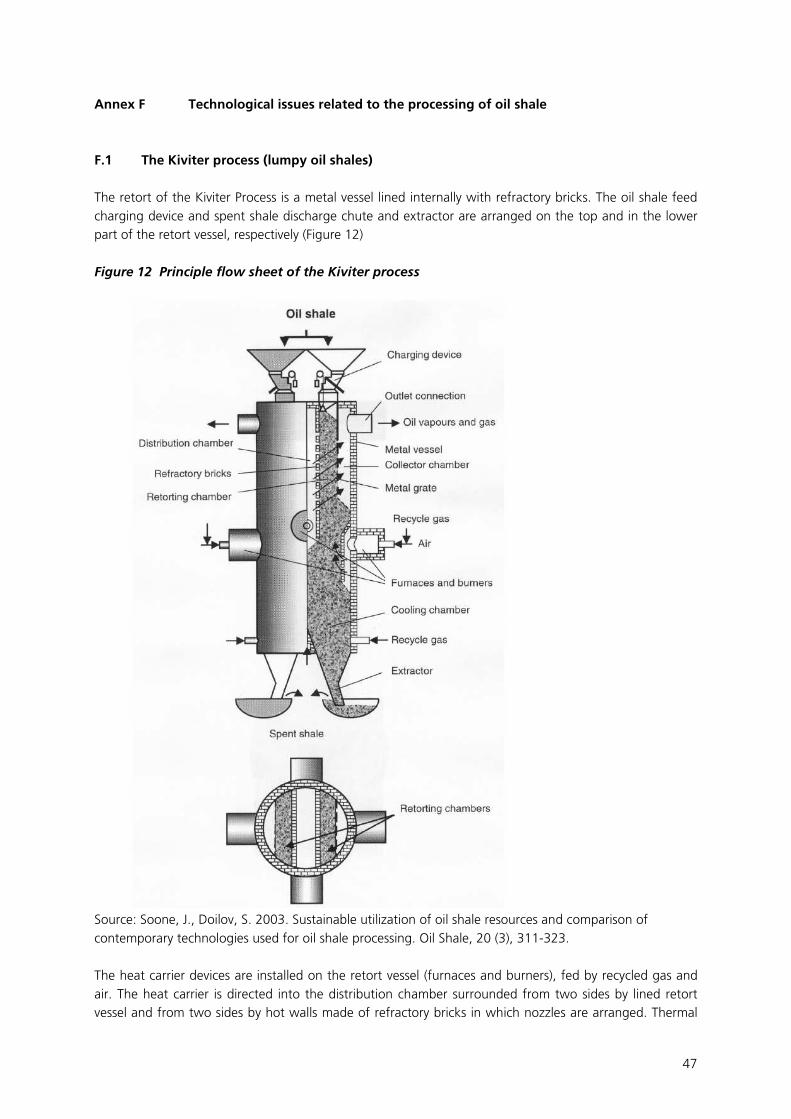
47
Annex F Technological issues related to the processing of oil shale
F.1 The Kiviter process (lumpy oil shales)
The retort of the Kiviter Process is a metal vessel lined internally with refractory bricks. The oil shale feed
charging device and spent shale discharge chute and extractor are arranged on the top and in the lower
part of the retort vessel, respectively (Figure 12)
Figure 12 Principle flow sheet of the Kiviter process
Source: Soone, J., Doilov, S. 2003. Sustainable utilization of oil shale resources and comparison of
contemporary technologies used for oil shale processing. Oil Shale, 20 (3), 311-323.
The heat carrier devices are installed on the retort vessel (furnaces and burners), fed by recycled gas and
air. The heat carrier is directed into the distribution chamber surrounded from two sides by lined retort
vessel and from two sides by hot walls made of refractory bricks in which nozzles are arranged. Thermal

48
processing of oil shale takes place in two retorting chambers surrounded from two sides by filled metal
vessel of the retort, from one side by a refractory brick hot wall provided with nozzles and from the other
side by a metal grate made of vertical tubes. The mixture of heat carrier and oil and water vapour moves
into two collector chambers encircled by lined metal retort vessel and a metal grate made of vertical
tubes. Semicoke (residual shale) moves down towards the cooling chambers. Oil vapours and gas are let
out of the retort via two outlet connections to the condensation system. Calorific value of initial oil shale
is at least 13.8 MJ/kg. The throughput of the retort is 900-1000 tonnes of oil shale per day.
From material and heat balances compiled from long-term operating data of the Kiviter process, the oil
(calorific value 41.0MJ/kg) yield is 17.0-17.5% and the gas yield (at 4.2-5.0 MJ/m3) is 380 - 430m3per ton
of oil shale. The chemical efficiency of the process is in the range of 72-75%. Phenols are separated from
process water and processed into different chemical products. (Soone, J. (2003))
The advantage of the Kiviter process is the compactness of the equipment. The main drawbacks of vertical
retorts such as the Kiviter with cross-flow of the heat-carrier are as follows:
• the need for lumpy oil shales (up to 125mm), which leads to losses in oil shale preparing and
increases the production costs;
• the fact that low-calorific gas is produced;
• the production of large amounts of solid residue (semicoke) (480kg per ton of oil shale), which has a
high content of incompletely retorted organic matter and is hazardous for the environment.
F.2 The Galoter process (fine-grained oil shales)
The Galoter process for thermal processing of oil shales uses fine-grained oil shales (size up to 25mm),
which are heated by a solid heat carrier in a horizontal rotating retort. This kind of semicoking process
does not use gas but the residual organic matter of spent shale for providing the heat needed for
retorting. Combustion of spent shale takes place in a separated aerofountain unit. Besides the main
product – shale oil –gas of high calorific value (39.8 - 46.8MJ/m3) is produced. The residue from
processing is ash, which does not cause such a substantial environmental hazard.
The Galoter process was employed in Estonia at AS Narva Elektrijaamad and thoroughly modernized in
recent decades. Basically the same process from the standpoint of processing method was used in
Australia, but with some major structural changes (ATP). In this case oil shale drying, semicoking and
combustion zones are combined to form a single compact aggregate, avoiding having to transport solid
material over long distances.
The general scheme of the Galoter process is presented in Figure 13. (Petersen, I. 2006)
Oil shale fines (up to 3000t per day) are dried in a separate fluidized bed dryer with a gaseous heat carrier,
produced by combustion of retorting residue. Dry oil shale is mixed with a solid heat carrier – hot ash (750
– 800ºC). The ash is obtained by the combustion of retorting residue in a separate furnace. The mixture of
oil shale and heat carrier is fed into a horizontal rotating retort.
Thermal treatment of oil shale starts in the mixer and continues in the retort. Contact with the heat carrier
results in intensive heavy oil cracking with formation of gas, lighter oil fractions and semicoke. The
semicoke leaving the retort at 460ºC enters the dust chamber to be separated from the gas phase and
then moved to the fountain furnace for burning. (Golubev, N. 2003)

49
Figure 13 Principle flow sheet of the Galoter process
Source: Golubev, N. 2003. Solid oil shale heat carrier technology for oil shale retorting. Oil Shale, 20 (.3),
324-332
F.3 Other retorting processes
The Chinese Fushun type retort is similar to the Estonian Kiviter retort. The retort is of vertical cylindrical
type, with outside steel plate lined with inner fire bricks. The oil shale is fed from the top of the retort at
the upper section (pyrolysis section) of the retort. The oil shale is dried and heated by the hot ascending
gaseous heat carrier, and pyrolyzed. The oil yield of the Fushun retort accounts for about 65% of Fisher
Assay. As the daily capacity of the retort is only 100 – 200 tons, the Fushun type retort is suitable for small
oil shale retorting plants, and for processing lean oil shale with low gas yield.
The Petrosix retort is also a kind of vertical retort. In Brazil, the Petrobras Company at Sao Mateus do Sul
built two Petrosix retorts for processing lumpy oil shale in the 6-50 mm range. The larger retort built in
1991 has a daily capacity of processing 6200 tons of oil shale, the smaller retort built in 1981 has a daily
capacity of 1600 tons. The drawback of this retort is that the potential heat of fixed carbon contained in
the shale coke is not utilized, thus influencing the thermal efficiency. The advantages are that the retort
capacity is high, and the retort off gas has high calorific value because it is not diluted by nitrogen. The
Petrosix retort is suitable for large and middle shale oil plants.
The Alberta Taciuk Process (ATP) is named for its inventor, engineer William Taciuk of UMATAC Industrial
Processes. A portable ATP retort was built with the capacity of 240 tons per day. The ATP retort was
originally developed for pyrolysis of oil sand, but was also suitable for treating oil shale. In 1999,
Australian SPP (Southern Pacific Petroleum) Company utilized Taciuk technology to build a plant at Stuart,
Australia, with the daily capacity of retorting 6000 tons oil shale. The SPP-Taciuk retort is a kind of
horizontal (slightly inclined) cylindrical, rotating retort for processing oil shale in the range 0-25 mm. In
2003, the retort was operated at 60% of plant availability. At the end of 2004, the Stuart plant was shut
Drying
Thermal decomposition
Combustionof retorting
residue
To condensation

50
down and the project was postponed for an undefined period of time. If the ATP retort were used for
normal operations it would be suitable for large and medium scale plants. (Qian, J 2006)
F.4 In-situ Conversion Process (ICP)
In the early 1980s, Shell began laboratory and field research on a novel in-ground conversion and recovery process
called In-situ Conversion Process (ICP) to extract hydrocarbons from oil shale for production of high quality
transportation fuels (e.g. gasoline, jet and diesel fuels). ICP recovers the resource without mining and uses less
water. It has the potential to access deeper, richer and thicker resources without the complications of surface and
subsurface mining.
The ICP uses electrical heaters to heat the oil shale in place. The heating process pyrolyzes the organic matter in
the oil shale and converts this matter into oil and hydrocarbon gas, which is then produced using conventional
pumping and extracting technology. A freeze wall, protecting the ground water from hydrocarbons and
preventing migration of ground water into the area, contains the production zone. The freeze wall is created by
drilling closely spaced holes around the resource target zone and circulating chilled refrigerant through a closed
loop piping in each hole. The refrigerant freezes the water contained in the surrounding rock, forming a
continuous barrier. This technology is commonly applied in the mining and construction industry.
After 6 to 12 months, once the freeze wall has been created, the target zone will be de-watered, preventing
mixing of ground water and hydrocarbons. A series of heater holes are then drilled within the containment zone,
maintaining an approximately 125 feet space between the heater and the freeze wall so that the heating does not
impact the barrier. Produced hydrocarbons are piped to a processing facility.
The ICP process slowly heats the oil shale to more than 300°C over a 3 to 4 year period using electrical resistance
heaters inserted into holes drilled into the reservoir. The typical target depth zone for this work is 1,000–2,000
feet. If viable, ICP allows generating more oil and gas from a smaller surface pad area than previous oil shale
processes.
The heating releases oil and gas from the kerogen contained in oil shale. Still in the reservoir, these hydrocarbons
undergo a series of changes, including the shearing of lighter components and an increase in hydrogen content.
This process is known as pyrolosis. Through fractures in the sub-subsurface, the hydrocarbons are then produced
to the surface.
Since the hydrocarbon mix is much lighter than conventional crudes – they contain almost no heavy ends – they
require fewer processing steps to convert the crude into high quality transportation fuels such as diesel, jet fuel or
naphtha (gasoline). Changing the sub-surface heating time, temperatures and pressures allows the operator to
control the crude quality. Shell found the general production mix from its Colorado oil shale tests to be about two
thirds liquids and one-third natural gas liquids such as propane and butane.
Groundwater protection is central to successful implementation of in-situ technology in deep water-prone oil shale
sections. Shell is testing a technology applied in the mining and construction industry where ice walls are used to
protect tunnels or mines from surrounding water. In its so called Freeze Wall Test, Shell has drilled a pattern of
157 holes into depth of about 2,000 feet and plans to circulate ammonia through a closed-loop pipe system.
Once the water in the surrounding rock is frozen to form a barrier, water is pumped out of the target zone. The
freeze wall not only protects the groundwater from contamination with hydrocarbons, but also prohibits
surrounding water to enter the production zone and reducing the thermal efficiency of the heating process. In its
Freeze Wall Test, Shell aims to test the integrity of the wall and ways to restore the barrier in case of an accidental
breakdown. A decision on whether the ICP is commercially feasible is expected early next decade.
(Source: Dr Harold Vinegar, Shell. www.shell.com/US/mahogony)

51
Annex G The Scottish oil shale industry: reclamation issues
The central Scotland oil shale field (Figure 14) is only a tenth the size of the Estonian oil shale field and has
7 main oil bearing seams. Remaining resources are calculated at 1,100 million tonnes (Cameron &
McAdam, 1978). It was actively exploited between about 1850
and 1962 (see chapter 3.4).
Figure 14 The Central Scotland (West Lothian) oil shale field (Harvie, 2005)
It was particularly noted for the wide range of products in addition to shale oil that were derived from the
raw material. These included motor spirit, which was marketed in the early days of motoring on the basis
that it was, uniquely in that part of the world and at that time, home made.
Waste disposal and reclamation policy and regulation were almost non-existent during the lifetime of the
Scottish oil shale industry, apart from the Clean Air Act. The industrial processes to extract oil were not
pollution threats by the standards of the time, mainly because so many of the waste products were
utilised and recycled within the refining and retorting plants. The greatest 'pollutant' was the waste
material that can still be seen in the massive bings scattered across the county of West Lothian (Figure 15).
These remain because of their financial value as hardcore for road building, and several of the bings are in
the process of being removed for this purpose. Paradoxically, their monetary value has also protected
bings from demolition and landscaping at the end of the 20th century, when reclamation and restoration
of mine waste were fashionable, and the remaining bings are no longer seen as waste heaps.
Figure 15 Greendykes and Five Sisters, two of the remaining bings in West Lothian. Both are
now designated as Historical Industrial Monuments (original photographs B A Harvie)
A
B
C
River Forth
N
A
B
C
River Forth
N
A
B
C
River Forth
N
Key:
oil shale field A Westphalian coal measures B Millstone grit series C Carboniferous limestone series

52
The bings provide much used open space for various recreational pursuits in an increasingly urban area of
Scotland. They are used as an educational resource because of the historical importance of the shale-oil
and other industries (from paraffin to detergent) that created them. Ecologically they exemplify the seres
in primary succession. As a consequence of their unusual physical and chemical structure the bings form
refugia for locally rare fauna and flora and contribute greatly to the biodiversity of the area. They are
home to several nationally (UK) rare and protected plant and animal species (Harvie, 2005). The West
Lothian bings, because they are unique within Scotland (and Britain and Western Europe) are now of
considerable social, ecological and historical importance.
The recently recognised ecological value of the bings in Scotland gives some insight into how reclamation
of spent shale may be best tackled in any future development of above ground oil shale production. In
Central Europe natural succession is relied upon in restoration projects except in the case of especially
toxic substrates (Prach & Pyšek, 2001). It is considered especially advantageous where the disturbed site is
small and surrounded by natural vegetation. There is no indication that lack of available seed sources,
nutrients or nitrogen has any significant effect on invasion and establishment of vegetation (Harvie, 2005).
Naturally dispersed plant species growing on the plateau of Greendykes (95 metres above the surrounding
countryside) have developed into a species for poor calcareous grassland; very unusual vegetation in
Scotland (Figure 16).
The climatic conditions in Central and Eastern Europe are more conducive to rapid invasion than those in
Central Scotland, indicating that reclamation of mine waste from shale oil production is unlikely to be
problematic. Urgent research into the ash wastes from the production of energy from oil shale (as is
practised in Estonia) is now needed to determine the potential for the reclamation of this waste by natural
successional processes.

53
Figure 16 Calcareous grassland on the summit of Greendykes and some examples of rare flora,
fauna and habitats recorded on the bings (original photographs B A Harvie)

54
Annex H Bibliography
Bartis, J.T., LaTourrette, T., Dixon, L., Peterson, D.J. & Cecchine, G. 2005. Oil shale development in the
United States. Prospects and policy issues. Prepared for the National Energy Technology Laboratory of
the U.S. Department of Energy by the
Rand Corporation, Santa Monica, California
Bsieso, M.S., 2003. Jordan’s experience in oil shale studies employing different technologies. Oil Shale,
2003, Vol. 20, No. 3 Special, pp. 360-370
BLM Colorado 2006. Land use planning Meeker, Colorado. White River field office planning. Available
from: http://www.co.blm.gov/wrra/nepa.htm [[date accessed 15th November 2006]
Bouchta, R. 1984. Valorization studies of Moroccan oil shales. Office Nationale de Recherches et
Exploitations Pétrolières, B.P. 774, Rabat, Morocco; 28p.
Bureau of Reclamation, 2005. “Colorado River Basin Salinity Control Program Overview,” U.S.
Department of the Interior, available at http://www.usbr.gov/dataweb/html/crwq.html
Cadman, W.H., 1948. The oil shale deposits of the world and recent developments in their exploitation
and utilization, reviewed to May 1947. Int. Petroleum Journal 34: 109 - 132.
Calvert, C. 2005. The vast North American resource potential of oil shale, oil sands and heavy oils – part
2. Available from: http://www.doi.gov/ocl/2005/OilShale063005.htm [date accessed 17th November
2006]
Cameron, I.B. & McAdam, A.D. 1978. The oil-shales of the Lothians, Scotland: present resources and
former workings. Report of the Institute of Geological Sciences 78/28. Her Majesty’s Stationery Office,
London
Caruso, G. 2005. When will world oil production peak? 10th Annual Asia oil & gas conference, Kuala
Lumpur, Malaysia. June 13th, 2005. Available from:
http://www.api.org/aboutoilgas/security/upload/caruso2005.pdf [date accessed 18th December 2006]
CERA [Cambridge Energy Research Associates] (2006) Peak oil theory – “world running out of oil soon” –
is faulty; could distort policy and energy debate. Available from:
http://www.cera.com/aspx/cda/public1/news [date accessed 17th November]
Directive 2004/74/EC of 29 April 2004 amending Directive 2003/96/EC as regards the possibility of certain
Member States to apply, in respect of energy products and electricity, temporary exemptios or reductions
in the levels of taxation
Directive 2004/85/EC amending Directive 2003/54/EC of the European Parliament and of the Council
(Electricity market) as regards the application of certain provisions to Estonia
DTI [Department of Trade and Industry] (2006) Towards FP7. Available from:
http://fp6uk.ost.gov.uk/fp7/page.aspx?sp=2569 [date accessed 15th November 2006]
Dyni, J.R., 1988. Review of the geology and shale-oil resources of the Tripolitic oil-shale deposits of Sicily,
Italy. U.S. Geological Survey, Open file report 88-270, 23p.

55
Dyni., J. R. 2001. A new era for oil shale development. Oil Shale 18 (4). 279-280.
Dyni, J.R., 2003. Geology and resources of some world oil-shale deposits. Oil Shale 20: 193 - 252.
Dyni, J.R., 2006. Geology and resources of some world oil-shale deposits. U.S. Geological Survey Scientific
Investigations Report 2005-5294, 42p.
Duncan, C.D. & Swanson, V.E., 1966. Organic-rich shale of the United States and World land areas. U.S.
Geological Survey, U.S. Government Printing Office: 1966 O - 206-429, 30p.
FuturePundit 2005 Shell oil shale extraction technology economically viable? Available from:
http://futurepundit.com/archives/002981.html [date accessed 17th November]
Gerling, J.P. (2004) Non conventional hydrocarbons – where, what and how much? Fossil fuels: reserves
and alternatives – a scientific approach (Eds L.C van Geuns & L.A. Groen).Royal Netherlands Academy of
Arts and Sciences, Amsterdam
Golubev, N. 2003. Solid oil shale heat carrier technology for oil shale retorting. Oil Shale, 20 (.3), 324-332
Green Car Congress September 2005 http://www.greencarcongress.com/2005/09shell_to_take6.html
Guthrie, B. & Klosky, S., 1951. The oil-shale industries in Europe. U.S. Bureau of Mines, Report
Investigation 4776, 73p.
Harney, B. M. 1983. Oil from Shale: An Analysis of Technology, Economics and Future, New York: Marcel
Dekker, Inc.
Harvie, B.A. 2005. The mechanisms and processes of vegetation dynamics on oil-shale spoil bings in West
Lothian, Scotland. Available from: http://www.era.lib.ed.ac.uk/handle/1842/640 [date accessed: 11th
November 2006]
Hotta, A., Parkkonen, R., Hiltunen, M., Arro, H., Loosaar, J., Parve, T., Pihu, T., Prikk, A., Tiikma T.
Experience 0f Estonian oil shale combustion based on CFB technology ´at Narva Power Plants. Oil Shale,
22 (.4s), 381-397
Hutton, A.C, 1987. Petrographic classification of oil shales. International Journal of Coal Geology 8: 203-
231.
Jaffé, F.C., 1962. Oil shale, nomenclature, uses, reserves and production. Colorado School of Mines,
Mineral Industries Bulletin 5(2), 11p.
Johnson, E.A., 1990. Geology of the Fushun coalfield, Liaoning province, People's Republic of China.
International Journal of Coal Geology 14: 217 - 236.
Johnson, H.R., Crawford, P.M., Bunger, J.W., 2004a. Strategic significance of America's oil shale resource.
Volume I: Assessment of strategic issues. Office of Strategic Petroleum Reserves, U.S. Department of
Energy, contract DE- AC01-03FE67758.

56
Johnson, H.R., Crawford, P.M., Bunger, J.W., 2004b. Strategic significance of America's oil shale resource.
Volume II: Oil shale resources Technology and Economics. Office of Strategic Petroleum Reserves, U.S.
Department of Energy, contract DE-AC01-03FE67758.
Kattai, V., Saadre, T.,Savitski, L. 2000. Eesti põlevkivi (Estonian oil shale), Tallinn
Kerr, D. 1994. Shale oil: Scotland. The world’s pioneering oil industry. The author, Edinburgh
Killops, S.D. & Killops, V.J., 1993. An introduction to organic geochemistry. Longman Scientific &
Technical, Essex, England, ISBN 0-582-08040-1.
Kinnunen, P., 2003. Aspects considered in new CFB boiler design for Narva power plants. Oil Shale, 2003,
Vol. 20, No. 3 Special, pp. 371 - 374.
Laherrere, J. 2005. Review on oil shale data. Available from: [date accessed 10th November 2006]
Levine, R.M. 1997. The mineral industry of Estonia. U.S. Geological Survey, minerals Information.
Miller, G.A., 1987. Development of the oil shale and associated minerals. In: Taylor, O.J. (ed.) Oil shale,
water resources and valuable minerals of the Pinceance Basin, Colorado. USGS professional paper 1310,
U.S. Gov. Printing Office, Washington D.C.
Ministry of Economic Affairs and Communications, Estonia, 2004. Long-term public fuel and energy
sector development plan until 2015
Murray, D. K., (Ed.), 1974. Energy Resources of the Piceance Creek Basin, Colorado: Rocky Mountain
Association of Geologists, Twenty-fifth Field Conference, Denver
Ots, A. 2006. Oil Shale fuel combustion, Tallinn.
Parker, A., 1962. Survey of energy resources. World Power Conference, London, 68p.
Parliamentary Office of Science and Technology, UK, October 2006. Postnote, number 268 Carbon
footprint of electricity generation
Perens, R., Punnng, J-M., Reinsalu, E. Water problems connected with oil shale mining in north-east
Estonia. Oil Shale, 2006, Vol. 23, No. 3, pp. 228-235
Petersen, I. Presentation in WEC Executive Assembly 2006 in Tallinn. The Unique Experience of Oil Shale
Utilization at Narva Power Plants. (http://www.wec-
estonia.ee/energy_day/fscommand/Ilmar_Petersen_WEC.pdf)
Prach, K. & Pyšek, P. 2001. Using spontaneous succession for restoration on human-disturbed habitats:
Experience fron Eastern Europe. Ecological Engineering 17, 55-62
Qian, J., Wang, J. World oil shale retorting technologies. International Conference on Oil Shale: “Recent
Trends In Oil Shale”, 7 -9 November 2006, Amman,Jordan.
Schmidt, S.J., 2003. New directions for shale oil: path to a secure new oil supply well into this century. Oil
Shale, 2003, Vol. 20, No. 3 Special, pp. 333-348.

57
Schnepf, R. 2006. European Union biofuels policy and agriculture: An overview. CRS report for Congress,
order code RS22404.
Snyder, Robert E. August 2004. Oil shale back in the picture, World Oil Magazine.
Soone, J., Doilov, S. 2003. Sustainable utilization of oil shale resources and comparison of contemporary
technologies used for oil shale processing. Oil Shale, 20 (3), 311-323.
Tenno, K. & Laur, A., 2003. Sustainability of oil shale-based electricity production. Oil Shale, 2003, Vol.
20, No. 3 Special, pp. 388-397.
Thorne, H.M. & Kraemer, A.J., 1950. Oil shale in Spain. U.S. Bureau of Mines, Report Investigation 4736,
31p.
Urov K, Sumberg. A., 1999. Characteristics of oil shales and shale-like rocks of known deposits and
outcrops. Monograph. Oil Shale, 16 (3), special , separate pagination: pp. 1-64.
U.S. News 2006. A world awash in oil? Available from
http://www.usnews.com.usnews/biztech/articles/061115/15oil.htm [date accessed 17th November 2006]
Van Regemorter, D., Nijs, W., 2006. “Markal Times, a model to support greenhouse gases”, Belgian
Science Policy, CES KULeuven and VITO, not yet published.
Veiderma, M. 2003. Estonian oil shale – resources and usage. Oil Shale 20(3), 295-303
Veiderma, M. 2004 The USA-Estonian co-operation in oil shale research and utilization. Oil Shale 21(4),
357-360.
Youngquist, W., 1998a. Shale oil - The elusive energy. M. King Hubbert Center for Petroleum Supply
Studies. Hubbert Center Newsletter 98/4.
Youngquist, W. 1998b. Spending our great inheritance – then what? Geotimes July, 24-26
Top Related