


Languages
Pages
Legal

A report on
Chemical Industry
Knowledge and Strategic Partner

Knowledge and Strategic Partner
A report on
Chemical Industry

Knowledge and Strategic Partner
A report on
Chemical Industry

Message MessageFederation ofIndian Chambersof Commerce and Industry
Federation HouseTansen MargNew Delhi 110001
+91 11 2335 7364T +91 11 2332 9369F [email protected]
www.ficci.comCIN: U99999DL1956NPL002635
Dr. A. Didar SinghSecretary General
A. Didar Singh
Industry’s Voice for Policy Change
The Indian Chemical Industry is an integral part of Indian economy . The
industry has key linkages with several other downstream industries such
as agriculture, infrastructure, textiles, food processing etc.
There is need to give focus to and provide support to Knowledge based
segments of the chemical industry namely Speciality Chemicals. This is in view
of the large talent pool in the country, coupled with huge emerging market
resulting from massive urbanization, infra building and increasing aspirations of
emerging middle class. Agrochemicals, Dyes, Food processing chemicals,
Construction chemicals, personal care chemicals are some of such segments.
The sector has huge unrealised potential.
I am happy to note that FICCI jointly with the Department of Chemicals and
Petrochemicals, Government of India and Government of Gujarat is organising
India Chem Gujarat 2015, an event with focus to Speciality Chemicals.
I am sure it will be found useful by all stakeholders.
Federation ofIndian Chambersof Commerce and Industry
Federation HouseTansen MargNew Delhi 110001
+91 11 23738760 (11 lines)T +91 11 23320714 / 23721504F [email protected]
www.ficci.comCIN: U99999DL1956NPL002635
Mr Deepak C MehtaChairman - FICCI National Chemical Committee VC & MD, Deepak Nitrite Ltd
(Deepak C Mehta)
Industry’s Voice for Policy Change
As Chairman of the FICCI National Chemical Committee, I must
congratulate the Department of Chemicals and Petrochemicals,
Government of India, iNDEXTb Government of Gujarat and Federation
of Indian Chambers of Commerce and Industry for the initiative in organising
India Chem Gujarat 2015, with focus to Speciality Chemicals from October 28-30,
2015 at Gandhinagar, Gujarat. It indeed is a very good initiative, as the Speciality
Chemicals sector has a very huge potential for growth.
The key growth drivers for specialty chemicals industry are exports base growth
coupled with increasing domestic demand. The domestic demand is rapidly
increasing due to growth in end use industries and application (per capita
consumption) growth. Approx. 300 million Indian middle class consumers need
more high-quality end products (e.g. high quality textiles, cosmetics, high-end
paints, paper etc.) and in order to improve quality of end products, product
manufacturers need to consume more high-end specialty chemicals
I wish the event all the success.
This report on Indian Chemical and Petrochemical Industry is a part of FICCI and
TATA Strategic Management Group (TSMG) Chemical Practice's endeavor to
highlight the utility of Chemicals in day-to-day life.
From increased agricultural productivity and better cure for human diseases to smoother
skin creams and sparkling toothpaste, chemicals play a vital role in everyday life. They
are making 21st century living more enriching by contributing towards building energy-
efficient homes, more comfortable bedding, longer-lasting paints and affordable
clothing. While there are negative perceptions about the chemical industry due to
concerns over sustainability and pollution, the chemical industry is working hard to find
solutions for many of the issues that a rising population presents to the society.
The report highlights the importance of chemicals in everyday life by taking the reader
through the key sub-segments- viz. Petrochemicals, Agrochemicals, Fertilizers and
Specialty Chemicals. It analyses the impact that each of these sub segments have in
terms of the critical challenges they address that contributes towards economic, social or
industrial activity and impact on other sectors within the chemical industry.
Gujarat is at the forefront in chemicals industry and today known as the 'Petro Capital' of
India. It contributes production of 62% of petrochemicals, 51% of chemicals and 35% of
pharmaceuticals of the country's total manufacturing. Its business friendly policies have
made it the first choice for investors.
As always, it was very insightful experience for FICCI and Tata Strategic (Chemicals)
team to materialize this report. We hope it acts as a guiding light for the players in the
chemical industry of India.
Foreword
Manish PanchalPractice Head – Chemical & Energy Tata Strategic Management Group
P S SinghHead- Chemicals & Petrochemicals
Knowledge and Strategy Partner 01
Table of Contents
Karthikeyan.K.SPrincipal – Chemical
Tata Strategic Management [email protected]
1. Executive Summary . . . . . . . . . . . . . . . . . . . . . . . . . . . . . . . . . . . . . . . . . . . . . . . . . . . . . . 01
2. Gujarat: An Investment Destination . . . . . . . . . . . . . . . . . . . . . . . . . . . . . . . . . . . . . . 10
CHEMICAL INDUSTRY SECTORIAL REPORT
3. Bulk Chemicals . . . . . . . . . . . . . . . . . . . . . . . . . . . . . . . . . . . . . . . . . . . . . . . . . . . . . . . . . . 16
4. Petrochemicals . . . . . . . . . . . . . . . . . . . . . . . . . . . . . . . . . . . . . . . . . . . . . . . . . . . . . . . . . . 21
5. Speciality Chemicals . . . . . . . . . . . . . . . . . . . . . . . . . . . . . . . . . . . . . . . . . . . . . . . . . . . . . 25
6. Fertilizers . . . . . . . . . . . . . . . . . . . . . . . . . . . . . . . . . . . . . . . . . . . . . . . . . . . . . . . . . . . . . . . . 28
7. Agrochemicals . . . . . . . . . . . . . . . . . . . . . . . . . . . . . . . . . . . . . . . . . . . . . . . . . . . . . . . . . . . 30
8. Reverse SEZ - An opportunity for Indian Chemicals & . . . . . . . . . . . . . . . . . . . 33
Petrochemicals Industry
9. Crop Protection Chemicals industry-Imperatives of growth. . . . . . . . . . . . . . . 36
10. About Tata Strategic . . . . . . . . . . . . . . . . . . . . . . . . . . . . . . . . . . . . . . . . . . . . . . . . . . . . . 38
Tata Strategic Contacts. . . . . . . . . . . . . . . . . . . . . . . . . . . . . . . . . . . . . . . . . . . . . . . . . . . 39
11. About FICCI. . . . . . . . . . . . . . . . . . . . . . . . . . . . . . . . . . . . . . . . . . . . . . . . . . . . . . . . . . . . . . 40
LIST OF FIGURES AND TABLES
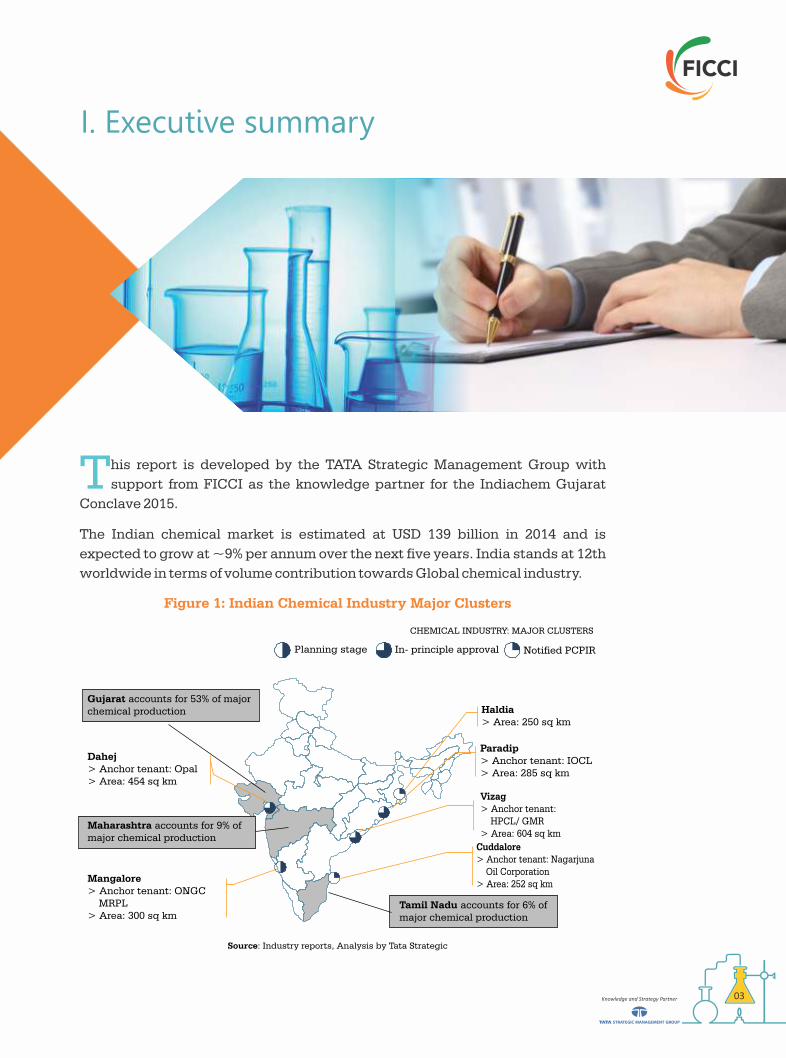
This report is developed by the TATA Strategic Management Group with
support from FICCI as the knowledge partner for the Indiachem Gujarat
Conclave 2015.
The Indian chemical market is estimated at USD 139 billion in 2014 and is
expected to grow at ~9% per annum over the next five years. India stands at 12th
worldwide in terms of volume contribution towards Global chemical industry.
I. Executive summary
Knowledge and Strategy Partner02 Knowledge and Strategy Partner 03
CHEMICAL INDUSTRY: MAJOR CLUSTERS
Gujarat accounts for 53% of major chemical production
Tamil Nadu accounts for 6% of major chemical production
Dahej> Anchor tenant: Opal> Area: 454 sq km
Mangalore> Anchor tenant: ONGC MRPL> Area: 300 sq km
-
Vizag> Anchor tenant: HPCL/ GMR> Area: 604 sq km
Paradip> Anchor tenant: IOCL> Area: 285 sq km
Haldia> Area: 250 sq km
Notified PCPIRIn- principle approvalPlanning stage
Source: Industry reports, Analysis by Tata Strategic
Maharashtra accounts for 9% of major chemical production
Cuddalore> Anchor tenant: Nagarjuna Oil Corporation> Area: 252 sq km
Figure 1: Indian Chemical Industry Major Clusters
Figure 1 : Indian Chemical Industry Major Clusters . . . . . . . . . . . . . . . . . . . . . . . . . 3
Figure 2 : Demand & Supply for Major Chemicals & Petrochemicals . . . . . . . . . . . 5
Figure 3 : Import & Export of Major Chemicals & Petrochemicals . . . . . . . . . . . . . . 5
Figure 4 : Projected Market Growth till FY25 . . . . . . . . . . . . . . . . . . . . . . . . . . . . . . . 6
Figure 5 : Market share of sub-segments. . . . . . . . . . . . . . . . . . . . . . . . . . . . . . . . . . . 6
Figure 6 : Chemical Industry Future Outlook . . . . . . . . . . . . . . . . . . . . . . . . . . . . . . . 7
Figure 7 : Gujarat's Contribution to Indian Economy . . . . . . . . . . . . . . . . . . . . . . . . 10
Figure 8 : Contribution of Gujarat to India . . . . . . . . . . . . . . . . . . . . . . . . . . . . . . . . 11
Figure 9 : Leading Chemical players in Gujarat . . . . . . . . . . . . . . . . . . . . . . . . . . . . 12
Figure 10 : Overview of Chemical Industry in Gujarat . . . . . . . . . . . . . . . . . . . . . . . 12
Figure 11 : Comparison of Infrastructure . . . . . . . . . . . . . . . . . . . . . . . . . . . . . . . . . . . 14
Figure 12 : Integrated Approach. . . . . . . . . . . . . . . . . . . . . . . . . . . . . . . . . . . . . . . . . . 15
Figure 13 : Demand & Supply Scenario of Organic Chemicals . . . . . . . . . . . . . . . . . 17
Figure 14 : Import-Export Scenario of Organic Chemicals. . . . . . . . . . . . . . . . . . . . . 17
Figure 15 : Demand & Supply Scenario of Inorganic Chemicals . . . . . . . . . . . . . . . . 18
Figure 16 : Import-Export Scenario of Inorganic Chemicals . . . . . . . . . . . . . . . . . . . 19
Figure 17 : Supply-Demand Scenario of Basic Major Petrochemicals . . . . . . . . . . . 21
Figure 18 : Import-Export Scenario of Basic Major Petrochemicals . . . . . . . . . . . . . 22
Figure 19 : Petrochemical Industry Future Outlook . . . . . . . . . . . . . . . . . . . . . . . . . . 23
Figure 20 : Speciality Chemicals Industry Future Outlook . . . . . . . . . . . . . . . . . . . . 25
Figure 21 : Total Production & Consumption scenario of Fertilizers . . . . . . . . . . . . . 28
Figure 22 : Indian Crop Protection Industry Outlook . . . . . . . . . . . . . . . . . . . . . . . . . 31
LIST OF FIGURES AND TABLES
This report is developed by the TATA Strategic Management Group with
support from FICCI as the knowledge partner for the Indiachem Gujarat
Conclave 2015.
The Indian chemical market is estimated at USD 139 billion in 2014 and is
expected to grow at ~9% per annum over the next five years. India stands at 12th
worldwide in terms of volume contribution towards Global chemical industry.
I. Executive summary
Knowledge and Strategy Partner02 Knowledge and Strategy Partner 03
CHEMICAL INDUSTRY: MAJOR CLUSTERS
Gujarat accounts for 53% of major chemical production
Tamil Nadu accounts for 6% of major chemical production
Dahej> Anchor tenant: Opal> Area: 454 sq km
Mangalore> Anchor tenant: ONGC MRPL> Area: 300 sq km
-
Vizag> Anchor tenant: HPCL/ GMR> Area: 604 sq km
Paradip> Anchor tenant: IOCL> Area: 285 sq km
Haldia> Area: 250 sq km
Notified PCPIRIn- principle approvalPlanning stage
Source: Industry reports, Analysis by Tata Strategic
Maharashtra accounts for 9% of major chemical production
Cuddalore> Anchor tenant: Nagarjuna Oil Corporation> Area: 252 sq km
Figure 1: Indian Chemical Industry Major Clusters
Figure 1 : Indian Chemical Industry Major Clusters . . . . . . . . . . . . . . . . . . . . . . . . . 3
Figure 2 : Demand & Supply for Major Chemicals & Petrochemicals . . . . . . . . . . . 5
Figure 3 : Import & Export of Major Chemicals & Petrochemicals . . . . . . . . . . . . . . 5
Figure 4 : Projected Market Growth till FY25 . . . . . . . . . . . . . . . . . . . . . . . . . . . . . . . 6
Figure 5 : Market share of sub-segments. . . . . . . . . . . . . . . . . . . . . . . . . . . . . . . . . . . 6
Figure 6 : Chemical Industry Future Outlook . . . . . . . . . . . . . . . . . . . . . . . . . . . . . . . 7
Figure 7 : Gujarat's Contribution to Indian Economy . . . . . . . . . . . . . . . . . . . . . . . . 10
Figure 8 : Contribution of Gujarat to India . . . . . . . . . . . . . . . . . . . . . . . . . . . . . . . . 11
Figure 9 : Leading Chemical players in Gujarat . . . . . . . . . . . . . . . . . . . . . . . . . . . . 12
Figure 10 : Overview of Chemical Industry in Gujarat . . . . . . . . . . . . . . . . . . . . . . . 12
Figure 11 : Comparison of Infrastructure . . . . . . . . . . . . . . . . . . . . . . . . . . . . . . . . . . . 14
Figure 12 : Integrated Approach. . . . . . . . . . . . . . . . . . . . . . . . . . . . . . . . . . . . . . . . . . 15
Figure 13 : Demand & Supply Scenario of Organic Chemicals . . . . . . . . . . . . . . . . . 17
Figure 14 : Import-Export Scenario of Organic Chemicals. . . . . . . . . . . . . . . . . . . . . 17
Figure 15 : Demand & Supply Scenario of Inorganic Chemicals . . . . . . . . . . . . . . . . 18
Figure 16 : Import-Export Scenario of Inorganic Chemicals . . . . . . . . . . . . . . . . . . . 19
Figure 17 : Supply-Demand Scenario of Basic Major Petrochemicals . . . . . . . . . . . 21
Figure 18 : Import-Export Scenario of Basic Major Petrochemicals . . . . . . . . . . . . . 22
Figure 19 : Petrochemical Industry Future Outlook . . . . . . . . . . . . . . . . . . . . . . . . . . 23
Figure 20 : Speciality Chemicals Industry Future Outlook . . . . . . . . . . . . . . . . . . . . 25
Figure 21 : Total Production & Consumption scenario of Fertilizers . . . . . . . . . . . . . 28
Figure 22 : Indian Crop Protection Industry Outlook . . . . . . . . . . . . . . . . . . . . . . . . . 31

Knowledge and Strategy Partner 05Knowledge and Strategy Partner04
Gujarat, Maharashtra and Tamilnadu are leading the charge being the major
chemical manufacturers in the country. The key driver being the significant
coastlines the states are endowed with (Fig 1). The country's chemical industry
has the potential to reach USD 214 billion by FY19 growing at a CAGR of ~9%.
The growth is expected to be driven by rising demandin end-use segments and
expanding exports fuelled by increasing export competitiveness. The success,
however, will depend on how well it's key challenges are addressed such as high
dependence on imports, small installed capacities, low focus on technology up-
gradation and the availability of vocationally trained manpower.
1.1 Chemicals - A way of Life!
Chemical industry is the responsible for converting raw materials like water,
crude oil, natural gas, air, metals, and minerals, etc. into other valuable products.
It is involved in almost every industrial process and therefore plays a significant
role in global economic and social development. R&D in the field of chemistry is
now focusing on rendering a green and sustainable solution for the long run.
Thus, chemistry might come across as a complicated theory but in true essence it
has offered products and solutions for virtually all sectors of economy. Hence,
Chemicals are truly a way of life, it has simplified our way of living as compared to
the past; and have also fostered comfort and growth in human lifestyle.
1.2 Chemical Industry
I. Overview
With immense thrust on knowledge building and an inherently capital intensive
nature, the Chemical industry has a significant role to play in the global economic
and social development. It is also a highly human resource intensive industry
employing a large number of people. Globally, nearly 20 million people are
employed in this industry. The diversification within the chemical industry is
large and covers more than 80000 commercial products with myriad applications
that one needs to only look around oneself to gauge how deeply connected one is
to the world of chemicals
Over the last few decades, the chemical industry has seen an increasing shift
towards Asia. This is in line with shift of key consumer industries (e.g.
Automotive, Electrical and Electronics) towards Asia. Looking particularly
towards the Indian chemical industry, it stands out to be the 3rd largest producer
in Asia. The chemical industry in India has started to evolve rapidly since the last
five years. Despite its large size and significant GDP contribution, the industry
accounted for ~3.4% of the global chemicals industry (~USD 4 Trillion).
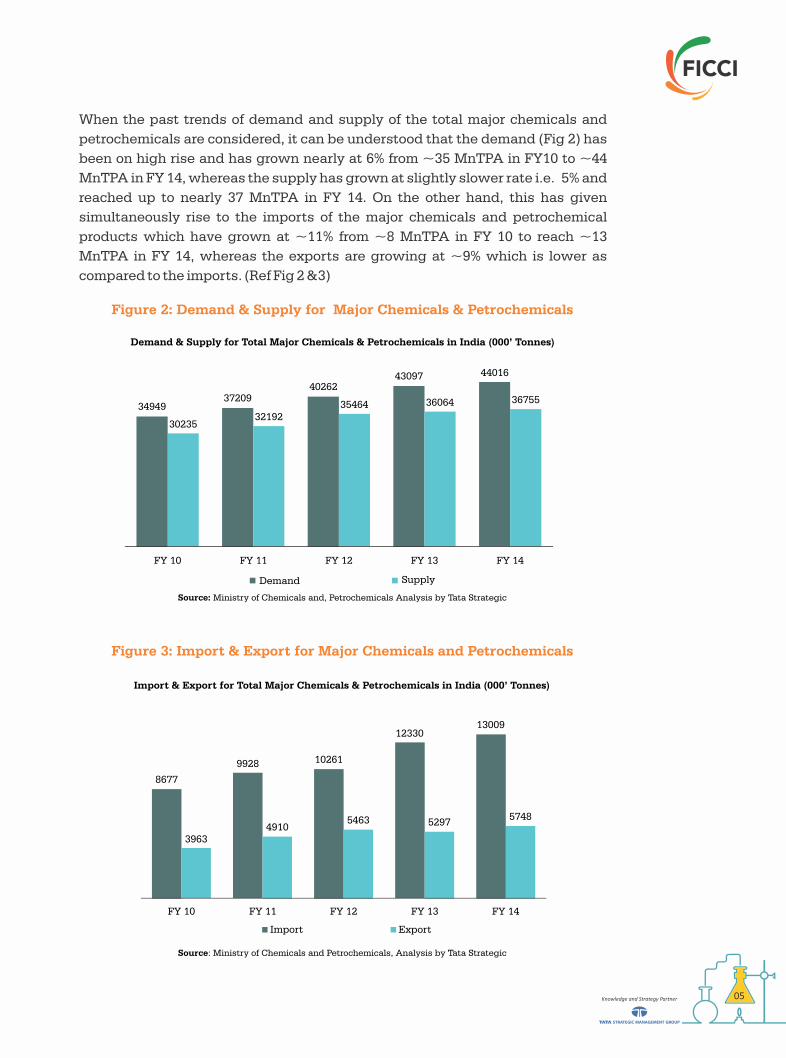
When the past trends of demand and supply of the total major chemicals and
petrochemicals are considered, it can be understood that the demand (Fig 2) has
been on high rise and has grown nearly at 6% from ~35 MnTPA in FY10 to ~44
MnTPA in FY 14, whereas the supply has grown at slightly slower rate i.e. 5% and
reached up to nearly 37 MnTPA in FY 14. On the other hand, this has given
simultaneously rise to the imports of the major chemicals and petrochemical
products which have grown at ~11% from ~8 MnTPA in FY 10 to reach ~13
MnTPA in FY 14, whereas the exports are growing at ~9% which is lower as
compared to the imports. (Ref Fig 2 &3)
Figure 2: Demand & Supply for Major Chemicals & Petrochemicals
Demand & Supply for Total Major Chemicals & Petrochemicals in India (000’ Tonnes)
3494937209
4026243097 44016
3023532192
35464 36064 36755
FY 10 FY 11 FY 12 FY 13 FY 14
Demand Supply
Source: Ministry of Chemicals and, Petrochemicals Analysis by Tata Strategic
Figure 3: Import & Export for Major Chemicals and Petrochemicals
Import & Export for Total Major Chemicals & Petrochemicals in India (000’ Tonnes)
8677
9928 10261
1233013009
39634910
5463 52975748
FY 10 FY 11 FY 12 FY 13 FY 14
Import Export
Source: Ministry of Chemicals and Petrochemicals, Analysis by Tata Strategic
Knowledge and Strategy Partner 05Knowledge and Strategy Partner04
Gujarat, Maharashtra and Tamilnadu are leading the charge being the major
chemical manufacturers in the country. The key driver being the significant
coastlines the states are endowed with (Fig 1). The country's chemical industry
has the potential to reach USD 214 billion by FY19 growing at a CAGR of ~9%.
The growth is expected to be driven by rising demandin end-use segments and
expanding exports fuelled by increasing export competitiveness. The success,
however, will depend on how well it's key challenges are addressed such as high
dependence on imports, small installed capacities, low focus on technology up-
gradation and the availability of vocationally trained manpower.
1.1 Chemicals - A way of Life!
Chemical industry is the responsible for converting raw materials like water,
crude oil, natural gas, air, metals, and minerals, etc. into other valuable products.
It is involved in almost every industrial process and therefore plays a significant
role in global economic and social development. R&D in the field of chemistry is
now focusing on rendering a green and sustainable solution for the long run.
Thus, chemistry might come across as a complicated theory but in true essence it
has offered products and solutions for virtually all sectors of economy. Hence,
Chemicals are truly a way of life, it has simplified our way of living as compared to
the past; and have also fostered comfort and growth in human lifestyle.
1.2 Chemical Industry
I. Overview
With immense thrust on knowledge building and an inherently capital intensive
nature, the Chemical industry has a significant role to play in the global economic
and social development. It is also a highly human resource intensive industry
employing a large number of people. Globally, nearly 20 million people are
employed in this industry. The diversification within the chemical industry is
large and covers more than 80000 commercial products with myriad applications
that one needs to only look around oneself to gauge how deeply connected one is
to the world of chemicals
Over the last few decades, the chemical industry has seen an increasing shift
towards Asia. This is in line with shift of key consumer industries (e.g.
Automotive, Electrical and Electronics) towards Asia. Looking particularly
towards the Indian chemical industry, it stands out to be the 3rd largest producer
in Asia. The chemical industry in India has started to evolve rapidly since the last
five years. Despite its large size and significant GDP contribution, the industry
accounted for ~3.4% of the global chemicals industry (~USD 4 Trillion).
When the past trends of demand and supply of the total major chemicals and
petrochemicals are considered, it can be understood that the demand (Fig 2) has
been on high rise and has grown nearly at 6% from ~35 MnTPA in FY10 to ~44
MnTPA in FY 14, whereas the supply has grown at slightly slower rate i.e. 5% and
reached up to nearly 37 MnTPA in FY 14. On the other hand, this has given
simultaneously rise to the imports of the major chemicals and petrochemical
products which have grown at ~11% from ~8 MnTPA in FY 10 to reach ~13
MnTPA in FY 14, whereas the exports are growing at ~9% which is lower as
compared to the imports. (Ref Fig 2 &3)
Figure 2: Demand & Supply for Major Chemicals & Petrochemicals
Demand & Supply for Total Major Chemicals & Petrochemicals in India (000’ Tonnes)
3494937209
4026243097 44016
3023532192
35464 36064 36755
FY 10 FY 11 FY 12 FY 13 FY 14
Demand Supply
Source: Ministry of Chemicals and, Petrochemicals Analysis by Tata Strategic
Figure 3: Import & Export for Major Chemicals and Petrochemicals
Import & Export for Total Major Chemicals & Petrochemicals in India (000’ Tonnes)
8677
9928 10261
1233013009
39634910
5463 52975748
FY 10 FY 11 FY 12 FY 13 FY 14
Import Export
Source: Ministry of Chemicals and Petrochemicals, Analysis by Tata Strategic
Knowledge and Strategy Partner06 Knowledge and Strategy Partner 07
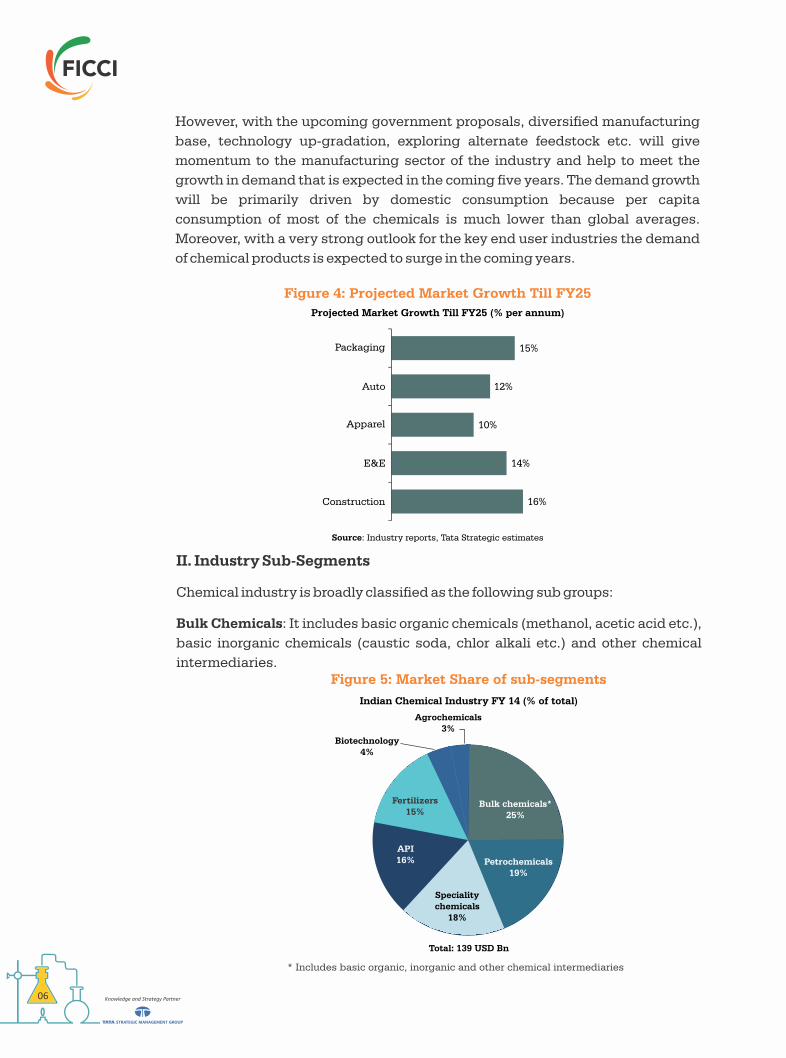
However, with the upcoming government proposals, diversified manufacturing
base, technology up-gradation, exploring alternate feedstock etc. will give
momentum to the manufacturing sector of the industry and help to meet the
growth in demand that is expected in the coming five years. The demand growth
will be primarily driven by domestic consumption because per capita
consumption of most of the chemicals is much lower than global averages.
Moreover, with a very strong outlook for the key end user industries the demand
of chemical products is expected to surge in the coming years.
II. Industry Sub-Segments
Chemical industry is broadly classified as the following sub groups:
Bulk Chemicals: It includes basic organic chemicals (methanol, acetic acid etc.),
basic inorganic chemicals (caustic soda, chlor alkali etc.) and other chemical
intermediaries.
Petrochemicals: Petrochemicals are chemical products derived from petroleum.
The two most common petrochemical classes are olefins (including ethylene and
propylene) and aromatics (including benzene, toluene and xylene isomers)
Fertilizers: Fertilizer is any organic or inorganic substance which supplies
chemical elements required for plant growth. Fertilizer sector manufactures
critical raw materials for agriculture which is a major occupation of the country
Speciality Chemicals: Speciality Chemicalsare low-volume but high-value
compounds. These chemicals are derived from basic chemicals and are sold on
the basis of their function. Paint, adhesives, electronic chemicals, etc. are some
examples of specialty chemicals
Agro Chemicals: Chemicals essentially meant for protecting agriculture crops
against insecticides and pesticides are covered under this sub-group
Of the five segments, Bulk chemical (25% share) is the largest followed by
petrochemicals (19%)and speciality chemicals (18%). In terms of potential
growth, speciality chemicals and agrochemicals are the fastest growing
segment followed by petro and bulk chemicals.
III. Future Outlook
To address the macro level uncertainties associated with an industry level
growth estimate, Tata Strategic has developed three scenarios to look at the
possible growth outlook of Indian chemical industry based on the growth rates of
its sub-segments. In the base case, the market size is estimated at ~195 USD
billion by FY19. Most likely the market will rise to ~USD 214 billion with 9%
growth. And the optimistic case is likely to achieve a growth of ~11% p.a. over the
next five years resulting in an industry size of ~USD 234 billion.
Figure 5: Market Share of sub-segments
Petrochemicals19%
Speciality chemicals
18%
API16%
Fertilizers15%
Bulk chemicals*25%
Biotechnology4%
Agrochemicals3%
Total: 139 USD Bn
* Includes basic organic, inorganic and other chemical intermediaries
Indian Chemical Industry FY 14 (% of total)
Figure 4: Projected Market Growth Till FY25
Projected Market Growth Till FY25 (% per annum)
16%
14%
10%
12%
15%
Construction
E&E
Apparel
Auto
Packaging
Source: Industry reports, Tata Strategic estimates
Figure 6: Chemical Industry Future Outlook
214234
FY 14 Base Most likelyFY19 (E)
High Growth
11%
9%
7%
X%-CAGR
Chemical Industry Future Outlook (USD Bn)
Source: Industry reports, Tata Strategic Analysis
139
195

Knowledge and Strategy Partner06 Knowledge and Strategy Partner 07
However, with the upcoming government proposals, diversified manufacturing
base, technology up-gradation, exploring alternate feedstock etc. will give
momentum to the manufacturing sector of the industry and help to meet the
growth in demand that is expected in the coming five years. The demand growth
will be primarily driven by domestic consumption because per capita
consumption of most of the chemicals is much lower than global averages.
Moreover, with a very strong outlook for the key end user industries the demand
of chemical products is expected to surge in the coming years.
II. Industry Sub-Segments
Chemical industry is broadly classified as the following sub groups:
Bulk Chemicals: It includes basic organic chemicals (methanol, acetic acid etc.),
basic inorganic chemicals (caustic soda, chlor alkali etc.) and other chemical
intermediaries.
Petrochemicals: Petrochemicals are chemical products derived from petroleum.
The two most common petrochemical classes are olefins (including ethylene and
propylene) and aromatics (including benzene, toluene and xylene isomers)
Fertilizers: Fertilizer is any organic or inorganic substance which supplies
chemical elements required for plant growth. Fertilizer sector manufactures
critical raw materials for agriculture which is a major occupation of the country
Speciality Chemicals: Speciality Chemicalsare low-volume but high-value
compounds. These chemicals are derived from basic chemicals and are sold on
the basis of their function. Paint, adhesives, electronic chemicals, etc. are some
examples of specialty chemicals
Agro Chemicals: Chemicals essentially meant for protecting agriculture crops
against insecticides and pesticides are covered under this sub-group
Of the five segments, Bulk chemical (25% share) is the largest followed by
petrochemicals (19%)and speciality chemicals (18%). In terms of potential
growth, speciality chemicals and agrochemicals are the fastest growing
segment followed by petro and bulk chemicals.
III. Future Outlook
To address the macro level uncertainties associated with an industry level
growth estimate, Tata Strategic has developed three scenarios to look at the
possible growth outlook of Indian chemical industry based on the growth rates of
its sub-segments. In the base case, the market size is estimated at ~195 USD
billion by FY19. Most likely the market will rise to ~USD 214 billion with 9%
growth. And the optimistic case is likely to achieve a growth of ~11% p.a. over the
next five years resulting in an industry size of ~USD 234 billion.
Figure 5: Market Share of sub-segments
Petrochemicals19%
Speciality chemicals
18%
API16%
Fertilizers15%
Bulk chemicals*25%
Biotechnology4%
Agrochemicals3%
Total: 139 USD Bn
* Includes basic organic, inorganic and other chemical intermediaries
Indian Chemical Industry FY 14 (% of total)
Figure 4: Projected Market Growth Till FY25
Projected Market Growth Till FY25 (% per annum)
16%
14%
10%
12%
15%
Construction
E&E
Apparel
Auto
Packaging
Source: Industry reports, Tata Strategic estimates
Figure 6: Chemical Industry Future Outlook
214234
FY 14 Base Most likelyFY19 (E)
High Growth
11%
9%
7%
X%-CAGR
Chemical Industry Future Outlook (USD Bn)
Source: Industry reports, Tata Strategic Analysis
139
195

Knowledge and Strategy Partner 09Knowledge and Strategy Partner08
IV. Key Challenges
With immense potential lined up in the way ahead, it is of prime importance, to
first overcome the existing challenges in the industry. The industry has several
critical issues like infrastructure, scale of operation, access to technology, ease of
doing business, energy and feedstock security etc. which have hampered it to
achieve its true potential and if those issues are addressed with the help of
Government intervention, it would help industry to achieve its true potential.
The new Government is now focusing on to revive manufacturing, build robust
infrastructure and regain investor's confidence. It has been taking initiatives to
address challenges in feedstock availability, complex tax and duty structure and
overcome other system intricacies.
V. Key Drivers
Strong growth outlook: There is an abundance of skilled human resource n
in India which can be employed in this industry. Going forward, speciality
chemicals and pharmaceuticals segments are expected to outgrow the
overall industry growth rate
Low per capita consumption: Due to low awareness among farmers, n
usage of agrochemicals and fertilizers have been on the lower end, which
can be improved by taking knowledge building initiatives by either
government or large corporation. There is a need to address issues like
availability, allocation and pricing of key feed stocks and providing for
necessary infrastructure.
Growing demand: With growing disposable incomes and increasing n
urbanization, end consumption demand is increasing for paints, textiles,
adhesives and construction, which in turn, is leading to substantial
industrial growth rate.
Diversified manufacturing: The Indian chemicals industry has seen n
quantum jump in diversified manufacturing base that produces world-
class products. This increasing scope will favourably influence the
industry growth.
One of the initiatives is 'Make in India' campaign, which aims to facilitate
investment, foster innovation, enhance skill development and build best-in-
class manufacturing infrastructure. Under this initiative GOI is focusing onto
raising the share of manufacturing in GDP from 16% to 25% by 2022.Theyhave de-
licensed manufacturing for most of the chemicalsand100% FDI is made
permissible in Indian Chemicals. Policies have been initiated to set up
integrated Petroleum, Chemicals and Petrochemicals Investment Regions
(PCPIR).Ithas also been encouraging the R&D sector and has reduced the list of
reserved chemical items for production in small scale sector thus facilitating
investment in technology up gradation and modernisation. Thus, through Make
in India initiative, the government can ensure its domestic demand is efficacious
and certain critical factors of the industry are well-addressed, and
competitiveness is enhanced for both domestic and multinational players as far
as domestic manufacturing is concerned.
Besides the government support the key imperatives for the growth of chemical
industry is to secure feedstock, right product mix and identify opportunities for
Mergers and Acquisitions. Companies can secure feedstock by setting plants in
the resource rich nation or explore alternative feedstock. Investments are needed
to be made in the right product mix and optimize the use of available feedstock
such as Naphtha and its derivatives. Exploring Merger, JV opportunities can help
companies to gain capital and technology support and also might open new
opportunities in the international market. To remain competitive in the market
companies can invest in strategic energy management and strategic water
management to cut down their energy costs and invest in upcoming PCPIRs in
India and overcome challenges related to infrastructure, power and water
availability.

Knowledge and Strategy Partner10
The chemical and petrochemical industry in Gujarat is the fastest growing
sector in the state's economy. Apart from having sound infrastructure
facilities, skilled manpower, excellent domestic and international connectivity
and availability of raw materials, a key differentiating factor for Gujarat is its
focus on industrial development in the state. It has evolved as an urbanised
economy ensuring easy off-take of industrial output.Gujarat is the 'Petro Capital'
of India, and contributes significantly to the country's petrochemicals production
(62%), chemicals production (53%) and pharmaceuticals production (45%).
Gujarat contributes 15% of the country's chemical exports. Bulk of this goes to US,
Europe and other developed nations - a clear sign of global competitiveness.
II : Gujarat: An Investment Destination
Knowledge and Strategy Partner 11
One of the leading industrialised states in India, Gujarat has become one of the
most preferred locations for investments. The state has attracted cumulative FDI
worth USD 11 billion from Apr 2000-Mar 2015 and is the second highest recipient
of FDI in India after Maharashtra. Currently, it has over 100 Industrial clusters,
involved in different industrial activities, to bring in cost competiveness and
extend common support for market development. The Cluster Development
Scheme has been launched for furthering the growth of product clusters. It has
truly emerged as the leader of chemical manufacturing in India distantly
followed by Maharashtra and Tamil Nadu.
Infrastructure and strategic location
Investor friendly climate, supportive and proactive government, policy measures
and incentives, support for SMEs, availability of natural resources, state
leadership and growth policies, PPP (public private partnership) model etc. has
together contributed to the holistic growth of the State. Besides thisthe presence
of mega-estates in chemical manufacturing at several industrial clusters in the
state has helped growth and expansion of the industry by providing an
appropriate business ecosystem. Chemical clusters across the state facilitate
rapid development and growth.
Major Chemical players in Gujarat
Leading Indian and multinational private organizations which have a footprint in
Gujarat are Reliance, TATA Chemicals, ONGC, Dow Chemicals, Cheminova,
Lanxess, India Oil (IOCL), Indian Petrochemical Corporation Limited (IPCL),
Nirma, Essar, BASF, Bayer, Rallis, Novartis, Torrent, Cadila, Aarti Group and
Figure 7: Gujarat’s Contribution to Indian Economy
8%
25%
17.70%
10%
7.60%
7%
5%
GDP Contribution formManufacturing
Exports
Crude Production
No. of factories in India
GDP
Urban Population
Population
Gujarat’s Contribution to Indian Economy
Source: Industry Research
Figure 8: Contribution of Gujarat to India
Contribution of Gujarat to India
85%
80%
65%62%
53%
45%
9%
Salt Processing
DiamondProcessing
Plastics Petrochemicals Chemicals Pharmaceuticals Engineering
Knowledge and Strategy Partner 13Knowledge and Strategy Partner12
Deepak Nitrite. More than 35% of large & medium units in the state are from
chemical industries and chemicals account for ~16% of employment in the state.
2The PCPIR at Dahej is spread over 453 km of area in the Gulf of Khambhat, in
Bharuch District in South Gujarat in close vicinity of other chemical estates and
onsite chemical port terminal & LNG terminal. Thus, along with its robust
business environment, policy support by government, strong talent pool and
entrepreneurial culture, the state is poised to further build on its leadership
position in the chemical industry in the way ahead.
Upcoming Ports
Building ports would enable the state government to make maximum use of the
state's 1600 km long coastline, which is ideal to facilitate movement of goods.
State government is planning to add multiple capacities to leverage the potential
of coasts. ABG Cement is planning captive cargo handling jetty in Surat with
capacity of 4.95 MTPA. Essar Ports is constructing a dry bulk terminal in
Jamnagar with capacity of 20 MTPA and Cochin Shipyard is planning a shipyard
in Kutch.
Gujarat is the leader in India when it comes to "Ease of doing business". It is the
only state which comply 100% with Environmental procedures.Gujarat fares
highly when it comes to setting up a business, allotment of land and obtaining a
construction permit. Being among the leaders in Chemicals manufacturing in
India, Gujarat has a key role to play in upcoming decade. Low per capita
consumption and strong growth drivers will propel the industry in this state to
newer heights.
Issues & Challenges in upcoming chemical clusters
Ø Policy and Government Support: Gujarat has setup a single window
clearance mechanism for entrepreneurs who want to establish industrial
ventures. Industrial Extension Bureau which serves as the single point of
contact has helped in reducing the time for clearance of projects. However,
ground reality is that there are time delays due to involvement of multiple
central and state agencies.
Ø Port Connectivity: Port connectivity is a critical aspect for setting up any
industry. Talking about the Dahej port, it has access to only one liquid
chemical terminal. The current port infrastructure is inadequate and has
limitations in size of vessels that the port can handle. There is currently no
export facility for chemicals through the Dahej port. There is a need for
identifying and partnering with players having experience in providing such
services.
Ø Basic Infrastructure: Basic infrastructure like road, rail, power, water, gas &
CETP needs to be further augmented. Proper layout planning and disaster
management is extremely critical in the case of an industry of such hazardous
nature. The current layout has a single gate serving both as an entry and exit
point. Water is another critical input for the chemical industry. As of now
there are already concerns with the quality and quantity of water being made
available at the PCPIR, even thou only part of the first Phase is operational.
There is an immediate need for the nodal agencies to look in to developing
Desalination facilities for water. CETPs for waste treatment, is another
critical requirement to ensure sustainable models for the future.
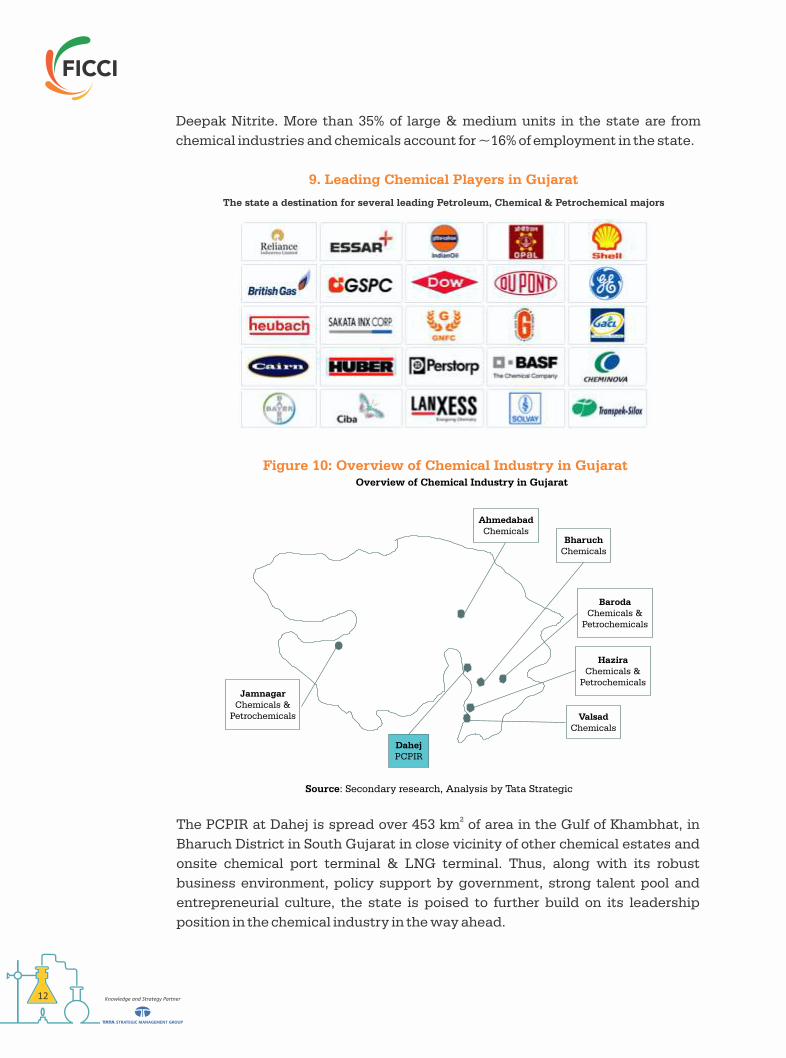
9. Leading Chemical Players in Gujarat
The state a destination for several leading Petroleum, Chemical & Petrochemical majors
Figure 10: Overview of Chemical Industry in Gujarat
Source: Secondary research, Analysis by Tata Strategic
Overview of Chemical Industry in Gujarat
AhmedabadChemicals
BarodaChemicals &
Petrochemicals
DahejPCPIR
JamnagarChemicals &
Petrochemicals
BharuchChemicals
HaziraChemicals &
Petrochemicals
ValsadChemicals

Knowledge and Strategy Partner 13Knowledge and Strategy Partner12
Deepak Nitrite. More than 35% of large & medium units in the state are from
chemical industries and chemicals account for ~16% of employment in the state.
2The PCPIR at Dahej is spread over 453 km of area in the Gulf of Khambhat, in
Bharuch District in South Gujarat in close vicinity of other chemical estates and
onsite chemical port terminal & LNG terminal. Thus, along with its robust
business environment, policy support by government, strong talent pool and
entrepreneurial culture, the state is poised to further build on its leadership
position in the chemical industry in the way ahead.
Upcoming Ports
Building ports would enable the state government to make maximum use of the
state's 1600 km long coastline, which is ideal to facilitate movement of goods.
State government is planning to add multiple capacities to leverage the potential
of coasts. ABG Cement is planning captive cargo handling jetty in Surat with
capacity of 4.95 MTPA. Essar Ports is constructing a dry bulk terminal in
Jamnagar with capacity of 20 MTPA and Cochin Shipyard is planning a shipyard
in Kutch.
Gujarat is the leader in India when it comes to "Ease of doing business". It is the
only state which comply 100% with Environmental procedures.Gujarat fares
highly when it comes to setting up a business, allotment of land and obtaining a
construction permit. Being among the leaders in Chemicals manufacturing in
India, Gujarat has a key role to play in upcoming decade. Low per capita
consumption and strong growth drivers will propel the industry in this state to
newer heights.
Issues & Challenges in upcoming chemical clusters
Ø Policy and Government Support: Gujarat has setup a single window
clearance mechanism for entrepreneurs who want to establish industrial
ventures. Industrial Extension Bureau which serves as the single point of
contact has helped in reducing the time for clearance of projects. However,
ground reality is that there are time delays due to involvement of multiple
central and state agencies.
Ø Port Connectivity: Port connectivity is a critical aspect for setting up any
industry. Talking about the Dahej port, it has access to only one liquid
chemical terminal. The current port infrastructure is inadequate and has
limitations in size of vessels that the port can handle. There is currently no
export facility for chemicals through the Dahej port. There is a need for
identifying and partnering with players having experience in providing such
services.
Ø Basic Infrastructure: Basic infrastructure like road, rail, power, water, gas &
CETP needs to be further augmented. Proper layout planning and disaster
management is extremely critical in the case of an industry of such hazardous
nature. The current layout has a single gate serving both as an entry and exit
point. Water is another critical input for the chemical industry. As of now
there are already concerns with the quality and quantity of water being made
available at the PCPIR, even thou only part of the first Phase is operational.
There is an immediate need for the nodal agencies to look in to developing
Desalination facilities for water. CETPs for waste treatment, is another
critical requirement to ensure sustainable models for the future.
9. Leading Chemical Players in Gujarat
The state a destination for several leading Petroleum, Chemical & Petrochemical majors
Figure 10: Overview of Chemical Industry in Gujarat
Source: Secondary research, Analysis by Tata Strategic
Overview of Chemical Industry in Gujarat
AhmedabadChemicals
BarodaChemicals &
Petrochemicals
DahejPCPIR
JamnagarChemicals &
Petrochemicals
BharuchChemicals
HaziraChemicals &
Petrochemicals
ValsadChemicals

Knowledge and Strategy Partner 15Knowledge and Strategy Partner14
Ø Social Infrastructure: Social infrastructure acts as the backbone for the
sustenance of industry growth and attracting skilled talent. Gujarat needs to
ensure that proper social infrastructure like education, recreation facilities
etc. are in place near the chemical industry cluster and regions like Dahej
PCPIR. Advance planning and development of master plan is essential.
Relative Comparison of Infrastructure
TSMG has conducted a detailed analysis, where we have mapped four Indian
states based on their current and future investment outlook for the chemical
sector and Singapore - a case study of success stories for an integrated chemical
park, on chemical industry and related infrastructure support parameters. On the
basis of our research Gujarat does emerge as the location of choice for chemical
industry in India. But on a global scale, when compared with countries like
Singapore, Gujarat has further potential to build infrastructure for the chemical
industry. Gujarat needs to check if there are enough initiatives to sustain the
infrastructure growth and compete with world class chemical hubs on a global
stage.
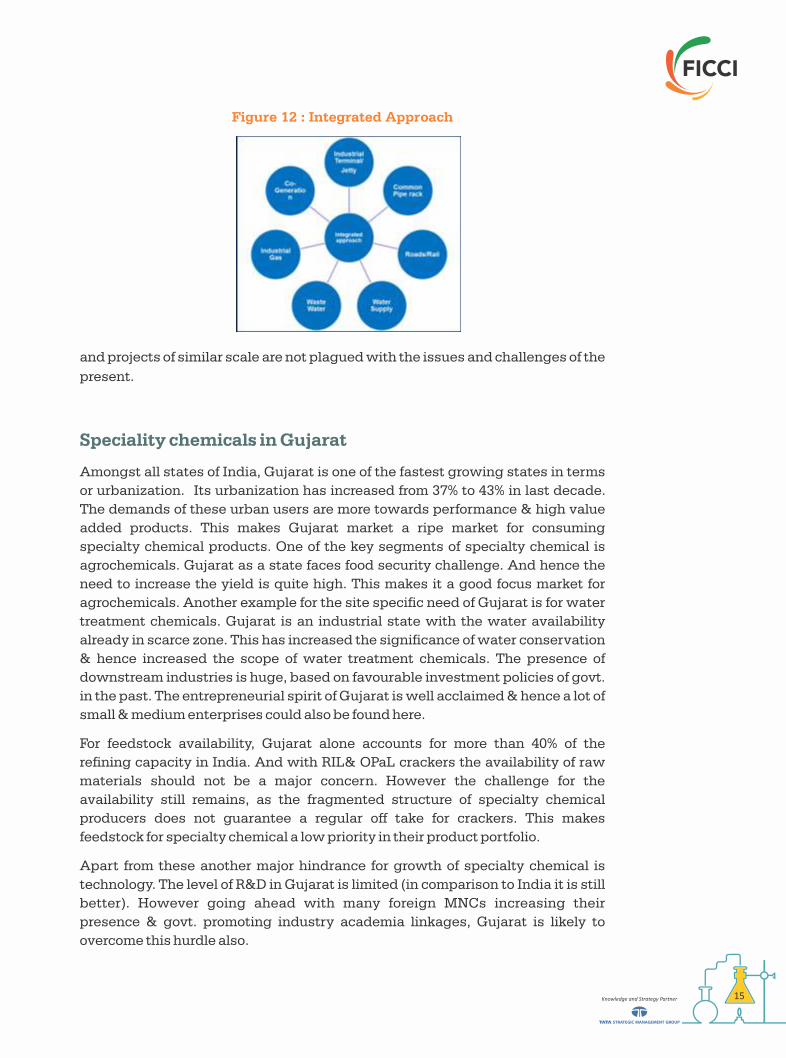
and projects of similar scale are not plagued with the issues and challenges of the
present.
Speciality chemicals in Gujarat
Amongst all states of India, Gujarat is one of the fastest growing states in terms
or urbanization. Its urbanization has increased from 37% to 43% in last decade.
The demands of these urban users are more towards performance & high value
added products. This makes Gujarat market a ripe market for consuming
specialty chemical products. One of the key segments of specialty chemical is
agrochemicals. Gujarat as a state faces food security challenge. And hence the
need to increase the yield is quite high. This makes it a good focus market for
agrochemicals. Another example for the site specific need of Gujarat is for water
treatment chemicals. Gujarat is an industrial state with the water availability
already in scarce zone. This has increased the significance of water conservation
& hence increased the scope of water treatment chemicals. The presence of
downstream industries is huge, based on favourable investment policies of govt.
in the past. The entrepreneurial spirit of Gujarat is well acclaimed & hence a lot of
small & medium enterprises could also be found here.
For feedstock availability, Gujarat alone accounts for more than 40% of the
refining capacity in India. And with RIL& OPaL crackers the availability of raw
materials should not be a major concern. However the challenge for the
availability still remains, as the fragmented structure of specialty chemical
producers does not guarantee a regular off take for crackers. This makes
feedstock for specialty chemical a low priority in their product portfolio.
Apart from these another major hindrance for growth of specialty chemical is
technology. The level of R&D in Gujarat is limited (in comparison to India it is still
better). However going ahead with many foreign MNCs increasing their
presence & govt. promoting industry academia linkages, Gujarat is likely to
overcome this hurdle also.
Figure 11 : Comparison of Infrastructure
Comparison of Infrastructure
Way Forward: Integrated Development – key to growth of
Gujarat as a chemical hub
The strong & robust infrastructure, focused & supportive policies and growing
downstream industries are helping the chemical industry to contribute to the
Gujarat growth story. However, there is a need for the state to compare itself with
international examples like a Jurong Island and ensure that State and Central
departments and agencies work seamlessly to help achieve the goal of
integrated development. This would serve well in ensuring that future phases
Figure 12 : Integrated Approach
Knowledge and Strategy Partner 15Knowledge and Strategy Partner14
Ø Social Infrastructure: Social infrastructure acts as the backbone for the
sustenance of industry growth and attracting skilled talent. Gujarat needs to
ensure that proper social infrastructure like education, recreation facilities
etc. are in place near the chemical industry cluster and regions like Dahej
PCPIR. Advance planning and development of master plan is essential.
Relative Comparison of Infrastructure
TSMG has conducted a detailed analysis, where we have mapped four Indian
states based on their current and future investment outlook for the chemical
sector and Singapore - a case study of success stories for an integrated chemical
park, on chemical industry and related infrastructure support parameters. On the
basis of our research Gujarat does emerge as the location of choice for chemical
industry in India. But on a global scale, when compared with countries like
Singapore, Gujarat has further potential to build infrastructure for the chemical
industry. Gujarat needs to check if there are enough initiatives to sustain the
infrastructure growth and compete with world class chemical hubs on a global
stage.
and projects of similar scale are not plagued with the issues and challenges of the
present.
Speciality chemicals in Gujarat
Amongst all states of India, Gujarat is one of the fastest growing states in terms
or urbanization. Its urbanization has increased from 37% to 43% in last decade.
The demands of these urban users are more towards performance & high value
added products. This makes Gujarat market a ripe market for consuming
specialty chemical products. One of the key segments of specialty chemical is
agrochemicals. Gujarat as a state faces food security challenge. And hence the
need to increase the yield is quite high. This makes it a good focus market for
agrochemicals. Another example for the site specific need of Gujarat is for water
treatment chemicals. Gujarat is an industrial state with the water availability
already in scarce zone. This has increased the significance of water conservation
& hence increased the scope of water treatment chemicals. The presence of
downstream industries is huge, based on favourable investment policies of govt.
in the past. The entrepreneurial spirit of Gujarat is well acclaimed & hence a lot of
small & medium enterprises could also be found here.
For feedstock availability, Gujarat alone accounts for more than 40% of the
refining capacity in India. And with RIL& OPaL crackers the availability of raw
materials should not be a major concern. However the challenge for the
availability still remains, as the fragmented structure of specialty chemical
producers does not guarantee a regular off take for crackers. This makes
feedstock for specialty chemical a low priority in their product portfolio.
Apart from these another major hindrance for growth of specialty chemical is
technology. The level of R&D in Gujarat is limited (in comparison to India it is still
better). However going ahead with many foreign MNCs increasing their
presence & govt. promoting industry academia linkages, Gujarat is likely to
overcome this hurdle also.
Figure 11 : Comparison of Infrastructure
Comparison of Infrastructure
Way Forward: Integrated Development – key to growth of
Gujarat as a chemical hub
The strong & robust infrastructure, focused & supportive policies and growing
downstream industries are helping the chemical industry to contribute to the
Gujarat growth story. However, there is a need for the state to compare itself with
international examples like a Jurong Island and ensure that State and Central
departments and agencies work seamlessly to help achieve the goal of
integrated development. This would serve well in ensuring that future phases
Figure 12 : Integrated Approach

Knowledge and Strategy Partner16
3.1 Basic Organic Chemicals
Organic Chemicals form a crucial segment of chemical industry. They play a
significant role by producing chemicals that are useful for our day to day life and
constitute an important part of human endeavours. Organic compounds are
structurally diverse and show enormous applications. They are important
constituents of useful products such as Synthetic fibres, Drugs &
Pharmaceuticals, Dyes & Pigments, Rubber, Agrochemicals, Polymers, and
Perfumes etc.
Five major organic chemicals produced in India are Methanol, Aniline and its
derivatives like Formaldehyde, Acetic Acid and Phenol. Together, they
contribute to ~2/3rd of Indian basic organic chemical industry.
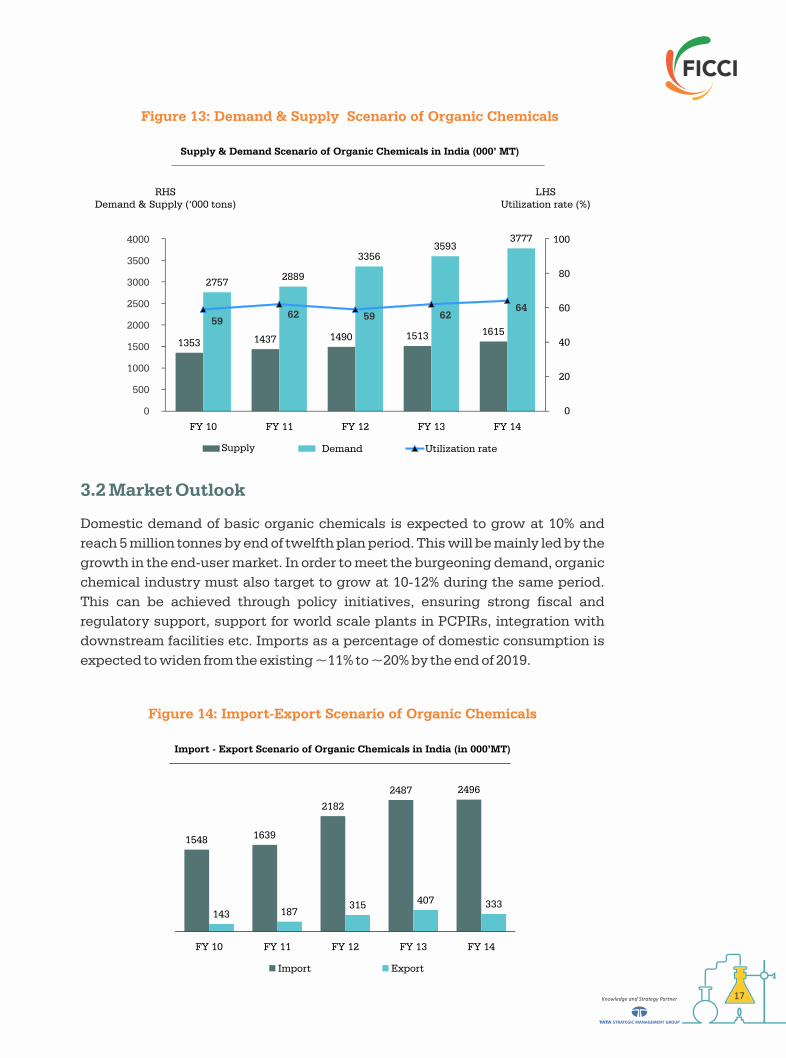
The demand for organic chemicals in India has increased at nearly 8.2 % between
FY 10- FY 14 to reach 3.7 million tons in 2014 (Fig 13). The domestic supply has
however grown at a much slower pace and has essentially been stagnant in the
last 3 years. This has resulted in widening of demand supply gap which was
primarily bridged through imports. Domestic production has increased at ~ 4.5%
per annum (Fig 13) and imports grew at a rate of 12.7% between FY10 and FY14
(Fig 14). The stagnation in the domestic production is largely attributed to the
large volume imports taking place from countries like China, resulting in low
utilization rates of ~ 64%.
CHEMICAL INDUSTRY SECTORIAL REPORTS
III. Bulk Chemicals
Knowledge and Strategy Partner 17
Figure 13: Demand & Supply Scenario of Organic Chemicals
Import - Export Scenario of Organic Chemicals in India (in 000’MT)
1548 1639
2182
2487 2496
143 187315 407 333
FY 10 FY 11 FY 12 FY 13 FY 14
Import Export
Supply & Demand Scenario of Organic Chemicals in India (000’ MT)
Figure 14: Import-Export Scenario of Organic Chemicals
3.2 Market Outlook
Domestic demand of basic organic chemicals is expected to grow at 10% and
reach 5 million tonnes by end of twelfth plan period. This will be mainly led by the
growth in the end-user market. In order to meet the burgeoning demand, organic
chemical industry must also target to grow at 10-12% during the same period.
This can be achieved through policy initiatives, ensuring strong fiscal and
regulatory support, support for world scale plants in PCPIRs, integration with
downstream facilities etc. Imports as a percentage of domestic consumption is
expected to widen from the existing ~11% to ~20% by the end of 2019.
1353 1437 1490 1513 1615
27572889
33563593
3777
5962 59 62
64
100
80
60
40
20
0
4000
3500
3000
2500
2000
1500
1000
500
0
FY 10 FY 11 FY 12 FY 13 FY 14
Supply Demand Utilization rate
RHSDemand & Supply (‘000 tons)
LHSUtilization rate (%)
Knowledge and Strategy Partner16
3.1 Basic Organic Chemicals
Organic Chemicals form a crucial segment of chemical industry. They play a
significant role by producing chemicals that are useful for our day to day life and
constitute an important part of human endeavours. Organic compounds are
structurally diverse and show enormous applications. They are important
constituents of useful products such as Synthetic fibres, Drugs &
Pharmaceuticals, Dyes & Pigments, Rubber, Agrochemicals, Polymers, and
Perfumes etc.
Five major organic chemicals produced in India are Methanol, Aniline and its
derivatives like Formaldehyde, Acetic Acid and Phenol. Together, they
contribute to ~2/3rd of Indian basic organic chemical industry.
The demand for organic chemicals in India has increased at nearly 8.2 % between
FY 10- FY 14 to reach 3.7 million tons in 2014 (Fig 13). The domestic supply has
however grown at a much slower pace and has essentially been stagnant in the
last 3 years. This has resulted in widening of demand supply gap which was
primarily bridged through imports. Domestic production has increased at ~ 4.5%
per annum (Fig 13) and imports grew at a rate of 12.7% between FY10 and FY14
(Fig 14). The stagnation in the domestic production is largely attributed to the
large volume imports taking place from countries like China, resulting in low
utilization rates of ~ 64%.
CHEMICAL INDUSTRY SECTORIAL REPORTS
III. Bulk Chemicals
Knowledge and Strategy Partner 17
Figure 13: Demand & Supply Scenario of Organic Chemicals
Import - Export Scenario of Organic Chemicals in India (in 000’MT)
1548 1639
2182
2487 2496
143 187315 407 333
FY 10 FY 11 FY 12 FY 13 FY 14
Import Export
Supply & Demand Scenario of Organic Chemicals in India (000’ MT)
Figure 14: Import-Export Scenario of Organic Chemicals
3.2 Market Outlook
Domestic demand of basic organic chemicals is expected to grow at 10% and
reach 5 million tonnes by end of twelfth plan period. This will be mainly led by the
growth in the end-user market. In order to meet the burgeoning demand, organic
chemical industry must also target to grow at 10-12% during the same period.
This can be achieved through policy initiatives, ensuring strong fiscal and
regulatory support, support for world scale plants in PCPIRs, integration with
downstream facilities etc. Imports as a percentage of domestic consumption is
expected to widen from the existing ~11% to ~20% by the end of 2019.
1353 1437 1490 1513 1615
27572889
33563593
3777
5962 59 62
64
100
80
60
40
20
0
4000
3500
3000
2500
2000
1500
1000
500
0
FY 10 FY 11 FY 12 FY 13 FY 14
Supply Demand Utilization rate
RHSDemand & Supply (‘000 tons)
LHSUtilization rate (%)

Knowledge and Strategy Partner18
3.3 Inorganic Chemicals
Inorganic chemicals are typically of mineral origin. The chemicals evolved out of
this industry are used as intermediaries for other industrial and manufacturing
process. Some examples of inorganic chemistry in our daily life include;
Ammonia is one of the major inorganic chemicals used in the production of
nylons, fibres, plastics, polyurethanes etc. Chlorine used in manufacture of PVC,
agrochemicals etc. Thus inorganic chemicals are used in the fields ranging from
mining to microchips. They are used in fertilizers and serve as key inputs for a
number of industries such as aluminium, soap, detergent, glass, tyre, rubber,
pulp and paper, pharmaceutical, water treatment, textiles, leather, fibre etc.
The inorganic chemicals industry consists of two segments-basic inorganic
chemicals and alkaline chemicals. Alkaline chemicals form a larger share of
production and also constitute the oldest segment of the chemical industry.
The demand for inorganic chemicals in India has been increasing at nearly 2.30 %
from FY 10- FY 14 and has reached the level of 6.9 million tons. The domestic
supply has however grown at a slower pace resulting in gradual widening of
demand supply gap which was primarily bridged through imports. Domestic
production grew at 1.89% per annum and imports grew at a rate of 0.14 %
between FY10 and FY 14. The capacity utilization levels are at 78% which is close
to that of the past few years.
Figure 15: Demand and Supply of Inorganic Chemicals in India
57056150 6305 6283 62656231 6433 6619
7133 6980
72
7879 79 78
100
80
60
40
20
0
8000
7000
6000
5000
4000
3000
2000
1000
0
FY 10 FY 11 FY 12 FY 13 FY 14
Supply Demand Utilization rate
Supply & Demand Scenario of Inorganic Chemicals in India (000’ MT)
3.4 Market Outlook
Domestic demand of basic inorganic chemicals is expected to grow at a stable
6-7% CAGR over FY14 to FY19, mainly led by the growth in the end-user market
like alumina, textiles, paper and detergents. Domestic utilization rates of the
Knowledge and Strategy Partner 19
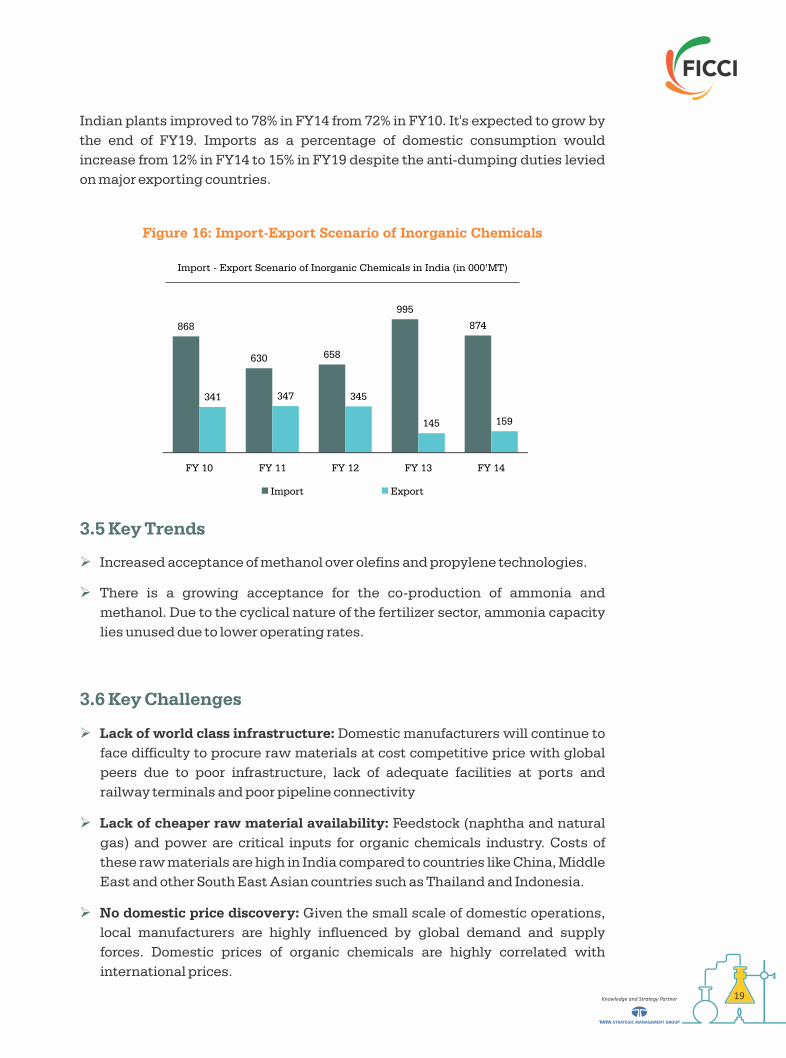
Indian plants improved to 78% in FY14 from 72% in FY10. It's expected to grow by
the end of FY19. Imports as a percentage of domestic consumption would
increase from 12% in FY14 to 15% in FY19 despite the anti-dumping duties levied
on major exporting countries.
Figure 16: Import-Export Scenario of Inorganic Chemicals
Import - Export Scenario of Inorganic Chemicals in India (in 000’MT)
868
630 658
995
874
341 347 345
145 159
FY 10 FY 11 FY 12 FY 13 FY 14
Import Export
3.5 Key Trends
Ø Increased acceptance of methanol over olefins and propylene technologies.
Ø There is a growing acceptance for the co-production of ammonia and
methanol. Due to the cyclical nature of the fertilizer sector, ammonia capacity
lies unused due to lower operating rates.
3.6 Key Challenges
Ø Lack of world class infrastructure: Domestic manufacturers will continue to
face difficulty to procure raw materials at cost competitive price with global
peers due to poor infrastructure, lack of adequate facilities at ports and
railway terminals and poor pipeline connectivity
Ø Lack of cheaper raw material availability: Feedstock (naphtha and natural
gas) and power are critical inputs for organic chemicals industry. Costs of
these raw materials are high in India compared to countries like China, Middle
East and other South East Asian countries such as Thailand and Indonesia.
Ø No domestic price discovery: Given the small scale of domestic operations,
local manufacturers are highly influenced by global demand and supply
forces. Domestic prices of organic chemicals are highly correlated with
international prices.
Knowledge and Strategy Partner18
3.3 Inorganic Chemicals
Inorganic chemicals are typically of mineral origin. The chemicals evolved out of
this industry are used as intermediaries for other industrial and manufacturing
process. Some examples of inorganic chemistry in our daily life include;
Ammonia is one of the major inorganic chemicals used in the production of
nylons, fibres, plastics, polyurethanes etc. Chlorine used in manufacture of PVC,
agrochemicals etc. Thus inorganic chemicals are used in the fields ranging from
mining to microchips. They are used in fertilizers and serve as key inputs for a
number of industries such as aluminium, soap, detergent, glass, tyre, rubber,
pulp and paper, pharmaceutical, water treatment, textiles, leather, fibre etc.
The inorganic chemicals industry consists of two segments-basic inorganic
chemicals and alkaline chemicals. Alkaline chemicals form a larger share of
production and also constitute the oldest segment of the chemical industry.
The demand for inorganic chemicals in India has been increasing at nearly 2.30 %
from FY 10- FY 14 and has reached the level of 6.9 million tons. The domestic
supply has however grown at a slower pace resulting in gradual widening of
demand supply gap which was primarily bridged through imports. Domestic
production grew at 1.89% per annum and imports grew at a rate of 0.14 %
between FY10 and FY 14. The capacity utilization levels are at 78% which is close
to that of the past few years.
Figure 15: Demand and Supply of Inorganic Chemicals in India
57056150 6305 6283 62656231 6433 6619
7133 6980
72
7879 79 78
100
80
60
40
20
0
8000
7000
6000
5000
4000
3000
2000
1000
0
FY 10 FY 11 FY 12 FY 13 FY 14
Supply Demand Utilization rate
Supply & Demand Scenario of Inorganic Chemicals in India (000’ MT)
3.4 Market Outlook
Domestic demand of basic inorganic chemicals is expected to grow at a stable
6-7% CAGR over FY14 to FY19, mainly led by the growth in the end-user market
like alumina, textiles, paper and detergents. Domestic utilization rates of the
Knowledge and Strategy Partner 19
Indian plants improved to 78% in FY14 from 72% in FY10. It's expected to grow by
the end of FY19. Imports as a percentage of domestic consumption would
increase from 12% in FY14 to 15% in FY19 despite the anti-dumping duties levied
on major exporting countries.
Figure 16: Import-Export Scenario of Inorganic Chemicals
Import - Export Scenario of Inorganic Chemicals in India (in 000’MT)
868
630 658
995
874
341 347 345
145 159
FY 10 FY 11 FY 12 FY 13 FY 14
Import Export
3.5 Key Trends
Ø Increased acceptance of methanol over olefins and propylene technologies.
Ø There is a growing acceptance for the co-production of ammonia and
methanol. Due to the cyclical nature of the fertilizer sector, ammonia capacity
lies unused due to lower operating rates.
3.6 Key Challenges
Ø Lack of world class infrastructure: Domestic manufacturers will continue to
face difficulty to procure raw materials at cost competitive price with global
peers due to poor infrastructure, lack of adequate facilities at ports and
railway terminals and poor pipeline connectivity
Ø Lack of cheaper raw material availability: Feedstock (naphtha and natural
gas) and power are critical inputs for organic chemicals industry. Costs of
these raw materials are high in India compared to countries like China, Middle
East and other South East Asian countries such as Thailand and Indonesia.
Ø No domestic price discovery: Given the small scale of domestic operations,
local manufacturers are highly influenced by global demand and supply
forces. Domestic prices of organic chemicals are highly correlated with
international prices.

4.1 Introduction
Petrochemicals play a vital role in economic development & growth of a country.
They are considered as enablers for growth of other sectors of the economy.
Petrochemicals are derived from various chemical compounds, mainly
hydrocarbons which are derived from crude oil and natural gas. Based on
chemical structure petrochemicals can be divided into 3 groups' olefins,
aromatics and synthesis gas. Examples of olefins include ethylene/propylene
which is used in industrial production of chemicals, plastics & plastics products.
IV. Petrochemicals
Knowledge and Strategy Partner 21Knowledge and Strategy Partner20
Ø Large global capacity additions: Apart from the current oversupply in global
markets, there is another cause of concern for domestic manufacturers, with
further large capacity additions happening in global markets. For example,
globally, methanol industry is expected to witness excess capacity in the
future due to a spate of capacity additions in gas rich countries such as Middle
East and Russia.
3.7 Key opportunities
Ø Consolidation: Sincemost of the Indian manufacturers operate on a small
scale compared to global peers, there is a room for consolidation in Indian
organic chemicals industry. Domestic players can take advantage of
economies of scale arising from consolidation and become more competitive
thereby preventing cheaper global imports.
Ø Improved feedstock supply: Domestic organic chemicals players don't have
the advantages of backward integration and hence, they lack pricing
flexibility. However, given the new finds of natural gas reserves in the country,
domestic manufacturers will be able to get supply of feedstock at stable
prices.
Ø Wider product portfolio: Commodity chemicals companies can improve their
product portfolio by adding speciality chemicals such as polymers additives,
water treatment chemicals, lubricating additives, etc. This will help in
improving their margins but requires significant R&D efforts.
Figure 17: Supply Demand Scenario of Basic Major petrochemicals
Supply & Demand Scenario of Basic Major Petrochemicals in India (000’ MT)
85099304
10151 1038410766
1013811018 11459
12557 12788
82
79
84 8284
98
94
90
86
82
78
74
70
14000
12000
10000
8000
6000
4000
2000
0
FY 10 FY 11 FY 12 FY 13 FY 14
Supply Demand Utilization rate
RHSDemand & Supply (‘000 tons)
LHSUtilization rate (%)
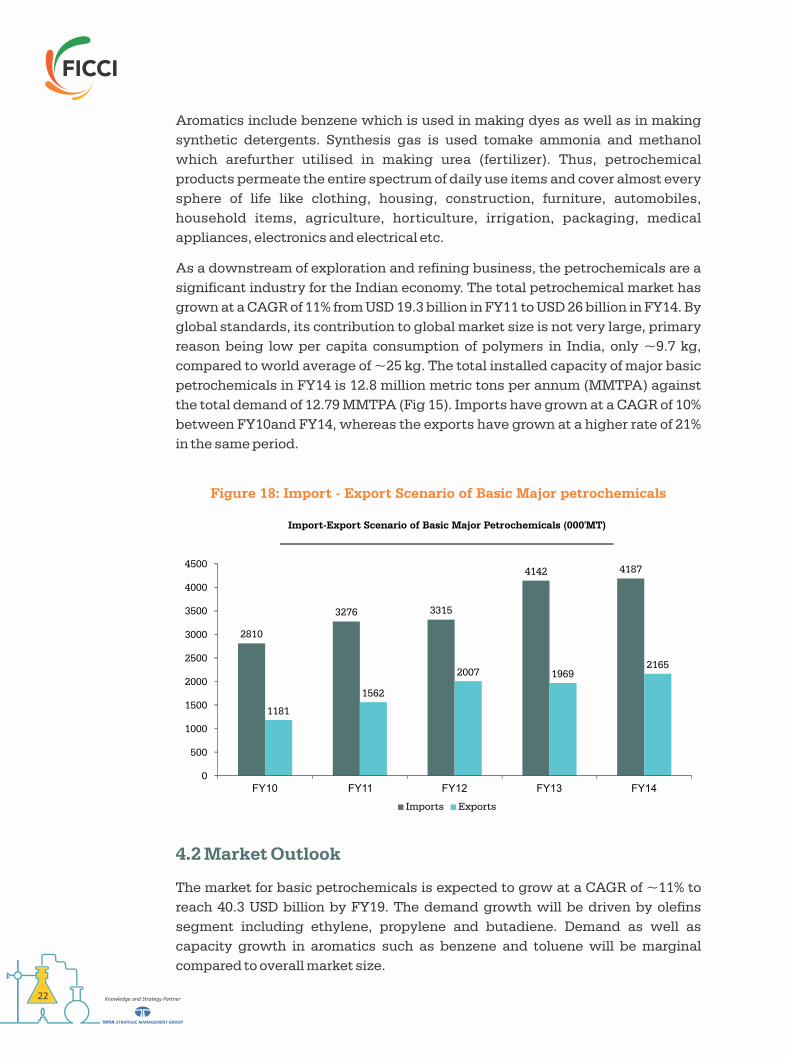
Knowledge and Strategy Partner22
Aromatics include benzene which is used in making dyes as well as in making
synthetic detergents. Synthesis gas is used tomake ammonia and methanol
which arefurther utilised in making urea (fertilizer). Thus, petrochemical
products permeate the entire spectrum of daily use items and cover almost every
sphere of life like clothing, housing, construction, furniture, automobiles,
household items, agriculture, horticulture, irrigation, packaging, medical
appliances, electronics and electrical etc.
As a downstream of exploration and refining business, the petrochemicals are a
significant industry for the Indian economy. The total petrochemical market has
grown at a CAGR of 11% from USD 19.3 billion in FY11 to USD 26 billion in FY14. By
global standards, its contribution to global market size is not very large, primary
reason being low per capita consumption of polymers in India, only ~9.7 kg,
compared to world average of ~25 kg. The total installed capacity of major basic
petrochemicals in FY14 is 12.8 million metric tons per annum (MMTPA) against
the total demand of 12.79 MMTPA (Fig 15). Imports have grown at a CAGR of 10%
between FY10and FY14, whereas the exports have grown at a higher rate of 21%
in the same period.
Figure 18: Import - Export Scenario of Basic Major petrochemicals
2810
3276 3315
4142 4187
1181
1562
2007 1969
4500
4000
3500
3000
2500
2000
1500
1000
500
0FY10 FY11 FY12 FY13
Import-Export Scenario of Basic Major Petrochemicals (000'MT)
Imports Exports
4.2 Market Outlook
The market for basic petrochemicals is expected to grow at a CAGR of ~11% to
reach 40.3 USD billion by FY19. The demand growth will be driven by olefins
segment including ethylene, propylene and butadiene. Demand as well as
capacity growth in aromatics such as benzene and toluene will be marginal
compared to overall market size.
2165
FY14
Knowledge and Strategy Partner 23
4.3 Key Trends
Ø Product switch: Linear low density polyethylene is increasingly replacing the
usage of low density polyethylene in India. Only 1 ton of ethylene is required
to produce 1 ton of LLDPE whereas > 1 ton of ethylene is required to produce 1
ton of LDPE.
Ø Change in feedstock mix: With increased availability of natural gas and new
gas finds, the dependency on naphtha as major feedstock for petrochemicals
complexes have reduced. In Middle East, substantial capacity additions will
be based on ethane as a feedstock.
4.4 Key Challenges
Ø Volatility in raw material prices: More than 50% of global petrochemical
capacities are based on naphtha, a crude oil derived product. The prices of
crude oil products have witnessed significant volatility, thereby making
petrochemicals prices highly volatile.
Ø Increased competition: Large capacity additions taking place in ethane rich
Middle East and demand rich China. Out of the 30 million tons of ethylene
capacity additions expected during period 2014 and 2019, 9 million tons is
expected in Middle East alone. Since, ethane based petrochemical products
are cheaper than petrochemical products in India, domestic producers are
expected to witness margins pressure.
Figure 19: Petrochemical Industry Future Outlook
Petrochemical Industry Future Outlook (USD billion)
26
40
FY14 FY19 (E)
11%
5.1 Introduction
Speciality chemicals are a unique group of high value and low volume products
known for their end usages and/or performance enhancing properties. Speciality
chemicals are a largely fragmented segment in chemical industry. It
encompasses products from paints, coatings and plastics to home care
surfactants, flavours and fragrances. Being so “usage-specific”, speciality
chemicals touches upon every segment of population these days.
5.2 Market Outlook
The Indian Speciality Chemical market is valued at ~25.3 billion USD as of FY14.
Speciality chemicals have observed a high growth rate in the past as well. A
growth of ~9.6% p.a. was witnessed since FY10when the market size was ~16
5. Speciality Chemicals
Knowledge and Strategy Partner 25Knowledge and Strategy Partner24
Ø High entry barriers: Given the capital intensive nature of the petrochemical
plant and tariff barriers, new entrants and small and medium size companies
are prohibited from easily entering into the market.
Ø Low capacity utilization: Due to oversupply in global markets, prices of
petrochemicals have taken a steep decline, thereby forcing the domestic
companies to underutilize their plants operating levels. The average capacity
utilization of the major basic petrochemicals has fallen from 95% levels before
global economic crisis to ~84% in 2014.
4.5 Key Opportunities
Ø Backward & forward integration: Given the volatility of crude oil prices and
India's heavy dependency on oil imports, there is an opportunity for oil and oil
related companies to reap benefits of increase in presence across the value
chain.
Ø Improved feedstock supply: Availability of feedstock dictates the location of
the plant. Domestic products are uncompetitive due to high costs of naphtha
when compared with ethane based products from Middle East.One means to
improve the competitiveness of the domestic products is by improving the
infrastructure support as is the case inMiddle East, China and Singapore.
Also going forward, as more natural gas becomes available in India, the
domestic players are likely to shift from naphtha to cheaper natural gas
thereby increasing their competitiveness in the market.
Ø More value-add products in portfolio: Demand for performance plastics such
as biodegradable polymers is expected to be on rise across the world
including India. Given the environment concerns with traditional plastics,
companies should look at expanding their portfolio and include more value
add products.
Ø Increased geographical presence: Given the capital intensive nature of the
project and high costs associated in India (due to no duty waivers, no/ very
less tax exemptions and high interest costs), the domestic companies may
also look outside for organic and inorganic opportunities. Many western
companies such as Dow, Shell, etc. are increasing their presence in energy
rich countries like Saudi Arabia, Kuwait, Qatar, etc. and setting up
manufacturing facilities.
Figure 20: Speciality Chemical Industry Future Outlook
Specialty Chemicals Industry Future Outlook (USD billion)
25
44
FY14 FY19 (E)
12%
Knowledge and Strategy Partner26 Knowledge and Strategy Partner 27
5.5 Key opportunities
Ø Availability of feedstock: For production of commodity petrochemicals, basic
building blocks like ethylene, propylene, etc. are required by crackers in
India. But unavailability of these in the production is a concern. Due to
alternate fuel availability like rap-seed oil, castor oil etc., Indian companies
can overcome the challenge by using alternative feedstock.
Ø Innovation: With a huge pool of technical human resource, scientists and
researchers, technology will play vital role in growth of this sector. With the
processes being very energy and resource intensive, there is an opportunity
to optimize at every step during production and operation.
billion USD. The end usage, which defines speciality chemicals, has been the key
growth driver in the past. This has led to increment in consumption. The growth
potential of consumption of speciality chemicals is strong and is expected to
reach ~44billion USD by FY19.Indian speciality chemicals production is
generally much higher than global standards, as the speciality chemicals usage
is at an early stage in India. Increase in GDP and Indian population will result in
consumption-driven growth in key end markets over the next decade and an
increased need for better products and services. Currently, the penetration of
speciality chemicals within India's end markets is low. With an increased focus
on improving products, usage intensity of speciality chemicals within these end
markets will rise in India over the next decade. Also, as the economy develops, on
stringent regulation of products and strengthening of consumption standards,
usage of speciality chemicals can be promoted.
5.3 Key Trends
Ø Focus on R&D: Spending on innovation has escalated. This is basically
because of the increased sales in the automotive and consumer electronics
segments. Recently, the focus has been shifting towards the R&D sector.
National research institutes like NCL and private sector companies are
concentrating on developing speciality chemicals and polymeric additives
for specific end user segments like automobile, textiles, etc.
Ø Green Transformation: A cohesive approach across the value chain
including procurement, product development, manufacturing process and
marketing along with adequate risk management and reporting at each step
is becoming critical. Companies establishing “Sustainable Leadership”
among all other stakeholders would have a distinct edge over others.
5.4 Key Challenges
Ø Improve infrastructure: There is a growing need to have adequate power
and water to support the utilities such as transportation, storage, etc. There
is poor connectivity by roads, rail and water which should be looked upon.
Ø Complex regulations: Currently, multiple licenses and certification are
required to operate a plant in India. The process for a new up and running
plant is very complex and tedious. This poses a resistance for new players.
Ø Develop better catalysts: There is a lack of good catalysts and processes for
better processing and value addition to feedstock. One of the key reasons is
the lack of autonomous research centres in catalysis.
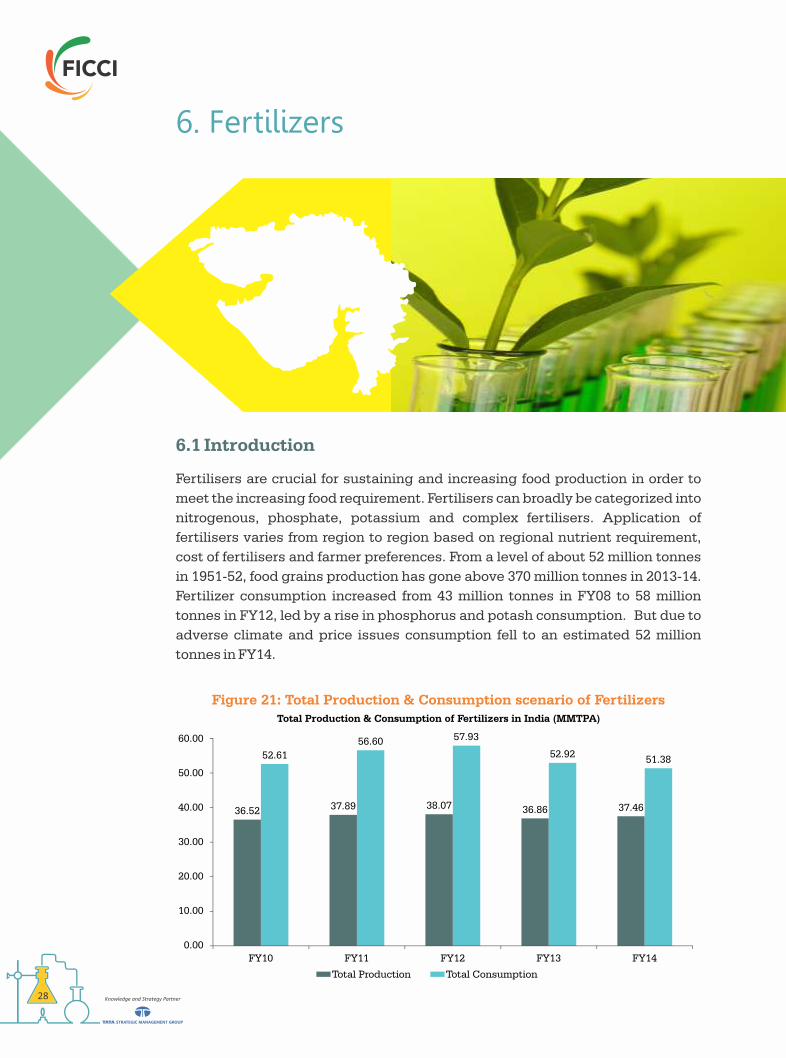
Knowledge and Strategy Partner 29Knowledge and Strategy Partner28
6.1 Introduction
Fertilisers are crucial for sustaining and increasing food production in order to
meet the increasing food requirement. Fertilisers can broadly be categorized into
nitrogenous, phosphate, potassium and complex fertilisers. Application of
fertilisers varies from region to region based on regional nutrient requirement,
cost of fertilisers and farmer preferences. From a level of about 52 million tonnes
in 1951-52, food grains production has gone above 370 million tonnes in 2013-14.
Fertilizer consumption increased from 43 million tonnes in FY08 to 58 million
tonnes in FY12, led by a rise in phosphorus and potash consumption. But due to
adverse climate and price issues consumption fell to an estimated 52 million
tonnes in FY14.
6.2 Market Outlook
Lack of monsoon and relatively higher prices of complex fertilizers has impacted
the overall consumption of fertilizers in 2014-15. The demand is expected to grow
at a CAGR ~3% as compared to the nogrowth in the past 5 years. Due to new
government policies, the fertilizer demand in India is expected to grow from
FY14to reach 71.5 Million tonnes in FY19, higher than the global growth rate of 2%
during the same period.Though urea consumption is expected to grow at
relatively slower pace, non-urea fertilisers would register a steady growth.
Companies' efforts to educate farmers about balanced usage of nutrients would
drive the demand of non-urea fertilisers.
6.3 Key Trends
Use of natural gas as feedstock for the production of urea is energy efficient and
cheaper. The current fertilizer policy is aimed towards increasing the use of
Natural Gas as a fuel. Government has been instrumental in this regards towards
motivating companies to use the alternative option.
6.4 Key Challenges
Demand for urea is expected to decline marginally by 1-2% in FY16 after growing
by 1% in the previous year. Also, the government's directive of neem-based
fertilizer production would mean lower volumes would be required as it releases
nitrogen content slowly into the soil and would check diversion of urea for other
purposes. Thus, urea demand is estimated to grow relatively slower at ~2%
CAGR to 33-35 Mntonnes over FY14 to FY19, compared with the previous 5 years
when urea consumption was estimated to have recorded a 3% CAGR.
6.5 Key Opportunities
The government is hopeful for players to develop and market innovative
formulations which could be tailored to a particular local soil and crop
requirements. Since subsidy would be given on the nutrient basis, players
developing newer formulations will be able to rate the products based on
demand.
6. Fertilizers
Figure 21: Total Production & Consumption scenario of Fertilizers
36.52 37.89 38.07 36.86 37.46
52.61
56.60 57.93
52.9251.38
60.00
50.00
40.00
30.00
20.00
10.00
0.00FY10 FY11 FY12 FY13 FY14
Total Production & Consumption of Fertilizers in India (MMTPA)
Total Production Total Consumption
Knowledge and Strategy Partner 31Knowledge and Strategy Partner30
7.1 Introduction
With growing population, food security has come up as a concern for India
recently. Agrochemicals have a major role to play, viz. enhancing productivity
and protecting the produce during and after harvest. Agrochemicals broadly
cover Insecticides, Fungicides, Herbicides, Bio-pesticides, etc. They are diluted
in recommended doses and applied on seeds, soil, irrigation water and crops to
prevent damage from pests, weeds and diseases. Insecticides are the largest
sub-segment of agrochemicals with 60% market share whereas herbicides with
16% market share are the fastest growing segment in India.
7.2 Market Outlook
Indian Agrochemical industry is valued at USD 4.25 billion in FY14 and is
estimated to grow at a CAGR of 12% to reach USD 7.5 billion by FY19. Out of this,
the domestic market is ~USD 2.25 billion in FY14. Almost 50% is constituted by
exports, which is expected to grow by 16% CAGR to reach USD 4.2 billion by
FY19, resulting in 60% market share in Agrochemical industry. On the other hand,
domestic market will grow at ~8% CAGR to reach USD 3.3 billion by FY19. India is
fourth largest producer of agrochemicals worldwide, after United States, Japan
and China.
7.3 Key Trends
Ø Focus on improvement and use of indigenous technologies such as pesticide
formulation, seed coating and use of hydrogels and soil conditioners can
further help in enhancing the productivity of a wide-ranging variety of crops
and broaden its reach in the overall region.
Ø Focus on R&D in bio-pesticides segment with increasing preference for
environmentally safe products in the market.
Ø Focus on development of new active ingredients, involving long-term toxicity
tests, meeting regulatory requirement, increase adoption of GM (genetically
modified) & biotech crops etc.
Ø Trend of contract farming is catching up in the Indian agriculture sector,
which may lead to faster technology transfer & adoption. Hence, the
development and effective usage of agrochemicals can empower every crop
across the nation; thereby contributing to raising rural economy.
7.4 Key Challenges
Ø Low awareness: Indian agrochemical industry faces challenges in terms of
low awareness among farmers, in spite of the strong growth drivers. Though,
7. Agrochemicals Indian Crop Protection Industry Outlook
Indian Crop Protection Industry (USD Billion)
Source: Industry Analysis by Tata Strategic
2.25
3.3
2
4.2
FY 14 FY 19
12%
16%
8%
USD 7.5 billionTotal
Exports
Domestic
USD 4.25 billion
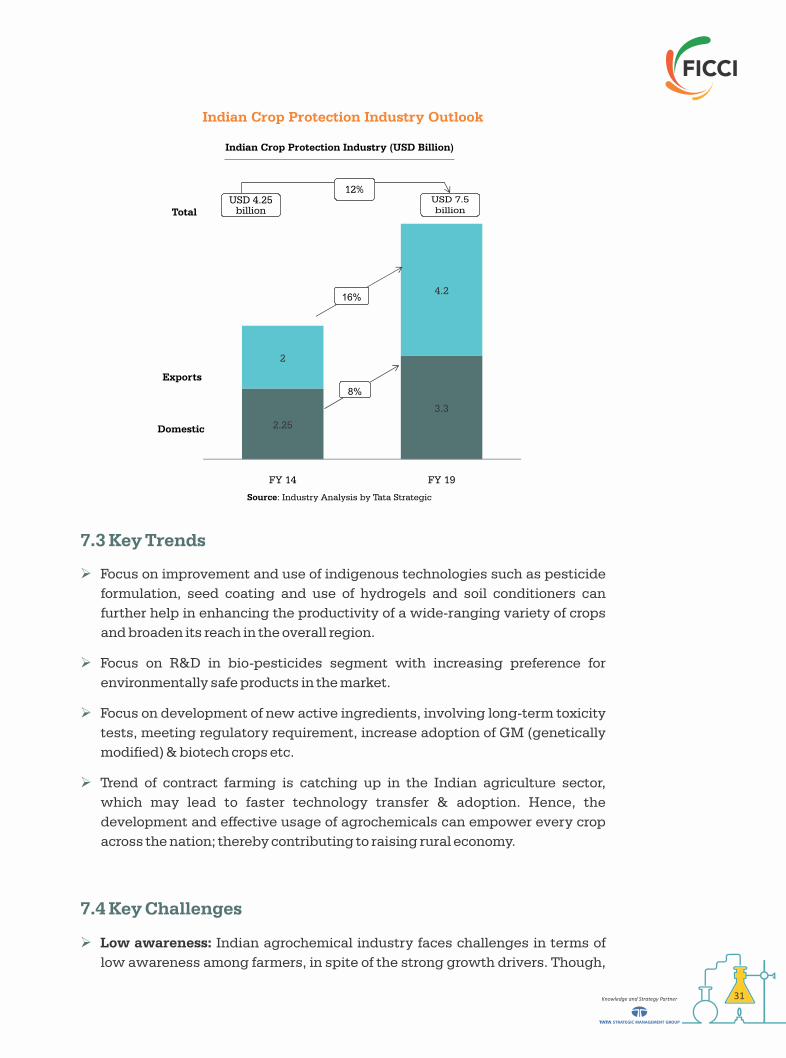
Knowledge and Strategy Partner 33Knowledge and Strategy Partner32
government bodies are taking initiatives towards a nationwide programme to
enhance the usage of agrochemical products among farmers. Larger
companies are conducting awareness camps for farmers and providing
complete solutions as part of their CSR activities and brand building.
Ø Spurious products: Inefficient products, from the unorganised sector, devoid
of any credibility, are reaching the end user negatively impacting the
revenues of the organised sector. The fake pesticides market size India was ~
USD 233 Mn in 2009.
Ø Expensive R&D: The gestation period of a new agrochemical molecule is an
estimated 9 years and ~USD 180 Mn. Typically, due to low returns and high
investments, Indian companies have not focussed on developing new
molecules. There is a need for the key players to develop these capabilities.
Ø Inefficient distribution system: The major end users being farmers located in
country side areas, effective distribution through retailers is crucial to ensure
that the products are available to them. Large corporations, lately, have been
assigning retailers to manage the distribution network to cut costs and other
resources.
7.5 Key Opportunities
Ø Immense growth potential: Currently, consumption levels of agrochemicals
is low; an estimated figure of 0.6 kg/ha as compared to world average of 3
kg/ha. So, there is huge potential for growth in future.
Ø Make in India: Due to abundance of cheap labour and low processing costs,
MNCs have an opportunity to setup their manufacturing hubs in India for their
export markets. The large pool of technically skilled labour in India is a key
driver for Indian players to initiate contract manufacturing and setup research
centres.
Ø Leveraging Export potential: India can use its low cost producer status to
increase exports and effectively manage the excess production capacity.
There is a need to establish an efficient supply chain both inside and outside
the territory.
8.1 Current Scenario
Natural gas demand in India is expected to grow from 242 million cu m/day in
fiscal 2012-13 to 378 in 2016-17 and 516 million cubic meters/day in fiscal 2021-22.
India is projected to import ~38% by 2016-17. Approximately, 19 % of the natural
gas demand was met through imports in 2012-13.
LNG imports were projected to rise sharply from 44.6 million cu m/day in 2012-13
to 143 million cu m/day (~38% of total imports) in fiscal 2016-17. The domestic
price of natural gas in USD 4.2/MMBTU and is expected to increase further in the
coming years. Natural gas, which is an essential feed stock for many Fertilizers
and Petrochemicals is allocated to priority sectors like Power, Fertilizer, CGD,
Refinery, Petrochemicals in that order. Therefore, petrochemical industry has to
depend on imported gas which is expensive.
Natural Gas is a major feedstock for the production of ammonia and majority of
the ammonia produced is used in the manufacturing of fertilizers. It is also the
feed stock for gas cracker which produces ethylene. Ethylene is in turn used in
the manufacture of Polyethylene, Mono Ethylene Glycol (MEG), PVC, Styrene etc.
8.2 The Possibility
In order to meet the supply gap in a sustainable manner, Indian companies can
either explore the possibility of setting up downstream plants and cracker in the
countries rich in these resources or invest in these plants and secure an off-take
agreement.
8. Reverse SEZ – An opportunity for Indian chemicals & Petrochemicals Industry
Knowledge and Strategy Partner 35Knowledge and Strategy Partner34
Select regions globally such as Mozambique, Iran & Myanmar can be good
investment options for us as they are resource rich but lack technical know-how,
capital or both to build their own industry. These countries are also low on
priority for other countries due to their macroeconomic situation. This can be an
opportunity for Indian companies wherein help can be provided to these
countries to develop their Chemical & Petrochemical industry by providing
capital/ sharing technical know-how and in return get access to gas at
competitive prices.
8.3 Way Forward
All the three countries (Mozambique, Iran & Myanmar) are rich in natural gas and
a source of cheap natural gas. Iran is also rich in crude. Select Indian companies
have seen these opportunities and have either already invested or exploring the
possibility of investing in these countries. The chemical & petrochemical
industry is still at the nascent stage in all these three countries. Indian
companies can share know-how, provide capital or build their own plants to reap
economic benefits. As there is a cheap availability of feedstock, Indian
companies can explore the following:
Ø Setup a gas cracker to produce ethylene and its derivatives. These can be sent
to India for the manufacture of further downstream value added products. For
example, India is a net importer of MEG. MEG can be manufactured in these
countries and can be sent to India for the manufacture of PET or Polyester
fibers.
Ø Co-invest in upcoming plants and secure an off-take agreements
Ø Co-invest in an integrated complex in Iran and other possible geographies
Ø Setup fertilizer plants in these countries to cater to demand both at these
geographies as well as India
The Indian government can encourage such investments by incentivizing the
import of products manufactured from such locations. The Indian government
has to work closely with the governments of these countries to implement this
model and provide sufficient protection to the companies investing in these
countries.
1. India Brand Equity Foundation's Sectorial report - August 2015
2. Report of the Sub-group on Petrochemicals for the 12th Five Year Plan
3. India Petrochemicals Industry Outlook to 2015
4. ICRA report on Indian fertilisers and Agri-Inputs Sector – August 2015
5. Press Information Bureau ,Government of India, Ministry of Chemicals and
Fertilizers
6. FICCI's report in Indian Agrochemical Industry
7. Report of the working group on fertilizer industry for the 12th plan(FY13-
FY17)
8. Indiachem report on Indian chemicals and petrochemicals sector, 2014
9. Chemicals & Petrochemicals statistics at a glance : 2014
10. Business Standard's articles
11. CRISIL's report on Indian agrochemical sector
12. India Brand Equity Foundation's report on Indian Inorganic chemicals
13. A brief report on Chemical and Petrochemical Industry in India – April
2015
14. Report by Dept. of Fertilizers, Ministry of Chemicals and Fertilizers,
Government of India - Indian Fertilizer Scenario 2014
15. CRISIL's report on “Demand for non-urea fertilisers to improve gradually”
16. Planning commission's report on Indian Chemical Industry; Five Year Plan
2012-17
17. Previous reports by TATA Strategic Management Group
References
Knowledge and Strategy Partner 37Knowledge and Strategy Partner36
Crop Protection Chemicals
industry-Imperatives of growthby
Mr. P. S. Singh
1. The future of Crop Protection Chemicals industry is bright. It is expected to
grow at a CAGR of 12% between FY 14 and FY 19 to reach USD 7.5 Bn. In
coming years, agrochemical industry should focus on developing new
processes and products with sustainability as the core principle. This requires
developing a collaborative platform in which the academia, government and
regulatory bodies, farmers associations, manufacturers and farmers come
together to promote safe and judicious usage of pesticides. Going ahead,
opportunities for the Indian crop protection industry will come from exports,
higher production of generic products, product portfolio expansion, and
growth in herbicides and fungicides.
2. In coming years, the need for safe and effective use of crop protection
chemicals will further increase to brace with larger climatic variations and
emergence of new invasive insects, weeds and diseases. Hence, it is
important for companies to invest today in science and practices which
promote safe and judicious use of crop chemicals. Judicious use of pesticides
implies using the right product, with correct dosage and with correct
application methodology. When used judiciously, the products deliver
maximum impact on the target species. Therefore, it is critical for both the
government and for Crop Protection Chemicals manufacturers to work closely
with the farmers and farmers associations to educate them on safe and
judicious use of existing pesticides as well as advancements happening in
products on a regular basis.
3 Internally, crop protection products manufacturers can also consider
performing a process and environmental impact audit of their existing
products and adopt green chemistry practices. To move to “green practices”,
in the short term, companies can implement zero discharge solutions, adopt
COD reduction techniques and develop collaborative platforms. In the
medium term, companies can implement solvent recovery practices, explore
alternate green solvents, evaluate biocatalysts and microwave chemistry
technology. Over the long term, companies may also focus on developing
biopesticides, implement process innovation to achieve a better material
balance and build symbiotic relationships with key stake holders. Embracing
farmers to promote judicious usage of crop protection products will be an
appropriate way to develop a long term sustainable business model in Crop
Protection Chemicals.
4. For a sustainable growth it is imperative for crop protection chemicals
manufacturers to adopt green chemistry processes, develop new products
which are nearly 100% green and increase their focus on educating and
training the farmers for proper usage of Crop Protection Chemicals. Focus on
Green Chemistry will help the companies to design new products and
processes with sustainability as the core principle. Over the long term, this
will help the companies to differentiate themselves and build competitive
advantage. Government should also look to curb the menace of spurious
pesticides.
5. However, the industry cannot implement the green chemistry practices in
isolation. It is imperative to build a collaborative ecosystem in which the
academia, industry, government and regulatory bodies come together and
create opportunities for the industry, academia and the Entrepreneurs to test,
scale-up and commercialize their ideas in the domain of green chemistry
practices. Ideas or concepts with potential should be nurtured and adequate
support should be provided for scale-up and commercialization. This would
encourage creation of inventions and innovations 24
6. With Government's current campaign on 'Make in India' which has a special
focus on the chemical industry and aims to turn the country into a global
manufacturing hub, good infrastructure and adoption of cluster approach(in
which like minded industry shares common infrastructure and thus bringing
down the over-all cost. Government could also consider giving same excise
treatment to crop protection chemicals, as to fertilizers and seeds as all of
them facilitate the agriculture sector.
7. The future indeed is bright for Indian Crop protection chemicals industry, as a
facilitator of the Indian agriculture as also of national economy.

Knowledge and Strategy Partner 39Knowledge and Strategy Partner38
Founded in 1991 as a division of Tata
I n d u s t r i e s L t d , Ta t a S t r a t e g i c
Management Group is the largest Indian
own management consulting firm. It has
a 50 member strong consulting team
supported by a panel of domain experts.
Tata Strategic has undertaken 1000+
engagements, with over 300 clients,
across countries and sectors.
It has a growing client base outside India
with increasing presence outside the Tata
Group. A majority of revenues now come
from outside the group and more than 20%
revenues from clients outside India.
Tata Strategic offers a comprehensive
range of solutions covering Direction
Setting, Driving Strategic Initiatives and
Implementation Support
Our Offerings
Tata Strategic Contacts
Manish Panchal
Practice Head – Chemicals, Energy & Logistics
E-mail: [email protected]
Phone: +91 22 6637 6713
Karthikeyan.K.S
Principal – Chemicals
E-mail: [email protected]
Phone: +91 22 6637 6756
About Tata Strategic
Report co-authored by Naina Malani ([email protected]) and Manish
Ratna([email protected]), TATA Strategic Management Group.

Knowledge and Strategy Partner40
About FICCI (Federation of Indian Chamber
of Commerce and Industry)
Established in 1927, FICCI is the largest and oldest apex business organisation in
India. Its history is closely interwoven with India’s struggle for independence, its
industrialization, and its emergence as one of the most rapidly growing global
economies.
A non-government, not-for-profit organisation, FICCI is the voice of India’s business
and industry. From influencing policy to encouraging debate, engaging with policy
makers and civil society, FICCI articulates the views and concerns of industry. It
serves its members from the Indian private and public corporate sectors and
multinational companies, drawing its strength from diverse regional chambers of
commerce and industry across states, reaching out to over 2,50,000 companies.
FICCI provides a platform for networking and consensus building within and across
sectors and is the first port of call for Indian industry, policy makers and the
international business community.
FICCI Contacts
Mr. P. S. Singh
Head-Chemicals & Petrochemicals Division
FICCI
Federation House, 1 Tansen Marg,
New Delhi-110001
Tel: +91-11-23316540 (Dir)
Email: [email protected]
Ms. Rinky Sharma
Research Associate,
Chemicals & Petrochemicals FICCI
Federation House, 1 Tansen Marg,
New Delhi -110001
T: 011-23487473 (Ext: 473)
Email:[email protected]

Industry’s Voice for Policy Change
Top Related