


Languages
Pages
Legal


A Rank-by-Feature Framework for Interactive Multi-dimensional
Data Exploration
Jinwook Seo and Ben Shneiderman
Human-Computer Interaction Lab. &
Department of Computer Science
University of Maryland, College Park

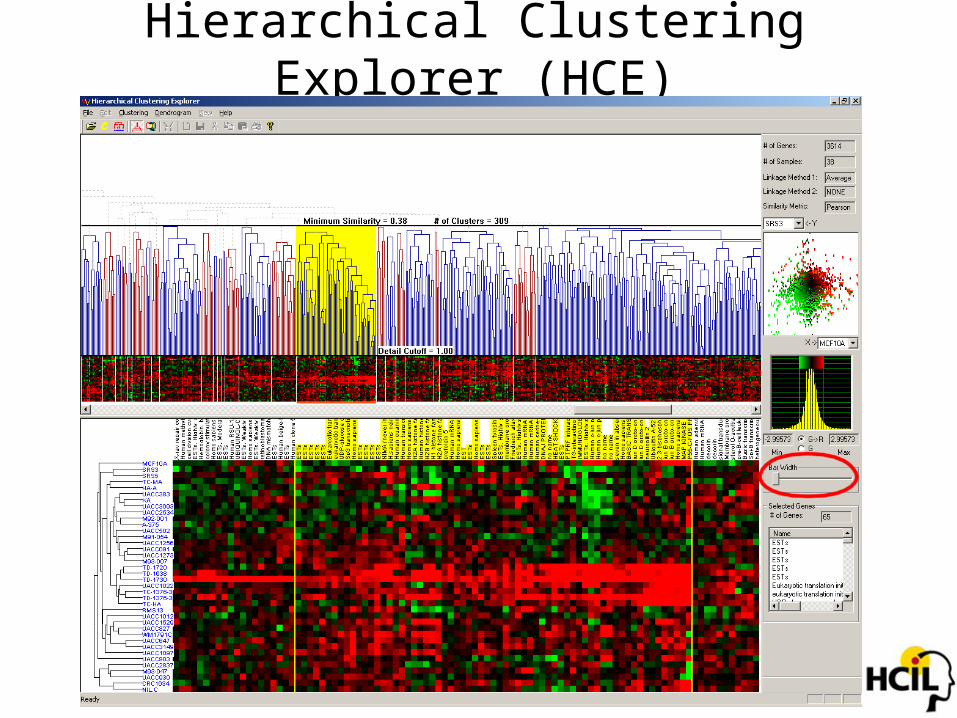
Hierarchical Clustering Explorer (HCE)
“HCE enabled us to find important clusters that we don’t know about yet.”
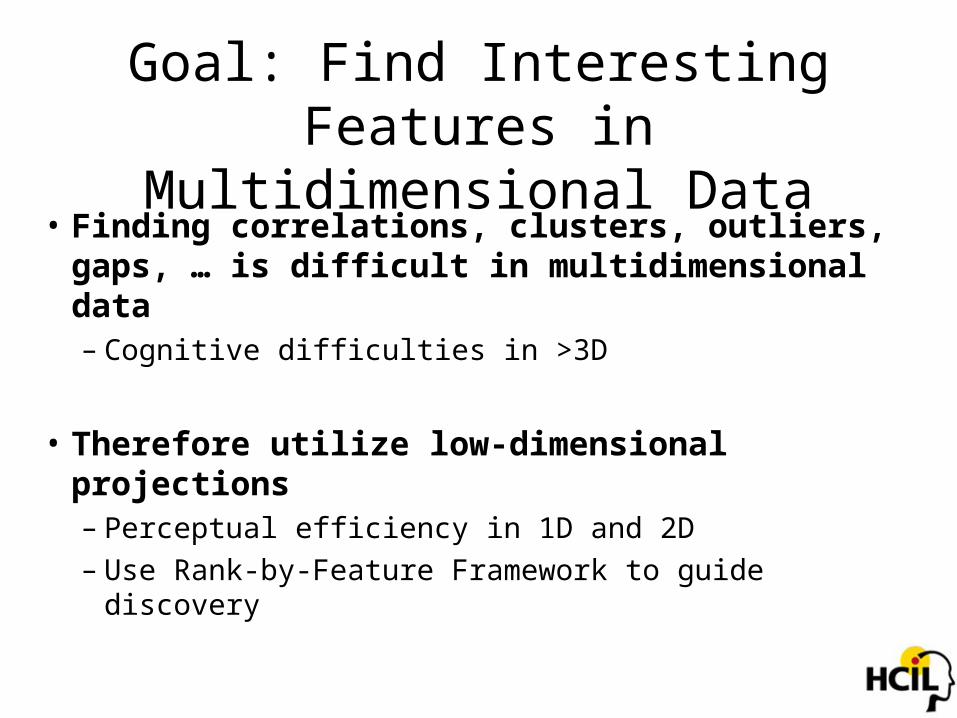
Goal: Find Interesting Features in Multidimensional Data
• Finding correlations, clusters, outliers, gaps, … is difficult in multidimensional data– Cognitive difficulties in >3D
• Therefore utilize low-dimensional projections– Perceptual efficiency in 1D and 2D– Use Rank-by-Feature Framework to guide discovery

Do you see any interesting feature?Scatter Plot
Ionization Energy50 75 100 125 150 175 200 225 250
0
10
20
30
40
50

Correlation…What else?Scatter Plot
Ionization Energy50 75 100 125 150 175 200 225 250
0
10
20
30
40
50
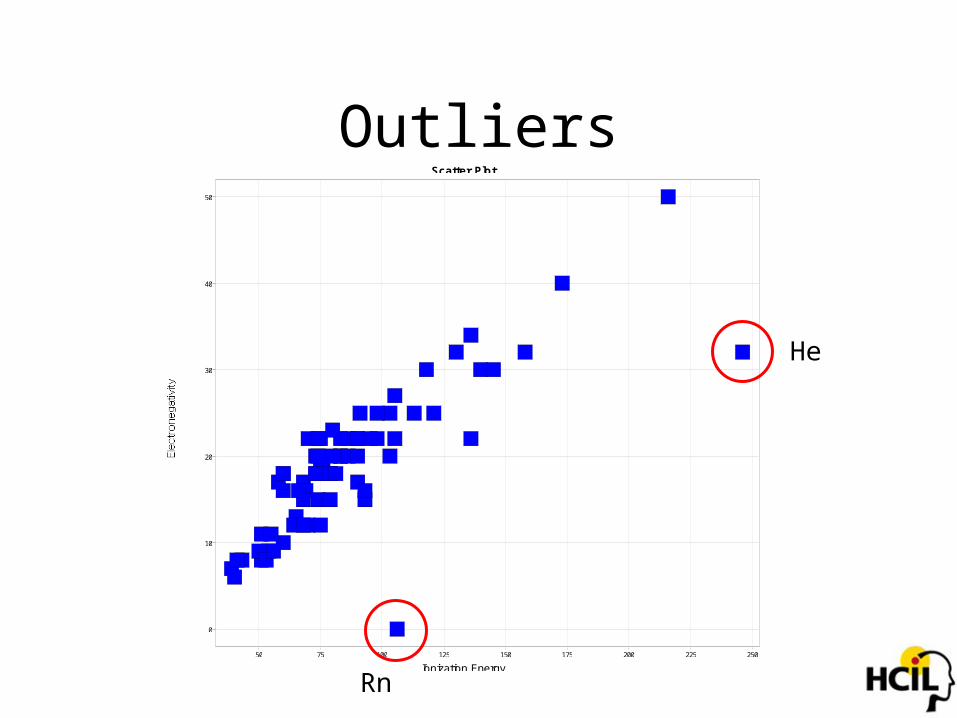
OutliersScatter Plot
Ionization Energy50 75 100 125 150 175 200 225 250
0
10
20
30
40
50
He
Rn
Demonstration
• Breakfast Cereals– 77 cereals– 8 dimensions (or variables) : sugar, potassium,
fiber, protein, etc.
• US counties census data– 3138 counties– 14 dimensions : population density, poverty
level, unemployment, etc.
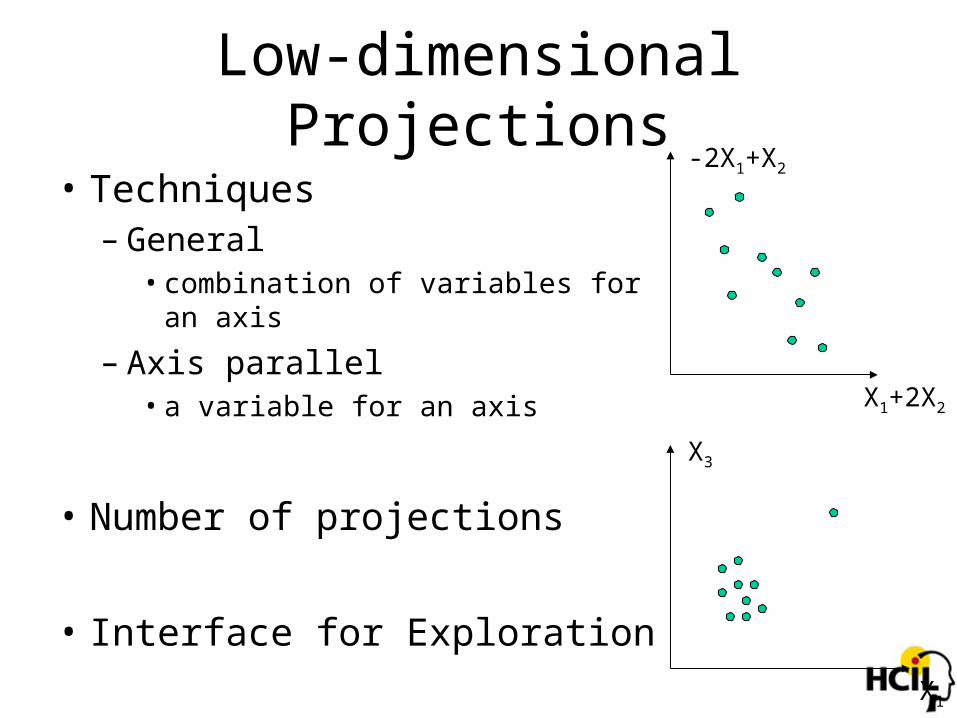
Low-dimensional Projections
• Techniques– General
• combination of variables for an axis
– Axis parallel • a variable for an axis
• Number of projections
• Interface for Exploration
X1+2X
2
-2X1+X2
X1
X3

Exploration by Projections• XGobi, GGobi – Scatterplot Browsing
www.ggobi.orgwww.research.att.com/areas/stat/xgobi/
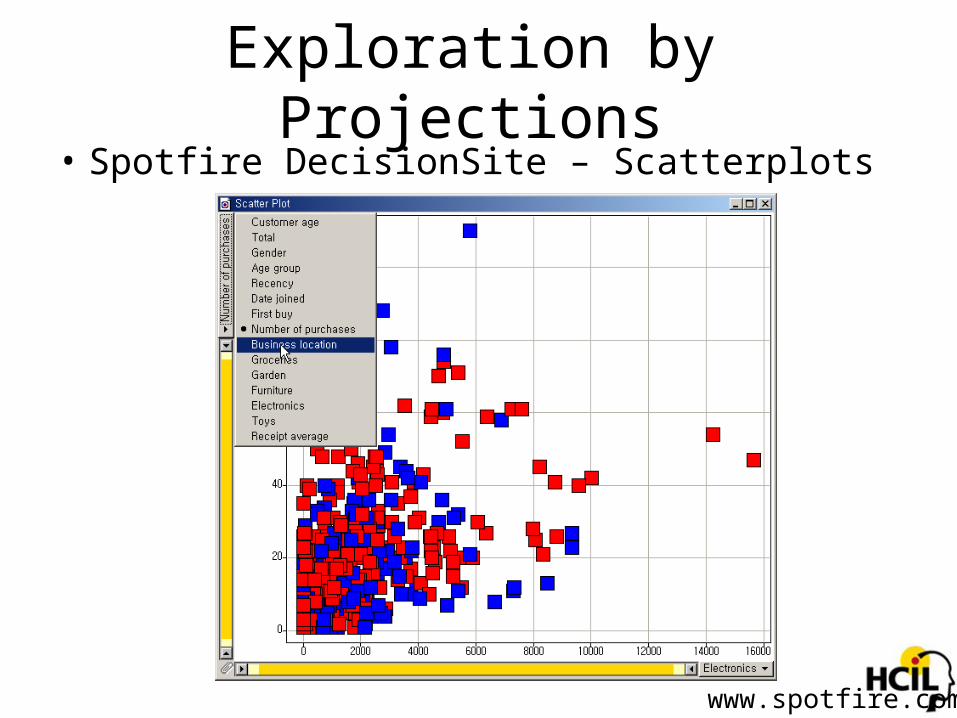
Exploration by Projections• Spotfire DecisionSite – Scatterplots
www.spotfire.com

Exploration by Projections• XmdvTool – Scatterplot Matrix
Worcester Polytechnic Institute
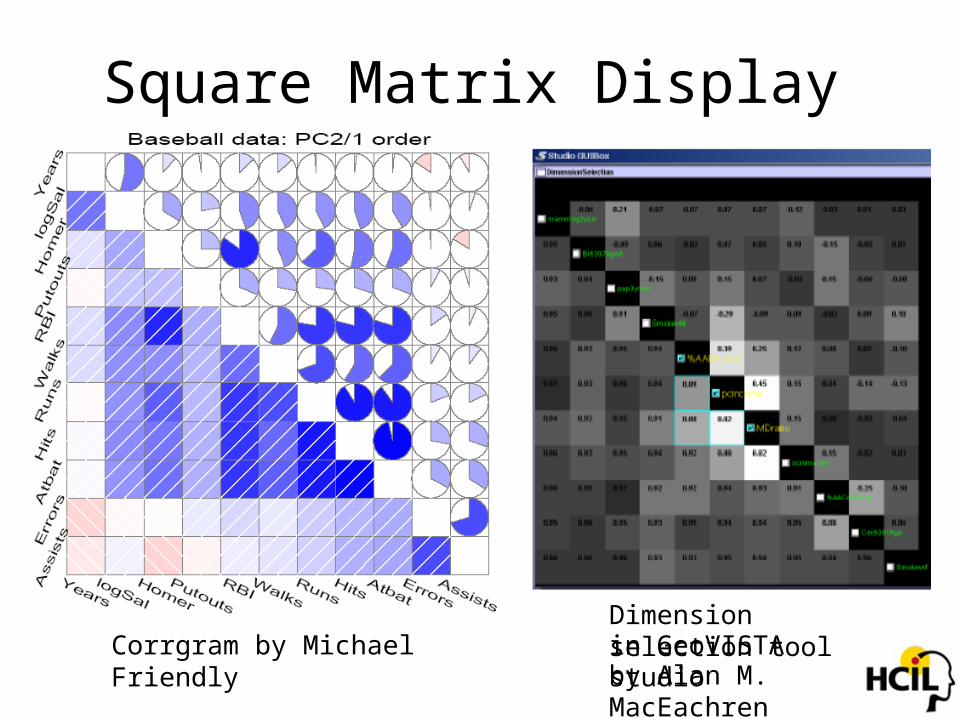
Dimension selection toolCorrgram by Michael Friendly
Square Matrix Display
in GeoVISTA studioby Alan M. MacEachren
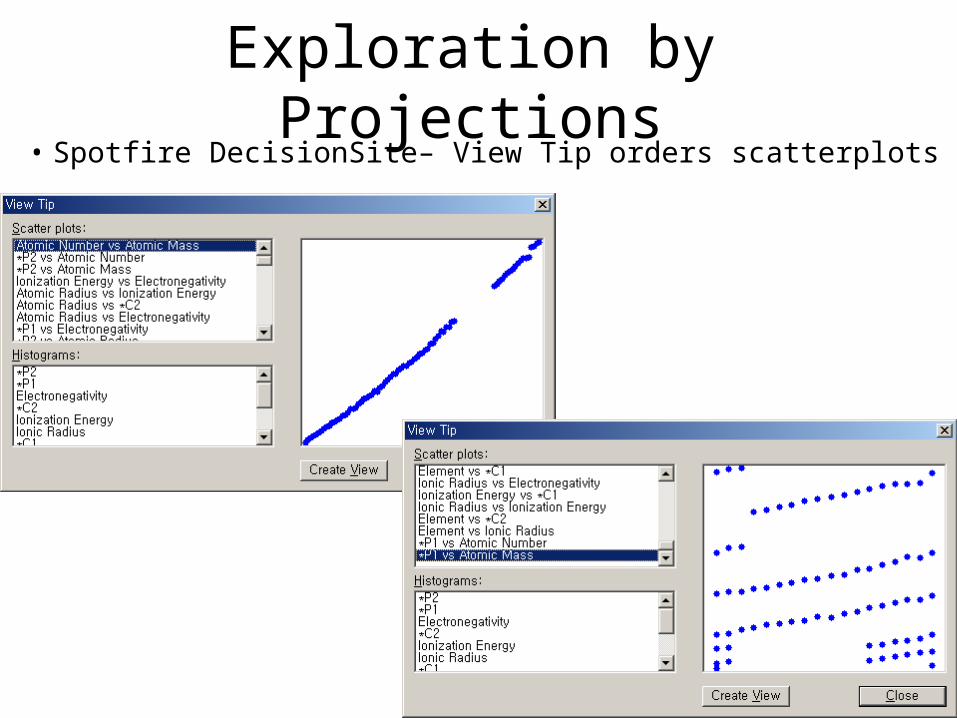
Exploration by Projections• Spotfire DecisionSite– View Tip orders scatterplots

Design Considerations
• Hard to interpret arbitrary linear projections Axis-parallel projections
• Interestingness depends on applications Incorporate users’ interest
• Overview of all possible projections
• Rapid change of axis

Demonstration
• Breakfast Cereals– 77 cereals– 11 dimensions (or variables) : sugar, potassium,
fiber, protein, etc.
• US counties census data– 3138 counties– 14 dimensions : population density, poverty
level, unemployment, etc.

Rank-by-Feature Framework: 1DRanking Criterion
Rank-by-Feature Prism
Score List
Manual Projection
Browser

Rank-by-Feature Framework: 2DRanking Criterion
Rank-by-Feature Prism
Score List
Manual Projection
Browser

Ranking Criterion: Pearson correlation (0.996, 0.31, 0.01, -0.69)
Ranking Criterion: Uniformity (entropy) (6.7, 6.1, 4.5, 1.5)
A Ranking Example3138 U.S. counties with 17 attributes

Ongoing and Future Work
• Identify & implement more ranking criteria– Gaps, outliers, etc.
• Ranking based on users’ selection of items– Separability of the selected items– Ranking by using only the selected items
• Scalability Issue– How to handle a large number of dimensions– Grouping by clustering dimensions – Filtering uninteresting entries in the prism
More about HCE
• In collaboration and sponsored by Eric Hoffman: Children’s National Medical Center
• Freely downloadable at www.cs.umd.edu/hcil/hce
• Version 3.0 beta, May 2004
• About 2,000 downloads since April 2002
• Licensing to ViaLactia Biosciences (NZ) Ltd.
More Applications?
• Try HCE and the Rank-by-Feature Framework with your problems and data
• Join the case studies on the use of HCE and the Rank-by-Feature Framework
• Welcome suggestions and comments
Top Related