


Languages
Pages
Legal


University of San Diego University of San Diego
Digital USD Digital USD
Dissertations Theses and Dissertations
2014-05-01
A Multi-Level Investigation of Leadership Effectiveness and A Multi-Level Investigation of Leadership Effectiveness and
Systems Awareness in the Leadership Circle Profile Systems Awareness in the Leadership Circle Profile
Crystal L. Dujowich PhD University of San Diego
Follow this and additional works at: https://digital.sandiego.edu/dissertations
Part of the Leadership Studies Commons
Digital USD Citation Digital USD Citation Dujowich, Crystal L. PhD, "A Multi-Level Investigation of Leadership Effectiveness and Systems Awareness in the Leadership Circle Profile" (2014). Dissertations. 855. https://digital.sandiego.edu/dissertations/855
This Dissertation: Open Access is brought to you for free and open access by the Theses and Dissertations at Digital USD. It has been accepted for inclusion in Dissertations by an authorized administrator of Digital USD. For more information, please contact [email protected].

A MULTI-LEVEL INVESTIGATION OF LEADERSHIP EFFECTIVENESS AND SYSTEMS AWARENESS IN THE LEADERSHIP CIRCLE PROFILE
by
CRYSTAL L. DUJOWICH
A dissertation submitted in partial fulfillment o f the requirements for the degree of
Doctor o f Philosophy
May, 2014
Dissertation Committee
Fred J. Galloway, Ed.D.Zachary Gabriel Green, Ph.D.
Cheryl Getz, Ed.D.
University o f San Diego
School of Leadership and Education Sciences
University o f San Diego
ABSTRACT
Leadership is a complex and multifaceted phenomenon, with scholarly literature
that documents the progression from leaders focused on inspiring transformation in
others, to leaders who can engage entire systems towards more globally conscious and
ethically focused actions. Such leadership involves increasingly complex relationships,
perspectives and context. Empirical contributions to the study o f leadership, however,
have remained focused on the individual and thus limited to a single level o f analysis. As
researchers acknowledge the dynamic process o f leadership, it is paramount that studies
identify and investigate the multiple layers o f analysis present.
This study sought to uncover patterns in leadership effectiveness by statistically
interpreting the variance that existed at multiple levels o f analysis. Utilizing The
Leadership Circle Profile, an existing 360-degree instrument which integrates leadership
competencies and internal assumptions that span leadership theories and are correlated
with stages o f adult development, this study employed multi-level modeling techniques
(MLM). Specifically, leadership effectiveness was examined as it varied among
participants (level-one) and across industries (level-two). Hypothesis testing revealed that
gender, ethnicity, management, and education levels were positively-oriented predictors
o f leadership effectiveness. However, second-level variance was found not to be best
explained by leadership effectiveness; instead, exploratory MLM analysis revealed that
systems awareness was a particularly powerful construct when understood from an
organizational perspective. Additional analyses were conducted and revealed that in
addition to gender, other predictors o f systems awareness were age, industry type,
management, and education levels, as well as the distance score between self and others.
This study extends the literature by demonstrating the importance o f context, in
that as the models gradually incorporated first and second level predictors, the emphasis
and contribution o f predictors changed. Thus, this study provided evidence for the
consideration of more complex empirical studies in leadership and emphasized the
marked difference o f practicing leadership with systems awareness. Further, the findings
o f gender, education, and management level support the development o f personal and
professional growth while highlighting the significance o f feminine leadership. Indeed, as
global growth requires a deeper understanding of resources and complex relationships,
effective leadership will need to be met with heightened capacity in systems awareness.

© Copyright by Crystal L. Dujowich, 2014 All Rights Reserved

DEDICATION
To the pursuit o f a more globally conscious and ethically grounded leadership, to
our highest selves, and to the communities that shape us.
ACKNOWLEDGEMENTS
This work would not have been possible without the support and guidance of
several individuals.
First and foremost, I would like to thank Bob Anderson and Marilyn Demond
from The Leadership Circle Profile. They provided access, opportunity, and were readily
available and willing to assist.
Next, a heartfelt thank you is extended to my committee. In many ways, they
represented my journey and path for the past five years in truth, love, and spirit.
Dr. Galloway, you have my admiration for your pursuit o f truth and passion for
sharing that knowledge with your students. You have taught me the value o f making our
work accessible and illuminated the power o f telling the story. Indeed, each student
deserves to have a champion such as you and I am grateful for your fearless leadership
and unwavering support.
Dr. Green, thank you for continuing to push my edge, for your love in support and
in challenge, and for fostering curiosity that undoubtedly has seeded a lifetime of
purposeful work. Your ability to consider the spectrum of possibilities both
professionally and personally, has promoted growth for my betterment. I know that our
work has just begun and look forward to what emerges - it is on the horizon.
Dr. Getz, thank you for leading by example, indicating the deep spiritual side of
leadership and service, depicting what it means to be present, and suspending oneself for
the space and growth o f others. The frequency and depth to which you answered such
calls for me can only be met with deep love, gratitude, and appreciation for your spirit.
To all o f my committee members, a sincere thank you for your trust, faith, and
love. All o f you have taught me that it is not simply enough to consider leadership but
rather, one needs to live it.
O f course, the work of this document conceals many others who were pivotal to
its creation and my journey. Thank you to Heather Gibb, Beth Garofalo and Linda Dews
who supported me in so many ways during my time at the university. You place endless
care into your work and students, and for that I am grateful. Thank you to my friends and
family, who constantly reminded me o f my strengths and capacity. This journey would
not have been possible without you “rascals”. Finally, my deepest gratitude is extended
to my two very dearest friends, my partners in life, in inquiry, and in love. Thank you for
the continual hours of support, conceptualization, and consideration.
viii
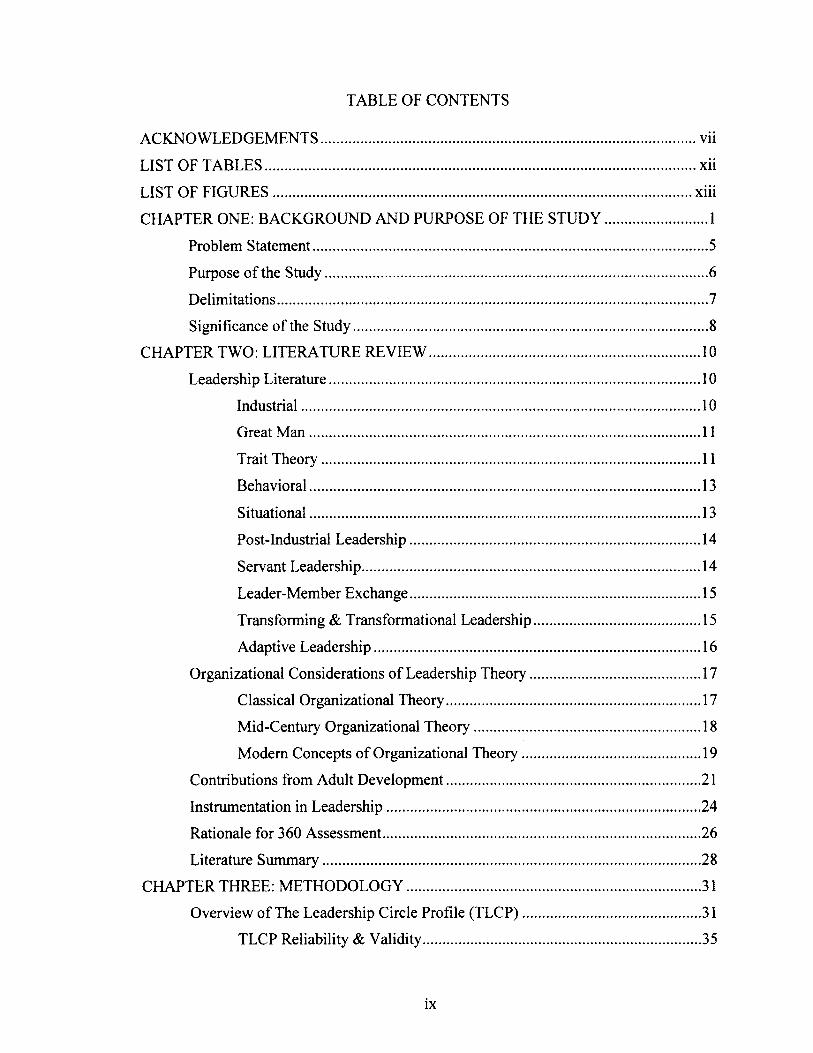
TABLE OF CONTENTS
ACKNOWLEDGEMENTS....................................................................................................... vii
LIST OF TABLES...................................................................................................................... xii
LIST OF FIGURES.......................................................................................................... xiii
CHAPTER ONE: BACKGROUND AND PURPOSE OF THE STUDY............................ 1
Problem Statement............................................................................................................5
Purpose o f the Study.........................................................................................................6
Delimitations......................................................................................................................7
Significance o f the Study.................................................................................................8
CHAPTER TWO: LITERATURE REVIEW.......................................................................... 10
Leadership Literature......................................................................................................10
Industrial............................................................................................................. 10
Great M an........................................................................................................... 11
Trait Theory........................................................................................................11
Behavioral........................................................................................................... 13
Situational...........................................................................................................13
Post-Industrial Leadership................................................................................14
Servant Leadership.............................................................................................14
Leader-Member Exchange................................................................................15
Transforming & Transformational Leadership..............................................15
Adaptive Leadership......................................................................................... 16
Organizational Considerations o f Leadership Theory...............................................17
Classical Organizational Theory......................................................................17
Mid-Century Organizational Theory.............................................................. 18
Modem Concepts o f Organizational Theory.................................................19
Contributions from Adult Development..................................................................... 21
Instrumentation in Leadership......................................................................................24
Rationale for 360 Assessment.......................................................................................26
Literature Summary....................................................................................................... 28
CHAPTER THREE: METHODOLOGY................................................................................ 31
Overview of The Leadership Circle Profile (TLCP).................................................31
TLCP Reliability & Validity............................................................................35
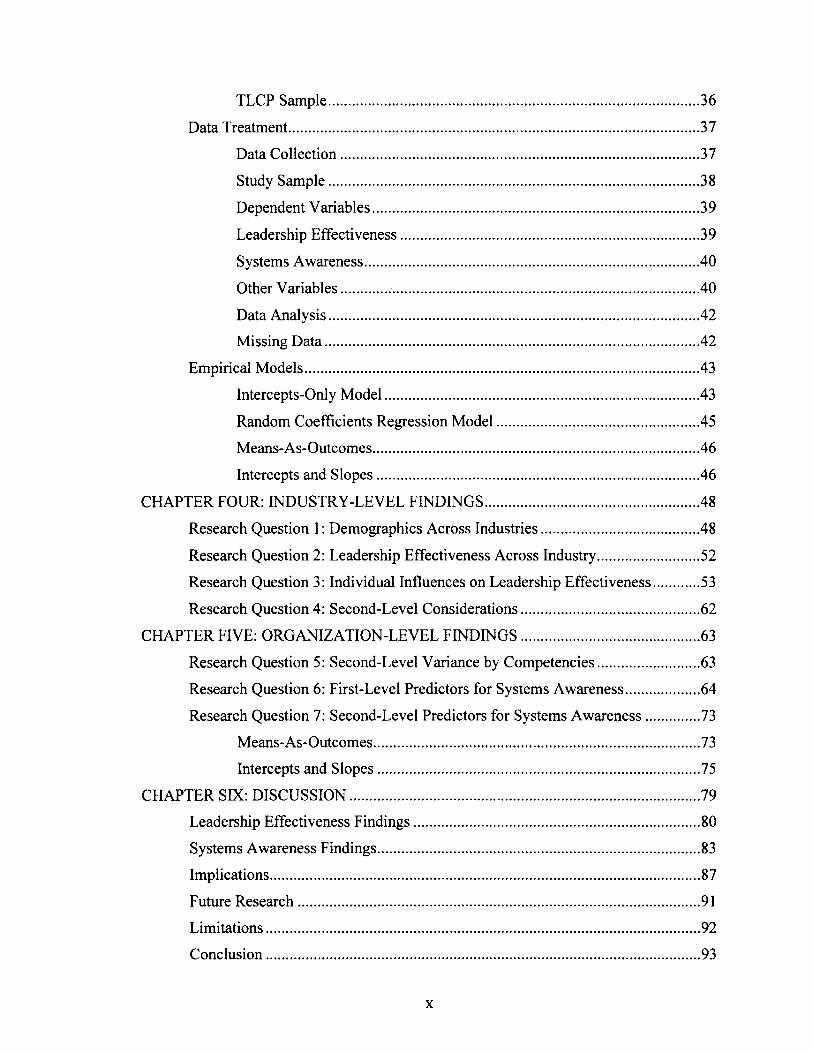
TLCP Sample..................................................................................................... 36
Data Treatment................................................................................................................ 37
Data Collection.................................................................................................. 37
Study Sam ple..................................................................................................... 38
Dependent Variables......................................................................................... 39
Leadership Effectiveness................................................................................. 39
Systems Awareness........................................................................................... 40
Other Variables..................................................................................................40
Data Analysis..................................................................................................... 42
Missing D ata...................................................................................................... 42
Empirical Models............................................................................................................43
Intercepts-Only M odel......................................................................................43
Random Coefficients Regression M odel....................................................... 45
Means-As-Outcomes......................................................................................... 46
Intercepts and Slopes........................................................................................46
CHAPTER FOUR: INDUSTRY-LEVEL FINDINGS.......................................................... 48
Research Question 1: Demographics Across Industries...........................................48
Research Question 2: Leadership Effectiveness Across Industry............................52
Research Question 3: Individual Influences on Leadership Effectiveness.............53
Research Question 4: Second-Level Considerations.................................................62
CHAPTER FIVE: ORGANIZATION-LEVEL FINDINGS.................................................63
Research Question 5: Second-Level Variance by Competencies............................63
Research Question 6: First-Level Predictors for Systems Awareness.................... 64
Research Question 7: Second-Level Predictors for Systems Awareness...............73
Means-As- Outcomes......................................................................................... 73
Intercepts and Slopes........................................................................................75
CHAPTER SIX: DISCUSSION................................................................................................79
Leadership Effectiveness Findings.............................................................................. 80
Systems Awareness Findings........................................................................................ 83
Implications..................................................................................................................... 87
Future Research..............................................................................................................91
Limitations...................................................................................................................... 92
Conclusion...................................................................................................................... 93
x
REFERENCES............................................................................................................................ 95
APPENDICES........................................................................................................................... 104
A. The Leadership Circle Profile Letter of Consent................................................104
B. Industries within TLCP...........................................................................................106
C. Demographics Across Industries........................................................................... 108
D. ICC Calculations......................................................................................................114
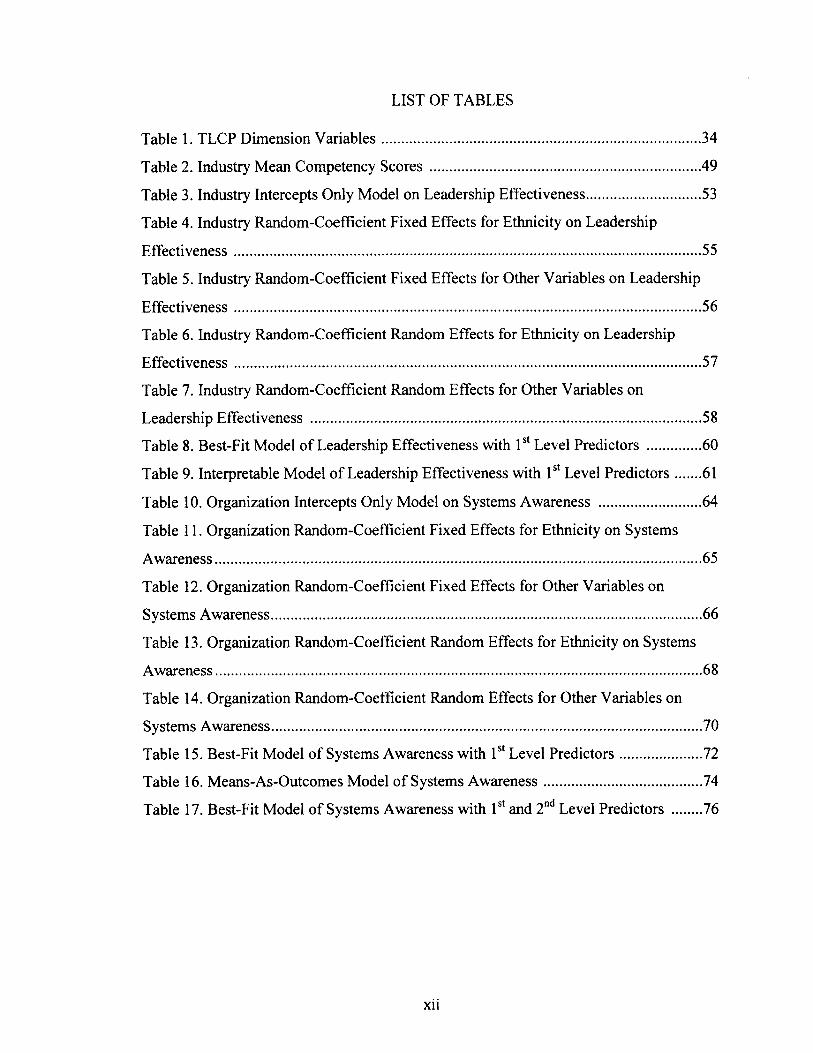
LIST OF TABLES
Table 1. TLCP Dimension V ariables....................................................................................... 34
Table 2. Industry Mean Competency S co res ..........................................................................49
Table 3. Industry Intercepts Only Model on Leadership Effectiveness............................... 53
Table 4. Industry Random-Coefficient Fixed Effects for Ethnicity on Leadership
Effectiveness................................................................................................................................55
Table 5. Industry Random-Coefficient Fixed Effects for Other Variables on Leadership
Effectiveness................................................................................................................................56
Table 6. Industry Random-Coefficient Random Effects for Ethnicity on Leadership
Effectiveness................................................................................................................................57
Table 7. Industry Random-Coefficient Random Effects for Other Variables on
Leadership Effectiveness ...........................................................................................................58
Table 8. Best-Fit Model o f Leadership Effectiveness with 1st Level Predictors ...............60
Table 9. Interpretable Model o f Leadership Effectiveness with 1st Level Predictors 61
Table 10. Organization Intercepts Only Model on Systems Awareness ............................64
Table 11. Organization Random-Coefficient Fixed Effects for Ethnicity on Systems
Awareness.....................................................................................................................................65
Table 12. Organization Random-Coefficient Fixed Effects for Other Variables on
Systems Awareness......................................................................................................................66
Table 13. Organization Random-Coefficient Random Effects for Ethnicity on Systems
Awareness.....................................................................................................................................68
Table 14. Organization Random-Coefficient Random Effects for Other Variables on
Systems Awareness......................................................................................................................70
Table 15. Best-Fit Model of Systems Awareness with 1st Level Predictors......................72
Table 16. Means-As-Outcomes Model o f Systems A w areness........................................... 74
Table 17. Best-Fit Model o f Systems Awareness with 1st and 2nd Level Predictors ..........76

LIST OF FIGURES
Figure 1. TLCP Dimension G raphic .....................................
1
CHAPTER ONE
BACKGROUND AND PURPOSE OF THE STUDY
Leadership must be more conscious. In a world of depleting resources and
competing gains, leaders must find ways to envision new potentials. Indeed, Western
(2008) called for such action through the formalization o f the eco-leader discourse, which
among other principles required an understanding of connectivity or systems thinking,
eco-ethics, and leadership spirit. However, such concepts can seem soft when, western
leadership has traditionally been performance-driven, associated with role, and power.
So then, what constitutes effective leadership? While leadership effectiveness
and effective leadership can be considered constructs in and o f themselves, many major
theories in leadership imply a positive impact on performance and more frequently than
not, each theory is coupled with an instrument for assessment purposes. For example,
Kroeck, Lowe & Brown (2004) outlined at least 30 such instruments explaining that the
spectrum of assessments can be understood by foundational theories, methods of
implementation, types of raters, and the questions they answer. While trait-based
measures like the Multifactor Leadership Questionnaire for Research (MLQ) have been
the most widely utilized (Avolio & Bass, 2004), behavioral and competency based
models like the Leader Behavior Description Questionnaire (LBDQ), the Leadership
Opinion Questionnaire (LOQ), and the Leader Member Exchange Measure (LMX) have
gained popularity due to their position that leadership can be developed or learned.
Supporting the notion that leadership is available to everyone, the conversation in
leadership instrumentation has moved from traits to behaviors. Further research has
supported that trait-based assessment pales in comparison to behavioral leadership’s
2
predictive ability for specified outcomes (McKenna, Shelton, & Darling, 2002), as
effectiveness can be associated with specific leader behaviors (Lew, Lippitt & White
1939; Vroom & Jago, 1978).
Even among instruments that assess leadership behaviors, much disagreement
exists due in part to the use of multiple instruments within a particular theoretical
framework (Kroeck, Lowe, & Brown, 2004) as well as the difficulty in comparing
diverse constructs and measurement techniques across taxonomies (Yukl, 2012).
Attempting to bridge these taxonomies, Yukl (2012), conducted a meta-analysis of
leadership behavior literature as it related to effectiveness, concluding that at least four
meta-categories existed with 15 behavioral components. Such meta-analyses, however,
can be controversial, particularly when one theoretical frame is predominant. What is not
needed is a grand theory o f leadership (Alevesson, 1996), but permission for researchers
to agree that more than one type o f leadership may exist.
Multiple styles o f leading make conceptual sense, as it is widely acknowledged in
the leadership field that cultural variables and context matters. Since culture is the unique
combination of underlying values, assumptions, and beliefs that lie within individuals,
between groups, and in the processes of structure (Schein, 2004), a one-size fits all model
o f leadership is as unlikely as one form of culture but, nonetheless has been pursued
(Goethals & Sorenson, 2006). Regardless, the link between leadership and culture
remains proximal and complex. As Schein (2004) stated, while cultural norms may
govern how organizations will respond, “ .. .it can be argued that the only thing o f real
importance that leaders do is to create and manage culture” (p. 11).

3
Cultural studies involving leadership have traditionally examined only one
organization, predominantly utilizing case studies, or staying within a specific sector or
industry. In research involving more robust quantitative methodology, culture has been
delineated across national lines or ethnicity. Most widely regarded is the GLOBE study,
which investigated how culture related to societal, organizational, and leader
effectiveness through an extensive study of 62 countries (House, 2004). While the
contributions of the GLOBE study are vast and particularly detailed, House feared that
what was occurring was Western hegemony. Specifically, that similarity in definitions
and conceptions of leadership were an indication of Western dominance. However,
taking into consideration that the world has become increasingly flat (Friedman, 2005),
national lines may not be the strongest demarcation of culture.
With regards to corporate leadership, culture has been at the heart o f Higgin’s
(2005) work. Asking the question, what factors make leadership transferrable to an
industry? Higgins uncovered elements o f organizational culture that supported individual
growth. Such culture, Higgins asserted, created “career imprints”, historical experiences
and accumulation o f embodied knowledge. In some instances, these career imprints
predicted the growth trajectory o f individuals from one organization into others across
industries. Findings like these are particularly potent as industry leaders are progressively
inclined to move across organizations and industries. In their annual report, Booz Allen
(2012), investigated the transfer patterns o f Chief Executive Officers (CEOs). In 2011,
14.2% of the world’s top 2,500 companies replaced their CEOs (Booz Allen, 2012). That
percentage is a noteworthy increase from 2010, when the turnover rate was 11.6%.
While the contributions to global leadership have been numerous, instances o f CEO
4
turnover and success have not improved. As top executives continue to test their
leadership skills by transferring into diverse industries, the work o f Schein (2004) and
Higgins (2005) becomes evermore solvent, further supporting the notion that leadership
development is context-specific and learned.
Understanding how learned skills or competencies impact leadership effectiveness
is particularly difficult to capture in assessment, especially when it is acknowledged that
leadership does not occur in isolation but is a nested phenomena. Consistent with
Bronfenbrenner’s Ecological Systems Theory, later renamed the Bioecological Model,
individuals are influenced by many external factors (2005). Such influences do not have
a linear relationship but interact at differing levels. When understood in a nested model,
influences that impose a more direct weight are constructed closer to the subject. As
proximity decreases, less direct influences encompass, but move farther from the subject
and subsequent influences.
While it is acknowledged that groups, dyads, clusters, organizations and cultures
add depth to the understanding of leadership, the vast majority o f empirical work remains
at the individual level o f analysis (Dionne, Gupta, Sotak, Shirreffs, Servan, Hao, Kim, &
Yammarino, 2014). In an effort to, evaluate and recap the trajectory o f empirical work
surrounding the levels of analysis in leadership research, Dionne et al. (2014) conducted
a meta-analysis o f 25 years o f research in the Leadership Quarterly. From this work, 798
articles were reviewed. Out o f 522 empirical articles, only 17% accounted for a multi
level approach. Utilizing a single lens for analysis, however, does not contribute to
critical theory and leaves leadership literature flat. As researchers acknowledge the
5
layered nature o f leadership, it is paramount that studies identify and investigate the
multiple levels o f analysis.
At a time in history when critical conscious leadership is needed, awareness must
be raised in both knowledge and practice. It is not enough to study the isolated individual
nor can a leader act with only one frame in mind. Grace (2011) purported in Sharing the
Rock, that it is time for leadership to go beyond self, beyond direct spheres o f influence,
and to act from a capacity that acknowledges the greater whole or system. As such,
investigations in leadership effectiveness must also engage with an awareness of the
system.
To date, there is a dearth of research that studies leadership effectiveness using a
multi-lens or unified approach as it spans multiple industries and organizations. Ignoring
that environments like industry settings contain culture and therefore should be examined
as units of external influence or nested phenomena is a mistake. As the retention o f top
executives decreases, uncovering patterns in leadership effectiveness will become
increasingly helpful particularly if such inquires can integrate a systems theory approach.
Through acknowledging that instruments designed to measure a single theory of
leadership are limiting and accounting for context by a multi-level analysis, empirical
studies in leadership can make a vast improvement to the field by raising awareness and
heightening the conversation. This study attempts to bridge these gaps.
Problem Statement
There were several compounding issues that guided the inquiry o f this research.
First, a one-size fits all theory o f leadership is neither practical nor useful. Adaptability
in leadership is pivotal as changing context places new demands. Therefore, a
6
combination of frameworks and competencies is necessary. Second, as a consequence,
instrumentation that supports only one theory o f leadership is limiting. As traditional
instruments have often been single-sourced, more dynamic points o f data are desirable.
With this in mind, assessment has struggled to incorporate the developmental, contextual,
and nested nature o f leadership. While cultural studies across national lines have added
substantial value, little remains known about the potential cultural differences in
leadership effectiveness across industries and organizations.
The level of analysis in leadership studies is particularly critical, not just for
scholarly work but especially when it comes to understanding, developing, and
consulting to leadership in professional settings. In order to enact, coach, or support
leadership, leaders, consultants and scholars need to understand both the patterns of
leadership effectiveness and differences that exist among individuals within systems.
Further, if the desire o f research is to advance the conversation and understanding of
leadership, more complex and consciously-oriented components of leadership must be
examined. In order to accomplish this, further research is needed that expands the breadth
o f systems examined and investigates the multi-level variance across variables.
Purpose of the Study
This study’s original purpose was to uncover patterns in leadership effectiveness
across industries and interpret the differences that may exist across individual and
industry variables. However, in investigating such aims, additional themes arose that
enriched this study’s purpose. Specifically, systems awareness was studied across
organizations and provided further depth in understanding the variance o f nested
phenomena associated with leadership. Utilizing The Leadership Circle Profile (TLCP),
7
an existing 360 instrument, which assesses a variety of leadership competencies grounded
in leadership, psychology, and adult development theory, this study sought to answer the
following research questions:
1) What similarities and differences exist between individuals within distinct
industries in TLCP?
2) How does leadership effectiveness vary across industries in TLCP?
3) How does leadership effectiveness vary across industries in TLCP when
individual-level variables are considered?
4) And if variance warrants analysis at the industry-level, how does
leadership effectiveness vary across industries in TLCP when industry-level
variables are considered?
5) If variance is limited at the industry-level, where might it reside and which
leadership competency best explains this variance?
6) How does this leadership competency vary when first-level variables are
considered?
7) How does this leadership competency vary when second-level variables
are considered?
Delimitations
Many instruments exist within leadership literature that may have been
appropriate for consideration with regard to the aims of this study. However, TLCP was
selected for several reasons. First, TLCP has a broad range o f applicability. Industries
included within its clientele span education, energy, manufacturing, nonprofits, and
media to name a few. Utilizing this instrument provided variability and scope that has

8
often been missing from existing literature. Second, TLCP was not developed to assess
one theory or type o f leadership. In so far, as there are many ways to conceptualize
leadership, there are equally as many ways to enact leadership. The Leadership Circle
Profile therefore provides an assimilation of competencies that span multiple theories in
leadership, rather than elevating one particular theory. Third, TLCP incorporates
concepts from human development theory. Thus, it accounts for individuals’
progression, uniqueness, and complexity.
As an archival data set, the TLCP, its design, and applicable variables were
preset. Therefore, the ability to manipulate variables was constrained. Additionally,
while participants likely either self-selected, were part o f educational development, or
engaged in a professional learning opportunity, the reasons for their participation
remained anonymous as did their identities. Thus, conclusions as to why TLCP was
preferred or utilized over other existing instruments and avenues were not known and
thus, a self-selection bias is likely at play.
As a 360-degree instrument, multiple raters contribute to variable scores. While
there are benefits to be gained from a variety of perspectives, 360 instruments are survey-
based, non-experimental, and could potentially have other reliability issues. This could be
compounded by the differing understandings and individual definitions o f leadership
implied; thereby, limiting the extent to which this study could be applicable to other
definitions o f leadership.
Significance of the Study
The implications of this study’s work will be addressed in the following
assertions. First, while leadership effectiveness is a leading component of leadership
9
research, it is often conceptualized along individual variables. When group and
organizational variables have been considered, they are often limited to case studies or
dichotomous predictors (i.e. private verse public organizations). Expanding the lens o f
analysis will open up further discussion o f the similarities within and across industry
leadership.
Second, as context and development is paramount to leadership but often not
accounted for within the research, scholars may be interested to use multi-level modeling
(MLM) to further explain nested phenomena. Third, the interpretation of similarities and
differences across industries and organizations within this study may lead to the
enhancement or redesign of leadership development programs. Fourth, the variables that
predict leadership effectiveness and systems awareness may provide insight into the
perceptions of culture and effectiveness in industries and organizations. As leadership
increasingly becomes a global desire and executives continue to move from one industry
or organization to another, further studies may be able to deduce the relationship of
leadership competencies, effectiveness, and transferability across context. Noting the
similarities and differences across layers o f analysis will deepen the understanding of
how these groups contribute to industrial and organizational culture and ultimately
impact individuals in leadership.
By acknowledging these layers, coaches, consultants, practitioners, and scholars
can generate new possibilities. Recognizing that dynamic interaction is inherit and
natural, creates opportunities for dynamic inquiry, deepened dialogue, and heightened
development. Ultimately, understanding how variables influence leadership effectiveness
across industries will increase leaders ability to reach new levels.
10
CHAPTER TWO
LITERATURE REVIEW
The theoretical history o f leadership is rich. And while, academic research on the
topic o f leadership is young compared to other disciplines, its breadth o f work is
expansive. However, there still remains a gap, as few studies look at how leadership
varies across industries. This is largely due to researchers resistance to consider more
than one leadership theory or frame, inability to account for multiple frames, and limited
study samples.
This section will begin by providing a recent history o f the major and formalized
theories in leadership studies. Next, a review of literature specific to organizational
theory will follow. Then, for contextual understandings, contributions made to leadership
through human development will be examined. Finally, significant instruments in
assessing leadership will follow and a case for utilizing 360 instruments will conclude.
Leadership Literature
Industrial
Early foundations o f leadership as a social science arose during a time when
“man-power” was believed to fuel industrial success and therefore is marked by
efficiency and linearity (Bass, 1990). The following theories outline the stems, from
which more modem conceptualizations have grown. While these theories are presented
in a linear fashion historically, it is important to note that the evolution of leadership
theory has been one of waves in social discourses (Western, 2008). Social discourses
represent boundaries in language and limits in possible truth but are often interconnected
by similarities and persisting threads o f relevancy that carry over into new

11
conceptualizations (Western, 2008). Therefore, while theories are represented as singular
entities, their progression and development over time often overlaps and draws from
previous contributions.
Great Man. Leadership literature dates back to some of the earliest philosophical
references with the writings o f Greek philosophers like Plato and Aristotle. Indeed, Plato
placed high esteem upon “leaders” as individuals (Bass, 1995; Bums, 1978). They
possessed capabilities and characteristics that were not common to the general public.
Even much later in history, theorists like Machiavelli emphasized the knowledge and
power o f leaders (Antonakis et al., 2004). While Machiavelli’s conceptual framework for
leadership differed from Plato’s, they shared the view that there is inherently a difference
in leaders and followers. Traits and ways o f being that differentiate the leader from that
o f followers became known as the “great man” theory in the early 1900’s and can be
found widely throughout historical literature. Bass (1990) recounted that these great men
“created what the masses could accomplish” (p. 37) and history was often credited to
their decisions and actions. Underlying the anecdotal evidence was an assumption that
leaders were bom and not made, limiting the access of leadership to individuals’
birthright. Due to a lack o f empirical studies supporting great man theory, and increasing
evidence that men and women are capable o f leadership, great man theory has remained a
historical benchmark and not a predominant discourse in recent leadership literature
(Bass, 1990). Despite this, emphasis on the individual remains predominant.
Trait Theory. Distinguishing itself from great man theory, trait theory did not
differentiate whether attributes or leader characteristics were inherited or acquired.
Instead, the intent was to focus on empirically isolating those traits for investigation and
12
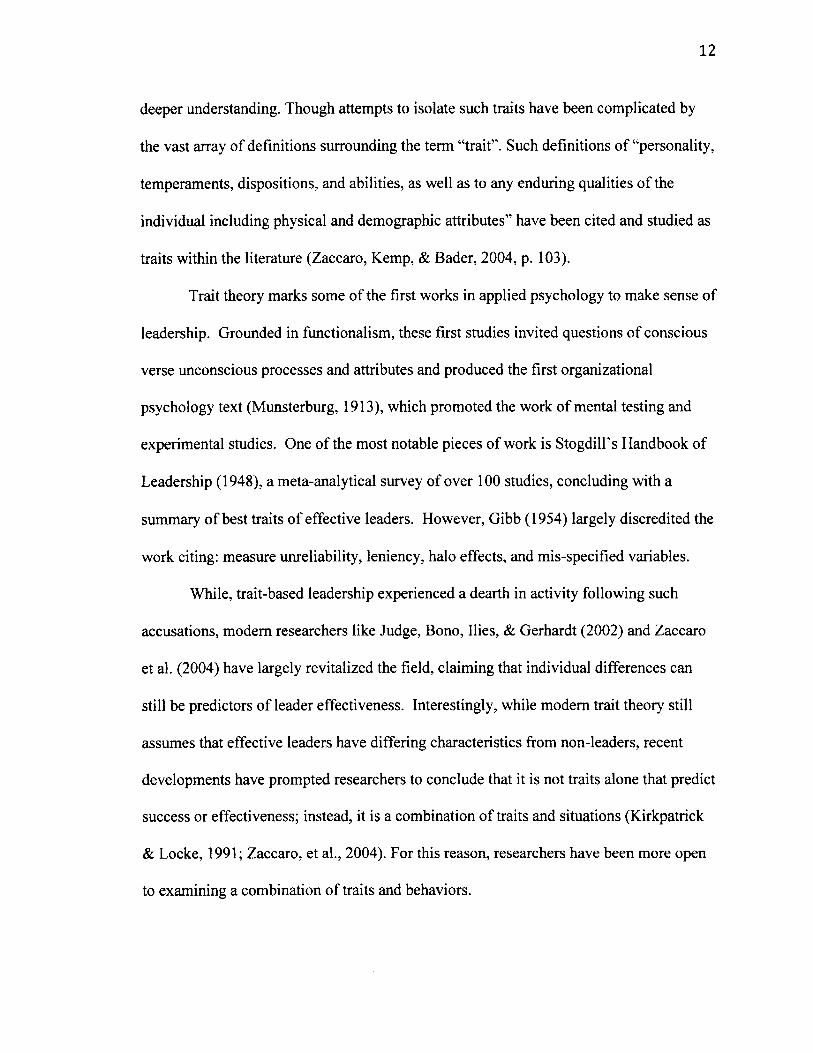
deeper understanding. Though attempts to isolate such traits have been complicated by
the vast array of definitions surrounding the term “trait”. Such definitions o f “personality,
temperaments, dispositions, and abilities, as well as to any enduring qualities o f the
individual including physical and demographic attributes” have been cited and studied as
traits within the literature (Zaccaro, Kemp, & Bader, 2004, p. 103).
Trait theory marks some of the first works in applied psychology to make sense of
leadership. Grounded in functionalism, these first studies invited questions of conscious
verse unconscious processes and attributes and produced the first organizational
psychology text (Munsterburg, 1913), which promoted the work o f mental testing and
experimental studies. One o f the most notable pieces of work is Stogdill’s Handbook of
Leadership (1948), a meta-analytical survey of over 100 studies, concluding with a
summary of best traits o f effective leaders. However, Gibb (1954) largely discredited the
work citing: measure unreliability, leniency, halo effects, and mis-specified variables.
While, trait-based leadership experienced a dearth in activity following such
accusations, modem researchers like Judge, Bono, Ilies, & Gerhardt (2002) and Zaccaro
et al. (2004) have largely revitalized the field, claiming that individual differences can
still be predictors of leader effectiveness. Interestingly, while modem trait theory still
assumes that effective leaders have differing characteristics from non-leaders, recent
developments have prompted researchers to conclude that it is not traits alone that predict
success or effectiveness; instead, it is a combination o f traits and situations (Kirkpatrick
& Locke, 1991; Zaccaro, et al., 2004). For this reason, researchers have been more open
to examining a combination o f traits and behaviors.

13
Behavioral. While the potency of trait theory waned, behavioral styles of
leadership gained momentum. Similar to the definitional issues o f trait theory, theorists
and researchers alike have characterized behaviors in a range o f ways. Behaviors can be
understood as mannerisms, styles, performance types, or dimensions. The work of
behavioral leadership began with the research o f Lewin, Lippitt, and White (1939) and
was continued by Lewin and Lippitt (1938), who defined the styles o f autocratic,
democratic, and laissez-faire leading. Later, the Ohio State University (Stogdill & Coons,
1957) and the University o f Michigan (Kahn & Katz, 1953) expanded behavioral
research by coining the terms “consideration” and “initiating structure” as two distinct
scopes of behavior. These scopes represented employee-focused versus production-
oriented behaviors. Adding to the discourse, B.F. Skinner popularized behavior
modification through positive reinforcement (Miltenburger, 2004). And while, these
contributions continued to be utilized particularly in management, behavioral leadership,
has in recent years, been largely incorporated into other theoretical lenses and does not
often stand-alone (Zaccaro et al., 2004).
Situational. Drawing from the contributions of trait and behavioral leadership
theories, comparative research studied how these individual properties varied across
social conditions. Situational and contingency models grew from such studies, indicating
variables that impacted optimal performance and leadership effectiveness. O f particular
note are the contingency model o f leadership effectiveness and cognitive resource theory
emphasizing the leader’s internal state (Fiedler, 1978; Fiedler & Garcia, 1987), the
normative decision-making model (Vroom & Jago, 1978; Vroom & Yetton, 1973), path-
goal theory (House, 1971), and situational leadership theory (Hersey & Blanchard, 1969)

14
- all centering on the perceived behavior o f leaders. Though there are similarities among
these theories, each supplies a unique approach to the examination o f variables and
subsequently has offered a distinct instrument. The applied value that such theories
contribute is that leadership is not stagnant, and indeed calls for adaptive behavior. As
Ayman (2004) pointed out, flexibility is one trait (i.e. internal state) that assumes
behaviors will vary and is highly supported in the leadership literature for effectiveness.
However, contingency and situational theories are complex and often difficult for leaders
to implement in the field when assessment and decisions are required in real time (Yukl,
2010). Further, such approaches do not adequately account for the development, work,
and support o f followers (Yukl, 2010).
Post-Industrial Leadership
Servant Leadership. The stance o f trait, behavior, and situational models of
leadership has largely focused on the leader and as a result, highlighted a top-down
relationship between leaders and followers (Rost, 1991). According to Rost, post
industrial leadership focused on relationships and growth, its applications expanded
beyond traditional views of business and politics. Variables concerning leadership were
not deterministic and stagnant but instead, showed development. These theories
supported advancement in their respective participants, inclusive of leaders and
followers. One of first examples was offered in 1970, when Greenleaf published an essay
entitled, The Servant as Leader. He further expanded this work into a book, Servant
Leadership (1977) shortly after. Within its contents, the desire to serve first, rather than
lead was detailed. He argued that it was through this desire to serve that leading would
ensue as a conscious choice. Furthermore, his work provided an ethical guide to those
15
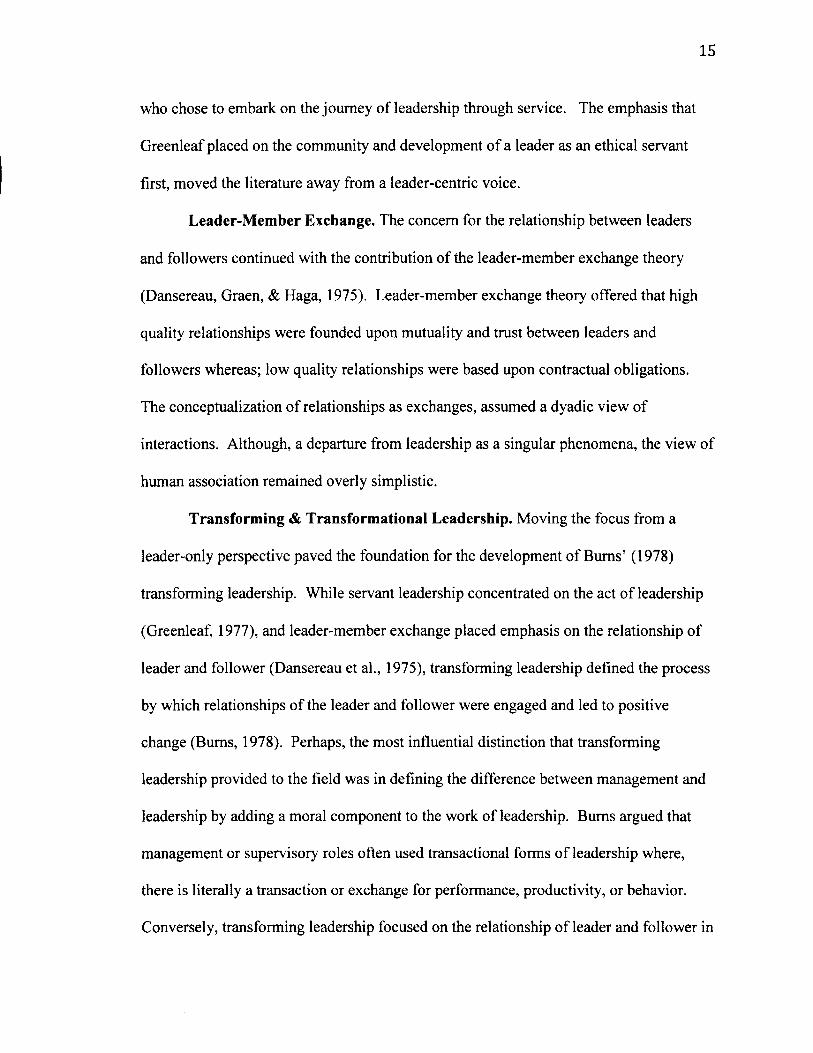
who chose to embark on the journey of leadership through service. The emphasis that
Greenleaf placed on the community and development o f a leader as an ethical servant
first, moved the literature away from a leader-centric voice.
Leader-Member Exchange. The concern for the relationship between leaders
and followers continued with the contribution of the leader-member exchange theory
(Dansereau, Graen, & Haga, 1975). Leader-member exchange theory offered that high
quality relationships were founded upon mutuality and trust between leaders and
followers whereas; low quality relationships were based upon contractual obligations.
The conceptualization of relationships as exchanges, assumed a dyadic view of
interactions. Although, a departure from leadership as a singular phenomena, the view of
human association remained overly simplistic.
Transforming & Transformational Leadership. Moving the focus from a
leader-only perspective paved the foundation for the development o f Bums’ (1978)
transforming leadership. While servant leadership concentrated on the act o f leadership
(Greenleaf, 1977), and leader-member exchange placed emphasis on the relationship of
leader and follower (Dansereau et al., 1975), transforming leadership defined the process
by which relationships o f the leader and follower were engaged and led to positive
change (Bums, 1978). Perhaps, the most influential distinction that transforming
leadership provided to the field was in defining the difference between management and
leadership by adding a moral component to the work of leadership. Bums argued that
management or supervisory roles often used transactional forms o f leadership where,
there is literally a transaction or exchange for performance, productivity, or behavior.
Conversely, transforming leadership focused on the relationship o f leader and follower in
16
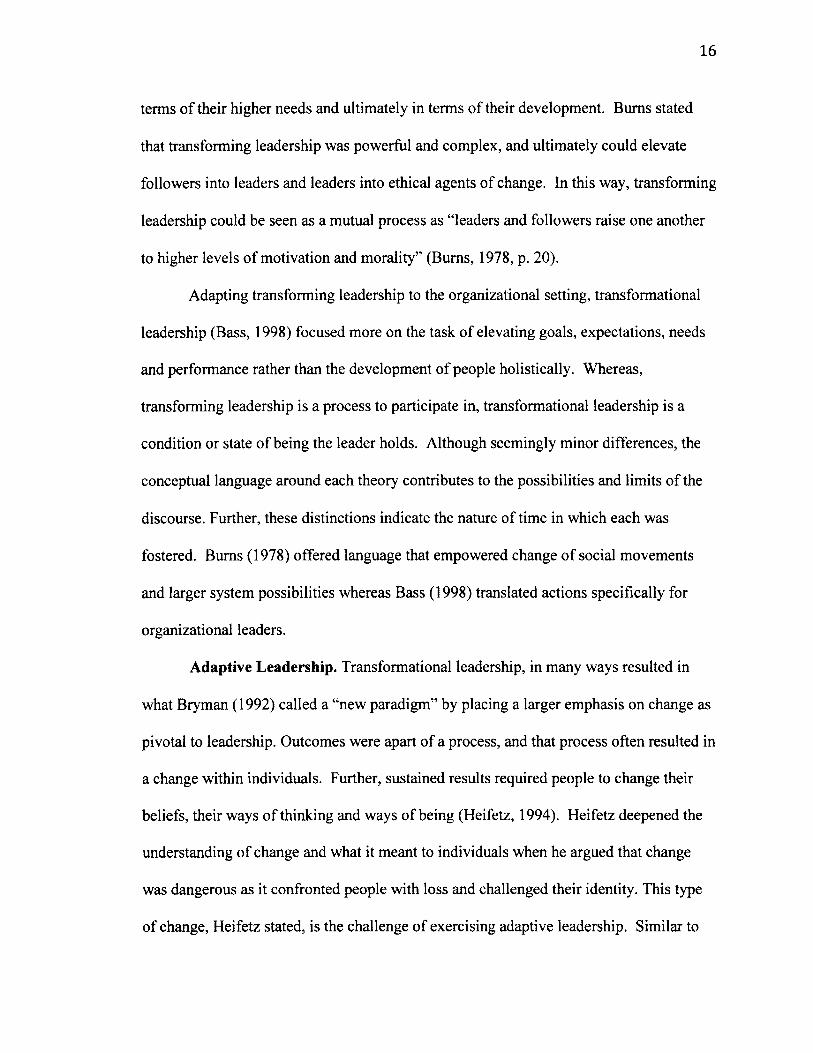
terms o f their higher needs and ultimately in terms of their development. Bums stated
that transforming leadership was powerful and complex, and ultimately could elevate
followers into leaders and leaders into ethical agents of change. In this way, transforming
leadership could be seen as a mutual process as “leaders and followers raise one another
to higher levels o f motivation and morality” (Bums, 1978, p. 20).
Adapting transforming leadership to the organizational setting, transformational
leadership (Bass, 1998) focused more on the task of elevating goals, expectations, needs
and performance rather than the development of people holistically. Whereas,
transforming leadership is a process to participate in, transformational leadership is a
condition or state of being the leader holds. Although seemingly minor differences, the
conceptual language around each theory contributes to the possibilities and limits o f the
discourse. Further, these distinctions indicate the nature of time in which each was
fostered. Bums (1978) offered language that empowered change o f social movements
and larger system possibilities whereas Bass (1998) translated actions specifically for
organizational leaders.
Adaptive Leadership. Transformational leadership, in many ways resulted in
what Bryman (1992) called a “new paradigm” by placing a larger emphasis on change as
pivotal to leadership. Outcomes were apart o f a process, and that process often resulted in
a change within individuals. Further, sustained results required people to change their
beliefs, their ways o f thinking and ways of being (Heifetz, 1994). Heifetz deepened the
understanding of change and what it meant to individuals when he argued that change
was dangerous as it confronted people with loss and challenged their identity. This type
o f change, Heifetz stated, is the challenge of exercising adaptive leadership. Similar to

17
the dichotomous relationship between transformational and transactional leadership
(Bums, 1978), Heifetz compared and contrasted adaptive challenges to technical
problems. He proposed that technical problems could be solved by expertise and
standard procedures, whereas adaptive challenges required leadership that challenged
norms, utilized skillful communication, and could experiment with new ideas and
discoveries. Heifetz placed particular weight on the understanding that adaptive
leadership interventions needed to occur over time and were not a one-time quick fix but
a long process o f investment in change.
Organizational Considerations of Leadership Theory
Nothing in leadership can be accomplished in isolation (Wheatley, 1999).
Leadership necessitates that there be followership, that the process o f leadership is a
group process in action, and that groups are apart of a larger structure. As such, the
context in which this action and followership occurs has also been studied.
Classical Organizational Theory
Organizational leadership cannot be specified to a definitive date, as it is well-
informed by ancient wisdom and early philosophy; however, classical organization
theory was popularized near the turn o f the eighteenth century (Shafritz, Ott, & Suk Jang,
2005). Constructed to accomplish economic goals and maximize production, classical
organizational theory proposed division of labor and logic-driven rationality. Smith’s
(1776) work, An Inquiry into the Nature and Causes o f the Wealth o f Nations, was
grounded in economic gains, centralization o f power and resources, and the specialization
o f management. Further specification, regarding processes for labor and production, was
introduced by Taylor (1911) in Principles o f Scientific Management. Taylor outlined

18
systematic guidelines for management, the collection of information, and the execution of
rational decisions and allocations. Likewise, applying similar principles, Weber (1922)
distinguished the bureaucratic organization, which was situated in formal procedures and
the delineation o f superiors from subordinates. However, the resounding critic of
classical organizational theory is that it fails to take into account ethics and the overall
well-being of humanity for the sake of economic gains.
Mid-Century Organizational Theory
At a time when some social science theories drew conclusions from exploitive
conditions, Follett (1926) called for practices that employed “power with” others rather
than “power over” others. Follett’s conceptualization did not diminish authority but
instead provided the invitation for authority to consciously practice more participatory
models. Although, scientific management was the predominant conceptual lens in the
early 1900’s, Follett’s contributions incited more conscious decisions regarding power
and encouraged a reframing of authority.
Indeed, the nature o f power and authority as it related to groups became a
prevailing area of interest. Lewin (1947) was the first to coin the term group dynamics,
which attempted to explain group phenomena. Lewin offered the following formula B =
f(P,E) where behavior (B) can be explained by the relationship between personal
characteristics (P) and environmental factors o f the group (£). More recent
conceptualizations of group dynamics include studying the system as it relates to
boundaries, authority, role, and task (Green & Molenkamp, 2005).

19
Modern Concepts of Organizational Theory
Appropriately, some of the insights to leadership with systems-oriented lens have
been developed from existing organizational literature. Senge (1990), for instance, honed
guidelines for exercising double-loop learning, originally explained by Argyris (1957),
which Senge referred to as generative learning. Utilizing five disciplines, Senge
suggested an approach to creating change within organizations, which ultimately led to
generative learning: a transformative learning that develops new ideas, behaviors, and
insights (Senge, 1990). This provided a framework for organizations to move towards
change while simultaneously bringing awareness to the importance o f feedback in the
process, integrating this information as change initiatives were executed. The first and
most relevant contribution of Senge’s five disciplines for this particular discussion is
systems thinking. Senge invited learners to engage in thinking that explores how the
parts o f an organization fit into the whole. He warned that inability to envision how
feedback informs the organization long-term often leads to the inability to problem-solve
and ultimately results in defensive routines.
Systems thinking as it was conceptualized by Senge (1990), was an organizational
application of General Systems Theory (GST) formally offered by von Bertalanffy in the
early 1900’s. Conceptually GST, von Bertalanffy explained, was the integration of
various sciences, natural and social in order to generate a general theory o f systems
(1968). Specifically, systems were viewed as a part of larger encompassing systems and
interdisciplinary approaches were utilized for deeper understanding. In doing so, von
Bertalanffy aimed to give depth and breadth in conceptualizing phenomena. However,
original hypothesis were met with resistance initially. The advancement o f the physical

20
sciences, particularly in the areas of physics, has highlighted the deep levels of
connectivity from natural to social science; thus, supporting the definition that a system
is, a complex o f interacting components and with the relationship among them, allow a
boundary or identification process both in the physical and affective sense (Laszlo, 1975).
In such capacities, components o f a system impact the system, are influenced by one or
more other components within the system, and are impacted by the system.
Recognizing that a system is a living network of process, Wheatley (1999),
suggested that insights from science, particularly the quantum study of science, could
contribute to leadership theory. Grounded in her argument that relationships are the
building blocks o f life, Wheatley incorporated the complexity o f systems thinking by
outlining how individuals, in being interconnected, are part of the system and thus, in
experiencing change, change the system. It is through this change that leadership can
evoke “potentials” (Wheatley, 1999). As she explained, potentials represent future
possibilities in the form of energy. In that, “relationships evoke these potentials. We
change as we meet different people or are in different circumstances” (Wheatley, 1999, p.
170). In this way, relationship mark interactions, which have the ability to influence and
often to shape, change, and impact the future. Thus, it is the task o f leadership to harness
this potential energy in meaningful and purposeful ways. However, seeing the system
and these potentials can be increasingly difficult as they are subjective to context and the
moment.
Yet, what is a moment? Furthering the discussion, Scharmer (2007) proposed that
leadership requires allowing the past to meet the future while attuning oneself to the large
system. He dictated that the crisis o f our time is to change how learning occurs and

21
consequentially the results that are derived from it. While this is similar to Senge’s
(1990) concept of generative learning, Scharmer added that in order to learn, individuals
must allow themselves to have an open mind, heart, and will. In doing so, he believed
that time could be understood in terms of “letting go” o f our history and “letting come”
the future (Scharmer, 2007). Scharmer’s framework in Theory U, involves: co-initiating,
co-sensing, co-presencing, co-creating, and co-evolving. The respective “co’s” are
symbolic of the individual in collaboration with others and thus consistent with
Whealtey’s (1999) notion o f self in relationship or Senge’s (1990) parts within the whole.
However, Scharmer (2007) argued that how Theory U differed from double-loop learning
was that it originates from what he referred to as the “blind spot”. At the bottom of
Scharmer’s “U” is “Presencing”, which he offered allowed seeing from the deepest
source, illuminating the blind spot. In exploring this deeper source, Scharmer directly
addressed the distinction between types o f “knowing”. Ultimately, in understanding our
knowing, Scharmer postulated, “to the degree that we see our attention and its source, we
can change the system” (2007, p.l 1). Scharmer explained that the true blind spot o f our
time is experience and through the process o f U we can come to know experience.
Contributions from Adult Development
Experience or how one makes sense of life can seem quite intangible. However,
decades of developmental research have provided framing and conceptualization o f the
human lived experience. Adding a rich layer o f depth to leadership, constructive-
development theory extends the psychosocial knowledge by purporting that context is
pivotal to understanding individuals (Cook-Greuter, 1999; Kegan, 1982; Torbert, 2004).
Here, the individual’s construction o f meaning is inseparable from the external and

22
internal factors that contribute to it, making the case for what Kegan refers to as an
“embeddual”, that humans are all, at all times, individuals embedded in their
environment.
Arising from stage-theory, a more linear conceptualization o f development,
constructionist research has progressively become more prominent in various forms of
social sciences, as it acknowledges the inherent tension of environmental and situational
factors on human experience. Specifically, constructionist theory permits multi
directional movement in human development. Reality, therefore, is understood as an
individual is informed by its environment and their capacity to interpret experience. As
individuals grow and develop over time, meaning-making process become increasingly
complex and individuals tend to move from pre-conventional to conventional stages of
development (Cook-Greuter, 2004; Kegan, 1982; Loevinger, 1976). Less than 5% of the
population ever reaches post-conventional development, which is marked by expanding
consciousness, heightened cognitive functioning, and deepening awareness of emotions
particularly, empathy (Cook-Greuter, 2004; Kegan, 1982). Particular credit is attributed
to Kegan’s (1982) work, which built upon the earlier developmental theorists like
Erikson and Loevinger. With the conceptualized five stages o f development through
word association, each stage is characterized by a subject-object perspective, as
individuals progress, their ability to synthesize this duality more broadly leads to a
deepening o f consciousness, complex relationships, and moves from more interpersonal
to intrapersonal meaning-making experience.
Post-conventional stages o f development have held particular interest in the field
of leadership studies, as the expansion of human capacity within these stages has also

23
been correlated with greater leadership effectiveness (Brown, 2012; Kegan, 1994; Rooke
& Torbert, 1998; Torbert, 2004). While Kegan’s work remains a pillar to the field,
Rooke and Torbert (1998, 2005) were the first to theorize how a leader’s development
translates into organizational success. Later, in collaboration with Cook-Greuter, they
were able to empirically develop and test this work with the Leadership Development
Framework (LDP) (Torbert, 2004). The LDP places leaders in “action logics”, similar to
stages o f development, by where multiple dimensions of a person’s reasoning and
behavior are highlighted, illuminating a leader’s predominant form of strategy (Torbert,
2004). Now referred to as the Global Leadership Profile (GLP), Torbert has contributed
more depth and additional action logic to his work. Including eight action logics, the
GLP interprets the assumptions and behavior o f individuals.
A study utilizing the GLP and conducted by Brown (2012) revealed that post-
conventional leaders, indeed, show novel leadership competencies above and beyond
existing frameworks. Specifically, Brown determined that o f the 15 competencies post-
conventional leaders embody, shared themes o f a) deep inner foundation, grounding their
work in transpersonal meaning, b) accessing knowledge through non-rational thought,
systems thinking and integral or complexity theory, and c) adaptively managing the
system through dialogue were connected throughout his findings. While the GLP still
remains the only widely tested developmental theory specific for leaders, the lack of
definition and construct development surrounding “organizational transformation” and
“leadership” has been a point o f weakness. Thus, while research suggests that human
development is critical to leader development (Getz, 2009; Rooke & Torbert, 1998,
2005), empirical instruments have failed to adequately link these two concepts.
24
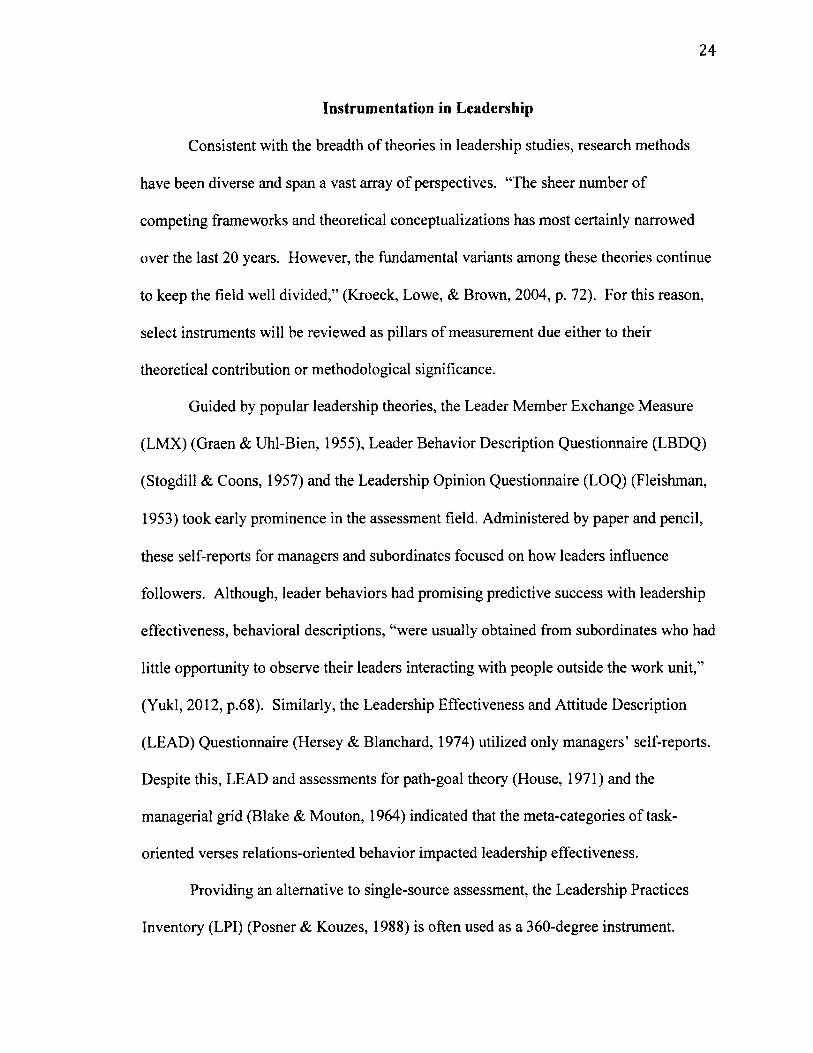
Instrumentation in Leadership
Consistent with the breadth o f theories in leadership studies, research methods
have been diverse and span a vast array o f perspectives. “The sheer number of
competing frameworks and theoretical conceptualizations has most certainly narrowed
over the last 20 years. However, the fundamental variants among these theories continue
to keep the field well divided,” (Kroeck, Lowe, & Brown, 2004, p. 72). For this reason,
select instruments will be reviewed as pillars o f measurement due either to their
theoretical contribution or methodological significance.
Guided by popular leadership theories, the Leader Member Exchange Measure
(LMX) (Graen & Uhl-Bien, 1955), Leader Behavior Description Questionnaire (LBDQ)
(Stogdill & Coons, 1957) and the Leadership Opinion Questionnaire (LOQ) (Fleishman,
1953) took early prominence in the assessment field. Administered by paper and pencil,
these self-reports for managers and subordinates focused on how leaders influence
followers. Although, leader behaviors had promising predictive success with leadership
effectiveness, behavioral descriptions, “were usually obtained from subordinates who had
little opportunity to observe their leaders interacting with people outside the work unit,”
(Yukl, 2012, p.68). Similarly, the Leadership Effectiveness and Attitude Description
(LEAD) Questionnaire (Hersey & Blanchard, 1974) utilized only managers’ self-reports.
Despite this, LEAD and assessments for path-goal theory (House, 1971) and the
managerial grid (Blake & Mouton, 1964) indicated that the meta-categories o f task-
oriented verses relations-oriented behavior impacted leadership effectiveness.
Providing an alternative to single-source assessment, the Leadership Practices
Inventory (LPI) (Posner & Kouzes, 1988) is often used as a 360-degree instrument.
25
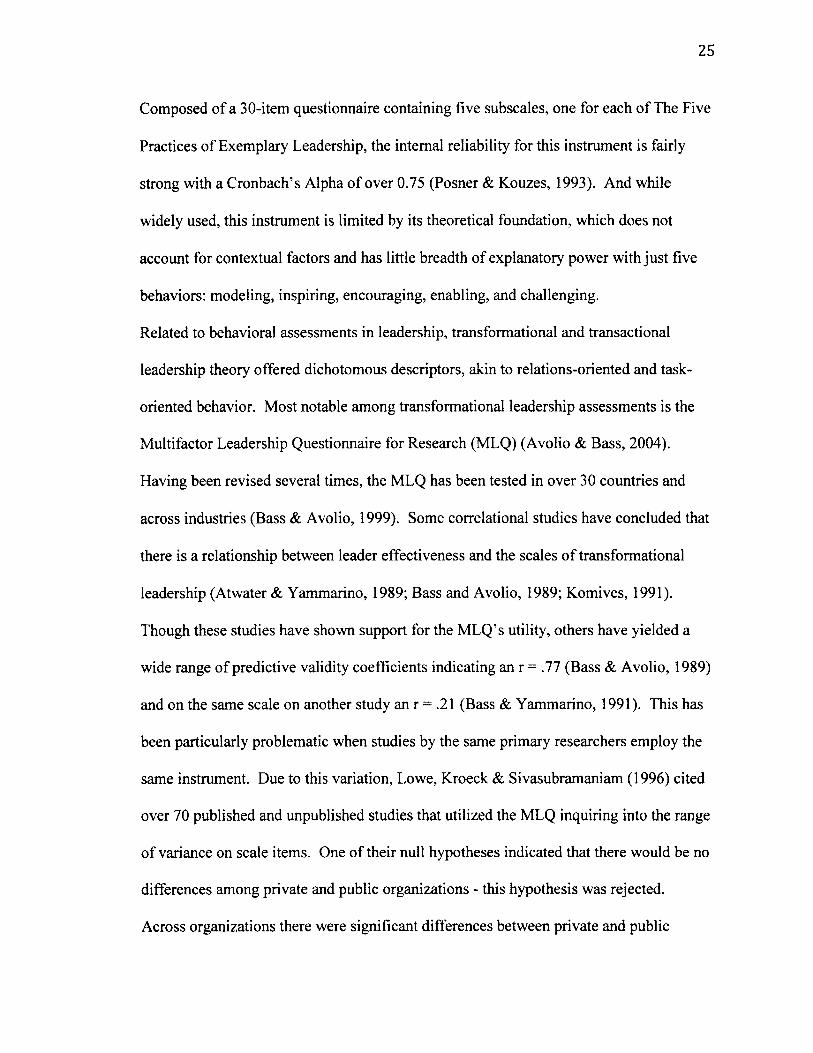
Composed o f a 30-item questionnaire containing five subscales, one for each o f The Five
Practices o f Exemplary Leadership, the internal reliability for this instrument is fairly
strong with a Cronbach’s Alpha o f over 0.75 (Posner & Kouzes, 1993). And while
widely used, this instrument is limited by its theoretical foundation, which does not
account for contextual factors and has little breadth of explanatory power with just five
behaviors: modeling, inspiring, encouraging, enabling, and challenging.
Related to behavioral assessments in leadership, transformational and transactional
leadership theory offered dichotomous descriptors, akin to relations-oriented and task-
oriented behavior. Most notable among transformational leadership assessments is the
Multifactor Leadership Questionnaire for Research (MLQ) (Avolio & Bass, 2004).
Having been revised several times, the MLQ has been tested in over 30 countries and
across industries (Bass & Avolio, 1999). Some correlational studies have concluded that
there is a relationship between leader effectiveness and the scales o f transformational
leadership (Atwater & Yammarino, 1989; Bass and Avolio, 1989; Komives, 1991).
Though these studies have shown support for the MLQ’s utility, others have yielded a
wide range o f predictive validity coefficients indicating an r = .77 (Bass & Avolio, 1989)
and on the same scale on another study an r = .21 (Bass & Yammarino, 1991). This has
been particularly problematic when studies by the same primary researchers employ the
same instrument. Due to this variation, Lowe, Kroeck & Sivasubramaniam (1996) cited
over 70 published and unpublished studies that utilized the MLQ inquiring into the range
o f variance on scale items. One o f their null hypotheses indicated that there would be no
differences among private and public organizations - this hypothesis was rejected.
Across organizations there were significant differences between private and public
26
organizations, namely that public organizations implemented more transformational
behaviors.
Rationale for 360 Assessments
It is the vast body of knowledge from which leadership is informed and the rapid
growth of the field that has served both as an asset and point o f contention in empirical
work. For with every new layer o f contextual understanding is an equally important yet
complex methodological inquiry. This is perhaps best articulated in Dansereau, Alutto,
and Yammarino’s (1984) book, which first brought clarity to the issues surrounding
theory and research in leadership. Namely that leadership theory did not account for the
rich levels o f analysis present and therefore, inhibited the statistical analysis o f theory
testing and practical implications. Other major critiques of leadership assessment have
included that they rely heavily on one theoretical frame with the intention o f promoting
that theory and that traditionally they have been limited by self-ratings or subordinate
perceptions alone (Yukl, 2012). Although some studies have utilized experimental or
quasi-experimental intervention techniques, convenience, time, and cost are all
contributing factors to the persistence o f survey methods in leadership studies. For this
reason, a case for 360 instruments will be reviewed, as they provide the utility of
practical application, convenience o f survey implementation and add depth to the source
o f data and levels of analyses.
Though 360-degree feedback tools were used throughout the 1980’s, it was
Edwards and Ewen’s (1996) publication that brought heightened visibility to the 360
instrument by affirming, through their research, that 360 processes were superior for
performance evaluation in both reliability and fairness over traditional single-rater tools.
27
Judge and Cowell (1997) reported that the use o f 360 feedback is among the practices of
top executive coaches and showed tremendous growth within the 90’s. In their studies,
Hagberg (1996), Rosti and Shipper (1998), and Shipper and Dillard (2000) showed that
360 feedback was one o f the best methods to increase self-awareness in regards to skill
sets and competencies. However, 360-degree instruments have predominantly been used
for developing individual leaders (Church & Bracken, 1997) or cultural change initiatives
(Burke & Jackson, 1991). This, argued Bracken and Church (2013), demonstrates a lack
of creativity in utilizing 360 tools and has resulted in unrealized potential.
More recently, organizations are using 360 feedback for understanding
performance (3D Group, 2013; Braken & Church, 2013). For example, in a study of
more than 200 organizations that employ 360-degree tools, 47% were using them for
performance indicators. While there has been hesitation to utilize such tools as they
provoke fears o f evaluation, decision-making, and fairness (Brett & Atwater, 2001),
organizations are increasingly interested in assessing the “how” o f effectiveness (Kaiser,
McGinnis & Overfield, 2012) and not just the “what” o f bottom-lines. Responding to the
recognition that engagement and quality o f leadership matters in the workplace
particularly with diverse demographics, 360 instruments have received heightened
attention (Hankin, 2005; Meister & Willyerd, 2010). Following the thread that quality
matters, studies have shown that how a 360 instrument is implemented is also critical for
its accuracy and how well-received it will be. A learning culture should be founded on
open dialogue around the use and delivery of the instrument (Blanchard and Thacker
2007; Hensel, Meijers, van der Leeden, & Kessels, 2010). Further, to guard against
inaccurate ratings, Hensel et al. (2010) found that at least six peer raters are needed to

28
reach a correlation above 0.45. While ten raters are ideal, it can be unrealistic for small
to medium size organizations to be able to reach such numbers.
Literature Summary
As conceptual understandings in leadership have progressed, theory has moved
from focusing on the individual characteristics (Munsterburg, 1913; Stogdill, 1948),
behaviors (Kahn & Katz, 1953; Lewin, Lippitt, & White, 1939; Stogdill & Coons, 1957),
and the situational responsiveness (Hersey & Blanchard, 1969; Fiedler, 1978; House,
1971; Vroom & Jago, 1978) of leaders to moral pillars o f service (Greenleaf, 1977),
conditions o f relationships (Dansereau, Graen, & Haga, 1975), and processes of
transformation (Bass, 1998; Bums, 1978) between leaders and followers. Increasingly,
leadership literature has incorporated aspects o f adaptability and change not simply as
abstract processes but as potentials available to all individuals, emphasizing that
leadership is not predetermined and in fact can be learned, developed, and furthered.
More recent conceptualizations o f organizational leadership theories share similar
themes o f transformation and change (Scharmer, 2007; Senge, 1990; Wheatley, 1999).
However, borrowing from GST (von Bertalanffy, 1968), organizational leadership theory
also takes into consideration feedback from the system or environment. Feedback
information occurs between organizations and the larger system (or even within the
organization) in terms of resources or other forms of capital and within GST is often
referred to as energy. Leaders’ ability to interpret such feedback and collaborate with
others towards new directions depends largely on several abstract processes that have
been referred to as systems thinking and awareness. For example, leaders ability to
engage with systems awareness may be informed by their capacity for change mastery
29
(Senge, 1990) or willingness to be open at that present moment to experience and
possibility (Scharmer, 2007).
However, systems awareness may represent, to a high-degree, pronounced
cognitive, social, and emotional functioning. Informed by theories o f human
development, individuals’ ability to reconcile personal experience for an integrated
worldview of how they are within and, at the same time, apart o f the system denotes post-
conventional or advanced levels o f development (Cook-Greuter, 2004; Kegan, 1982;
Loevinger, 1976; Torbert, 2004). For this reason, acknowledging leadership theory
without consideration to human development is amiss.
As leadership assessment attempts to further understandings o f leadership, it is
paramount that multiple theories are considered. Conceptual acknowledgement has
supported different ways of leading but has done little to consider such measures across
context at both the individual and organizational level (Dansereau, Alutto, & Yammarino,
1984; Yukl, 2012). Further, since assessment in leadership has been limited by cost,
convenience, and accessibility, surveys have largely dominated the field and several
studies support that 360-degree instruments are considered a best practice in survey
methods and leadership development (Edwards & Ewen, 1996; Hagberg, 1996; Judge &
Cowell, 1997; Rosti & Shipper, 1998; Shipper & Dillard, 2000).
Thus, in accordance with the literature, this study seeks to explore how leadership
varies across industries, organizations, and individuals with data from an existing 360-
degree instrument, TLCP. Selection of TLCP proved to be consistent with observing
multiple leadership competencies while simultaneously taking human development into
consideration. Further, the rationale, validity, and reliability o f TLCP are discussed
the next chapter as is MLM, the methodology that guided this study.
31
CHAPTER THREE
METHODOLOGY
Addressed within this chapter are the processes enlisted to answer this study’s
research questions. Background to TLCP is provided, including external validity and
reliability reports as well as sample demographics. Following this overview, procedures
o f data treatment are detailed. This chapter concludes with an explanation of empirical
models for relevant multi-level modeling (MLM) and this study’s design.
Overview of The Leadership Circle Profile (TLCP)
The theoretical foundation for TLCP borrows from the psychology, leadership,
and adult development literatures to form a competency-based 360-degree instrument.
The Leadership Circle Profile is an online-based questionnaire that contains 29
dimensions corresponding to eight summary dimensions. Summary dimensions are
meta-categories combining specified items or dimensions. O f the 29 dimensions, 18
leadership competencies and 11 internal assumptions account for outcome variables. In
this way, TLCP assesses both behaviors and beliefs and was the first 360 assessment in
leadership to highlight cognitive assumptions that underlie behavior (Anderson, 2006).
These competencies are depicted in list format in Table 1 below. All items are scale
items, ranging from 1 to 5, with 5 indicating the strongest demonstration of each item.
As part of the instrument and theoretical design, outcome variables are depicted in
a circular graph (See Figure 1) in percentile scores. This is done to highlight the
behavioral polarities present. Specifically, dimensions that are displayed across from one
another have opposite internal assumptions. For example, Authenticity is opposite
Protecting. Four additional outcome variables: Creative, Reactive, Task, and Relationship
32
are calculated from means in corresponding dimensions and presented in a scale score.
The top half o f the circle, Creative, correlates to Kegan’s and Susan Cook-Greuter’s stage
four, while the bottom half of the circle, Reactive, is correlated to stage three. Only these
stages are represented in the circle since less than 1% of the population can achieve level
five, adulthood is marked by level three, and almost all leadership theory is written for
level four with the aspiration of obtaining one’s higher-self (Anderson, 2006). The left
and right halves of the circle are labeled Relationship and Task respectively, representing
the emphasis of an individual’s orientation towards behaviors in these dimensions. The
last outcome variable is leadership effectiveness located on the bottom outside of the
circle.
The Leadership Circle Profile (TLCP) proved to be a particularly valuable
instrument in this study for several reasons. First, it is the only survey tool that correlates
leadership competencies with developmental stages. The top and bottom half o f the
circle represents some of the foremost work o f developmental theory and places emphasis
on adult stages o f development which appropriately correspond to competencies
represented in the population and leadership literature. Additionally, it covers a breadth
o f leadership theories. For example, the dimension o f Self-Awareness informed by the
work of Goleman (1995) and the Systems Awareness dimension is modeled from Senge’s
(1990) work. The range of applicable leadership theory is representative o f the possible
ways and styles of leadership one might choose to engage. Further, these competencies
are portrayed as a spectrum in percentile scores. In this way, individuals are informed
about their tendencies and inclinations and can see their own variability. Lastly, as a
widely used instrument, TLCP provided a rich reliable and valid foundation for

33
assessment. Normed from a base o f over 3,000 self-assessments and 30,000 feedback-
assessments, TLCP has reached a vast range of leaders, shows impressive correlations to
business performance indexes and been externally validated (Anderson, 2006).
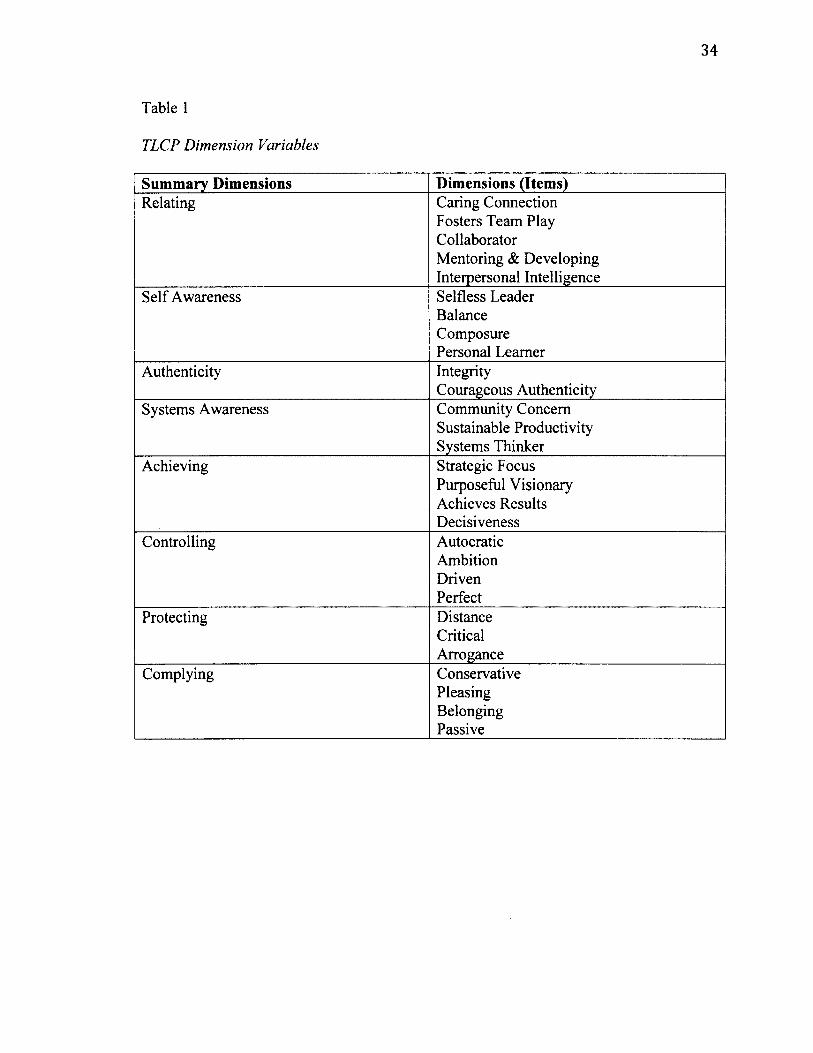
34
Table 1
TLCP Dimension Variables
Summary Dimensions Dimensions (Items)Relating Caring Connection
Fosters Team Play CollaboratorMentoring & Developing Interpersonal Intelligence
Self Awareness Selfless Leader Balance Composure Personal Learner
Authenticity IntegrityCourageous Authenticity
Systems Awareness Community Concern Sustainable Productivity Systems Thinker
Achieving Strategic Focus Purposeful Visionary Achieves Results Decisiveness
Controlling AutocraticAmbitionDrivenPerfect
Protecting DistanceCriticalArrogance
Complying ConservativePleasingBelongingPassive
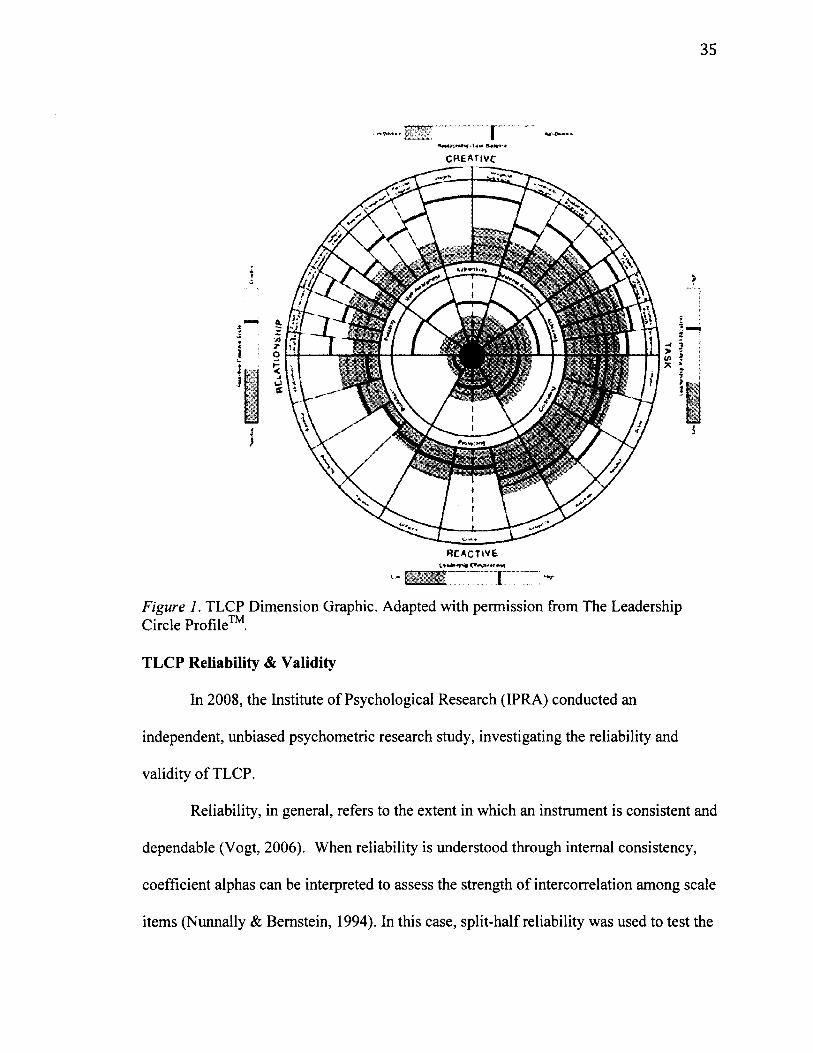
C H E A T IVC
H E A C T 1 V E
Figure 1. TLCP Dimension Graphic. Adapted with permission from The Leadership Circle Profile™
TLCP Reliability & Validity
In 2008, the Institute of Psychological Research (IPRA) conducted an
independent, unbiased psychometric research study, investigating the reliability and
validity o f TLCP.
Reliability, in general, refers to the extent in which an instrument is consistent and
dependable (Vogt, 2006). When reliability is understood through internal consistency,
coefficient alphas can be interpreted to assess the strength o f intercorrelation among scale
items (Nunnally & Bernstein, 1994). In this case, split-half reliability was used to test the

36
internal consistency of each subscale and indicated favorable results with a mean
coefficient alpha o f .89 and a range of .83 to .96. The outer dimensions of TLCP also had
strong alpha coefficients greater than .70 with the exception o f Conservative and Balance
that had an alpha coefficient of .64. It was suggested by the external researchers that
additional items be added to this scale as some dimension elements had as many as nine
items, Conservative and Balance had two and three items respectively. It is important to
note that this modification has not yet been implemented.
Additionally, validity analysis, which assesses the degree that an instrument
measures its intended construct (Nunnally & Bernstein, 1994), was also conducted.
Specifically, criterion validity was used in order to test TLCP predicted outcomes
(Murphy & Davidshofer, 1991). Self-reported scores were omitted from such analyses as
previous research indicates that these reports inflate correlation coefficients or can have
halo effects (Bretz, Milkovich, & Read, 1992). Further, since the sample size ranged
from 15,145 to 86,298 and was particularly large, the percent o f shared variance was
interpreted rather than p values to avoid interpreting statistically significant values as
practically important. Findings demonstrated that Leadership Effectiveness was
significantly and positively correlated with five Creative dimensions: Relating, Self-
Awareness, Authenticity, Systems Awareness, and Achieving with a range of r = 0.77 to r
= 0.89, and negatively correlated with Reactive dimensions (ranging from r = -0.14 to r =
-0.59). Weighted scores in the eight dimensions did not impact the criterion validity.
TLCP Sample
The sample for this study included 246,645 records from TLCP, which have been
collected from the years o f 2000 - 2010. This represented over 19,000 individuals and
37
their respective raters. Participants included managers, leaders, and executives who have
opted to take the TLCP for feedback, learning, or development purposes. While it is not
possible to distinguish among these three categories of individuals, several sample
demographics are known. Specifically, 59% of the sample was male, 40% were female
and 1% wished not to disclose. Although this is an international sample, 69% were from
the United States, 13% were from South Africa, 4% were from Australia, 3% from
Canada, 1% were from India, and the remaining 10% were accounted for by 120
countries, making this a predominantly Western-based sample. Additionally, the sample
was also predominantly Caucasian (68%) with 6% identified as Asian or Pacific Islander,
6% as black, and 3% as Hispanic or from Latin America. Thirteen percent o f the sample
did not report their ethnic identity and 4% identified as Other. What remained a
distinctive characteristic of this data set was the robustness of industries present. Over 30
industries were represented and can be viewed in Appendix B. Industry, however, was a
consultant-inputted variable, meaning that individuals do not self-select or enter their
industry into the database; rather, a TLCP consultant gathered such information from the
client. Additional demographic variables included: age, educational level, management
level, number o f direct reports, and relationship (denoting relationship to individual
rated).
Data Treatment
Data Collection
Being an independent organization, the TLCP data has been privately maintained
and remains the property of The Leadership Circle™. Permission to use the instrument
was granted by The Leadership Circle™, a formal letter o f consent is attached in
38
Appendix A. The approval o f this research and appropriate adherence to the Institutional
Review Board (IRB) guidelines is also provided on the final page o f this document. To
ensure the confidentiality of participants, identifiable information, such as client names,
organizational names, and contact information, was removed from all data records prior
to transfer. Participants were not notified via consent o f this research, as this was an
archival data, and notification, may have adversely impact participants’ anonymity. The
participants’ unique identification number was used to distinguish all data records; such
numbers cannot be linked to individuals’ personal information, as this study’s researcher
did not have access to the key. Instead, these unique identification numbers helped
decipher raters from participants for analyses purposes. A single data file was provided
electronically from The Leadership Circle to this study’s researcher. All computers and
accounts that have access to this data were password protected and privately owned.
Concern for data mismanagement was minimal, particularly, as confidential information
was removed prior to transfer.
Study Sample
The Statistical Package for the Social Sciences (SPSS), a computer-based
program specializing in performing analysis was utilized in this study. Preliminary
analyses were conducted on the data sample to indicate the appropriateness o f variables
and cases for selection. Two major concerns drove the preliminary investigation: a) the
number o f raters for participants and b) the number o f participants within organizations
and industries. Following the caution offered by Hensel et al. (2010) that too few raters
can lead to biased results, a conservative minimum of eight raters was required for
participant inclusion. In order to conduct such computation, the data sample was split

39
separating self-scores from rater scores and restructured. After tabulating raters, data was
remerged and cases containing eight raters or higher were retained. Additionally, as the
predominant method of analysis was MLM, considerations for second-level units
required a minimum of 15 categories with at least 50 first-level measurements. Said
differently, it was specified that records for inclusion were industries and organizations
that contained at least 50 participants. Thus from the original sample, 6,743 individuals
from 54 organizations and 15 industries were retained.
Dependent Variables
Leadership Effectiveness. Leadership effectiveness was one of the dependent
variables in this study. Within TLCP, leadership effectiveness exists as a weighted scale
score. Five items comprise leadership effectiveness and were either the participant’s or
raters’ perception o f the following:
• I am satisfied with the quality o f leadership that he/she provides.• He/she is the kind of leader that others should aspire to become.• He/she is an example o f an ideal leader.• His/her leadership helps this organization to thrive.• Overall, he/she provides very effective leadership.
Since each rater contributed a unique leadership effectiveness score to each participant,
approximately six to 30 scores on average existed for each participant. Three variable
types were developed for leadership effectiveness: a) an aggregated mean score o f self
and other ratings b) an aggregated score o f other ratings and c) a distance ratio that
reflected the difference between mean scores o f self and others. The aggregated mean
score o f others’ leadership effectiveness ratings was the predominant dependent variable
as determined by the intra-class correlation coefficient (ICC), whereas, the distance ratio
was used in some circumstances as an independent variable or predictor.

40
Systems Awareness. Systems awareness was the second dependent variable
explored in this study. Also, a weighted scale score, systems awareness was a summary
dimension o f three competencies and their respective items:
Community Concern• 1 create vision that goes beyond the organization to include making a positive
impact on the world.• I attend to the long-term impact o f strategic decision on the community.• I balance community welfare with short-term profitability.• I live an ethic of service to others and the world.• I stress the role o f the organization as corporate citizen.
Sustainable Productivity• I balance bottom line results with other organizational goals.• I allocate resources appropriately so as not to use people up.• I balance short-term results with long-term organizational health.
Systems Thinker• I reduce activities that waste resources.• I redesign the system to solve multiple problems simultaneously.• I evolve organizational systems until they produce envisioned results.
Due to the nature o f this summary dimension as a scale score, a mean aggregated variable
was also computed for use in analysis. Similar to leadership effectiveness, the ICC was
higher when others’ ratings o f systems awareness were calculated as the dependent
variable in contrast to utilizing either a mean aggregate of self and other ratings or a
distance ratio. Thus, the higher ICC denoted more variability and allowed for models to
explain more variance.
Other Variables
Also within the data set were the demographic variables o f age, gender, ethnicity,
educational level, management level and number o f reports for first level-predictors. In
order to guard against multicollinearity, age and number o f reports were mean centered.
Educational level and management level were transformed to enhance interpretation so
41
that higher-level categories corresponded to increased value or higher levels of
achievement. For example, high school was coded as one, associate’s as two, and so on.
Gender was represented as a dummy variable and coded as one for females and zero for
males. And while ethnicity was also dummied to represent diverse individuals (those that
did not identify as White) as one and White as zero, a dummy variable for each
individual ethnicity was also created.
Second-level variables were only created for organizational analysis, as industry
analysis was not warranted. Categories included: diverse organizations, female
organizations, higher education, and industry. Diverse organizations were coded as one if
their organization was comprised o f at least 20% racial minorities. For female
organizations, one was assigned to organizations where the gender ratio was female-
dominant and in the case o f higher education, one was assigned to organizations who
more predominantly displayed graduate or higher levels of education. Fifteen industry
sectors were included as second-level predictors and a dummy variable was created for
each. The three variables, diverse organizations, female organizations, and higher
education were derived from first-level predictors. While it was possible, that individuals
within this sample do not represent their organizations on the whole, the requirement that
each organization maintained at least 50 respective participants minimized this chance.
Further, while some researchers have warned against advancing first-level predictors to
second-level criterion (George, 1990), more recent studies have demonstrated that it is
relatively common practice (James, Demaree, & Wolf, 1993; Langffed, 2000) when
group members have sufficiently similar responses for aggregation.
42
Data Analysis
Multi-level modeling was used to address the research questions o f this study.
While descriptive statistics outlined the parameters of TLCP data set (answering research
question 1), MLM provided an appropriate analytical technique, building upon multiple
linear regression (Tabachnick & Fidell, 2006), but with the added advantage of
considering both within-group variance and between-group variance simultaneously
(responding to the remaining research questions). Since the leadership o f organizations
involves natural hierarchies or systems within systems, MLM enabled the analysis of
nested phenomena. Specifically, leadership effectiveness and systems awareness were
examined as they varied among participants (level-one) and across industries (level-two).
Multi-level modeling was particularly helpful in this study as it assumes randomization of
coefficients and therefore does not assume independence of errors. Such methodology is
especially useful when analyzing phenomena that are highly correlated. Conceptually,
MLM treats the estimated regression coefficients at the first level of analysis as the
dependent variables at the second level of analysis. In other words, MLM is helpful in
studies like this one where, it was likely that participants (level-one) are closely related to
other participants within the same industry or organization (level-two). Moreover,
sample sizes are able to vary across levels (Tabachnick & Fidell, 2006), which is a
regular characteristic o f nested data.
Missing Data
Prior to conducting the MLM analyses, a process for handling missing data was
addressed. If there had been considerable amounts of missing data, it could have
potentially led to biased results or the inability to conduct analysis in SPSS. Simply

43
stated, there are two types of missing data, missing at random (MAR) and missing not at
random (MCAR). Proper treatment o f missing values requires familiarity with the data
set and educated estimates as to why such data is missing (Heck, Scott, & Tabata, 2010).
In this study, some demographic categories were determined to be MAR, as estimates
indicated less than 5-8% of such data was missing. In such cases, individuals were
retained since inputting demographic categories was inappropriate and since MLM can
still process models with missing values. In the instances where competency scores were
missing and variables were scale scores, data values were assigned by means o f multiple
imputation of plausible values or full maximum likelihood estimation (Rubin, 1987). Full
maximum likelihood assumes normal distribution o f the dependent variable, thus this
specification was confirmed through analysis in SPSS.
Empirical Models
To answer this study’s research questions, multi-level testing was conducted
employing four different models when appropriate: intercepts-only, random-coefficient,
means-as-outcomes, and intercepts and slopes.
The null hypothesis offered that predicting variables at the first and second levels
o f analysis would not have an impact on the variance between individuals, organizations
and industries, and thus, not significantly improve model fit.
Intercepts-Only Model
Prior to implementing the cross-level analysis, an intercepts-only model with
Random Effects (or one-way analysis o f variance (ANOVA)) was conducted. The
intercepts-only model serves as a valuable first step to assess the variance in the
dependent variable (leadership effectiveness or systems awareness) present at each
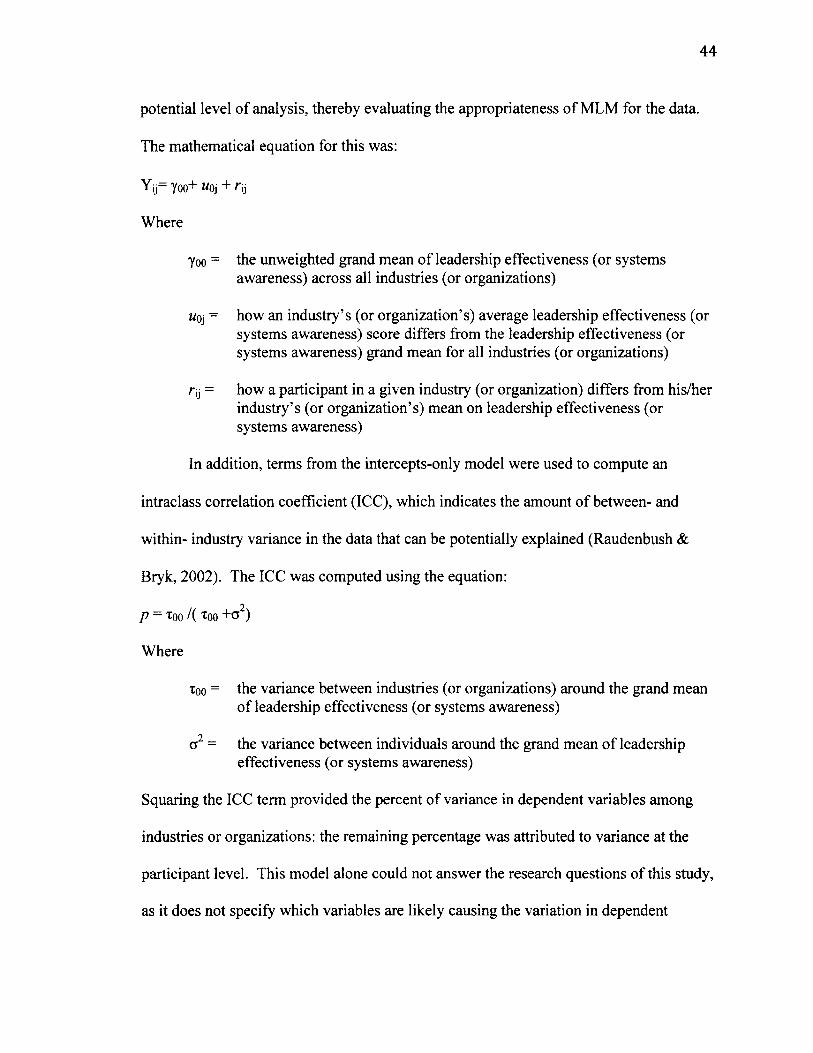
44
potential level of analysis, thereby evaluating the appropriateness o f MLM for the data.
The mathematical equation for this was:
Yij= Yoo+ woj + r]}
Where
Yoo = the unweighted grand mean o f leadership effectiveness (or systems awareness) across all industries (or organizations)
«oj “ how an industry’s (or organization’s) average leadership effectiveness (or systems awareness) score differs from the leadership effectiveness (or systems awareness) grand mean for all industries (or organizations)
ry = how a participant in a given industry (or organization) differs from his/her industry’s (or organization’s) mean on leadership effectiveness (or systems awareness)
In addition, terms from the intercepts-only model were used to compute an
intraclass correlation coefficient (ICC), which indicates the amount o f between- and
within- industry variance in the data that can be potentially explained (Raudenbush &
Bryk, 2002). The ICC was computed using the equation:
p = too / ( xoo +02)
Where
too= the variance between industries (or organizations) around the grand mean of leadership effectiveness (or systems awareness)
a = the variance between individuals around the grand mean of leadership effectiveness (or systems awareness)
Squaring the ICC term provided the percent o f variance in dependent variables among
industries or organizations: the remaining percentage was attributed to variance at the
participant level. This model alone could not answer the research questions o f this study,
as it does not specify which variables are likely causing the variation in dependent
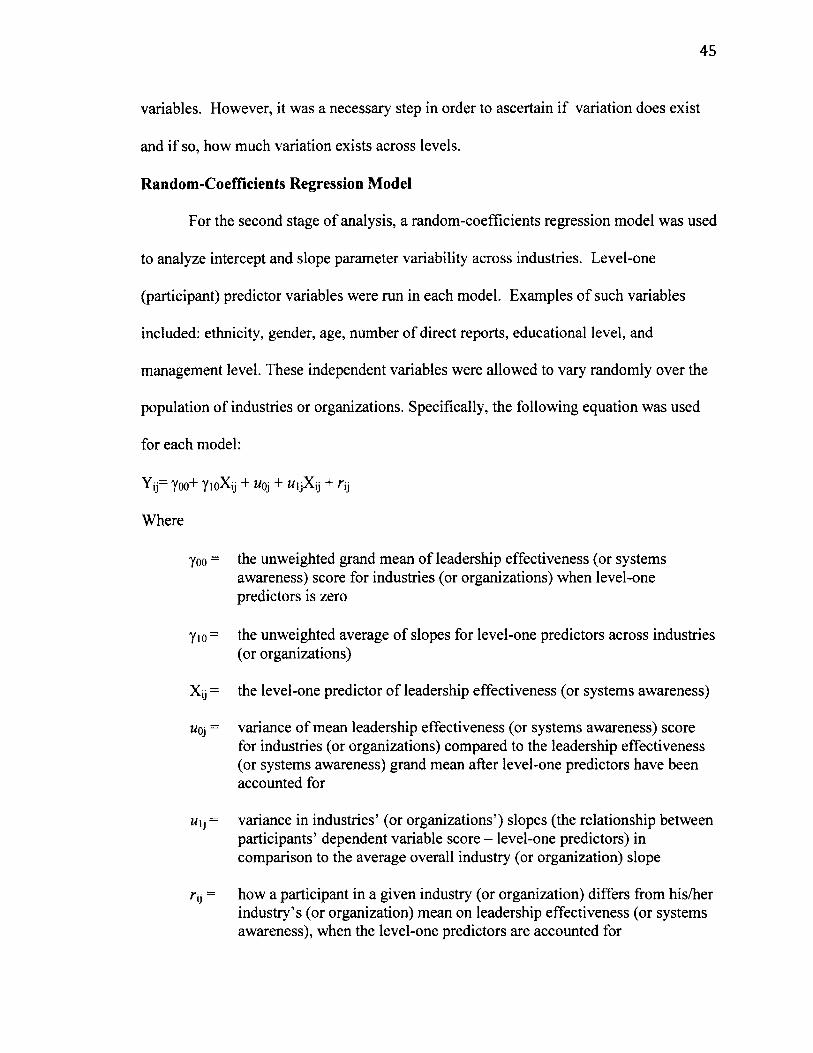
45
variables. However, it was a necessary step in order to ascertain if variation does exist
and if so, how much variation exists across levels.
Random-Coefficients Regression Model
For the second stage o f analysis, a random-coefficients regression model was used
to analyze intercept and slope parameter variability across industries. Level-one
(participant) predictor variables were run in each model. Examples o f such variables
included: ethnicity, gender, age, number o f direct reports, educational level, and
management level. These independent variables were allowed to vary randomly over the
population of industries or organizations. Specifically, the following equation was used
for each model:
Y jj— Y oo+ Y io X ij + w0j + M ijX jj + A"ij
Where
Yoo = the unweighted grand mean of leadership effectiveness (or systemsawareness) score for industries (or organizations) when level-one predictors is zero
Y10= the unweighted average o f slopes for level-one predictors across industries(or organizations)
Xjj = the level-one predictor o f leadership effectiveness (or systems awareness)
wqj = variance o f mean leadership effectiveness (or systems awareness) scorefor industries (or organizations) compared to the leadership effectiveness (or systems awareness) grand mean after level-one predictors have been accounted for
wij = variance in industries’ (or organizations’) slopes (the relationship betweenparticipants’ dependent variable score - level-one predictors) in comparison to the average overall industry (or organization) slope
rjj = how a participant in a given industry (or organization) differs from his/herindustry’s (or organization) mean on leadership effectiveness (or systems awareness), when the level-one predictors are accounted for
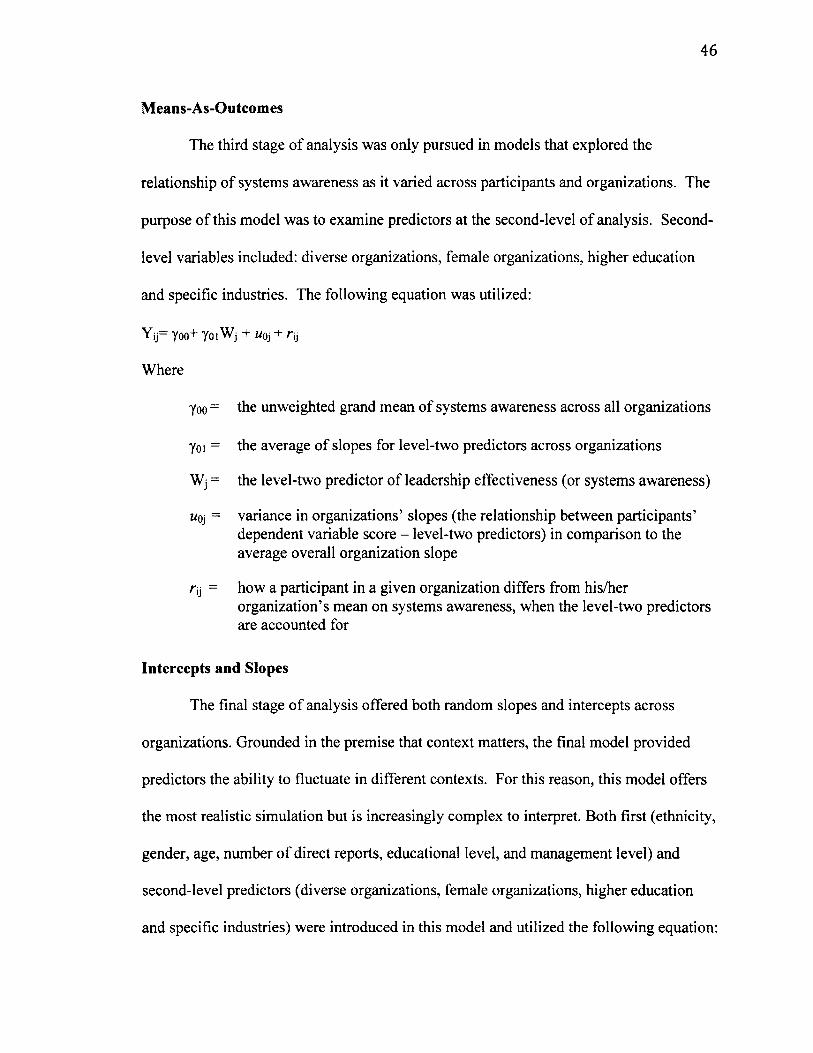
46
Means-As-Outcomes
The third stage of analysis was only pursued in models that explored the
relationship o f systems awareness as it varied across participants and organizations. The
purpose o f this model was to examine predictors at the second-level o f analysis. Second-
level variables included: diverse organizations, female organizations, higher education
and specific industries. The following equation was utilized:
Y j j = Y o o + Y o i W j + Moj + r y
Where
Y oo = the unweighted grand mean of systems awareness across all organizations
Y oi = the average o f slopes for level-two predictors across organizations
Wj = the level-two predictor of leadership effectiveness (or systems awareness)
«oj = variance in organizations’ slopes (the relationship between participants’dependent variable score - level-two predictors) in comparison to the average overall organization slope
r\\ = how a participant in a given organization differs from his/herorganization’s mean on systems awareness, when the level-two predictors are accounted for
Intercepts and Slopes
The final stage o f analysis offered both random slopes and intercepts across
organizations. Grounded in the premise that context matters, the final model provided
predictors the ability to fluctuate in different contexts. For this reason, this model offers
the most realistic simulation but is increasingly complex to interpret. Both first (ethnicity,
gender, age, number o f direct reports, educational level, and management level) and
second-level predictors (diverse organizations, female organizations, higher education
and specific industries) were introduced in this model and utilized the following equation:
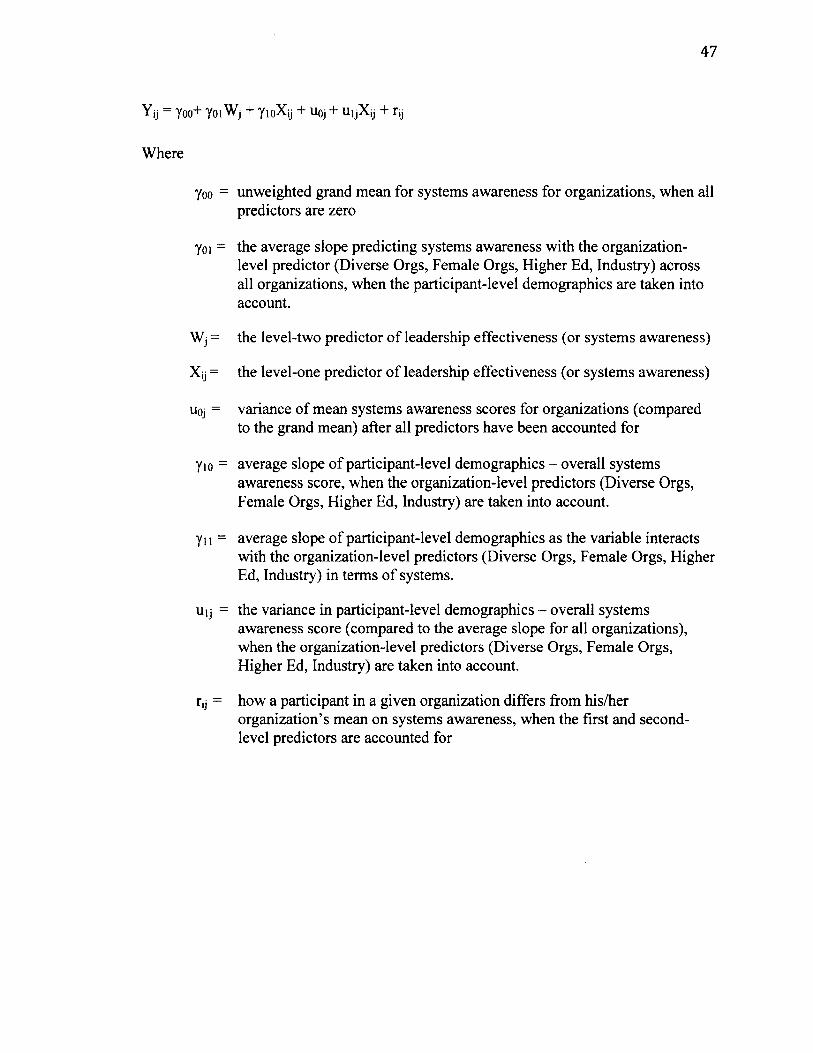
47
Yjj = Y00+ YOlWj + YioXjj + U0j + UijXy + ry
Where
Yoo = unweighted grand mean for systems awareness for organizations, when all predictors are zero
Yoi = the average slope predicting systems awareness with the organization- level predictor (Diverse Orgs, Female Orgs, Higher Ed, Industry) across all organizations, when the participant-level demographics are taken into account.
Wj = the level-two predictor o f leadership effectiveness (or systems awareness)
Xy = the level-one predictor o f leadership effectiveness (or systems awareness)
uoj = variance of mean systems awareness scores for organizations (comparedto the grand mean) after all predictors have been accounted for
Yio - average slope of participant-level demographics - overall systemsawareness score, when the organization-level predictors (Diverse Orgs, Female Orgs, Higher Ed, Industry) are taken into account.
Yi i = average slope of participant-level demographics as the variable interactswith the organization-level predictors (Diverse Orgs, Female Orgs, Higher Ed, Industry) in terms o f systems.
uy = the variance in participant-level demographics - overall systemsawareness score (compared to the average slope for all organizations), when the organization-level predictors (Diverse Orgs, Female Orgs, Higher Ed, Industry) are taken into account.
ry = how a participant in a given organization differs from his/herorganization’s mean on systems awareness, when the first and second- level predictors are accounted for

48
CHAPTER FOUR
INDUSTRY-LEVEL FINDINGS
The intention of this study was to investigate patterns o f leadership competencies
and assess the variance o f leadership effectiveness across contexts. Archival data from
the Leadership Circle Profile’s (TLCP) 360-degree instrument was utilized in order to
perform the quantitative analysis necessary to answer this study’s research questions.
Both descriptive and inferential statistics were explored and specifically, multi-level
modeling (MLM) analyses were conducted. This chapter reports and is guided by the
results of the first four research questions. It is important to note that all tables and
appendices referencing the results o f this study are reported to the thousandths place.
This was done since standard deviations and variance terms were particularly narrow due
to a five-point scale and in some circumstances justified interpreting and reporting the
thousandths place, which enhanced the precision o f measurement and maintained
consistency throughout the study’s findings.
Research Question 1: Demographics Across Industries
The original data sample from TLCP included 246,645 records across the years of
2000-2010. These records represented ratings for over 19,000 individuals and were
transformed into a single case for each individual rated. As discussed previously
detailed, 6,743 o f the cases were retained for this study after meeting specified
parameters (see Chapter 3). This included 56 organizations across 15 industries.
To further investigate sample differences and similarities, descriptive analysis
included mean and percentage counts for the sample as well as within distinct industries.
The average age of participants was 43. Ethnic representation was as follows: 78.4%
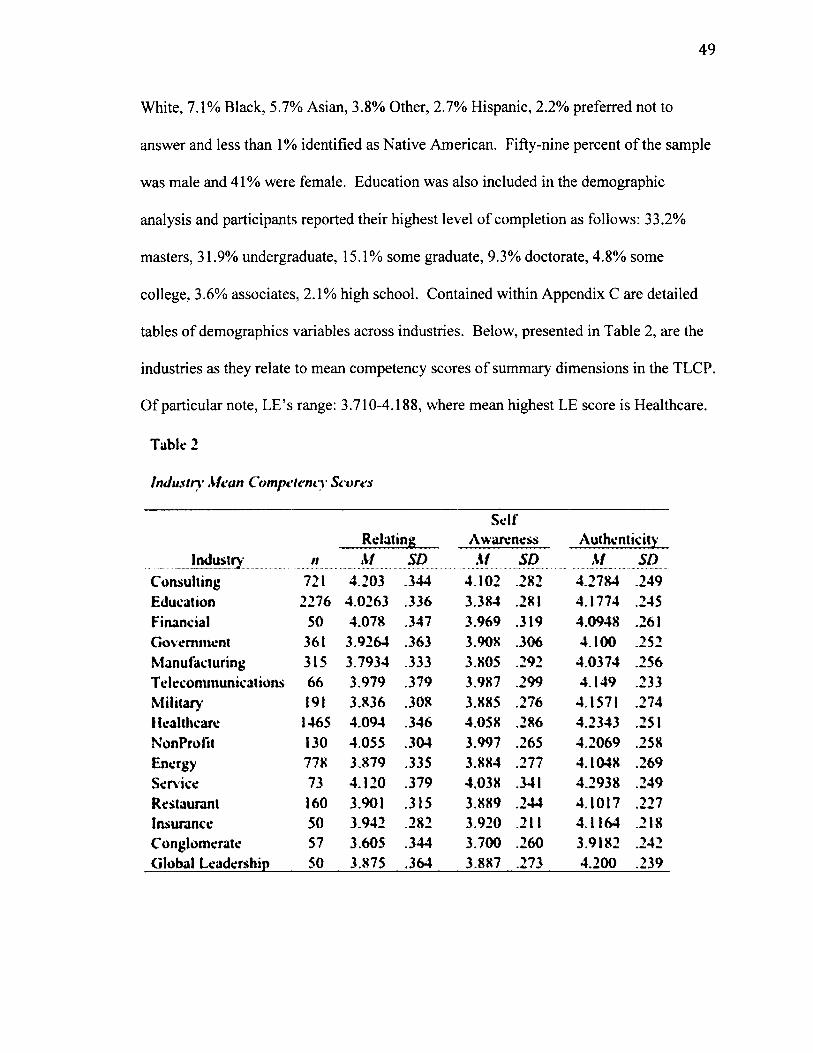
49
White, 7.1% Black, 5.7% Asian, 3.8% Other, 2.7% Hispanic, 2.2% preferred not to
answer and less than 1% identified as Native American. Fifty-nine percent o f the sample
was male and 41% were female. Education was also included in the demographic
analysis and participants reported their highest level of completion as follows: 33.2%
masters, 31.9% undergraduate, 15.1% some graduate, 9.3% doctorate, 4.8% some
college, 3.6% associates, 2.1% high school. Contained within Appendix C are detailed
tables of demographics variables across industries. Below, presented in Table 2, are the
industries as they relate to mean competency scores o f summary dimensions in the TLCP.
O f particular note, LE’s range: 3.710-4.188, where mean highest LE score is Healthcare.
Table 2
Industry Mean Competency Scores
SelfRelating Awareness Authenticity
Industry n __M _ ... ..SD .... ......M ..... SD..... ........M SDConsulting 721 4.203 .344 4.102 .282 4.2784 .249Education 2276 4.0263 .336 3.384 .281 4.1774 .245Financial 50 4.078 .347 3.969 .319 4.0948 .261Government 361 3.9264 .363 3.908 .306 4.100 .252Manufacturing 315 3.7934 .333 3.805 .292 4.0374 .256T clccommunicaiions 66 3.979 .379 3.987 .299 4.149 .233Military 191 3.836 .308 3.885 .276 4.1571 .274Healthcare 1465 4.094 .346 4.058 .286 4.2343 .251NonProfit 130 4.055 .304 3.997 .265 4.2069 .258Energy 778 3.879 .335 3.884 .277 4.1048 .269Service 73 4.120 .379 4.038 .341 4.2938 .249Restaurant 160 3.901 .315 3.889 .244 4.1017 .227Insurance 50 3.942 .282 3.920 .211 4.1164 .218Conglomerate 57 3.605 .344 3.700 .260 3.9182 .242Globa) Leadership 50 3.875 .364 3.887 .273 4.200 .239

50
Tabic 2 Continued
Industry■ Mean Competency Scores
Industry n
SystemsAwareness Achieving
LeadershipEffectiveness
M SD M SD At SDConsulting 721 3.988 .293 4.193 .271 4.172 .361Education 2276 3.885 .297 4.158 .271 4.093 .372Financial 50 3.832 .326 4.071 .332 4.067 .391Government 361 3.857 .292 4.049 .296 3.979 .393Manufacturing 315 3.706 .277 3.991 .293 3.894 .374Telecommunications 66 3.945 .286 4.123 .285 4.047 .401Military 191 3.801 .284 4.014 .293 3.927 .338Healthcare 1465 4.013 .271 4.217 .271 4.188 .363Nonprofit 130 4.041 .268 4.207 .248 4.185 .310Energy 778 3.724 .289 4.035 .295 3.969 .380Service 73 3.972 .348 4.228 .282 4.161 .396Restaurant 160 3.791 .253 4.037 .293 3.949 .381Insurance 50 3.701 .252 4.060 .246 3.971 .313Conglomerate 57 3.590 .213 3.862 .218 3.710 .379Global Leadership 50 3.752 .266 4.161 .248 4.060 .373
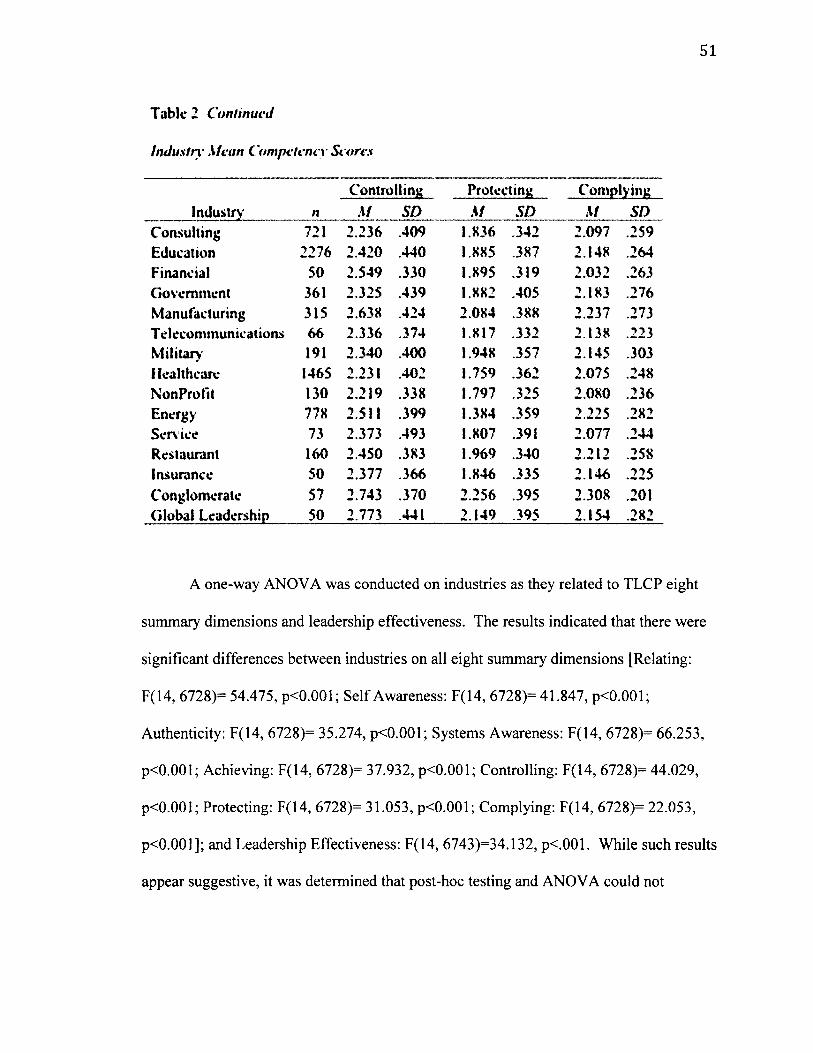
51
Table 2 Continued
Industry• Mean Competency Scores
Industry nControlling Protecting Complying
M SD M SD M SDConsulting 721 2.236 .409 1.836 .342 2.097 .259Education 2276 2.420 .440 1.885 .387 2.148 .264Financial 50 2.549 .330 1.895 .319 2.032 .263Government 361 2.325 .439 1.882 .405 2.183 .276Manufacturing 315 2.638 .424 2.084 .388 2.237 .273T elecommunications 66 2.336 .374 1.817 .332 2.138 .223Military' 191 2.340 .400 1.948 .357 2.145 .303Healthcare I46S 2.231 .402 1.759 .362 2.075 .248NonProfit 130 2.219 .338 1.797 .325 2.080 .236Energy 778 2.511 .399 1.384 .359 2.225 .282Service 73 2.373 .493 1.807 .391 2.077 .244Restaurant 160 2.450 .383 1.969 .340 2.212 .258Insurance 50 2.377 .366 1.846 .335 2.146 .225Conglomerate 57 2.743 .370 2.256 .395 2.308 .201Global Leadership 50 2.773 .441 2.149 .395 2.154 .282
A one-way ANOVA was conducted on industries as they related to TLCP eight
summary dimensions and leadership effectiveness. The results indicated that there were
significant differences between industries on all eight summary dimensions [Relating:
F(14, 6728)= 54.475, p<0.001; Self Awareness: F(14, 6728)= 41.847, p<0.001;
Authenticity: F(14, 6728)= 35.274, p<0.001; Systems Awareness: F(14, 6728)= 66.253,
p<0.001; Achieving: F(14, 6728)= 37.932, p<0.001; Controlling: F(14, 6728)= 44.029,
p<0.001; Protecting: F(14, 6728)= 31.053, p<0.001; Complying: F(14, 6728)= 22.053,
p<0.001]; and Leadership Effectiveness: F(14, 6743)=34.132, p<.001. While such results
appear suggestive, it was determined that post-hoc testing and ANOVA could not
52
appropriately account for the variance across industries and that multi-level analysis
would provide richer explanatory power.
Research Question 2: Leadership Effectiveness Across Industry
Given that leadership effectiveness was constructed in several ways: mean
aggregate o f leadership effectiveness for others’, mean aggregate o f leadership
effectiveness for self and others’ scores, and distance between self and others’ leadership
effectiveness scores (see Chapter 3 for variable construction), calculations for the ICC
were conducted to determine the best model to explain variance across levels of
'y
individual and industry data. Employing the equation ICC = too / ( too +c ) the mean
aggregate of leadership effectiveness for others’ yielded ICC=0.093, mean aggregate of
leadership effectiveness for self and others’ scores yielded ICC=0.062, and distance
between self and others’ leadership effectiveness scores yielded ICC=0.046. Converted
to percentages, the ICC indicates the amount o f between- and within-industry variance
that can be potentially explained.
The mean aggregate of leadership effectiveness for other’s scores indicated the
highest percentage o f second-level variance (9.3%, p<0.001). Suggesting that, after
accounting for individual differences in leadership effectiveness, 9.3% of the variance
lies between industry differences. This is a modest variance percentage, as 86.7%
remained between individuals. Given that, while modest, some variance does exist at the
industry-level, this model was retained as it appropriately accounts for such variance
when considering other predictors. Put simply, continuing analysis in multi-level
modeling was a more appropriate technique to investigate individual-level factors as they
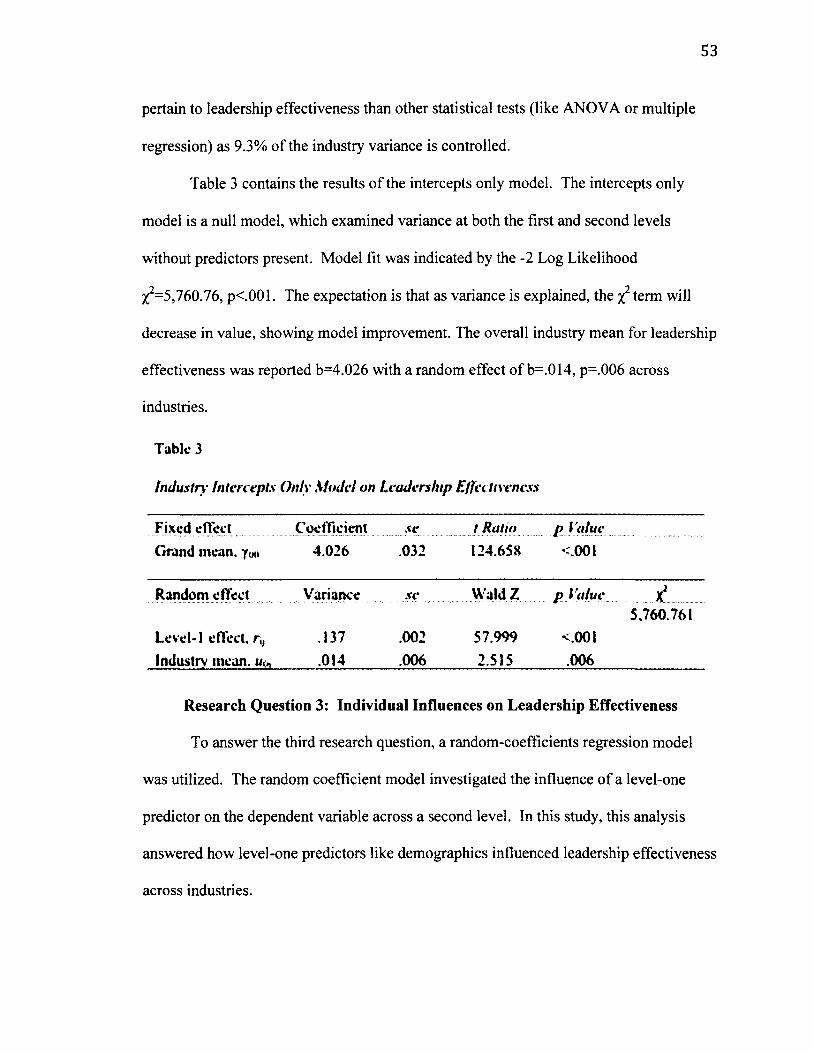
53
pertain to leadership effectiveness than other statistical tests (like ANOVA or multiple
regression) as 9.3% of the industry variance is controlled.
Table 3 contains the results o f the intercepts only model. The intercepts only
model is a null model, which examined variance at both the first and second levels
without predictors present. Model fit was indicated by the -2 Log Likelihood
3^=5,760.76, p<.001. The expectation is that as variance is explained, the %2 term will
decrease in value, showing model improvement. The overall industry mean for leadership
effectiveness was reported b=4.026 with a random effect o f b=.014, p=.006 across
industries.
Table 3
Industry Intercepts Only Model on Leadership Effectiveness
Fixed effect Coefficient .«• t Ratio p ValueGrand mean, fm 4.026 .032 124.658 <.001
Random effect Variance ..... sc....... .....Wald Z .... ...p Value ..........x25,760.761
Level-1 effect, rM .137 .002 57.999 <.001Industry mean, t/,* .014 .006 2.S15 .006
Research Question 3: Individual Influences on Leadership Effectiveness
To answer the third research question, a random-coefficients regression model
was utilized. The random coefficient model investigated the influence o f a level-one
predictor on the dependent variable across a second level. In this study, this analysis
answered how level-one predictors like demographics influenced leadership effectiveness
across industries.
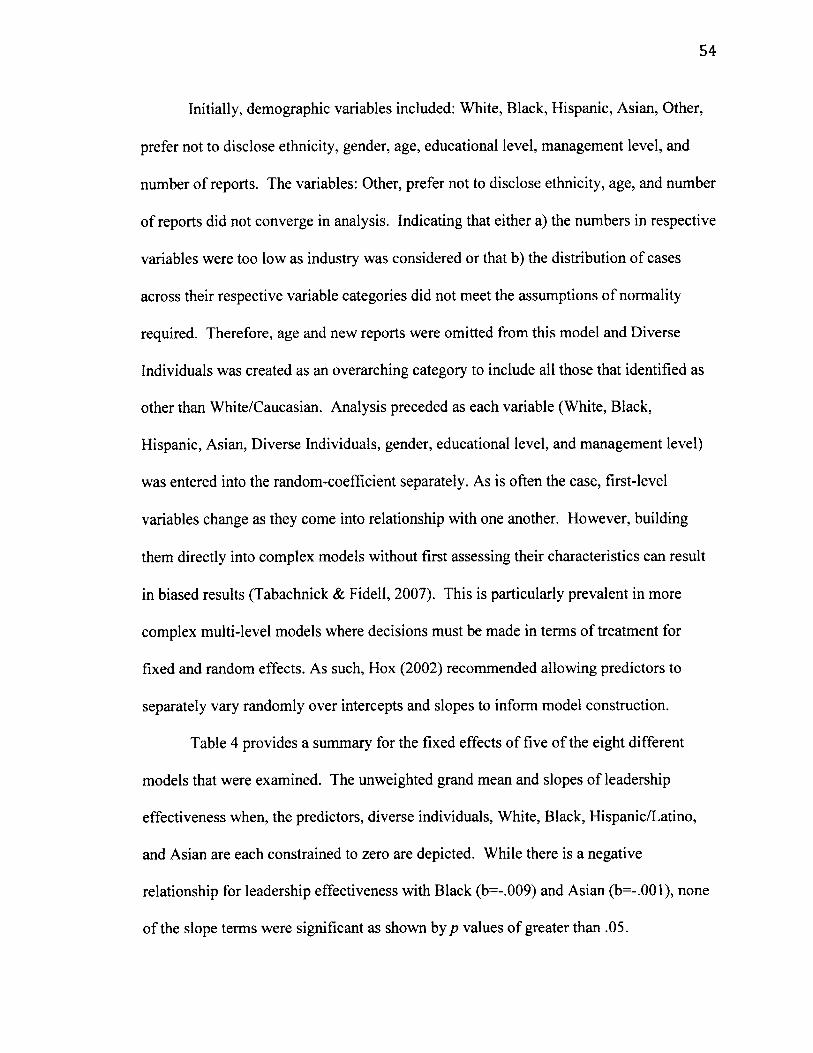
54
Initially, demographic variables included: White, Black, Hispanic, Asian, Other,
prefer not to disclose ethnicity, gender, age, educational level, management level, and
number o f reports. The variables: Other, prefer not to disclose ethnicity, age, and number
of reports did not converge in analysis. Indicating that either a) the numbers in respective
variables were too low as industry was considered or that b) the distribution o f cases
across their respective variable categories did not meet the assumptions of normality
required. Therefore, age and new reports were omitted from this model and Diverse
Individuals was created as an overarching category to include all those that identified as
other than White/Caucasian. Analysis preceded as each variable (White, Black,
Hispanic, Asian, Diverse Individuals, gender, educational level, and management level)
was entered into the random-coefficient separately. As is often the case, first-level
variables change as they come into relationship with one another. However, building
them directly into complex models without first assessing their characteristics can result
in biased results (Tabachnick & Fidell, 2007). This is particularly prevalent in more
complex multi-level models where decisions must be made in terms o f treatment for
fixed and random effects. As such, Hox (2002) recommended allowing predictors to
separately vary randomly over intercepts and slopes to inform model construction.
Table 4 provides a summary for the fixed effects of five o f the eight different
models that were examined. The unweighted grand mean and slopes o f leadership
effectiveness when, the predictors, diverse individuals, White, Black, Hispanic/Latino,
and Asian are each constrained to zero are depicted. While there is a negative
relationship for leadership effectiveness with Black (b=-.009) and Asian (b=-.001), none
of the slope terms were significant as shown by p values o f greater than .05.

55
Tabic 4
Industry Random-Coefficient Fixed Effects for Ethnicity on Leadership Effectiveness
________________________ Coefficient_______ sy_________ t Ratio______ p ValueDiverse Individuals
Grand mean. 4.012 .043 92.560 92.560Slope, y,u .019 .022 .871 .871
WhiteGrand mean, ywu 4.008 .037 109.271 <.001Slope, yiu .024 .021 1.148 .272
BlackGrand mean. y«. 4.027 .031 127.117 <.001Slope. y,u -.009 .033 -.268 .796
Hispanic/LatinoGrand mean. 4.026 .032 125.898 <.001Slope, ym .003 .042 .069 .948
AsianGrand mean. Yw 4.027 .032 125.712 <.001Slope, yiu . . . - 001 .028 _ -.017 . ,987
Fixed effects for other criterion variables are depicted in Table 5. Consistent with
findings from ethnicity, slope terms in fixed effects for all other variables were also not
significant when entered into models separately. However, interpretation became richer
for both the intercept and slope terms after consulting the random effects o f each model.
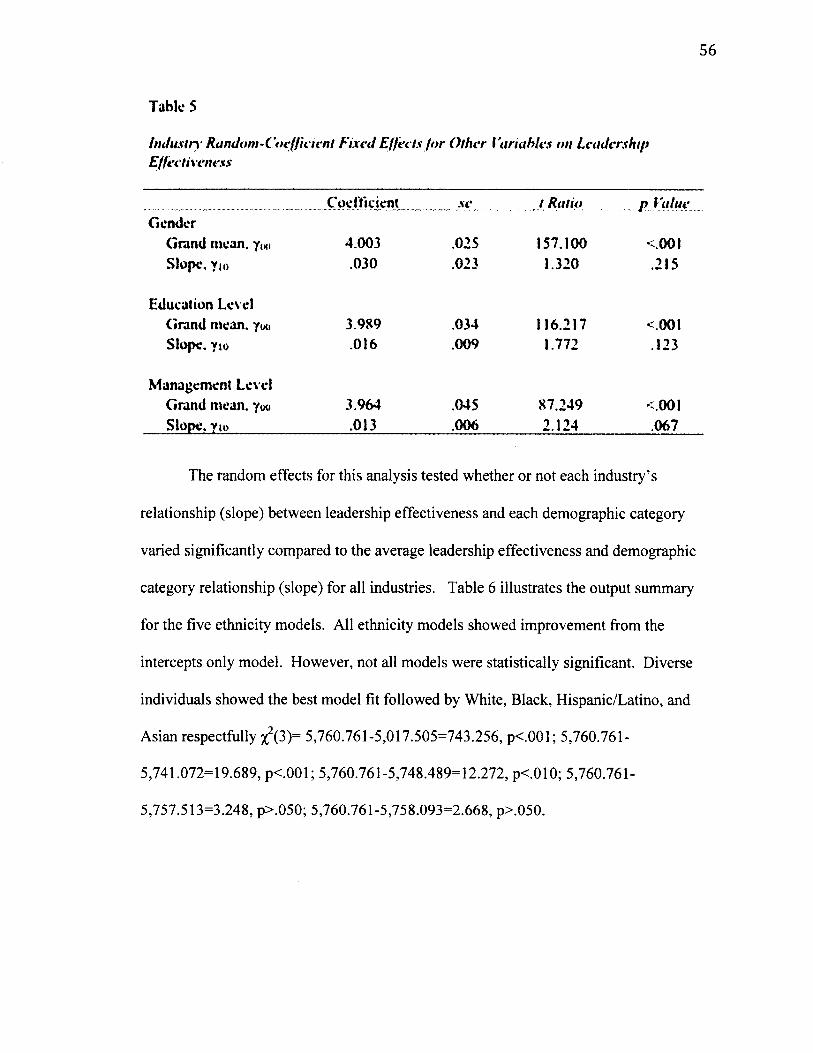
56
Tabic 5
Indusin Random-Coefficient Fixed Effects for Other Variables on LeadershipEffectiveness
Coefficient ......s e ....... ... / Ratio....... p ValueGender
Grand mean. y(Ki 4.003 .025 157.100 <.001Slope. yl0 .030 .023 1.320 .215
Education LevelGrand mean, yint 3.989 .034 116.217 <.001Slope, yio .016 .009 1.772 .123
Management LevelGrand mean, ywi 3.964 .04S 87.249 <.001Slope. Yn> .013 .006 2.124 .067
The random effects for this analysis tested whether or not each industry’s
relationship (slope) between leadership effectiveness and each demographic category
varied significantly compared to the average leadership effectiveness and demographic
category relationship (slope) for all industries. Table 6 illustrates the output summary
for the five ethnicity models. All ethnicity models showed improvement from the
intercepts only model. However, not all models were statistically significant. Diverse
individuals showed the best model fit followed by White, Black, Hispanic/Latino, and
Asian respectfully x2(3)= 5,760.761-5,017.505=743.256, p<.001; 5,760.761-
5,741.072=19.689, p<.001; 5,760.761-5,748.489=12.272, p<.010; 5,760.761-
5,757.513=3.248, p>.050; 5,760.761-5,758.093=2.668, p>.050.
57
Industry• Random-Coefficient Random Effects for Ethnicity on Leadership
Tabic 6
Industry Random-Coeffietent Random Effects for Ethnicity on LeadershipEffectiveness
___________________ Variance se Wald Z p Value x*Diverse Individuals 5,017.505
Level-1 effect, r„ .133 54.911 54.911 <.001Industry mean, mo, .024 2.293 2.293 .011Covariance, mio -.006 -1.444 -1.444 .149Slope, in, .003 1.496 1.496 .067
White 5,741.072Level-1 effect, r,, .136 .002 57.964 <001Industry mean, mo, .017 .008 2.179 .014Covariance,!/.,, -.002 .003 -.701 .484Slope, in, .003 .002 1.514 .130
Black 5,748.489Level-1 effect. r„ .136 .002 57.945 <001Industry mean. Mu, .014 .006 2.505 .006Covariance. m,« .009 .006 1.544 .123Slope. m„ .008 .006 1.248 .106
I iispanic/Latino 5.757.513Level-1 effect, r., .136 .002 57.940 <.001Industry mean. Mu, .014 .006 2.508 .006Covariance. m,u .005 .006 .893 .372Slope. u„ .007 .009 .715 .237
Asian 5.758.093Level-1 effect. r„ .136 .002 57.965 <.001Industry mean, i/u, .014 .006 2.S02 .006Covariance, miu .002 .004 .415 .678
Slope, uu . ,............. ,002......... .003........ .865 .193
Table 7 displays the random effects for other variables. In this case, models were
all statistically a significant model improvement y2(3)= 5,760.761-5,657.130=103.631,

58
p<.001; 5,760.761-5,106.641=654.120, p<.001; and 5,760.761-5,713.314=47.447,
p<.001.
Table 7
Industry Random-Coefficient Random Effects for Other Variables on Leadership Effectiveness
t*....5.657.13
Variance Wald Z p ValueGender
Level-1 effect. r„ .135 57.879 <.001Industry mean, to,, .009 2.364 .009Predictor covariance. t/|0 .006 2.153 .031Predictor slope, a,, .005 1.695 .045
Education Level 5,106.641Level-1 effect. r„Industry mean. to,,Predictor covariance, an,Predictor slope, ui.
Management Level 5 ,713 .314Level-1 effect. r„Industry mean, to,,Predictor covariance, uw
Predictor slope, u,f
.133 55.514 <.001Oil 1.727 .042.000 .037 .711.000 .771 .220
.136 57.864 <001
.022 1.721 .042-.001 -.897 .370.000 1.197 .115
In both ethnicity and other variables (Table 6 & 7), industry means, uq} were
significant: Diverse Individuals, b = .024, p=.011; White, b = .017, p=.014; Black, b =
.014, p=.006; Hispanic/Latino, b = .014, p=.006; Asian, b = .014, p=.006; gender, b =
.009, p=.009; educational level, b = .011, p=.042; and management level b = .022,
p=.042. Taken together, this means that variation existed in the industry mean intercept
o f leadership effectiveness as compared to the grand mean of all industries when the
respective demographic category is taken into account. Despite this, the residuals or

59
level-1 effect terms were also p<.001, and made little improvement from the intercepts
only model.
Gender was the only level-one predictor to indicate that its’ relationship with
leadership effectiveness differed depending on the industry average of leadership
effectiveness. Said simply, the covariance term mio showed a positive relationship with
females and leadership effectiveness and that these two variables influence each other b =
.006, p<.001. Further, the slope My for gender was also significant b = .005, p<.001,
denoting that the relationship o f leadership effectiveness and gender differed by industry.
The presence o f a significant slope My signifies that the fixed effects (Table 5) for gender
may not be interpretable, as My represents the need for multiple slopes, one for each
industry (Tabachnick & Fidell, 2007). Thus, a single fixed slope may not be accurate.
Integrating the findings from the random coefficient models, variables were
entered together to find the best model. The combination o f Diverse Individuals, gender,
education level, and management level displayed the best model fit with x2(6)=
5,760.761-4,937.370=823.391, p<.001 (Table 8). It is important to note that gender was
interpreted as random effect due to its significant slope and covariance terms when
initially run in random effects (Table 7) and all other variables were fixed.
As is indicated by Table 8, education and management levels were both
substantial predictors. Estimates specify that as levels o f management increased by one
unit, leadership effectiveness increased by .014 and as education level increased by one
unit, leadership effectiveness increased .016 points. Additionally, this model decreased
individual variance by 4.4% (b = .131, p<.001) and industry variance by 35.7% (b = .009,
p=.008). However, there were several problematic returns in this model. First, the

60
statistically significant slope term, u\i for random effects indicated a greater than chance
probability that the relationship of level-one effects and leadership effectiveness differed
by industry; in essence, rendering fixed effects uninterpretable. Additionally, the
clumping of minorities into Diverse Individuals, while empirically provided a strong
model fit, did not supply a rich interpretation. For these reasons, an additional model was
explored.
Table 8
Best-Fit Model o f Leadership Effectiveness with 1st Level Predictors
Fixed Effects Coe fficient se t Ratio p Value
Grand mean, ywDiverse Individuals slope, yw Gender slope, yw Education Level slope, yjo Management Level slope, yio
Random EfTects
3.899.001.030.016.014
Variance
.035
.012
.021
.007
.003
se
110.974
.0941.4312.4714.703
Wald Z
<.001.925.181.014
<.001
p Value x2
Gender 4.937.370Level-1 effect. r„ .131 .002 54,911 <.001Industry mean. u„, .009 .004 2.389 .008Covariance, u.,;, .006 .003 2.286 .022Slope, ui, .005 .003 1.722 .042
Adding specific demographic categories enriched the interpretation o f Table 9.
While the model decreased in fit, it still remained highly significant x2(6)= 5,760.761-
5,037.972=722.789, p<.001 and meaningful, as the location o f gender became fixed
permitting model interpretation. Black (b = .056, p=.029) on average had a stronger
relationship with leadership effectiveness than other ethnicities and was the only
statistically significant ethnic predictor. Both education and management level were
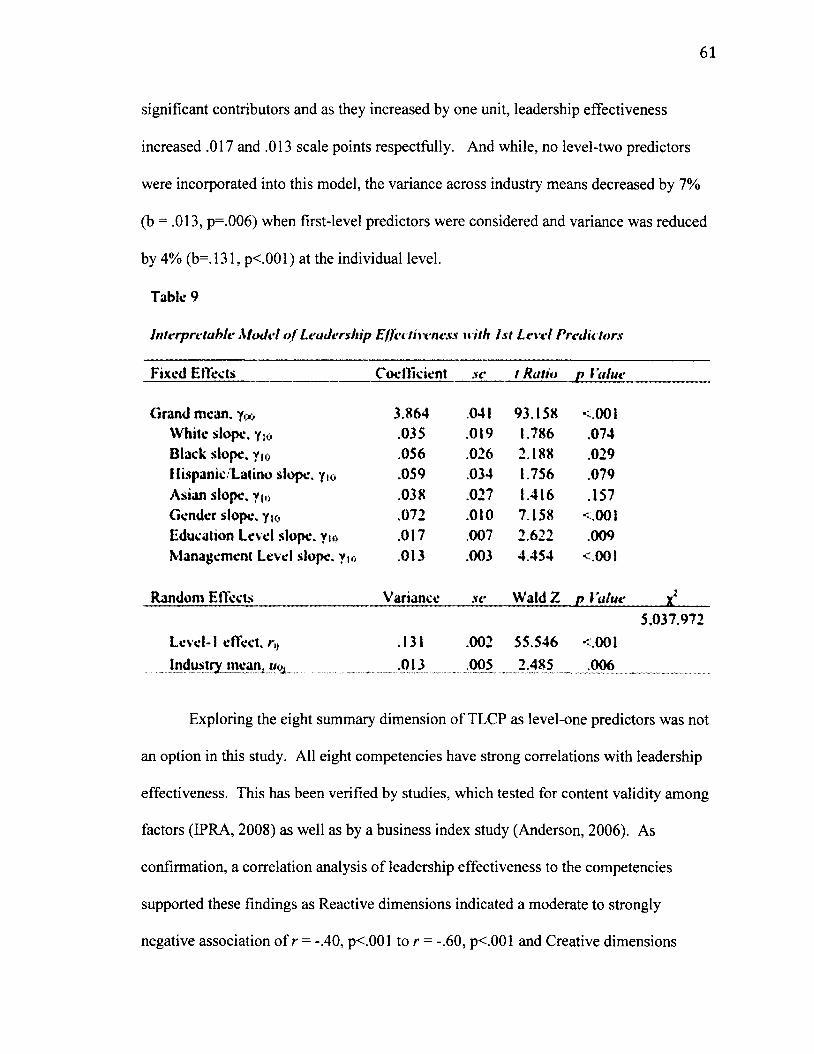
61
significant contributors and as they increased by one unit, leadership effectiveness
increased .017 and .013 scale points respectfully. And while, no level-two predictors
were incorporated into this model, the variance across industry means decreased by 7%
(b = .013, p=.006) when first-level predictors were considered and variance was reduced
by 4% (b=.131, p<.001) at the individual level.
Table 9
Interpretable Model o f Leadership Effectiveness with 1st Level Predictors
Fixed Effects Coefficient se t Ratio p Value
Grand mean, y,,;, 3.864 .041 93.158 <.001White slope, yjo .035 .019 1.786 .074Black slope. yl() .056 .026 2.188 .029Hispanic Lalino slope. .059 .034 1.756 .079Asian slope, y 10 .038 .027 1.416 .157Gender slope. yi<> .072 .010 7.158 <.001Education Level slope. yi,> .017 .007 2.622 .009Management Level slope. yt0 .013 .003 4.454 <.001
Random Effects Variance se Wald Z p Value x25.037.972
Level-1 effect, n, .131 .002 55.546 <.001Industry mean, i/q, .013 .005.... 2,485_____ .006 _________
Exploring the eight summary dimension of TLCP as level-one predictors was not
an option in this study. All eight competencies have strong correlations with leadership
effectiveness. This has been verified by studies, which tested for content validity among
factors (IPRA, 2008) as well as by a business index study (Anderson, 2006). As
confirmation, a correlation analysis o f leadership effectiveness to the competencies
supported these findings as Reactive dimensions indicated a moderate to strongly
negative association o f r = -.40, p<.001 to r = -.60, p<.001 and Creative dimensions
62
indicated a highly positive association o f r = .77, p<.001 to r = .90, p<.001. Such strong
relationships assume multicollinearity and would heavily biased estimates.
Research Question 4: Second-level Considerations
As initially constructed, the fourth research question was conditional upon the
appropriateness o f analysis. While, subsequent levels o f analyses enrich interpretation,
their practical utility can be questionable. Often, ICC is used as a determinant for
building additional levels o f analysis. Although, there is not a clear cut-off in terms of
percentage, as can be the case in interpreting statistics, it is unlikely that industry leaders
would invest time and resources into predictors that, taken together, offer less than 10%
explanatory power. For this reason, the fourth research question was deemed practically
insignificant despite, findings that variation of leadership effectiveness was 9.3%,
p<0.001 at the industry-level.
The presence o f research question four, while not employable in its current
construction, was particularly helpful for advancing scholarly inquiry. Too often
insignificant results are not interpreted. Such indices can often be as informative,
illuminating holes or gaps, as the authority o f significant findings. For this study, there
were two specific areas that permitted a reconstruction of possibility: the level o f analysis
and the dependent variable. Specifically, if there was not substantial variation at the
industry-level, where might it reside? And, given that leadership effectiveness is highly
correlated with all summary dimensions o f TLCP, how might these dimensions vary
across levels o f inquiry? Such questions resulted in an exploratory quantitative
investigation and are discussed further in Chapter 5.
63
CHAPTER 5
ORGANIZATION-LEVEL FINDINGS
Following the conclusion that second-level variance was limited when industries
were considered, this chapter highlights an exploratory analysis o f competencies as they
vary across organizations. Finding that systems awareness explained considerable
variability, further analysis investigated relevant predictors.
Research Question 5: Second-level Variance by Competencies
Engaging exploratory multi-level analysis, intercepts-only regression models were
run across organizations within the TLCP. Fifty-four organizations composed a sample
o f the same 6,743 participants that were taken from the fifteen industries included in
Chapter four. Fourteen models were run and ICC’s (see Appendix D) indicated that
Relating and Systems Awareness had the highest amount of variation across
organizations 18.45% and 18.11% respectively. While all Creative dimensions have a
positive correlation with Leadership Effectiveness, Relating suggested collinearity with a
tolerance o f .165 and a variance inflation factor (VIF) o f 6.049; whereas, Systems
Awareness displayed a tolerance of .250 and VIF o f 3.996. Moreover, Systems
Awareness implies an understanding o f connectivity and working across systems, thus
the theoretical contribution was more relevant to the study of nested phenomena in
leadership.
Table 10 shows the results from the intercepts-only regression and baseline model
for Systems Awareness. Here, the overall mean for Systems Awareness was reported as
b = 3.881, p<.001. Variation across organizations, indicated in the random effects, was b
= .017, pc.001 and accounts for 18.11% of the variance.
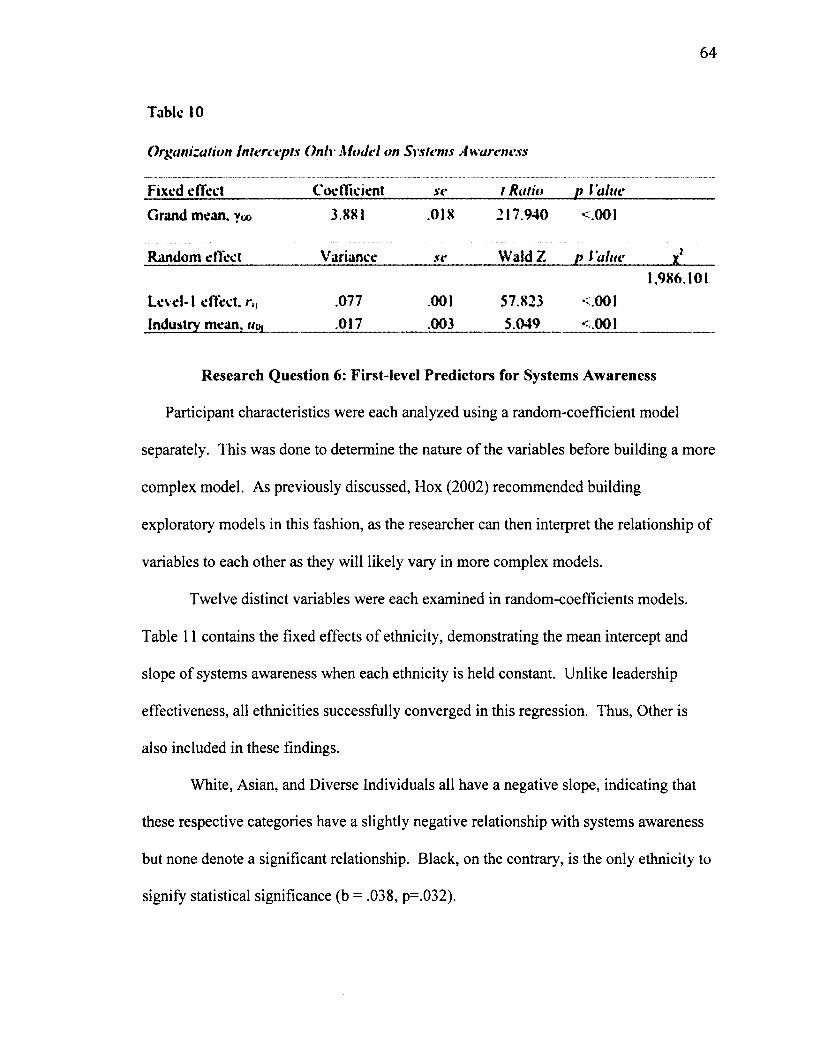
64
Tabic 10
Organization intercepts Only Model on Systems Awareness
Fixed effect____________Coefficient______ sc_______ t Ratio p ValueGrand mean. yw
Random effect
3.881
Variance
.018
se
217.940
Wald Z
<.001
p lalue X*
Level-1 effect. r„ .077 .001 57.823 <.0011,986.101
Industry mean, i / d, .017 .003 5.049 <.001
Research Question 6: First-level Predictors for Systems Awareness
Participant characteristics were each analyzed using a random-coefficient model
separately. This was done to determine the nature o f the variables before building a more
complex model. As previously discussed, Hox (2002) recommended building
exploratory models in this fashion, as the researcher can then interpret the relationship of
variables to each other as they will likely vary in more complex models.
Twelve distinct variables were each examined in random-coefficients models.
Table 11 contains the fixed effects of ethnicity, demonstrating the mean intercept and
slope of systems awareness when each ethnicity is held constant. Unlike leadership
effectiveness, all ethnicities successfully converged in this regression. Thus, Other is
also included in these findings.
White, Asian, and Diverse Individuals all have a negative slope, indicating that
these respective categories have a slightly negative relationship with systems awareness
but none denote a significant relationship. Black, on the contrary, is the only ethnicity to
signify statistical significance (b = .038, p=.032).

65
Table 11
Organization Random-Coefficient Fixed Effects for Ethnicity on Systems Awareness
Fixed Effects ....Coefficient..... _ .. A T ......... _ ___t Ratio.... p ValueDiverse Individuals
Grand mean, y,» 3.898 .021 185.652 <.001Slope, Yi« -.010 .011 -.939 .354
WhiteGrand mean. y«i 3.887 .019 206.283 <.001Slope, yin -.007 .011 -.651 .518
BlackGrand mean, yt<l 3.879 .018 219.067 <001Slope. Ym .038 .016 2.327 .032
Hispanic.'LatinoGrand mean, y«, 3.881 .018 217.007 <.001Slope, Ym .021 .031 .678 .505
AsianGrand mean, y«, 3.882 .018 217.498 <.001Slope. Ym -.006 .017 -.320 .760
OtherGrand mean, y» 3.883 .018 217.221 <001
.... Slope. Y lf l .................................... -.047 .023 -2.057 .056
Six other categories o f level-one predictors are shown in Table 12 for fixed
effects. Positive relationships among predictors and systems awareness are indicated
significant in all but the number o f reports. However, the grand mean when educational
level is constrained to zero (b = 3.800, p<.001) shows the most change from the null
model (b - 3.881, p<.001), while the distance score o f leadership effectiveness depicts
the greatest slope (b = .177, p<.001).
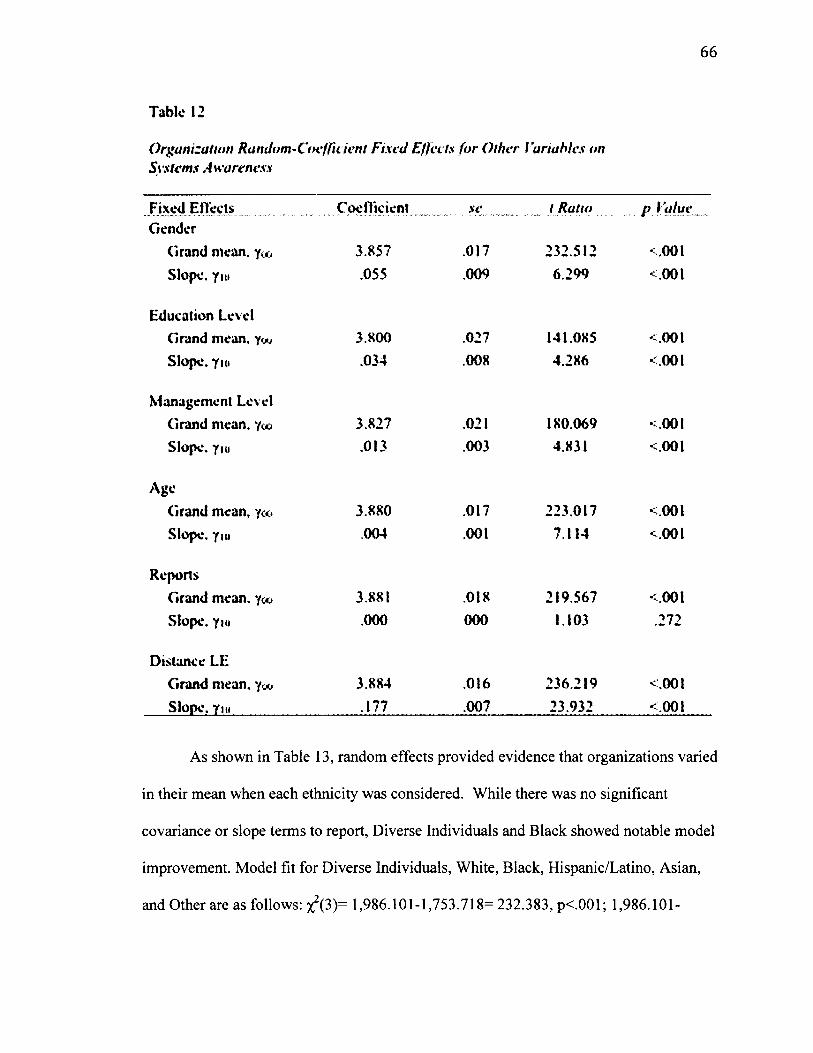
6 6
Table 12
Organization Random-Coefficient Fixed Effects for Other Variables onSystems Awareness
Fixed Effects.. ..... .. .........Gender
....Coefficient .... .vr l Ratio p Value
Grand mean, y,x. 3.857 .017 232.512 <.001Slope, ym .055 .009 6.299 <.001
Education LevelGrand mean. you 3.800 .027 141.085 <001Slope, ym .034 .008 4.286 <.001
Management Level Grand mean, yoo 3.827 .021 180.069 <001Slope, ym .013 .003 4.831 <.001
AgeGrand mean, yoo 3.880 .017 223.017 <001Slope, ym .004 .001 7.114 <.001
ReportsGrand mean, you 3.881 .018 219.567 <.001Slope, ym .000 000 1.103 .272
Distance LEGrand mean, you 3.884 .016 236.219 <.001Slope, ym .177 .007 23.932 <.001
As shown in Table 13, random effects provided evidence that organizations varied
in their mean when each ethnicity was considered. While there was no significant
covariance or slope terms to report, Diverse Individuals and Black showed notable model
improvement. Model fit for Diverse Individuals, White, Black, Hispanic/Latino, Asian,
and Other are as follows: %2(3)= 1,986.101-1,753.718= 232.383, p<.001; 1,986.101-

67
1,981.320= 4.781, p>.050; 1,986.101-1,975.860= 10.241, p<.050; 1,986.101-1,980.105=
5.996, p>.050; 1,986.101-1,986.002= .099, >.050; 1986.101-1,981.486= 4.615, p>.050.
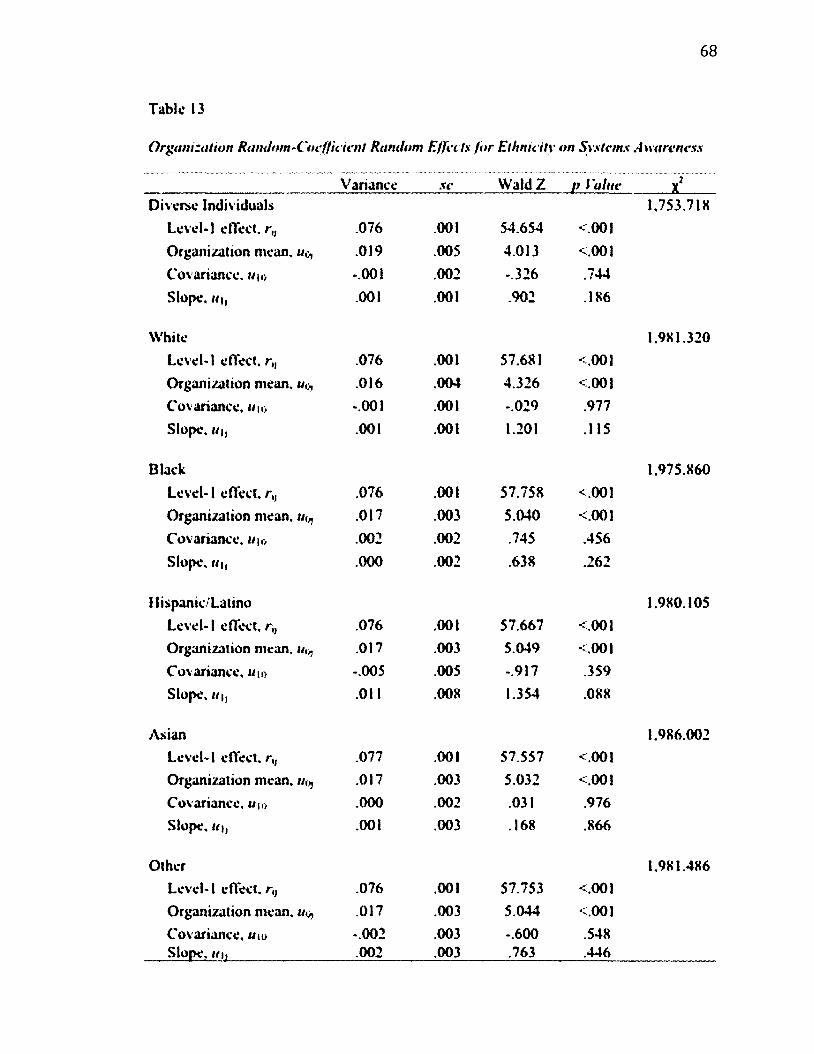
6 8
Tabic 13
Organization Random-Coefficient Random Effects for Ethnicity on Systems Awareness
Variance se WaldZ p Value______Diverse Individuals
Level-1 effect. r,, .076 .001 54.654 <.0011.753.718
Organization mean, m,:, .019 .005 4.013 <.001Covariance. «/;•> -.001 .002 -.326 .744Slope, mi, .001 .001 .902 .186
WhiteLevel-1 eftect. r„ .076 .001 57.681 <001
1.981.320
Organization mean. u,„ .016 .004 4.326 <.001Covariance. »n> -.001 .001 -.029 .977Slope. M|, .001 .001 1.201 .115
BlackLevel-1 effect, r,, .076 .001 57.758 <001
1.975.860
Organization mean. md, .017 .003 5.040 <.001Covariance, u i,> .002 .002 .745 .456Slope, mi, .000 .002 .638 .262
Hispanic/Latino Level-1 effect, r„ .076 .001 57.667 <.001
1.980.105
Organization mean. .017 .003 5.049 <.001Covariance, ui,> -.005 .005 -.917 .359Slope. M|, .011 .008 1.354 .088
AsianLevel-1 effect, r,, .077 .001 57.557 <.001
1.986.002
Organization mean. n,>, .017 .003 5.032 <.001Covariance. M|,> .000 .002 .031 .976Slope, M|, .001 .003 .168 .866
OtherLevel-1 effect, r,, .076 .001 57.753 <.001
1,981.486
Organization mean, uo, .017 .003 5.044 <001Covariance, uio -.002 .003 -.600 .548Slope, mi, .002 .003 .763 .446
69
As seen in Table 14, other variables o f gender, education level, management
level, age, number of reports and distance score o f leadership effectiveness model fit
included: %2(3)= 1,986.101 -1,917.161= 68.94, p<.001; 1,986.101 -1,737.378= 248.723,
pc.OOl; 1,986.101-1,946.016— 40.085, p<.001; 1,986.101-1,895.759= 90.342, p<.001;
1,986.101-1,983.676= 2.425, p>.050; 1,986.101-1,131.643= 854.458, p<.001. The
distance score of leadership effectiveness proved to be the strongest model, also
indicating variance among industry means (b = .014, p<.001) and slopes (b = .001, p =
.043). Education level provided the next strongest model and likewise, showed variance
among industry means (b = .025, p<.001) and slopes (b = .019, p=.014). The presence of
a significant random effects slope in distance score of leadership effectiveness and
education level suggested that estimates in fixed effects (Table 12) were not interpretable.
Interestingly, the number o f reports indicated significant covariance term (b = -.001,
p=.032). The negative skew to this term, explained that as systems awareness increased,
the relationship o f systems awareness and number o f reports decreased.
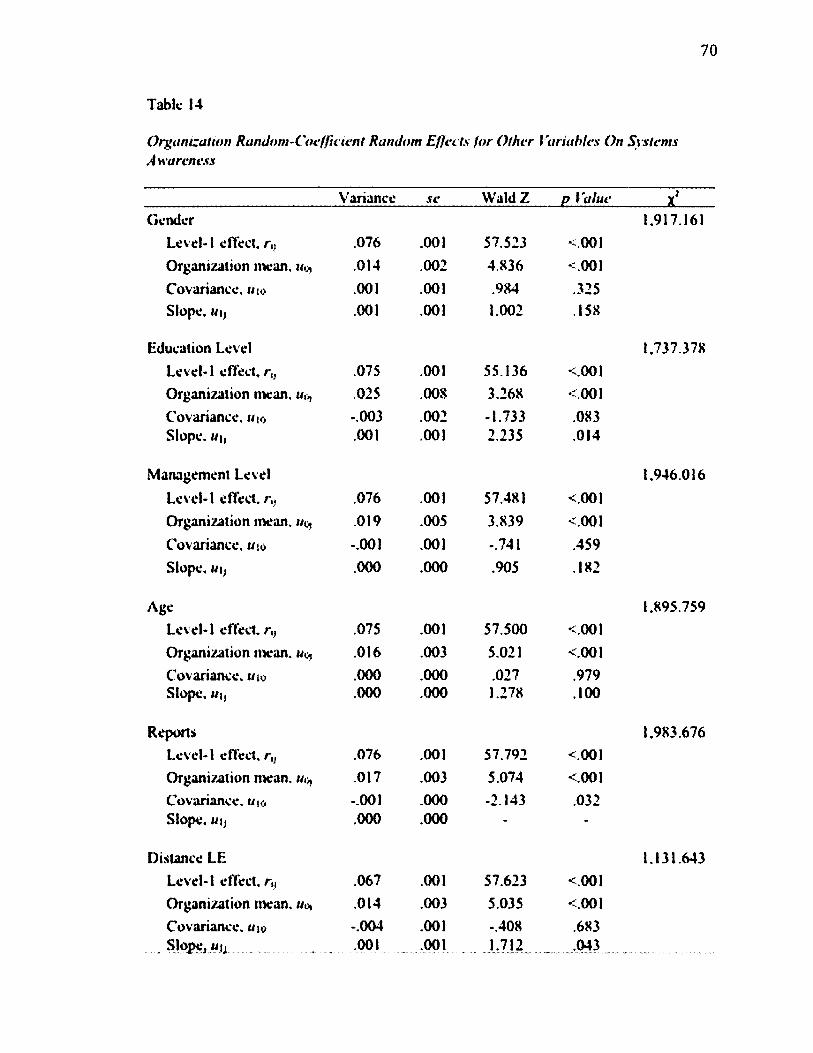
70
Tabic 14
Organization Random-Coefficient Random Effects for Other Variables On SystemsAwareness
VarianceGender
Level-1 effect, r,, .076Organization mean. u,A .014Covariance, m© .001Slope, m i , .001
Education LevelLevel-1 eftect. r„ .075Organization mean,m , , .025Covariance,««. *003Slope, mi, .001
Management LevelLevel-1 effect, r„ .076Organization mean, .019Covariance, mo -.001Slope, mi, .000
AgeLevel-1 effect, r,} .075Organization mean, m©, .016Covariance, ut© .000Slope, mi, .000
ReportsLevel-1 effect, r„ .076Organization mean, m ©, .017Covariance, ui© -.001Slope, m i , .000
Distance LELevel-1 effect, r,, .067Organization mean, mo, .014Covariance, in© -.004Slope, M|j . . . . . . 001
re Wald Z p Value t*1.917.161
.001 57.523 <001
.002 4.836 <001
.001 .984 .325
.001 1.002 .158
1.737.378.001 55.136 <.001.008 3.268 <001.002 -1.733 .083.001 2.235 .014
1.946.016.001 57.481 <.001.005 3.839 <.001.001 -.741 .459.000 .905 .182
1.895.759.001 57.500 <.001.003 5.021 <.001.000 .027 .979.000 1.278 .100
1.983.676.001 57.792 <.001.003 5.074 <.001.000 -2.143 .032.000 . •
1.131.643.001 57.623 <.001.003 5.035 <.001.001 -.408 .683.001 1.712 .043
71
Prior to building a complete multi-level model with individual predictors, the
variables o f education level and distance scores for leadership effectiveness displayed
slopes that varied across organizations. This suggested that these variables may be best
suited as a random instead o f fixed effect. Decisions surrounding fixed and random
effects “apply separately to each predictor in the model” and may take into account the
nature o f the variable as well as its behavior in random effects (Tabachnick & Fidell,
2007, p. 829). Thus, due to the categorical nature o f education level, it was determined to
be best accommodated by a fixed effect.
Ten other fixed variables were placed in the final first-level predictor model and
are depicted in Table 15. The only variable assessed independently but not included was
Diverse Individuals. While this variable showed significant model improvement as
compared to other ethnicity variables, when ethnicity variables were included together,
their strength o f model fit was better overall than Diverse Individuals. Although, each
individual variable was not statistically significant, exclusion o f ethnicity variables
decreased model fit.

72
Tabic 15
Best-Fit Sfode! o f Systems Awareness with 1st Level Predictors
Fixed Effects Coefficient se t Ratio p I "a Iue
Grand mean, you 3.775 .035 119.816 <.001White slope. y,<> -.040 .022 -1.778 .075Black slope, ym .034 .025 1.347 .178Hispanic Latino slope. y„> .012 .030 .421 .674Asian slope, ym -.018 .026 -.667 .505Other slope, yu, -.045 .028 -1.646 .100Gender slope. yi» .046 .007 6.238 <.001Education Level slope. y«i .031 .005 6.083 <.001Management Level slope, ym .012 .002 5.514 <.001Age slope. yM, .004 .000 9.801 <001Reports slope, y t)> .000 .000 1.638 .102Distance LE slope. Yio .180 .008 23.872 <.001
Random EtTccts Variance se Wald Z p Value
Distance LELevel-1 effect, r,, .065 .001 55.180 <.001Organization mean. </u, .012 .003 4.782 <.001Covariance. «tu -.001 .001 -.256 .798
..... Slope* ....... ......................... . .001 .001 1.550 .060
Overall model fit (Table 15) dramatically increased x2(13)= 1,986.101-780.663=
1,205.438, p<.001 and the grand mean of systems awareness changed from b = 3.881 in
the baseline model to b = 3.775, p<.001. Variance at the individual-level decreased from
.077 to .065 or 15.6% and variance at the organizational-level decreased from .017 to
.012 or 29.4%. There was a positive relationship between systems awareness and all
statistically significant variables. Specifically, there was a strong relationship between

73
females and systems awareness. Similarly, as education, management, age, and distance
scores for leadership effectiveness increased so did systems awareness.
Research Question 7: Second-Level Predictors for Systems Awareness
Means-As-Outcomes
Following the evaluation o f first-level predictors, a means-as-outcomes regression
was utilized to assess how industry-level variables could explain variance in systems
awareness. Eighteen second-level variables were examined. Three variables: diverse
organizations, female organizations, and higher education were calculated from first-level
variables (see Chapter 3) to indicate cultural differences in organizational makeup. The
other 15 variables represented specific sectors o f industry that the organizations belonged
to. Depicted, in Table 16, are only 17 of these variables, as the industry, Global
Leadership, failed to converge.
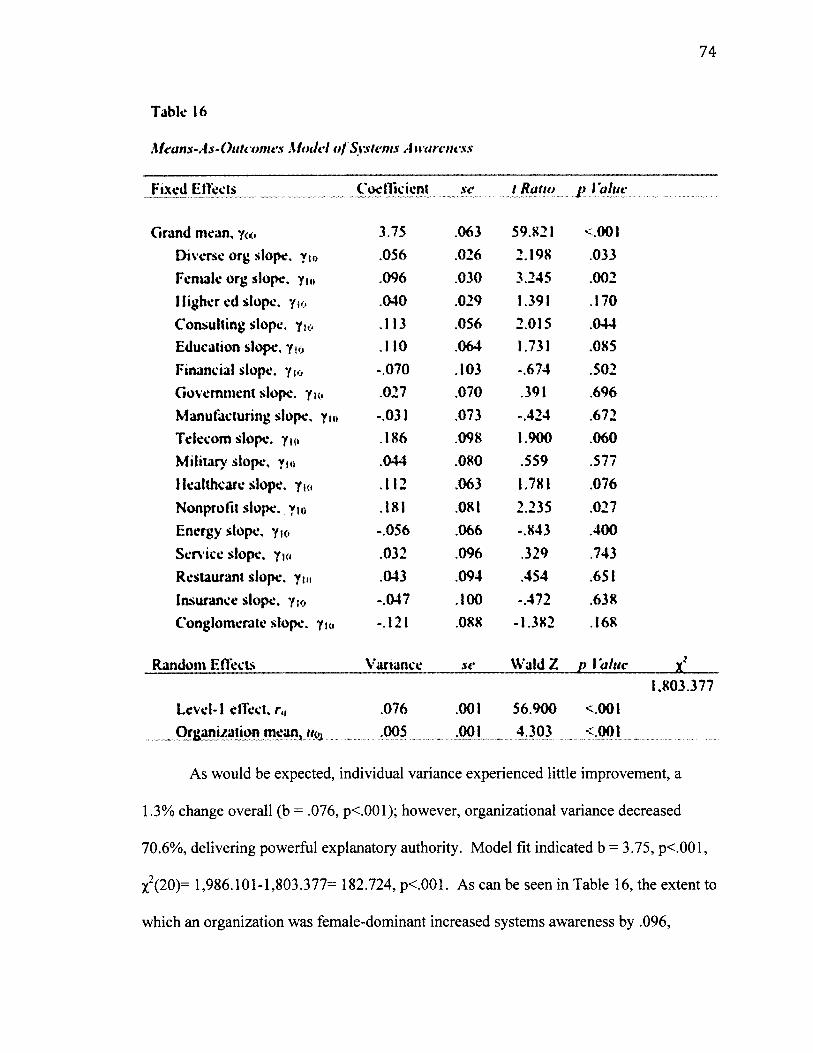
74
Tabic 16
Means-As-Outeomes Model of Systems Awareness
Fixed Effects
Grand mean, y«.Diverse org slope, ym Female org slope. ym Higher cd slope. yio Consulting slope, y t<> Education slope. yio Financial slope, yio Government slope, ym Manufacturing slope, ym Telecom slope. yi« Military slope, ym Healthcare slope, ym Nonprofit slope. ym Energy slope, yu.Sen ice slope, yio Restaurant slope, ym Insurance slope, yi<, Conglomerate slope, ym
Random Effects
Coefficient se l Ratio p 1 alue
3.75 .063 59.821 <.001.056 .026 2.198 .033.096 .030 3.245 .002.040 .029 1.391 .170.113 .056 2.015 .044.110 .064 1.731 .085-.070 .103 -.674 .502.027 .070 .391 .696-.031 .073 -.424 .672.186 .098 1.900 .060.044 .080 .559 .577.112 .063 1.781 .076.181 .081 2.235 .027-.056 .066 -.843 .400.032 .096 .329 .743.043 .094 .454 .651-.047 .100 -.472 .638-.121 .088 -1.382 .168
Variance se Wald Z p Value
.076 .001 56.900 <.001
.005 .001 4.303 <001Level-1 effect. r„ Organization mean, m<u
1.803.377
As would be expected, individual variance experienced little improvement, a
1.3% change overall (b = .076, p<.001); however, organizational variance decreased
70.6%, delivering powerful explanatory authority. Model fit indicated b = 3.75, p<.001,
X2(20)= 1,986.101-1,803.377= 182.724, p<.001. As can be seen in Table 16, the extent to
which an organization was female-dominant increased systems awareness by .096,
75
p=.002 and was the most powerful second-level predictor. Organizations that were more
diverse (b=.056, p=.033), or apart of the nonprofit (b=.l 81, p=.027) or consulting
(b=.l 13, p=.044) industries were also significantly more likely to have higher systems
awareness.
Intercepts and Slopes
In support o f this study’s final research question, a multi-level model including
first and second-level predictors was designed. The final intercepts and slopes model o f
MLM is summarized in Table 17 and shows the best fit with x2(29)= 1,986.101-727.936=
1,258.165, p<.001.
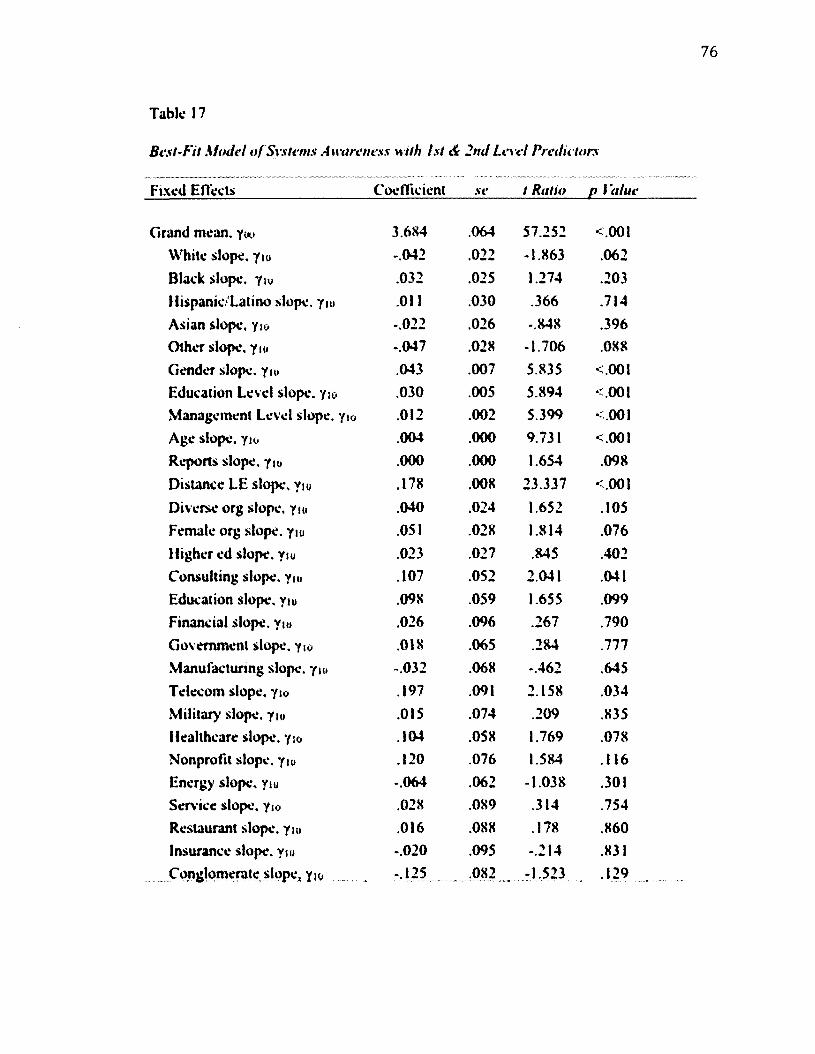
76
Table 17
Best-Fit M odel of Systems Awareness with 1st & 2nd Level Predictors
Fixed Effects Coefficient se t Ratio p 1 'aim
Grand mean, y«> 3.684 .064 57.252 <.001White slope, yio -.042 .022 -1.863 .062Black slope, yio .032 .025 1.274 .203Hispanic.'Latino slope, yio .011 .030 .366 .714Asian slope, yio -.022 .026 -.848 .396Other slope, yiu -.047 .028 -1.706 .088Gender slope, ym .043 .007 5.835 <001Education Level slope, ym .030 .005 5.894 <001Management Level slope, ym .012 .002 5.399 <.001Age slope, ym .004 .000 9.731 <.001Reports slope, ym .000 .000 1.654 .098Distance LE slope, ym .178 .008 23.337 <.001Diverse org slope, ym .040 .024 1.652 .105Female org slope, ym .051 .028 1.814 .076Higher ed slope, ym .023 .027 .845 .402Consulting slope, ym .107 .052 2.041 .041Education slope, ym .098 .059 1.655 .099Financial slope. ylu .026 .096 .267 .790Government slope, ym .018 .065 .284 .777Manufacturing slope, ym -.032 .068 -.462 .645Telecom slope, ym .197 .091 2.158 .034Military' slope, ym .015 .074 .209 .835Healthcare slope, ym .104 .058 1.769 .078Nonprofit slope, ym .120 .076 1.584 .116Energy slope, ym -.064 .062 -1.038 .301Service slope, ym .028 .089 .314 .754Restaurant slope, ym .016 .088 .178 .860Insurance slope, ym -.020 .095 -.214 .831Conglomerate slope, ym -.125 .082 -1.523 .129

77
Table 17 Continued
Best-Fit Mode! o f Systems Awareness with 1st dc 2nd Level Predictors
Random Effects Variance se Wald Z p Value X*
Level-1 effect. r„ .065 .001 55.147 <001727.936
Organization mean, t/o, .004 .001 4.010 <.001Organization mean
Distance LE. .001 .001 1.577 .057
All variables with the exception o f distance score for leadership effectiveness
were fixed. Allowing this distance score to generate random slopes across organizations
within the full model decreased the variance from .012 (Table 15) to .001, a reduction of
91.7%. Overall, individual variance was reduced by 15.6% (b = .065, p<.001), which
was an improvement from the baseline model but equivalent to the first-level predictor
model. Organizational variance was minimized by 76.5% as it departed from the
baseline o f b = .017, p<.001 to b = .004, p<.001. The grand mean of systems awareness
differed significantly in this final model (b = 3.684, p<.001) from the null (b = 3.881,
pc.001).
Although Ethnicity variables at the first-level remained statistically insignificant,
they nevertheless contributed to model fit. Similarly, organizations that expressed more
ethnic diversity were not significant despite, previously being significant in the Means-
As-Outcomes Model (Table 16). In fact, with the exception o f Consulting (b = .113,
p=.044) and Telecom (b = .186, p=.034), none o f the organizational predictors were
significant. Conversely, several individual predictors, gender b = .043, education level b
78
= .030, management level b = .012, age b = .004, and distance scores for leadership
effectiveness b = .178, showed a significant (p<.001) positive relationship with systems
awareness.
79
CHAPTER 6
DISCUSSION
The original focus o f this dissertation was to investigate the variance of leadership
effectiveness across industries using MLM in TLCP. Previous literature, which
investigated the level of analyses in leadership research, indicated that there remained a
dearth of MLM studies (less than 17%) and that the majority o f existing research
examined only the individual or leader (Dionne et al., 2014). This demonstrates the lack
o f alignment between theoretical and empirical work in leadership studies, as it is widely
acknowledged that context matters in terms o f human development (Bronfenbrenner,
2005; Cook-Greuter, 1999; Kegan, 1982; Torbert, 2004), relationships (Bass, 1998;
Bums, 1978; Dansereau, Graen, & Haga, 1975), organizational culture (Higgins, 2005;
Schein, 2004), and system processes (Argyris,1957; Laszlo, 1975; Scharmer, 2007;
Senge, 1990; Wheatley, 1999). Further, as many studies focus on leadership within a
particular sector or dichotomously coded as private versus public (Kroeck &
Sivasubramaniam, 1996) or utilize instruments that are informed by a single theory
(Yukl, 2012), this study selected an instrument, TLCP, which demonstrated breadth
across numerous sectors (39 industries), incorporated multiple leadership theories,
accounted for human development theory contributions, and was externally deemed valid
and reliable (IPRA, 2008).
A total o f 246,645 records were collected from TLCP. As TLCP is a 360-degree
instrument, this represented over 19,000 individuals and their respective raters.
However, since the predominant method o f analysis was MLM, considerations for
second-level analysis required a minimum of 15 categories with at least 50 first-level

80
measurements. In other words, it was specified that records for inclusion were industries
and organizations that contained at least 50 participants. Thus from the original sample,
6,743 individuals from 54 organizations and 15 industries were retained.
Initial analysis revealed that leadership effectiveness variance was limited at the
industry-level. Thus, a series o f exploratory analyses ensued. O f the eight summary
dimensions (leadership competencies) within TLCP, systems awareness was determined
to be o f particular relevance to this study’s aim as it encompasses how individuals
interpret feedback in terms o f behaviors, relationships, and processes. Systems
awareness acknowledges the importance o f context in leadership and, its principles have
been deemed paramount to leaders who want to enact change in a globally more
conscious future (Scharmer, 2007; Senge, 1990; Western, 2008). Thus, due to its
explanatory power (ICC>18%) and its theoretical alignment with this study’s purpose, it
was included in the analytical investigation.
This chapter summarizes the findings of this study, providing connection to the
literature, relevant future directions, and concludes with limitations and implications.
Symbolic o f the nested nature o f this study, findings will be discussed in accordance with
the literature.
Leadership Effectiveness Findings
Since TLCP is a 360-instrument, it was a particularly attractive vehicle for
analysis, providing both other and self-ratings. Typical of quantitative analyses involving
multiple scale scores, careful consideration was required on how to construct the
dependent variables. Interestingly, out o f the three possibilities, the mean aggregate of
others’ scores (ICC=9.6%) provided the most explanatory power o f differences across

81
industry. From an empirical point o f view, there was likely less bias in others’ scores,
while also providing richer variability. Yet from a practical standpoint, this may signal a
need for leaders to reevaluate self-importance and perspective. Examining these values
confirmed that self-reported scores were inflated - or at the very least echoes the
question: whose opinion matters?
As was anticipated, variability in predictor significance and impact was observed
as models increased in complexity. For example, in the leadership effectiveness models,
none of the demographic variables indicated a significant relationship with the grand
mean o f leadership effectiveness when individually assessed in fixed effects. However,
when variables were entered together in the full model, Black participants were positively
associated with leadership effectiveness, as were females and increasing levels of
management and education.
Positive associations of higher education and management levels with leadership
effectiveness were not surprising. It is likely that as participants progressed academically
and professionally, they gained relevant skills and knowledge for more effective
leadership. Possibilities, opportunities, and challenges may have more readily presented
themselves, providing further life experiences and practical knowledge. Additionally,
having already attained some advancement in stature, denoted by title and degree, such
individuals might be more predisposed to performance and achievement goals.
Consequentially, educational degrees and professional titles may inherently convey more
authority and power. Understandings o f group dynamics would offer that these messages
(consciously or subconsciously) of role and power likely influence raters’ perception of
participants (Green & Molenkamp, 2005).

82
Particular note must be attributed to the significance of Black participants’
relationship to leadership effectiveness. Prior literature gave no indication that Black
participants’ leadership effectiveness would be significantly different from all other
ethnicities. Perhaps the reason this particular ethnicity was distinctive is grounded in
social history. Given that this sample was highly westernized, persisting mental schemas
might exist around the nature o f being Black. Carrying forth themes from post-colonial
America, Black participants may more readily be perceived as persistent and strong.
Likewise, Black participants might hold their identity with more pride and fortitude, and
readily rise to the challenge o f leadership with confidence and capability. This could also
be a result o f “double consciousness”. Offered by W.E.B. Du Bois (1903) double
consciousness refers to the phenomenon in African American psychology whereby,
individuals are aware o f their self-identity while, at the same time, cognizant o f how they
are being perceived by others - being Black in a predominantly White world. In
addition, while never pleasant to consider, prevailing themes o f prejudice may inhibit
opportunities for Black individuals. Thus, when selected for positions o f leadership, it is
more likely such participants have pronounced leadership capacity, undeniably in
contrast to other candidates. Of course such proposals are highly speculative and would
require focused exploration and investigation in further studies.
Females displayed a strong relationship with leadership effectiveness across
industries. Their positive correlation with leadership effectiveness might have followed
similar trends as being Black. In that, as a historically oppressed minority, they may hold
leadership opportunities with more weight and likewise, may be required to notably
outperform other candidates in order to advance. Positions for women have not been as
83
prevalent (Eagly & Carli, 2007), and may have encouraged those that rise to the occasion
to be significant contributors. Less speculative, it is widely acknowledged that women
tend to have more participatory, creative and collaborative ways o f leading (Eagly &
Johnson, 1990; Batliwala, 2011). Women tend to focus on relationships more so than
tasks, as compared to men, and they use alternative methods to engage others (Eagly &
Johnson, 1990; Batliwala, 2011). Thus, it is highly likely that such stylistic differences in
leading may be more favorable in the eyes o f the rater and more aligned with what is
needed in today’s society. Moreover, the top-half o f the circle, Creative, is associated
with leadership effectiveness and is comprised o f competencies that by nature lend
themselves to more feminine ways o f leading. This is not to say that males cannot
equally employ feminine leadership style, quite the contrary. In essence, males tendency
to use feminine forms of leadership likely heighten their perceived leadership
effectiveness. Doing so, might explain the finding that women’s relationship to
leadership effectiveness demonstrated a positive relationship with the overall leadership
effectiveness score in the industry o f their membership. Specifically, as an industry’s
leadership effectiveness score increased, so did females’ relationship to leadership
effectiveness. The cultural implications suggest that feminine forms o f leading may be
more well-received and more favorable in industries where competencies associated with
leadership effectiveness are more widely practiced.
Systems Awareness Findings
When leadership effectiveness did not indicate that variability across industries
was o f practical note, exploratory MLM regressions were conducted and found that at the
organization-level, relating and systems awareness explained significant variance. In
84
terms of alignment, systems awareness was pursued as it offered insight into
understanding complex systems, a major focus o f this study, and showed a wider breadth
of scope, as relating was more highly associated with leadership effectiveness and
suggested some concerns with multicollinearity. Unlike leadership effectiveness,
systems awareness was considered a summary dimension and was comprised o f three
distinct factors: community concern, productive stability, and systems thinker.
Whereas, models of leadership effectiveness held less explanatory power at the
industry-level, the final intercepts and slopes model o f systems awareness reduced
organizational variance by 76.5%. Findings reported that gender, education level,
management level, age, and most significantly - distance scores were important
participant predictors. Organization predictors, while important in explanatory power for
the model, were less substantial in the presence o f participant predictors. This
information was consistent with baseline models, indicating that much of the variance
(81.9%) resided at the participant-level. Regardless, consulting and telecommunications
industries showed a positive relationship with systems awareness.
Again, education and management level arose as significant participant
predictors. As previously mentioned in the leadership effectiveness findings, progression
in academic and professional life displayed signs of achievement, desire for
improvement, advancement, and demonstrated fortitude in work ethic. These themes
likely gave participants an advantage or in the very least, demonstrated experience in
navigating complex situations and developing solutions. Consistent with human
development, high achievement may signal complex associations with generative nature
(Erikson, 1959). In essence those that have reached personal success, may derive further
85
meaning from giving back and contributing to the greater good. Further, the ability to
navigate systems skillfully is also associated with higher levels o f development (Cook-
Greuter, 1999; Kegan, 1982; Torbert, 2004) and may locate participants with higher
systems awareness to higher roles. While higher levels o f human development are
associated with more advanced skills in leadership (Brown, 2012; Torbert, 2004) testing
causality was not possible in this study, and therefore it cannot be determined if higher-
level leaders gain more systems awareness or if systems awareness positions individuals
to higher levels o f leadership.
Unsurprisingly, age was associated with higher systems awareness scores.
Cognitive science is well informed, in that as humans grow and develop they demonstrate
increasing capacities for complex thought and construction. Piaget’s (1948) work
supports this notion, demonstrating in clinical trials that development in complex
associations can demonstrate a general linear trajectory with age. Indeed, many
developmental theorists provide age parameters around their developmental stages and
conceptualizations (Piaget, 1948; Erikson, 1959). Thus, age is also representative of
lived experience and displayed similar patterns to those of education and management
level.
As was the case in leadership effectiveness, females indicated a positive
relationship with systems awareness. Due to their emphasis on relationships and
processes, literature (Eagly & Johnson, 1990; Batliwala, 2011) would support a
foreseeable connection among all subscales: community concern, productivity stability,
and systems thinker. Namely that females typically have strong ties to relationships,
8 6
demonstrate more reflectivity, and tend to be more process-focused and thus may be
more predisposed to foundational concepts o f systems awareness.
The distance score for leadership effectiveness was the largest predictor. As a
mean-centered variable, it represented how close a participant’s score was to the mean of
others’ scores whether or not that value was over or underestimated (positive or
negative). It is important to note that distance was the only variable permitted to
randomly vary across slopes. If in fact, distance had indicated a significant effect (and it
did), it would have been expected that as systems awareness increased, distance
decreased. This was not the case. As systems awareness increased, so did distance.
Initially, this finding was puzzlingly. It would seem that the ability to understand how
parts work in relationship to the whole might also denote an association with increased
perception and awareness o f self in relation to others (Senge, 1990; Scharmer, 2007).
Given that distance had a positive relationship with systems awareness, this finding,
perhaps, signals a distinction between systems thinking and self-awareness. It may also
indicate a departure from holding the value o f oneself in the light o f others. Simply
stated, without further research, it is difficult to assess if the discrepancy in distance
scores (as compared to systems awareness) is due to a lack o f perception, increase in self
authorship or a more advanced form o f consciousness, or simply a Type I error where the
null hypothesis o f no effect has been mistakenly rejected. Since high scores in systems
awareness mark more advanced forms of consciousness (Anderson, 2006), it may be
possible that individuals who demonstrate increasingly complex levels of development
also are aware o f other perceptions yet maintain confidence in the value they placed upon
their leadership (above or below the mark of others). The ability to utilize systems
87
awareness would lend itself to higher levels o f consciousness, and as o f yet, it is unclear
if such forms of making-meaning are a separate skill set or if such ways of making-
meaning are elevated from others’ more predominant world-view.
Also significant in the final model were consulting and telecommunications.
These predictors represented the only second-level variables to demonstrate significant
relationships with systems awareness and further, were the only two o f 15 industries to
do so. While the nonprofit industry did show a positive correlation with systems
awareness in the means-as-outcomes (second-level predictors only) model, its positive
relationship with systems awareness was not deemed significant in the final model.
Despite this, positive associations for consulting and telecommunications were
promising. For consulting, it would be expected that in order to advise systems, strategy,
and support processes of growth or transformation, one would need a high degree of
systems awareness. Likewise, as a provider, sustainer, and developer of worldwide
communication and information, connecting disparate regions together, it was also not
surprising to find telecommunications was a significant industry.
Implications
The results of this study may provide several layers o f implications for practical
use. First, a general overview o f layers o f analysis and why that matters is described.
Then themes found at the participant level are discussed as they contributed to both
leadership and systems awareness. Following, are other predictors and their implications
as they relate to leadership effectiveness or systems awareness. Concluding this section
is an overview of larger implications for this work in practice and scholarship.

8 8
This research found that leadership effectiveness was particularly interesting
when studied through the perception of others and that, despite variation in competency
scores across industries, leadership effectiveness demonstrated little variability. This
suggests that leadership effectiveness may not be the best indicator o f whether or not an
individual will be successful across industries and may support existing literature that
acknowledges the value in different ways o f leading (Alevesson, 1996). Instead,
observing competencies proved to be more illuminating. However, it was also found that
organizations provided slightly more variability when investigating leadership
competencies. Consistent with the literature, organizations may have stronger cultural
lines than industries (Higgins, 2005; Schein, 2004). While industries should also be
considered, as there is some variability, it may be more likely that transferability in
leadership is contained more at the organizational level than industry level.
With regard to leaders’ capacities, education needs to be at the foreground.
Advancement in education had a highly significant relationship with leadership
effectiveness and systems awareness. In order to more fully develop leadership and big
picture thinkers with a global conscience, organizations and industries should look
towards continued development and furthering education and individuals should take
steps to invest in their education accordingly. Additionally, due to the relationship of
systems awareness and leadership effectiveness with increasingly more advanced
positions o f management, leaders should seek opportunities for advancement and
organizations and industries would be best served by supplying such possibilities to
further develop their leaders.

89
One o f the most resounding themes o f this study was found in investigating
females’ relationship to leadership effectiveness and systems awareness. Females
demonstrated a positive relationship with both leadership effectiveness and systems
awareness. However, females’ relationship to leadership effectiveness was also
connected to the industry average for leadership effectiveness. As leadership
effectiveness is highly associated with the creative dimension of TLCP, and such
capacities resemble more feminine ways o f leading, industries and organizations may
look to increase support o f feminine ways o f leading. This may look like relationship
building events, incentives for creative applications, and the support o f open dialogue in
professional settings.
The fact that this study found Black individuals had a significant relationship
with leadership effectiveness is important for at least two reasons. First, from an
academic standpoint, this finding highlights the importance o f distinguishing, as much as
possible, across descriptive variables. While it may be more desirable to have significant
power behind criterion, critical distinctions can also be lost. Second, this finding does
suggest such a distinction is significant and should be further examined. While it was not
in the breadth of scope o f this study to analyze the “why” or “how” o f Black leadership,
these are important questions, and will be further delineated in the next section.
Finally, while leadership effectiveness and systems awareness shared some
common themes, the implications of systems awareness findings were also distinct in
several ways. First, systems awareness was examined because it showed significant
variability across industries, more so than most other competencies. As emergent and
new leadership theories cite a need for more systems awareness or thinking, developing
90
this competency more widely across organizations will be critical. The call for leaders
who can work with change, complexity, and ambiguity for the common good is
increasingly present (Grace, 2011; Scharmer, 2004; Western, 2008) and exceeds what has
been traditionally framed as cultural competency or global leadership and moves beyond
people and processes to understanding how such elements simultaneously inform each
other and the larger system. However, supporting the nature o f this distinctive construct,
awareness of how systems work and contributing to that efficiency in meaningful ways
does not inherently lend itself to understanding self -perception as presented by simply
quantitative comparison. Further research is needed to investigate the capacity o f leaders
who demonstrate high degrees of systems awareness and whether or not this way of
thinking signals a different skill set from self-awareness or if, developmental, post-
conventional leaders are by nature deviate from the perception of others.
Further, as there is growth in life experience and age, systems awareness
increases. Thus leaders seeking to develop this capacity may expose themselves to more
opportunities for practice. As there remain very few industries and organizations today
that operate in isolation, many would benefit from enhanced systems awareness. Such
leaders should look into developing some o f the criterion provided within this
implications section.
Ultimately, the individual level predictors explained the most variance; however,
investigating individual predictors was important to do in context with their organization.
Said differently, nested models matter. Individual criterion changed as industry and
organization were considered and they changed in contrast to other criterion variables.
Leaving variables out, despite their significance levels, drastically changes parameter

91
estimates and provides a false perception of how much something truly makes a
difference. Thus, moving forward, leadership studies needs to consider analytical
techniques that account for multiple layers of meaning to give more breadth to scholarly
work.
Future Research
There are a number of avenues for future research as a result o f this study.
Several of the most pressing themes are discussed below.
First, this study was limited by its archival nature. It would be o f use to execute a
similar study with more recent data records. And, may be o f even more interest to draw
comparisons across samples.
Second, gender differences played a large role in both leadership effectiveness
and systems awareness. While it was speculated that these differences may be closely
associated with feminine ways of leading, as supported by the literature, it would be
beneficial to closely examine how females differ across industries and organizations.
Particular emphasis should be placed on investigating why organizations with higher
leadership effectiveness scores also have significantly higher levels o f women with high
leadership effectiveness. While at first glance, this may seem in part due to the
composition o f the organization (more females equates to higher leadership effectiveness
or systems awareness), the three highest female-dominated industries (service, nonprofit,
and healthcare) did not indicate significant levels o f systems awareness in the final
model.
A third area of research might include ethnic studies across industries and
organizations with regard to leadership effectiveness. This study showed that Black

92
participants, indeed, had a higher leadership effectiveness score than other ethnicities.
Research investigating this connection would be particularly interesting. Perhaps, such
work would draw implications across culture, context, and perception.
Fourth, further work is needed with regard to the leadership competencies
exemplified by post-conventional leaders. Systems awareness would suggest a higher-
level of consciousness and increasingly complex thought process; yet, its inverse
relationship to the perception o f others leaves many unanswered questions. Further
research is needed to illuminate the movement in development towards systems
awareness capacities.
Finally, one of the major themes o f this work was that while leadership
effectiveness did not differ greatly across industry, variability showed more promise
when competencies were individually assessed. Although it was not in the scope of this
study to investigate all eight summary dimensions of TLCP at a deep level, it would be of
critical value to see the range of differences and similarities. Along the same lines,
noting how others’ perceptions differ from self-perceptions would also make an
interesting cross-case analysis and may be potentially worthwhile to explore at the
relationship level.
Limitations
Due to the nature o f archival data and inherent limitations o f any methodology
this study was bounded in several ways. As an archival data set, the TLCP, its design, and
applicable variables were preset. Although there were gains in having an established
instrument with a large sample, the ability to manipulate variables was restricted to
information that had already been collected. Information as to why TLCP was preferred
93
or utilized over other existing instruments and avenues was not known and thus, a self
selection bias is likely at play. Additionally, while this is a reputable instrument and
while data cleaning did occur, the possibility of some record or reporting errors could
have gone undetected.
Recent years o f TLCP data were not included in this study and thus findings could
be dated and not representative o f the current situation particularly in industry sectors.
And despite its international scope, TLCP remains a predominantly Western, Caucasian-
dominant sample. Therefore, the study’s findings are not generalizable across all people
and cultures.
Lastly, as a quantitative study, the ability to capture social phenomena was
constrained by method and philosophy. The richness to which variables in this study
could be observed, experienced or conveyed could not be fully expressed. While this
study attempted to account for context and interactive components, undoubtedly some
depth was lost for breadth.
Conclusion
During the past decade, there have been substantial contributions to the field of
leadership studies, expressing the complexities o f context, eliciting more expansive
consciousness, and citing the need for transformative co-creation. Similarly,
advancements in empirical and heuristic methods, while still limiting, have offered new
ways to conceptualize phenomena. Yet, despite this, engagement o f this knowledge
remains repressed while normative models persist. This study extends leadership
literature by examining on a large scale how leadership effectiveness varied across
industries. Consequentially, one of the most significant findings was that there was little
94
variability across industries with regard to leadership effectiveness. Though individuals
who had achieved higher levels of education, higher levels o f management, who were
female, and who were Black displayed significantly higher leadership effectiveness than
others, variability situated at the industry-level was not large enough to warrant further
analysis. However, when TLCP competencies were examined, systems awareness
showed a heightened level o f variability across organizations. This was concerning, as
progressively, leadership theory has called for systems awareness as a pivotal quality for
the advancement o f society. Again, there were marked differences positively associated
with individuals who were female, had higher levels of education and management but
when systems awareness was concerned, age, distance scores, and type o f industry also
mattered.
As was demonstrated in this dissertation, leadership is a multi-faceted
phenomenon. Like many areas o f social science, attempts to capture the characteristics,
processes, and components o f leadership may appear paradoxical and in fact, they are. In
the pursuit of knowledge, any construction must set parameters and such boundaries
inherently exclude as much if, not more o f what is included. In the case o f this study,
individual characteristics were highly significant; denoting that who we are and what
labels define us as leaders, matter. However, context was also significant and provided
evidence that while the call for a more conscious leadership that can contribute to the
common good is abounding, many organizations are not ready to respond.
The hope o f this study is that calling attention to systems awareness will heighten
the attention we place on such measures and consequentially inspire the necessary work
o f more effective leadership.
95
References
3D Group (2013). Current practices in 360 degree feed-back: A benchmark study o f North American companies. Emeryville, CA: 3D Group.
Alvesson, M. (1996). Leadership studies: From procedure and abstraction to reflexivity and situation. Leadership Quarterly, 7, 455-485.
Anderson, R. J. (2006). The leadership circle profile: Breakthrough leadership assessment technology. Industrial and Commercial Training, 55(4), 175-184. doi: 10.1108/00197850610671946.
Antonakis, J., Cianciolo, A. T., & Sternberg, R. J. (2004). Leadership: Past, present, future. In J. Antonakis, A. T. Cianciolo, R. J. Sternberg (Eds.), The nature of leadership (pp. 3-15). Thousand Oaks, CA: Sage Publications Inc.
Argyris, C. (1957). Personality and organization. New York, NY: Harper & Row.
Attwater, L. E., & Yammarino, F. J. (1993). Personal attributes as predictors o f superiors’ and subordinates’ perceptions o f military academy leadership. Human Relations, 46, 645-668.
Avolio, B. J., & Bass, B. M. (2004). Multifactor leadership questionnaire: Third edition manual and sampler set. Redwood City, CA: Mind Garden.
Ayman, R. (2004). Situational and contingency approaches to leadership. In J. Antonakis, A. T. Cianciolo, R. J. Sternberg (Eds.), The nature o f leadership (pp. 148-170). Thousand Oaks, CA: Sage Publications Inc.
Bass, B. M. (1990). Bass and Stogdill’s handbook o f leadership: Theory, research, and managerial applications (3rd ed.). New York, NY: Free Press.
Bass, B. M. (1995). Concepts o f leadership: The beginnings. In J. T. Wren (Ed.), The Leader’s Companion (pp. 49-52). New York, NY: The Free Press.
Bass, B. M. (1998). Transformational leadership: Industrial, military, and educational impact. Mahwah, NJ: Erlbaum.
Bass, B. M., & Avolio, B. J. (1989). Potential biases in leadership measures: Howprototypes, leniency, and general satisfaction relate to ratings and rankings of transformational and transactional leadership constructs. Educational and Psychological Measurement, 49, 509-527.
Bass, B. M., & Avolio, B. J. (1999). Manual fo r the multifactor leadership questionnaire fo rm 5X). Redwood City, CA: Mind Garden.
96
Bass, B. M., & Yammarino, F. J. (1991). Congruence o f self and others' leadershipratings o f naval officers for understanding successful performance. Applied I: An International Review, 40(4), 437-454.
Batliwala, S. (2011). Feminist leadership fo r social transformation: Clearing the conceptual cloud. New York, NY: CREA.
von Bertalanffy, L. (1968). General system theory: Essays on its foundation and development (ed.). New York, NY: George Braziller.
Blake, R. R., & Mouton, J. S. (1964). The managerial grid. Houston, TX: Gulf Publishing.
Blanchard, P.N., & Thacker, J.W. (2007). Effective training, systems, strategies, and practices. Englewood Cliffs, NJ: Pearson, Prentice Hall.
Booz Allen. (2012). CEO succession report: 12th annual global CEO succession study. New York, NY: Booz & Company.
Bracken, D. W., & Church, A. H. (2013). The “new” performance managementparadigm: Capitalizing on the unrealized potential o f 360 feedback. People & Strategy, 32 (6), 34-40.
Brett, J. F., & Atwater, L. E. (2001). 360-Degree feedback: Accuracy, reactions and perceptions o f usefulness. Journal o f Applied Psychology, (86)5, 930-942.
Bretz, R.D. Jr., Milkovich, G.T., & Read, W. (1992). The current state o f performanceappraisal research and practice: Concerns, directions, and implications. Journal o f Management, 18, 321-352.
Bronfenbrenner, U. (2005). Making human beings human: Bioecologicalperspectives on human development. Thousand Oaks, CA: Sage Publications Ltd.
Brown, B. C. (2012). Leading complex change with post-conventional consciousness. Journal o f Organizational Change Management, 25(4), 560-577. Doi: 10.1108/09534811211239227.
Bryman, A. (1992). Charisma and leadership in organizations. London: Sage.
Burke, W. W., & Jackson, P. (1991). Making the Smith-Kline Beechman merger work. Human Resource Management, 30, 69-87.
Bums, J. M. (1978). Leadership. New York, NY: Harper & Row.

97
Church, A. H., & Bracken, D. W (1997). Advancing the state o f the art o f 360-degree feedback: Guest editors' comments on the research and practice o f multirater assessment methods. Group & Organization Management, 22(2), 149-161.
Cook-Greuter, S. R. (1999). Postautonomous ego development: A study o f its nature and measurement. (Doctoral dissertation), Harvard University.
Dansereau, F., Alutto, J. A., & Yammarino, F. J. (1984). Theory testing in organizational behavior: The varient approach. Englewood Cliffs, NJ: Prentice Hall.
Dansereau, F., Graen, G. B., & Haga, W. J. (1975). A vertical dyad linkage approach to leadership within formal organizations: A longitudinal investigation of the role making process. Organizational Behavior and Human Decision Processes, 13, 46-78.
Dionne, S. D., Gupta, A., Sotak, K. L, Shirreffs, K. A., Servan, A., Hao, C., Kim, D. H., & Yammarino, F. J. (2014). A 25-year perspective on levels o f analysis in leadership research: The Leadership Quarterly, 25, 6-25.
Du Bois, W. E. B. (1903). The souls o f Black folk. Chicago: A. C. McClurg and Co.
Eagly, A. H., & Carli, L. L. (2007). Through the labyrinth: The truth about how women become leaders. Boston, MA: Harvard Business School Press.
Eagly, A. H., & Johnson, B. T. (1990). Gender and leadership style: A meta-analysis. Psychological Bulletin, 108(2), 233-256.
Edwards, M. R., & Ewen. A. J. (1996). 360-Degree Feed- back. The Powerful New Model for Employee Assessment and Performance Improvement. New York: AMACOM.
Erikson, E. H. (1959). Psychological issues: Identity and the life cycle. New York, NY: International University Press.
Fielder, F. E. (1971). Leadership. Morristown, NJ: General Learning Press.
Fielder, F. E. (1978). The contingency model and dynamics o f the leadership process. In L. Berkowitz (Ed.). Advances in experimental social psychology (Vol. 11, pp. 59- 112). New York, NY: Academic Press.
Fielder, F. E., & Garcia, J. E. (1987). New approaches to effective leadership: Cognitive resources and organizational performance. New York, NY: John Wiley.
Fleishman, E. A. (1953). The description o f supervisory behavior. Personnel Psychology, 37, 1-6.
98
Follett, M. P. (1926). The giving o f orders. In H. C. Metcalf (Ed.), Scientific foundations o f business administration. Baltimore, MD: The Williams & Wilkins Co.
Friedman, T. (2005). The world is flat: A brief history o f the twenty-first century. New York, NY: Farrar, Straus and Giroux.
George, J. M. (1990). Personality, affect, and behavior in groups. Journal o f Applied Psychology, 75, 107-116.
Getz, C. (2009). Teaching leadership as exploring sacred space. [3/30/09]. Educational Action Research, 77(3), 447-461. doi: 10.1080/09650790903093318
Gibb, C. A. (1954). Leadership. In G. Lindzey (Ed.), Handbook o f social psychology. Cambridge, MA: Addison-Wesley.
Goethals, G. R., & Sorenson, G. L. J. (2007). The quest for a general theory of leadership. Northampton, MA: Edward Elgar Publishing, Inc.
Grace, B. (2011). Sharing the rock: Shaping our future through leadership fo r the common good. Bellevue, WA: Common Good Works.
Graen, G. B., & Uhl-Bien, M. (1995). Relationship-based approach to leadership:Development o f leader-member exchange (LMX) theory o f leadership over 25 years: Applying a multi-level multi-domain perspective. Leadership Quarterly, 6, 219-247.
Green, Z. G., & Molenkamp, R. J. (2005). The BART system o f group and organizational analysis: Boundary, authority, role, and task. Retrieved from: http://www.it.uu.se/edu/course/homepage/projektDV/ht09/BART_Green_Molenk amp.pdf.
Greenleaf, R. K. (1977). Servant leadership. Mahwah, NJ: Paulist Press.
Hagberg, R. (1996). Identify and help executives in trouble, HR Magazine, 47(8), 88-92.
Hankin, H. (2005/ The new workforce: Five sweeping trends that will shape your company's future. New York, NY: AMACOM.
Heck, R. H., Scott, T. L., & Tabata, L. N. (2010). Multilevel and longitudinal modeling with IBM SPSS. New York, NY: Routledge.
Heifetz, R. A. (1994). Leadership without easy answers. Cambridge, MA: Harvard University Press.
Hensel, R., Meijers, F., van der Leeden, R., & Kessels, J. (2010). 360 degree feedback: How many raters are needed for reliable ratings on the capacity to develop
99
competences, with personal qualities as developmental goals? The International Journal o f Human Resource Management, 21 (15), 2813-2830.
Hersey, P., & Blanchard, K. H. (1969). Life cycle theory o f leadership. Training and Development Journal, 23, 26-34.
Higgins, M. C. (2005). Career imprints: Creating leaders across an industry. San Francisco, CA: Jossey-Bass.
House, R. J. (1971). A path-goal theory o f leader effectiveness. Administrative Science Quarterly, 16, 321-338.
House, R. J., Spangler, W. D. & Woycke, J. (1991). Personality and charisma in the U.S. presidency: A psychological theory of effectiveness. Administrative Science Quarterly, 36, 334-396.
House, R. J., Hanges, P. J., Javidan, M., Dorfman, P. W., Gupta, V. (2004). Culture,leadership, and organizations: The GLOBE study o f 62 societies. Thousand Oaks, CA: Sage.
Hox, J. J. (2002). Multilevel Analysis. Mahwah, NJ: Lawrence Erlbaum Associates.
Institute for Psychological Research and Application (IPRA). (2008). Psychometricproperties and validation o f the leadership circle profile. Technical report from Department of Psychology, Bowling Green State University.
James, L. R., Demaree, R. G., & Wolf, G. (1993). rwg: An assessment o f within-group and interrater agreement. Journal o f Applied Psychology, 78(2), 306-309
Judge, T. A., Bono, J. E., Ilies, R., & Gerhardt, M. W. (2002). Personality and leadership: A qualitative and quantitative review. Journal o f Applied Psychology, 87, 765- 780.
Judge, W., & Cowell, J. (1997). The brave new world of executive coaching, Business Horizons, 40(4), 71.
Kahn, R. L, & Katz, D. (1953). Leadership practices in relation to productivity and morale. In D. Cartwright & A. Zander (Eds.), Group dynamics. New York:Harper & Row.
Kaiser, R. B., McGinnis, J., & Overfield, D. V. (2012). The how and the what ofleadership. Consulting Psychology Journal: Practice and Research, 64(2), 119- 135.
Kegan, R. (1982). The evolving self: Problem and process in human development. Cambridge, MA: Harvard University Press.

100
Kegan, R. (1994). In over our heads: The mental demands o f modern life. Cambridge, MA: Harvard University Press.
Kenny, D. A., & Zaccaro, S. J. (1983). An estimate of variance due to traits in leadership. Journal o f applied Psychology, 68, 678-685.
Kirpatrick, S. A. & Locke, E. A. (1991). Leadership: Do traits matter? Academy o f Management Executive, 5, 48-60.
Komives, S. R. (1991). The relationship of same-and cross-gender work pairs to staffperformance and supervisor leadership in residence hall units. Sex Roles, 24, 355- 363.
Kroeck, K. G., Lowe, K. B., & Brown, K. W. (2004). The assessment o f leadership. In J. Antonakis, A. T. Cianciolo, R. J. Sternberg (Eds.), The nature o f leadership (pp. 71-98). Thousand Oaks, CA: Sage Publications Inc.
Langfred, C. W. (2000). Work-group design and autonomy: A field study o f interaction between task and interdependence and group autonomy. Small Group Research, 31, 54-70.
Laszlo, E. (1975). The meaning and significance o f general system theory. Behavioral Science, 20(1), 9-24.
Levine, J. (1983). Materialism and qualia: The explanatory gap. Pacific Philosophical Quaarterly, 64, 354-361.
Lewin, K. (1947). Frontiers o f group dynamics: Concept, method and reality in social science, social equilibria and social change. Human Relations, I, 5-41.
Lewin, K., & Lippitt, R. (1938). An experimental approach to the study o autocracy and democracy: A preliminary note. Sociometry, 1, 292-300.
Lewin, K., Lippitt, R., & White, R. K. (1939). Patterns of aggressive behavior inexperimentally created social climates. Journal o f Social Psychology, 10, 271- 299.
Loevinger, J. (1976). Ego development: Conceptions and theories. San Francisco, CA: Jossey-Bass.
Lowe, K. B., Kroeck, K. G., & Sivasubramaniam, N. (1996). Effectiveness correlates of transformational and transaction leadership: A meta-analytic review o f the MLQ literature. Leadership Quarterly, 7, 385-425.
101
McKenna, M., Shetlon, C., & Darling, J. (2002). The impact o f behavioral styleassessment on organizational effectiveness: A call for action. Leadership & Organization Development Journal, 23, 314-322.
Meister, J. C., & Willyerd, K. (2010). The 2020 work-place: How innovative companies attract, develop, and keep tomorrow's employees today. New York, NY: HarperCollins.
Miltenberger, R.G., (2004). Behavior modification principles and procedures (3rd ed). Belmont, CA: Wadsworth/Thomson Learning.
Munsterberg, H. (1913). Psychology and industrial efficiency. New York, NY: Houghton Mifflin.
Murphy, K. R., & Davidshofer, C. O. Psychological testing: Principles and applications. Englewood Cliffs, NJ: Prentice Hall.
Nunnally, J. C., & Bernstein, I. H. (1994/ Psychometric theory (3rd Ed.). New York, NY: McGraw-Hill.
Piaget, J. (1948). The moral judgment o f the child. Glencoe: Free Press.
Posner, B. Z., & Kouzes, J. M. (1988). Development and validation of the Leadership Practices Inventory. Educational and Psychological Measurement, 48(2), 483- 496.
Posner, B. Z., & Kouzes, J. M. (1993). Psychometric properties o f the Leadership Practices Inventory, updated. Educational and Psychological Measurement,53(1), 191-199.
Raudenbush, S. W., & Bryk, A. S. (2002). Hierarchical linear models: Applications and data analysis methods (2nd ed.). Thousand Oaks, CA: Sage Publications, Inc.
Rooke, D., & Torbert, W. R. (1998). Organizational transformation as a function of CEO's developmental stage. [Empirical Study]. Organization Development Journal, 16(1), 11-28.
Rooke, D., & Torbert, W. R. (2005). Seven transformations o f leadership. Harvard Business Review, 83(4), 67-75.
Rost, J. (1991). Leadership fo r the twenty-first century. New York, NY: Praeger.
Rosti, R. T. Jr., & Shipper, F. (1998). A study o f the impact o f training in a management development program based on 360 feedback, Journal o f Managerial Psychology, 12, 77- 89.

102
Rubin, D. (1987). Multiple imputation fo r nonresponse in surveys. New York, NY:Wiley.
Scharmer, C. O. (2007). Theory U: Leading from the future as it emerges. San Francisco, CA: Berrett-Koehler Publishers Inc.
Schein, E. H. (2004). Organizational culture and leadership (3rd ed.). San Francisco, CA: Jossey-Bass.
Senge, P. M. (1990). The fifth discipline: The art and practice o f the learning organization. New York, NY: Currency and Doubleday.
Shafritz, J. M., Ott, J. S., & Jang, Y. S. (2005). Classics o f organization theory (6th ed.). Belmont, CA: Thomson Wadsworth.
Shipper, F. & Dillard, J. E. Jr. (2000). A study o f impending derailment and recovery of middle managers across career stages. Human Resource Management, 39(4), 331- 45.
Smith, A. (1776). O f the division o f labour. In E. Cannan (ed.), An inquiry into thenature and causes o f the wealth o f nations. Strand, London: Methuen & Co., Ltd.
Sorenson, G. (2005). An intellectual history o f leadership studies: The role of James MacGregor Bums.
Stogdill, R. M. (1948). Personal factors associated with leadership: A survey o f the literature. Journal o f Psychology, 25, 35-71.
Stogdill, R. M., & Coons, A. E. (Eds.). (1957) Leader behavior: Its description and measurement (Research Monograph Number 88). Columbus, Ohio: Bureau of Business Research, Ohio State University.
Tabachnick, B. G., & Fidell, L. S. (2006). Using multivariate statistics (4th ed.). Needham Heights, MA: Allyn & Bacon, Inc.
Taylor, F. W. (1911). The principles o f scientific management. New York, NY: Norton.
Torbert, W. R. (2004). Action inquiry: The secret o f timely and transforming leadership. San Francisco, CA: Berrett-Koehler Publishers Inc.
Vogt. P. W. (2006). Quantitative research methods fo r Professionals in education and other fields. New York, NY: Allyn & Bacon.
Vroom, V. H., & Jago, A. G. (1978). On the validity of the Vroom-Yetton model.Journal o f Applied Psychology, 63, 151-162.

103
Vroom, V. H., & Yetton, P. W. (1973). Leadership and decision-making. Pittsburgh, PA: University o f Pittsburgh Press.
Weber, M. (1922). Bureaucracy. In H. Gerth & C. W. Mills (eds.), Max Weber: Essays in sociology. Oxford, UK: Oxford University Press.
Western, S. (2008). Leadership: A critical text. Los Angeles, CA: Sage.
Wheatley, M. J. (1999). Leadership and the new science: Discovering order in a chaotic world. San Francisco, CA: Berrett Koehler.
Yukl, G. (2010). Leadership in organizations (7th ed.). Upper Saddle River, NJ: Pearson Education, Inc.
Yukl, G. (2012, November). Effective leadership behavior: What we know and what questions need more attention. Academy o f Management Perspectives, 66-85.
Zaccaro, S. J., Gilbert, J., Thor, K., & Mumford, M. (1991). Social perceptiveness and behavioral flexibility as characterological bases for leader role acquisition. Leadership Quarterly, 2, 317-342.
Zaccaro, S. J., Kemp, C., & Bader, P. (2004). Leader traits and attributes. In J. Antonakis, A. T. Cianciolo, R. J. Sternberg (Eds.), The nature o f leadership (pp. 101-124). Thousand Oaks, CA: Sage Publications Inc.

Appendix A The Leadership Circle™ Letter of Consent
105
The leadership Circle
March S. 2014
Institutional Review Board,
As the Chairman and Chef Development Officer of The leadership Circle, I am writing to formally subm it that Crystal L Oujowich has my permission to conduct research analysis on the archival da ta se t contained by The Leadership Circle Profile. This is a pre-existing da taset and
therefore. Crystal I. Dujowich will not be in contact with our clients but correspond directly with m e with th e progress and nature of her research. I am aw are th a t she is applying for Institutional Review Board approval for her dissertation research th a t will be conducted using our records. Confidential information will remain as such, under the property and protection of The Leadership Circle.
If you have any further questions, please contact me.
Sincerely,
Founder, C hairm an, & Chief D evelopm ent Officer 419 8 7 / 0 4 3 0

106
Appendix B Industries w ithin TLCP

107
Industries
BroadcastingConsultingEducationFinancialGovernmentTechnologyLegalManufacturingMarketingResearchRetailSocial ServiceT elecommunicationsMilitaryHealthcareNonProfitAutomotiveConstructionEnergyRecreationServiceArchitectureRestaurantTransportationInsurancePharmaceuticalConglomerateReal EstatePrintingGovernment ContractorRecruitmentPublishingSocial ServicesGlobal LeadershipT ravel/EntertainmentSpanishMuseumEntrepreneurChemical

108
Appendix C Demographics Across Industries
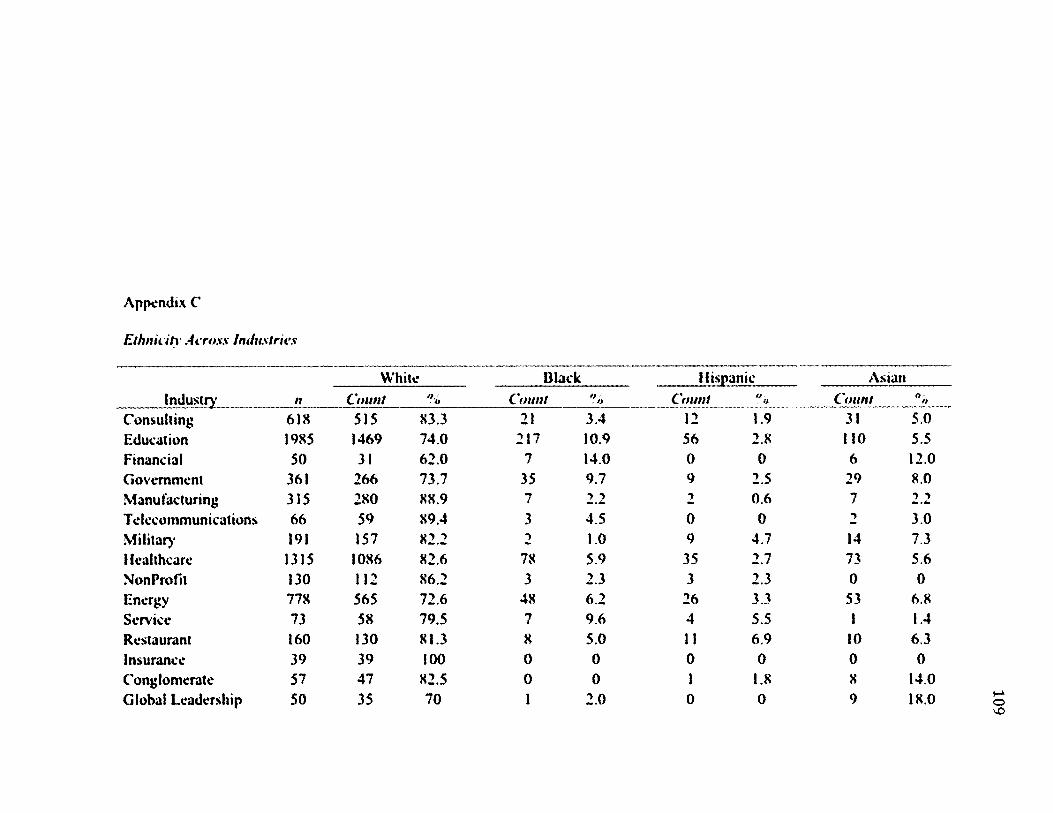
Appendix C
Ethnicity Across Industries
Industry_____ConsultingEducationFinancialGovernmentManufacturingT elecommunicationsMilitary*HealthcareNonProfitEnergyServiceRestaurantInsuranceConglomerateGlobal Leadership
Whiten Count
618 515 83.31985 1469 74.050 31 62.0
361 266 73.7315 280 88.966 59 89.4191 157 82.2
1315 1086 82.6130 112 86.2778 565 72.673 58 79.5160 130 81.339 39 10057 47 82.550 35 70
Black Hispanic Asian,'ount Ot> Count Oa Count Oft21 3.4 12 1.9 31 5.0
217 10.9 56 2.8 110 5.57 14.0 0 0 6 12.0
35 9.7 9 2.5 29 8.07 2 2 2 0.6 7 2 23 4.5 0 0 2 3.02 1.0 9 4.7 14 7.378 5.9 35 2.7 73 5.63 2.3 3 2.3 0 0
48 6.2 26 3.3 53 6.87 9.6 4 5.5 1 1.48 5.0 11 6.9 10 6.30 0 0 0 0 00 0 1 1.8 8 14.01 2.0 0 0 9 18.0
109

Appendix C Continued
Ethnicity Across Industries
Industry ...ConsultingEducationFinancialGovernmentManufacturingT elecommunicationsMilitaryI lealthcareNonprofitEnergyServiceRestaurantInsuranceConglomerateGlobal Leadership
American Indian n Count °o
618 0 01985 6 0.350 0 0
361 0 0315 I 0.366 0 0191 0 0
1315 3 0.2130 1 0.8778 1 0.173 1 1.4160 0 039 0 057 0 050 0 0
Other Prefer Not to AnswerCount ayyo Count a y O
28 4.5 11 1.894 4.7 33 1.76 12 0 08 2.2 14 3.911 3.5 7 2.21 1.5 1 1.52 1.0 7 3.7
20 1.5 20 1.56 4.6 5 3.853 6.8 32 4.12 2.7 0 01 0.6 0 00 0 0 00 0 1 1.81 2.0 4 8.0 110

Appendix C Continued
Gender Across Industries
Industry nConsulting 721 3Education 2276 5Financial 50 0Government 361 0Manufacturing 315 0Telecommunications 66 0Military 191 0Healthcare 1465 3NonProfit 130 0Energy 778 1Service 73 0Restaurant 160 0Insurance 50 8Conglomerate 57 0Global Leadership 50 0
FemaleCount
388 53.8820 36.026 52.0157 43.570 22.222 33.327 14.1
840 57.3106 81.5151 19.472 98.652 32.512 24.013 22.83 6.0
MaleCount
33 45.81451 63.824 48.0
204 56.5245 77.844 66.7164 85.9621 42.424 18.5
626 80.51 1.4
108 67.530 60.044 77.247 94.0 111

Appendix C Continued
Educational Level Across Industries
High SchoolIndustry .........n Count a
Consulting 618 5 0.8Education 1985 4 0.2Financial 50 16 32.0Government 361 9 2.5Manufacturing 315 21 6.7Telecommunications 66 8 12.1Military 191 1 0.5Healthcare 1314 11 0.8NonProfit 130 I 0.8Energy 778 45 5.8Service 73 2 2.7Restaurant 160 6 3.8insurance 36 1 2.6Conglomerate 57 I 1.8Global Leadership 50 0 0
Some College Associate's; DegreeCount O'so Count 0//O
27 4.4 17 2.838 1.9 39 2.018 36.0 5 10.024 6.6 11 3.034 10.8 18 5.713 19.7 -> 3.010 5.2 2 1.061 4.6 72 5.57 5.4 6 4.6
44 5.7 36 4.64 5.5 3 4.1I) 6.9 7 4.40 0 0 04 7.0 3 5.31 2.0 0 0
112

Appendix C Continued
Educational Level Across Industries
Undergraduate Degree
Industry n Count %Consulting 618 132 21.4Education 1985 895 45.1Financial 50 9 18.0Government 361 77 21.3Manufacturing 315 120 38.1Telecommunications 66 24 36.4Military 191 48 25.1Healthcare 1314 235 17.9NonProlit 130 34 26.2Energy 778 275 35.3Service 73 19 26.0Restaurant 160 56 35Insurance 36 24 61.5Conglomerate 57 18 31.6Global Leadership 50 6 12.0
Some Graduate Master's DegreeDoctorate
DegreeCount fta Count O'o Count ftO
77 12.5 292 47.2 68 (1.0490 24.7 417 21.0 102 5.1
2 4.0 0 0 0 039 10.8 115 31.9 86 23.833 10.5 84 26.7 5 1.6S 7.6 13 19.7 1 1.5
45 23.6 78 40.8 7 3.7112 8.5 584 44.4 239 18.217 13.1 59 45.4 6 4.683 10.7 252 32.4 43 5.57 9.6 29 39.7 9 12.314 8.8 63 39.4 3 1.94 10.3 7 17.9 3 7.75 8.8 25 43.9 1 1.8I 2.0 39 78.0 3 6.0
oo

114
Appendix D ICC Calculations
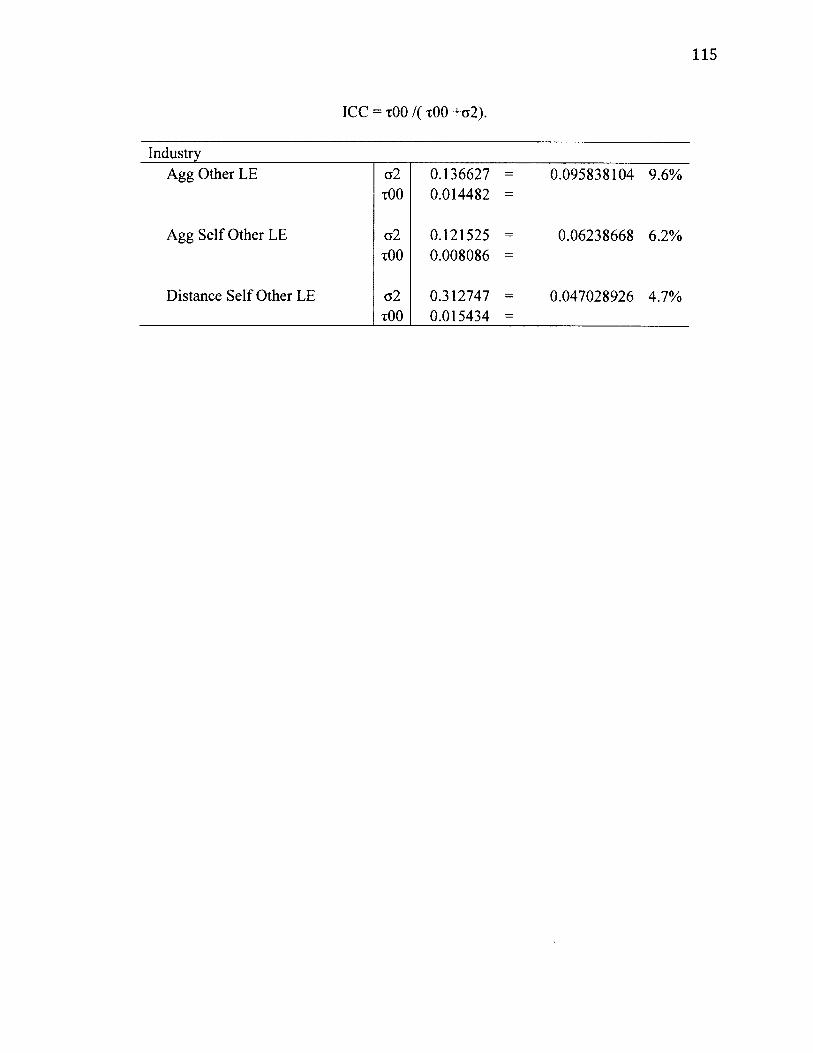
115
ICC = xOO / ( xOO +o2).
IndustryAgg Other LE c2
TOO0.136627 = 0.014482 =
0.095838104 9.6%
Agg Self Other LE ct2tOO
0.121525 - 0.008086 =
0.06238668 6.2%
Distance Self Other LE o2tOO
0.312747 - 0.015434 =
0.047028926 4.7%
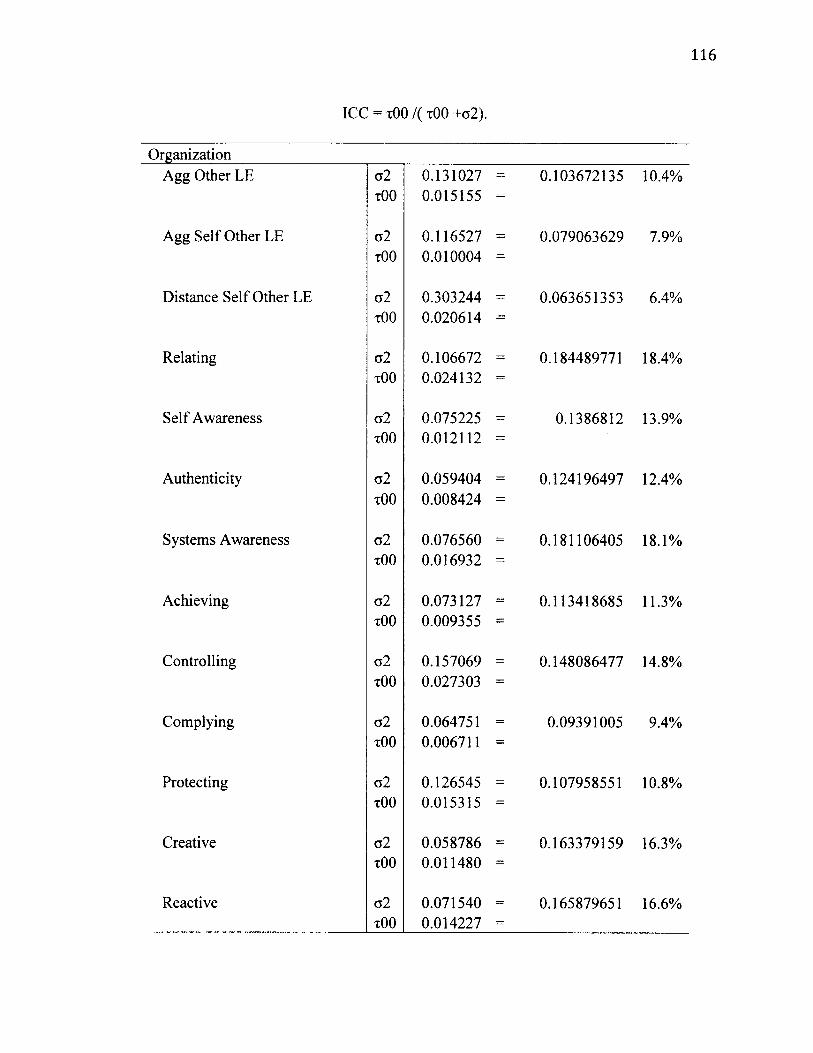
116
ICC = xOO /( TOO +ct2).
OrganizationAgg Other LE o2 0.131027 = 0.103672135 10.4%
TOO 0.015155 =
Agg Self Other LE o2 0.116527 = 0.079063629 7.9%TOO 0.010004 —
Distance Self Other LE a2 0.303244 = 0.063651353 6.4%TOO 0.020614 =
Relating o2 0.106672 = 0.184489771 18.4%t O O 0.024132 =
Self Awareness o2 0.075225 = 0.1386812 13.9%TOO 0.012112 —
Authenticity o2 0.059404 = 0.124196497 12.4%TOO 0.008424 =
Systems Awareness o2 0.076560 = 0.181106405 18.1%TOO 0.016932 =
Achieving o2 0.073127 = 0.113418685 11.3%TOO 0.009355 =
Controlling o2 0.157069 = 0.148086477 14.8%TOO 0.027303 =
Complying o2 0.064751 0.09391005 9.4%TOO 0.006711 -
Protecting o2 0.126545 — 0.107958551 10.8%t O O 0.015315 =
Creative o2 0.058786 = 0.163379159 16.3%TOO 0.011480 =
Reactive c2 0.071540 = 0.165879651 16.6%TOO 0.014227 =
Top Related