


Languages
Pages
Legal

A Monte Carlo analysis of uncertainties yof inventory estimates of CH4 and CO2emissions in Nanjing and the Yangtzeemissions in Nanjing and the Yangtze
River Delta
YangDong----YangDong
1. Background
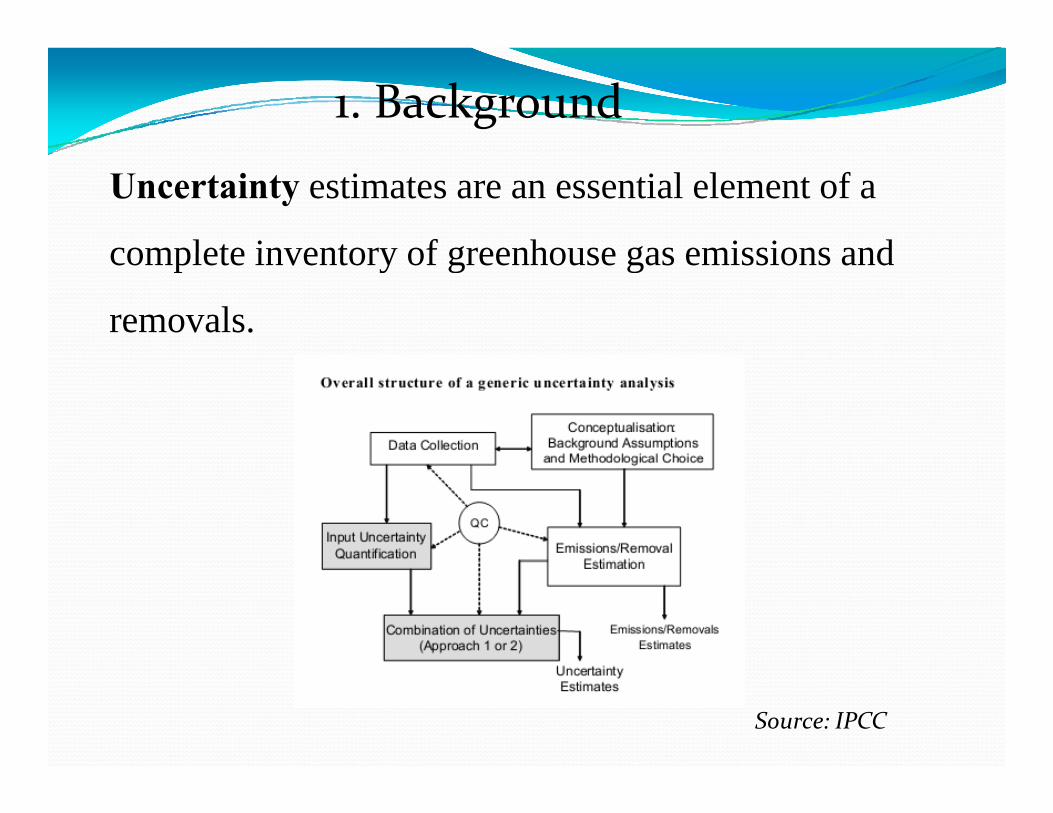
Uncertainty estimates are an essential element of a
complete inventory of greenhouse gas emissions andcomplete inventory of greenhouse gas emissions and
removals.
Source: IPCC
Winiwarter and Rypdal (2001), Eggleston et al . (1998) and Monni et al. (2004) provide examples of Monte Carlo analysis applied to national GHG inventories to
i i i b h i ll i i destimate uncertainties both in overall emissions and emissions trends.
More detailed descriptions and applications of this method are presented in Bevington and Robinson p g(1992), Manly (1997), Morgan and Henrion (1990), and Cullen and Frey (1999).
2 Monte Carlo methods2. Monte Carlo methods
2.1 Source of Monte Carlo methods
Monte Carlo methods are a class of computational algorithms
that rely on repeated random sampling to compute their resultsthat rely on repeated random sampling to compute their results.
They were central to the simulations required for the Manhattan
jProject .
2 2 Basic ideas and principles2.2 Basic ideas and principles
Basic ideas :When the required solution of the problem q p
is the probability of certain events, or the expectations of a
random variable we can use a "test" method to get the random variable , we can use a test method to get the
frequency of such events, or the average of this random
bl d h h l f h blvariable, and use them as the solution of the problem.
Principles:It is based on a probability model and the
simulation results is regarded as the approximate solution.
2.3 Particular Pattern
Monte Carlo methods vary, but tend to follow a particular pattern:pattern:
Construct or describe the probability of the process;
Sampling from a known probability distribution;
Establish various estimators.
2.3.1 Construct or describe the probability of the process
Monte Carlo methods can be roughly divided into two categories:
The problem itself has intrinsic randomness;
The problem can be transformed into some kind of randomThe problem can be transformed into some kind of random
distribution of the number of features.
2.3.2 Sampling from a known probability distribution
Construct a probabilistic model and extracted randomConstruct a probabilistic model and extracted random
variables (or random vector) by the model . It can generally
be called by the package, or extract a uniformly distributed
random number structure.
2.3.3 Establish various estimators
After the realization of the simulation experiment, we will
determine a random variable, as required by the solution of the
problem Establish various estimates equivalent to theproblem. Establish various estimates ,equivalent to the
inspection and registration of the simulation results.
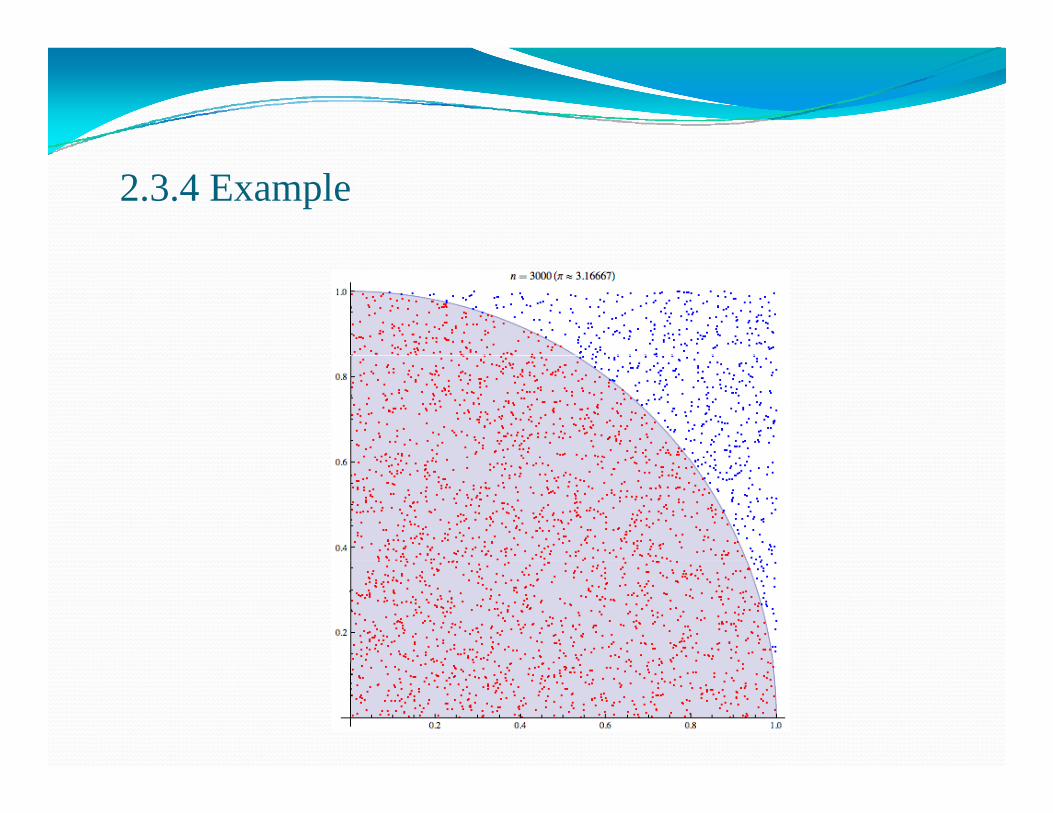
2.3.4 Example
2.4 Advantage of Monte Carlo methods
The computational complexity of this method is no The computational complexity of this method is no
longer dependent on the dimension;
Suit for the study of complex system.
2.5 Monte Carlo and random numbers
Random numbers are the basic tools for Monte Carlo
simulationsimulation
Random number generation is the problem of sampling .
A . Generate random numbers using physical methods ;
B mathematical recurrence formula The sequenceB . mathematical recurrence formula .The sequence---
pseudo- random number .
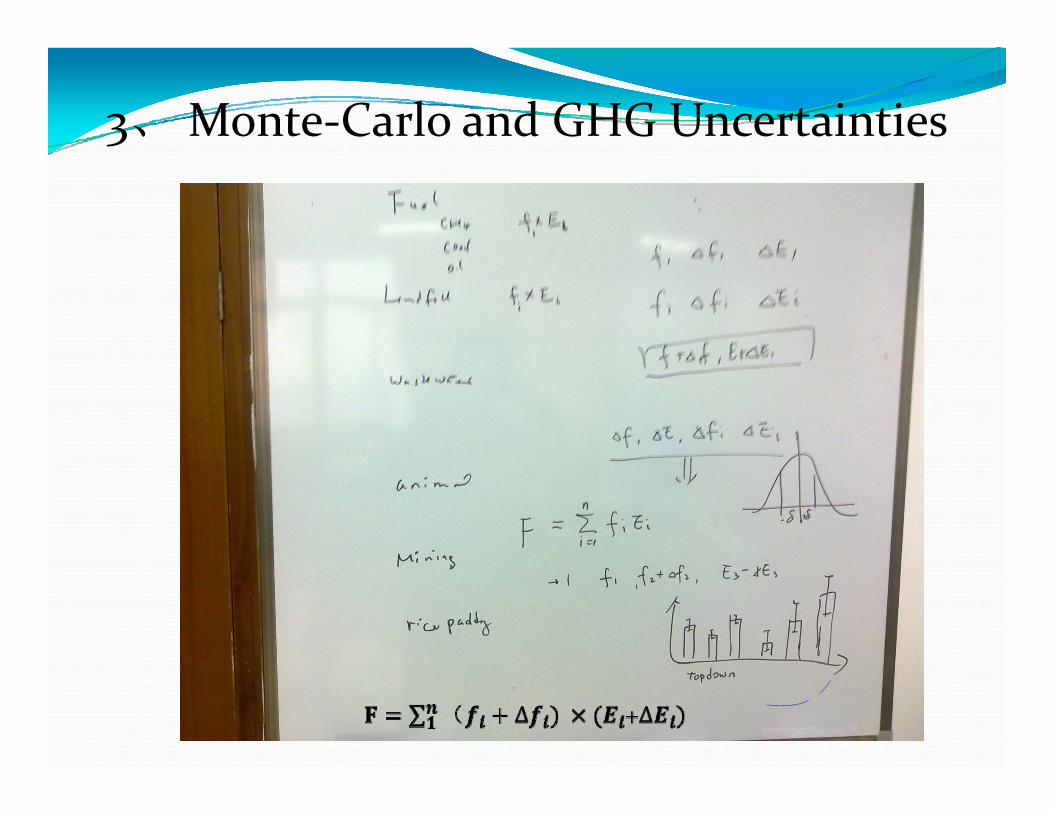
3、 Monte‐Carlo and GHG Uncertainties
3.1 The principle of Monte Carlo analysis
to select random values of emission factor, activity data
from within their individual probability density functions,
and to calculate the corresponding emission valuesand to calculate the corresponding emission values.
repeated many times, and the results of each calculation run
build up the overall emission probability density function.
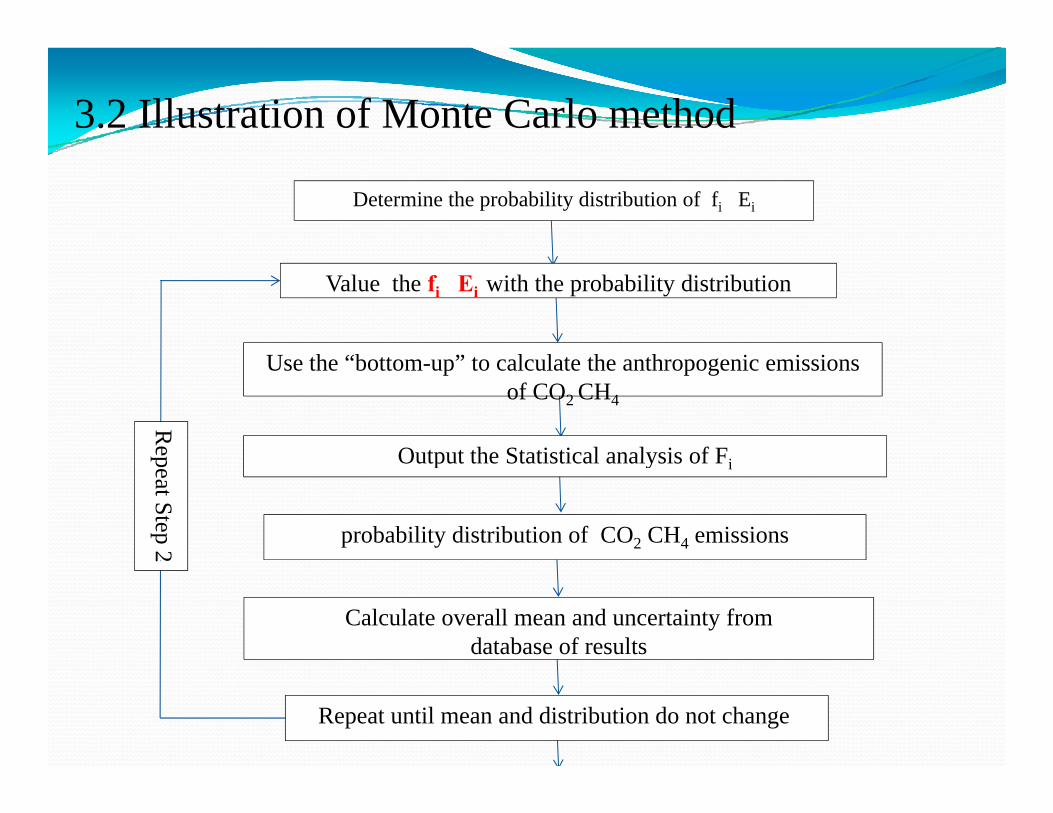
3.2 Illustration of Monte Carlo method
Determine the probability distribution of fi Ei
Value the fi Ei with the probability distribution
U h “b ” l l h h i i iUse the “bottom-up” to calculate the anthropogenic emissions of CO2 CH4
Output the Statistical analysis of F
Rep Output the Statistical analysis of Fi
probability distribution of CO2 CH4 emissions
peat Step 2
Calculate overall mean and uncertainty fromdatabase of results
2
Repeat until mean and distribution do not change
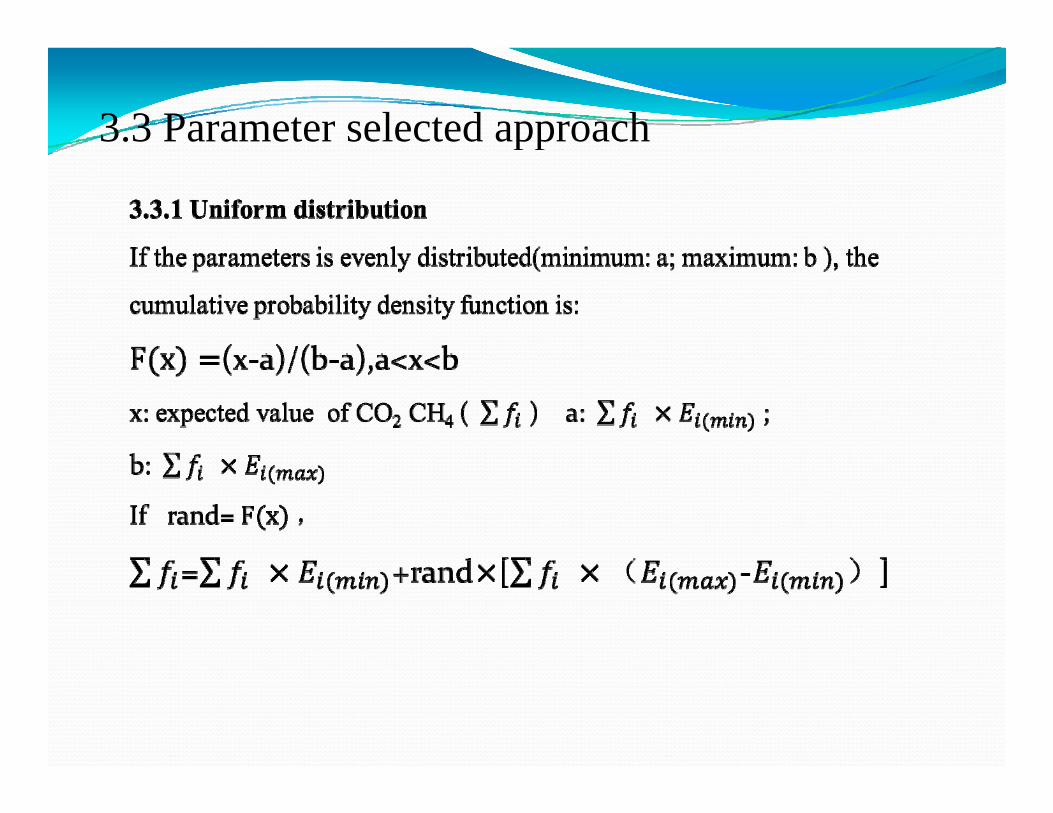
3.3 Parameter selected approachpp
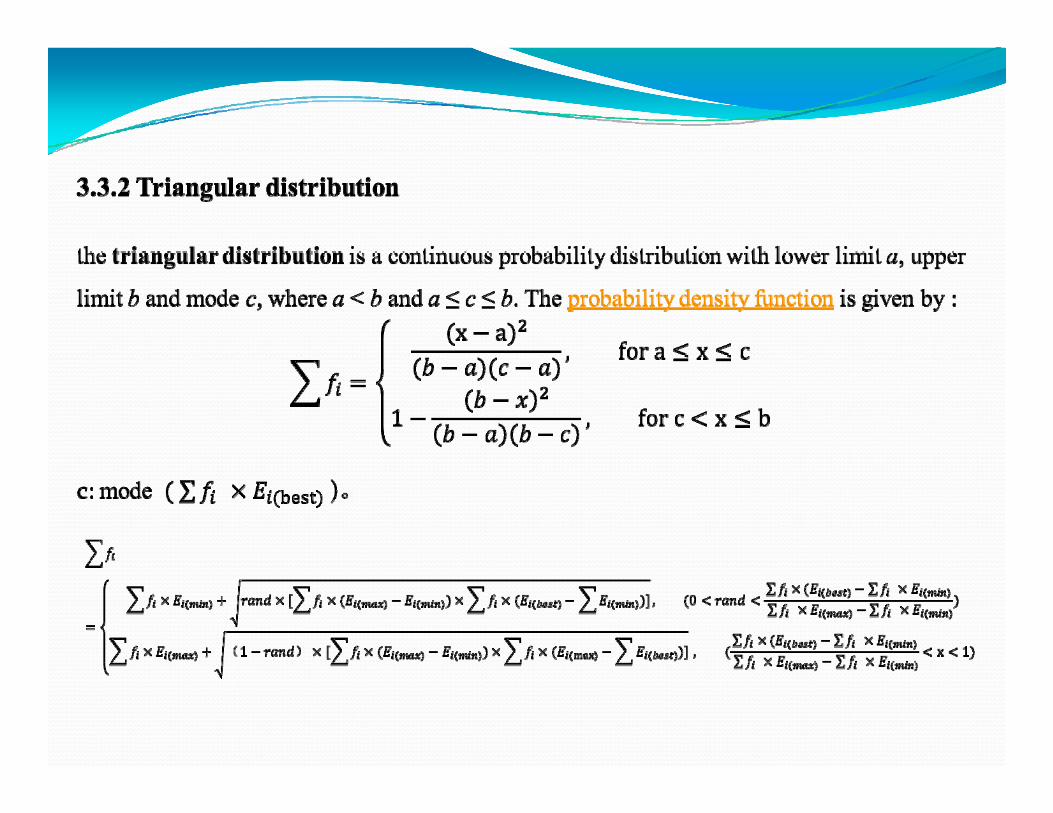
3 4 Nanjing GHG uncertainty3.4 Nanjing GHG uncertainty
1 C i i b i ji ( i )
Category CH4(min) CH4(mean) CH4(max)
Table 1. CH4 emissions by category in Nanjing (units : ton)
Fuel 1.01E+03 3.35E+03 1.04E+04
Landfill 5 48E+04 6 15E+04 6 84E+04Landfill 5.48E+04 6.15E+04 6.84E+04
Wastewater 1.40E+04 1.40E+04 1.40E+04
Li t k 3 53E+03 5 05E+03 6 56E+03Livestock 3.53E+03 5.05E+03 6.56E+03
Bioenergy 2.42E+03 3.35E+03 5.57E+03
Total 7.57E+04 8.72E+04 1.05E+05
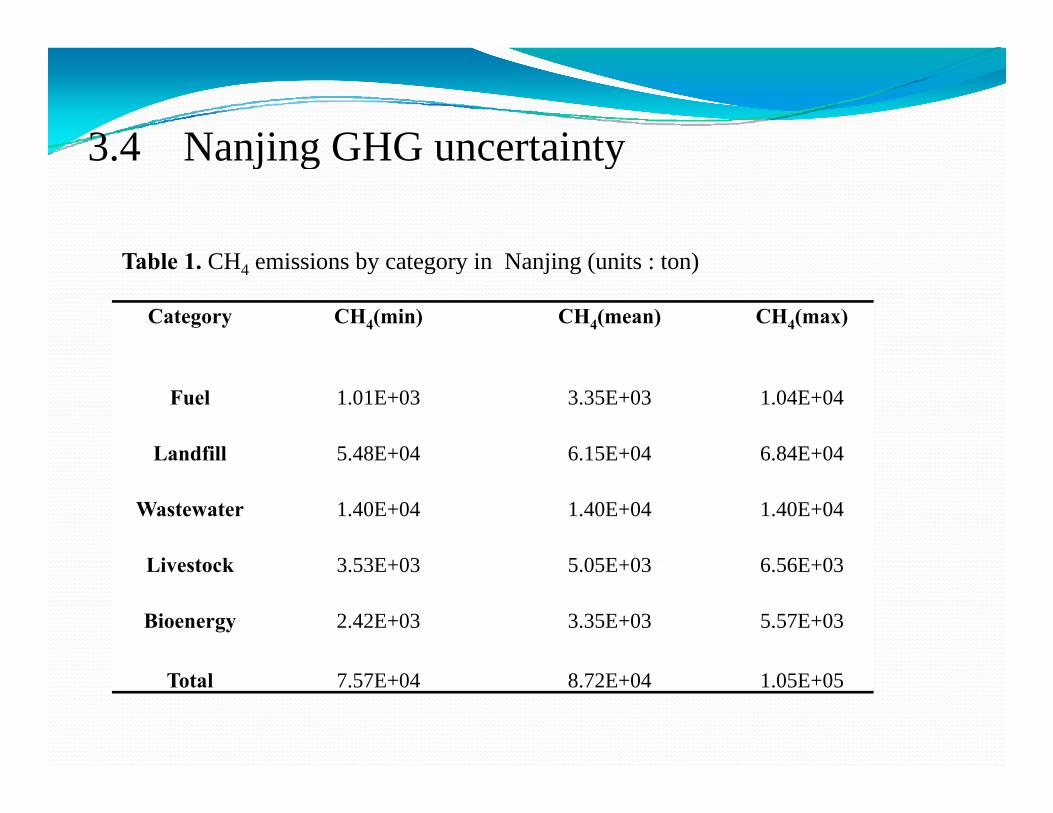
MATLAB code of Monte Carlo (NJ-CH4):( )
n=20000; %随机点数(可增加点数)x=(1006+(10393-1006)*rand(1,n))+(54800+(68400-54800)*rand(1,n)) +13967+ (3530+(6560-3530)*rand(1,n))+(2420+(5570-2420)*rand(1,n));%产生20000个最小值到最大值的随机数
61000 1000 91000 %画概率密度图的区间xx=61000:1000:91000; %画概率密度图的区间nx=histc(x,xx); %计算x在xx每个小区间内的点数px=nx/n;
sumpx=cumsum(px);
subplot(1,2,1)subplot(1,2,1)bar(xx(1:end-1),px(1:end-1));title('概率密度')
subplot(1,2,2)plot(xx(1:end-1),sumpx(1:end-1));title('累积概率密度')
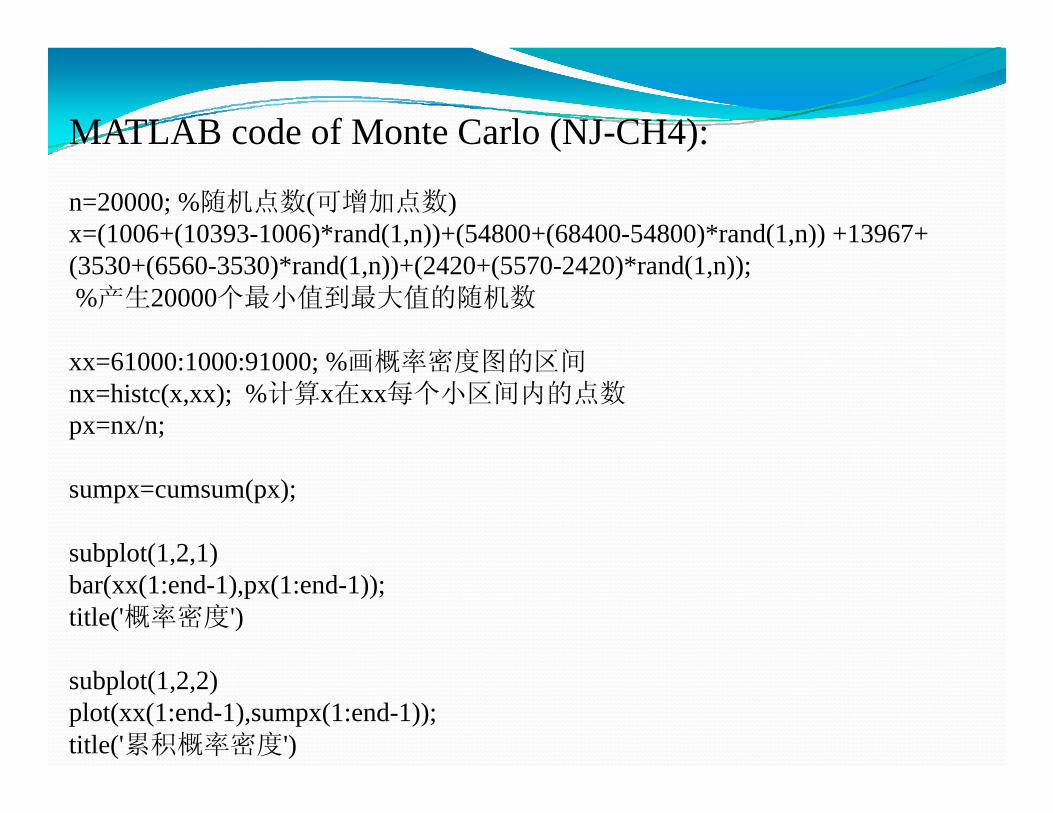
Figure 1. uncertainty estimate of CH4 (Nanjing)
MC(95%): CH4(min)=80000(ton) ; CH4(max)=98500(ton)
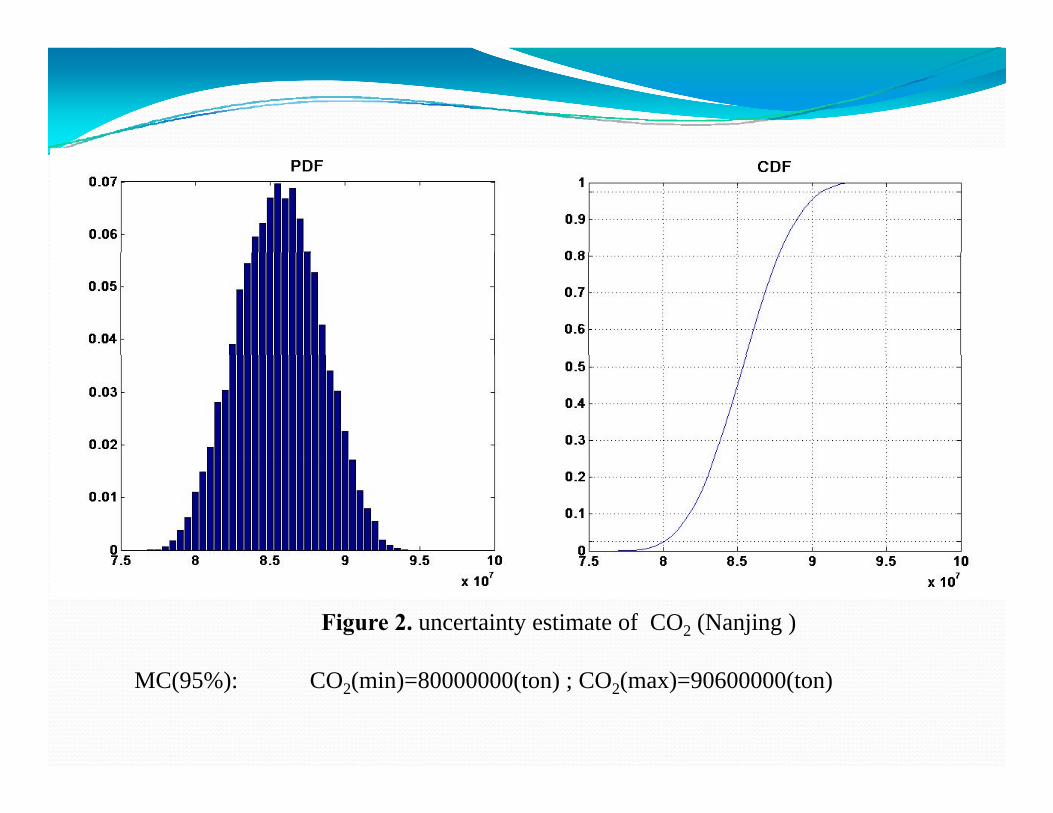
Figure 2. uncertainty estimate of CO2 (Nanjing )
MC(95%): CO2(min)=80000000(ton) ; CO2(max)=90600000(ton)
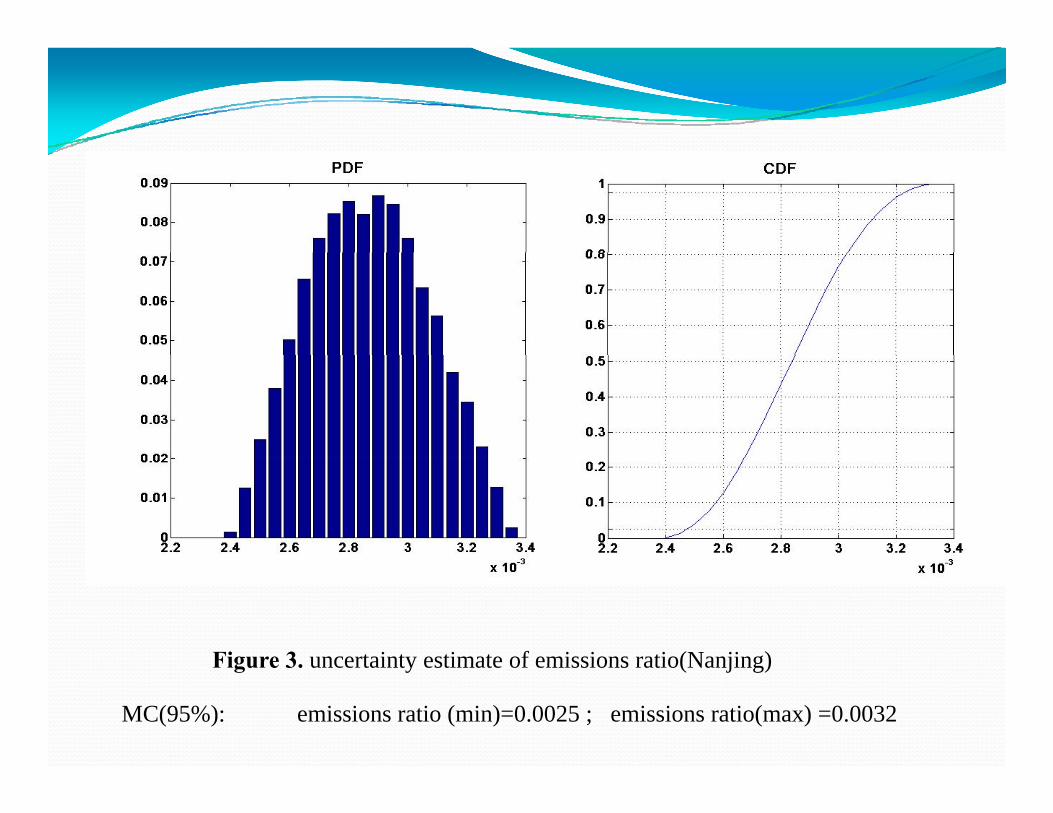
Figure 3 uncertainty estimate of emissions ratio(Nanjing)
MC(95%): emissions ratio (min)=0.0025 ; emissions ratio(max) =0.0032
Figure 3. uncertainty estimate of emissions ratio(Nanjing)
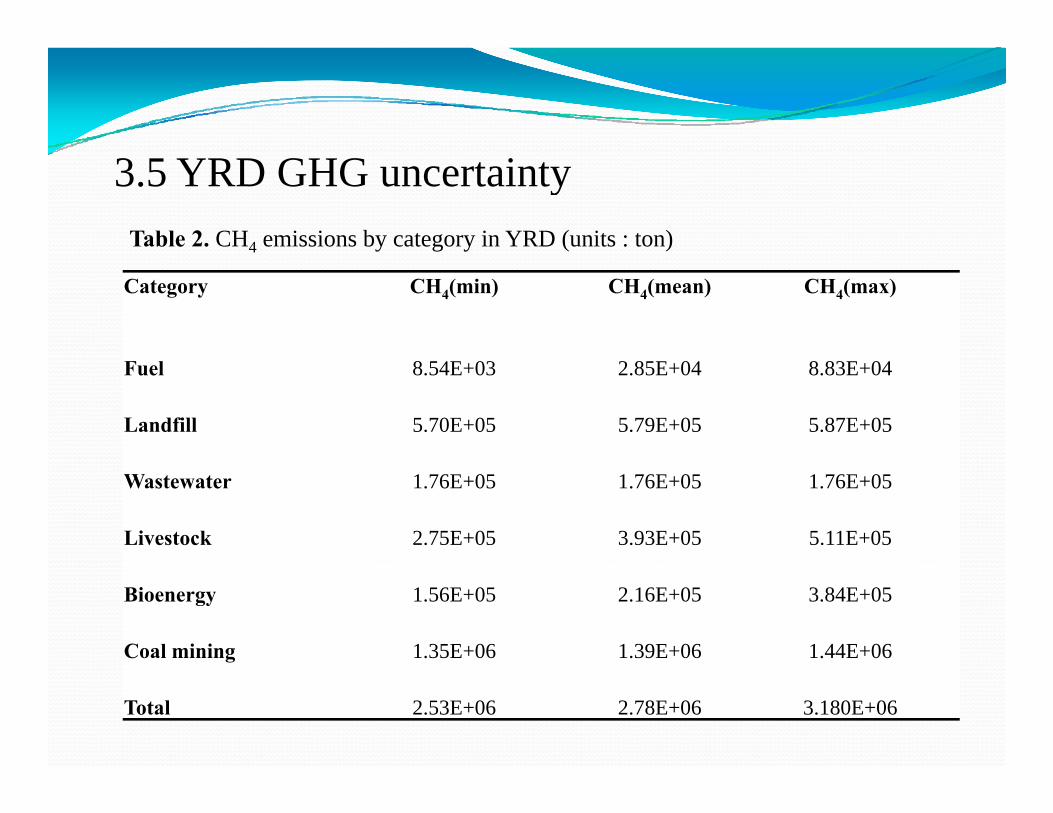
Table 2. CH4 emissions by category in YRD (units : ton)
3.5 YRD GHG uncertainty
Category CH4(min) CH4(mean) CH4(max)
Fuel 8.54E+03 2.85E+04 8.83E+04
Landfill 5.70E+05 5.79E+05 5.87E+05
Wastewater 1.76E+05 1.76E+05 1.76E+05
Livestock 2.75E+05 3.93E+05 5.11E+05
Bioenergy 1.56E+05 2.16E+05 3.84E+05
Coal mining 1.35E+06 1.39E+06 1.44E+06
Total 2.53E+06 2.78E+06 3.180E+06
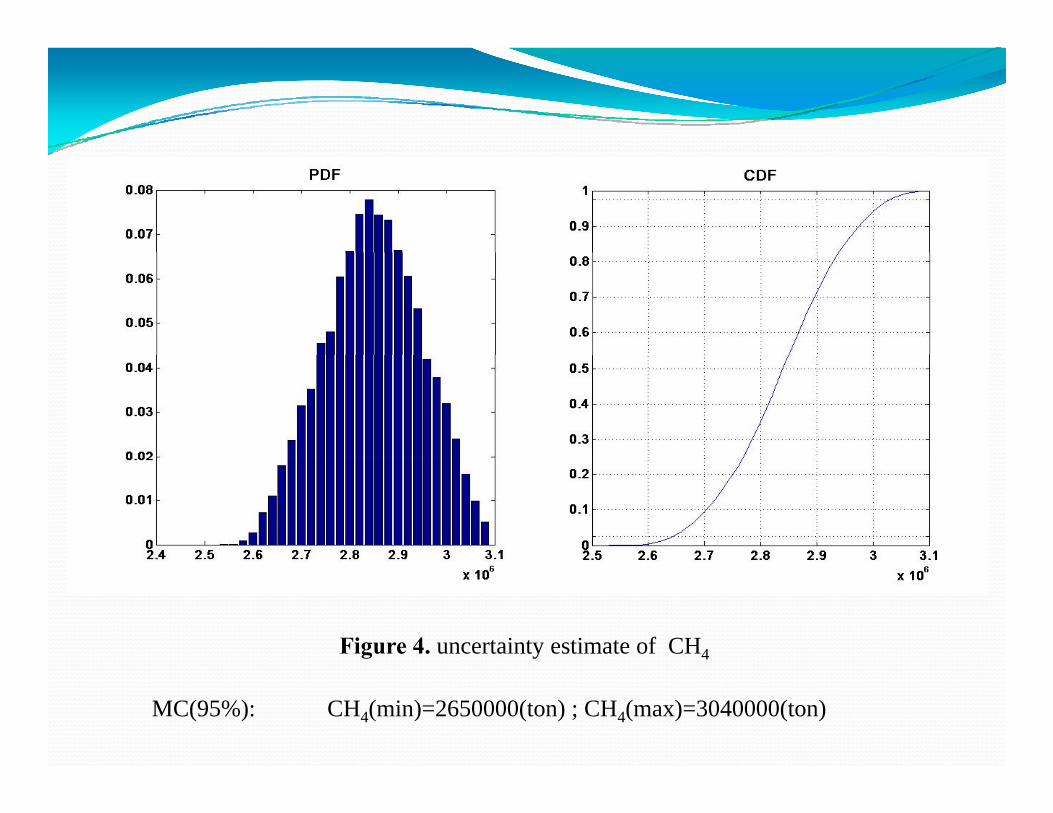
Figure 4. uncertainty estimate of CH4
MC(95%): CH4(min)=2650000(ton) ; CH4(max)=3040000(ton)
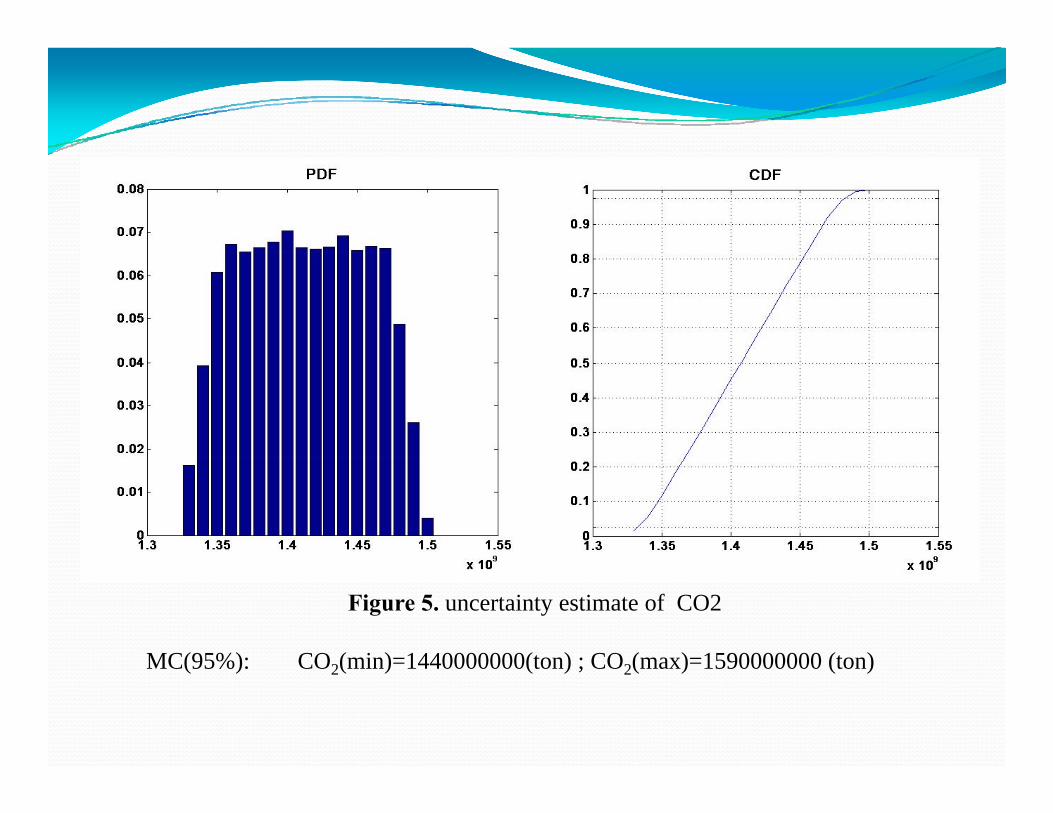
MC(95%): CO (min)=1440000000(ton) ; CO (max)=1590000000 (ton)
Figure 5. uncertainty estimate of CO2
MC(95%): CO2(min)=1440000000(ton) ; CO2(max)=1590000000 (ton)
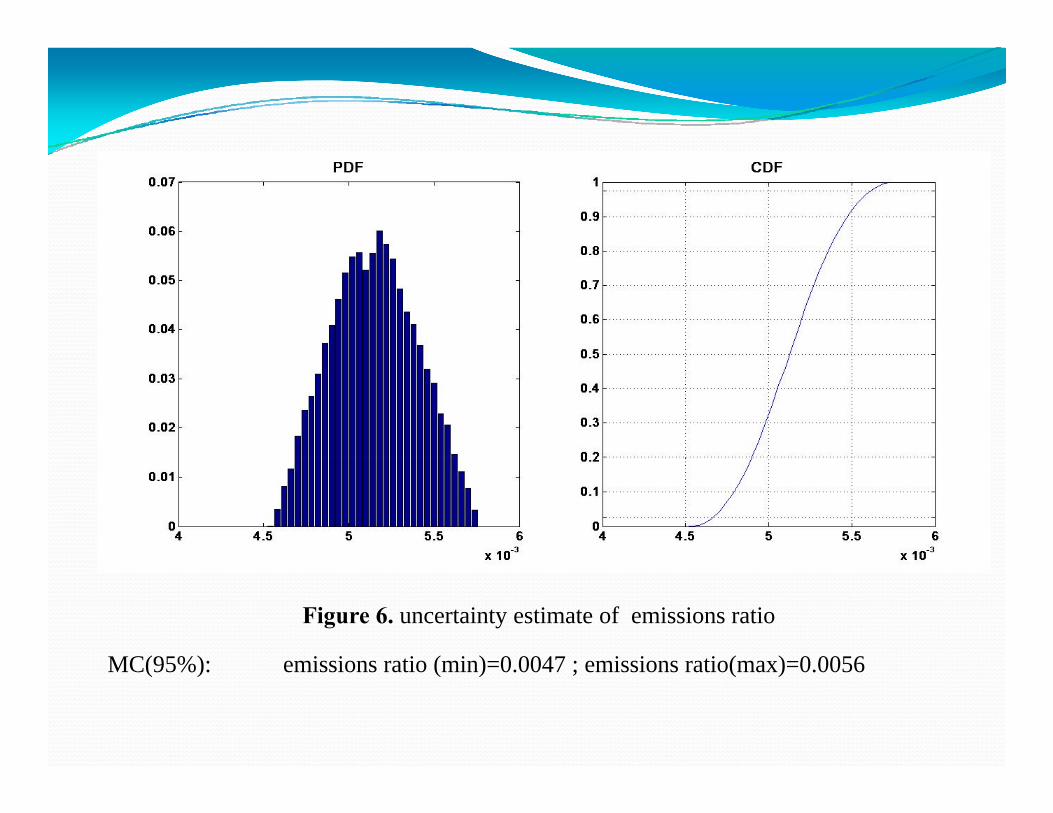
MC(95%): emissions ratio (min)=0 0047 ; emissions ratio(max)=0 0056
Figure 6. uncertainty estimate of emissions ratio
MC(95%): emissions ratio (min)=0.0047 ; emissions ratio(max)=0.0056
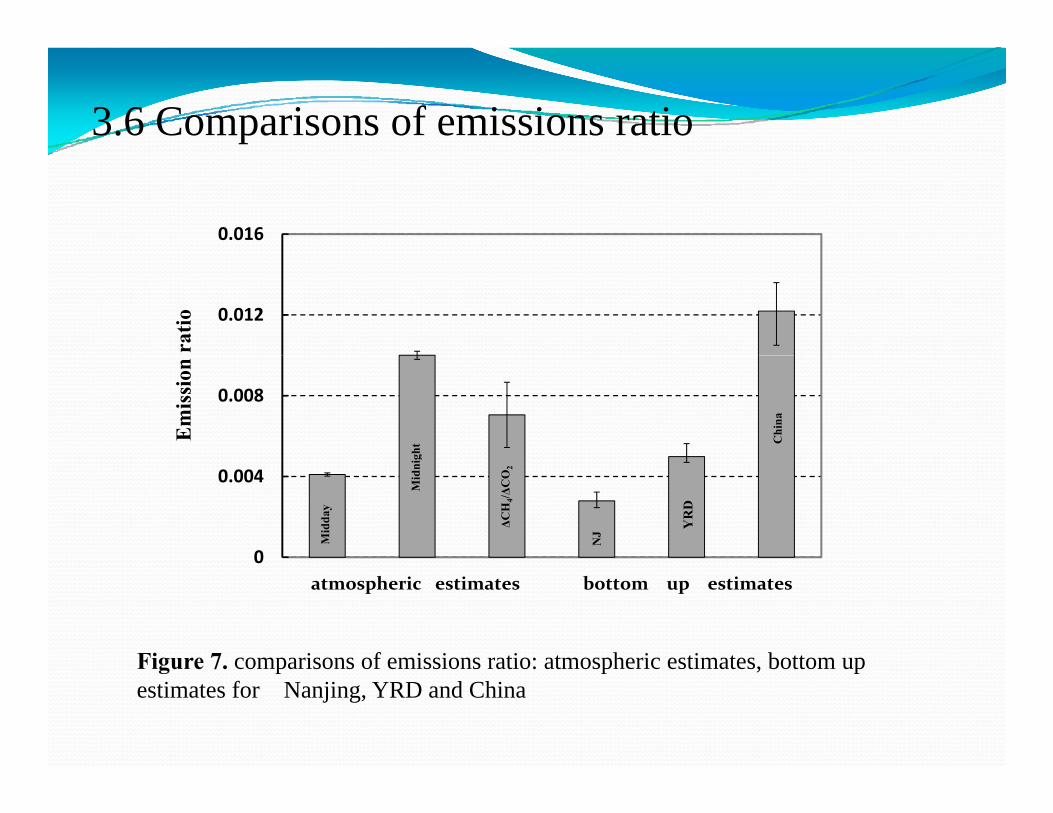
3.6 Comparisons of emissions ratio
0.016
ratio
0.012
Em
issi
on
0.008gh
t Chi
na
0
0.004
Mid
day
Mid
nig
ΔCH
4/ΔC
O2
NJ
YR
D
Figure 7 comparisons of emissions ratio: atmospheric estimates bottom up
0atmospheric estimates bottom up estimates
Figure 7. comparisons of emissions ratio: atmospheric estimates, bottom up estimates for Nanjing, YRD and China

Top Related