


Languages
Pages
Legal


A FUNCTIONAL IMMOBILIZATION MATRIX BASED ON A CONDUCTING
POLYMER MODIFIED WITH PMMA/CLAY NANOCOMPOSITES AND GOLD
NANOPARTICLES: APPLICATIONS TO AMPEROMETRIC GLUCOSE
BIOSENSORS
A THESIS SUBMITTED TO
THE GRADUATE SCHOOL OF NATURAL AND APPLIED SCIENCES
OF
MIDDLE EAST TECHNICAL UNIVERSITY
BY
MELİS KESİK
IN PARTIAL FULFILLMENT OF THE REQUIREMENTS
FOR
THE DEGREE OF MASTER OF SCIENCE
IN
CHEMISTRY
FEBRUARY 2014

Approval of the thesis:
A FUNCTIONAL IMMOBILIZATION MATRIX BASED ON A CONDUCTING
POLYMER MODIFIED WITH PMMA/CLAY NANOCOMPOSITES AND
GOLD NANOPARTICLES: APPLICATIONS TO AMPEROMETRIC
GLUCOSE BIOSENSORS
submitted by MELİS KESİK in partial fulfillment of the requirements for the degree
of Master of Science in Chemistry Department, Middle East Technical University
by,
Prof. Dr. Canan Özgen _____________________
Dean, Graduate School of Natural and Applied Sciences
Prof. Dr. İlker Özkan _____________________
Head of Department, Chemistry
Prof. Dr. Levent Toppare _____________________
Supervisor, Chemistry Dept., METU
Examining Committee Members:
Prof. Dr. Suna Timur _____________________
Biochemistry Dept., Ege University
Prof. Dr. Levent Toppare _____________________
Chemistry Dept., METU
Assoc. Prof. Dr. Ali Çırpan _____________________
Chemistry Dept., METU
Assist. Prof. Dr. Emren Nalbant Esentürk _____________________
Chemistry Dept., METU
Dr. Senem Kıralp Kayahan _____________________
Yalçıner Patent ve Danışmanlık Ltd. Şti.
Date: 05.02.2014

iv
I hereby declare that all information in this document has been obtained and
presented in accordance with academic rules and ethical conduct. I also declare
that, as required by these rules and conduct, I have fully cited and referenced all
material and results that are not original to this work.
Name, Last name: Melis KESİK
Signature

v
ABSTRACT
A FUNCTIONAL IMMOBILIZATION MATRIX BASED ON A CONDUCTING
POLYMER MODIFIED WITH PMMA/CLAY NANOCOMPOSITES AND
GOLD NANOPARTICLES: APPLICATIONS TO AMPEROMETRIC
GLUCOSE BIOSENSORS
Kesik, Melis
M. Sc., Department of Chemistry
Supervisor: Prof. Dr. Levent Toppare
February 2014, 97 pages
Designing biosensors for detection of target species in any test solution has attracted
keen interest throughout the world. Over the conventional methods biosensors have
several advantages which are specific, rapid, and simple to operate, and ease of
fabrication with minimal sample pretreatment involved. However, reproducibility and
stability are still major drawbacks. To overcome these problems, a suitable
immobilization method must be chosen. Conducting polymers serve excellent
immobilization platform for biomolecule depositions owing to their biocompatibility,
ease of preparation and ability to modify structural properties. Besides, combination of
conducting polymers and nanostructures attracted considerable attention in biosensing
applications. Modification of the electrode surface with nanostructures leads to increase
rate of electron transfer between biomolecules and support material. By this way,
effective and stable biosensor design is achieved. In this thesis, a functional polymer,
vi
poly(6-(4,7-bis(2,3-dihydrothieno[3,4-b][1,4]dioxin-5-yl)-2H-benzo[d][1,2,3]triazol-2-
yl)hexan-1-amine) poly(BEDOA-6), was utilized as an immobilization matrix for
glucose oxidase biosensor construction. Moreover, conducting polymer surface was
modified with PMMA/clay nanocomposite material and modified gold nanoparticles to
develop two different glucose biosensors. After successful electrochemical deposition
of the polymer; poly(BEDOA-6) on the graphite electrode, immobilization of glucose
oxidase was carried out. During immobilization, nanostructures were used in biosensor
fabrication to achieve the most effective surface design for target biosensors. By
applying constant potential, consumption of oxygen concentration in bulk solution was
followed using amperometric technique. Surface features of the biosensors were
characterized using several techniques like SEM, XPS, TEM, Fluorescence Microscopy.
The designed biosensors showed wide linear ranges with low detection limits. Also,
kinetic parameters, operational and storage stabilities were determined. Finally, the
biosensors were tested on real samples.
Keywords: Conducting Polymers, Glucose biosensors, Enzyme Based Amperometric
Biosensors, Gold Nanoparticles, Clay Nanocomposites, Glucose Oxidase.

vii
ÖZ
PMMA / KİL NANOKOMPOZİTLER VE ALTIN NANOPARTİKÜLLER İLE
MODİFİYE EDİLEN İLETKEN POLİMER BAZLI FONKSİYONEL
İMMOBİLİZASYON MATRİSLER: AMPEROMETRİK GLUKOZ
BIYOSENSÖR UYGULAMALARI
Kesik, Melis
Yüksek Lisans, Kimya Bölümü
Tez Yöneticisi: Prof. Dr. Levent Toppare
Şubat 2014, 97 sayfa
Herhangi bir test solüsyonunda hedef analit tayininde biyosensör dizaynı tüm dünya
tarafından oldukça ilgi çekmektedir. Geleneksel yöntemlere göre, biyosensörlerin
kendine özgü, hızlı ve kolay çalışma ve en az örnek hazırlama işlemi ile kolay
üretilebilme gibi birçok avantajı vardır. Fakat tekrarlanabilirlikleri ve kararlılıkları hala
önemli sorunlardır. Bu sorunları çözmek için, uygun immobilizasyon metodu
seçilmelidir. İletken polimerlerin biyouyumlulukları, kolay hazırlanmaları ve modifiye
edilebilir yapısal özellikleri sayesinde biyomoleküller için uygun immobilizasyon
platformu olarak hizmet verirler. Bunun yanı sıra, iletken polimerlerin nanoyapılarla
birlikte biyosensör uygulamalarında kullanımı hayli ilgi çekmektedir. Elektrot yüzeyini
nanoyapılarla modifiye etmek biyomolekül ile destek malzemesi arasındaki elektron
transfer hızının artmasına sebep olmaktadır. Bu sayede, etkili ve kararlı biyosensör
dizaynı elde edilmektedir. Bu tezde, sentezlenmiş fonksiyonel bir polimer olan poly(6-
(4,7-bis(2,3-dihidrotiyeno[3,4-b][1,4]dioksin-5-il)-2H-benzo[d][1,2,3]triazol-2-

viii
il)hekzan-1-amin) (poly(BEDOA-6) glikoz oksidaz enzimi immobilizasyonunda
immobilizasyon matrisi olarak kullanılmıştır. Ayrıca, iki farklı glikoz biyosensörü
geliştirmek için, iletken polimer yüzeyi PMMA/kil nanokomposit ve modifiye edilmiş
altın nanopartikül ile modifiye edilmiştir. Polimerin grafit elektrot yüzeyinde başarılı
bir şekilde biriktirilmesinden sonra, glikoz oksidaz enziminin immobilizasyonu
yapılmıştır. Bu immobilizasyon hedeflenen biyosensörler için en etkili yüzey dizaynını
elde etmek için nanoyapılar kullanılmıştır. Sabit uygulanan potensiyel altında,
çözeltideki oksijen konsantrasyonu tüketimi amperometrik teknik kullanılarak
izlenmiştir. SEM, XPS, TEM ve Floresans mikroskop gibi bazı teknikler kullanılarak
yüzey özellikleri karakterize edilmiştir. Dizayn edilen bu biyosensörler düşük saptama
sınırı olan geniş lineer aralıklar göstermektedir. İlaveten, biyosensörlerin çeşitli kinetik
parametreleri, operasyonel ve depo kararlılıkları tayin edilmiştir. Son olarak, hazırlanan
bu biyosensörler farklı numunelerde test edilmiştir.
Anahtar kelimeler: İletken Polimerler, Glukoz Biyosensörleri, Enzim Esaslı
Amperometrik Biyosensörler, Altın Nanoparçacıklar, Kil Nanokompositleri, Glikoz
Oksidaz.

ix
To my precious family….

x
ACKNOWLEDGMENTS
I would like to express my appreciation to my supervisor Prof. Dr. Levent Toppare for
his guidance, support, encouragement, patience, valuable advices. Words cannot
express my gratitude. It is feeling beyond words that I know he always support me
during my whole life.
I would like to express my sincere thanks Prof. Dr. Suna Timur for her valuable
discussions, endless support and help throughout this study.
I would like to express my thanks Assoc. Prof. Yasemin Arslan Udum for her assistance,
endless help and patience for my countless phone calls.
I would like to express my appreciation to Assist. Prof. Dr. Emren Nalbant Esentürk for
her valuable collaboration, partnership and providing me deep knowledge about
Inorganic chemistry.
I would like to give my special thanks Assoc. Prof. Dr. Ali Çırpan for the nice working
environment and his moral support. I will always be a playmate for cute baby Melis.
I wish to thank all the past and present members of Toppare and Çırpan Research
Group for the nice working environment and their friendship.
I would like to express my appreciation to Fulya Ekiz Kanık for everything throughout
my thesis study. I appreciate for her extraordinary support, endless help, motivation and
her kind friendship.
I owe great thanks Gönül Hızalan Özsoy for teaching me organic synthesis with every
details, kind friendship and endless help whenever I need her.
I would like to give my special thanks Seza Göker, Merve İleri, Sinem Toksabay and
Saniye Söylemez for their endless support, real friendship, providing me excellent

xi
working environment and spending time with me during my experiments until middle
of the night. They make these years unforgettable for me.
I would like to express my deepest sense of gratitude to Nehir Utku, Büke Mıhçı, Esra
Öğün, Esra Özdemir for their real friendship, support and motivation. For 7 years, they
are always with me whenever I feel blue or happy. I am one of the luckiest person in the
World for being their friend.
I would like to thank Hande Ünay, Ozan Erlik, Emre Ataoğlu, Ebru Işık, Janset Turan
for their frienship, moral support and encouragement. I am deeply sorry not meeting
with them before.
I would like to thank Berfu Esen for being a second sister to me and always being there
for me, her true friendship. Since 2003, she believes in me and makes me feel happy.
I would like to thank Ayşe Gündoğdu, Burhan Şentürk, Burak Çetinkaya, Orçun Elitez
and Çilem Çiçek for their frienship, spending wonderful time with me. The memories
which they are involved always make me happy.
I would like to express my gratitude to Ali Mancar for his great love, continuous
support, understanding and encouraging me. I could not achieve anything without his
love and trust. I appreciate for every moment that we spend together.
I would like to express my special thanks and appreciation to my family for believing in
me and giving me endless support. I am the luckiest person in the world being their
daughter and sister. I would not be possible to achieve anything throughout my all life
without them.

xii
TABLE OF CONTENTS
ABSTRACT ..................................................................................................................... v
ÖZ .................................................................................................................................. vii
ACKNOWLEDGMENTS ................................................................................................ x
TABLE OF CONTENTS ............................................................................................... xii
LIST OF TABLES ........................................................................................................ xvi
LIST OF FIGURES ...................................................................................................... xvii
LIST OF ABBREVIATIONS ....................................................................................... xxi
CHAPTERS ..................................................................................................................... 1
1. INTRODUCTION ........................................................................................................ 1
1.1. Conducting Polymers ........................................................................................ 1
1.1.1. History of Conducting Polymers ................................................................ 1
1.1.2. Theory of Conducting Polymers ................................................................ 3
1.1.3. Syntheses of Conducting Polymers ............................................................ 7
1.1.3.1. Chemical Polymerization ....................................................................... 7
1.1.3.2. Electrochemical Polymerization ............................................................. 8
1.1.4. Applications of Conducting Polymers ..................................................... 11
1.2. Biosensors ........................................................................................................ 11
1.2.1. Electrochemical Biosensors ..................................................................... 13
1.2.1.1. Conductometric Biosensors .................................................................. 13
1.2.1.2. Potentiometric Biosensors .................................................................... 14
1.2.1.3. Amperometric Biosensors .................................................................... 14
1.2.2. Immobilization Techniques ...................................................................... 17
1.2.2.1. Physical Adsorption .............................................................................. 19
1.2.2.2. Entrapment ........................................................................................... 20
1.2.2.3. Covalent Bonding ................................................................................. 21

xiii
1.2.2.4. Intermolecular Crosslinking .................................................................. 22
1.2.3. Applications of Biosensors ........................................................................... 23
1.2.4. Glucose Biosensors ....................................................................................... 25
1.2.5. Conducting Polymers in Biosensing Design ................................................ 26
1.2.6. Nanostructures in Biosensing Design ........................................................... 28
2. EXPERIMENTAL ...................................................................................................... 33
2.1. Materials ........................................................................................................... 33
2.2. Instrumentations ............................................................................................... 34
2.2.1. Electrochemical measurements ................................................................. 34
2.2.2. Characterization studies ............................................................................ 34
2.2.2.1. Nuclear Magnetic Resonance Spectrometer (NMR) ............................. 34
2.2.2.2. High Resolution Mass Spectrometer (HRMS) ...................................... 34
2.2.2.3. Scanning electron microscope (SEM) ................................................... 35
2.2.2.4. Fluorescence microscope ...................................................................... 35
2.2.2.5. Transmission electron microscope (TEM) ............................................ 35
2.2.2.6. X-ray photoelectron spectroscope (XPS) .............................................. 35
2.2.2.7. UV-vis-NIR spectrophotometer ............................................................ 36
2.2.2.8. Fourier Transform Infrared Spectrophotometry (FTIR) ....................... 36
2.3. Synthesis of the Monomer ................................................................................ 36
2.4. Electrochemical Polymerization of the Monomer ........................................... 38
2.5. Construction of Biosensors .............................................................................. 39
2.5.1. PMMA/laponite nanocomposite/ poly(BEDOA-6)/GOx Biosensor ........ 39
2.5.2. Au NPs/MPA/ poly(BEDOA-6)/GOx Biosensor ..................................... 40
2.6. Amperometric Measurements .......................................................................... 41
2.7. Effect of nanostructure addition on biosensor responses ................................. 43
2.7.1. PMMA/laponite nanocomposite/ poly(BEDOA-6)/GOx Biosensor ........ 43
2.7.2. Au NPs/MPA/ poly(BEDOA-6)/GOx Biosensor ..................................... 43
2.8. Optimization of Biosensor Performance .......................................................... 43
2.8.1. Optimization of Conducting Polymer Thickness ...................................... 43
2.8.2. Optimization of Enzyme Amount ............................................................. 44

xiv
2.8.3. Effect of pH .............................................................................................. 44
2.8.4. Optimization of Nanostructures Amounts ............................................... 44
2.9. Analytical characterization of Biosensors ....................................................... 45
2.10. Sample Application ...................................................................................... 46
2.10.1. PMMA/laponite nanocomposite/ poly(BEDOA-6)/GOx Biosensor ....... 46
2.10.2. Au NPs/MPA/ poly(BEDOA-6)/GOx Biosensor ..................................... 46
3. RESULTS AND DISCUSSION ................................................................................. 49
3.1. Electrochemical Studies .................................................................................. 49
3.1.1. Electrochemical Polymerization of the Monomer ................................... 49
3.1.2. Electrochemical Behavior of the Conducting Polymer ............................ 50
3.2. PMMA/laponite nanocomposite/ poly(BEDOA-6)/GOx Biosensor ............... 52
3.2.1. Investigation of biosensor construction method ...................................... 52
3.2.2. Effect of PMMA/Laponite Nanocomposite dispersion for biosensor
construction ............................................................................................................. 53
3.2.3. Effect of PMMA/Laponite Nanocomposite Introduction ........................ 54
3.2.4. Optimization of Biosensor Performance .................................................. 55
3.2.4.1. Optimization of Conducting Polymer Thickness ................................. 55
3.2.4.2. Optimization of enzyme amount .......................................................... 57
3.2.4.3. Optimization of crosslinker (glutaraldehyde) amount .......................... 58
3.2.4.4. Optimization of pH ............................................................................... 59
3.2.4.5. Optimization of nanocomposite amounts ............................................. 60
3.2.5. Surface Characterization of the biosensor design .................................... 61
3.2.5.1. X-ray photoelectron spectroscopy (XPS) ............................................. 61
3.2.5.2. Scanning electron microscope (SEM) .................................................. 62
3.2.6. Analytical characterization of the proposed biosensor ............................ 63
3.2.7. Sample Application .................................................................................. 66
3.3. Au NPs/MPA/ poly(BEDOA-6)/GOx Biosensor ............................................ 67
3.3.1. Characterization of Modified Gold Nanoparticles ................................... 67
3.3.2. Effect of Au NPs/MPA in Biosensor Fabrication .................................... 70
3.3.3. Optimization Studies ................................................................................ 72
xv
3.3.3.1. Optimization of Conducting polymer thickness .................................... 72
3.3.3.2. Optimization of enzyme amount ........................................................... 73
3.3.3.3. Optimization of Au NPs/MPA amount ................................................. 75
3.3.4. Characterizations of the proposed biosensor ............................................ 76
3.3.4.1. Fourier Transform Infrared Spectrophotometry (FTIR) ....................... 76
3.3.4.2. Scanning electron microscope (SEM) ................................................... 77
3.3.4.3. Fluorescence microscopy ...................................................................... 79
3.3.5. Analytical characterization of Biosensors................................................. 80
3.3.6. Sample Application ................................................................................... 82
4. CONCLUSION ........................................................................................................... 85
REFERENCES ............................................................................................................... 89

xvi
LIST OF TABLES
TABLES
Table 1.1. Immobilization procedures. .......................................................................... 18
Table 1.2. Applications of biosensors ............................................................................ 24
Table 3.1. Analytical characteristics of the biosensors. ................................................. 65
Table 3.2. Glucose analyses in the serum samples. ....................................................... 66
Table 3.3. Results of glucose analyses in beverages. ..................................................... 83
xvii
LIST OF FIGURES
FIGURES
Figure 1.1. Common conjugating polymer structures ...................................................... 3
Figure 1.2. Band structure for an insulator, a semiconductor and a metal. ...................... 5
Figure 1.3. Structural representation of bipolaron formation in polypyrrole and its
corresponding energy bands in the mid gap ..................................................................... 6
Figure 1.4. Synthetic routes of polyheterocycles for chemical polymerization................ 7
Figure 1.5. Proposed mechanism of the electropolymerization of pyrrole. .................... 10
Figure 1.6. Simple representation of a biosensor ............................................................ 12
Figure 1.7. Schematic representation of three generations of amperometric biosensors 17
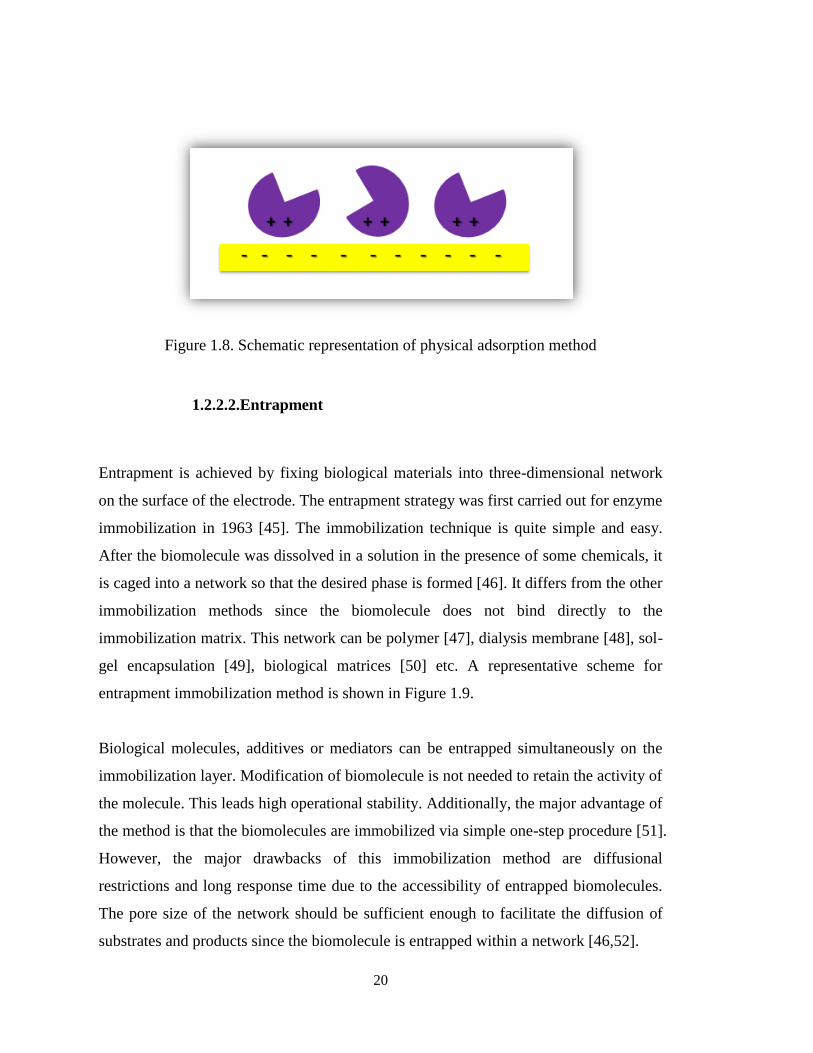
Figure 1.8. Schematic representation of physical adsorption method. ........................... 20
Figure 1.9. Schematic representation of entrapment method.......................................... 21
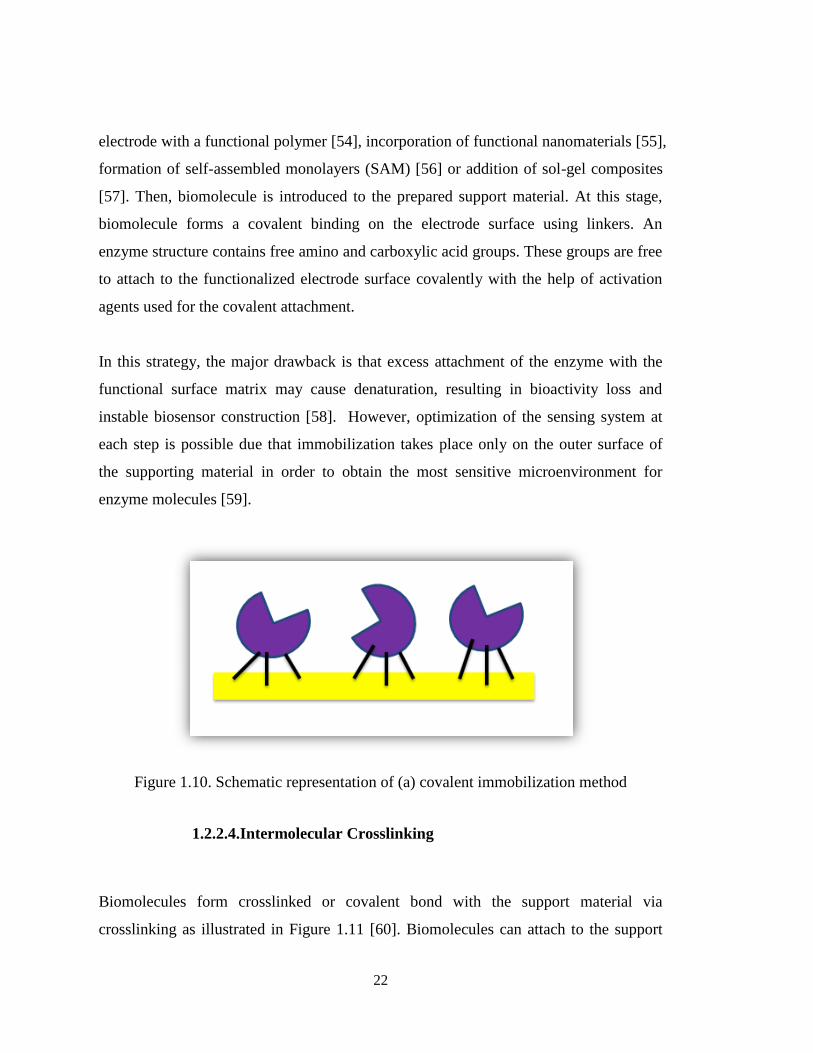
Figure 1.10. Schematic representation of (a) covalent immobilization method. ............ 22
Figure 1.11. Schematic representation of intermolecular crosslinking immobilization
method. ............................................................................................................................ 23
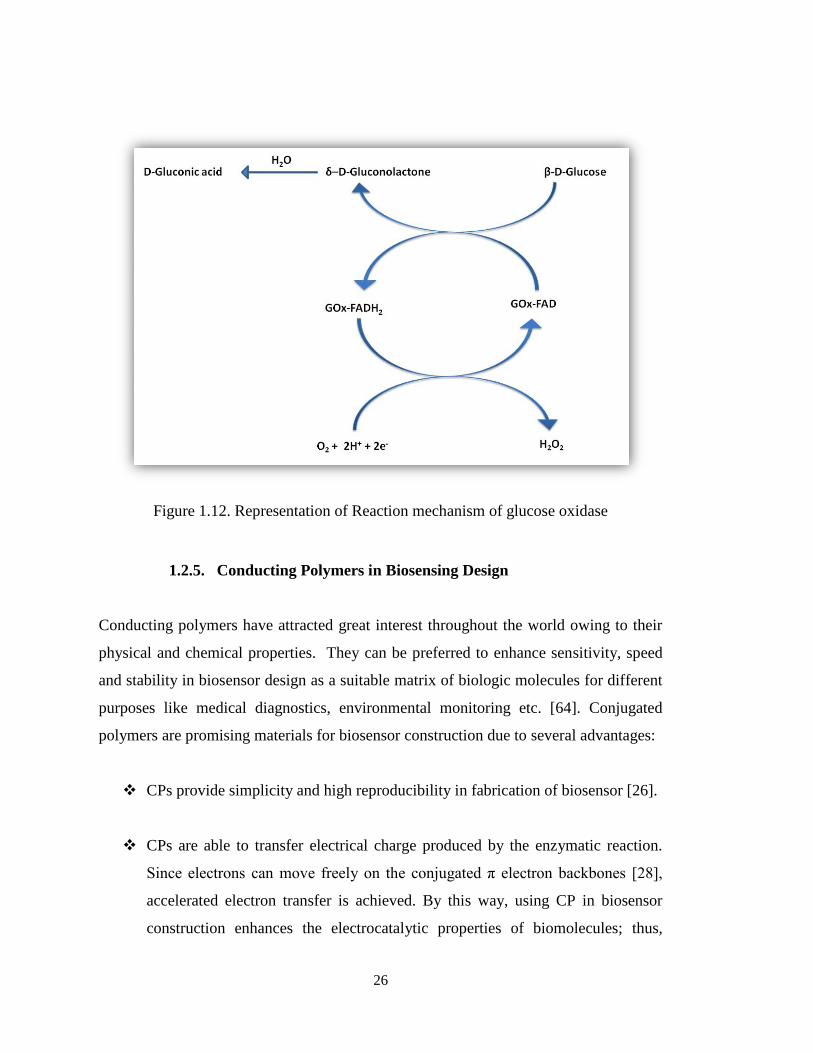
Figure 1.12. Representation of Reaction mechanism of glucose oxidase. ...................... 26
Figure 1.13. Representation of clay and polymer/clay nanocomposite. ......................... 30
Figure 1.14. Representation of self-assembled gold nanoparticles functionalized with
MPA. ............................................................................................................................... 31
Figure 2.1. Synthetic route to BEDOA-6. ....................................................................... 38
Figure 2.2. Schematic representation of PMMA/laponite nanocomposite/poly(BEDOA-
6)/GOx Biosensor ........................................................................................................... 40
Figure 2.3. Schematic representation of Au NPs/MPA/ poly(BEDOA-6)/GOx biosensor
......................................................................................................................................... 41
Figure 2.4. Representation of amperometric measurement procedure ........................... 42

xviii
Figure 3.1. Repeated potential scan electropolymerization of monomer at 100 mV/s vs.
Ag reference electrode in 0.1 M TBAPF6/DCM. ........................................................... 50
Figure 3.2. Scan rate dependence of poly(BEDOA-6) film in 0.1 M TBAPF6/DCM
solvent/electrolyte system at 100, 200, 300 and 400 mV/s. ........................................... 51
Figure 3.3. Chronoamperometry experiment for poly(BEDOA-6) on the electrode in 0.1
TBAPF6/DCM while switching between neutral and oxidized states. Each interval on
the x axis stands for 5 s. ................................................................................................. 52
Figure 3.4. Effect of different preparation technique on biosensor response ................ 53
Figure 3.5. Effect of clay dispersion in water and dichloromethane on biosensor
response .......................................................................................................................... 54
Figure 3.6. Effect of nanocomposite addition on poly(BEDOA-6)/GOx biosensor (in 50
mM NaOAc buffer solution, pH 5.5, 25 ºC, -0.7 V). Error bars show the standard
deviation (SD) of three measurements. .......................................................................... 55
Figure 3.7. The effect of the polymer film thickness on biosensor response (in 50 mM
NaOAc buffer solution, pH 5.5, 25 ºC, -0.7 V, 0.45 mM glucose). Error bars show the
standard deviation (SD) of three measurements ............................................................ 56
Figure 3.8. The effect of enzyme amount (in 50 mM NaOAc buffer solution, pH 5.5, 25
ºC, -0.7 V, 0.45 mM glucose). Error bars show the standard deviation (SD) of three
measurements. ................................................................................................................ 57
Figure 3.9. The effect of crosslinker amount (in 50 mM NaOAc buffer solution, pH 5.5,
25 ºC, -0.7 V, 0.45 mM glucose). Error bars show the standard deviation (SD) of three
measurements. ................................................................................................................ 58
Figure 3.10. The effect of pH (in 50 mM NaOAc buffer solution, 25 ºC, -0.7 V, 0.45
mM glucose). Error bars show the standard deviation (SD) of three measurements. .... 59
Figure 3.11. The effect of clay dispersion in 5 mL water (in 50 mM NaOAc buffer
solution, pH 5.5, 25 ºC, -0.7 V, 0.45 mM glucose). Error bars show the standard
deviation (SD) of three measurements. .......................................................................... 60
Figure 3.12. C1s and N1s XPS spectra of the polymer deposited surface (A and C) and
protein immobilized onto the polymer deposited surface (B and D). ............................ 62

xix
Figure 3.13. SEM images of polymer (a) before and (b) after biomolecule and
nanocomposite immobilization under optimized conditions. ......................................... 63
Figure 3.14. Calibration curve for glucose (in 50 mM NaOAc buffer solution, pH 5.5,
25 ºC, -0.7 V). (A typical amperometric signal of the biosensor for 0.2 mM glucose and
linear range as inset.) Error bars show the standard deviation (SD) of three
measurements. ................................................................................................................. 64
Figure 3.15. UV-vis spectra of Au NPs and Au NPs/MPA solutions prepared in
different concentrations of MPA..................................................................................... 68
Figure 3.16. UV-vis spectra of Au NPs and Au NPs/MPA solutions prepared by
different modification procedures. .................................................................................. 69
Figure 3.17. A) UV-vis spectra of Au NPs and Au NPs/MPA; B) TEM images of (a) Au
NPs and (b) Au NPs/MPA. ............................................................................................. 70
Figure 3.18. The effect of surface modification on performance of glucose biosensors
(in 50 mM NaOAc buffer solution, pH 5.5, 25 ºC, -0.7 V). Error bars show the standard
deviation (SD) of three measurements. ........................................................................... 72
Figure 3.19. The effect of polymer film thickness on biosensor response (in pH 5.5
NaOAc, 50 mM, 25 ºC, -0.7 V). Error bars show the standard deviation (SD) of three
measurements. ................................................................................................................. 73
Figure 3.20. The effect of enzyme amount (in 50 mM NaOAc, 25 ºC, -0.7 V). Error
bars show the standard deviation (SD) of three measurements. ..................................... 74
Figure 3.21. The effect of pH (in 50 mM NaOAc, 25 ºC, -0.7 V). Error bars show the
standard deviation (SD) of three measurements. ............................................................ 75
Figure 3.22. FTIR spectra of poly(BEDOA-6) and poly(BEDOA-6)/Au NPs/MPA. ... 77
Figure 3.23. SEM images of (A) poly(BEDOA-6), (B) poly(BEDOA-6)/GOx, (C)
poly(BEDOA-6)/Au NPs/MPA and (D) poly(BEDOA-6)/Au NPs/MPA/GOx under
optimized conditions. ...................................................................................................... 79
Figure 3.24. Fluorescence images of poly(BEDOA-6) (A) before and (B) after Au
NPs/MPA/GOx immobilization under optimized conditions on ITO glass (with 63x
magnification). ................................................................................................................ 80

xx
Figure 3.25. Calibration curve for glucose (in 50 mM NaOAc buffer solution, pH 5.5,
25 ºC, -0.7 V). Error bars show the standard deviation (SD) of three measurements.... 81
xxi
LIST OF ABBREVIATIONS
ACN Acetonitrile
Ag Silver
Au NPs Gold Nanoparticles
Au NPs/MPA 3-mercaptopropionic acid Modified Gold Nanoparticles
BEDOA-6 6-(4,7-bis(2,3-dihydrothieno[3,4-b][1,4]dioxin-5-yl)-2H-
benzo[d][1,2,3]triazol-2-yl)hexan-1-amine
BSA Bovine Serum Albumin
CB Conduction Band
CE Counter Electrode
CP Conducting Polymer
CV Cyclic Voltammetry
Cyst Cysteamine
DCM Dichloromethane
DMF Dimethylformamide
Eg Band gap
EDOT 3,4-Ethylenedioxythiophene
EDC N-(3-dimethylaminopropyl)-N’-ethylcarbodiimide hydrochloride
FAD Flavin Adenine Dinucleotide
FTIR Fourier Transform Infrared Spectrophotometry
GA Glutaraldehyde
GOx Glucose Oxidase
HRMS High Resolution Mass Spectrometer
HOMO Highest Occupied Molecular Orbital
ITO Indium Tin Oxide
LOD Limit of Detection
MPA 3-Mercaptopropionic acid
NHS N-Hydroxysuccinimide
NMR Nuclear Magnetic Resonance Spectrometer
NaOAc Sodium acetate
NP Nanoparticle
Pt Platinum
PMMA Poly(methyl methacrylate)
RSD Relative Standard Deviation
SAM Self-assembled Monolayers
xxii
(SN)x Poly(sulfurnitride)
SEM Scanning Electron Microscope
XPS X-ray Photoelectron Spectroscope
SD Standard Deviation
TBAPF6 Tetrabutylammonium hexafluorophosphate
TEM Transmission Electron Microscope
THF Tetrahydrofuran
TLC Thin Layer Chromatography
PAn Polyacetylene
PANI Polyaniline
PAc Polyacetylene
VB Valence Band
1
CHAPTER 1
INTRODUCTION
1.1.Conducting Polymers
1.1.1. History of Conducting Polymers
One of the oldest known conductive polymer is polyaniline (PAn), known as “aniline
black”. A film on an electrode surface was produced by oxidation of aniline in the
presence of sulfuric acid by Letheby in 1862, obtained a partly conductive material [1].
The first polymerization of acetylene was achieved by Natta in 1958 using coordination
catalyst system to form polyacetylene (PAc), possessing semiconductor properties [2].
However, the molecule did not attract interest at that time since it was produced as an
insoluble and infusible powder. Shirakawa and coworkers in 1967 carried out the
synthesis of polyacetylene using tremendous amount of Ziegler-Natta catalyst
unwittingly which cause to be produced a thin silvery semiconductor film. The
conductivity of the polymer was changed drastically upon addition of halogens. Thus,
scientists realized that an insulator polymer can be converted to a semiconductor and a
metallic form changing the dopant concentration. After the discovery of
poly(sulfurnitride) (SN)x in the early 1970s, the concept of conductivity of conjugated
polymer was aroused because the synthesized polymeric inorganic material, (SN)x,
revealed an increase in conductivity upon treating with bromine [3].
2
A new era was began at the end of 1970s with the investigation of highly conductive
poly(acetylene) in its doped state, exhibiting metallic electrical conductivity [4]. Alan
MacDiarmind, Alan Heeger and Hideki Shirakawa were awarded with the Nobel Prize
in Chemistry in 2000 [5]. The groundbreaking discovery was demonstrated new
application areas, taking advantages of known characteristic properties of polymers. In
other words, these three scientists opened up the field of “plastic electronics”. A
polymer plastic has single and double bonds alternating along the polymer chain. The
electrons on the polymer backbone cannot carry electric current since they remain
localized. However, when the material is doped with strong electron acceptors,
electrons move freely and the polymer plastics become conductive as almost a metal. In
this case, conductivity of polyacetylene increased by a factor of 1011
times.
Although polyacetylene shows high electrical conductivity, it is air sensitive. Thus, new
conducting polymers (CPs) were designed and synthesized over the past decades in
order to obtain better properties. In 1980s, polyheterocyclic structures were started to
develop. These polymers have attracted much more interest over the past two decades
due to their electron rich character, providing east oxidation process and possible
structural modifications. Moreover, polyheterocycles are stable in air. Although none
demonstrate better electrical conductivity than polyacetylene, heterocyclic polymers
were more processable and allow more diversity in structures. Hence, conducting
polymers have attracted keen interest because of possible uses as supporting material in
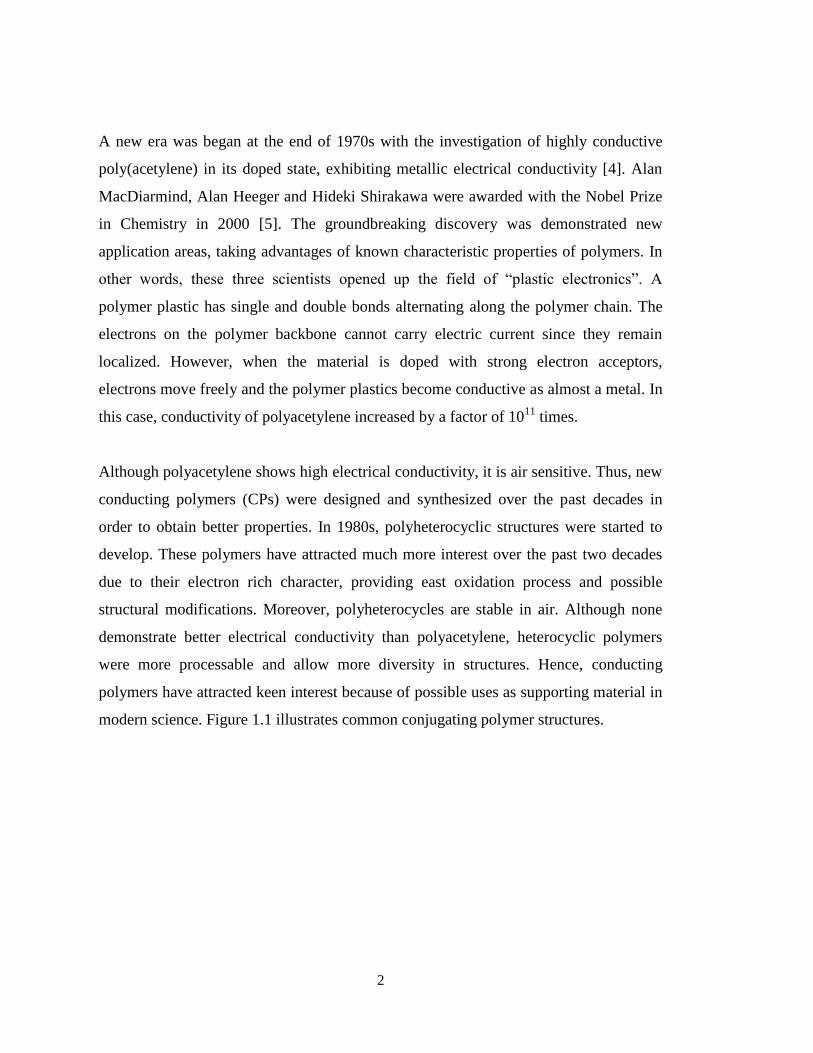
modern science. Figure 1.1 illustrates common conjugating polymer structures.
3
Figure 1.1. Common conjugating polymer structures
1.1.2. Theory of Conducting Polymers
Conductive polymers exhibit superior electrochemical properties due to the presence of
conjugated π electrons along the polymer chain. Alternating single and double bonds
result in conjugation, providing charge mobility. Each bond involves sp- or sp2-
hybridized atoms in the backbone. High degree of overlapping molecular orbitals
permits delocalization of electrons, providing free movement of electrons. However,
conjugation does not make the material conductive alone. The electrical conductivity

4
results from the presence of dopant stimulated charge carriers which allow transmitting
electrical current along the conjugated polymer backbone [6].
The band theory explains the electronic structure and conduction mechanism of
materials. According to this theory, orbitals are overlapped forming delocalized energy
bands. The conductivity of a material is designated by the relative population of each
band and energy difference between the bands. Materials are commonly classified as
insulators, semiconductors and metals according to their relative separation in occupied
and unoccupied energy states. Energy diagram of the classified materials are shown in
Figure 1.2. The highest occupied molecular orbital (HOMO) is called the valence band
(VB); the lowest unoccupied molecular orbital is called as the conduction band (CB).
Energy difference between valence and conduction bands is known as the band gap (Eg)
which determines the motion of electrons. The band gap of an insulator is too large to
transfer electrons between two bands which the energy difference is bigger than 3 eV.
Furthermore, there is no energy gap in a metal, resulting in the flow of electrons
through the material, thus high conductivity. A semiconductor material has a narrow
band gap ranging from 0.5 to 3 eV with a filled valence band and an empty conduction
band [7]. Conductivity of semiconductors can be increased fallowing the doping
procedure with charge carriers. It can be carried out with either holes or electrons. p-
type doping is performed creating holes by taking electrons from valence band; whereas
n-type doping cause adding electron to conductance band [8].

5
Figure 1.2. Band structure for an insulator, a semiconductor and a metal
“Doping” is the process used to enhance conductivity of a polymer. It is a redox process
which involves reduction or oxidation of electrons in the polymer backbone [9]. It is
possible to perform doping processes following either chemical or electrochemical
treatment [5b]. During reversible doping and dedoping mechanism, no change in the
chemical structure of conducting polymers is observed. Thus, band structure of
conducting polymers is changed upon oxidation and reduction process (Figure 1.3).
A radical cation, known as polaron, is formed when an electron is removed from the
valence band during oxidation of polymer chain (p-doping). The charge is partially
delocalized over several polymer segments, resulting in the cleavage of a double bond
in the backbone. If a second electron is removed upon further oxidation, a bipolaron is
created. At high dopant concentration, several bipolarons lead formation of bipolaron
bands. Heavily doped polymer produces partially filled bands between valence and
conduction bands, yielding metallic like conductivity.

6
Figure 1.3. Structural representation of bipolaron formation in polypyrrole and its
corresponding energy bands in the mid gap
7
1.1.3. Syntheses of Conducting Polymers
Conducting polymers can be synthesized according to two widely employed methods:
chemical and electrochemical polymerization. There are several other techniques
carried out like photochemical polymerization, solid state polymerization, pyrolysis
[10]. Conductivity, processability, defined three dimensional structures, solubility and
stability of the conducting polymers should be considered to determine the
polymerization methods for a target design.
1.1.3.1.Chemical Polymerization
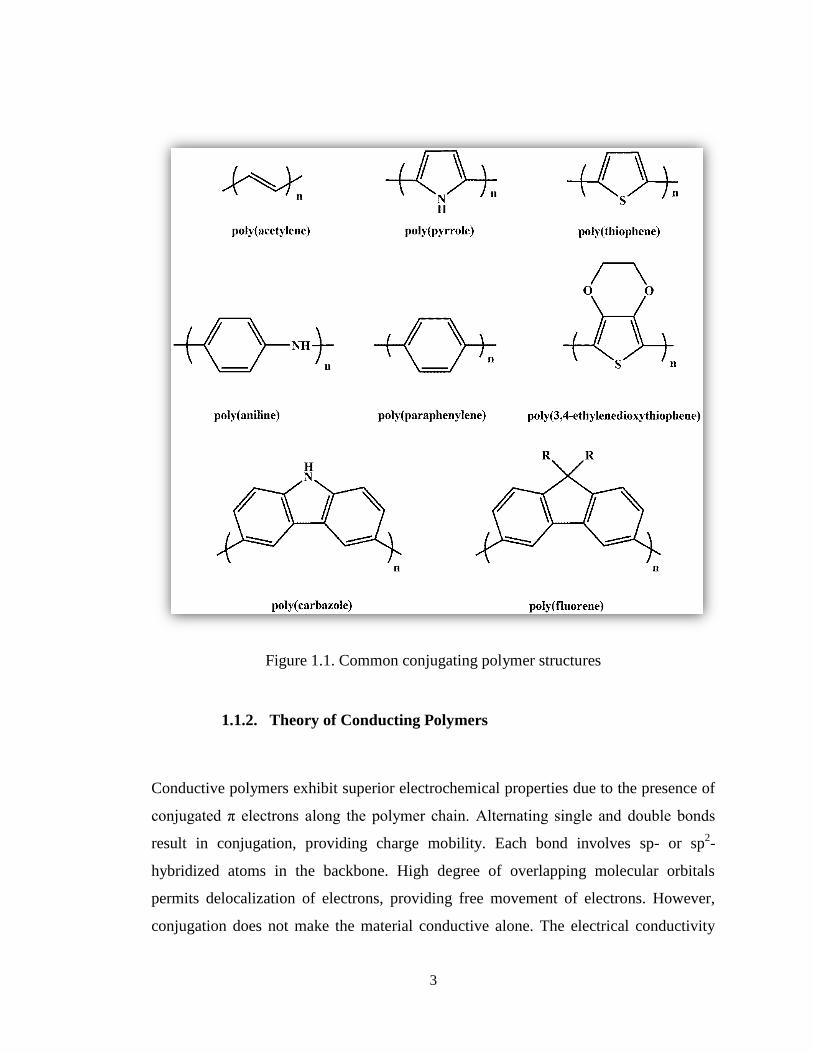
Chemical polymerization can be performed by oxidation of monomers in the presence
of oxidizing agents. For heterocyclic monomers, FeCl3 is generally preferred as oxidant
chemical; although other chemicals can be used for oxidizing agent during chemical
polymerization [11]. During FeCl3 catalyzed polymerization, Fe3+
oxidizes the
monomer and the polymer growth starts while Fe3+
ions are reduced to Fe2+
ions.
Reduction to its neutral state is managed upon addition of strong base like ammonium
hydrazine or hydroxide (Figure 1.4). In another way, chemical polymerization can be
carried out by reacting a monomer with Mg in THF, followed by self coupling with
metal complex catalyst like Ni(bipy)Cl2 [12].
Figure 1.4. Synthetic routes of polyheterocycles for chemical polymerization
8
Chemical polymerization provides synthesis of conducting polymers at low cost.
However, intrinsic properties of the produced polymer may not be qualified, resulted
low conductivity. Moreover, strong oxidizing agents used for polymerization process
may cause overoxidation and decomposition of the polymer as well as many side
reactions may occur [13].
1.1.3.2.Electrochemical Polymerization
Electrochemical polymerization is an effective method for synthesis of conducting
polymers, offering many advantages over chemical polymerization. It is possible to
deposit the polymer at the electrode surface by controlling the thickness of the coated
conducting polymer in terms of charge passing through the cell. As polymer chain
grows, the polymers are oxidized to their doped states. The method represents simple,
reproducible and straightforward process for growth of the conducting polymers on the
electrode surface which allows well defined and finely controlled deposition. The major
drawback is that the synthesized polymer is insoluble, therefore, characterization of the
products are difficult using traditional methods like GPC.
The electrochemical polymer synthesis is performed using various techniques like
potentiostatic (constant-potential), galvanostatic (constant current) and potentiodynamic
(potential scanning with cyclic voltammetry) [14]. In electrochemical polymerization
method, the polymer may be produced in its insulating form, leading to a passivation of
the electrode and limits accessible thickness of the deposited film [15].
Figure 1.5 illustrates the mechanism of the electropolmerization for heterocycles using
pyrrole unit as an example with the steps of radical cation, radical cation coupling and
resonance stabilization. The process occurs in a solution with the presence of
supporting electrolyte. The process starts with the formation of radical cation upon
oxidation of the monomer. The electron transfer reaction is much faster than the

9
diffusion of the monomer from the bulk solution. Thus, high radical concentration is
retained on the electrode surface. Then, two routes can be proceeded to achieve the
polymerization. Either the produced radical cation of the monomer can combine with a
neutral monomer to form a dimer or two radical cation coupling form a dimer. Since the
dimer is more easily oxidized than the monomer, it can be reoxidized to allow further
coupling reaction, proton loss and rearomatization to progress. Hence, electrochemical
polymerization is proceeded through successive electrochemical and chemical steps,
known as E(CE)n mechanism (E for electrochemical, C for chemical) until the produced
oligomers during the process become insoluble in the reaction medium and precipitate
onto the electrode surface [16].

10
Figure 1.5. Proposed mechanism of the electropolymerization of pyrrole

11
1.1.4. Applications of Conducting Polymers
Conducting polymers are known as “synthetic metals”, opening new research field
owing to their overwhelming characteristics. They exhibit both excellent conductivity
like metal and high mechanical strengths and processability like polymers. Therefore,
application areas of conducting polymers focus on usage of conducting polymers as
plastic-metals which has attracted keen interest of scientific world in the last decades.
Taking the advantages of ease of processability, ability of conduct the electricity in the
any desired level, low cost, straightforward preparation techniques and mechanical,
optical and electrical properties make the conducting polymers fundamental materials in
large areas. Chemical and biological sensors [17], light emitting diodes [18], field effect
transistors [19], electrochromic devices [20], rechargeable materials [21], photovoltaic
devices [22], drug delivery [23] and artificial muscles [24] are the most significant
applications of conducting polymers. In this thesis, the use of conducting polymers as
enzyme immobilization matrices in biological sensors is investigated.
1.2.Biosensors
A device that transforms chemical information into an analytical signal is known as the
chemical sensor. Biosensors are a type of chemical sensors utilizing a biochemical
mechanism. This system translates the information from the chemical domain into an
output signal in order to provide the selective sensors for the analyte that can be
measured [25].
In recent years, biosensors have attracted lots of attention throughout the world. The
designed biosensors are specific, rapid, and simple to operate, and ease of fabrication
with minimal sample pretreatment involved [26]. Besides, real time analysis can be

12
possible which leads rapid measurements, ability to monitor and control the process
[27]. Hence, biosensors have many applications in life such as diagnosis, food
technology, biotechnology, genetic engineering, environmental monitoring etc. [28]. A
biosensor includes mainly two parts: a biological detection element and a transducer.
The biological component in the construction system can be catalytic or non-catalytic.
The catalytic groups consist of enzymes, tissues and microorganisms; whereas the non-
catalytic groups have antibodies, nucleic acids and receptors. The second part, a
transducer, is required to convert the biological signal into the understandable signal.
Several transducer are used to fabricate the biosensor such as electrochemical
(conductometric, potentiometric and amperometric), optical, colorimetric and acoustic
etc [29]. According to transducer types and biological detection element types,
biosensors are categorized, illustrated in Figure 1.6.
Figure 1.6. Simple representation of a biosensor
13
1.2.1. Electrochemical Biosensors
The transducer of a sensor is used to transmit the biochemical information to an
understandable signal, designating selectivity or specificity of the sensor. Suitable
transducer system is adjusted according to the nature of biochemical interaction with
the specific analyte [30]. There are various types of transducers: electrochemical
(conductometric, potentiometric and amperometric), optical, colorimetric and acoustic
etc.
In case of electrochemical transducers, electrochemical transducers are used for
construction of a biosensor, which can be chosen as conducting, semiconducting, ionic
conducting material to coat the electrode with the biological receptor. The working
principle of electrochemical biosensors is that an electrochemical species is consumed
or produced during the biological reaction, while the electrochemical signal is recorded
using an electrochemical detector [31]. Combination of analytical power of
electrochemical techniques and specific selectivity of biological recognition element
lead to an effective electrochemical biosensor, presenting simple to handle, low cost
and fast detection process for a specified biological reaction [32].
Electrochemical techniques can be classified in three main subclasses depending on the
type of transducer: conductometric, potentiometric and amperometric biosensors.
1.2.1.1.Conductometric Biosensors
Conductometric biosensors detect the changes in the conductance as a consequence of
the biological element, designed by a two-electrode device. They are based on either
consumption or generation of charges species involved in the enzymatic reactions. The
change in charges species lead difference in ionic composition of the analytes [33].
14
1.2.1.2.Potentiometric Biosensors
The potentiometic biosensors are designed to measure the potentials at the working
electrode with respect to the reference electrode under no current flow [34]. They
monitor electric potential related to ion concentration in the system created by selective
binding of the electrode. They are based on ion-selective electrodes (ISE) and ion-
selective field effect transistors (ISFET). For instance, the electrode senses the change
in electrode potential and determines several ions like Na+, Ca
2+ or NH4
+ in the reaction
matrix, resulting from the enzymatic reaction while the ions accumulate and bind to a
suitable ion selective membrane [31].
1.2.1.3.Amperometric Biosensors
Amperometric electrochemical biosensor has attracted great interest for biosensor
construction compared to the others since amperometric detection is a useful technique
for substrate analysis because of its selectivity, sensitivity, rapid response, ease of
construction and reproducible performance [35].
Amperometric biosensors measure the differences in the current on the working
electrode upon applied constant potential, created by oxidation or reduction of species
in the sensing matrix during biological reaction. Therefore, the reaction generates the
current change, monitoring as a function of time and the current change is related to the
amount of analytes in the reaction solution.
In the amperometric detection, the electron transfer between the catalytic molecule and
the electrode surface occurs where oxidation or reduction reactions are involved. Thus,
the transducer surface is one of the most important factors affecting the functioning of
amperometric biosensors. They are generally modified with mediators or conducting

15
polymers [26]. Furthermore, maintaining the applied voltage is very important to
perform the process. For this purpose, a reference electrode is introduced to keep the
potential stable. This leads to the improvement of repeatability of the electrochemical
reaction. That is why the amperometric electrodes are preferred owing to their high
sensitivity, rapidness in signal processing and better selectivity. Also, the most valuable
reason for being pioneering place in biosensing applications is simple construction
systems.
In 1962, Clark and Lyons developed the first amperometric type enzyme electrode [36].
They used glucose oxidase as the biomaterial. The basic setup is based on recording
either production of H2O2 or consumption of O2 during enzymatic reaction occurs. It
involves a platinum cathode where oxygen is reduced and a Ag/AgCl reference
electrode. Upon application of -0.68 V to the cathode, a current proportional to the
oxygen concentration in the reaction medium is recorded. The decisive reduction of
oxygen results in the diminishing of oxygen concentration. Thus, the rate of this
electrochemical reaction is strongly related to the rate of diffusion of oxygen from the
bulk solution [37]. Hence, during the catalytic reaction, the reduction of the diffused
oxygen concentration is detected following the current change due to the formation of
new equilibrium in the reaction medium. Also, since the consumed oxygen
concentration is proportional to the consumed substrate concentration, the current
change determines the analyte concentration. However, the other electrochemical
electrodes used equilibrium conditions to detect the changes in the reaction medium.
Among them, the amperometric constructions are sensitive to changes than the other
electrochemical electrodes.
Another approach to construct an amperometric biosensor is to follow the current
change upon applied +0.68 V potential to the cathode. The production of hydrogen
peroxide is measured relative to the reference electrode, known as hydrogen peroxide
electrode. However, the applied potential is much higher than the oxygen electrode. The
selectivity and efficiency of the biosensor may not be good enough since electroactive

16
species in the reaction medium can interfere. For example, a glucose biosensor is
designed to measure glucose concentration in human blood. The samples have several
oxidative species like ascorbic acid, paracetamol or uric acid. By applying high
potential to the reaction cell, these species may activated and cause change in results.
This limitation can be overcome by choosing the working potential as low as possible
[38].
After the first enzyme based amperometric biosensor was fabricated, enzymes are
widely used as a significant tool in biosensing study [39]. Such devices are used to
develop efficient biosensing designs by combining the properties of the enzyme
specificity to recognize a specific analyte and the direct transfer of the biocatalytic
reaction rate.
There are three generations of amperometric biosensors depending on the level of
integration, as shown in Figure 1.7. In the first generation, the biorecognition element is
fixed onto the transducer surface via bounding or entrapment in a membrane. The
product of the biological reaction during the analysis diffuses to the transducer and
electrical response is recorded. Although this type of biosensor is simple and easily
constructed, possible analytes in the sensing system which coexist in the real samples
may interfere the analytical response, causing poor selectivity. The second generation
includes “mediators” between the receptor and transducer to obtain improved signals. A
redox reaction occurs during the enzymatic reaction that is reoxidized by the mediator.
Then, the mediator is oxidized at the electrode. The process results in improved
selectivity as using artificial mediators eliminate the interference effect, resulting in
improved selectivity. In the case of third generation system, there is a direct binding
between the biocatalyst and the transducer in order to facilitate direct communication
without addition of promoters or mediators. The catalytic reactions cause the biosensor
response. At this time, any product or mediator do not diffuse directly to the system.
Although addition of mediator can improve the selectivity, easy leakage of the
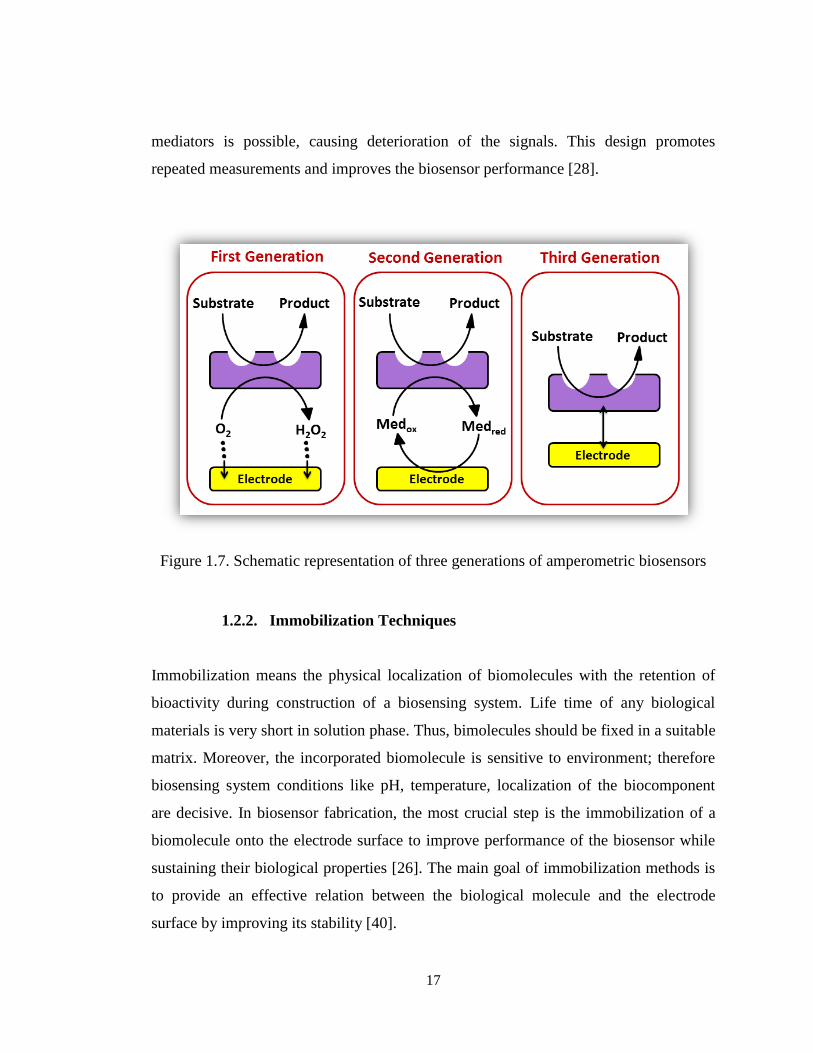
17
mediators is possible, causing deterioration of the signals. This design promotes
repeated measurements and improves the biosensor performance [28].
Figure 1.7. Schematic representation of three generations of amperometric biosensors
1.2.2. Immobilization Techniques
Immobilization means the physical localization of biomolecules with the retention of
bioactivity during construction of a biosensing system. Life time of any biological
materials is very short in solution phase. Thus, bimolecules should be fixed in a suitable
matrix. Moreover, the incorporated biomolecule is sensitive to environment; therefore
biosensing system conditions like pH, temperature, localization of the biocomponent
are decisive. In biosensor fabrication, the most crucial step is the immobilization of a
biomolecule onto the electrode surface to improve performance of the biosensor while
sustaining their biological properties [26]. The main goal of immobilization methods is
to provide an effective relation between the biological molecule and the electrode
surface by improving its stability [40].

18
In order to maintain enzyme stability, increase shelf life of biosensor and reduce the
time of enzymatic response, various immobilization methods have been developed [28].
For efficient deposition of a biomolecule, there are few pre-requisites; (1) efficient and
stable way of immobilization of enzymes on the surface, (2) biomolecule must not lose
its biological property, (3) it should form compatible and inert microenvironment
towards host structure and (4) it should be available during immobilization procedure
[41]. Hence, several techniques illustrated in Table 1.1 are developed to immobilize the
biomaterial providing a suitable environment.
Table 1.1. Immobilization procedures
Method Advantages Disadvantages
Physical
Adsroption
Little or no damage to
enzyme
Simple and cheap
No chemical changes to
support or biocatalyst
Interactions are affected
by changing the
conditions in reaction
matrix
Entrampment Simple and easy.
Only physical confinement
of enzyme near transducer
Speed of one-step procedure
Diffusional restrictions
Long response time
Covalent bonding Leaching out of the enzyme
are reduced
Long life time
High operational stability
Excess attachment may
cause denaturation
19
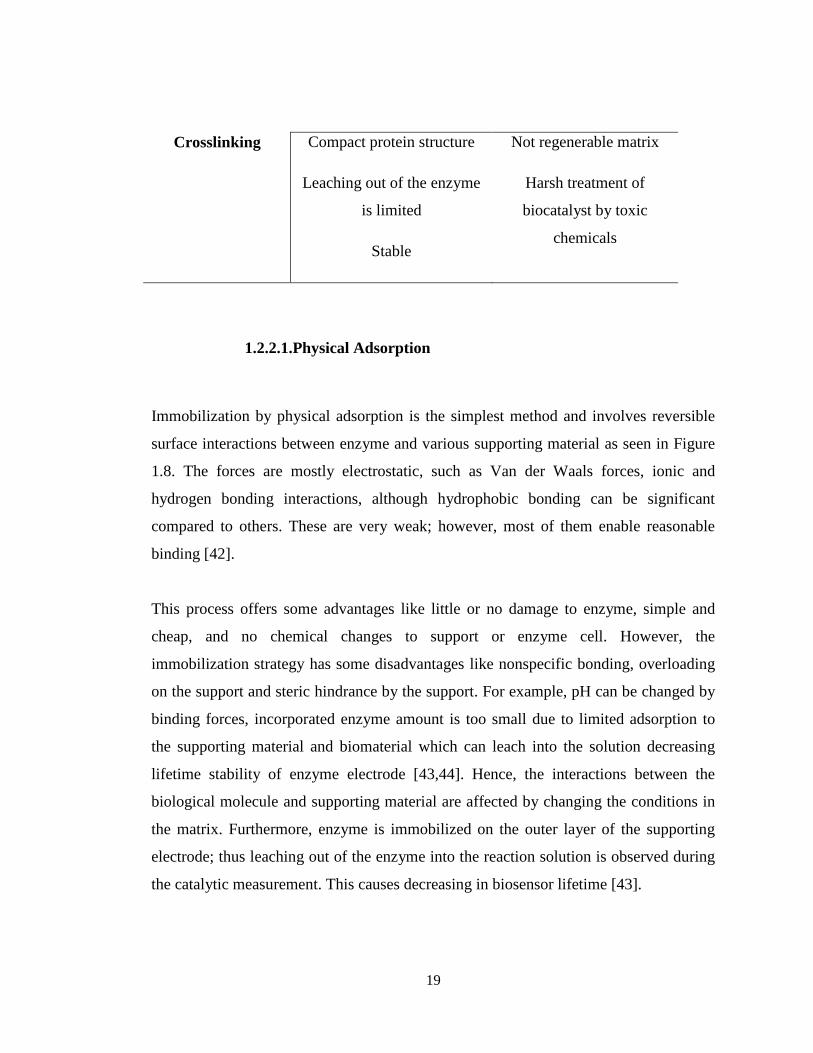
Crosslinking Compact protein structure
Leaching out of the enzyme
is limited
Stable
Not regenerable matrix
Harsh treatment of
biocatalyst by toxic
chemicals
1.2.2.1.Physical Adsorption
Immobilization by physical adsorption is the simplest method and involves reversible
surface interactions between enzyme and various supporting material as seen in Figure
1.8. The forces are mostly electrostatic, such as Van der Waals forces, ionic and
hydrogen bonding interactions, although hydrophobic bonding can be significant
compared to others. These are very weak; however, most of them enable reasonable
binding [42].
This process offers some advantages like little or no damage to enzyme, simple and
cheap, and no chemical changes to support or enzyme cell. However, the
immobilization strategy has some disadvantages like nonspecific bonding, overloading
on the support and steric hindrance by the support. For example, pH can be changed by
binding forces, incorporated enzyme amount is too small due to limited adsorption to
the supporting material and biomaterial which can leach into the solution decreasing
lifetime stability of enzyme electrode [43,44]. Hence, the interactions between the
biological molecule and supporting material are affected by changing the conditions in
the matrix. Furthermore, enzyme is immobilized on the outer layer of the supporting
electrode; thus leaching out of the enzyme into the reaction solution is observed during
the catalytic measurement. This causes decreasing in biosensor lifetime [43].
20
Figure 1.8. Schematic representation of physical adsorption method
1.2.2.2.Entrapment
Entrapment is achieved by fixing biological materials into three-dimensional network
on the surface of the electrode. The entrapment strategy was first carried out for enzyme
immobilization in 1963 [45]. The immobilization technique is quite simple and easy.
After the biomolecule was dissolved in a solution in the presence of some chemicals, it
is caged into a network so that the desired phase is formed [46]. It differs from the other
immobilization methods since the biomolecule does not bind directly to the
immobilization matrix. This network can be polymer [47], dialysis membrane [48], sol-
gel encapsulation [49], biological matrices [50] etc. A representative scheme for
entrapment immobilization method is shown in Figure 1.9.
Biological molecules, additives or mediators can be entrapped simultaneously on the
immobilization layer. Modification of biomolecule is not needed to retain the activity of
the molecule. This leads high operational stability. Additionally, the major advantage of
the method is that the biomolecules are immobilized via simple one-step procedure [51].
However, the major drawbacks of this immobilization method are diffusional
restrictions and long response time due to the accessibility of entrapped biomolecules.
The pore size of the network should be sufficient enough to facilitate the diffusion of
substrates and products since the biomolecule is entrapped within a network [46,52].

21
Figure 1.9. Schematic representation of entrapment method
1.2.2.3.Covalent Bonding
The most popular attachment strategy is covalent immobilization owing to its numerous
advantages [53]. The method involves formation of covalent bonding using activated
functional groups on the support materials like NH2, COOH with the enzyme as seen in
Figure 1.10 [42].
Covalent binding between the enzyme and the support matrix is preferred to construct
long life time and high operational stability of enzyme based biosensors. Several
problems in the other immobilization techniques can be overcome due to the robust
covalent bond formation during localization of enzyme onto the electrode. With this
technique, the diffusion limitations, leaching out of the enzyme are reduced. Besides,
the method facilitates high enzyme stability [28].
Following two sequential step procedure, covalent attachment is achieved. The
supporting surface is first functionalized via several techniques like coating the
22
electrode with a functional polymer [54], incorporation of functional nanomaterials [55],
formation of self-assembled monolayers (SAM) [56] or addition of sol-gel composites
[57]. Then, biomolecule is introduced to the prepared support material. At this stage,
biomolecule forms a covalent binding on the electrode surface using linkers. An
enzyme structure contains free amino and carboxylic acid groups. These groups are free
to attach to the functionalized electrode surface covalently with the help of activation
agents used for the covalent attachment.
In this strategy, the major drawback is that excess attachment of the enzyme with the
functional surface matrix may cause denaturation, resulting in bioactivity loss and
instable biosensor construction [58]. However, optimization of the sensing system at
each step is possible due that immobilization takes place only on the outer surface of
the supporting material in order to obtain the most sensitive microenvironment for
enzyme molecules [59].
Figure 1.10. Schematic representation of (a) covalent immobilization method
1.2.2.4.Intermolecular Crosslinking
Biomolecules form crosslinked or covalent bond with the support material via
crosslinking as illustrated in Figure 1.11 [60]. Biomolecules can attach to the support

23
matrix or within itself. There are several proteins used to crosslink the biomolecules
like bovine serum albumin (BSA), glutaraldehyde (GA) or carbodiimide. With this
method, compact protein structure is achieved and leaching out of the enzyme is limited
as well as response time is reduced. However, a high degree of crosslinking can be a
problem since intermolecular crosslinking is difficult to control, resulting in the loss of
activity. Although, the constructed biosensor presents a good operational and storage
stability, taking these advantages of the method, it is crucial to determine the optimum
amount of crosslinker for the designed biosensing system.
Figure 1.11. Schematic representation of intermolecular crosslinking immobilization
method
1.2.3. Applications of Biosensors
The biosensor technology has attracted great interest due to its many important
applications. The new developed techniques also have advantages over conventional
laboratory based assays. The conventional methods are time consuming, expensive,
required well trained personnel and not used for real time measurements. Nevertheless,
biosensors are inexpensive, portable with minimized design, easy to handle, selective

24
and sensitive. A wide variety of application field of modern biosensors is listed in
Table 1.2.
Table 1.2. Applications of biosensors
Field Applications
Health care Drug screening
Analysis of glucose, alcohol, chloresterol etc. and
hormone
Diagnosis of genetic diseases
Markers of diseases
Detection of species in growing cells
Environmental monitoring Water and soil analysis
Detection of pesticides and other toxic substances
Waste water analysis
Bacterial and viral analysis
Food and drink analysis Food freshness
Detection of glucose content in beverages
Analysis of cholesterol in butter
Food components of sugars
Pathonegic organisms test
25
Defense and military
applications
Detection of biological warfare agents
Quantification of organophosphorous nerve agents
1.2.4. Glucose Biosensors
Diabetes has become one of the world wide health concerns, causing death and
disability. The number of people suffering from diabetes was 200 million nowadays. It
is expected to rise to 366 million in 2030 [61]. Diabetes is abnormality in the level of
insulin in human body. Insulin is a hormone which converts the sugar existing in human
body into energy. When glucose level is above a certain value in human blood, urgent
consideration must be required. Hence, monitoring glucose level and maintaining
blood glucose levels to normal values is very crucial for diabetic diagnosis.
In the last decades, effective glucose monitoring biosensors has been developing [62].
Glucose oxidase (GOx, β-D-glucose:oxygen 1-oxidoreductase; EC 1.1.3.4 ) is widely
employed in construction of glucose biosensors. GOx is flavoprotein, containing two
tightly bounded flavine adenine dinucleotide redox centers . The redox centers lead
electron transfer during the enzymatic reaction. GOx from Aspergillus niger catalyzes
the oxidation of β-glucose to D-glucono-δ-lactone in the presence of molecular oxygen
which subsequently is hydrolyzed into gluconic acid non-enzymatically and hydrogen
peroxide, spontaneously [63] (Figure 1.12).
26
Figure 1.12. Representation of Reaction mechanism of glucose oxidase
1.2.5. Conducting Polymers in Biosensing Design
Conducting polymers have attracted great interest throughout the world owing to their
physical and chemical properties. They can be preferred to enhance sensitivity, speed
and stability in biosensor design as a suitable matrix of biologic molecules for different
purposes like medical diagnostics, environmental monitoring etc. [64]. Conjugated
polymers are promising materials for biosensor construction due to several advantages:
CPs provide simplicity and high reproducibility in fabrication of biosensor [26].
CPs are able to transfer electrical charge produced by the enzymatic reaction.
Since electrons can move freely on the conjugated π electron backbones [28],
accelerated electron transfer is achieved. By this way, using CP in biosensor
construction enhances the electrocatalytic properties of biomolecules; thus,
27
promotes rapid electron transfer and direct communication between the
transducer and the biomolecule. [59,65].
CPs as immobilization platforms offer extensive stability of enzymes on the
electrode surface [66]. In an enzymatic biosensor, it is crucial to immobilize
enzyme molecules onto the substrate stable and for long-term without activity
lost. For this reason, conducting polymers are excellent materials with their
structure, electronic character and compatibility.
CPs are deposited on the electrode surface during electrochemical synthesis.
Whatever surface properties are, the electrodes can be coated with the
conducting polymers by arranging thickness of the film upon demand [67].
Besides, it is possible to produce CPs at room temperature electrochemically
which is very crucial for biomolecules [51].
CPs have organized structures on electrode surfaces, created a three dimensional
matrix onto the electrode surface for efficient deposition of the enzymes. This
leads retaining the enzyme activity for a long time [68,69].
CPs allow the structural and electronic modifications of various surfaces to be
used as immobilization matrices for biomolecules [70]. They can be
functionalized upon interest and used for various kinds of purposes. The
polymer structure can be tuned by according to the properties of resultant
materials and widely applied in the construction of biomedical devices. They
can be functionalized and used in covalent immobilization technique to achieve
a stronger biosensor construction. Besides, electronic and mechanical properties
can be also altered chemical modeling or synthesis. For instance, a polymer
which has characteristics of hydrophobicity can be modified by introducing
hydrophilic groups. As a result, the hydrophilic groups bring the highest
interaction with biological materials whereas the former one has not.

28
CPs are used to produce sensitive and reproducible microenvironment for
biological reactions to mimic the naturally occurring environment of biological
molecules.
1.2.6. Nanostructures in Biosensing Design
In recent years, the design of electrochemical biosensors with nanostructures has
received great attention to provide better analytical properties in terms of sensitivity,
selectivity and reliability [71]. Nanomaterials exhibit remarkable properties and due to
the constantly growing demand for high and long-term efficiency in every kind of
research, nanomaterials are always preferred due to their distinct properties [72-74].
The introduction of nanomaterials into conducting polymers attracted attention in
material science since both production of nanostructures and conducting polymer is
simple and easy to fabricate [75,76]. The effect due to the combination of these two
valuable materials brings many advantages such as enhanced conductivity [77].
Furthermore, introduction of nanomaterials can also provide substantial electronic
interaction with the polymer which improves the charge transfer. Besides, the charge
can be travel along the conducting polymer chain and transferred to the desired
positions via nanostructures bringing on an improved electronic activity of the material
[78].
Nanostructures are extensively used in the fabrication of electrochemical biosensors to
get a combination of suitable immobilization method and support material. There are
various types of nanomaterials; however, in this context, the use of clay nanocomposite
and gold nanoparticles incorporated in conducting polymer as an immobilization
platform for the construction of different glucose biosensors is mentioned.

29
Modification of the electrode surfaces with clay is one of the convenient ways to
improve the analytical characteristics and long-term stability of biosensors due to their
ion exchange capability, well defined layered structure and large surface area [79-81].
Additionally, clay modified matrices have been used in biosensor fabrication to assure
the retention of activity and functionality of enzymes after immobilization. There are
several types of clay minerals and their related layered structures: laponite,
montmorillonite, nontronite and layered double hydroxides [82]. Specially, laponite,
cationic clay, is used as a matrix for biomolecules deposition improving performance of
the biosensors to immobilize several redox biomolecules. Laponite is manufactured
from abundant inorganic mineral sources and has a chemical composition analogous to
that of naturally occurring smectite clay minerals. It is also used as a film forming agent
to produce electrically conductive, antistatic and barrier coatings. Its porous structure
provides high hydrophilic property [83]. However, hydrophilicity of the clay makes the
clay less compatible with the organic polymers. Thus, various polymer/clay
nanomaterials are prepared to make the organic clays compatible with the polymers.
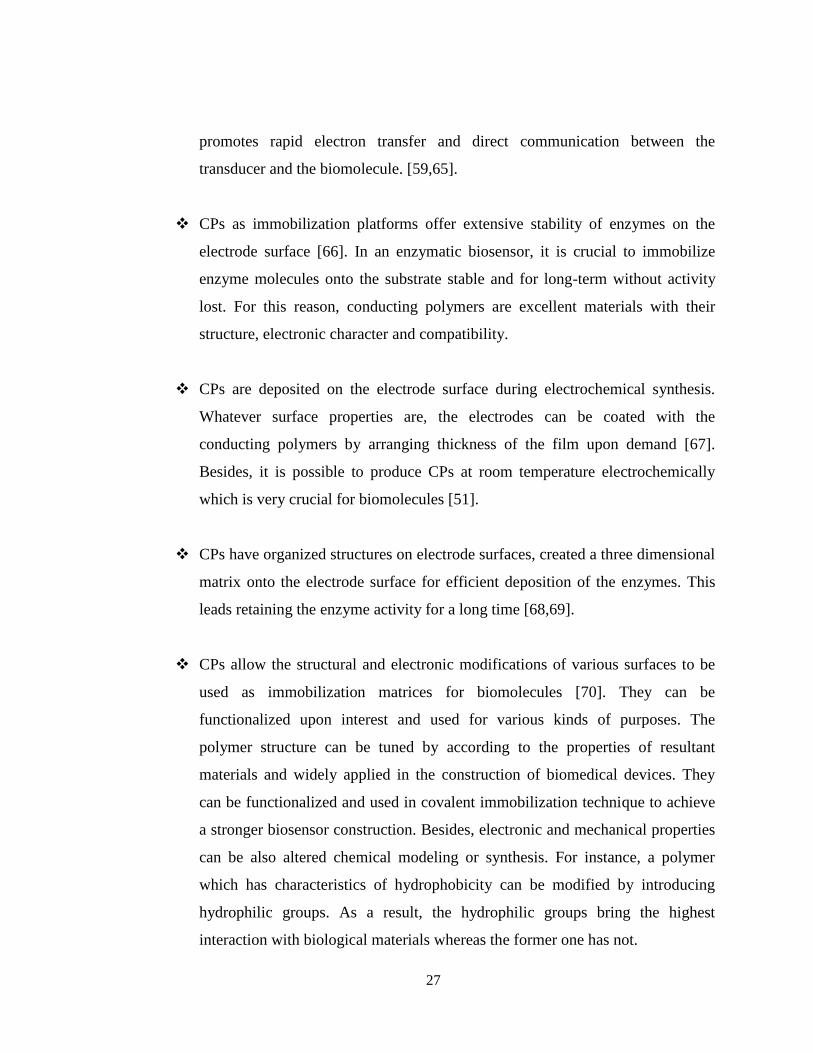
Hence, the preparation of polymer/clay nanocomposite (Figure 1.13) material ends up
with enhanced compatibility with the organic polymers, namely conducting polymers.
These composites have used in many applications owing to their unique structures.
They exhibit better properties than virgin polymers or clay materials [84]. Taking the
advantage of clay nanocomposite for its high chemical stability, well adsorption
capacity, high surface area and intercalation property [85], clay-modified biosensors
exhibit good stability and efficiency [83,86-88].
30
Figure 1.13. Representation of clay and polymer/clay nanocomposite
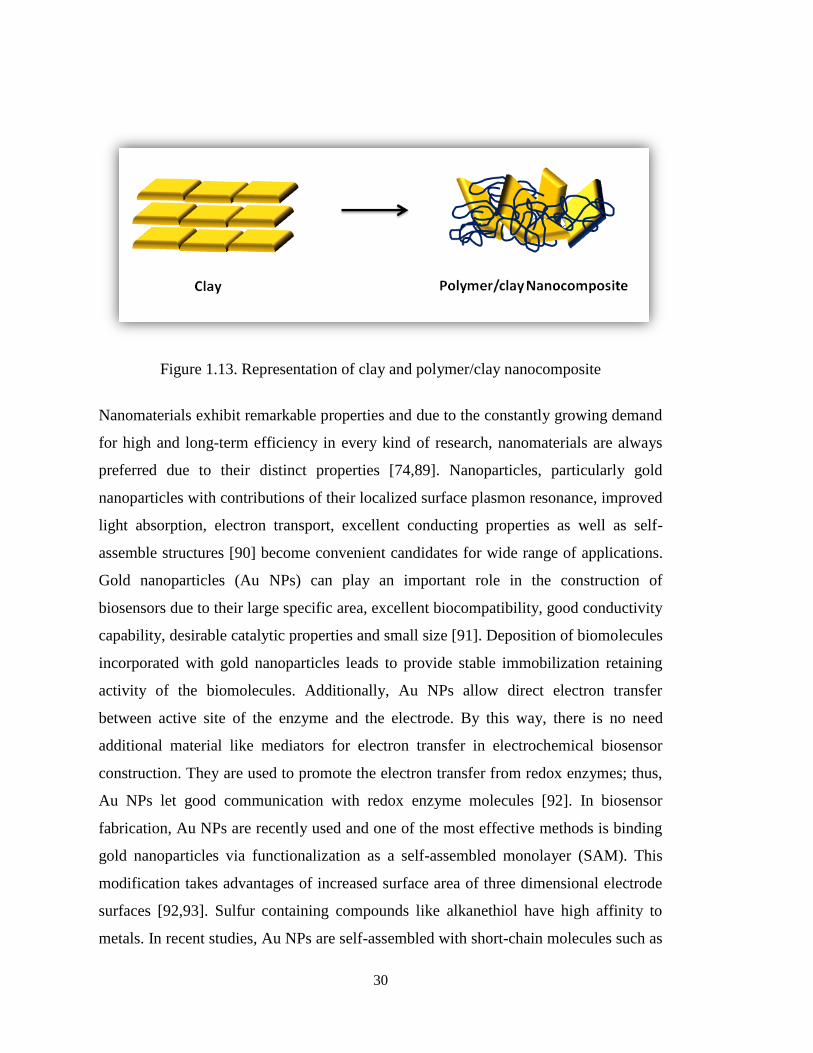
Nanomaterials exhibit remarkable properties and due to the constantly growing demand
for high and long-term efficiency in every kind of research, nanomaterials are always
preferred due to their distinct properties [74,89]. Nanoparticles, particularly gold
nanoparticles with contributions of their localized surface plasmon resonance, improved
light absorption, electron transport, excellent conducting properties as well as self-
assemble structures [90] become convenient candidates for wide range of applications.
Gold nanoparticles (Au NPs) can play an important role in the construction of
biosensors due to their large specific area, excellent biocompatibility, good conductivity
capability, desirable catalytic properties and small size [91]. Deposition of biomolecules
incorporated with gold nanoparticles leads to provide stable immobilization retaining
activity of the biomolecules. Additionally, Au NPs allow direct electron transfer
between active site of the enzyme and the electrode. By this way, there is no need
additional material like mediators for electron transfer in electrochemical biosensor
construction. They are used to promote the electron transfer from redox enzymes; thus,
Au NPs let good communication with redox enzyme molecules [92]. In biosensor
fabrication, Au NPs are recently used and one of the most effective methods is binding
gold nanoparticles via functionalization as a self-assembled monolayer (SAM). This
modification takes advantages of increased surface area of three dimensional electrode
surfaces [92,93]. Sulfur containing compounds like alkanethiol have high affinity to
metals. In recent studies, Au NPs are self-assembled with short-chain molecules such as

31
cysteamine (Cyst) and 3-mercaptopropionic acid (MPA) [94]. Biosensors fabricated
with SAM technique can possess high sensitivity and short response time. MPA is a
bifunctional molecule containing both thiol and carboxylic acid functional groups. The
thiol groups serve as binding sites for covalent attachment of MPA to Au NPs (Figure
1.14). Moreover, the carboxylic acid groups can further react covalently with amino
groups of a functional material and also with the enzyme molecules in order to achieve
effective immobilization and increase lifetime stability [28].
Figure 1.14. Representation of self-assembled gold nanoparticles functionalized with
MPA

32
33
CHAPTER 2
EXPERIMENTAL
2.1.Materials
Glucose oxidase (GOx, β-D-glucose: Oxygen 1-oxidoreductase, EC 1.1.3.4, 47200
units/g) from Aspergillus niger, D-glucose, 3-mercaptopropionic acid (MPA) and
glutaraldehyde (GA) (50 wt. % solution in water) were purchased from Sigma (St.
Louis, USA; www.sigmaaldrich.com). N-Hydroxysuccinimide (NHS) and N-(3-
dimethylaminopropyl)-N’-ethylcarbodiimide hydrochloride (EDC) were purchased
from Fluka (Buchs, Switzerland) and Sigma, respectively. Dichloromethane (DCM),
acetonitrile (ACN), sodium hydroxide was obtained from Merck (Darmstadt, Germany;
www.merck.com). Tetrabutylammonium hexafluorophosphate (TBAPF6) was supplied
by Aldrich. All chemicals for the synthesis of monomer were purchased from Aldrich
except tetrahydrofuran (THF) which was obtained from Acros (Geel, Belgium,
www.acros.com). All other chemicals were analytical grade.
Spectrophotometric enzyme assay kit for glucose measurements HUMAN 10260,
Glucose Liquicolor (Wiesbaden, Germany) was used to determine reliability of the
biosensor. Column chromatography of all products was performed using Merck Silica
Gel 60 (particle size: 0.040–0.063 mm, 230–400 mesh ASTM). All reactions were
carried out under argon atmosphere unless otherwise mentioned.
34
2.2.Instrumentations
2.2.1. Electrochemical measurements
For the amperometric studies and cyclic voltammetry measurements Ivium CompactStat
potentiostat (Ivium Technologies, The Netherlands) and Palm Instrument (PalmSens,
Houten, The Netherlands) were used. All electrochemical measurements were
performed in a three-electrode cell consisting of a graphite electrode (Ringsdorff Werke
GmbH, Bonn, Germany, type RW001, 3.05 mm diameter and 13 % porosity) as the
working electrode, a platinum (Pt) wire as the counter electrode and a silver (Ag) wire
as the reference electrode.
2.2.2. Characterization studies
2.2.2.1.Nuclear Magnetic Resonance Spectrometer (NMR)
1H NMR and
13C NMR spectra were recorded in CDCl3 on Bruker Spectrospin Avance
DPX-400 spectrometer and chemical shifts (d) were given relative to tetramethyl silane.
2.2.2.2.High Resolution Mass Spectrometer (HRMS)
A Waters Synapt MS System HRMS confirm the structures by measuring on the exact
molecular weight of the target molecules.

35
2.2.2.3.Scanning electron microscope (SEM)
JEOL JSM-6400 model scanning electron microscope was used for surface imaging and
characterization studies of the electrode surfaces after successive modification
procedures.
2.2.2.4.Fluorescence microscope
Epifluorescence microscope (Olympus, Tokyo, Japan) was used for surface imagining
for both conducting polymer coated graphite electrode and
biomolecules/nanocomposite immobilized enzyme electrode, taking advantage of
fluorescent character of conducting polymer and enzyme.
2.2.2.5.Transmission electron microscope (TEM)
FEI Tecnai G2 Spirit BioTwin Transmission electron microscope was used to depict
changes in the morphology of gold nanoparticles and functionalized gold nanoparticles.
2.2.2.6.X-ray photoelectron spectroscope (XPS)
XPS was performed on a PHI 5000 Versa Probe (FULVAC-PHI, Inc., Japan/USA)
model X-ray photoelectron spectrometer instrument with monochromatized Al Kα
radiation (1486.6 eV) as an X-ray anode at 24.9 W.

36
2.2.2.7.UV-vis-NIR spectrophotometer
Varian Cary 5000 UV-vis-NIR spectrophotometer was used to perform the
characterization studies of the nanoparticles.
2.2.2.8.Fourier Transform Infrared Spectrophotometry
(FTIR)
FTIR spectra were recorded on a Varian 1000 FTIR spectrometer to investigate
functional groups after successive layer formation onto the graphite electrode surface.
2.3.Synthesis of the Monomer
Synthesis and characterization of the monomer, BEDOA-6, were carried out according
to a previously described method [95]. Figure 2.1 represents synthetic route to BEDOA-
6.
1H-benzo[d][1,2,3]triazole, potassium tert-butoxide and 1,6-dibromohexane were
reacted to obtain 2-(6-bromohexyl)-2H-benzo[d][1,2,3] triazole as a colorless oil. The
product, 2-(6-bromohexyl)-2H-benzo[d][1,2,3] triazole, an aqueous HBr solution and
bromine was used to obtain 4,7-dibromo-2-(6-bromohexyl)-2H- benzo[d][1,2,3] triazole
was obtained as light yellow oil. For stannylation of 2,3-dihydrothieno[3,4-
b][1,4]dioxine, at -78 °C, under argon atmosphere, to a solution of 3,4-
Ethylenedioxythiophene (EDOT) and THF, n-butyl lithium was added slowly. Then,
tributyltin chloride was added very slowly. 4,7-Dibromo-2-(6-bromohexyl)-2H-
benzo[d][1,2,3] triazole and tributyl(2,3-dihydrothieno[3,4-b][1,4]dioxin-5-yl)stannane
were dissolved in anhydrous THF) and dichlorobis(triphenylphosphine)-palladium(II)

37
was added at room temperature to synthesize 2-(6-bromohexyl)-4,7-bis(2,3-
dihydrothieno[3,4-b][1,4]dioxin 5-yl)-2H-benzo[d][1,2,3]triazole. A mixture of 2-(6-
bromohexyl)-4,7-bis(2,3-dihydrothieno[3,4-b][1,4]dioxin-5-yl)-2H-
benzo[d][1,2,3]triazole and potassium phthalimide in DMF was allowed to get 2-(6-
(4,7-bis(2,3-dihydrothieno[3,4-b][1,4]dioxin-5-yl)-2H-benzo[d][1,2,3]triazol-2-
yl)hexyl)isoindoline-1,3-dione as a yellow solid. To a solution of 2-(6-(4,7-bis(2,3-
dihydrothieno[3,4-b][1,4]dioxin-5-yl)-2H-benzo[d][1,2,3]triazol-2-
yl)hexyl)isoindoline-1,3-dione in ethanol, hydrazine monohydrate was used to obtain
the taget compound -6-(4,7-bis(2,3-dihydrothieno[3,4-b][1,4]dioxin-5-yl)-2H-
benzo[d][1,2,3]triazol-2-yl)hexan-1-amine (BEDOA-6).
1H NMR (400 MHz, CDCl3): δ (ppm) 8.05 (s, 2H), 6.41 (s, 2H), 4.72 (t, J=7.1 Hz, 2H),
4.23 (m, 4H), 4.20 (m, 4H), 2.58 (t, J=6.5, 2H), 2.51 (b, 2H), 1.42-1.28 (m, 8H).
13C NMR (100 MHz, CDCl3): δ (ppm) 140.3, 138.0, 122.2, 119.7, 116.5, 112.6, 99.2,
63.5, 63.0, 55.1, 40.6, 32.1, 28.5, 25.0, 24.8. HRMS: Calculated [M]+ 499.1474,
Measured [M]+ 499.1459

38
Figure 2.1. Synthetic route to BEDOA-6
2.4.Electrochemical Polymerization of the Monomer
Spectroscopic grade graphite rods were polished on an emery paper and washed
thoroughly with distilled water. In order to achieve electrochemical polymerization and
film deposition, the monomer was subjected to cyclic voltammetry (CV) in DCM
solution containing 0.1 M TBAPF6 as the supporting electrolyte. Repeated potential-
scan electropolymerization of 0.01 M monomer in 0.1 M TBAPF6/DCM solvent-
electrolyte couple on the graphite electrode was performed at a scan rate of 100 mV/s.

39
2.5.Construction of Biosensors
2.5.1. PMMA/laponite nanocomposite/ poly(BEDOA-6)/GOx
Biosensor
For the immobilization of enzyme, the nanocomposite (laponite and poly(methyl
methacrylate) (PMMA)) solution was used. 4 mg clay-laponite was stirred in 5 mL
distilled water for 2.5 days at 1000 rpm. Then, a proper amount of GOx solution (2.5
mg GOx in 5 µL 50 mM sodium phosphate buffer, pH 7.0) was mixed with clay
dispersion solution (3 µL clay-water dispersion). This solutions were spread over the
polymer coated electrodes and glutaraldehyde solution (5 µL 1% GA, in 50 mM sodium
phosphate buffer, pH 7.0) was then added as cross-linker and the electrodes were
allowed to stand at ambient conditions to dry for 120 min. After the immobilization, the
electrode surface was washed with water and the prepared electrode was stored at + 4
ᵒC overnight. Figure 2.2 illustrates the preparation for the proposed sensing system.
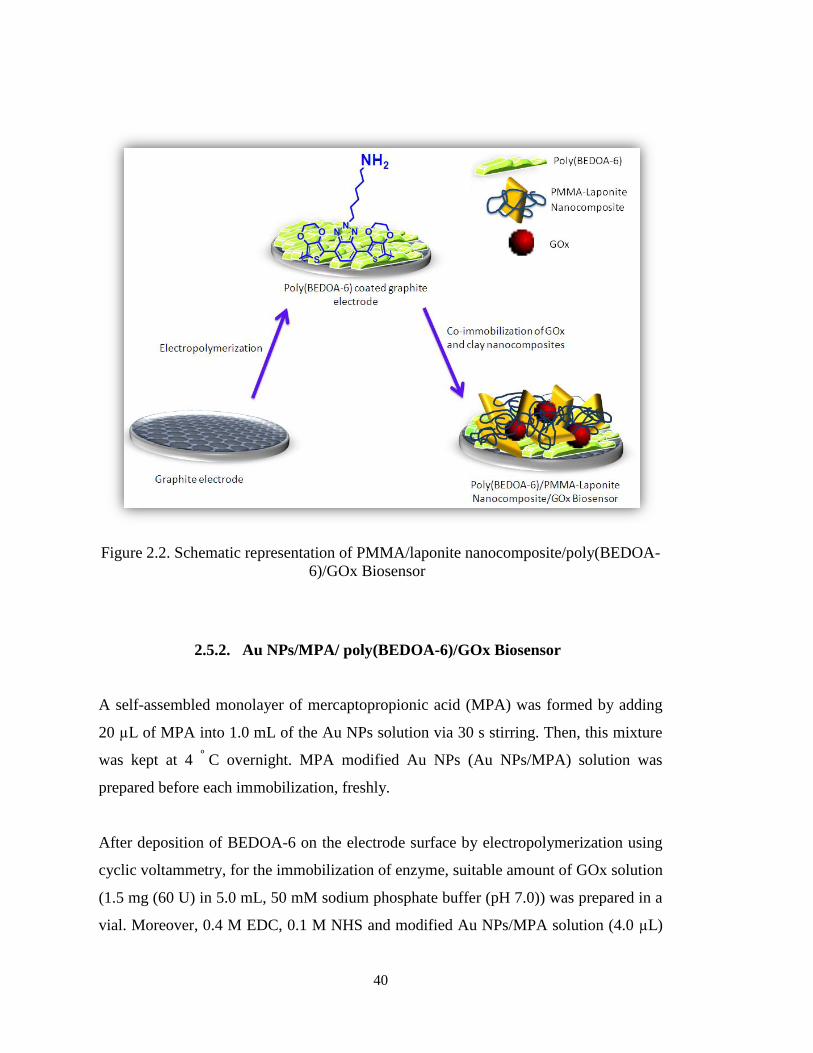
40
Figure 2.2. Schematic representation of PMMA/laponite nanocomposite/poly(BEDOA-
6)/GOx Biosensor
2.5.2. Au NPs/MPA/ poly(BEDOA-6)/GOx Biosensor
A self-assembled monolayer of mercaptopropionic acid (MPA) was formed by adding
20 µL of MPA into 1.0 mL of the Au NPs solution via 30 s stirring. Then, this mixture
was kept at 4 ᵒ
C overnight. MPA modified Au NPs (Au NPs/MPA) solution was
prepared before each immobilization, freshly.
After deposition of BEDOA-6 on the electrode surface by electropolymerization using
cyclic voltammetry, for the immobilization of enzyme, suitable amount of GOx solution
(1.5 mg (60 U) in 5.0 mL, 50 mM sodium phosphate buffer (pH 7.0)) was prepared in a
vial. Moreover, 0.4 M EDC, 0.1 M NHS and modified Au NPs/MPA solution (4.0 µL)

41
were mixed in a separate vial and kept at room temperature for 20 min where
crosslinking agents activated the carboxylic acid moieties of the reagents. Enzyme and
nanoparticle solutions were mixed homogeneously and spread over the polymer coated
electrode surface and the electrodes were allowed to stand at ambient conditions to dry
for 3 h. The enzyme electrodes were then rinsed with distilled water to remove unbound
enzyme. The electrodes were kept at 4 ᵒ
C overnight. The solutions were prepared
freshly prior to preparation of the biosensors. Figure 2.3 displays the procedure for the
construction of the proposed amperometric glucose biosensor.
Figure 2.3. Schematic representation of Au NPs/MPA/ poly(BEDOA-6)/GOx biosensor
2.6.Amperometric Measurements
All amperometric studies were performed in 10 mL buffer solution. In this method,
under constant potential, the current change due to the enzymatic reactions was
measured. After the three electrodes system was constructed, applied potential was
chosen as - 0.7 V since at that potential oxygen is reduced to hydrogen peroxide; as a
result, oxygen consumption can be monitored [96]. When the signal baseline reaches a
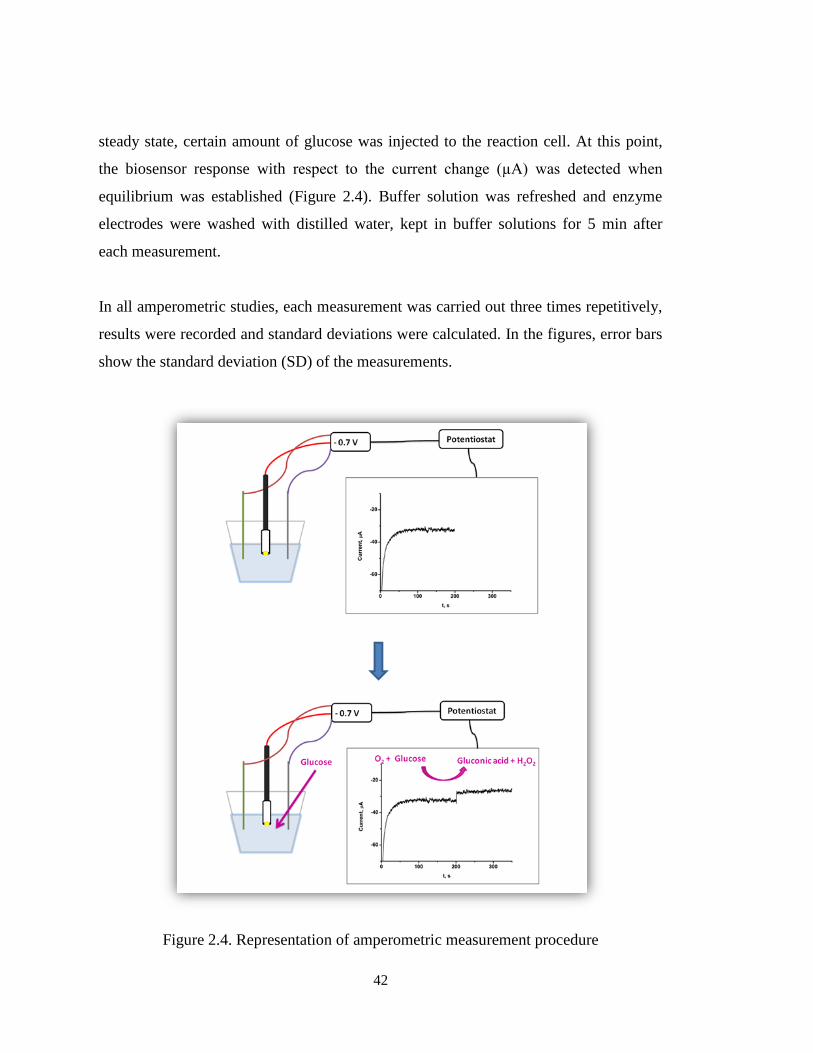
42
steady state, certain amount of glucose was injected to the reaction cell. At this point,
the biosensor response with respect to the current change (µA) was detected when
equilibrium was established (Figure 2.4). Buffer solution was refreshed and enzyme
electrodes were washed with distilled water, kept in buffer solutions for 5 min after
each measurement.
In all amperometric studies, each measurement was carried out three times repetitively,
results were recorded and standard deviations were calculated. In the figures, error bars
show the standard deviation (SD) of the measurements.
Figure 2.4. Representation of amperometric measurement procedure

43
2.7.Effect of nanostructure addition on biosensor responses
2.7.1. PMMA/laponite nanocomposite/ poly(BEDOA-6)/GOx
Biosensor
To prove the contribution of PMMA/laponite nanocomposite on poly(BEDOA-6)/GOx
biosensor response, two different electrodes were prepared with and without
nanocomposite while keeping the other ingredients in constant amount. Amperometric
measurements were carried out in a 10 mL 50 mM NaOAc buffer solution (pH 5.5) by
applying a constant potential of - 0.7 V. Changes in current were recorded upon glucose
addition as a substrate and calibration curves were drawn for these two different
electrodes.
2.7.2. Au NPs/MPA/ poly(BEDOA-6)/GOx Biosensor
In order to investigate the effect of Au NPs and modified Au NPs on the performance of
glucose biosensor, different biosensors were prepared with Au NPs and modified Au
NPs (Au NPs/MPA). This was also repeated in the absence of Au NPs just by keeping
the enzyme amount and polymer thickness constant.
2.8.Optimization of Biosensor Performance
2.8.1. Optimization of Conducting Polymer Thickness
Quality of the polymer film is affected by the duration of electropolymerization;
consequently, the properties like stability of the biosensor depend on film thickness.
The polymer layer thickness is directly related to scan number during the
electropolymerization. The thickness can be measured in terms of the charge passing
through the cell [97]. In order to detect the optimum thickness, polymers with different

44
thicknesses were deposited on the graphite working electrode with different number of
scans. After polymerization in different scan numbers, using same amount of reagents,
different biosensors were prepared and the amperometric responses to same amount of
glucose were recorded. The biosensor with optimum polymer layer thickness gives the
highest amperometric response. For further experimental steps, this optimum thickness
was selected.
2.8.2. Optimization of Enzyme Amount
In order to examine the relationship between enzyme amount and biosensor response,
different amounts of enzyme were used to construct different biosensors. Amperometric
responses were detected and compared. By keeping other parameters like polymer
thickness, pH and crosslinker amount constant, the optimum enzyme amount was
determined.
2.8.3. Effect of pH
Glucose oxidase is acidic (pI=4.2) and active over a wide range of pH values (pH 3.0–
8.0) [97]. Regarding the influence of the pH of working buffer on the amperometric
response of biosensors, pH dependence of the responses was investigated over a pH
range. Buffer solutions in different pH affect the enzyme activity. Thus, after
optimization of pH of working buffer solutions, the measurements were performed in
that working condition for further studies.
2.8.4. Optimization of Nanostructures Amounts
The amounts of nanostructures and the adsorbed glucose oxidase might influence the
biosensor response, and have an effect on the performance of the developed biosensor.
The effect of the composition of nanostructures on the biosensor response was

45
investigated. Amperometric responses of electrodes prepared with same amount of GOx
and different amounts of nanostructures were recorded to obtain the most effective
combination.
2.9.Analytical characterization of Biosensors
The analytical characteristics of the sensor were examined under optimized conditions
using glucose as the substrate. All the experiments were performed at ambient
conditions. Calibration curve was plotted with respect to substrate concentration (mM)
versus current (µA). Several analytical parameters like linearity equations, linear
dynamic ranges with limits of detection (LOD) were investigated under the optimized
conditions.
Also, kinetic parameters were investigated. Since amperometric detection technique
measures current with respect to time, apparent Michealis-Menten constant, KM app
, and
Imax were obtained from Lineweaver-Burk plots [99].
The repeatability of the analytical responses corresponding to exact glucose solutions
was analyzed for ten times. The standard deviation (SD) and the relative standard
deviation (RSD) were calculated. In order to test shelf life stability, the optimized
biosensor was used in the detection of glucose concentration every other day until
activity loss was observed. Biosensor systems were stored at +4 ᵒ
C when not in use.
Furthermore, possible interferents were analyzed with the proposed biosensors.
Ascorbic acid, cholesterol and urea (between 0.01 and 0.1 M) were examined by
injecting into the reaction cell instead of glucose during amperometric measurements
under optimized working conditions by applying -0.7 V.

46
2.10. Sample Application
2.10.1. PMMA/laponite nanocomposite/ poly(BEDOA-6)/GOx
Biosensor
The GOx biosensor was tested to analyze the glucose amount in real human blood
serum. The real human serum samples were obtained from Middle East Technical
University (METU) Medical Center from patients who volunteered for that matter and
all experiments were carried out in compliance with relevant and ethical laws. The
serum samples were added to the reaction cell instead of the substrate. The reaction
medium consists of 10 mL 50 mM NaOAc (pH 5.5) buffer solution. By adding different
volume of serum samples without any pre-treatment, the concentration in the reaction
cell was arranged in order to be in the linear range of the glucose biosensor. Then,
signals were recorded and concentrations were calculated from the calibration curve.
Values obtained were compared with glucose amounts analyzed by the local hospital.
The measured results by the proposed biosensing system were compared.
2.10.2. Au NPs/MPA/ poly(BEDOA-6)/GOx Biosensor
Glucose contents in various beverages were detected using the biosensor. Beverage
samples can be used without any pretreatments for the analyses. In those measurements,
instead of glucose, beverage samples were injected as the substrate directly into the
measurement cell. The reliability of the biosensor was determined with a reference
method using a commercial enzyme assay kit for glucose measurements. This enzyme
assay kit is based on GOx-PAP method including glucose oxidase, peroxidase, phenol
and 4-aminophenazone. Colorimetric test depends on enzymatic oxidation of glucose
by the help of glucose oxidase. Hydrogen peroxide, the product, reacts with phenol and
4-aminophenazone in the presence of peroxidase which gives a red-violet color via
47
quinoneimine dye indicator [100]. Real samples with no dilution were analyzed both
with the proposed sensing system and a spectrophotometric technique.

48
49
CHAPTER 3
RESULTS AND DISCUSSION
3.1. Electrochemical Studies
3.1.1. Electrochemical Polymerization of the Monomer
Electrochemical polymerization and film deposition were achieved via cyclic
voltammetry. Repeated potential-scan electropolymerization on the graphite electrode
up to 10 cycles is shown in Figure 3.1. As seen from the figure, during the first cycle,
monomer oxidation occurs followed by a reduction. While the polymerization proceeds
during scanning, the increase in the current density shows the successful deposition of
the polymer on the working electrode. The deposited charge increases with the
increasing cycles. After the polymerization, the surface of the electrode was rinsed with
distilled water to remove the impurities.
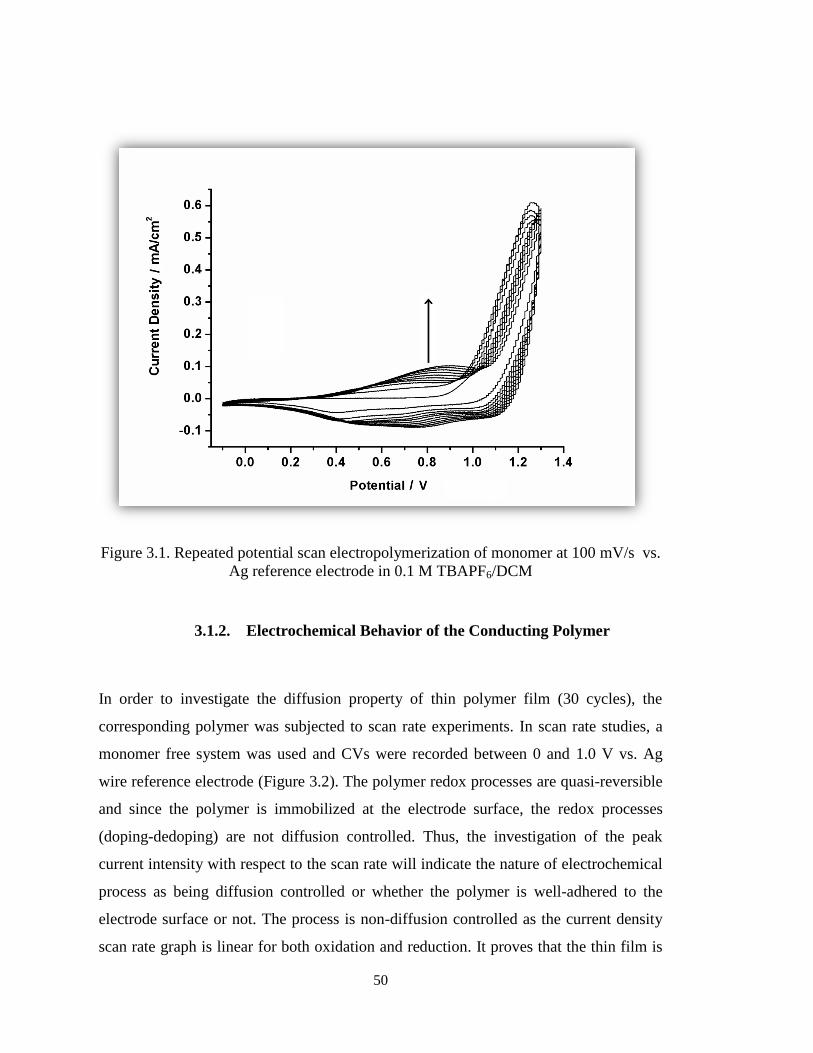
50
Figure 3.1. Repeated potential scan electropolymerization of monomer at 100 mV/s vs.
Ag reference electrode in 0.1 M TBAPF6/DCM
3.1.2. Electrochemical Behavior of the Conducting Polymer
In order to investigate the diffusion property of thin polymer film (30 cycles), the
corresponding polymer was subjected to scan rate experiments. In scan rate studies, a
monomer free system was used and CVs were recorded between 0 and 1.0 V vs. Ag
wire reference electrode (Figure 3.2). The polymer redox processes are quasi-reversible
and since the polymer is immobilized at the electrode surface, the redox processes
(doping-dedoping) are not diffusion controlled. Thus, the investigation of the peak
current intensity with respect to the scan rate will indicate the nature of electrochemical
process as being diffusion controlled or whether the polymer is well-adhered to the
electrode surface or not. The process is non-diffusion controlled as the current density
scan rate graph is linear for both oxidation and reduction. It proves that the thin film is
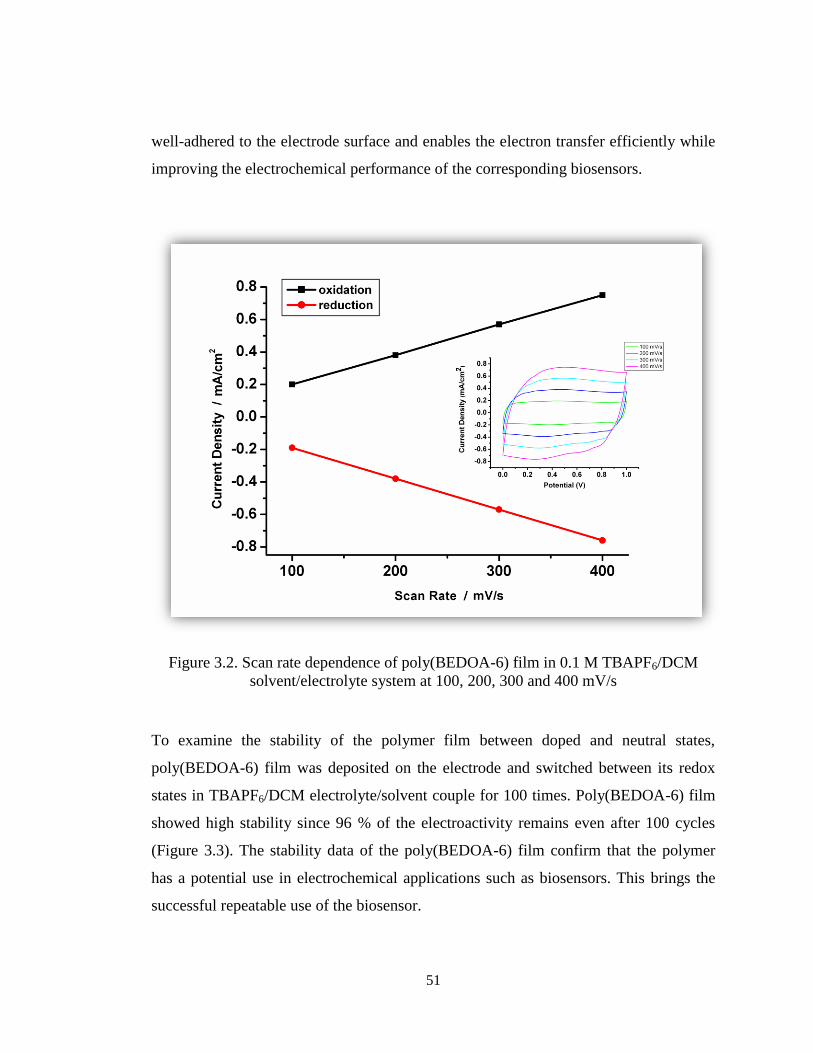
51
well-adhered to the electrode surface and enables the electron transfer efficiently while
improving the electrochemical performance of the corresponding biosensors.
Figure 3.2. Scan rate dependence of poly(BEDOA-6) film in 0.1 M TBAPF6/DCM
solvent/electrolyte system at 100, 200, 300 and 400 mV/s
To examine the stability of the polymer film between doped and neutral states,
poly(BEDOA-6) film was deposited on the electrode and switched between its redox
states in TBAPF6/DCM electrolyte/solvent couple for 100 times. Poly(BEDOA-6) film
showed high stability since 96 % of the electroactivity remains even after 100 cycles
(Figure 3.3). The stability data of the poly(BEDOA-6) film confirm that the polymer
has a potential use in electrochemical applications such as biosensors. This brings the
successful repeatable use of the biosensor.

52
Figure 3.3. Chronoamperometry experiment for poly(BEDOA-6) on the electrode in 0.1
TBAPF6/DCM while switching between neutral and oxidized states. Each interval on
the x axis stands for 5 s
3.2.PMMA/laponite nanocomposite/ poly(BEDOA-6)/GOx Biosensor
3.2.1. Investigation of biosensor construction method
Different preparation techniques were tried to detect the most proper way of
construction of the proposed biosensor. For the first one, after electropolymerization,
clay dispersion was added on the electrode and then a certain amount of glucose
oxidase was spread over the electrode following glutaraldehyde solution. The second
preparation technique was based on that after electropolymerization, glucose oxidase
and clay dispersion solution were mixed and added on the polymer coated electrode

53
surface and then GA solution were used. As seen in Figure 3.4, second technique is the
most efficient one, hence it was used for further experiments.
Figure 3.4. Effect of different preparation technique on biosensor response
3.2.2. Effect of PMMA/Laponite Nanocomposite dispersion for
biosensor construction
Since clay mixture was not soluble in water, there could be a dispersion problem during
the biosensor preparation. Nevertheless, this mixture was fully dissolved in DCM.
Therefore, efficiency of nanocomposite dispersion on the detection signal was
investigated. As seen in Figure 3.5, although clay mixture was not dissolved in water, it
had a better effect on biosensor responses.
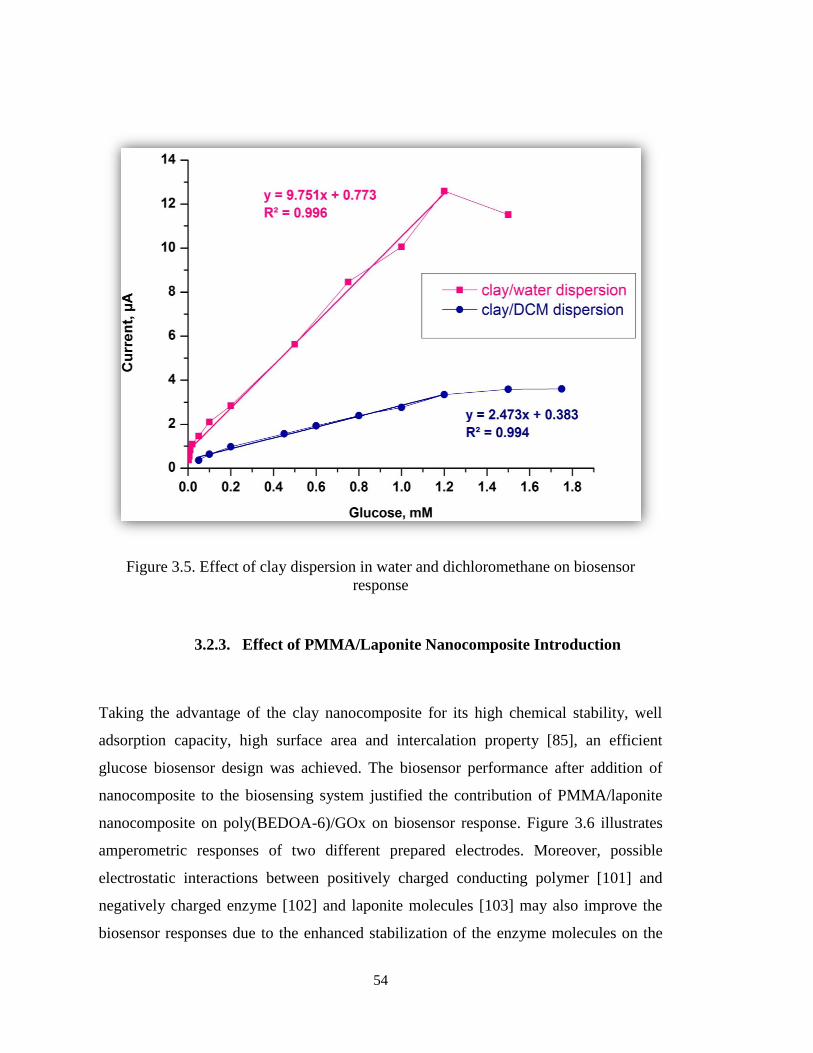
54
Figure 3.5. Effect of clay dispersion in water and dichloromethane on biosensor
response
3.2.3. Effect of PMMA/Laponite Nanocomposite Introduction
Taking the advantage of the clay nanocomposite for its high chemical stability, well
adsorption capacity, high surface area and intercalation property [85], an efficient
glucose biosensor design was achieved. The biosensor performance after addition of
nanocomposite to the biosensing system justified the contribution of PMMA/laponite
nanocomposite on poly(BEDOA-6)/GOx on biosensor response. Figure 3.6 illustrates
amperometric responses of two different prepared electrodes. Moreover, possible
electrostatic interactions between positively charged conducting polymer [101] and
negatively charged enzyme [102] and laponite molecules [103] may also improve the
biosensor responses due to the enhanced stabilization of the enzyme molecules on the

55
electrode surface. These stronger interactions contribute stability of the enzyme
molecules and generation of appropriate microenvironment promoting the reactions on
the active site of the enzyme molecules.
Figure 3.6. Effect of nanocomposite addition on poly(BEDOA-6)/GOx biosensor (in 50
mM NaOAc buffer solution, pH 5.5, 25 ºC, -0.7 V). Error bars show the standard
deviation (SD) of three measurements
3.2.4. Optimization of Biosensor Performance
3.2.4.1.Optimization of Conducting Polymer Thickness
The effect of film thickness on the biosensor responses was shown in Figure 3.7.
Polymers with different thicknesses were deposited on graphite working electrodes with
20, 30, 40, 50 scans to find the optimum thickness. The highest response was recorded
with 30-cycle deposition. The charges and film thicknesses for 20, 30, 40 and 50-cycle

56
polymer films were calculated as 0.56 mC (12 nm), 0.72 mC (16 nm), 0.90 mC (20 nm)
and 1.63 mC (36 nm), respectively. Due to the possible diffusion problems which may
arise from high polymer layer thickness, lower responses were recorded for the higher
scan numbers. On the other hand, not only to achieve a strong covalent binding between
enzyme molecules and polymer matrix, but also to stabilize the huge protein molecules
and nanocomposite structures on the electrode surface, a sufficient amount of polymer
layer has to be generated. Moreover, in blank experiments, to observe the nourishing
impact of conducting polymer on the biosensor responses, a biosensor containing the
same amount of nanocomposite without a poly(BEDOA-6) layer was prepared. At
optimized conditions, the biolayer was directly adsorbed on graphite working electrode;
nevertheless, lower response signals were recorded with a linearity between 0.02 and
0.6 mM for glucose and an equation of y= 4.846x+0.400, R2=0.991.
Figure 3.7. The effect of the polymer film thickness on biosensor response (in 50 mM
NaOAc buffer solution, pH 5.5, 25 ºC, -0.7 V, 0.45 mM glucose). Error bars show the
standard deviation (SD) of three measurements
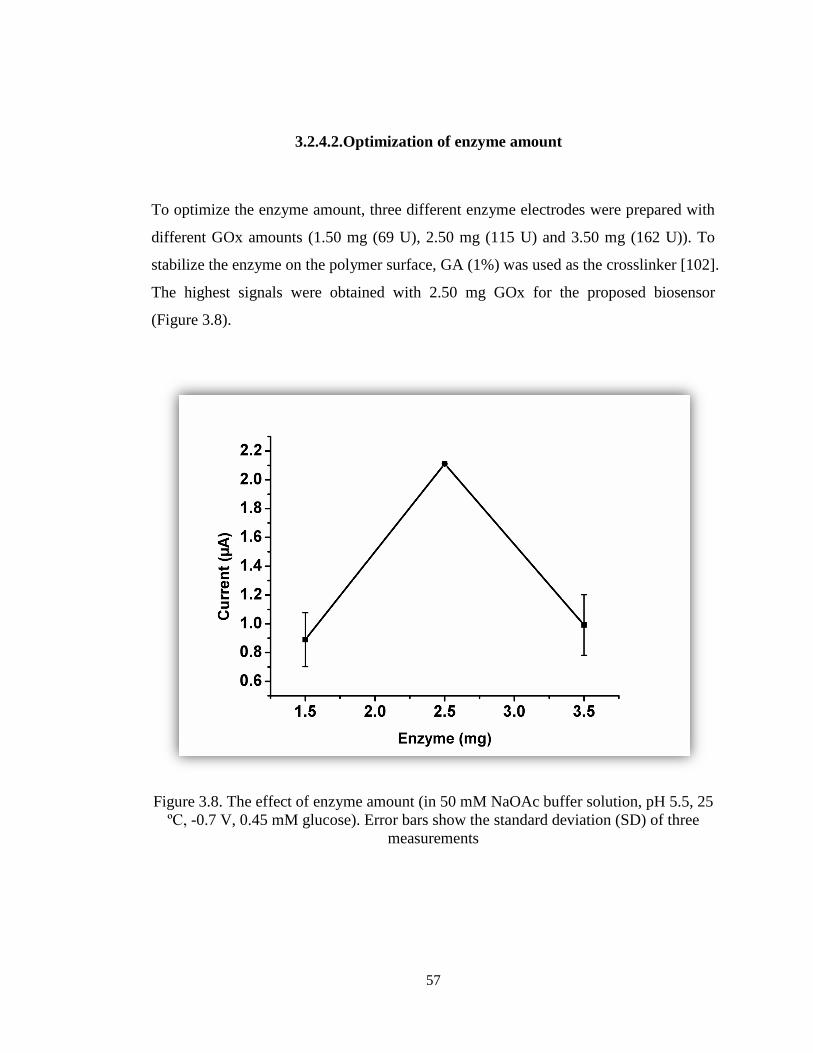
57
3.2.4.2.Optimization of enzyme amount
To optimize the enzyme amount, three different enzyme electrodes were prepared with
different GOx amounts (1.50 mg (69 U), 2.50 mg (115 U) and 3.50 mg (162 U)). To
stabilize the enzyme on the polymer surface, GA (1%) was used as the crosslinker [102].
The highest signals were obtained with 2.50 mg GOx for the proposed biosensor
(Figure 3.8).
Figure 3.8. The effect of enzyme amount (in 50 mM NaOAc buffer solution, pH 5.5, 25
ºC, -0.7 V, 0.45 mM glucose). Error bars show the standard deviation (SD) of three
measurements

58
3.2.4.3.Optimization of crosslinker (glutaraldehyde) amount
Glutaraldehyde is an important crosslinking agent to obtain successful immobilization
leading to effective covalent binding between functional group of the polymer and the
biomolecule. To obtain the ideal crosslinking between the amino groups in the protein
structure and amino groups of the polymer, glutaraldehyde amount was optimized.
Three different GA solutions were prepared (0.5 %, 1 % and 2.5 %) and they were used
in preparation of the GOx biosensors. The highest response was recorded the one using
1 % GA solution (Figure 3.9).
Figure 3.9. The effect of crosslinker amount (in 50 mM NaOAc buffer solution, pH 5.5,
25 ºC, -0.7 V, 0.45 mM glucose). Error bars show the standard deviation (SD) of three
measurements

59
3.2.4.4.Optimization of pH
pH dependence of the responses was investigated over a pH range between 3.5 and 8.0
with sodium citrate buffer (50 mM) at pH 3.5, sodium acetate buffer (50 mM) at pH 4.0
– 6.0 and phosphate buffer (50 mM) at pH 6.5 – 8.0 in the presence of 0.45 mM glucose.
The biosensor revealed the best result at pH 5.5 as given in Figure 3.10. pH 5.5 buffer
was used as the working solution.
Figure 3.10. The effect of pH (in 50 mM NaOAc buffer solution, 25 ºC, -0.7 V, 0.45
mM glucose). Error bars show the standard deviation (SD) of three measurements

60
3.2.4.5.Optimization of nanocomposite amounts
The effect of the composition of PMMA/ laponite clay nanocomposite suspension on
the biosensor response was investigated. Amperometric responses of electrodes
prepared with same amount of GOx and different amounts of nanocomposite (clay
suspensions with 2, 4 and 6 mg nanocomposite by dispersing in 5 mL water) were
recorded to obtain the most effective dispersion. The highest response to glucose was
observed in the 4 mg/5 mL water nanocomposite dispersion containing biosensor
(Figure 3.11).
Figure 3.11. The effect of clay dispersion in 5 mL water (in 50 mM NaOAc buffer
solution, pH 5.5, 25 ºC, -0.7 V, 0.45 mM glucose). Error bars show the standard
deviation (SD) of three measurements
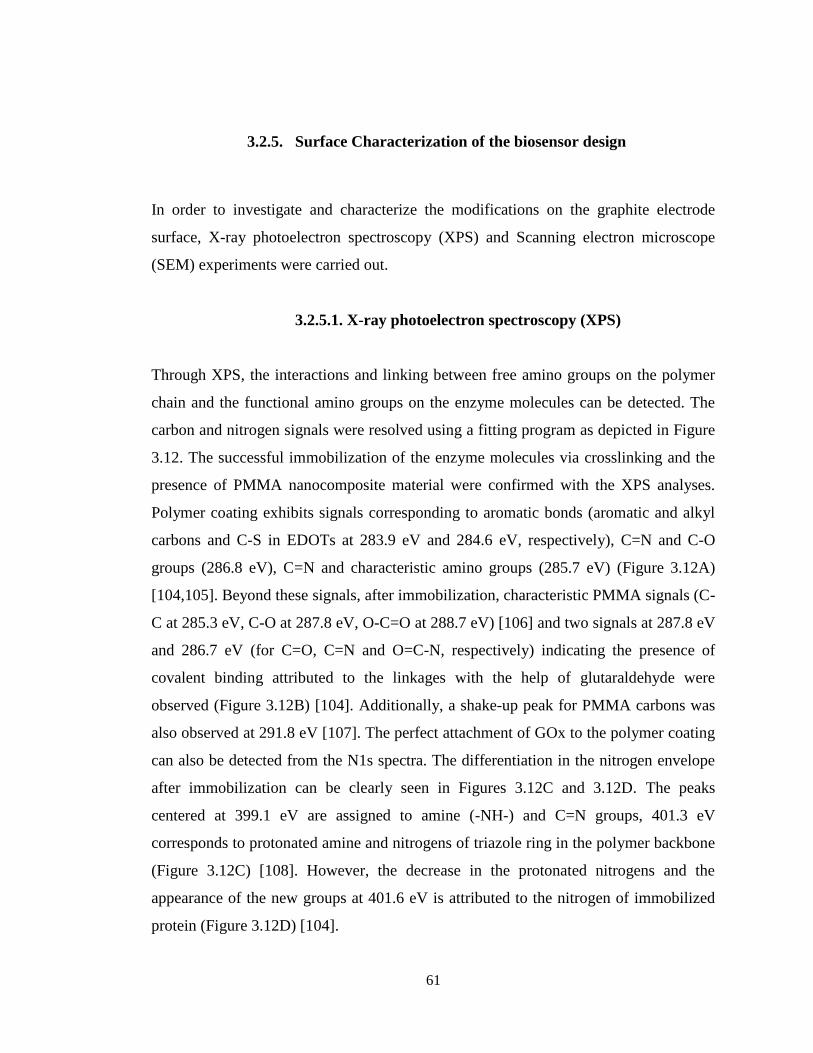
61
3.2.5. Surface Characterization of the biosensor design
In order to investigate and characterize the modifications on the graphite electrode
surface, X-ray photoelectron spectroscopy (XPS) and Scanning electron microscope
(SEM) experiments were carried out.
3.2.5.1. X-ray photoelectron spectroscopy (XPS)
Through XPS, the interactions and linking between free amino groups on the polymer
chain and the functional amino groups on the enzyme molecules can be detected. The
carbon and nitrogen signals were resolved using a fitting program as depicted in Figure
3.12. The successful immobilization of the enzyme molecules via crosslinking and the
presence of PMMA nanocomposite material were confirmed with the XPS analyses.
Polymer coating exhibits signals corresponding to aromatic bonds (aromatic and alkyl
carbons and C-S in EDOTs at 283.9 eV and 284.6 eV, respectively), C=N and C-O
groups (286.8 eV), C=N and characteristic amino groups (285.7 eV) (Figure 3.12A)
[104,105]. Beyond these signals, after immobilization, characteristic PMMA signals (C-
C at 285.3 eV, C-O at 287.8 eV, O-C=O at 288.7 eV) [106] and two signals at 287.8 eV
and 286.7 eV (for C=O, C=N and O=C-N, respectively) indicating the presence of
covalent binding attributed to the linkages with the help of glutaraldehyde were
observed (Figure 3.12B) [104]. Additionally, a shake-up peak for PMMA carbons was
also observed at 291.8 eV [107]. The perfect attachment of GOx to the polymer coating
can also be detected from the N1s spectra. The differentiation in the nitrogen envelope
after immobilization can be clearly seen in Figures 3.12C and 3.12D. The peaks
centered at 399.1 eV are assigned to amine (-NH-) and C=N groups, 401.3 eV
corresponds to protonated amine and nitrogens of triazole ring in the polymer backbone
(Figure 3.12C) [108]. However, the decrease in the protonated nitrogens and the
appearance of the new groups at 401.6 eV is attributed to the nitrogen of immobilized
protein (Figure 3.12D) [104].

62
Figure 3.12. C1s and N1s XPS spectra of the polymer deposited surface (A and C) and
protein immobilized onto the polymer deposited surface (B and D)
3.2.5.2. Scanning electron microscope (SEM)
Figure 3.13 depicts SEM images of the conducting polymer coated on graphite
electrode and the polymer/ PMMA-clay nanocomposite/GOx modified electrode
surfaces. The typical homogeneous, cauliflower-like structure of the conducting
polymer can be observed in the first image (Figure 3.13a). After the protein-
nanocomposite mixture immobilization, the change in the morphology of the polymeric
composition can be clearly seen in Figure 3.13b. Compare to the polymer, the
nonuniform and irregular coating on the surface was observed. The morphology in
figure (b) represents the irregular and network-like structure due to the porous nature of
PMMA/laponite nanocomposites. Moreover, besides the crosslinking between the
polymer and the enzyme molecules, the entrapment of enzyme molecules within this
porous network also enhances the high enzyme loading and stability of the biosensor
keeping the biomolecules on the electrode surface firmly.

63
Figure 3.13. SEM images of polymer (a) before and (b) after biomolecule and
nanocomposite immobilization under optimized conditions
3.2.6. Analytical characterization of the proposed biosensor
Calibration curve was plotted with respect to substrate concentration under optimized
conditions as given in Figure 3.14. A linear relationship was observed between 2.8 mM
and 1.2 mM glucose concentration satisfying the equation y=9.651x+0.773 and
R2=0.995 (given as inset in Figure 14). Furthermore, to calculate the limit of detection
(LOD), the intercept of the linear range of the calibration curve was set as zero using
S/N (signal-to-noise ratio) =3 criterion found as 1.99 mM for the biosensor. Also,
kinetic parameters were investigated. Since amperometric detection technique measures
current with respect to time, thus, apparent Michealis-Menten constant, KMapp
, and Imax
were obtained from Lineweaver-Burk plots [99]. KMapp
value was estimated to be 1.31
mM and Imax value was found as 12.59 mA for poly(BEDOA-6)/PMMA-laponite
nanocomposite/ GOx biosensor.
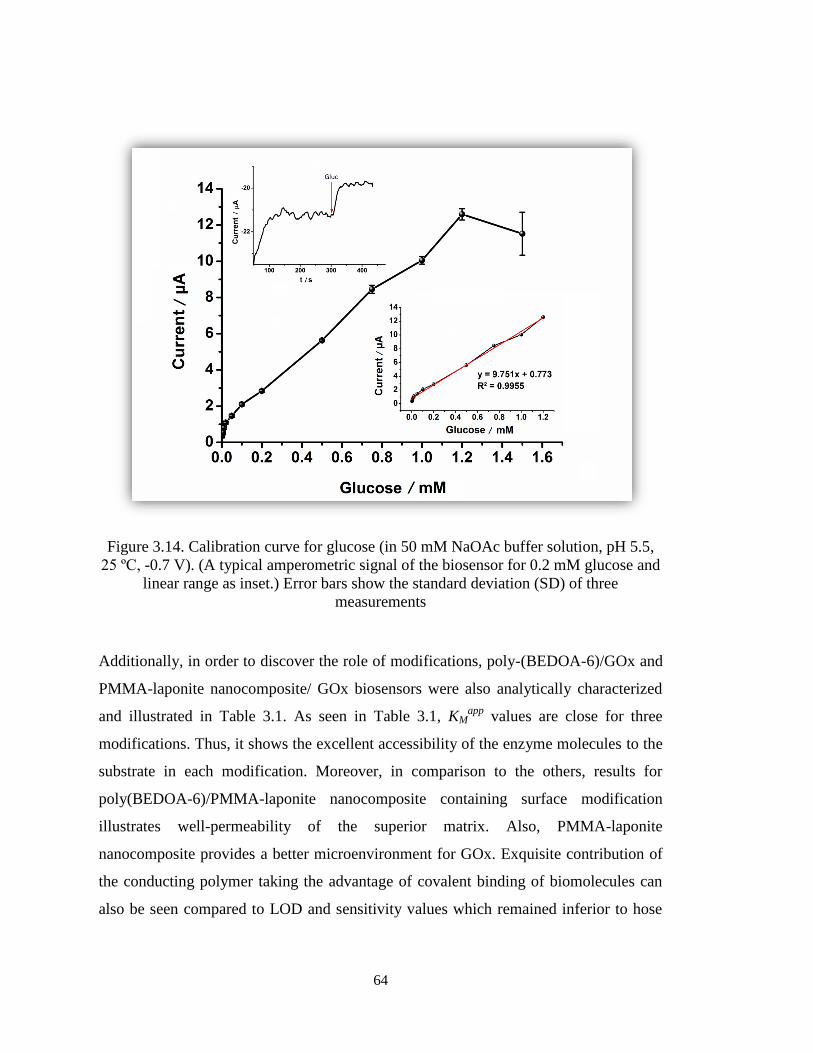
64
Figure 3.14. Calibration curve for glucose (in 50 mM NaOAc buffer solution, pH 5.5,
25 ºC, -0.7 V). (A typical amperometric signal of the biosensor for 0.2 mM glucose and
linear range as inset.) Error bars show the standard deviation (SD) of three
measurements
Additionally, in order to discover the role of modifications, poly-(BEDOA-6)/GOx and
PMMA-laponite nanocomposite/ GOx biosensors were also analytically characterized
and illustrated in Table 3.1. As seen in Table 3.1, KMapp
values are close for three
modifications. Thus, it shows the excellent accessibility of the enzyme molecules to the
substrate in each modification. Moreover, in comparison to the others, results for
poly(BEDOA-6)/PMMA-laponite nanocomposite containing surface modification
illustrates well-permeability of the superior matrix. Also, PMMA-laponite
nanocomposite provides a better microenvironment for GOx. Exquisite contribution of
the conducting polymer taking the advantage of covalent binding of biomolecules can
also be seen compared to LOD and sensitivity values which remained inferior to hose

65
recorded for poly(BEDOA-6)/PMMA-laponite nanocomposite/GOx biosensor.
Sensitivity calculations were done using the surface area of the electrode.
Table 3.1. Analytical characteristics of the biosensors
Biosensor KM
app(mM)/
Imax(µA)
Sensitivity
(mA M-1
cm-2
)
Linear
Range (mM)
LOD
(µM)
Poly(BEDOA-6)/GOx 0.96 / 6.34 11.10 0.1 - 1.5 98.10
PMMA-Laponite
nanocomposite/GOx 0.43 / 5.25 20.14 0.02 - 0.6 54.0
Poly(BEDOA-6)/
PMMA-Laponite
nanocomposite/GOx
1.31 / 12.59 37.16 0.0028 - 1.2 1. 99
A typical amperometric response of the biosensor is shown as an inset in Figure 3.14.
This rapid signal is an indication of the fast mass transfer of the substrate through the
matrix. The catalytic properties of the immobilized GOx molecules are also promoted
by poly(BEDOA-6)/PMMA-laponite nanocomposite matrix due to a good preservation
of the accessibility of the enzyme molecules.
The repeatability of the analytical responses corresponding to 0.45 mM glucose
solutions was analyzed for ten times. The standard deviation (SD) and the relative
standard deviation (RSD) were calculated as ± 0.2 and 3.8 %, respectively. In order to
test shelf life stability, the optimized biosensor was used in the detection of glucose
concentration every other day during 6 weeks by using 0.45 mM glucose and the
biosensor was stored at +4 ᵒ
C when not in use. For a period of 6 weeks no activity loss
was observed. These results proved that the covalent binding between the biomolecules
and the polymer matrix and the electrostatic interactions between enzyme molecules
and clay matrix improved the analytical properties and the long-term stability.
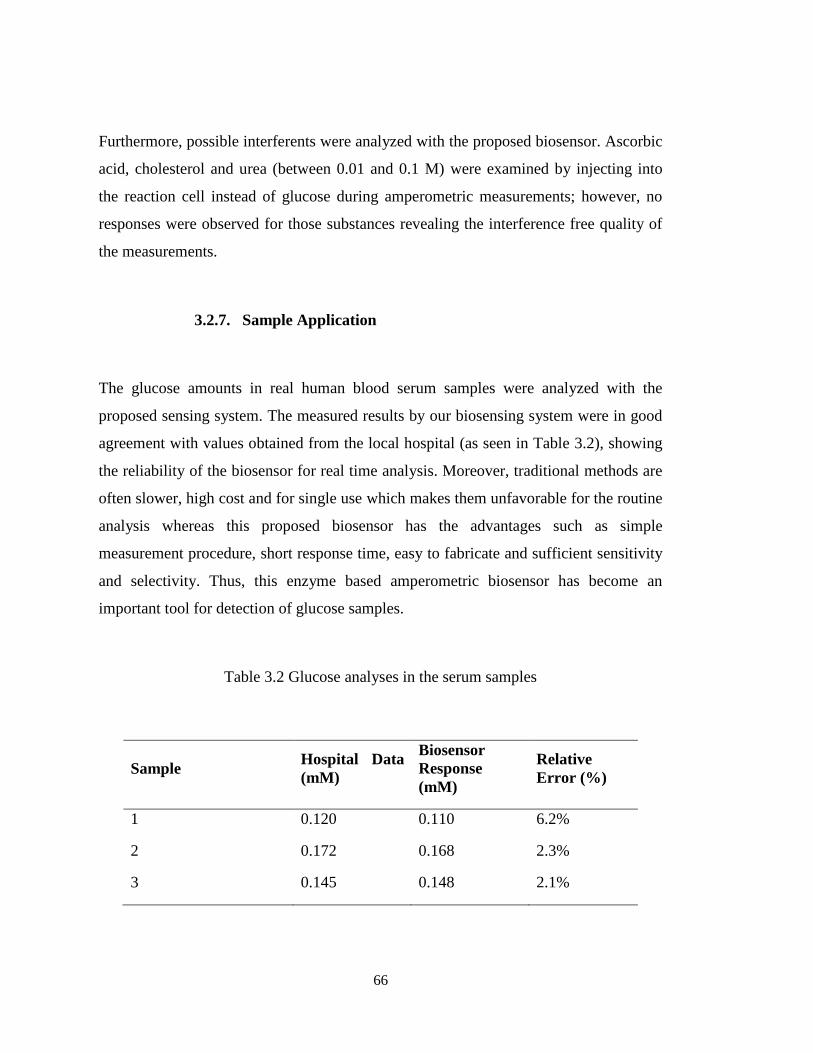
66
Furthermore, possible interferents were analyzed with the proposed biosensor. Ascorbic
acid, cholesterol and urea (between 0.01 and 0.1 M) were examined by injecting into
the reaction cell instead of glucose during amperometric measurements; however, no
responses were observed for those substances revealing the interference free quality of
the measurements.
3.2.7. Sample Application
The glucose amounts in real human blood serum samples were analyzed with the
proposed sensing system. The measured results by our biosensing system were in good
agreement with values obtained from the local hospital (as seen in Table 3.2), showing
the reliability of the biosensor for real time analysis. Moreover, traditional methods are
often slower, high cost and for single use which makes them unfavorable for the routine
analysis whereas this proposed biosensor has the advantages such as simple
measurement procedure, short response time, easy to fabricate and sufficient sensitivity
and selectivity. Thus, this enzyme based amperometric biosensor has become an
important tool for detection of glucose samples.
Table 3.2 Glucose analyses in the serum samples
Sample Hospital Data
(mM)
Biosensor
Response
(mM)
Relative
Error (%)
1 0.120 0.110 6.2%
2 0.172 0.168 2.3%
3 0.145 0.148 2.1%

67
3.3.Au NPs/MPA/ poly(BEDOA-6)/GOx Biosensor
3.3.1. Characterization of Modified Gold Nanoparticles
In order to modify colloidal Au NPs with 3-mercaptopropionic acid (MPA), different
MPA concentrations were applied [109-111] and various procedures described in
literature were performed [109,112,113]. First of all, for efficient self-assembling of
MPA to Au NPs (Au NPs/MPA), MPA concentration in modification process was
optimized. UV-vis spectra of corresponding solutions were given in Figure 3.15. As
seen the characteristic absorbance of spherical Au NPs appears at 530 nm. Upon
modification, a decrease in intensity of this peak and formation of a new absorbance
band around 800 nm suggest a change in surface characteristics of NPs and thus
successful modification of Au NPs through Au-S bond. Fig. 3.15 also shows the change
in the intensity of newly formed absorbance band with the use of different MPA
concentrations. This suggests that the optimum MPA concentration for modification is
0.225 M (Figure 3.15).

68
Figure 3.15. UV-vis spectra of Au NPs and Au NPs/MPA solutions prepared in
different concentrations of MPA
Afterwards, different modification procedures were applied by keeping the MPA
concentration at optimum value (0.225 M). Figure 3.16 demonstrates the UV-vis
analysis results of different methods employed for modification. By considering the
depletion in the characteristic absorbance of Au NPs and appearance of a new
absorption band corresponding Au NPs/MPA in UV-vis spectra, the most adequate
preparation method for modification was determined to be 30 s stirring time and
overnight storing at 4 ºC (Figure 3.16).
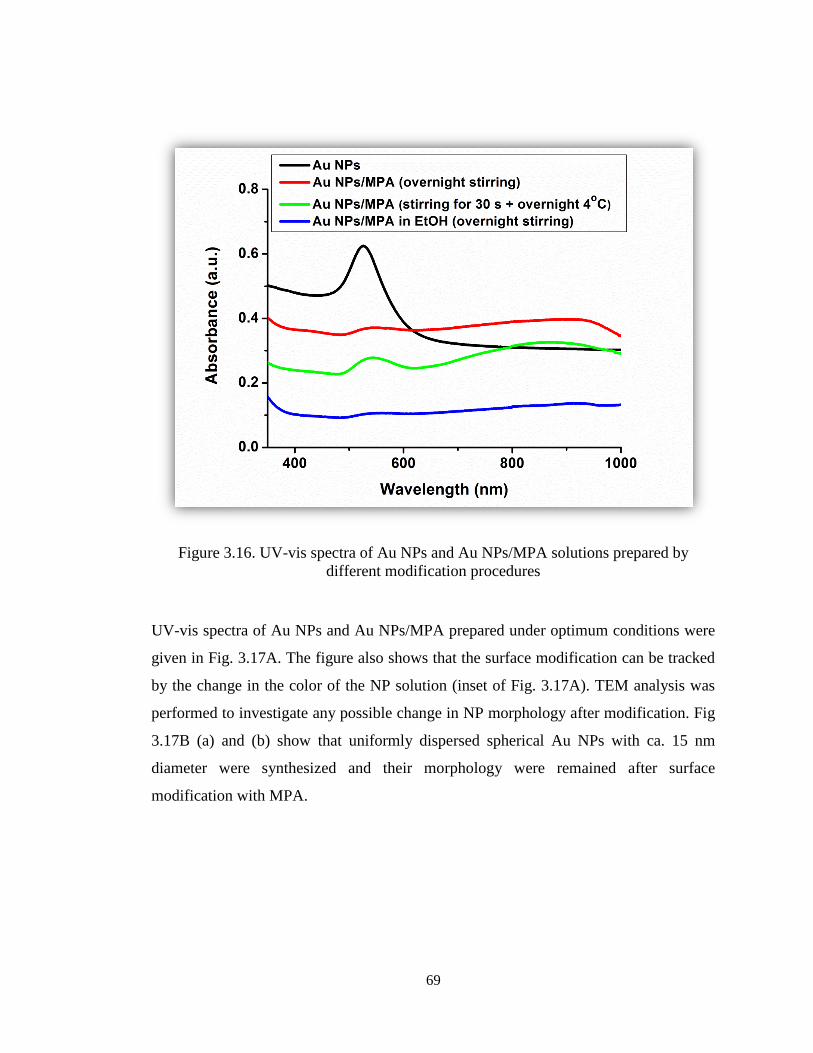
69
Figure 3.16. UV-vis spectra of Au NPs and Au NPs/MPA solutions prepared by
different modification procedures
UV-vis spectra of Au NPs and Au NPs/MPA prepared under optimum conditions were
given in Fig. 3.17A. The figure also shows that the surface modification can be tracked
by the change in the color of the NP solution (inset of Fig. 3.17A). TEM analysis was
performed to investigate any possible change in NP morphology after modification. Fig
3.17B (a) and (b) show that uniformly dispersed spherical Au NPs with ca. 15 nm
diameter were synthesized and their morphology were remained after surface
modification with MPA.

70
Figure 3.17. A) UV-vis spectra of Au NPs and Au NPs/MPA; B) TEM images of (a) Au
NPs and (b) Au NPs/MPA
3.3.2. Effect of Au NPs/MPA in Biosensor Fabrication
Figure 3.18 illustrates that the addition of modified Au NPs improved biosensor
performance. Since MPA self-assembled Au NPs led to an increase in the surface area
of three-dimensional electrodes [93a], the one with Au NPs/MPA gave the highest

71
response for glucose. Moreover, the effect of conducting polymer (poly(BEDOA-6)) on
biosensor performance was also investigated. It can be easily seen that presence of
conducting polymer on the electrode surface resulted in achieving an excellent glucose
biosensor. Hence, this additional interface enhanced the stability of the enzyme
molecules on the electrode surface supplying higher enzyme activity. Due to the
presence of functional groups on the polymer backbone the polymer, modified Au NPs
and enzyme molecules may be linked together revealing a better interface and
electronically more active structure. The functional conducting polymer provides a
robust and efficient conjugation between enzyme molecules and Au NPs/MPA by
incorporating them and behaves as an excellent transducer in the biosensor construction
[114]. Therefore, from the amplified signals, it is obvious that Au NPs/MPA lie
between the conducting polymer and enzyme molecules on the electrode surface. The
presence of these nanostructures brings the wiring effect on electron transfer between
active site of the enzymes and polymer coated transducer which accelerates and
facilitates the electron transfer and diminishes the diffusion problems [115,116].
Modified architecture of Au NPs/MPA induces the effectiveness of the NPs together
with the immobilization stability.
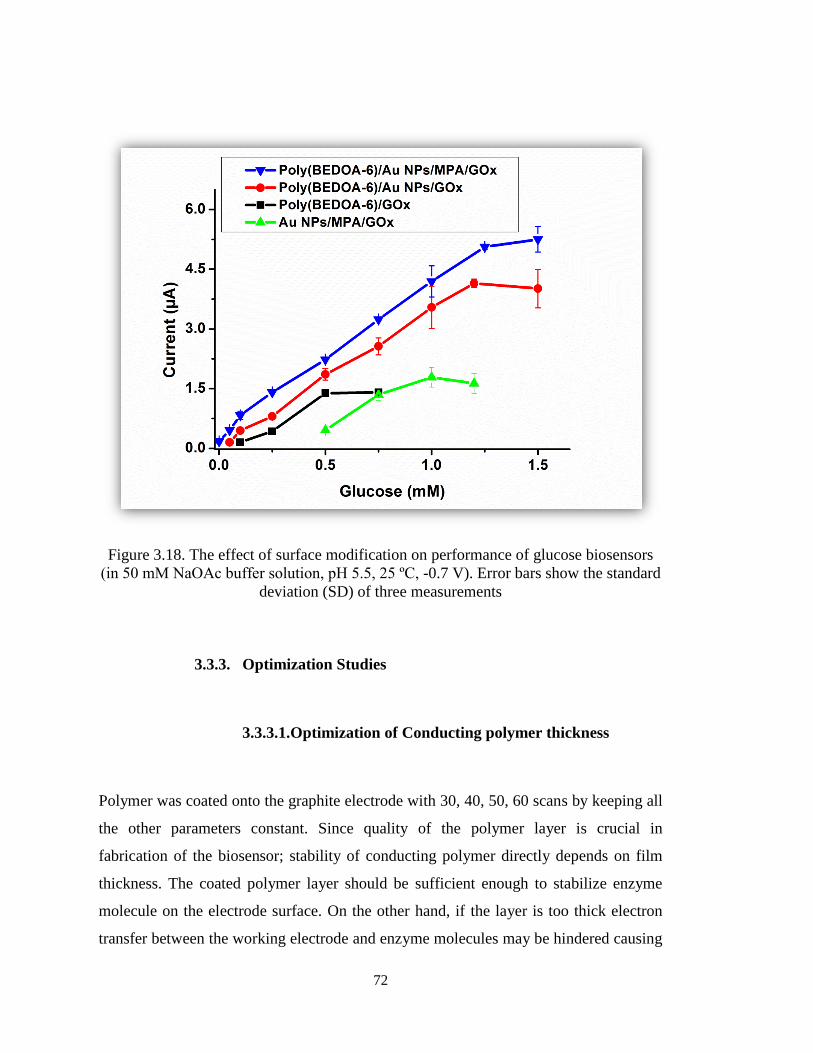
72
Figure 3.18. The effect of surface modification on performance of glucose biosensors
(in 50 mM NaOAc buffer solution, pH 5.5, 25 ºC, -0.7 V). Error bars show the standard
deviation (SD) of three measurements
3.3.3. Optimization Studies
3.3.3.1.Optimization of Conducting polymer thickness
Polymer was coated onto the graphite electrode with 30, 40, 50, 60 scans by keeping all
the other parameters constant. Since quality of the polymer layer is crucial in
fabrication of the biosensor; stability of conducting polymer directly depends on film
thickness. The coated polymer layer should be sufficient enough to stabilize enzyme
molecule on the electrode surface. On the other hand, if the layer is too thick electron
transfer between the working electrode and enzyme molecules may be hindered causing

73
a lower charge transfer rate. Also applying enzyme molecules on a more than 50 cycle
coated-electrode may result in an alteration of the 3D structure causing a sort of
denaturation. As seen in Figure 3.19, 50 cycle deposition was determined as the
optimum thickness for the biosensor application which corresponds to 5.70 nm in
thickness.
Figure 3.19. The effect of polymer film thickness on biosensor response (in pH 5.5
NaOAc, 50 mM, 25 ºC, -0.7 V). Error bars show the standard deviation (SD) of three
measurements
3.3.3.2.Optimization of enzyme amount
To optimize enzyme amount, three electrodes were prepared with different amount of
GOx as 0.5 mg (20 U), 1.5 mg (60 U), 2.5 mg (100 U) (Figure 3.20). The highest
signals were obtained with the biosensor having 1.5 mg (60 U) GOx. In lower amounts

74
of GOx, sufficient responses as regards to sensitivity could not be recorded. Besides, for
higher amounts of enzyme, suitable binding between enzyme molecules and polymer
was not possible; hence, leaching of enzyme molecules from the electrode surface was
observed. Moreover, due to the diffusion problems, the signals decreased and response
times extended. Thus, 60 U enzyme was used for further experimental steps as the
biorecognition element in biosensor construction.
Figure 3.20. The effect of enzyme amount (in 50 mM NaOAc, 25 ºC, -0.7 V). Error
bars show the standard deviation (SD) of three measurements
The pH dependence of the glucose biosensor responses to 0.5 mM glucose was
investigated between pH 4.5 and 7.0 (sodium acetate buffer at pH 4.5; 5.0; 5.5 and
sodium phosphate buffer at pH 6.0; 6.5; 7.0, 25 ºC.) The best result was achieved at pH
5.5 sodium acetate buffer solution as given in Figure 3.21. pH 5.5 sodium acetate buffer
was used as the working buffer solution.

75
Figure 3.21. The effect of pH (in 50 mM NaOAc, 25 ºC, -0.7 V). Error bars show the
standard deviation (SD) of three measurements
3.3.3.3.Optimization of Au NPs/MPA amount
During the biosensor preparation different amounts of Au NPs/MPA solutions (2.0-6.0
µL) were introduced to surface of the biosensor where 4.0 µL Au NPs/MPA solution
was found as the optimum. The decrease in the response for higher amounts of Au
NPs/MPA may originate due to the excess covalent attachments between carboxylic
acid modified Au NPs/MPA, enzymes and polymer. Both orientation and 3D structure
of enzyme molecules may be destroyed. This may bring denaturation. Moreover, due to
the excess crosslinking, diffusion problems may arise [117]. In lower amounts, Au
NPs/MPA may not show their wiring affects enough which reveals lower signals.

76
3.3.4. Characterizations of the proposed biosensor
3.3.4.1.Fourier Transform Infrared Spectrophotometry
(FTIR)
FTIR spectroscopy was used to examine the alternation of functional groups upon
modification. The FTIR spectra of poly(BEDOA-6) and poly(BEDOA-6)/Au NPs/MPA
were shown in Figure 3.22. Five characteristic bands corresponding to poly(BEDOA-
6) were observed. The peaks at 3435 cm-1
and 3136 cm-1
were assigned to the stretching
vibration of free primary NH2 groups as two spikes. The adsorption bands observed at
840 cm-1
, 1440 cm-1
, 1628 cm-1
were due to C-H (aromatic), C-H (CH2) stretching and
N-H bending frequencies, respectively. These results confirmed the presence of
functional groups of the polymer. Moreover, FTIR spectrum of poly(BEDOA-6)/Au
NPs/MPA in Fig. 3.23 demonstrates the presence of MPA and covalent linkage between
MPA and polymer via amide bond. There are two characteristic peaks that differed
from the spectrum of poly(BEDOA-6) due to the modification of polymer. While the
corresponding primary amine peaks of the polymer disappeared, the 3435 cm-1
peak
remains proving the secondary amine (-N-H) stretching arising from an amide bond.
That is generated by covalent binding of free amine groups of the polymer with the
carboxylic acid end groups of MPA. Second peak at 1707 cm-1
was attributed to C=O
stretching frequency which proved the existence of carbonyl groups caused of MPA and
by the formation of an amide linkage. The results demonstrate successful modifications
via covalent linkage that would be used in target biosensor construction.
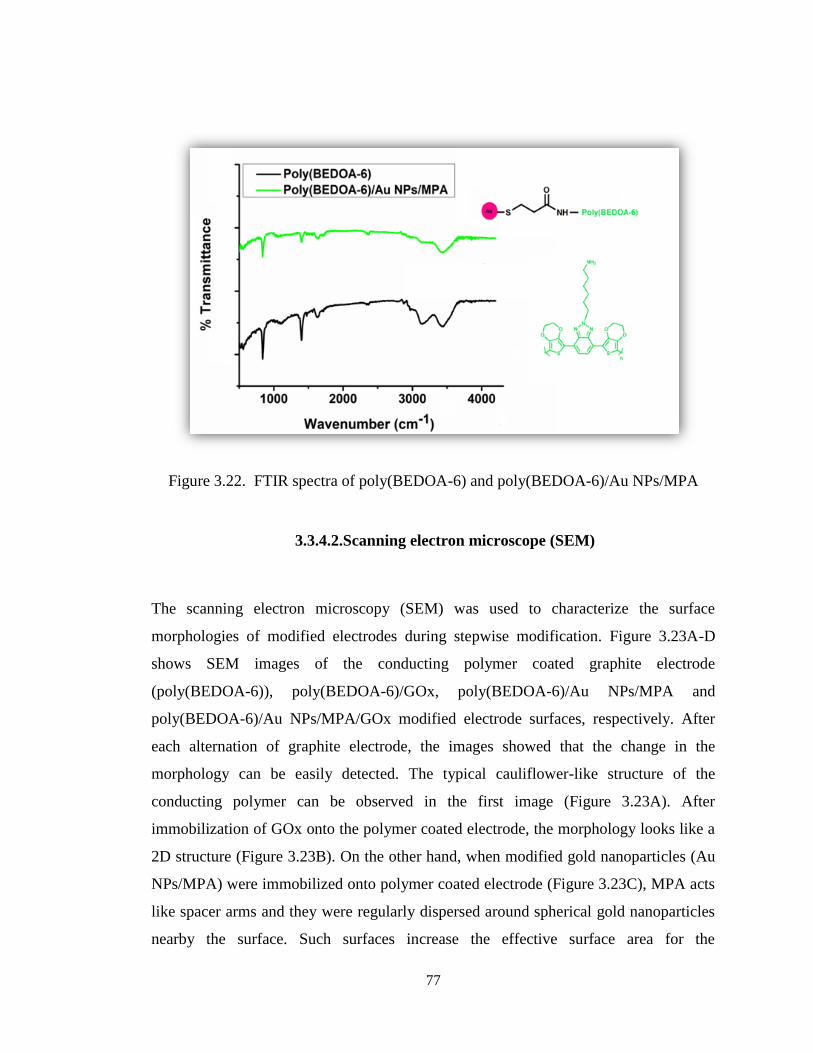
77
Figure 3.22. FTIR spectra of poly(BEDOA-6) and poly(BEDOA-6)/Au NPs/MPA
3.3.4.2.Scanning electron microscope (SEM)
The scanning electron microscopy (SEM) was used to characterize the surface
morphologies of modified electrodes during stepwise modification. Figure 3.23A-D
shows SEM images of the conducting polymer coated graphite electrode
(poly(BEDOA-6)), poly(BEDOA-6)/GOx, poly(BEDOA-6)/Au NPs/MPA and
poly(BEDOA-6)/Au NPs/MPA/GOx modified electrode surfaces, respectively. After
each alternation of graphite electrode, the images showed that the change in the
morphology can be easily detected. The typical cauliflower-like structure of the
conducting polymer can be observed in the first image (Figure 3.23A). After
immobilization of GOx onto the polymer coated electrode, the morphology looks like a
2D structure (Figure 3.23B). On the other hand, when modified gold nanoparticles (Au
NPs/MPA) were immobilized onto polymer coated electrode (Figure 3.23C), MPA acts
like spacer arms and they were regularly dispersed around spherical gold nanoparticles
nearby the surface. Such surfaces increase the effective surface area for the
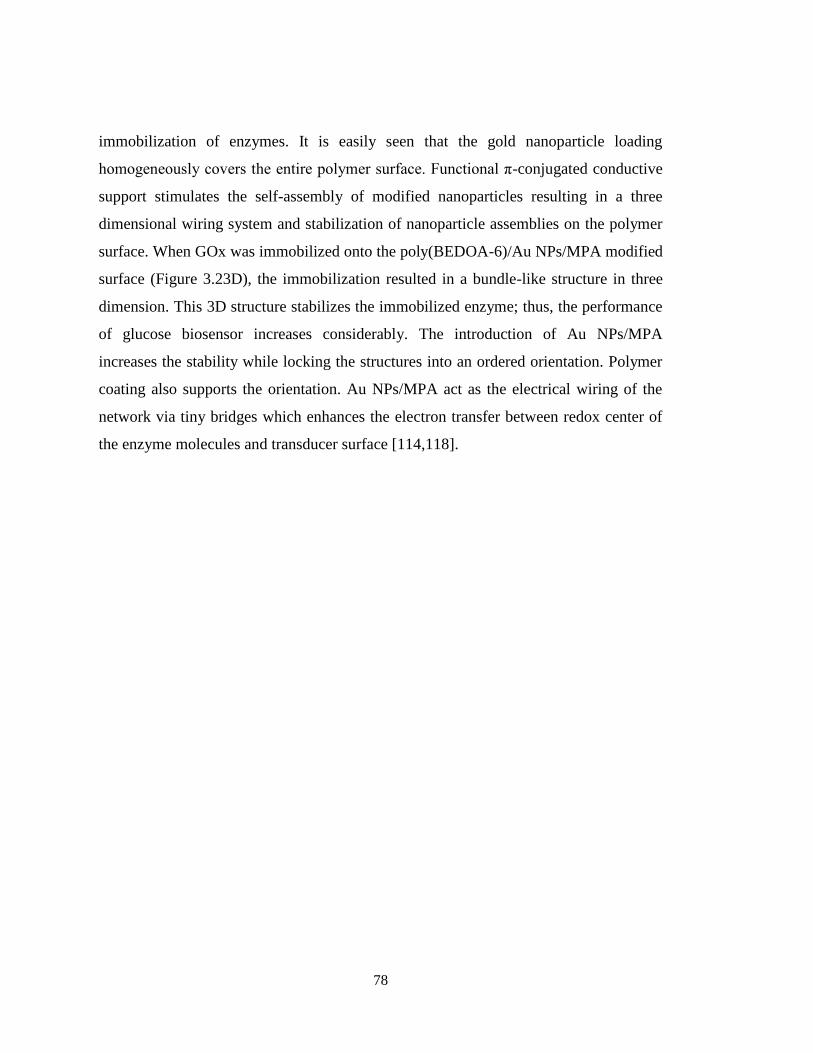
78
immobilization of enzymes. It is easily seen that the gold nanoparticle loading
homogeneously covers the entire polymer surface. Functional π-conjugated conductive
support stimulates the self-assembly of modified nanoparticles resulting in a three
dimensional wiring system and stabilization of nanoparticle assemblies on the polymer
surface. When GOx was immobilized onto the poly(BEDOA-6)/Au NPs/MPA modified
surface (Figure 3.23D), the immobilization resulted in a bundle-like structure in three
dimension. This 3D structure stabilizes the immobilized enzyme; thus, the performance
of glucose biosensor increases considerably. The introduction of Au NPs/MPA
increases the stability while locking the structures into an ordered orientation. Polymer
coating also supports the orientation. Au NPs/MPA act as the electrical wiring of the
network via tiny bridges which enhances the electron transfer between redox center of
the enzyme molecules and transducer surface [114,118].
79
Figure 3.23. SEM images of (A) poly(BEDOA-6), (B) poly(BEDOA-6)/GOx, (C)
poly(BEDOA-6)/Au NPs/MPA and (D) poly(BEDOA-6)/Au NPs/MPA/GOx under
optimized conditions
3.3.4.3.Fluorescence microscopy
To inquire surface characteristics of the modified immobilization matrices, wide field
fluorescence microscopy technique was used where the substrate is an indium tin oxide
(ITO) glass. The conducting polymer exhibits a characteristic fluorescence property due
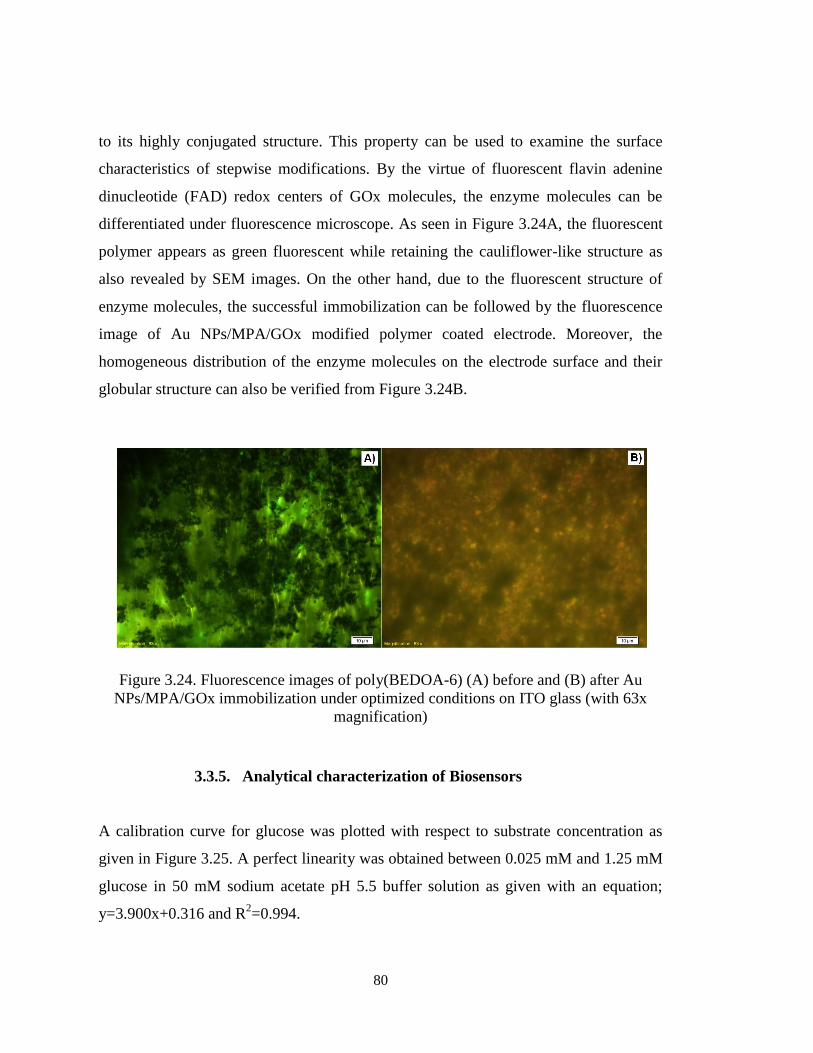
80
to its highly conjugated structure. This property can be used to examine the surface
characteristics of stepwise modifications. By the virtue of fluorescent flavin adenine
dinucleotide (FAD) redox centers of GOx molecules, the enzyme molecules can be
differentiated under fluorescence microscope. As seen in Figure 3.24A, the fluorescent
polymer appears as green fluorescent while retaining the cauliflower-like structure as
also revealed by SEM images. On the other hand, due to the fluorescent structure of
enzyme molecules, the successful immobilization can be followed by the fluorescence
image of Au NPs/MPA/GOx modified polymer coated electrode. Moreover, the
homogeneous distribution of the enzyme molecules on the electrode surface and their
globular structure can also be verified from Figure 3.24B.
Figure 3.24. Fluorescence images of poly(BEDOA-6) (A) before and (B) after Au
NPs/MPA/GOx immobilization under optimized conditions on ITO glass (with 63x
magnification)
3.3.5. Analytical characterization of Biosensors
A calibration curve for glucose was plotted with respect to substrate concentration as
given in Figure 3.25. A perfect linearity was obtained between 0.025 mM and 1.25 mM
glucose in 50 mM sodium acetate pH 5.5 buffer solution as given with an equation;
y=3.900x+0.316 and R2=0.994.

81
Figure 3.25. Calibration curve for glucose (in 50 mM NaOAc buffer solution, pH 5.5,
25 ºC, -0.7 V). Error bars show the standard deviation (SD) of three measurements
Moreover, the biosensor signals corresponding to 0.1 mM glucose solution were
measured for ten times in order to prove repeatability of the biosensor response. The
standard deviation (SD) and the relative standard deviation (RSD) were calculated as
0.124 and 5.87 % respectively. Limit of detection (LOD) was also calculated as 25 µM
according to S/N=3. Also, a typical amperometric response of the biosensor was given
as an inset in Figure 3.25.
Furthermore, kinetic characterizations were carried out using Lineweaver-Burk plot
[99]. In amperometric detection technique, current was measured with respect to time;
apparent Michealis-Menten constant, KMapp
, and Imax were calculated as 0.81 mM and

82
7.10 µA respectively. A low KMapp
value was observed. Hence, with the help of the
modified polymer matrix, immobilized enzyme molecules exhibit higher affinity toward
glucose. With the help of wiring effect of Au NPs/MPA, such a low KMapp
value and
LOD was achieved.
Shelf life of the proposed biosensor was also examined. The optimized biosensor was
used in glucose detection everyday and no activity loss was observed for 3 weeks. It
was stored at +4 ºC when not in use. Covalent linkage between enzyme molecules and
immobilization matrix brings considerable shelf life stability. Moreover, it is reported
that Au NPs assembling around GOx brings an environment congruent with the native
system where the redox proteins can be oriented freely [118,119]. The results also
verified this situation with long-term stability and amplified signals.
In addition, interference studies were carried out with the proposed biosensor. Possible
interferents like ascorbic acid, cholesterol and urea (between 0.01 and 0.1 M) were used
as the substrate. Amperometric measurements were done under optimized working
conditions by applying -0.7 V and no current change were detected. Hence this
proposed biosensor can be used for sample applications even in the presence of such
interferents in the analyte.
3.3.6. Sample Application
To investigate the performance and reliability of the constructed biosensor, it was used
to analyze the glucose content in various beverages. Real samples with no dilution were
analyzed both with poly(BEDOA-6)/Au NPs/MPA/GOx biosensor and a
spectrophotometric technique (Table 3.3). Results prove that there exists no significant
difference between the two methods showing the reliability and accuracy of the
biosensor.

83
Table 3.3. Results of glucose analyses in beverages
Glucose (mol/L)
Sample Spectrophotometric Poly(BEDOA-6)/Au
NPs/ MPA/ GOx
E® Lemonade 0.183 0.189
C® Soda 0.076 0.074
T® Ice Tea 0.031 0.035
L®
Ice Tea 0.035 0.041
C® Orange Juice 0.107 0.106

84
85
CHAPTER 4
CONCLUSION
In this thesis, two different biosensors with different matrices were constructed for
detection of glucose concentration in a test solution. Glucose oxidase was used as a
model enzyme for fabrication of these two biosensing systems. A functional conducting
polymer poly(BEDOA-6) was used as an immobilization platform for both sensors. The
pendant amino groups on the polymer backbone serve as binding sites to form covalent
linkage to enzyme molecule with the help of crosslinking agents. The covalent
attachment improved the stability of the biosensors.
Taking the several advantages of usage of nanostructures, the analytical characteristics
and long-term efficiency of designed sensing systems were improved. Electrode
surfaces were modified with clay nanocomposite and functional gold nanoparticles,
respectively. Then, effect of presence of each layer used in construction was
investigated and best results were revealed detecting the most effective biosensing
designs.
To prove applicability of both biosensing systems, the biosensors were used to analyze
glucose content in real human blood samples and various beverages. Both biosensors
were in good agreement with corresponding reference methods.
In the first glucose biosensors prepared by poly(BEDOA-6) and PMMA/Clay
nanocomposite, the conducting polymer coated graphite electrode was modified with
PMMA/laponite nanocomposites in order to improve the interaction of enzyme with the
immobilization matrix, enhancing stability of the biosensor. After the effect of
86
introduction of clay nanocomposite to the sensing design was proved, surface
morphology of the biosensor was studied via SEM and XPS techniques. The optimized
biosensor showed good kinetic and analytical parameters, summarized as follows:
The optimum biosensor was prepared using 30 cycle conducting polymer
deposition, 2.50 mg GOx, 1% GA solution,4 mg/5 mL water nanocomposite
dispersion. Amperometric measurements were performed in 50 mM NaOAc
buffer solution at pH 55.
KMapp
and Imax were found as 1.31 mM and 12.59 µA, respectively.
The biosensor showed a wide linear range between 2.8 mM and 1.2 mM to
glucose with a low detection limit of 1.99 mM. Selectivity of the designed
system was 37.16 mAM-1
cm-2
.
For a period of 6 weeks no activity loss was observed.
This study was published in Electroanalysis in 2013 [95].
Second glucose biosensor was constructed with pristine and functional gold
nanoparticles. After effective modification technique was achieved, the effect of
nanoparticles on biosensor response was investigated. Deposition of conducting
polymer was achieved electrochemically and functional gold nanoparticles and enzyme
was immobilized onto the coated graphite electrode. Surface morphology of the
functional nanoparticles and the biosensor was carried out via TEM, SEM,
Fluorescence Microscope techniques. Also, the covalent bond formation between both
the polymer and modified particles and the polymer and enzyme was confirmed by
FTIR. The results of optimized biosensor were summarized as follows:
87
The biosensor response was maximized using 50 cycle deposition, 1.5 mg GOx,
4.0 µL Au NPs/MPA solution during construction. Amperometic measurements
were performed at pH 5.5 NaOAc buffer solution.
KMapp
and Imax were calculated as 0.81 mM and 7.10 mA respectively.
The biosensor showed a wide linear range between 0.025 mM and 1.25 mM
glucose concentration with a low detection limit of 0.025 mM. Selectivity was
found as 14.97 mAM-1
cm-2
.
No activity loss was observed for 3 weeks.
This study was published in Polymer in 2013 [120].

88
89
REFERENCES
[1] H. Letheby, J. Chem. Soc., 1862, 15, 161.
[2] G. Natta, G. Mazzanti, P. Corradini, Atti Accad. Lincei Cl. Sci. Fis. Mat.
Nat. Rend., 1958, 25, 3.
[3] (a) A. G. MacDiarmid, J. Am. Chem. Soc., 1976, 98, 388; (b) F. B. Burt,
Journal of Chemical Society, 1910, 68, 105.
[4] H. Shirakawa, F. J. Louis, A. G. MacDiarmid, C. K. Chiang, A.J.
Heeger, J. Chem. Soc., Chem. Commun., 1977, 578, 578.
[5] (a) H. Shirakawa, Angew. Chem. Int. Ed., 2001, 40, 2574; (b) A. G.
MacDiarmid, Angew. Chem. Int. Ed., 2001, 40, 2581; (c) A.J. Heeger, Angew.
Chem. Int. Ed., 2001,40, 2591; (d) H. Shirakawa, Synth. Met., 2002, 125, 3; (e)
A. G. MacDiarmid, Synth.Met., 2002, 125, 11; (f) A. J. Heeger, Synth. Met.,
2002, 125, 23.
[6] A. Heeger, A. G. MacDiarmid, H.Shirakawa, The Nobel Prize in
Chemistry 2000 - Advanced Information". Nobelprize.org. Nobel Media AB
2013. Web. 12 Jan 2014.
http://www.nobelprize.org/nobel_prizes/chemistry/laureates/2000/advanced.htm
l.
[7] G. Blasse, B.C. Grabmaier, Luminescent Materials, 1994, Springer-
Verlag.
[8] M. E. G. Lyons, Electroactive Polymer Electrochemistry, 1994, New
York, p48.
[9] A. G. MacDiarmid, A. J. Heeger, Synth. Met., 1979, 1, 101.
[10] J. A. Rogers, Z. Bao, V. R. Raju, Appl. Phys. Lett., 72 (1998) 2716.
[11] (a) N. Toshima, O. Ihata, Synth. Met., 1996, 79, 165; (b) Z.C. Sun, Y.
H. Geng, J. Li, X. H. Wang, X. B. Jing, F. S. Wang, J. Appl. Polym. Sci., 1999,
90
72, 1077; (c) K.Yoshino, R. Hayashi, R. Sugimoto, Jpn. J. Appl. Phys., 1984,
23, L899.
[12] A. Malinauskas, Polymer, 2001, 42, 3957.
[13] R. H. Baughman, J. L. Bredas, R.R. Chance, R. L. Elsenbaumer, L. W.
Shacklette, Chem. Rev., 1982, 82, 209.
[14] (a) L. Toppare, Encyclopedia of Engineering Materials Part A, Polymer
Science and Technology, New York: Marcel Dekker, 1988, Vol. 1, Chapter 8;
(b) K. Doblhofer, Rajeshwar in Handbook of Conducting Polymers, 2nd Edn.,
ed.; T.A. SSkotheim, R.L.Elsenbaumer, (c) J.R. Reynolds, Marcel Dekker, New
york, 1998, 531.
[15] R. J. Mortimer, A. L. Dyer, J. R. Reynolds, Displays, 2006, 27, 2.
[16] (a) A. F. Diaz, A. Martinez, K. K. Kanazawa, M. M. Salmon,
J.Electroanal. Chem., 1981, 130, 181; (b) J. Roncali, Chem. Rev., 1992, 92, 711.
[17] (a) S. Kıralp, L. Toppare, Y. Yagcı, Int. J. Biol. Macromol., 2003, 33,
37; (b) Ö. Türkarslan, A.E. Böyükbayram, L. Toppare, Synth. Met., 2010, 160,
808; (c) A. Mulchandani, N.V. Myung, Curr. Opin. Biotech., 2011, 22, 502; (d)
V. Mazeiko, A. Kausaite-Minkstimiene, A. Ramanaviciene, Z. Balevicius, A.
Ramanavicius, Sensor Actuat. B-Chem., 2013, 189, 187; (e) S. Soylemez, F.
Ekiz Kanik, A.G. Nurioglu, H.Akpinar, L. Toppare, Sensor Actuat. B-Chem.,
2013, 182, 322.
[18] (a) E. J. W. List, L. Holzer, S. Tasch, G. Leising, U. Scherf, K. Mullen,
M. Catellani, S. Luzzati, Solid State Commun., 1999, 109, 455, (b) H. Kang, G.
Kim, I. Hwang, Y. Kim, K. Cheol Lee, S.H. Park, K. Lee, Sol. Energ. Mat. Sol.
C., 2012, 107, 148; (c) F. Xu, W.Q. Zhu, L.Yan, H. Xu, L.H. Xiong, J.H. Li,
Org. Electron., 2012, 13, 302; (d) P. Zacharias, M. C. Gather, A. Köhnen, N.
Rehmann, K. Meerholz, Angew. Chem. Int. Ed., 2009, 48, 4038.
[19] (a) D. S. H. Charrier, T. Vries, S. G. J. Mathijssen, E. J. Geluk, E. C. P.
Smits, M. Kemerink, R. A. J. Janssen, Org. Electron., 2009, 10, 994; (b) P. Jha,
S.P. Koiry, Vibha Saxena, P. Veerender, Abhay Gusain, A.K. Chauhan, A.K.
Debnath, D.K. Aswal, S.K. Gupta, Org. Electron., 2013, 14, 2635; (c) J. Lee, W.

91
Kim, H. Lim, Microelectron. Eng., 2012, 98, 382; (d) F. Garnier, G. Horowitz,
X. Peng, D. Fichou, Adv. Mater., 1990, 2, 592.
[20] (a) U. Bulut, A. Cirpan, Synth. Met., 2005, 148, 68; (b) A. Balan, G.
Gunbas, A. Durmus, L. Toppare, Chem. Mater., 2008, 20, 7510; (c) A. Kumar,
S. Jang, J. Padilla, T. F. Otero, G. A. Sotzing, Polymer, 2008, 49, 3686; (d) H.
Li, K. Xie, Y.Pan, H. Wang, H. Wang, Synth. Met., 2012, 162, 22.
[21] (a) F. Li, W.J. Albery, J. Electroanal. Chem. Interfacial Electrochem.,
1991, 302, 279. (b) P. Novak, K. Muller, K. Santhanam, O. Haas, Chem. Rev.,
1997, 97, 207; (c) A. Guerfi, J. Trottier, I. Boyano, I. De Meatza, J.A. Blazquez,
S. Brewer, K.S. Ryder, A. Vijh, K. Zaghib, J. Power Sources, 2014, 248, 1099;
(d) K. Gurunathan, D.P. Amalnerkar, D.C. Trivedi, Mater. Lett., 2003, 57, 1642.
[22] (a) C. J. Brabec, N. S. Sariciftci, J. C. Hummelen., Adv. Funct. Mater.,
2001, 11, 15, (b) E. Kaya, A. Balan, D. Baran, A. Cirpan, L. Toppare, Org.
Electron., 2011, 12, 202. (c) C.O. Too, G.G. Wallace, A.K. Burrell, G.E. Collis,
D.L. Officer, E.W. Boge, S.G. Brodie, E.J. Evans, Synth. Met., 2001, 123, 53;
(d) J. Wang, Y. Wang, D. He, Z. Liu, H. Wu, H. Wang, P. Zhou, M. Fu, Sol.
Energ. Mat. Sol. C., 2012, 96, 58.
[23] (a) G. Valdés-Ramírez, J. R. Windmiller, J.C. Claussen, A.G. Martinez,
F.Kuralay, M. Zhou, N. Zhou, R. Polsky, P.R. Miller, R. Narayan, J. Wang,
Sensor Actuat. B-Chem., 2012, 161, 1018; (b) M. Sharma, G.I.N. Waterhouse,
S.W.C. Loader, S. Garg, D. Svirskis, Int. J. Pharm., 2013, 443, 163.
[24] (a) A. Katchalsky, H. Eisenberg, Nature 1950, 166, 267; (b) R. Kiefer,
S.Y. Chu, P.A. Kilmartin, G.A. Bowmaker, R.P. Cooney, J. Travas-Sejdic,
Electrochim. Acta, 2007, 52, 2386; (c) Y. A. Ismail, J. G. Martínez, A. S. Al
Harrasi, S.J. Kim, Toribio F. Otero, Sensor Actuat. B-Chem., 2011, 160, 1180.
[25] D. Thevenot, K. Toth, R.A. Durst, G.S. Wilson, Biosens. Bioelectron.,
2001, 16, 121.
[26] M.Gerard, A. Chaubey, B.D. Malhotra, Biosens. Bioelectron. 2002, 17,
345.
[27] l. Karube, K. Nakanishi, IEEE Eng. Med. Biol., 1994, 13, 364.
92
[28] T. Ahuja, I.A. Mir, D. Kumar, Rajesh, Biomaterials, 2007, 28, 791.
[29] S. K. Sharma, N. Sehgal, A.Kumar, Curr. Appl. Phys., 2003, 3, 307.
[30] J. Svorc, S. Miertu, J. Katrlik, M. Stredansk, Anal. Chem., 1997, 69,
2086.
[31] A. Chaubey, B.D. Malhotra, Biosens. Bioelectron. 2002, 17, 441.
[32] S. Cosnier, Biosens. Bioelectron., 1999, 14, 443.
[33] A. J. Lawrence, G.R. Moores, Eur. J. Biochem., 1972, 24, 538.
[34] M. Pohanka, P. Skládal, J. Appl. Biomed., 2008, 6, 57.
[35] P. Yang, L. Wang, Q. Wu, Z. Chen, X. Lin, Sensor Actuat B-Chem.,
2014, 194, 71.
[36] L. Clark, C. Lyons, Ann. N.Y. (1962). Acad. Sci. 102. 29.
[37] S. F. Peteu, D. Emerson, R. M. Worden, Biosens. Bioelectron., 1996, 11,
1059.
[38] L. Gorton, A. Lindgren, T. Larsson, F.D. Munteanu, T. Ruzgas, I.
Gazaryan, Anal. Chim. Acta, 1999, 400, 91.
[39] (a) R. Devi, B. Batra, S. Lata, S. Yadav, C.S. Pundir, Process Biochem.,
2013, 48, 242; (b) C. He, J. Liu, Q. Zhang, C. Wu, Sensor Actuat. B-Chem.,
2012, 166-167, 802; (c) D. Odaci, A. Telefoncu, S.Timur, Sensor Actuat. B-
Chem., 2008, 132, 159.
[40] S.Tuncagil, S.K. Kayahan, G. Bayramoglu, M.Y. Arica, L. Toppare,
J.Mol. Catal. B-Enzym., 2009, 58, 187-193.
[41] S. Cosnier, Anal. Bioanal. Chem., 2003, 377, 507.
[42] Bickerstaff, Immobilization of Enzymes and Cells, 1997, New Jersey:
Humana Press.
[43] Rajesh, V. Bisht, W. Takashima, K. Kaneto, Biomaterials, 2005, 26,
3683.
[44] J.M. Dicks, M.F. Cardosi, A.P.F. Turner, Electroanalysis, 1993, 5, 1.
[45] P. Bernfeld, J. Wan., Science, 1963, 142, 678.
[46] O.R. Zaborsky, Immobilized Enzymes, 1973, CRC Press, Cleveland.

93
[47] Ö. Yılmaz, D.Odacı Demirkol, S. Gülcemal, A. Kılınç, S. Timur, B.
Çetinkaya, Colloid Surface B., 2012, 100, 62.
[48] E. Başkurt, F. Ekiz, D. Odacı Demirkol, S. Timur, L. Toppare, Colloid
Surface B., 2012, 97, 13.
[49] S. Singh, D.V.S. Jain, M.L. Singla, Sensor Actuat. B-Chem., 2013, 182,
161.
[50] C.Situ, A.R.G. Wylie, A. Douglas, C.T. Elliott, Talanta, 2008, 76, 832.
[51] S. Cosnier, M. Holzinger., Chem. Soc. Rev., 2011, 40, 2146.
[52] S. Borgmann, G. Hartwich, A. Schulte, W. Schuhmann, Perspectives in
Bioanalysis, 2005.
[53] W.H. Scouten, J.H.T. Luong, R.S. Brown, Trends in Biotechnology,
1995, 13, 178.
[54] N.C. Kekec, F. Ekiz Kanik, Y. Arslan Udum, C. Gundogdu Hizliates, Y.
Ergun, L.Toppare, Sensor Actuat. B-Chem., 2014, 193, 306.
[55] S. Demirci, F.B. Emre, F. Ekiz, F. Oğuzkaya, S. Timur, C. Tanyeli, L.
Toppare, Analyst, 2012, 137, 4254.
[56] H. Wang, H. Ohnuki, H. Endo, M. Izumi, Sensor Actuat. B-Chem., 2012,
168, 249.
[57] F. Li, Wei Chen, Shusheng Zhang, Biosens. Bioelectron., 2008, 24, 781.
[58] M. Aizawa, S. Yabuki. In: Proceedings of the 51st annual meeting Japan
chemical society. 1985, p. 6.
[59] J.C. Vidal, E.G. Ruiz, J.R. Castillo, Microchim. Acta, 2003, 143, 93.
[60] R.E. Gyurcsanyi, Z. Vagföldi, G. Nagy, Electroanalysis, 1999, 11, 712.
[61] S. Wild, G. Roglic, A .Green, R. Sicree, H. King, Diabetes Care, 2004,
27, 1047.
[62] (a) H.B. Yildiz, S. Kiralp, L. Toppare, Y.Yağci, Int. J. Biol. Macromol.,
2005, 37, 174; (b) O. Lioubashevski, V.I. Chegel, F. Patolsky, E. Katz, I.
Willner, J. Am. Chem. Soc. 2004, 126, 7133; (c) A. Guerrieri, G.E. De
Benedetto, F. Palmisanot, P.G. Zambonint, Biosens. Bioelectron., 1998, 13, 103.

94
[63] D.G. Hatzinikolaou, B.J. Macris, Enzyme Microb. Technol., 1995, 17,
530.
[64] (a) T. F. Otero, J. G. Martinez, J. Arias-Pardilla, Electrochim. Acta 2012,
84,112. (b) V. Serafin, L. Agui, P. Yanez-Sedeno, J. M. Pingarron, J.
Electroanal. Chem. 2011, 656, 152, (c) Parham, H., Rahbar, N., 2010. J. Hazard.
Mater. 177, 1077–1084.
[65] S. Tuncagil, D. Odaci, E. Yildiz, S. Timur, L. Toppare, Sensors Actuat.
B-Chem, 2009, 137, 42.
[66] W. Schuhmann, Microchim. Acta, 1995, 21, 1.
[67] S. Cosnier, Appl. Biochem. Biotech., 2000, 89, 127.
[68] K.V. Santhanam, Pure Appl. Chem., 1998, 70, 1259.
[69] Y. Xian, Y. Hu, F. Liu, Y. Xian, H. Wang, L. Jin, Biosens. Bioelectron,
2006, 21, 1996.
[70] B.D. MAlhotra, A. Chaubey, S.P.Singh, Anal. Chim. Acta, 2006, 578,
59.
[71] J.M. Pingarron, P. Yanez-Sedeno, A. Gonzalez-Cortes, Electrochim.
Acta, 2008, 53, 5848.
[72] H. Li, W.Hong, F. Cai, Q. Tang, Y.Yan, X. Hu, B. Zhao, D.Zhang, Z.Xu,
J. Mater. Chem., 2012, 22, 24734.
[73] K. Kamps, R. Leek, L. Luebke, R. Price, M. Nelson, S. Simonet, D. J.
Eggert, T. Aygan Atesin, E. M. Bratsolias Brown, Integr. Biol., 2013, 5, 133.
[74] J. Yuan, A.H.E. Müller, Polymer, 2010, 51, 4015.
[75] Y. Yoon, H. Sohn, J. Lee, Polymer, 2009, 50, 1395.
[76] J. Kim, C, Hwang, S. Jo, W. Jung, Appl. Phys. Lett., 2011, 99, 233304.
[77] J. Choi, K. Park, H. Lee, Y. Kim, J. Lee, Y. Sung, Electrochim. Acta,
2003, 48, 2781.
[78] V. Armel, O. Winther-Jensen, R. Kerr, D.R. MacFarlane, B. Winther-
Jensen, J. Mater. Chem., 2012, 22, 19767.
[79] P. K. Ghosh, J. A. Bard, J. Am. Chem. Soc., 1983, 105, 5691.

95
[80] J. V. De Melo, S. Cosnier, C. Mousty, C. Martelet, N. Jaffrezic- Renault,
Anal. Chem. 2002, 74, 4037.
[81] W. Schuhmann, Rev. Mol. Biotechnol. 2002, 82, 425.
[82] C. Mousty, Anal. Bioanal. Chem., 2010, 396, 315.
[83] C. Mousty, Appl. Clay Sci., 2004, 27, 159.
[84] Y. Mansoori, S.V. Atghia, M.R. Zamanloo, Gh. Imanzadeh, M.
Sirousazar, Eur. Polym. J., 2010, 46, 1844.
[85] Y. Liu, H. Y. Liu, N. F. Hu, Biophys. Chem., 2005, 117, 27.
[86] E. Han, D. Shan, H. Xue, S. Cosnier, Biomacromolecules, 2007, 8, 971.
[87] C. Mousty, Appl. Clay Sci., 2004, 27, 159.
[88] S. Cosnier, C. Gondran, A. Senillou, M. Gratzel, N. Vlachopoulos,
Electroanalysis, 1997, 9, 1387.
[89] J. Zhang, X. Xu, X. Yang, Analyst, 2012, 137, 3437.
[90] (a) C. C. D. Wang, W. C. H. Choy, C.Duan, D. D. S. Fung, W. E. I. Sha,
F. X. Xie, F. Huang and Y. Cao, J. Mater. Chem., 2012, 22, 1206; (b) Y. Leroux,
E. Eang, C. Fave, G. Trippe and J. C. Lacroix, Electrochem. Commun., 2007, 9,
1258.
[91] (a) S. Guo, E. Wang, Anal. Chim. Acta, 2007, 598, 181; (b) R. Ladj, A.
Bitar, M. Eissa, Y. Mugnier, R. Le Dantec, H. Fessia, A. Elaissaria, J. Mater.
Chem. B, 2013, 1, 1381.
[92] (a) P. Yanez-Sedeno, J.M. Pingarron, Anal. Bioanal. Chem. 382, 2005,
884; (b) S. Liu, D. Leech, H. Ju, Anal. Lett., 36, 2003, 1.
[93] (a) S. Zhang, N. Wang, Y. Niu, C. Sun. Sens. Actuators B-Chem., 2005,
109, 367, (b) M. Adamovski, A. Zaja, P. Gründler, G. Flechsig, Electrochem.
Commun., 2006, 8, 932; (c) X. Zhong, R. Yuan, Y. Chai, Y. Liu, J. Dai, D.
Tang, Sens. Actuators B-Chem., 2005, 104, 191.
[94] Y. Zhang, W. Jiang, Electrochim. Acta, 2012, 71, 239.
[95] M.Kesik, O. Kocer, F. Ekiz Kanik, N.Akbasoglu Unlu, E. Rende, E.
Aslan-Gurel, R. M. Rossi, Y. Arslan Udum, L. Toppare, Electroanalysis, 2013,
25, 1995.

96
[96] L. Gorton, Electroanalysis, 1995, 7, 23.
[97] S. Tuncagil, D. Odaci, S. Varis, S. Timur, L. Toppare,
Bioelectrochemistry, 2009, 76, 169.
[98] H. J. Brights, M. Appleby, J. Biol. Chem., 1969, 244, 3625.
[99] L. Lineweaver, D. Burk, J. Am. Chem. Soc., 1934, 56 658.
[100] (a) D. Barham and P. Trinder, Analyst, 1972, 97, 142; (b) A. Teuscher, P.
Richterich, Schweiz. Med. Wschr., 1971, 101, 345.
[101] S. Geetha, C. R. K. Rao, M. D. Vijayan, C. Trivedi, Anal. Chim. Acta,
2006, 568,119.
[102] F. Ekiz, M. Yuksel, A. Balan, S. Timur, L. Toppare, Macromol. Biosci.,
2010, 10, 1557.
[103] Q. Fan, D. Shan, H. Xue, Y. He, S. Cosnier, Biosens. Bioelectron., 2007,
22, 816.
[104] D. Wan, S. Yuan, G. L. Li, K. G. Neoh, E. T. Kang, ACS Appl. Mater.
Interf., 2010, 2, 3083.
[105] E. Turan, T. Caykara, React. Funct. Polym., 2011, 71, 1089.
[106] C. Chen, Y. Jiang, J. Kan, Biosens. Bioelectron., 2006, 22, 639.
[107] R. Nathawat, A. Kumar, N. K. Acharya, Y. K. Vijay, Surf. Coat. Tech.,
2009, 203, 2600.
[108] S. Hubert, M. C. Pham, L. H. Dao, B. Piro, Q. A. Nguyen, M.
Hedayatullah, Synth. Met., 2002, 128, 67.
[109] J. Gao, X. Huang, H. Liu, F. Zan, J. Ren, Langmuir, 2012, 28, 4464.
[110] R. Güzel, Z. Üstündag, H. Eksi, S. Keskin, B. Taner, Z.G. Durgun, A. A.
I. Turan and A. O. Solak , J Colloid Interface Sci., 2010, 351, 35.
[111] Z. Tan, J. Liu, Anal. Chem., 2010, 82, 4222.
[112] T. Luczak, Electrochim. Acta, 2009, 54, 586.
[113] Y.Q. Dang, H.W. Li, B. Wang, L. Li, Y. Wu, ACS Appl. Mater.
Interfaces. 2009,1, 1533.
[114] N. German, A. Ramanavicius, J. Voronovic, A. Ramanaviciene, Colloid
Surf. A, 2012, 413, 224.

97
[115] N. German, J. Voronovi, A. Ramanavicius, A. Ramanaviciene, Procedia
Eng., 2012,47,482.
[116] D.R. Paul, L.M. Robeson, Polymer, 2008, 49, 3187.
[117] D. Odaci, M.U. Kahveci, E.L. Sahkulubey, C. Ozdemir, T. Uyar, S.
Timur, Y. Yagci, Bioelectrochemistry, 2010, 79, 211.
[118] Y. Xiao, F. Patolsky, E. Katz, J.F. Hainfeld, I. Willner, Science, 2003,
299,1877.
[119] A. Ramanaviciene, G. Nastajute, V. Snitka, A. Kausaite, N. German, D.
Barauskas-Memenas, A. Ramanavicius, Sensor Actuat. B-Chem., 137,2009,
483.
[120] M. Kesik, F. Ekiz Kanik, G. Hızalan, D. Kozanoglu, E. Nalbant Esenturk,
S. Timur, L. Toppare, Polymer, 54, 2013, 4463.
Top Related