


Languages
Pages
Legal


A conceptual instrument to measure the success of branding in the tourism
industry
JW Hood
10852425
M. Com Tourism Management
Thesis submitted in fulfillment of the requirements for the degree Philosophiae Doctor in Tourism Management at the
Potchefstroom Campus of the North-West University
Supervisor: Prof. Dr. E Slabbert
November 2015

A conceptual instrument to measure the success of branding in the tourism industry I
FINANCIAL
ASSISTANCE
Financial assistance from the North – West University (NWU) as well as workload relief
and financial assistance from Tshwane University of Technology (TUT) is gratefully
acknowledged. Thank you to both marketing managers of both resort groups for the
competition prices sponsored to encourage a better response rate during the surveys.
Statements and suggestions in this thesis are those of the author and should not be
regarded as those of North West University, Tshwane University of Technology or any
of the two resort groups.

A conceptual instrument to measure the success of branding in the tourism industry II
Acknowledgements
I would like to thank the following people who played a significant role throughout the
course of my studies:
To my Heavenly Father for parents that loved and supported me from grade 1 till
now. Further for a wonderful, supporting and loving wife for the past 10 years.
Also for putting various people in my life that encouraged, motivated, guided and
assisted me to become the person I am today.
To my wife Dalene for her assistance, support and understanding. Thank you for
putting up with me as a student for most of our married life. Thank you for putting
up with a sometimes grumpy and difficult man and placing our life on hold in
order for me to complete my studies!
To my little son JW. You may not have understood what I was doing so long at
work or away from home. I know that someday you will be able to look up to me
and hopefully I will be able to encourage you to reach the highest qualification
possible.
To Prof. Dr. Elmarie Slabbert for her guidance, support and encouragement over
the past six years. Being a lecturer myself I know that you sometimes put your
family aside for me. Thanks a million!
To Dr. Suria Ellis for her assistance and help with the statistical analysis.
To the marketing managers of both resort groups for the opportunity provided
and financial support by them to test my conceptual instrument.
In loving memory of my mom, sister and grandparents.

A conceptual instrument to measure the success of branding in the tourism industry III
ABSTRACT
KEYWORDS: Marketing; Tourism; Brand; Evaluation; Measure; Instrument.
Several studies have been completed on branding within the tourism industry and it is
therefore an active research field. The problem is that all of these studies made use of
different measuring instruments to measure branding. These evaluation methods were
mostly adopted from the manufacturing field and applied to the tourism industry. This
research therefore attempts to fill the branding gap in tourism literature by developing a
conceptual instrument (a questionnaire) to measure branding in the tourism industry.
This will give the owner/management an overall view of the performance of the tourism
brand and will allow the owner/management to identify underperforming brand
categories of their overall brand. The method of research for this study is exploratory by
nature and conducted in different phases. Phase A consisted of a literature analysis
whereas phase B consisted of qualitative research. During phases C and D a
quantitative research approach was followed. Since this research focus on developing a
brand measure instrument (questionnaire) directed at the tourism industry, data was
gathered from two major tourism resort groups. A high reliability and inter-item
correlation was the result of a statistical analysis of the initial five brand categories
identified through the literature review. An additional three brand categories were
identified during this study. The measuring instrument therefore has a practical
application that can assist the tourism product to compete at higher levels of branding.
This may result in having a competitive edge that can draw more tourists, retain existing
tourists and ultimately result in a higher turnover.
A conceptual instrument to measure the success of branding in the tourism industry IV
ABSTRAK
SLEUTELWOORDE: Bemarking; Toerisme; Brandmerk; Evaluering; Meting;
Instrument.
Verskeie ondersoeke is reeds oor brandmerking in die toerismebedryf voltooi en dit is
dus ʼn aktiewe navorsingsveld. Die probleem is egter dat al hierdie ondersoeke
verskillende meetinstrumente gebruik het om brandmerking te meet. Hierdie
evalueringsmetodes is meestal uit die vervaardigingsgebied opgeneem en op die
toerismebedryf toegepas. Hierdie navorsing poog dus om die brandmerkingsgaping in
toerismeliteratuur aan te vul deur die ontwikkeling van ʼn konseptuele instrument (ʼn
vraelys) om brandmerking in die toerismebedryf te meet. Dit sal die eienaar/bestuur ʼn
algehele beskouing van die prestasie van die toerismebrandmerk gee en sal die
eienaar/bestuur in staat stel om onderpresterende brandmerkkategorieë van hul
algehele brandmerk te identifiseer. Die navorsingsmetode vir hierdie studie is
verkennend van aard en is in verskillende fases uitgevoer. Fase A het uit ʼn
literatuurontleding bestaan terwyl Fase B uit kwalitatiewe navorsing bestaan het.
Gedurende Fases C en D is ʼn kwantitatiewe navorsingsbenadering gevolg. Aangesien
hierdie navorsing op die ontwikkeling van ʼn brandmerkmeetinstrument (vraelys) vir die
toerismebedryf fokus, is data van twee belangrike toerisme-oordgroepe versamel. ʼn
Hoë betroubaarheids- en inter-itemkorrelasie was die gevolg van ʼn statistiese ontleding
van die aanvanklike vyf brandmerkkategorieë wat uit die literatuuroorsig geïdentifiseer
is. ʼn Bykomende drie brandmerkkategorieë is tydens hierdie studie geïdentifiseer. Die
meetinstrument besit dus ʼn praktiese toepassing wat die toerismeproduk kan steun om
op hoër vlakke van brandmerking mee te ding. Dit kan tot ʼn mededingende snykant lei
wat meer toeriste kan lok, bestaande toeriste kan behou en uiteindelik ʼn hoër omset tot
gevolg kan hê.
A conceptual instrument to measure the success of branding in the tourism industry V
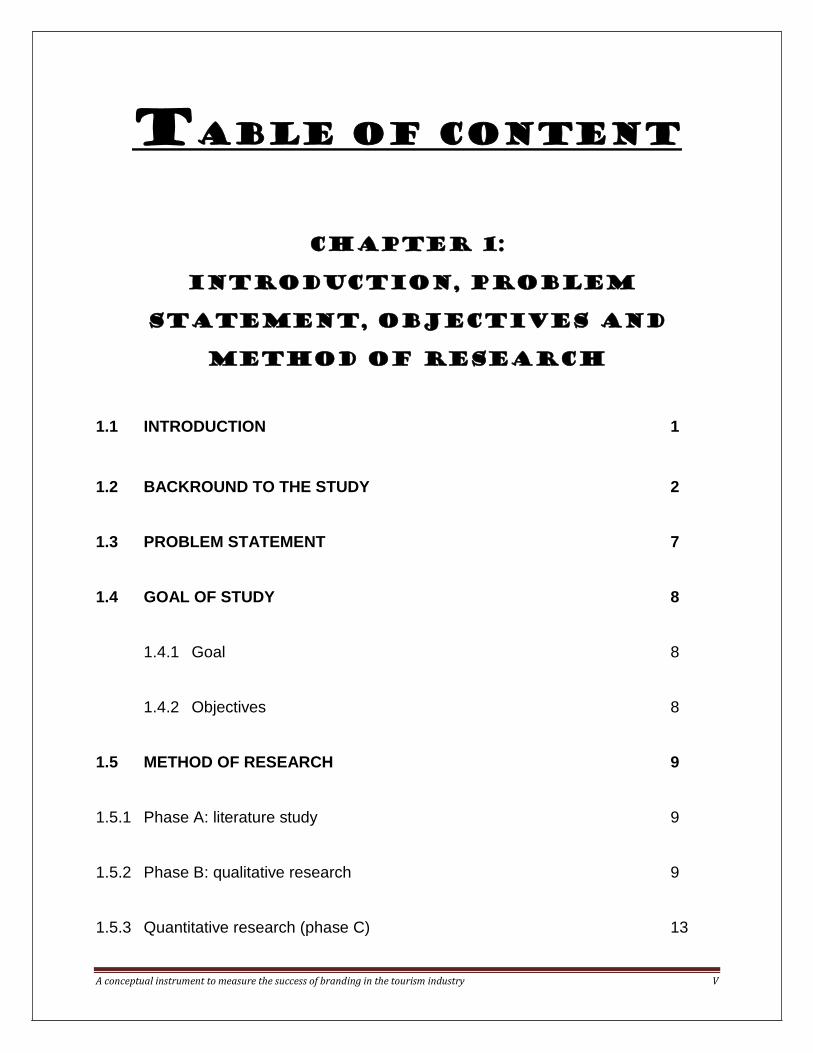
TABLE OF CONTENT
CHAPTER 1:
INTRODUCTION, PROBLEM
STATEMENT, OBJECTIVES AND
METHOD OF RESEARCH
1.1 INTRODUCTION 1
1.2 BACKROUND TO THE STUDY 2
1.3 PROBLEM STATEMENT 7
1.4 GOAL OF STUDY 8
1.4.1 Goal 8
1.4.2 Objectives 8
1.5 METHOD OF RESEARCH 9
1.5.1 Phase A: literature study 9
1.5.2 Phase B: qualitative research 9
1.5.3 Quantitative research (phase C) 13

A conceptual instrument to measure the success of branding in the tourism industry VI
1.5.4 Quantitative research (phase D) 14
1.6 DEFINING THE CONCEPTS 16
1.6.1 Marketing 16
1.6.2 Brand 16
1.6.3 Tourism 16
1.6.4 Measure instrument / questionnaire 17
1.7 CHAPTER CLASSIFICATION 17
CHAPTER 2:
Marketing IN THE TOURISM
INDUSTRY
2.1 INTRODUCTION 20
2.2 EVOLUTION ERAS OF MARKETING 22
2.2.1 Production orientation era 23
2.2.2 Sales orientation era 24
2.2.3 Marketing orientation era 24

A conceptual instrument to measure the success of branding in the tourism industry VII
2.2.4 Societal marketing orientation era 24
2.3 DEFINING MARKETING AND TOURISM MARKETING 25
2.4 BASIC ASPECTS OF MARKETING AND TOURISM MARKETING 27
2.4.1 Characteristics of a tourism product 27
2.4.2 Core principles of marketing 29
2.5 BASIC ASPECTS OF SERVICE MARKETING 38
2.5.1 Defining a service 38
2.5.2 The scale of market entities 38
2.5.3 The molecular model 40
2.5.4 The servuction model 41
2.5.5 Service strategies 43
2.5.5 Consumer behaviour in services 49
2.6 CONCLUSION 59

A conceptual instrument to measure the success of branding in the tourism industry VIII
CHAPTER 3:
BRANDING IN THE TOURISM
INDUSTRY
3.1 INTRODUCTION 61
3.2 DEFINING BRANDING 63
3.3 SIGNIFICANCE OF BRANDING IN THE TOURISM INDUSTRY 64
3.4 BASIC ASPECTS OF TOURISM BRANDING 65
3.4.1 Levels of a tourism brand 65
3.4.2 Functions of a tourism brand 66
3.4.3 Advantages of branding in the tourism industry 68
3.4.4 Forces influencing a tourism brand’s potential 70
3.4.5 Myths about branding 72
3.4.6 Powerful tourism brands can beat competitors 73
3.4.7 Ways to position a tourism brand 76
3.4.8 Components of brand distinction 78
3.4.9 Five E’s of internal branding 80
3.4.10 Brand prism 83

A conceptual instrument to measure the success of branding in the tourism industry IX
3.5 SERVICE BRANDS 84
3.5.1 The importance of services 85
3.5.2 The challenges of services branding 86
3.5.3 Branding to make tangible the intangible 87
3.6 CREATING TOURISM BRANDS 88
3.6.1 Steps to creating a new brand 88
3.6.2 Naming a brand 91
3.6.3 Aspects to consider during brand development 94
3.6.4 Current trends in branding 96
3.7 HOW CONSUMERS CHOOSE BRANDS 99
3.7.1 Brand experiences 99
3.7.2 The influence of brand equity on consumers 99
3.7.3 Brands and the buyer decision process 102
3.7.4 Factors influencing brand selection 103
3.8 CONCLUSION 106

A conceptual instrument to measure the success of branding in the tourism industry X
CHAPTER 4:
A REVIEW OF CURRENT BRAND
MEASURE INSTRUMENTS
4.1 INTRODUCTION 107
4.2 BRAND EVALUATION METHODS 108
4.2.1 Multidimensional evaluation 112
4.2.2 Brand assessment questionnaire (Singapore Government) 120
4.2.3 Brand assessment questionnaire (All-about-branding) 122
4.2.4 Brand audit 126
4.2.5 Criteria to assess the strength of a brand 129
4.2.6 Brand relevance tachometer 131
4.2.7 McKinsey brand diamond 132
4.2.8 Brand purchase funnel 135
4.3 BRAND MEASUREMENT ASPECTS AND ELEMENTS 140
4.3.1 Brand awareness 140
4.3.2 Brand usage 142

A conceptual instrument to measure the success of branding in the tourism industry XI
4.3.3 Brand satisfaction 143
4.3.4 Brand loyalty 144
4.3.5 Brand experience 145
4.4 CONCLUSION 147
CHAPTER 5:
METHOD OF RESEARCH
5.1 INTRODUCTION 148
5.2 RESEARCH DESIGN 148
5.2.1 Exploratory studies 149
5.2.2 Descriptive studies 149
5.2.3 Explanatory studies 149
5.3 SECONDARY DATA 150
5.4 RESEARCH STRATEGIES 150
5.4.1 Experiment 150
5.4.2 Survey 151

A conceptual instrument to measure the success of branding in the tourism industry XII
5.4.3 Case study 151
5.4.4 Action research 151
5.4.5 Grounded theory 151
5.4.6 Ethnography 152
5.4.7 Archival research 152
5.5 SAMPLING TECHNIQUES 152
5.5.1 Probability sampling 152
5.5.2 Non – probability sampling 154
5.6 SAMPLE SIZE 155
5.7 QUESTIONNAIRES 157
5.7.1 Types of questionnaires 157
5.7.2 Choice of questionnaire 158
5.8 THE RESEARCH PROCESS FOLLOWED TO REACH THE GOAL OF THIS
STUDY 158
5.8.1 Phase A: literature study 159
5.8.2 Phase B: qualitative research 160
A conceptual instrument to measure the success of branding in the tourism industry XIII
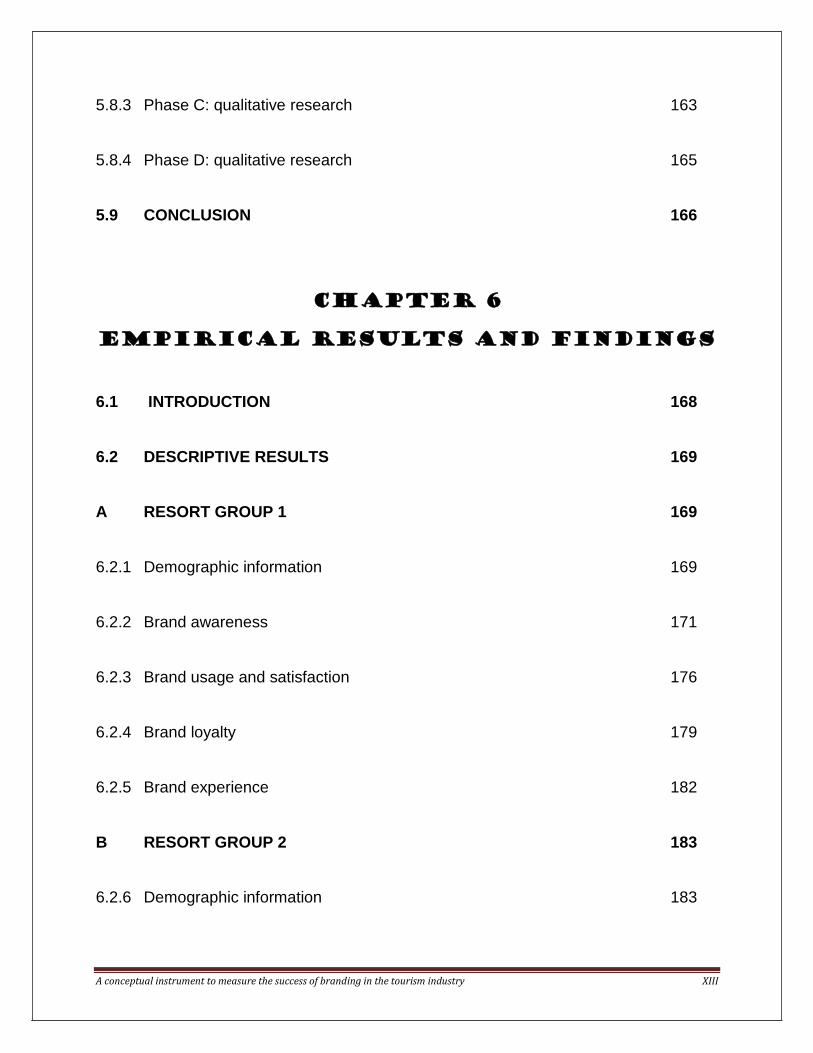
5.8.3 Phase C: qualitative research 163
5.8.4 Phase D: qualitative research 165
5.9 CONCLUSION 166
CHAPTER 6
EMPIRICAL RESULTS AND FINDINGS
6.1 INTRODUCTION 168
6.2 DESCRIPTIVE RESULTS 169
A RESORT GROUP 1 169
6.2.1 Demographic information 169
6.2.2 Brand awareness 171
6.2.3 Brand usage and satisfaction 176
6.2.4 Brand loyalty 179
6.2.5 Brand experience 182
B RESORT GROUP 2 183
6.2.6 Demographic information 183

A conceptual instrument to measure the success of branding in the tourism industry XIV
6.2.7 Brand awareness 185
6.2.8 Brand usage and satisfaction 190
6.2.9 Brand loyalty 193
6.2.10 Brand experience 196
6.3 EXPLORATORY RESULTS 197
6.3.1 Results of phase A 197
6.3.2 Results of phase B 203
6.3.3 Results of phase C 214
6.3.4 Results of phase D 224
6.3.5 Correlation between the brand factors 227
6.4 CONCLUSION 229
CHAPTER 7
EMPIRICAL RESULTS AND FINDINGS
7.1 INTRODUCTION 230
7.2 RESEARCH CONCLUSIONS 232

A conceptual instrument to measure the success of branding in the tourism industry XV
7.2.1 Conclusions from literature review 232
7.2.2 Conclusions from data collected 233
7.3 RESEARCH CONTRIBUTION 240
7.3.1 Methodology contribution 240
7.3.2 Scholarly contribution 249
7.3.3 Practical contribution 250
7.4 RESEARCH RECOMMENDATION 251
7.5 RESEARCH LIMITATIONS 251
ADDENDUM A 290

A conceptual instrument to measure the success of branding in the tourism industry XVI
LIST OF TABLES
Table 1.1 Previous tourism brand research studies 4
Table 1.2 Summary of equity dimensions tested in previous studies 6
Table 1.3 Criteria for selecting expert group members 10
Table 2.1 Levels of service performance 51
Table 4.1 Previous tourism brand research studies 108
Table 4.2 Summary of equity dimensions tested in previous studies 110
Table 4.3 A holistic approach to brand evaluation 113
Table 4.4 Summary of brand health bar chart 119
Table 4.5 Summary of brand assessment questionnaire
(Singapore Government) 122
Table 4.6 Summary of brand assessment questionnaire
(All-about-branding) 126
Table 4.7 Summary of brand audit 129
Table 4.8 Summary of brand dynamics pyramid 131
Table 4.9 Summary of brand relevance tachometer 132
Table 4.10 Summary of McKinsey brand diamond 134
Table 4.11 Summary of brand purchase funnel 136
Table 4.12 Summary of brand evaluation methods 136
Table 4.13 Brand awareness elements 141
Table 4.14 Brand usage elements 142
Table 4.15 Brand satisfaction elements 143
Table 4.16 Brand loyalty elements 144
Table 4.17 Brand experience elements 145
Table 5.1 Sample sizes for different sizes of population at a
95% confidence level 155
Table 6.1 Summary of demographic info: resort group 1 169
Table 6.2 Summary of favourite holiday resort in South Africa 171
A conceptual instrument to measure the success of branding in the tourism industry XVII
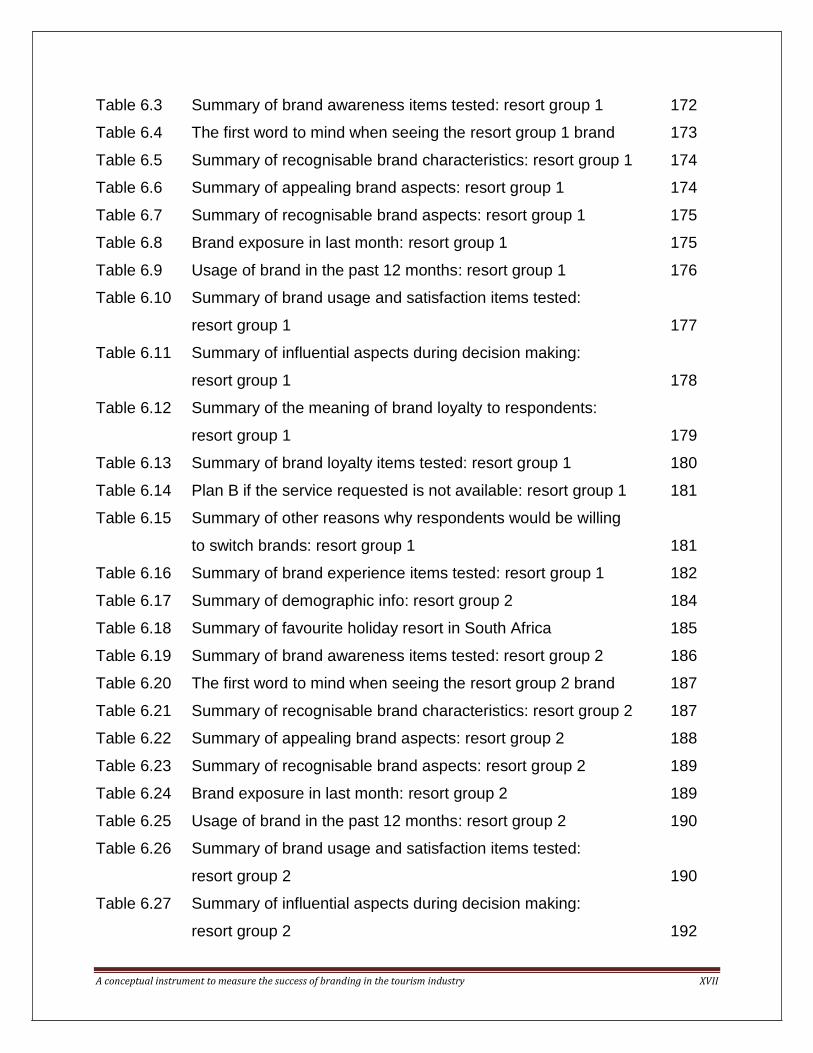
Table 6.3 Summary of brand awareness items tested: resort group 1 172
Table 6.4 The first word to mind when seeing the resort group 1 brand 173
Table 6.5 Summary of recognisable brand characteristics: resort group 1 174
Table 6.6 Summary of appealing brand aspects: resort group 1 174
Table 6.7 Summary of recognisable brand aspects: resort group 1 175
Table 6.8 Brand exposure in last month: resort group 1 175
Table 6.9 Usage of brand in the past 12 months: resort group 1 176
Table 6.10 Summary of brand usage and satisfaction items tested:
resort group 1 177
Table 6.11 Summary of influential aspects during decision making:
resort group 1 178
Table 6.12 Summary of the meaning of brand loyalty to respondents:
resort group 1 179
Table 6.13 Summary of brand loyalty items tested: resort group 1 180
Table 6.14 Plan B if the service requested is not available: resort group 1 181
Table 6.15 Summary of other reasons why respondents would be willing
to switch brands: resort group 1 181
Table 6.16 Summary of brand experience items tested: resort group 1 182
Table 6.17 Summary of demographic info: resort group 2 184
Table 6.18 Summary of favourite holiday resort in South Africa 185
Table 6.19 Summary of brand awareness items tested: resort group 2 186
Table 6.20 The first word to mind when seeing the resort group 2 brand 187
Table 6.21 Summary of recognisable brand characteristics: resort group 2 187
Table 6.22 Summary of appealing brand aspects: resort group 2 188
Table 6.23 Summary of recognisable brand aspects: resort group 2 189
Table 6.24 Brand exposure in last month: resort group 2 189
Table 6.25 Usage of brand in the past 12 months: resort group 2 190
Table 6.26 Summary of brand usage and satisfaction items tested:
resort group 2 190
Table 6.27 Summary of influential aspects during decision making:
resort group 2 192
A conceptual instrument to measure the success of branding in the tourism industry XVIII
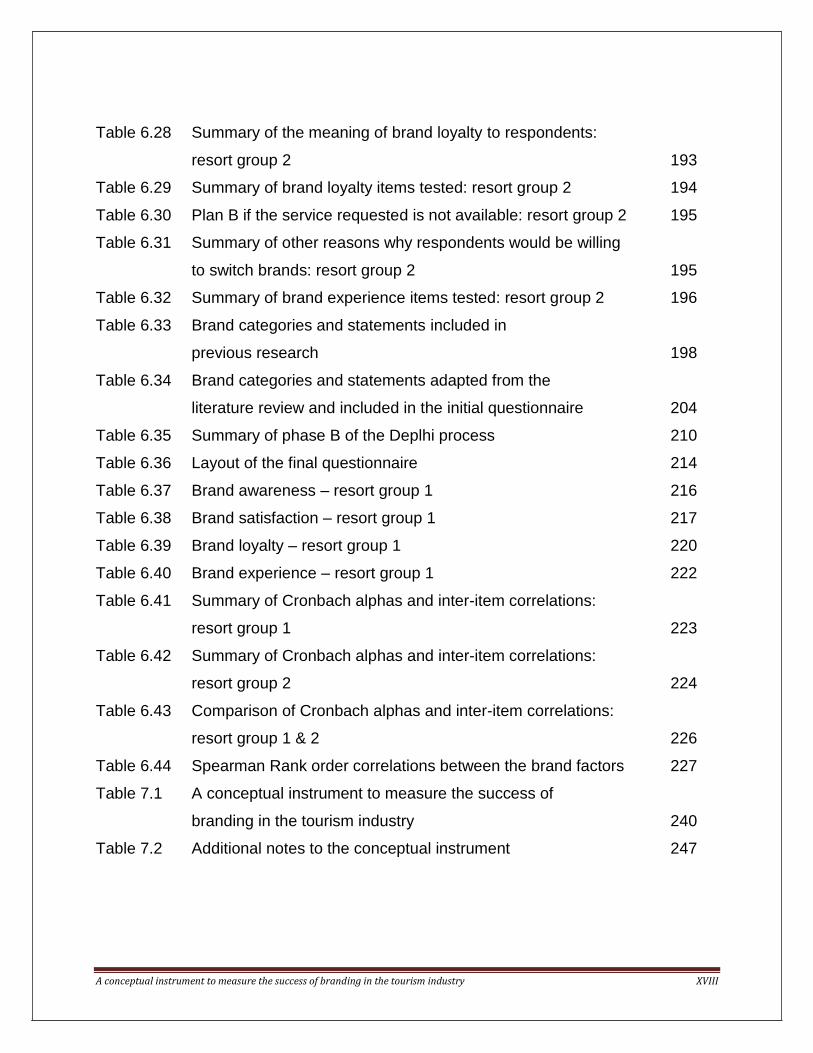
Table 6.28 Summary of the meaning of brand loyalty to respondents:
resort group 2 193
Table 6.29 Summary of brand loyalty items tested: resort group 2 194
Table 6.30 Plan B if the service requested is not available: resort group 2 195
Table 6.31 Summary of other reasons why respondents would be willing
to switch brands: resort group 2 195
Table 6.32 Summary of brand experience items tested: resort group 2 196
Table 6.33 Brand categories and statements included in
previous research 198
Table 6.34 Brand categories and statements adapted from the
literature review and included in the initial questionnaire 204
Table 6.35 Summary of phase B of the Deplhi process 210
Table 6.36 Layout of the final questionnaire 214
Table 6.37 Brand awareness – resort group 1 216
Table 6.38 Brand satisfaction – resort group 1 217
Table 6.39 Brand loyalty – resort group 1 220
Table 6.40 Brand experience – resort group 1 222
Table 6.41 Summary of Cronbach alphas and inter-item correlations:
resort group 1 223
Table 6.42 Summary of Cronbach alphas and inter-item correlations:
resort group 2 224
Table 6.43 Comparison of Cronbach alphas and inter-item correlations:
resort group 1 & 2 226
Table 6.44 Spearman Rank order correlations between the brand factors 227
Table 7.1 A conceptual instrument to measure the success of
branding in the tourism industry 240
Table 7.2 Additional notes to the conceptual instrument 247

A conceptual instrument to measure the success of branding in the tourism industry XIX
LIST OF FIGURES
Figure 2.1 Schematic chapter layout 22
Figure 2.2 The evolution of marketing in non – service industries 23
Figure 2.3 The marketing mix 32
Figure 2.4 The tourism product life cycle 36
Figure 2.5 Scale of market entities 39
Figure 2.6 The molecular model 40
Figure 2.7 The servuction model 42
Figure 2.8 The service triangle 44
Figure 2.9 Service marketing mix 46
Figure 2.10 Service oriented organisational structure 48
Figure 2.11 Factors influencing consumer behaviour 50
Figure 2.12 Zone of tolerance 52
Figure 2.13 Determinants of consumer expectations 53
Figure 2.14 Consumer buying decision process 56
Figure 3.1 Schematic chapter layout 63
Figure 3.2 Components of distinction 78
Figure 3.3 Five E’s of internal branding 81
Figure 3.4 Brand prism 84
Figure 3.5 Creating a brand 89
Figure 3.6 Brand naming process 92
Figure 3.7 Customer based brand equity pyramid 100
Figure 3.8 Buyer decision process 102
Figure 3.9 Phases in brand acquaintance and acceptance 104
Figure 4.1 Brand evaluation: process of building and sustaining brands 112
Figure 4.2 Brand health bar chart – a hypothetical example 119
Figure 4.3 The customer – centric roadmap 128
Figure 4.4 Brand dynamics pyramid 130
Figure 4.5 McKinsey brand diamond 133

A conceptual instrument to measure the success of branding in the tourism industry XX
Figure 4.6 Brand purchase funnel 135
Figure 5.1 Research process applied 159

A conceptual instrument to measure the success of branding in the tourism industry 1
CHAPTER 1
INTRODUCTION AND PROBLEM
STATEMENT
1.1 INTRODUCTION
Traditionally brands are mostly coupled with consumer goods, but destination marketers
are increasingly adopting this method to differentiate themselves from competitors
(Henderson, 2000:36-44). Hankinson (2001:127) argues that creating brands as defined
and discussed in traditional marketing literature is a much more difficult and complex
process when applying it to tourism destinations because the tourism industry is a large,
diverse, complex and vital industry that possesses certain special characteristics
(Jordaan & Prinsloo, 2001:12) such as intangibility, heterogeneity, inseparability and
perishability (Saayman, 2002:339). Therefore, according to Cai (2002:721), the tourist is
not able to ‘test’ the destination with all its components, before making a choice. Cai
(2002:721) further mentions that this means that the final decision of the tourist involves
a greater risk and therefore leads to a more intensive information search. The result of
this is that the destination brand acts as a critical stimulus to motivate tourists and assist
them in their destination choice.
The difficulties in applying the principles of branding in the tourism industry also create
difficulties in measuring the success of a brand in this industry. Brand measurement
instruments are lacking for the tourism industry even though they can add value to the
marketing process.
The aim of this chapter is to describe the research problem, identify the goals and
objectives, the related method of research and to clarify important concepts.

A conceptual instrument to measure the success of branding in the tourism industry 2
1.2 BACKGROUND TO THE STUDY
Bergvall (2007:1) points out that it is a complex task for newcomers to branding to grasp
what branding is all about. “Thanks to a huge amount of interest in branding during the
1990s, most people have grasped the fact that branding is more than a logo” (Bergvall,
2007:2). Researchers such as Czinkola and Ronkainen (1991:284–287) and Balmer
and Gray (2000:256) further add that brand names are a reflection of the destination.
The term ‘brand’, according to these researchers, refers to a name, term, symbol, sign
or design used by a destination to distinguish its offerings from those of other
destinations. Brands are one of the most standard stable items in the product offering
and they may allow further standardisation of other marketing elements such as
promotional items. The brand mark may become invaluable when the product itself
cannot be promoted but the symbol can be used. The term ‘trademark’ refers to the
legally protected part of the brand, indicated by the symbol (Czinkola & Ronkainen,
1991:284–287). Czinkola and Ronkainen (1991:285) further indicated that the
psychological power of brands is vast and that brands are powerful marketing tools.
Managing a brand can thus be an effective tool even if the brand is constructed around
a memory (Bergvall, 2007:2), as is the case with many tourism products.
Choosing a brand for a destination is a vital promotional consideration owing to the fact
that the brand communicates attributes and connotation to potential visitors (Balmer,
2001:2). Marketers search for brand names that can communicate destination concepts
and help position the destination in the mind of the consumers (Belch & Belch,
1998:56). According to Dahringer (1992:357) and Wood (2002:226-230), destinations
should develop brands only after they have considered the costs of developing a brand
image relative to the benefits. Dahringer (1992:357) implies that when a destination
decides to create a brand themselves, the brand name and image become part of the
total tourist experience. By providing status, a brand name can even command a price
premium, thus helping to insulate the marketer against low-priced competitors. Branding
therefore plays an imperative role in the marketing of tourism products.
However, according to Pike (2002:2), research on the application of branding appeared

A conceptual instrument to measure the success of branding in the tourism industry 3
in the marketing literature only during the 1940s. The growth in the branding research
was evident during the second half of the 20th century with an estimated 766
publications on general branding. According to Pike (2002:2) the first journal article was
by Dosen, Vransevic and Prebezac in 1998. This article analysed the appropriateness
of Croatia’s brand. The same year also saw the first destination branding case study on
Wales by Pritchard and Morgan. Other research was conducted but concentrated not
exclusively on branding. This research included destination image (Gallarza, Saura &
Garcia, 2002; Pike, 2002), destination positioning (Chacko, 1997; Reich, 1997;
Woodside, 1982) and destination slogans (Klenosky & Gitelson, 1997; Pritchard, 1982;
Richardson & Cohen, 1993).
The new millennium saw texts emerge on destination branding by Morgan, Pritchard
and Pride during 2002 and 2004. This was followed by analysis of city branding in the
context of tourism and film traditions by Donald and Gammack (2007) based on
Sydney, Hong Kong and Shanghai. Baker (2007) then conducted research on the
practitioner’s perspective on the branding of small cities in North America. Destination
marketing text that includes destination branding was only researched by Pike in 2004
and 2008. According to Pike (2009:2), the Journal of Vacation Marketing of 1999,
volume 5, was the first journal with a special edition on destination branding only. This
has since been followed by a special issue on place branding in The Journal of Brand
Management (2002, Vol. 9) and then Tourism Analysis (2007, Vol. 12, 4). The study
and publication of destination branding is therefore a relatively new field that still
demands in-depth research.
According to Murphy, Moscardo and Benckendorff (2007:5), there has been a rapid
growth in destination branding over the past few years and this branding approach is
often used to promote tourism destinations. The researchers further indicated that this
concept evolved from the background of general tangible consumer goods. It has since
been applied to a number of national tourism destinations, but the intellectual analysis
of the value and effectiveness of destination branding and its measurement is slowly
developing. Murphy et al. (2007:5) also indicated that the tourism industry lacks an

A conceptual instrument to measure the success of branding in the tourism industry 4
appropriate and reliable brand measuring instrument that will allow comparative
analyses and assist in effective product development.
Table 1.1 summarises some of the previous tourism-related branding research by
highlighting the evaluation methods used in each study.
Table 1.1: Previous tourism brand research studies
Author(s) Study completed Evaluation method used
What was evaluated?
Clarke (2000:329-344)
Tourism brands: an exploratory study of the brands box model
Chernatony and McWilliam brands box model
The application of the brand box model’s four-cell matrix on two dimensions of a brand
Yoo and Donthu (2001:1-14)
Developing and validating a multidimensional consumer-based brand equity scale
22 dimensions of brand equity
Evaluated dimensions of brand equity
Cai (2002:720-742) Cooperative branding for rural destinations
Conceptual model for destination branding
Examined destination image through conceptual destination brand model
Gnoth (2002:262-179)
Leveraging export brands through a tourism destination brand
Theoretical model Examined the development of a country as its tourism brand became international
Kim and Kim (2005:549-560)
The relationship between brand equity and firms’ performance in luxury hotels and chain restaurants
Application of Aaker’s perceptual brand equity components
Examined the underlying dimensions of brand equity and how they affect company performance
Yeoman, Durie, Beattie and Palmer (2005:134-147)
Capturing the essence of a brand from its history: the case of Scottish tourism marketing
Brand essence wheel Examined how the history of Scottish tourism becomes a pattern for the future
Konecnik and Gartner (2006:400-421)
Customer-based brand equity for a destination
Exploring and evaluating brand equity using four dimensions: brand loyalty, brand awareness, brand image and perceived quality
Customer-based brand equity applied to a destination
Lee and Back (2007:331-344)
Attendee-based brand equity
Evaluating brand equity using four dimensions: brand loyalty, brand awareness, brand image and perceived quality
Investigated conference attendee behaviours from brand equity perspective
Murphy et al (2007:5-14)
Using brand personality to differentiate regional tourism destinations
Application of Aaker’s personality dimension
Examined the value of destination brand personality

A conceptual instrument to measure the success of branding in the tourism industry 5
Tasci, Gartner and Cavusgil (2007:1529-1540)
Measurement of destination brand bias using a quasi-experimental design
Quasi-experimental design Measured three different spaces of destination image
Konecnik and Go (2008:177-189)
Tourism destination brand identity: the case of Slovenia
Theoretical framework to analyse tourism destination identity
Explored concept of destination brand identity from supply-side
Tores and Bijmolt (2008:628-640)
Assessing brand image through communalities and asymmetries in brand-to-attribute and attribute-to-brand associations
Assessing communalities and asymmetries between brand-to-attribute and attribute-to-brand associations
Assessed communalities and asymmetries between brand-to-attribute and attribute-to-brand associations
Boo, Busser and Baloglu (2009:219-231)
A model of customer-based brand equity and its application to multiple destinations
Customer-based brand equity model
Examined empirical information to develop a destination brand model
Marzano and Scott (2009:247-267)
Power in destination branding
Australia’s Golden Coast branding process (forms of power)
Examined forms of social power evident in a destination branding process
According to Table 1.1 branding consists of various elements that make the
development of standardised measuring instruments more difficult. The research by
Tasci, Gartner and Cavusgil (2007:1529-1540) evaluated twenty two image dimensions
of a modified Gensch’s methodology. The thrust of Gensch’s methodology measured
three different perception spaces of a brand to distil possible biases held by current and
potential users. Limitations to this study indicated that the sample population was
relatively young as the study was conducted only among a student population.
Furthermore, a movie clip was used as a substitute for first hand experiences of the
destination brand, thus the realism was influenced. Lastly, the study was conducted on
only one destination brand and not tested again.
The research by Murphy et al. (2007:5-14) also made use of a questionnaire consisting
of three components. In the first component respondents were asked to describe their
perception of the destination’s brand by using only three words. For the second
component respondents had to indicate on a 1 to 5 likert scale their associations with
the five brand dimensions and fifteen corresponding brand facets as identified by Aaker.
The last component of the questionnaire explored the link between the destination

A conceptual instrument to measure the success of branding in the tourism industry 6
brand and the self image/ identity using Sirgy and Su’s proposed measures of self-
congruity. Limitations to this study indicated a low visitation to the destination and the
fact that there was a strong indication that Aaker’s traditional product brand personality
model did not translate directly to a tourism destination brand.
Finally, the research by Boo et al. (2009:219-231), Kim and Kim (2005:549-560),
Konecnik and Gartner (2006:400-421), Lee and Back (2007:331-344) and Yoo and
Donthu (2001:1-14) all examined the underlying dimensions of brand equity and how
they affect an organisation’s or destination’s brand performance. In all of the above
mentioned studies, the measurement of brand equity consisted of five dimensions,
namely brand loyalty, brand awareness, brand recognition, perceived quality and brand
image. Table 1.2 summarises these four dimensions.
Table 1.2: Summary of equity dimensions tested in previous studies
Equity dimension tested What did the study include? Type of questions used
Brand loyalty Measured six items Seven-point likert scale
Brand awareness Measured three items Open ended questions
Brand recognition Respondents chose from a list Open ended question
Multiple choice questions
Perceived quality Focused on respondents’
perceptions
Seven-point likert scale
Brand image Focused on items specific to
the product category
Seven-point likert scale
According to Table 1.2, the studies by Boo et al. (2009:219-231), Kim and Kim
(2005:549-560), Konecnik and Gartner (2006:400-421), Lee and Back (2007:331-344)
and Yoo and Donthu (2001:1-14) mostly employed six measurement items of brand
loyalty on a seven-point Likert scale. Brand awareness that refers to “the strength of a
brand presence in the respondent’s minds”, was evaluated based on three scale items,
namely: top-of-mind brand, unaided brand recall and brand recognition. These were
mostly evaluated by open-ended questions such as “Write down the name of the luxury
hotel situated in Seoul that firstly comes to mind” or “List three other luxury hotels

A conceptual instrument to measure the success of branding in the tourism industry 7
situated in Seoul that comes to mind”. Brand recognition was measured by asking
respondents to choose brand names that they are familiar with from a list. The
questions were mostly open-ended or multiple choice. Perceived quality was mostly
measured by using a seven-point likert scale and questions focused only on the
respondents’ perceptions rather than their expectations. Brand image included the
development of scale items specific to the product category and all items were
measured on a seven-point likert scale. These researchers assumed that a high scale
point of brand image indicated that the brand not only had a positive image for the
respondent, but also exhibited a greater level of brand image strength in comparison
with other brands.
Limitations to these studies included: not investigating every possible unrelated effect
that could change or influence a brand’s performance besides brand equity; most of the
studies were constrained to respondents from a single country; the quality of data used
in the research may be vulnerable owing to non-probability sampling methods used and
problems linked to Internet coverage. It was thus clear that research should be
considered to develop a questionnaire that can effectively measure the effectiveness of
a brand in the tourism industry. The lack of an instrument is evident.
1.3 PROBLEM STATEMENT
It is clear from the discussion above that, firstly, several studies have been completed
on branding within the tourism industry and it is therefore an active research field within
the tourism industry. Secondly, these listed studies made use of different measuring
instruments (as indicated above) to measure branding. These evaluation methods were
mostly adopted from the manufacturing field and tweaked a little to be applied to the
tourism industry. Thirdly, limited studies was done on a South African brand. Lastly,
none of the evaluation methods has been standardised to measure the effectiveness of
branding in the tourism industry. This creates difficulty in terms of comparative studies
and hinders the development of research in this field of study.
This research therefore attempts to fill the branding gap in tourism literature by

A conceptual instrument to measure the success of branding in the tourism industry 8
developing a conceptual instrument (a questionnaire) to measure branding in the
tourism industry. As with previous studies, this conceptual instrument also focused on
brand awareness, brand recognition, brand usage, brand satisfaction, brand loyalty and
brand satisfaction. The lack of measuring the brand experience, which is very relevant
in a tourism context, was evident and was therefore added to this research. However, it
is adapted to the needs of the tourism industry which is more focused on creating an
experience. This conceptual instrument may then be used by tourism destinations or
tourism product owners to determine the effectiveness of their current brand. It will also
enable these tourism product owners and marketers to identify possible problem areas
concerning the brand, allowing immediate action. This, in turn, can then have a positive
influence on the profitability and sustainability of the evaluated tourism brand. The
conceptual instrument can enable destinations to determine the weak points of their
brands and correct these in future. The conceptual instrument can also enable
researchers to compare different tourism brands in future and ultimately contribute to
the much neglected field of tourism research. Lastly, this research was the first step in
the process to develop a standardised tourism brand measure instrument.
The research question therefore remains: what are the items that need to be included in
a questionnaire that focuses on measuring the success of a tourism brand?
1.4 GOAL OF STUDY
1.4.1 Goal
The goal of this study was to develop a conceptual instrument to measure the success
of branding in the tourism industry. This instrument may then be used by product
owners and marketers in determining the success of respective tourism brands.
1.4.2 Objectives
To conduct a literature review on some of the important aspects of tourism marketing
To conduct an in-depth literature review on the role of branding in tourism marketing

A conceptual instrument to measure the success of branding in the tourism industry 9
To identify and analyse current models and tools used to measure brand
effectiveness by means of an in-depth literature review
To conduct a literature review to establish which brand elements should be included
in the conceptual tourism brand measure instrument
To evaluate and test the tourism brand measurement instrument on two well-known
and established tourism brands in South Africa
To draw conclusions and make recommendations regarding the application of the
conceptual tourism brand measure instrument
1.5 METHOD OF RESEARCH
The method of research for this study was exploratory by nature and was conducted in
different phases. Phase A refers to the literature analysis, Phase B to the qualitative
research and phases C and D to the quantitative research. These are discussed in the
next section.
1.5.1 Phase A: literature study
In formulating the literature study, relevant academic articles, tourism, marketing and
management books as well as existing brand measurement instruments was used.
Journals such as Annals of tourism research, Tourism management and the Journal for
brand management as well as postgraduate studies were used to gather secondary
information. Further information was obtained by using academic Internet search
engines such as Science Direct, Ebsco-Host and Emerald. The purpose of the literature
study was to establish which brand measurement tools currently exist and how these
were applied to the tourism industry by previous researchers.
The following keywords were used for search purposes: brand, brand awareness, brand
loyalty, destination image, brand personality, tourism marketing, tourism promotion,
brand equity, experience and brand perception.
1.5.2 Phase B: qualitative research
This section highlights the first method chosen to conduct the empirical analysis.

A conceptual instrument to measure the success of branding in the tourism industry 10
1.5.2.1 Research design, method of collecting data and test plan
The research for this part of the study was exploratory, as the Delphi technique was
used to gather and analyse the data. This technique is described by researchers as a
qualitative method but with quantitative elements (Malhotra & Birks, 2006:75). The
Delphi technique involves the gathering and analysis of information from a panel of
experts in a particular field of interest. The experts in the field completed a
questionnaire indicating their views on which brand elements to include in the
conceptual brand measurement instrument. These views were then collated and
circulated to panel members for further comment and repeated for a second time before
final results were collated (Veal, 2006:105; Jennings, 2001:283). The Delphi technique
comprised of the following steps:
Step 1: Develop the research question – A review of the literature was conducted to
determine the theoretical gap. From this, fifty-seven possible elements were identified
and included in the initial questionnaire.
Step 2: Design the research – The Delphi technique was selected as judgements of
experts in a group decision-making setting was needed (Cant, Gerber-Nel, Nel & Kotze,
2003:27). During this research, a total of sixteen invitations were sent to domestic
experts, eighteen to domestic experts from the industry and seventy to international
experts to participate in this research. Those who had previous knowledge on tourism
branding or who were currently working on aspects of branding were given priority
placement in either the domestic or international groups. Table 1.3 indicates the criteria
that were used as a guideline in selecting expert group members:
Table 1.3: Criteria for selecting expert group members
Member type Criteria for selection
Domestic At least a Master’s degree or equivalent qualification
Lecturing tourism marketing for at least 3 years
South African citizen

A conceptual instrument to measure the success of branding in the tourism industry 11
Track record of conference papers delivered
Publications in well-known marketing journals
International At least a Master’s degree or equivalent qualification
Lecturing tourism marketing for at least 3 years
Non-South African citizen
Track record of conference papers delivered
Publications in well-known marketing journals
Industry At least a degree or equivalent qualification
Employed within the tourism industry for at least 5 years
with a focus on tourism marketing
Actively involved in the marketing of a company
Selecting the research participants was a critical part of this exploratory study, since it
was these participants’ expertise on which the outcome of the Delphi technique was
based (Chrisnall, 2001:34). There were four requirements for ‘expertise’. Firstly, they
had to have knowledge of and/ or experience with branding and its application.
Secondly, they had to have the capacity and willingness to participate. Thirdly, they had
to have sufficient time to participate. Fourthly, effective communication skills were
needed (Chrisnal, 2001:34; Adler & Ziglio, 1996:25). Since expert opinions were sought,
a purposive sample was necessary where participants were not selected to represent
the general population, but rather for their expert ability to answer the research
question.
During the initial contact, the potential respondents were contacted via e-mail, informed
about the research process and invited to participate. They were assured of anonymity
in the sense that none of their statements would be attributed to them by name. From
the total of sixteen invitations sent to domestic experts, eighteen to domestic experts
from industry and seventy to international experts, only sixteen indicated that they would
participate in this research. After securing the participation of the respondents, the
questionnaire was finalised for round one of the Delphi technique.

A conceptual instrument to measure the success of branding in the tourism industry 12
Step 3: Develop Delphi technique Round 1 questionnaire – The initial broad questions
were developed through careful analysis and evaluation of the literature and formed the
focus of the Delphi technique, the reason being that if respondents did not understand
the question, they might provide inappropriate answers and/ or might become
frustrated. The initial fifty-seven elements identified through the literature research were
included in the draft questionnaire. This draft questionnaire utilised a 5-point Likert scale
to rate each element and determine the appropriateness of each item in measuring the
success of a tourism brand.
Step 4: Release and analyse Round 1 questionnaire – The draft questionnaire was then
distributed via e-mail to the sixteen Delphi participants who accepted the invitation. The
draft questionnaire was compiled in Excel format with a clear description on each part to
be completed. The participants were given 10 days to complete the draft questionnaire
and they were also allowed to add elements they considered appropriate. Each of the
fifty-seven elements was rated on a 5-point Likert scale and returned to the researcher
via email. The results of Round 1 were then analysed according to the research
paradigm. This allowed the researcher to eliminate irrelevant elements by using the
median values. Owing to the fact that 1 = extremely important and 5 = not important at
all, all elements higher than 2.5 were eliminated.
Step 5: Develop Round 2 questionnaire – The responses from Round 1 formed the
basis of the questions in the Round 2 questionnaire. The researcher was directed by the
opinions of the sixteen participants. The purpose of Round 2 was to pare down the
brand elements (Veal, 2006:107). The format of the questions remained the same.
Step 6: Release and analyse Round 2 questionnaire – The Round 2 questionnaire
consisted of fifty-two elements and was released to the sixteen research participants for
the second time via e-mail. They were once again requested to complete and return the
questionnaire to the researcher for analysis. However, the participants were firstly given
the opportunity to verify that the Round 1 responses did indeed reflect their opinions
and that they were further afforded the opportunity to change or expand their Round 1

A conceptual instrument to measure the success of branding in the tourism industry 13
responses now that the other research participants’ answers were shared with them
(Veal, 2006:107). Continuous verification throughout the Delphi technique was critical to
improve the reliability of the results (Chrisnall, 2001:34) and was factored into the
research design. After analysis, non-valid elements were eliminated from the
questionnaire by using the median values. Owing to the fact that 1 = extremely
important and 5 = not important at all, all elements higher than 2.5 were eliminated.
Step 7: Round 3
In the final phase, a list of the remaining elements was e-mailed to the participants. The
sixteen research participants were again given the opportunity to change their answers
and to comment on the emerging and collective perspective of the research
participants. The purpose of this phase was to reach consensus on the final elements to
be included in the conceptual instrument. This conceptual instrument then formed the
basis of Phase C of this study. This final questionnaire consisted of fifty-one elements.
1.5.2.2 Sampling framework and sampling technique
During Phase B, the potential respondents were invited via e-mail, informed about the
research process and invited to participate. They were assured of anonymity in the
sense that none of their statements would be attributed to them by name. A total of
sixteen invitations were sent to domestic experts, eighteen to domestic experts from the
industry and seventy to international experts. Purposive sampling was therefore
implemented in this part of the study.
1.5.2.3 Data analysis
The data was coded on SPSS (Version 18) and analysed according to the research
paradigm (statistical summarising into medians plus upper and lower quartiles). The
results were then presented with descriptive tables (Field, 2005:10).

A conceptual instrument to measure the success of branding in the tourism industry 14
1.5.3 Quantitative research (Phase C)
1.5.3.1 Research design and method of collecting data
The research design was of an exploratory nature, since this research focused on
developing a questionnaire. The questionnaire (as completed in phase B) was finalised
and distributed electronically through the marketing department of a well-known resort
group in South Africa (for the purpose of this study referred to as ‘resort group 1’) to its
members. This resort group was chosen since their brand was already well established
and well-known.
1.5.3.2 Sampling framework and sampling technique
Resort group 1 has been operational for 85 years and currently has approximately 70
000 members. An e-mail invitation was sent by the resort group’s marketing department
to all their members stating the purpose and significance of the research. A link to the
brand questionnaire in Survey Monkey was included in this invitation. The sampling was
therefore based on the availability and willingness of members to complete the
questionnaire, but sent to the complete database. Each respondent was able to
complete the questionnaire without interference from the researcher. Upon completion
of the questionnaire, all respondents were automatically thanked for their participation
and the completed questionnaire was available to the researcher via the Survey
Monkey website. A total of 2 152 fully completed questionnaires was collected and
analysed. The response rate was therefore 3% of the current member base.
1.5.3.3 Data analysis
A factor analysis was performed to synthesise the large amount of data. This was done
on all of the elements identified in phase B. The results are presented with descriptive
tables (Field, 2005:10) in chapter 6. Cronbach Alpha Coefficients were calculated to
determine the reliability of the data before continuing to phase D.

A conceptual instrument to measure the success of branding in the tourism industry 15
1.5.4 Quantitative research (Phase D)
1.5.4.1 Research design and method of collecting data
Research design was of an exploratory nature, since this research focused on
developing a conceptual instrument to measure the success of branding in the tourism
industry. Following phase C, and once the results of the factor analysis had been
obtained, changes were made to the conceptual instrument and distributed through the
marketing department of a second well-known resort group in South Africa (for the
purpose of this study known as ‘resort group 2’) to potential respondents on their
database. The data and results of both groups in phases C and D were compared to
determine the reliability for two different tourism products. The purpose of this phase
was to validate and determine the reliability of the data.
1.5.4.2 Sampling framework and sampling technique
Resort group 2 was bought by an international company and therefore underwent a
brand change a few years ago. Their brand is therefore relatively young in South Africa
compared to the brand of resort group 1. Unlike resort group 1, resort group 2 did not
have a membership program in place; an e-mail invitation was therefore sent by the
resort group’s marketing department to all possible respondents on their current
database (approximately 20 000) stating the purpose and significance of the research.
This database totalled a number of about twelve thousand e-mail addresses. A link to
the brand questionnaire in Survey Monkey was included in this invitation. The sampling
was therefore based on the availability and willingness of recipients to complete the
questionnaire. Each respondent was able to complete the questionnaire without
interference from the researcher. Upon completion of the questionnaire, all respondents
were automatically thanked for their participation and the completed questionnaire was
available to the researcher via the Survey Monkey website. A total of 599 fully
completed questionnaires was collected and analysed. The response rate was therefore
2.9% of the current data base.

A conceptual instrument to measure the success of branding in the tourism industry 16
1.5.4.3 Data analysis
A factor analysis was performed to synthesise the large amount of data. This was done
on all the elements identified in Phase B. The results are presented with descriptive
tables (Field, 2005:10) in chapter 6. Confirmative Cronbach Alpha Coefficients were
calculated to determine the reliability of the data.
A detailed discussion on the research methodology appears in chapter 5.
1.6 DEFINING THE CONCEPTS
The following concepts were used during this study:
1.6.1 Marketing
In comparing the descriptions of Belz and Peattie (2012:2), Kotler and Armstrong
(2010:2), Morrison (2010:5), Backer (2009:4), Smith and Alexander (2006:1), Cahill
(2006:4), Kotler and Armstrong (2006:5), Kotler and Keller (2006:4), West, Ford and
Ibrahim (2006:6), Engelbrecht (2005:1), Bennett and George (2004:2), Bowie and Buttle
(2004:8), Perreault and McCarthy (2003:10), Mawson (2000:5) and Kuzwayo (2000:2) it
was found that they define marketing as a social and managerial process by which
individuals and groups obtain what they need and want through creating and
exchanging products and values with others.
1.6.2 Brand
In comparing the descriptions of Shimp (2010:34), Cheverton (2006:1), Van Auken
(2005:14), Kapferer (2004:5), Kotler and Gertner (2002:4), Aaker (2002:7), Machado
and Cassin (2002:81), George (2001:172) and Laws (1997:84), it was found that they
define a brand as a unique name and/ or symbol (such as a logo, trademark or package
design) intended to identify the goods or services of one seller, or group of sellers, and
to distinguish those goods or services from one another. The brand and its use are also
legally protected.

A conceptual instrument to measure the success of branding in the tourism industry 17
1.6.3 Tourism
According to Kotler, Bowen and Makens (2010:5), Holloway (2009:6), McCabe (2009:2),
Duval (2007:6), George (2007:3), Page (2007:10), Cooper, Fletcher, Fyall, Gilbert and
Wanhill (2005:6), Horner and Swartbrooke (2005:2), Robinson and Novelli (2005:3),
Plog (2004:5), Middleton and Clarke (2001:3), Bennett (2000:4), Burke and Resnick
(2000:3), the definition of tourism refers to the activity that occurs when tourists travel.
This includes all facets from the planning of the trip, travelling to the destination, the
stay at the destination, the return home and the reminiscences about it afterwards. It
also includes the activities the traveller undertook as part of the trip, purchases made
and the interactions that occurred between host and guest.
1.6.4 Measurement instrument/ questionnaire
According to Davis (2007:XV), a measurement instrument/ questionnaire is designed by
evaluating a set of characteristics according to a pre-established scoring method.
1.7 CHAPTER CLASSIFICATION
Chapter 1 consists of the introduction, problem statement and methodology used in this
study. It focuses on previous research, the different evaluation methods used and
identifies the gap this research is trying to fill. It also explains how the Delphi technique
is implemented during this study.
Chapter 2 concentrates on the literature review of general marketing which forms the
basis of branding. This chapter highlights seven aspects. Part one explains the four
evolution eras of marketing, part two indicates the definitions pertaining to marketing
and tourism marketing, part three explains the basic aspects of tourism marketing, part
four focuses on the scale of market entities and molecular models, part five explains the
factors that influence the experience of services, part six explains consumer behaviour
in services by highlighting the four main factors that influence consumer behaviour and
finally the seven stages of the consumer buying decision process are discussed.

A conceptual instrument to measure the success of branding in the tourism industry 18
Chapter 3 concentrates on the literature review of branding in general and within the
tourism industry. A background on branding and all its related aspects are discussed.
This chapter then highlights five aspects. Firstly, the term branding is explained
according to various authors, followed by the significance of branding. Part three of the
chapter explains some basic aspects of branding. Part four of the chapter discusses
how brands are created, aspects to consider during brand development and current
trends in branding. Part five of this chapter indicates how consumers choose brands by
explaining how equity influences consumers, the buyer decisions process and factors
influencing brand selection.
Chapter 4 focuses on the evaluation of eight current brand measure instruments. This
chapter firstly discusses and secondly summarises each measurement instrument to
establish similarities and identify possible gaps. The elements identified from the
literature review of chapters 2 and 3, together with the similarities and gaps of current
brand measure instruments, are reconciled to form the bases of this conceptual
instrument. As with previous studies, this conceptual instrument also focuses on brand
awareness, brand recognition, brand usage, brand satisfaction and brand loyalty. Brand
experience is added as a new evaluation category by this study.
Chapter 5 briefly summarises the research process in general and elaborates on the
research process followed for this study. The chapter firstly explains three different
research designs and a discussion on examining available secondary data. Thirdly,
seven research strategies are discussed with emphasis on the survey strategy utilised
for this study. Fourthly, the different phases of the research process are explained.
Phase A includes a literature study to establish which brand measurement tools
currently exist and how these were applied by previous researchers to the tourism
industry. Phase B consists of a number of steps. Firstly, brand measurement elements
are indentified through an in-depth literature review. Secondly, a process is followed to
invite and finalise the participation of a panel of domestic academic, international
academic and industry experts. These experts then form part of step 3 that consists of a
process whereby the indentified brand measurement elements of phase A are rated and

A conceptual instrument to measure the success of branding in the tourism industry 19
if necessary are eliminated. The process is repeated until the brand measurement
elements were finalised that need to form part of the draft questionnaire. During phase
C, the questionnaire (as completed in phase B) is finalised and distributed electronically
through the marketing department of a well-known resort group in South Africa (resort
group 1) to its members. The purpose of phase C is to determine the reliability of the
data. Following phase C, and once the results of the factor analysis are obtained,
changes are made to the conceptual instrument and distributed through the marketing
department of a second well-known resort group in South Africa (resort group 2) to all
members on their database. The data and results of phase D are then compared to
those of phase C to determine the validity and reliability of the instrument. The purpose
of phase D is therefore to validate the reliability of the data.
The purpose of Chapter 6 is twofold. Firstly, the descriptive results for the five
categories identified (brand awareness, brand usage, brand satisfaction, brand loyalty,
brand experience) are discussed to portray the basic features of the data collected for
both resort groups 1 and 2. Secondly, the development of the conceptual instrument is
discussed by explaining and providing the results of the four phases followed.
During phase A, a literature study was conducted using relevant academic articles. The
goal of this phase is also twofold. The first goal is to identify and analyse current models
and tools used to measure brand effectiveness by means of an in-depth literature
review. The second goal is to conduct a literature review to establish which brand
elements should be included in the conceptual tourism brand measurement instrument.
Phase B of this study is exploratory, as the Delphi technique is used to gather and
analyse data from a panel of experts. This involves a seven step process to reach
consensus on the final elements to be included in the conceptual instrument. Phase C
of this study is also of an exploratory nature, since this research focuses on developing
a brand measurement instrument (questionnaire). The purpose of phase C is to
determine the reliability of the data. This was done by conducting a factor analysis and
calculating Cronbach alphas, inter-item correlations and mean values. The purpose of

A conceptual instrument to measure the success of branding in the tourism industry 20
the last phase (D) is to validate the results of phase C and thereby proving the reliability
of the proposed brand measurement instrument.
Finally, Chapter 7 draws conclusions and makes recommendations based on the
overall goal of this study.

A conceptual instrument to measure the success of branding in the tourism industry 21
CHAPTER 2
MARKETING IN THE TOURISM
INDUSTRY
2.1 INTRODUCTION
Marketing is generally recognised as being central to many industries including the
tourism industry (George, 2008:4; Kotler, Bowen & Makens, 2006:3). Marketing also
helps to direct the available tourism resources of a destination to meet the needs of
current and potential tourists. The importance of marketing has increased over the past
decade owing to vigorous changes in the internal and external marketing environment.
These changes include increased ecological awareness, political changes, economic
fluctuations and increased competition within the industry (Cant, 2010:23). Marketers
must therefore focus on defining and satisfying tourists’ requirements as best they can
to be successful in the ever-changing marketing environment (McDaniel, Lamb & Hair,
2009:3). Kotler et al. (2006:10) added to this view by indicating that marketers must
identify tourists’ needs, develop tourism products in line with those needs, establish
price, lay down distribution methods and market effectively.
In recent years, many people have associated marketing as being the same as personal
selling. Others associate marketing with personal selling, advertising and even
something to do with making products/ services available for future sales (McDaniel et
al., 2009:3). According to all the researchers mentioned, marketing includes these
aspects and many more. Marketing also involves more than just the activities performed
by the marketing department. It entails processes that focus on delivering value and
benefits to tourists by employing communication, distribution and pricing strategies. It
further provides tourists and stakeholders with goods, services, ideas, values and
benefits they desire or need when and where they want. It also involves building long-

A conceptual instrument to measure the success of branding in the tourism industry 22
term and jointly satisfying relationships. Marketing finally entails an understanding that
organisations have many connected stakeholders or partners, including employees,
suppliers, distributors and society at large (Cant, 2010:23; McDaniel et al., 2009:3;
Page, 2007:2).
George (2001:xi) quotes the Minister of Environmental Affairs and Tourism at the time,
Mr Valli Moosa, who indicated that tourism and hospitality are recognised by many
countries as the world’s largest and fastest growing industry owing to the foreign
exchange earnings it generates. Mr Moosa added that tourism in South Africa already
makes a great contribution to the development of the economy in terms of job creation
and foreign exchange earnings, but that it still holds great unlocked potential. The
minister finally mentioned that marketing holds the key to successfully unlocking South
Africa’s tourism potential, clearly emphasising the importance of this management
function.
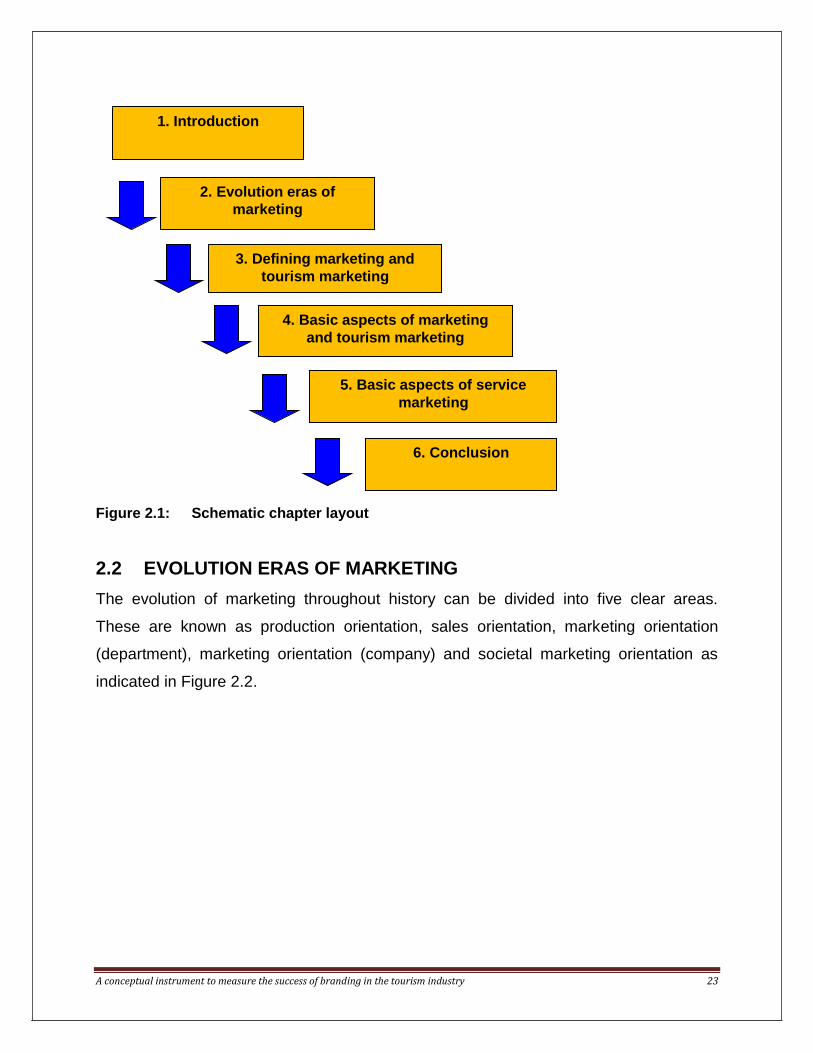
Figure 2.1 indicates the layout of the chapter. The purpose of this chapter is to unlock
some of the important aspects of tourism marketing to serve as the theoretical
framework of the study. This will be done by firstly explaining the evolution eras of
marketing and defining what marketing and tourism marketing are. The basic aspects of
tourism marketing will then be explained. This includes the unique characteristics of a
tourism product/ service and the seven core principles of marketing implied on the
tourism industry. Once the basic aspects of tourism marketing are understood, the focus
will shift to basic aspects of service marketing. This is because of the fact that tourism
products include services, and services are part of tourism products (Hoffman &
Bateson, 2001:4; Smith & Allexander, 2006:247). This will be done by focusing on
models to further indicate the difference between goods and services, factors that
influence the experience of services, service strategies such as the service triangle,
service marketing mix and how a service-oriented organisational structure functions.
Lastly, consumer behaviour in services will be explained by highlighting the factors that
influence consumer behaviour, how consumers develop expectations and finally
explaining the consumer buying decision process.
A conceptual instrument to measure the success of branding in the tourism industry 23
Figure 2.1: Schematic chapter layout
2.2 EVOLUTION ERAS OF MARKETING
The evolution of marketing throughout history can be divided into five clear areas.
These are known as production orientation, sales orientation, marketing orientation
(department), marketing orientation (company) and societal marketing orientation as
indicated in Figure 2.2.
1. Introduction
2. Evolution eras of
marketing
3. Defining marketing and
tourism marketing
4. Basic aspects of marketing
and tourism marketing
5. Basic aspects of service
marketing
6. Conclusion

A conceptual instrument to measure the success of branding in the tourism industry 24
Figure 2.2: The evolution of marketing in non-service industries
Source: Morrison (2002:5)
From the figure above, it is firstly important to note that there are differences in the
evolution of marketing in service and non–service industries (Morrison, 2010:8-13;
Morrison, 2002:4). The evolution of marketing in non-service industries may be labelled
as follows:
2.2.1 Production orientation era
This era was the first evolutionary stage in the development of marketing. It began with
the industrial revolution and continued into the 1920s. During this era demand was so
high that factories could not keep up with supply. Every item that was produced could
be sold, so management only concentrated on production. This meant that customers’
needs and wants were a secondary item in management’s minds (Belz & Peattie,
2012:13; McDaniel, Lamb & Hair, 2009:4; Strydom, 2004:8).
1920 -1930
Production orientation
1930 -1950
Sales orientation
1970 - Present Societal marketing
orientation
1960 -1970 Marketing orientation
(company)
1950 -1960 Marketing orientation
(department)

A conceptual instrument to measure the success of branding in the tourism industry 25
2.2.2 Sales orientation era
Technological advances in production and increased competition gradually transformed
the emphasis of marketing during this era. There was enough capacity to meet demand,
competition intensified and the prominence switched from production to selling. The
basic idea was that people would buy more if aggressive sales techniques were used
and that higher sales equal higher profits. Customers’ needs and wants were to a
certain extent still secondary in management’s minds (Belz & Peattie, 2012:13;
McDaniel et al., 2009:5; Strydom, 2004:9; Morrison, 2002:5).
2.2.3 Marketing orientation era
This era resulted from even more strong competition and technological advances.
Supply exceeded demand and marketing developed as an academic discipline.
Organisations suddenly began to understand that focusing on selling did not guarantee
satisfied customers or even higher sales. Customers now suddenly had more options to
choose from than ever before and were able to select products and services that best
satisfied their needs. Customers’ needs were the number one priority of management
(McDaniel et al., 2009:5). This era had two stages, namely the marketing-department
era and marketing-company era (Morrison, 2002:5). During the marketing-department
era, new departments were set up and even renamed to coordinate marketing activities.
A common phrase of this era was, “That’s not our problem. It’s the marketing
department’s.” An organisation-wide change of attitude occurred with the start of the
marketing-company era in the 1960s. A common phrase during this era was, “It’s
everyone’s problem if our customers are not satisfied”. Marketing was seen as a long-
term, organisational concern (Belz & Peattie, 2012:13; Strydom, 2004:8; Morrison,
2002:6).
2.2.4 Societal marketing orientation era
This was the final evolution to date. It began in the 1970s when organisations began to
recognise their societal responsibility additional to profits and customer satisfaction.
Companies advertising now included the responsible use of products and services sold
(Morrison, 2002:6).

A conceptual instrument to measure the success of branding in the tourism industry 26
The evolution of marketing in the service industries did not follow the same historical
evolution as mentioned above. According to Belz and Peattie (2012:14) and Morrison
(2002:10) the service industry was lagging behind some ten to twenty years. Reasons
for this include aspects such as the fact that many managers have come up through the
ranks while working in the company and that major technological breakthroughs came
later to the service industry. Because of this, service managers have had thirty years
and less to perfect their marketing skills compared to non-service managers.
These differences in the evolution of service and non-service industries highlight a very
important fact, namely that marketing of tourism services differs greatly from that of the
manufacturing industry. It is therefore important to firstly indicate the differences
between marketing and tourism marketing.
2.3 DEFINING MARKETING AND TOURISM MARKETING
According to McDaniel, Lamb and Hair (2009:3), Kotler and Armstrong (2006:5),
Drummond and Ensor (2005:2), Engelbrecht (2005:1), Lamb, Hair, McDaniel, Boshoff
and Terblanche (2004:4), Strydom (2004:2) as well as Bowie and Buttle (2004:8),
marketing is the process of planning and executing the conception, pricing, promotion
and distribution of ideas, goods and services to create exchanges that satisfy individual
and organisational goals. The marketing of a tourism product/ service differs in that it
applies mostly to an intangible experience (Hoffman & Bateson, 2001:3). George
(2001:4) points out that many people often use the term “marketing” without knowing
what it really entails; people see it as a way of getting other people to spend money, but
that this belief is totally incorrect. George (2001:4) and Holloway (2004:7) contend that
marketing is more about tourists – how to find them, how to satisfy them and how to
keep them.
Hingston (2001:79) indicates that potential tourists will know nothing about a tourism
product/ service unless attempts have been made to inform them. These attempts to
inform them, according to Lancaster and Reynolds (2002:70), are known as marketing.

A conceptual instrument to measure the success of branding in the tourism industry 27
A combination of various communication tools is used in the marketing process and
may include publicity and public relations, personal selling, advertising and promotions.
Lancaster and Reynolds (2002:70) state that different approaches may be used to
market the destination. To be able to answer the question as to what marketing really is,
it is important to analyse the basic principles of marketing and indicate if, and how, it
differs to that of tourism marketing.
According to Hoffman and Bateson (2001:4), the division between products and
services is not always perfectly clear. The researchers indicated that a pure product
would entail that the benefits received by the customer contained no elements supplied
by a service. Similarly, a pure service would contain no product elements. This means
that in reality many services contain some product elements and products bought offer
at least a delivery service. The distinction is further obscured by the fact that most
businesses within the tourism industry conduct business on both sides of the fence.
Despite the confusion, a good starting point to understand the difference between
products and services, is the following: products can be defined as objects, devices or
things whereas services indicate deeds, efforts or performances (Lamb, Hair &
McDaniel, 2005:266). Moreover, the term “product” is often used and refers to both
goods and services (Kotler & Armstrong, 2006:252; Smith & Alexander, 2006:247;
Perreault & McCarthy, 2003:185; Hoffman & Bateson, 2001:4; Mawson, 2000:55).
Tourism can thus be referred to as a product because tourism can include both a
physical product as well as the services associated with its delivery. Furthermore, the
aspects associated with marketing can therefore also apply to tourism marketing. These
basic aspects of marketing that can apply to tourism marketing are discussed in the
next section.
2.4 BASIC ASPECTS OF MARKETING AND TOURISM MARKETING
There are three important terms in marketing that are commonly used as
interchangeable terms: buyer, consumer and customer (Rao, 2007:71). According to the
researcher there is a substantial difference in the meaning of these terms and that the

A conceptual instrument to measure the success of branding in the tourism industry 28
understanding of such differences has strategic significance. A consumer is one who
consumes goods and/ or services (products). A consumer includes human beings,
animals, birds, trees and all those who have the capacity to consume. A buyer is that
person who buys goods and or services (products). All buyers are human beings and
also represent those consumers who cannot buy. The term “customer” finds meaning
from a selling point of view. If a buyer repeatedly buys goods and/ or services (products)
from a company, he/ she is known as a customer.
According to Keyser (2002:169) as well as Perrault and McCarthy (2003:208), tourism
products are bought by visitors when visiting that destination. These offerings include
accommodation, transport, attractions and entertainment. The marketing of tourism-
related products differs from the marketing of manufactured products as the
characteristics of tourism products are different.
2.4.1 Characteristics of a tourism product
Marketing a tourism product differs from marketing a manufactured product based on
the following criteria (Lamb, Hair & McDaniel, 2005:267; Bowie & Buttle, 2004:22-25;
Hoffman & Bateson, 2001:8-11; Perrault & McCarthy, 2003:186-187):
2.4.1.1 Intangibility
Saayman (2002:339) states that tourism products cannot be seen, tasted, felt, heard or
smelled prior to purchase or consumption. Jordaan and Prinsloo (2001:12) indicate that
all other characteristics emerge from intangibility and that it is the primary source of
differentiation between manufactured products and tourism products. Marketing tools
such as pictures are used to make the tourism product as tangible as possible to
potential visitors.
2.4.1.2 Inseparability
Kerin, Hartley and Rudelius (2004:212) believe that this unique element of a tourism
product means that the offerings delivered cannot, and may not, be separated from the
service itself. This is also explained by George (2001:20) as instances where tourism

A conceptual instrument to measure the success of branding in the tourism industry 29
products are sold first, and then consumed and produced simultaneously. George
(2004:20) adds that both provider and consumer are involved in the process of delivery.
2.4.1.3 Variability
Variability indicates that the quality of a tourism product is unpredictable because
service delivery depends on the people who are involved in the delivery process (Kerin
et al., 2004:212). These researchers add that this is due to daily job performances and
each individual’s capabilities. Kotler and Armstrong (1999:43) aver that a service is
highly variable and, according to the researchers, quality depends on when and where
the service is provided and by whom it is delivered. Kotler, Bowen and Makens
(2003:43) mention that a major cause of customer disappointment in the tourism
industry is due to variability or lack of consistency.
2.4.1.4 Perishability
Perishability, according to George (2004:21) as well as Kotler et al. (2003:43) describes
offerings that cannot be stored, saved, resold or returned after use. This simply means
that a tourism product that is not sold today cannot be stored and added to tomorrow’s
offering. The product itself exists, but what is sold is the temporary use or the
experience of the product. If unsold it is then lost forever (Kotler et al., 2006:44).
2.4.1.5 Heterogeneity
This aspect, according to Hoffman and Bateson (2001:38), is the inability to control
service quality before it reaches the consumer. According to the researchers, service
encounters occur in real time and consumers are part of the delivery process
(inseparability). Owing to this inseparability it is often too late to introduce quality-control
measures before the service reaches the consumer.
Morrison (2002:18) notes that, apart from the unique characteristics of a tourism
product, effective tourism and hospitality marketing includes the following seven core
principles: the marketing concept, marketing orientation, satisfying customers’ needs

A conceptual instrument to measure the success of branding in the tourism industry 30
and wants, market segmentation, value and the exchange process, marketing mix and
the product/ service life-cycle. Each of these principles will be discussed next.
2.4.2 Core principles of marketing
2.4.2.1 Marketing concept
According to Morrison (2002:18), this concept means that a tourism product is based on
those elements that satisfy buyers’ needs and wants. Product owners are constantly
putting themselves in buyers’ shoes to establish how customers would react. This
concept requires constant research on the needs of current and potential visitors
(Morrison, 2010:23-25; Kotler & Armstrong, 2006:10).
2.4.2.2 Marketing orientation
Having a marketing orientation implies that the product owner has accepted the above
mentioned marketing concept and acts according to it (Morrison, 2010:19; Kotler &
Armstrong, 2006:10).
2.4.2.3 Satisfying customer needs and wants
Owing to survival in the current competitive business environment (Morrison, 2010:25;
Morrison, 2002:19) all tourism product organisations must realise that the key to long-
term existence lies in satisfying customers’ or buyers’ needs and wants. This often
involves the identification of new buyer needs and wants and converting them into
sales.
2.4.2.4 Market segmentation
Lancaster and Reynolds (2002:38) claim that segmentation means dividing the market
into groups that share similar needs and wants. According to the researchers, not all
buyers are alike; therefore they have different needs and desires that do not apply to a
single product. Lancaster and Reynolds (2002:38) and Cahill (2006:15) mention that
effective segmentation can be achieved by grouping together demand and giving a

A conceptual instrument to measure the success of branding in the tourism industry 31
uniform demand to specific buyers to achieve effective tourism and hospitality
marketing.
McCabe (2009:147-159), Kotler and Armstrong (2006:219), Lee and Johnson (2005:91-
92), Lamb et al. (2004:132-140), Strydom (2004:65-75) and Mawson (2000:39-40) point
out that tourist markets can be segmented according to the following:
Behavioural segmentation
This means that current customers and potential buyers can be divided into
segments based on their knowledge, attitude towards and the use of tourism-related
products.
Geographic segmentation
This signifies that current customers and potential buyers can be grouped according
to origin, market size, market density or climate.
Demographic segmentation
Marketers often use this type of segmentation and it can be done in accordance with
age, gender, income, ethnic group and family life-cycle.
Psychographic segmentation
This type of segmentation incorporates demographic segmentation. This is done by
segmenting current customers and potential buyers according to personality (habits),
motive of visit, lifestyle and geo-demographics (combination of geographic and
demographic variables).
Benefit sought segmentation
This segmentation can be done by grouping current customers and potential buyers
in accordance with the benefits they seek from using the tourism-related product.

A conceptual instrument to measure the success of branding in the tourism industry 32
Expenditure-based segmentation
Finally, current customers and potential buyers can be segmented according to the
sum of money spent on the tourism product. According to Srivastava (2000:1) this is
the total consumption expenditure made by a customer/ buyer while using a tourism-
related product.
2.4.2.5 Value and the exchange process
Value represents a mental estimate that current customers and potential buyers make
of a tourism-related product ability to satisfy their needs and wants (Morrison, 2002:19).
Some customers/ buyers equate value closely with price; others do not. It is also
important to understand that price is not the only indicator of value.
2.4.2.6 Marketing mix
The traditional marketing mix consists of the four P’s: product, price, place and
promotion (Lamb, Hair & McDaniel, 2006:51; Middleton, 2001:90; George, 2001:9; Reid
& Bojanic, 2001:13-15; Kotler, 2000:5).
Blem (2001:3) as well as Kerin et al. (2004:12) states that the marketing mix is one of
the most basic aspects of marketing. The different components of the marketing mix
can be used to communicate with customers/ buyers (Rix, 2004:9). Lancaster and
Reynolds (2002:24) indicate that a marketing strategy is like a recipe to marketers.
According to these researchers, the ingredients are the marketing mix; as a recipe
varies according to a dish, so do different marketing mix components vary in order to
market a tourism-related product successfully to consumers/ buyers. Lancaster and
Reynolds (2002:24) conclude by saying that success means not miscalculating any
minor ingredient of the marketing strategy used.
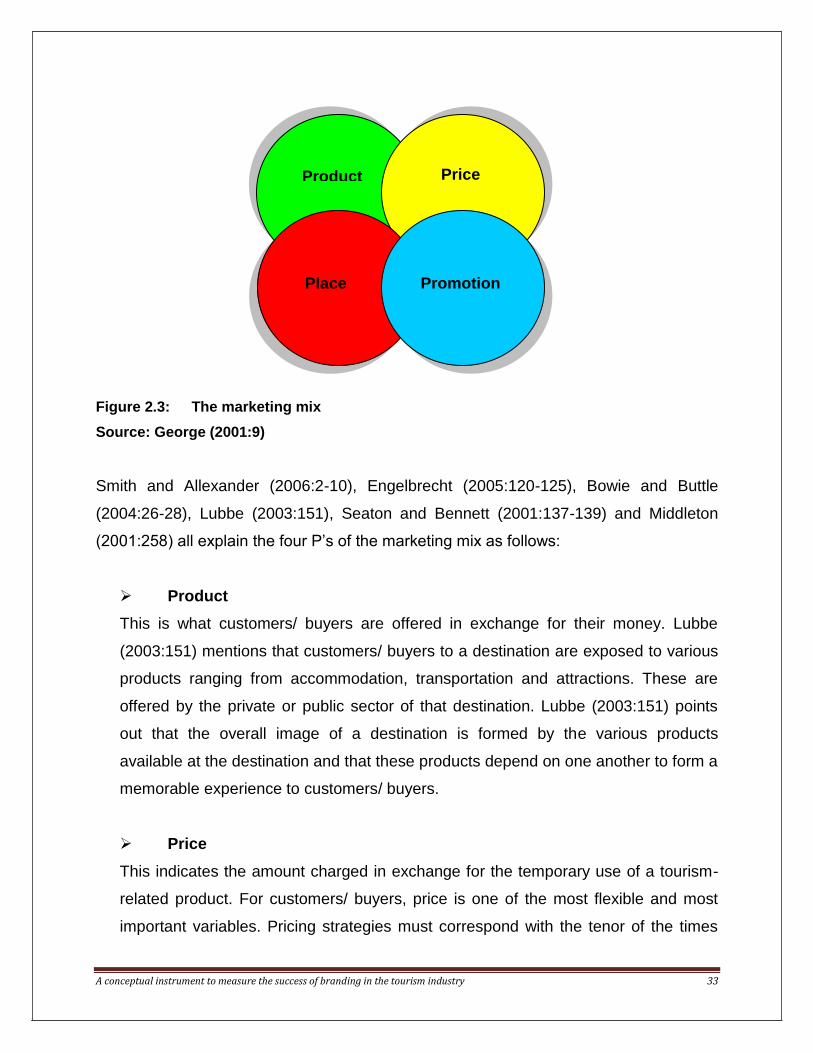
A conceptual instrument to measure the success of branding in the tourism industry 33
Figure 2.3: The marketing mix
Source: George (2001:9)
Smith and Allexander (2006:2-10), Engelbrecht (2005:120-125), Bowie and Buttle
(2004:26-28), Lubbe (2003:151), Seaton and Bennett (2001:137-139) and Middleton
(2001:258) all explain the four P’s of the marketing mix as follows:
Product
This is what customers/ buyers are offered in exchange for their money. Lubbe
(2003:151) mentions that customers/ buyers to a destination are exposed to various
products ranging from accommodation, transportation and attractions. These are
offered by the private or public sector of that destination. Lubbe (2003:151) points
out that the overall image of a destination is formed by the various products
available at the destination and that these products depend on one another to form a
memorable experience to customers/ buyers.
Price
This indicates the amount charged in exchange for the temporary use of a tourism-
related product. For customers/ buyers, price is one of the most flexible and most
important variables. Pricing strategies must correspond with the tenor of the times
Product Price
Place Promotion

A conceptual instrument to measure the success of branding in the tourism industry 34
and still be flexible to respond to changing market conditions (Lubbe, 2003:155). The
researcher further mentions that competition within the tourism industry affects the
prices charged and that pricing policies and strategies are determined by the target
markets selected. According to Seaton and Bennett (2001:137-139), these pricing
strategies can also be used to control consumer/ buyer demand. Seaton and
Bennett (2001:137-139) and Allen, O’Toole, Harris and McDonnell (2008:110-11)
established that pricing strategies can produce the following outcomes:
Maximise access
Public sector organisations are often judged by the levels of service they
provide to local communities, who ultimately pay their salaries.
Restrict access
Discriminatory pricing may be used to restrict access to certain buyer
segments to protect another segment. This is particularly common in the
marketing of luxury tourism products.
Control demand in time
Price can also be used to manage tourism demand during different periods.
During higher demand times, higher prices may be charged and lower prices
during low demand periods. This is common in the tourism industry where
high and low seasons are applicable.
Control demand in space
Price can also be used to disperse people away from certain areas. High
prices may be charged for prime tourism-related products while lower prices
may be charged for products not yet known to customers/ buyers.
Place
This indicates the channels used in the tourism industry to get customers/ buyers to
the destination in order to use the tourism-related products. Holloway and Robinson

A conceptual instrument to measure the success of branding in the tourism industry 35
(2000:128) declare that various channels or intermediaries can be used to reach
customers/ buyers, and define these intermediaries as any dealer who acts as a link
between the tourism-related product and the customer/ buyer. According to Lubbe
(2003:155), distribution is a major consideration for any tourism-related product and
must be available and accessible to the intended target market. In conclusion, the
researcher mentions that the tourism industry is unique in the sense that customers/
buyers must be transported to the destination to enjoy tourism-related products and
not vice versa.
Promotion
This indicates methods that are used to inform and remind customers/ buyers of a
tourism-related product and to try to persuade them to buy. This may include
personal or impersonal methods. It is not enough to develop attractive tourism-
related products, price them attractively and ensure that they are readily available.
These products must be communicated to customers/ buyers to motivate them so
that they can make use of these offerings (Lubbe, 2003:155). According to Middleton
(2001:258), sales promotions are aimed at the following three main targets:
Individual buyers
Additional short-run purchases are the objective of promotions aimed at
individual users. These may, for example, include pay for two nights – stay an
extra night free of charge.
Distribution networks
Third party distributors, such as travel agents, are targeted by promotions if
the tourism-related products receive most of their sales revenue through
these distribution networks.

A conceptual instrument to measure the success of branding in the tourism industry 36
Sales force
A sales force is required for larger organisations to service and motivate
corporate customers/ buyers and distribution networks by using incentives or
reward systems.
2.4.2.7 Product life-cycle
According to Engelbrecht (2005:157), Lancaster and Reynolds (2002:181), Ferrell,
Hartline and Lucas (2002:112), a tourism-related product passes through a number of
stages during its existence (Figure 2.4). These researchers indicate that a number of
things can happen once a tourism-related product has been launched onto the market.
It may be an instant success, meaning sales growing rapidly, but it can also decline
again as new opposing or revitalised old tourism products start competing strongly with
it. The tourism-related product may also be moderately successful and continue to be
profitable for a number of years. The last possibility may be that the tourism product
fails completely. Kapferer (2008:238), Brown (2006:5), Kotler and Armstrong
(2006:299), Yeshin (2006:59), Holloway (2004:146) and Perreault and McCarthy
(2003:208-210) identified the stages of the product life-cycle: gestation, introduction,
growth, maturity, saturation, decline and revival. According to these researchers, the
aim of all tourism-related products is to avoid the decline stage and remain in the
maturity stage for as long as possible. The introduction of new updated tourism-related
product features can result in revived purchases.

A conceptual instrument to measure the success of branding in the tourism industry 37
Figure 2.4: The tourism product life-cycle
Source: Adapted from Brown (2006:5) & Holloway (2004:146)
Figure 2.4 shows the five stages. Stokes and Lomax (2008:229), Brown (2006:5-6),
Holloway (2004:146-148), Perrault and McCarthy (2003:208-209), Lancaster and
Reynolds (2002:181) as well as Reid and Bojanic (2001:13-15) explain these stages as
follows:
Gestation
The first stage is the period during which the new tourism-related product is
developed and its future planned. At this stage financial investment is required.
Introduction stage
This relates to the period when a new tourism-related product is launched onto the
market. The researchers mention that its duration depends on the market
Introduction Growth Maturity
Decline Revival
Gestation
Time & Stages
Vo
lum
e

A conceptual instrument to measure the success of branding in the tourism industry 38
penetration and ends when a high awareness is achieved. It will then move into the
next stage known as the growth stage.
Growth stage
According to the researchers, there is still high promotional expenditure to gain
market share during this stage. They also mention that brand promotion has taken
over from product awareness and that distribution is important to establish
dealerships and distributive outlet agreements. This stage ends as the tourism-
related product becomes a brand leader and starts moving into the maturity stage.
Maturity stage
According to the researchers, much marketing activity is devoted to this stage as it is
characterised by competition. The researchers indicate that the following are
characteristics of this stage: sales continue to grow, attempts are made to
differentiate products in an effort to retain market share, prices are cut, brand and
inventory validation occurs among retailers and distributors and marginal products
are leaving because of severe competition and price cuts. This then leads to the
decline stage.
Decline stage
According to the researchers, consistent dropping of sales signifies this stage. They
indicate the following characteristics associated with decline: continuous dropping of
sales, escalation of price cutting and destinations abandoning the market.
Revival stage
There are many different ways in which a tourism-related product can rejuvenate
itself and the method chosen will depend on the reason for the initial decline. If the
decline occurred through the introduction of a new competitive product,
management may choose to add similar benefits or add new but different benefits.
Lowering prices might also be chosen as an option. More money could also be spent
on advertising and more emphasis placed on promoting the tourism-related product.

A conceptual instrument to measure the success of branding in the tourism industry 39
2.5 BASIC ASPECTS OF SERVICE MARKETING
As mentioned in section 2.3, services form part of and play a significant role in tourism-
related products. It is therefore important firstly to define a service.
2.5.1 Defining a service
According to Rao (2007:7), services may be defined as intangible activities performed
by persons or machines or even both, for the purpose of creating value perceptions
among customers/ buyers. As mentioned earlier (see 2.3), services form part of and
play a significant role in tourism-related products.
Various aspects in the above mentioned section 2.4 indicate the differences between
products and services. Even in service marketing the difference is evident. The
following models may help to understand/ indicate these differences.
2.5.2 The scale of market entities
This is a common way of indicating the difference between products and services
(Hoffman & Bateson, 2001:4-5). The scale of market entities (Figure 2.5) displays a
range of products based on their tangibility.

A conceptual instrument to measure the success of branding in the tourism industry 40
Figure 2.5: Scale of market entities
Source: Hoffman & Bateson (2001:5)
According to Figure 2.5 above, pure products are tangible dominant and pure services
intangible dominant. This means that products possess physical properties that can be
felt, tasted and seen prior to purchase. In contrast, services lack these physical
properties and consequently the following marketing challenges become evident: the
service is advertised that no one can see; the price of a service has no cost of goods
sold; the service cannot be stored and individuals are needed to perform a service. By
using the scale of market entities, a product can then be clearly defined according to
tangible or intangible dominant. Interestingly, when service aspects are added to
products that are sold, it is seen as a product and this product then transforms from a
TANGIBLE
DOMINANT
INTANGIBLE
DOMINANT
Salt
Soft d
rinks
Dete
rge
nts
Auto
mo
bile
s
Cosm
etics
Fast-
food o
utlets
F
ast
– fo
od o
utlets
Advert
isin
g a
ge
ncie
s
Airlin
es
Investm
en
t m
ana
gem
ent
Consultin
g
Teachin
g

A conceptual instrument to measure the success of branding in the tourism industry 41
commodity into an experience. This change can then in turn increase the revenue –
producing opportunities of the product dramatically.
Hoffman and Bateson (2001:8) identified a second way to indicate differences between
goods and services and are discussed next.
2.5.3 The molecular model
According to Hoffman and Bateson (2001:8), the molecular model reinforces the
understanding that virtually all products have both tangible and intangible elements.
This model is often used as a management tool to visualise a firm’s entire product.
Figure 2.6 provides an explanation according to two products, namely airlines and
motor cars. All tangible elements of the product are denoted in red circles and intangible
elements in green circles.
Transport
Pre- and post-flight
service
Service frequency
Vehicle
In flight service
Food & drink
Price
Distribution
Airlines
Market position
Tangible elements
Intangible elements

A conceptual instrument to measure the success of branding in the tourism industry 42
Figure 2.6: The molecular model
Source: Hoffman & Bateson (2001:8)
The Servuction model, according to Hoffman and Bateson (2001:10-14), is an
uncomplicated but powerful way to illustrate factors that influence the experience of the
service part of a product. This model is discussed next.
2.5.4 The servuction model
This model consists of two parts: that which is visible to customers/ buyers and that
which is not.
Vehicle
Transport
Options
Price
Distribution
Motor cars
Market position
Tangible elements
Intangible elements

A conceptual instrument to measure the success of branding in the tourism industry 43
Figure 2.7: The servuction model
Source: Hoffman & Bateson (2001:10)
According to Figure 2.7 above, the visible part consists of three sub-parts, namely the
inanimate environment, contact personnel/ service providers and other customers. The
invisible part consists of the invisible organisation and its systems.
2.5.4.1 The inanimate environment
This refers to all lifeless features that are presented during the service encounter.
Because the service part of tourism-related products is intangible, it cannot be
objectively evaluated. Customers/ buyers thus look for tangible cues that surround the
service on which to base their service performance evaluation. These may include
aspects such as furniture, flooring, lighting, music, odours, wall hangings and
countertops.
Customer A
Customer B
Bundle of service benefits received by
Customer A
Invisible Visible
Contact personnel or service provider
Inanimate environment
Invisible organisation & system
A conceptual instrument to measure the success of branding in the tourism industry 44
2.5.4.2 Contact personnel/ service providers
Contact personnel are employees with whom the customer/ buyer briefly interacts such
as parking attendants, receptionists or hosts. Service providers on the other hand are
those employees who provide the core service such as waiters or front-desk personnel.
2.5.4.3 Other customers
The consumption of services is often described as a “shared experience” because of
the fact that it often occurs in the company of other customers. This simply means that
other customers can also impact on the service experience, similar to the impact of
visible components previously mentioned.
The unseen organisation and systems reflects the rule, regulations and processes on
which the firm’s product is based. As a result they also have a profound effect on the
customers’/ buyers’ service experience.
The Servuction system is what creates the experience of a product and, in turn, the
experience creates a bundle of benefits to customers/ buyers. The most philosophical
implication of this model is that it demonstrates that customers/ buyers are a vital part of
the service process. Their participation may be active or passive, but they are always
involved in the service delivery process. This has a significant effect on the nature of
service marketing and therefore some of the service strategies are discussed next.
2.5.5 Service strategies
According to Rao (2007:48) and Ferrell et al. (2002:1) a strategy is an integrated and
coordinated set of commitments and actions designed to exploit core competencies and
gain a competitive advantage. A strategy is also used by managers to please
customers, compete successfully and to achieve set organisational goals.
One of the most popular strategic models, developed by Christian Gronross, is the
service marketing triangle.

A conceptual instrument to measure the success of branding in the tourism industry 45
2.5.5.1 Service triangle
According to Rao (2007:58-59), three important groups play an essential function in the
achievement of company goals. These groups are top management, employees and
customers (Figure 2.8).
Figure 2.8: The service triangle
Source: Rao (2007:59)
According to Kotler and Armstrong (2006:607) and George (2004:26), the left side of the
triangle suggests that employees are treated the same as external consumers in order
to successfully deliver promises to consumers. They therefore refer to this as internal
marketing. George further mentions that in order for these promises to be kept,
employees must be recruited, trained and rewarded for good service they offer.
The external marketing activities are indicated by the right side of the triangle. These
activities elevate consumer expectations and promise to meet them. Besides the
Top management
Internal marketing
External
marketing
Employees Interactive
marketing Customers

A conceptual instrument to measure the success of branding in the tourism industry 46
employees and physical evidence of the product, traditional elements of marketing,
such as advertising and promotions are included in here.
The actual service delivery takes place at the bottom side of the triangle and is known
as interactive marketing. This means that the employees here interact directly with
consumers and it is where promises are delivered. The researcher lastly mentions that
successful product marketing depends on all three sides of the triangle.
Owing to the unique characteristics of a service and the many challenges within the
market place, researchers have adapted the traditional marketing mix (see Figure 2.3)
to suit a service-oriented product. This is known as the service marketing mix and is
discussed next.
2.5.5.2 Service marketing mix
According to Rao (2007:62-64), the traditional 4 P’s of the marketing mix were adapted
to service marketing and resulted in three additional P’s namely physical evidence,
people and processes. Figure 2.9 indicates the 7 P’s.

A conceptual instrument to measure the success of branding in the tourism industry 47
Figure 2.9: Service marketing mix
Source: Rao (2007:63)
According to Figure 2.9, three additional P’s are applicable to the service industry,
namely (Morrison, 2010:349; Rao 2007:63-64; Bowie & Buttle, 2004:26-28; Reid &
Bojanic, 2001:13-15):
Physical evidence
Most services cannot exist without the support of tangible aspects. Although the
service is not visible to customers they use the tangible aspects of the services to
form an opinion about the service. This means that an element such as furniture in a
hotel can be used by the customer to evaluate good service delivery.
People
Every employee is seen as a part-time or full-time marketing person. If an employee
is visible to the consumer during service delivery, his/her behaviour, activities and
performance will have a direct influence on consumers.
Consumer
Price
Physical evidence
Product
Place People
Promotion
Process
A conceptual instrument to measure the success of branding in the tourism industry 48
Process
Process is the practical actions that enable the service to be available and ensures
that a quality service is delivered. The design of the physical setting and how the
functions are scheduled and routed indicate efficiency to the customers.
As previously indicated by the service triangle (Figure 2.8), top management plays a
vital role to achieve company goals. Rao (2007:62) indicates that there must be a shift
from the old organisational structure to a new structure that supports a service-oriented
product. This service-oriented organisational structure is discussed next.
2.5.5.3 Service oriented organisational structure
According to Rao (2007:61), no service-oriented company should have a large number
of hierarchical levels. The researchers further indicate that top management should not
be directly involved at operational level decision making. Figure 2.10 shows the required
shift in the organisational structure of a service-oriented company.

A conceptual instrument to measure the success of branding in the tourism industry 49
Figure 2.10: Service oriented organisational structure
Source: Rao (2007:62)
According to Rao (2007:61-62), a traditional military structure keeps top management
remote from the reality of service delivery. Although the components of the pyramids
above (Figure 2.10) are almost the same, the priorities have changed. Turning the
pyramid upside down demonstrates that top management is not at the apex level any
longer. The frontline, which consists of personnel, physical resources and operational
systems, interact with the customers. The frontline thus makes most of the decisions
relating to the basic service package (BSP) delivered. The performance of frontline now
influences success or failure of the organisation. The other support personnel and even
top management, now facilitate the frontline in order to improve service delivery.
The above mentioned service strategies are further influenced by the behaviour of
consumers. Aspects related to consumer behaviour are discussed next.
Frontline
Middle
Management
Top
Management
Frontline
Top
Management
Support Personnel
OLD NEW

A conceptual instrument to measure the success of branding in the tourism industry 50
2.5.6 Consumer behaviour in services
2.5.6.1 Defining the importance of consumer behaviour
According to Lamb et al. (2006:152), consumer behaviour refers to how consumers
make purchase decisions as well as how they use and dispose purchased goods and
services (products). The researchers further mention that consumers’ goods and
services (products) preferences change constantly and it is therefore important for
managers to understand this constant change of flux. By understanding the change,
managers can then create a proper marketing mix.
The study of consumer behaviour also includes an analysis of factors that influence
purchase decisions and use, and are therefore discussed next.
2.5.6.2 Factors influencing consumer behaviour
According to Lamb et al. (2006:162), the above mentioned decision-making process
cannot be independently viewed. Figure 2.11 indicates the factors that may have an
influence on consumer behaviour.

A conceptual instrument to measure the success of branding in the tourism industry 51
Figure 2.11: Factors influencing consumer behaviour
Source: Lamb et al. (2006:162)
According to Lamb et al. (2006:162-163), George (2008:169-175), Kotler and Armstrong
(2006:119-136), Lee and Johnson (2005: 114-121) and Bowie and Buttle (2004:54-58),
the figure above underlying cultural, social, individual and psychological factors strongly
influences the decision process. These aspects have an effect from the time a
consumer perceives a stimulus all the way through to post purchase behaviour. The
cultural factors include culture and cultural values, subcultures and social class. The
Cultural factors
Culture & values
Subculture
Social class
Social factors
Reference group
Opinion leaders
Family
Individual factors
Gender
Age
Family life-cycle
Personality
Self-concept
Lifestyle
Psychological factors
Perception
Motivation
Learning
Belief & attitude
Buy/ Don’t
buy
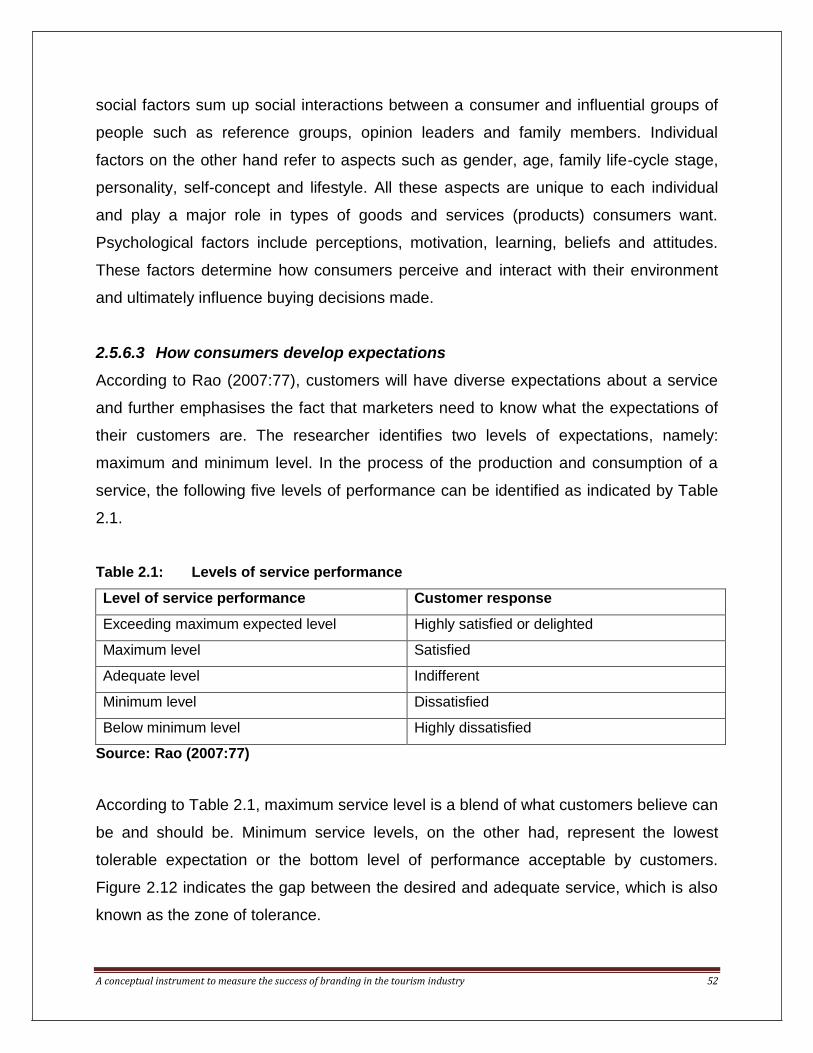
A conceptual instrument to measure the success of branding in the tourism industry 52
social factors sum up social interactions between a consumer and influential groups of
people such as reference groups, opinion leaders and family members. Individual
factors on the other hand refer to aspects such as gender, age, family life-cycle stage,
personality, self-concept and lifestyle. All these aspects are unique to each individual
and play a major role in types of goods and services (products) consumers want.
Psychological factors include perceptions, motivation, learning, beliefs and attitudes.
These factors determine how consumers perceive and interact with their environment
and ultimately influence buying decisions made.
2.5.6.3 How consumers develop expectations
According to Rao (2007:77), customers will have diverse expectations about a service
and further emphasises the fact that marketers need to know what the expectations of
their customers are. The researcher identifies two levels of expectations, namely:
maximum and minimum level. In the process of the production and consumption of a
service, the following five levels of performance can be identified as indicated by Table
2.1.
Table 2.1: Levels of service performance
Level of service performance Customer response
Exceeding maximum expected level Highly satisfied or delighted
Maximum level Satisfied
Adequate level Indifferent
Minimum level Dissatisfied
Below minimum level Highly dissatisfied
Source: Rao (2007:77)
According to Table 2.1, maximum service level is a blend of what customers believe can
be and should be. Minimum service levels, on the other had, represent the lowest
tolerable expectation or the bottom level of performance acceptable by customers.
Figure 2.12 indicates the gap between the desired and adequate service, which is also
known as the zone of tolerance.

A conceptual instrument to measure the success of branding in the tourism industry 53
Figure 2.12: Zone of tolerance
Source: Rao (2007:78)
The above indicated “zone of tolerance” is the extent to which customers recognise or
are willing to accept the variation between maximum and minimum service expected.
Customers will be frustrated and highly dissatisfied if the service is below the expected
level. On the other hand, customers will be delighted if the service performance
exceeds the maximum level expected. If the performance of a service falls into the
tolerance zone, customers do not particularly notice the service performance. As soon
as the service performance is outside the tolerance zone, the service is noticed and can
then be either positive or negative as indicated under customer response in Table 2.1.
Rao (2007:79) takes this aspect further and indicates some aspects that determine the
maximum and minimum level of service expectations as shown by Figure 2.13.
Maximum service level
Zone of tolerance
Minimum service level

A conceptual instrument to measure the success of branding in the tourism industry 54
Figure 2.13: Determinants of consumer expectations
Source: Rao (2007:79)
According to Figure 2.13, there are three factors that influence the maximum level of
service expectations in an individual, namely:
Maximum service level
Zone of tolerance
Minimum service level
Needs and wants Derived expectations of others
Personal expectations
Wo
rd-o
f-m
ou
th
co
mm
un
icati
on
M
ark
eti
ng
sti
mu
lati
on
P
ast
exp
eri
en
ce
Emergencies Service choices
Participation in production Situational factors

A conceptual instrument to measure the success of branding in the tourism industry 55
Needs and wants
A person’s needs may be physical, psychological, social and/ or functional and are
all vital factors in shaping the maximum service level expectations. Wants on the
other hand refer to the means to satisfy a person’s needs.
Derived expectations of others
Maximum service level expectations also occur when customer expectations are
driven by other consumers or even family members.
Personal expectations
This aspect refers to the consumers’ generic attitude toward the meaning of service
and also the proper conduct expected of service providers.
Minimum service level expectations are influenced by the following four factors:
Service choices
If consumers have multiple service providers of varying quality levels, the minimum
service level expectation depends upon the selection of service provider.
Emergencies
In an emergency, the service level expectation will be much higher, as consumers
expect fast, effective service.
Participation in service production
If consumers feel that their role played in receiving service from a service provider is
insignificant, or if they do not possess the required skills to participate in the service
production process, they tend to develop a low level of expectation. The tolerance
zone of consumers then expands when they feel that they are not perfectly
performing their role in the service delivery.

A conceptual instrument to measure the success of branding in the tourism industry 56
Situational factors
This refers to factors beyond the control of service providers. If consumers
understand the situational factors influencing the service delivery, their tolerance
zone would be generally higher than before.
Maximum and minimum service level expectations are influenced by three factors
namely:
Marketing stimulation
Service providers make use of marketing to establish links with target markets and
to inform them of the features of the service. This information directed from the
service company forms the base for the consumers to develop their expectations.
Word-of-mouth communication
This aspect is still one of the most powerful methods of influencing consumers’
minds. Consumers seek information from earlier users and, based on that
information, expectations are created.
Past experience
While using a service, consumers are likely to refer/ compare it to their previous
experience with the same service provider or service outlet. Consumers may even
refer to their experience with similar or even comparable services.
2.5.6.4 Consumer buying decision process
The consumer decision-making process (Figure 2.14) is based on the assumption that
consumers move through a series of push and pull factors or a process of stages before
and after purchasing a product (Stokes & Lomax, 2008:120-123; George, 2008:176-
178). This seven stage process is influenced by cultural, social, individual and
psychological factors as indicated previously in Figure 2.11.

A conceptual instrument to measure the success of branding in the tourism industry 57
Figure 2.14: Consumer buying decision process
Source: George (2008:176)
Figure 2.14 above can be divided into seven stages that a consumer passes through
when purchasing a tourism-related product (Morrison, 2010:123-125; George 2008:177-
Need recognition
Information search
Pre-purchase alternative evaluation
Purchase
Consumption
Post-purchase
alternative evaluation
Dissatisfaction Satisfaction
Influencing factors:
Cultural Social
Individual
Psychological

A conceptual instrument to measure the success of branding in the tourism industry 58
178; Stokes & Lomax, 2008:120-123; Kotler & Armstrong, 2006:148-155; Lee &
Johnson, 2005:109; Bowie & Buttle, 2004:60-61; Perreault & McCarthy, 2003:110; Reid
& Bojanic, 2001:75):
Stage 1: Need recognition
The decision-making process begins when the consumer recognises a need/ desire
for a tourism-related product. Reasons for and against the identified need/ desire are
weighed against time and money available. Marketers often use promotions during
this stage to make prospective consumers change their need into a desire for the
product. Research is critical to determine what motivates consumers to purchase a
particular product.
Stage 2: Information search
During this stage the potential consumer searches for more information about the
desired/ needed product. The search for tourism-related products is likely to take
longer and involve the use of more information sources compared to other everyday
used products. The consumer lastly also assesses the benefits of the product as
presented by marketing during this stage.
Stage 3: Pre-purchase evaluation of alternatives
During Stage 3 the consumer evaluates the collected information against that of
alternative products (substitutes). Evaluation criteria tend to include criteria based on
price, convenience and recommendations. The alternatives are then ranked
according to preference.
Stage 4: Purchase
During this stage the consumer chooses a tourism-related product taking time and
money into account. The product is then purchased.

A conceptual instrument to measure the success of branding in the tourism industry 59
Stage 5: Consumption
The consumer experiences the product during this stage. Often the decision-making
process is repeated a number of times during consumption; this is due to the
recognition of new products not known and purchased in advance.
Stage 6: Post-purchase evaluation of alternatives
This is a very important stage. Consumers use the information they receive from
actually experiencing the tourism-related product to evaluate it. The outcome of
these evaluations will influence future purchasing decisions.
Stage 7: Dissatisfaction/ Satisfaction
If consumers have a satisfactory experience, they are likely to purchase the product
again and it will result in positive word-of-mouth advertising by them. An
unsatisfactory experience occurs when consumer expectations are not met. This will
result in a low probability of repeat purchase and high negative word-of-mouth
advertising. If consumers were first time users, this will mean that they will not
purchase again as they often consume on a trail basis.
Although the consumer buyer decision-making process is a useful model for examining
buying decisions, the process is not always as straightforward as it seems. This is due
to two reasons, namely prospective buyers can withdraw at any time during the process
and secondly, it is not uncommon for some stages to be skipped. It is at this stage that
branding plays a big role to assist in information search (Stage 2) or even help to
accelerate the buying process. According to George (2008:226), the concept of
branding tourism-related products has become a very common marketing practice.
According to the researcher, branding has developed to such a level that brand names
are sometimes more valuable than the products they represent. Palmer (2005:231)
emphasises this fact by indicating that branding is the tangible feature that helps
consumers decide which tourism-related product to buy. In essence a brand is a
shorthand reference for choice (Palmer, 2005:231).
A conceptual instrument to measure the success of branding in the tourism industry 60
According to Bergvall (2007), branding is more than a logo; it is the memory of
everything a person remembers about a company through the use of its products or
services and his or her interaction with advertising and other users. “Branding is a
person’s collected experiences of a company, product or service with a certain name”
(Bergvall 2007).
Haig (2007) indicates that human beings, like animals, want to distinguish themselves
from others. An animal like the peacock has beautiful feathers to help it differentiate
itself from other peacocks and also to attract peahens. Haig mentions that human
beings do not have fancy feathers to set them apart and therefore they use brands.
Aaker (2002:40) and Balmer (2001:28) point out that branding is one of the most
commonly used marketing tools that indicate to potential customers what to expect.
Branding related to tourism products will be discussed in Chapter 3.
2.6 CONCLUSION
The purpose of this chapter was to unlock some of the important aspects of tourism
marketing. This was done by firstly explaining the four evolution eras of marketing
known as the production orientation, sales orientation, marketing orientation and
societal marketing orientation eras. Secondly, the definitions pertaining to marketing
and tourism marketing were given. The third part of the chapter explained the basic
aspects of tourism marketing. This included the unique characteristics of a tourism
product/ service and the seven core principles of marketing known as the marketing
concept, marketing orientation, satisfying consumer needs and wants, marketing
segmentation, the value of the exchange process, the marketing mix and lastly the
product life-cycle.
The focus then shifted to explaining the basic aspects of service marketing. This was
done because of the fact that tourism products include services and services include
tourism products (Hoffman & Bateson, 2001:4). This fourth part of the chapter focused
on the scale of market entities and molecular models to emphasise the difference

A conceptual instrument to measure the success of branding in the tourism industry 61
between goods and services. The factors that influence the experience of services were
explained by using the Servuction model. In order to gain a competitive advantage over
other tourism-related products, service strategies such as the service triangle, service
marketing mix and how a service oriented organisational structure functions were
explained. Consumer behaviour in services was then explained by highlighting the four
main factors that influence consumer behaviour, followed by an in-depth discussion on
how consumers develop expectations. In conclusion the seven stages of the consumer
buying decision process were discussed.

A conceptual instrument to measure the success of branding in the tourism industry 62
CHAPTER 3
BRANDING IN THE TOURISM
INDUSTRY
3.1 INTRODUCTION
Brands are traditionally associated with consumer goods, but according to Tassiopoulus
(2004:121), Bowdin, McDonnell, Allen and O’Toole (2003:52) and Henderson (2000:36),
marketers of tourism products are also adopting branding techniques. Hankinson
(2001:127) and Davis (2005:18) argue that creating a brand for a tourism product is
much more difficult and complex than for a consumer brand. Morgan, Pritchard and
Pride (2002:5) added to this argument by stating that limited budgets, lack of overall
product control and political pressure are some of the challenges faced by tourism
product marketers. The researchers further indicate that the key to tourism product
differentiation lies in the development of an emotional relationship with consumers.
According to Qu, Kim and Im (2010:465), a well advertised and widely known brand can
greatly assist in differentiating a tourism product from other similar products. This is due
to the fact that tourism products often offer the same general features. According to Qu,
Kim and Im (2010:465), the key therefore lies in establishing a unique brand.
According to Bergvall (2007:1) and Yeshin (2006:48), it is a complex task for anyone
new to “brands” to try to understand what branding is all about. Owing to the explosive
amount of interest in branding during the 1990s, most people have grasped the fact that
branding is more than a logo (Bergvall, 2007; Laws, 2002:62-63). According to Shimp
(2010:34), Cheverton (2006:1), Van Auken (2005:14), Kapferer (2004:5) and Kotler &
Gertner (2002:4), a brand name conveys the image of the product or service. The term
“brand” refers to a name, term, symbol, sign or design used by a firm to differentiate its

A conceptual instrument to measure the success of branding in the tourism industry 63
offerings from those of its competitors (Shimp, 2010:34). In the product offering, brands
are one of the most standard stable items and assist in the further standardisation of
other marketing elements such as promotional items. In the case of a tourism product,
the brand may become invaluable because of the intangible nature of the product. The
term “trademark” refers to the legally protected part of the brand, represented by the
symbol (Davis, 2005; Van Gelder, 2003:10). McCabe (2009:189) believes that the
psychological power of brands is great and that brands are often used as a marketing
tool. Brands can even be an effective management tool, as long as the brand is
constructed around a memory (Bergvall, 2007:1).
From a promotional perspective, choosing a brand name is extremely important owing
to the fact that brand names communicate attributes and meaning associated with the
product. This means that when marketers search for a brand name, they need to ensure
that the name chosen can communicate the product’s characteristics which in turn help
to position the product in customers’ minds (Cai, 2002:273-274). According to Go and
Govers (2010:7), a brand should only be developed after considering the costs of
developing a brand image relative to the benefits. Go and Govers (2010:7) also imply
that when a brand is developed, the brand name and image become part of the total
product. By providing status, a brand name can even command a price premium, thus
helping to insulate the marketer against low-priced competitors.
The purpose of this chapter is to conduct a literature review on the role of branding in
tourism marketing. This will be done by highlighting five aspects (see Figure 3.1).
Firstly, the term “branding” will be explained, followed by its significance. Thirdly, the
basic aspects of branding will be explained. Part four of the chapter indicates how
brands are created by explaining the brand naming process and aspects to consider
during brand development. Part five indicates how consumers choose brands by
explaining how equity influences consumers; the buyer decision-making process of
brands and factors influencing brand selection.
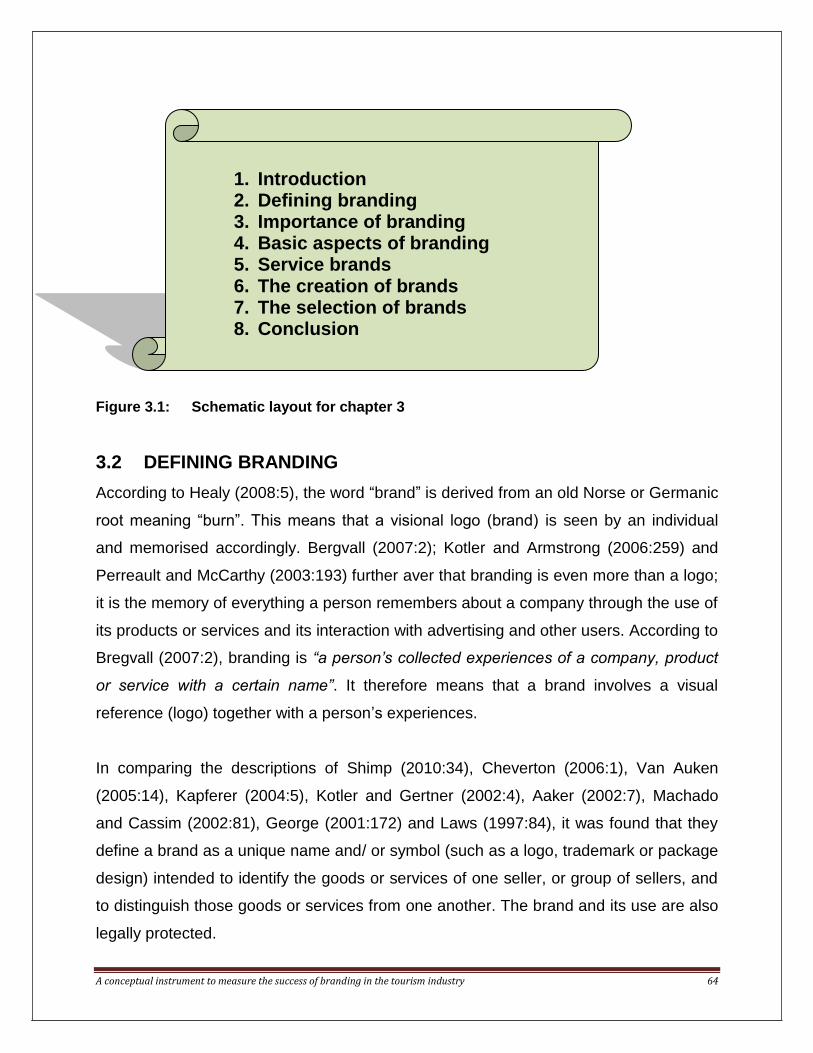
A conceptual instrument to measure the success of branding in the tourism industry 64
Figure 3.1: Schematic layout for chapter 3
3.2 DEFINING BRANDING
According to Healy (2008:5), the word “brand” is derived from an old Norse or Germanic
root meaning “burn”. This means that a visional logo (brand) is seen by an individual
and memorised accordingly. Bergvall (2007:2); Kotler and Armstrong (2006:259) and
Perreault and McCarthy (2003:193) further aver that branding is even more than a logo;
it is the memory of everything a person remembers about a company through the use of
its products or services and its interaction with advertising and other users. According to
Bregvall (2007:2), branding is “a person’s collected experiences of a company, product
or service with a certain name”. It therefore means that a brand involves a visual
reference (logo) together with a person’s experiences.
In comparing the descriptions of Shimp (2010:34), Cheverton (2006:1), Van Auken
(2005:14), Kapferer (2004:5), Kotler and Gertner (2002:4), Aaker (2002:7), Machado
and Cassim (2002:81), George (2001:172) and Laws (1997:84), it was found that they
define a brand as a unique name and/ or symbol (such as a logo, trademark or package
design) intended to identify the goods or services of one seller, or group of sellers, and
to distinguish those goods or services from one another. The brand and its use are also
legally protected.
1. Introduction 2. Defining branding 3. Importance of branding 4. Basic aspects of branding 5. Service brands 6. The creation of brands 7. The selection of brands 8. Conclusion

A conceptual instrument to measure the success of branding in the tourism industry 65
Based on the meaning of branding, the next section will focus on the significance of
branding in the tourism industry.
3.3 SIGNIFICANCE OF BRANDING IN THE TOURISM INDUSTRY
Consumers are daily bombarded by marketers who are trying to sell tourism products to
them. In the tourism industry this often means competing against well-known
international brands. Marketers use various media such as magazines, websites,
television and even social media to try to get the consumer to see and ultimately choose
their tourism brand above the rest (George, 2014:7). According to Davis (2010:17-18), it
is the responsibility of marketers to identify and expose the tourism brand to potential
customers in order to attract them. To accomplish this, marketers utilise a variety of
different marketing communication tools. Davis (2010:17) and Yeshin (2006:47) further
mention that domestic and international competition is growing rapidly and that
marketers are faced with having to convince customers that their tourism product can
best satisfy their current needs. Competing on price is often just a short-term solution as
it excludes customer service, people development and investment in product quality
(Davis, 2010:18; Davis, 2005:32). The solution, according to Davis (2010:18) and
Lindstorm (2005:195), is treating a tourism brand as a strategic asset. This means that
the tourism brand receives ongoing investment in order to distinguish the brand from
other tourism products and to assist in building a valued reputation in the marketplace.
Haig (2007:2) further points out that tourism brands are often used by human beings,
like animals, to distinguish themselves from others. Animals like the peacock has
beautiful feathers to help it distinguish itself from other peacocks and also to attract
peahens. Haig mentions that people do not have fancy feathers to set them apart and
therefore they use tourism related brands.
From the above it can be concluded that branding in the tourism industry is important for
three reasons. Firstly, to attract potential consumers, secondly to differentiate the
tourism brand from other competing brands and thirdly to communicate what consumer
A conceptual instrument to measure the success of branding in the tourism industry 66
needs the specific tourism brand can satisfy. In order to further highlight the significance
of branding, the basic aspects of tourism branding will be discussed in the next section.
3.4 BASIC ASPECTS OF TOURISM BRANDING
The first basic aspect of tourism branding involves the different levels of a tourism brand
as discussed next.
3.4.1 Levels of a tourism brand
According to Shimp (2010:62), McCabe (2009:188), Shimp (2007:44), Kotler and
Armstrong (2006:253), Moser (2003:11-20) and Jordaan and Prinsloo (2001:112), a
tourism brand consists of the following four levels:
3.4.1.1 Generic level
The generic level refers to the tourism products’ ability to meet the customer’s basic
needs. In the case of the accommodation sector the generic level refers to the provision
of a place to sleep. For competing tourism brands, this is the easiest aspect to copy.
Within the accommodation sector any tourism product that provides a place to sleep (for
example, guesthouses, hotels, lodges, backpackers) operates on the generic level and
is therefore in competition with one another.
3.4.1.2 Expected level
Within the expected level a specific target market’s basic needs are satisfied together
with a minimum expectation about the tourism related brand. As buying increases, the
brand starts to evolve by better matching the resources to meet customers’ needs.
Within the accommodation sector the basic need refers to a place to sleep whereas the
minimum expected level may be linked to the star rating advertised. This means that a
consumer staying in a five star hotel will expect a five star service.
3.4.1.3 Augmented level
Consumers at this level become more experienced and sophisticated which means that
the brand would need to be augmented or improved to satisfy the consumers’ needs.

A conceptual instrument to measure the success of branding in the tourism industry 67
This is achieved by adding non-functional values (for example, emotional) as well as
functional needs (such as promotions directed to the user’s peer group to reinforce his
or her social standing through ownership of the brand). Sun City and resort groups such
as the ATKV and Forever add emotional aspects (for example, “family fun”) and
functional needs (for instance, “club membership with added benefits”) which enable
them to operate on the augmented level.
3.4.1.4 Potential level
Only creativity limits the extent to which the tourism brand can mature to the potential
level with consumers gaining even more experience of the brand and developing a
greater tendency to be more critical about the brand. Destinations such as Dubai with its
six and seven star hotels, built on man-made islands and each with a unique feature,
are capturing the imagination of tourists worldwide.
From the above it can be concluded that most brands within the tourism industry can
easily operate on the generic and expected levels. Some well-known and established
tourism brands operate on the augmented level by adding emotional aspects and
functional needs. The potential level is the level that all tourism brands aspire to. After
understanding the different levels of a brand, it is important to indicate what functions a
brand may have.
3.4.2 Functions of a tourism brand
Danesi (2006:92-100) and Jordaan and Prinsloo (2001:142-143) point out that a tourism
brand may have one or more of the following functions:
3.4.2.1 Communication function
The tourism brand is used to communicate and emphasise what the tourism product
offers by concentrating on one or two aspects of the product. Low cost airlines like
Mango and Kulula Airlines emphasise that their domestic flights are the cheapest in
South Africa.

A conceptual instrument to measure the success of branding in the tourism industry 68
3.4.2.2 Reduction function
In order to reduce search costs and minimise the risk of buying an ineffective service or
visiting unknown destinations, consumers use tourism brands. These tourism brands
provoke evidence of consistent service standards to consumers. International hotel
groups such as Sun International and Hilton make sure that the guest service provided
and features in all their hotels worldwide are exactly the same. This means that the
consumer who is familiar with their brand knows exactly what to expect if visiting an
unfamiliar destination for the first time.
3.4.2.3 Facilitation function
Brands assist in facilitating new service introductions, promotions, segmentation and
pricing. To consumers a well-known brand diminishes the risk associated with that
service or product and this in turn makes it easier for tourism product owners to
introduce new services, products or experiences. South African Airways introduced SA
Airlink a few years ago to service their growing domestic market. The smaller SA Airlink
planes fly to and from smaller cities.
3.4.2.4 Differentiation function
Similar services can be differentiated by using different tourism brands which assist
consumers in decision making. Airlines like South African Airways, British Airways,
Lufthansa and many more use bold colours in their brand logos displayed on aircrafts to
distinguish themselves from other airlines.
3.4.2.5 Expressive or social-adaptive function
A particular lifestyle or status is expressed by consumers when using a specific brand.
These brands are used by consumers to identify themselves with sub-groups in their
society. Exclusive tourism brands such as the Sabi Sabi Game Reserve and
Thornybush Game Lodge next to the Kruger National Park provide an exclusive five star
lodge service to the high-end domestic and international tourism market. Exclusive
accommodation, game drives, tour guides, charter flights and exceptional service forms
part of their packages.

A conceptual instrument to measure the success of branding in the tourism industry 69
3.4.2.6 Security function
Emotional factors can play a decisive role in consumers’ buying process and therefore
brand names play an important role (cf. 3.6.2). These brand names provide trust and
security to consumers on the quality of the tourism-related brand. By using a well-known
hotel brand like Protea Hotels, the consumer knows what to expect based on previous
usage.
3.4.2.7 Associative function
Associations in the consumers’ minds are a combination of various signals or symbols
attached to the brand (Cheverton, 2006:111). To a consumer these associations may
be positive or negative. A tourism brand such as Starlight Cruises is associated with
cruise line holidays and may have a negative association to some consumers. This
might be due to the seasickness factor or even not being able to swim.
3.4.2.8 Economic function
The decision-making process is much easier and faster if consumers are familiar with
the brand they are using. This is a consequence of the fact that consumers do not need
to asses alternatives every time before buying. By using a well-known or previously
used tourism brand, the consumer knows the price range associated with the brand.
This known factor helps to accelerate the decision-making process.
From the above it can be concluded that, from the consumers’ point of view, all eight
discussed functions assist them when buying or choosing a tourism product. From a
tourism product point of view, only the facilitation and differentiation function apply.
These eight functions of a brand might bring to mind what the advantages of branding
are. These are discussed next.
3.4.3 Advantages of branding in the tourism industry
According to Cheverton (2006:34) and Kotler and Armstrong (2006:260), the following
are advantages of branding within the tourism industry:

A conceptual instrument to measure the success of branding in the tourism industry 70
If the destination or tourism product such as a resort has a brand name it is more
recognisable to consumers and can assist in encouraging repeat business. A
brand also cuts across countries, class and cultural backgrounds.
Brands encourage consumers to purchase particular tourism products because
they provide consumers with the benefits they are looking for. The benefits
sought by consumers may vary from safety, to status and self-esteem.
Branding can be used to sell a line of products. Virgin Airlines have developed a
brand that offers consumers a reliable product, linking their music product, soft
drinks, non-fiction books and airline seats.
Established brands’ value is closely related to quality perceptions and consistent
standards.
Large hotel companies that have a wide range of properties can target a defined
market segment by grouping the various hotels together and selling them to
consumers under various brand names.
Owing to the intangible nature of a tourism product, branding provides a
significant way for achieving differentiation by enabling the tourism product to
distinguish itself from other related tourism products.
From the above it can be concluded that the benefits of branding are evident and that a
well-established brand does have a competitive advantage in the tourism market.
Knowing the advantages of using a brand, the next important aspect to discuss is the
forces that might influence a brand’s potential.
3.4.4 Forces influencing a tourism brand’s potential
When auditing the factors affecting the future of brands, De Chernatony and McDonald
(2003:53–59) identified the following five forces that must be considered:

A conceptual instrument to measure the success of branding in the tourism industry 71
3.4.4.1 Manufacturers
Tourism products often under-utilise its brand assets through its inability to recognise
what is occurring within the tourism market. This can be rectified by having realistic,
quantified objectives for the tourism brand. Objectives must indicate exactly which
target market it refers to, be specific and indicate which resources must be used to
achieve its full potential.
3.4.4.2 Distributors
The brand strategy of a tourism product cannot be formulated without the consent and
support of a distributor. In the current era of increasing competition it is vital that both
parties can rely on each other for their success. Both parties must realise that long-term
brand profitability can only evolve through mutual understanding and support. A tourism
product such as a game lodge may rely on a charter flight operator to transport
consumers to and from the lodge owing to its inaccessible location. The charter flight
operator in turn relies on the lodge for regular business.
3.4.4.3 Consumers
Consumers see buying as a process of problem solving. They become aware of a need,
seek information that will satisfy their need, evaluate the information obtained and then
make a decision that will best suit their needs. The consumer’s characteristics and
experience with the tourism brand influence the extent of this buying process. The
researchers further indicated that consumers have to make a brand selection from
various possibilities and that marketers therefore need to identify all possible target
markets and position the tourism brand in such a way that it is appealing.
3.4.4.4 Competitors
A tourism brand is mostly compared to other related tourism brands. Tourism brand
owners try to benchmark themselves against competition but often misjudge key
competitors. Misleading data about customers are often the result of managers not
researching current or even potential consumers. Not understanding the objectives and
strategies of competitors, as well as not fully understanding their brand position and

A conceptual instrument to measure the success of branding in the tourism industry 72
personalities, may also add to the problem. It is therefore essential that marketers do
not focus on a conservative, defensive position but rather try to gather enough
information to anticipate competitive response and be able to continuously update the
strategy to enable them to protect their tourism brand.
3.4.4.5 The marketing environment
The continued scanning of the marketing environment by brand strategists is vital in
identifying future opportunities and threats. This can be done by using a SWOT analysis
(George, 2001:61). It involves analysing all strengths, weaknesses, opportunities and
threats related to the tourism product.
From the above it can be concluded that the above five forces may be minimised by:
Having brand objectives that indicate exactly which target market it refers to,
being specific and indicating which resources must be used to achieve its full
potential.
In the current era of increasing competition it is vital that both the tourism product
owner and distributor can rely on each other for their success.
Consumers have to make a brand selection from various possibilities. This
means that marketers must therefore identify and understand the target market
and position the tourism brand in such a way that it is appealing.
Marketers need to gather enough information about competitors to anticipate
competitive response in order to protect their brand.
The continued scanning of the marketing environment is vital in identifying future
opportunities and threats. This can be done by conducting a SWOT analysis.
According to Tobak (2011:1), there are many myths and misgivings about branding in
the world. This often confuses people who seek the true meaning and essence of
branding. Some of the myths are explained in the next section.

A conceptual instrument to measure the success of branding in the tourism industry 73
3.4.5 Myths about branding
Myth 1: The modern concept of a brand is difficult to describe. A product is a physical
entity made in a factory, while a brand is a psychological entity made in the mind of
consumers. A brand is a mixture of tangible and intangible attributes symbolised by a
trademark and has a powerful influence on consumers if managed carefully.
Myth 2: The concept of a brand is relatively recent. Thinking of brands like Coca-Cola
that dates back from 1885, and both Lion Lager and Castle are over 100 years old as
well as resort brands like Forever and ATKV, it is easy to recognise how many top
brands of half a century ago remain today’s brand leaders.
Myth 3: Brands are the exclusive domain of products and services in the mature phase.
Today just about anything has the potential to be branded but the main activity currently
is to brand companies and develop corporate brands.
Myth 4: Scientific analysis of brands is still in its infancy. Only the true picture of a brand
can be seen best by analysing past marketing, financial and legal standpoints related to
that brand or destination.
Myth 5: Brands represent a small fraction of a company’s assets. This was certainly
true in the past but over the best part of a decade in the eighties this all changed to the
point that is estimated that around 60-70% of the London Stock Exchange is goodwill
and that a very high portion of this percentage is brand value.
Myth 6: Brands have life-cycles. In practical terms most brands need to have no life-
cycle at all but to survive, brands have to be nurtured and invested in.
Myth 7: Brand valuation cannot be included in the balance sheet. Not in South Africa
perhaps; but over a decade ago in the United Kingdom this was already happening. In
1984 Rupert Murdoch used the valuation of acquired brands in the News Group annual
report.
Myth 8: Brand valuation is only for balance sheet purposes. Balance sheet valuation is
just one of many reasons to value brands. For investor purposes alone the idea of the

A conceptual instrument to measure the success of branding in the tourism industry 74
value of the individual brands that are owned by a group can give an indication of the
rating that group should enjoy.
Myth 9: The accounting world knows how to value brands. When it comes to intangible
elements such as brands there is great unease and considerable diversity of opinions
as accountants are best at valuing tangible elements.
Myth 10: The more you invest in a brand the more valuable it becomes. Sadly there is
no connection between investment and resulting value. Methods of valuing brands that
are income-based include Royal-relief and Discounted cash flow methods.
Because of these myths, marketers need to work around these aspects and find
alternative and innovative ways to beat competitors. The next section indicates how
powerful brands can help to defeat competitors.
3.4.6 Powerful tourism brands can beat competitors
According to Cheverton (2006:34) and Sherrington (2006:68), tourism product owners
and consumers interpret brands in different ways and, consequently, different
emphases are placed on the resources they use to support their brands. Jordaan and
Prinsloo (2001:76) as well as Van Gelder (2003:30) indicate that powerful tourism
brands are all about customer satisfaction. If the tourism product delivered succeeds in
satisfying consumers’ needs, they will return! The researchers further indicate that, in
order for a tourism brand to be powerful, that brand must firstly be seen as a strategic
device and secondly the brand’s competitive advantage must be sustainable. These are
discussed next.
3.4.6.1 A tourism brand as a strategic device
According to Kapferer (2008:19) and Lozito (2005:2), some tourism product owners
believe that brands are primarily differentiating devices and as such they put much
emphasis on finding a prominent name while other product owners view brands as
being functional devices and therefore emphasise excellence of performance in their

A conceptual instrument to measure the success of branding in the tourism industry 75
marketing programmes. Hollis (2008:8) and Jordaan and Prinsloo (2001:92) further
assert that really successful tourism product owners regard their brands as strategic
devices and therefore adopt a holistic brand perspective. This holistic perspective
involves the identification and analysis of forces that can influence the value of the
brand, identifying the brand’s unique advantages and defending this position against
competitors.
The strategist subscribing to this holistic view of branding recognises that the key to
success lies in finding a competitive advantage that other companies find difficult to
copy (Kapferer, 2008:19). Some suggestions on how to achieve a competitive
advantage are therefore given.
3.4.6.2 Sustaining a tourism brands’ competitive advantage
The challenge facing a marketer, according to Lindstorm (2005:46), is how to sustain a
tourism brand’s competitive advantage. This is a particularly difficult problem within the
services sector since competitive responses can appear very quickly. According to
Hollis (2008:145), Lindstorm (2005:98) and Davis (2005:164), the key lies in managing
the tourism brand in such a way that the competitive advantages are retained. The
researchers further identified the following management aspects:
The management of a tourism brand is an activity which is of fundamental
importance to the tourism product’s survival and prosperity. The marketing
department is often responsible for managing the tourism brand and its
competitive advantage. What is important to remember is that top management
must also be part of this owing to the fact that the brand influences the tourism
product’s reputation and that reputation is the responsibility of top management.
The importance of continuity is the second reason why top management must be
strongly involved in the management of a tourism brand. The researchers
indicate that CEOs on average stay twice as long as marketers and therefore
their involvement is a good insurance to ensure consistency.

A conceptual instrument to measure the success of branding in the tourism industry 76
All parts of the tourism product have the responsibility to guard, promote and
build the brand. To do this, everyone must be aware and understand the core
position of the tourism brand. This is known as internal marketing. In the tourism
industry that is associated with services rendered, this internal marketing is as
important as external marketing.
Lastly the researchers indicate that monitoring systems must be put in place to
assist the management of the tourism brand. It is essential that each tourism
brand has its own set of key brand indicators and that monitoring the brand must
concentrate on these indicators.
From the above it can be concluded that the following can help a tourism brand to beat
other competitors:
Identify and analyse the forces that can influence the value of the tourism brand.
Identify the brand’s unique advantages and defend these against competitors.
Top management is fundamentally important to a tourism brand’s survival and
prosperity.
All parts of an organisation have the responsibility to guard, promote and build
the tourism brand. This is known as internal marketing.
Monitoring systems must be put in place to assist in the management of the
brand.
According to Saxena (2007:278), positioning is the act of communicating products
available in such a way that the product occupies a distinct and valued place in the
customer’s mind. Ways to position a brand are therefore discussed in the next section.
3.4.7 Ways to position a tourism brand
Saxena (2007:278) as well as Tybout and Calkins (2005:11-26) claim that positioning is
not what is done to the tourism product, but what is done to the mind of the consumer.

A conceptual instrument to measure the success of branding in the tourism industry 77
The researcher identifies the following ways that can be used to position a tourism
brand:
3.4.7.1 Use of situations
A tourism brand can be positioned by using daily situations familiar to consumers.
Within these familiar situations the use of the brand and its possible advantages are
shown in comparison to other brands. Garden Court Hotels have been using a
bachelor’s morning wakeup routine to advertise their hotels’ “homelike feeling”. The
campaign shows the bachelor waking up and walking around in his underwear following
his normal homelike routines. Only when finally sitting down at the breakfast table he
realises that he is in the hotel surrounded by strangers looking at him.
3.4.7.2 Emphasising tangible benefits
Based on the tangible benefits of the tourism brand, such as specific features, price and
distribution, a brand can also be positioned. This type of positioning does not provide a
long-term sustainable advantage as competitors can easily adapt. Airlines such as
Mango and Kulula are in a constant battle over advertising their airline as having the
cheapest domestic flights in South Africa.
3.4.7.3 Linking the brand to uses
The third approach to position a tourism brand is to identify the possible uses of the
brand; emphasis is more on what the brand can be used for. A tourism brand such as
SANParks is linked to conservation of various species including the much talked about
rhino conservation. By staying at any of the twenty-one national parks throughout South
Africa the consumer has the option to donate money when checking in. This donation is
then used by SANParks to help protect the ever decreasing rhino population.
3.4.7.4 Head-on competitive positioning
This positioning approach places the tourism brand directly next to the leader in the
market and tries to uproot it on a specific tangible variable. The airline Emirates

A conceptual instrument to measure the success of branding in the tourism industry 78
compares its leg-room space onboard with other well-known airlines as being the best
in the class.
3.4.7.5 Lifestyle positioning
A tourism brand can be positioned as a lifestyle concept and can be either
contemporary or futuristic. A popular dimension of this positioning type is aspirations.
Luxury game lodges such as Sabi Sabi advertise themselves as being the playground
of the rich and famous. In the case of Sabi Sabi, it emphasises the fact that Richard
Branson has built himself a holiday home within the reserve.
3.4.7.6 Benefits offered
Lastly, a tourism brand can be positioned by highlighting the benefits that the customer
gets by using the brand. The Victoria & Alfred Waterfront in Cape Town highlights the
fact that internationally known hotels, world leading restaurants and excellent shopping
are conveniently located within walking distance from one another. This is linked to the
fact that the world-known Table Mountain is visible in the background.
From the above it can be concluded that a tourism product owner can use one or a
combination of the six aspects above to position the tourism brand in the consumer’s
mind. Davis (2010:148) adds to this by indicating that positioning goes hand in hand
with distinction. The components of brand distinction are therefore discussed next.

A conceptual instrument to measure the success of branding in the tourism industry 79
3.4.8 Components of brand distinction
Brand building is the responsibility of the entire organisation, not just of the marketing
department. As such, distinction guides the company’s overall direction (Davis,
2010:148; De Mooij, 2005:18).
Figure 3.2: Components of distinction
Source: Davis (2010:149)
Figure 3.2 indicates that distinction of a tourism brand can be based on the following
four components:
3.4.8.1 Heritage
Knowing the tourism brand’s heritage will guide brand planners to make choices that
are more likely to gain internal support. This means that customers can anticipate and
expect the tourism product to operate in a certain way and this may ultimately lead to
market growth. The subcomponents of heritage are known as core competencies,
uniqueness and precedents. A resort group such as ATKV and Forever Resort are
known for their history in being family oriented. Consumers can therefore expect any
future changes to still focus on the family market.
Heritage Context
Goals Positioning

A conceptual instrument to measure the success of branding in the tourism industry 80
3.4.8.2 Context
The task of developing brand distinction needs to be done with the management of a
tourism product knowing and understanding the market conditions the brand operates
and competes in. Brand planning must therefore take into account the overall market
situation in which the tourism brand operates. The recession of 2008 had a major effect
on consumers’ spending patterns in the years to come. This greatly influenced
consumers on what and how much they spend their limited budgets on. The ripple
effects were also felt within the tourism industry and management had to find ways to
adapt in order to survive.
3.4.8.3 Goals
Building a reputable brand as a tourism product goal may be a useful philosophical
start, but requires far more detailed coordination and planning. Building a tourism brand
involves a wide range of marketing activities and setting long-, medium and short-term
goals. Forever Resorts celebrated their 80th birthday in 2014. Throughout the 80 years
they had to set long-, medium and short-term brand goals to first introduce, later grow
and much later maintain their brand in an ever-changing global market.
3.4.8.4 Positioning (cf. 3.4.7)
For a tourism brand to be successful, positioning must reflect an understanding of the
target market, provide a frame of reference and articulate the customer value
perception. Value can be created by a clear brand identity and position in the following
ways:
it provides meaning and focus for the tourism product
it guides and enhances the brand strategy
it provides future extension options
it improves brand memorability
it provides a value proposition

A conceptual instrument to measure the success of branding in the tourism industry 81
From the above it can be concluded that positioning goes hand in hand with distinction
and that, in order to distinguish a tourism brand from other competing brands, the
following can be done:
Knowing a brand’s heritage will guide brand planners to make choices that are
more likely to gain internal support.
Brand planning must take into account the overall market situation in which the
brand operates. It also involves a wide range of marketing activities as well as
setting long-, medium and short-term goals.
Brand positioning (cf. 3.4.7) must reflect an understanding of the target market,
provide a frame of reference and articulate the customer value perception.
According to Davis (2010:197) and McEwen (2005:49), building a brand culture involves
identifying the right people and creating organisational mechanisms to promote strong
individual behaviours and team-based capabilities that support the overall values and
reputation of the brand. In order to build a brand culture, the brand must be completely
understood internally. The five E’s of internal branding are discussed next.
3.4.9 Five E’s of internal branding
A brand must be brought to life for employees, making the company more than just a
place to work and earn a living. Employees must believe that the work they are doing is
worthwhile and they must be able to see the connection between their work and the
brand results (Davis, 2010:197). Figure 3.3 show the five E’s of internal branding.

A conceptual instrument to measure the success of branding in the tourism industry 82
Figure 3.3: Five E’s of internal branding
Source: Davis (2010:197)
According to Figure 3.3 internal branding consists of the following five E’s:
3.4.9.1 Educate
The first step of internal branding is similar to the launch of a new product, namely to
create awareness. With employees, part of awareness building involves educating them
about a product. The tourism product owner therefore needs to educate the employees
about the brand or new brand initiative to gain their acceptance.
3.4.9.2 Exchange
While the education stage sets the basis for understanding, exchange involves inviting
employees to share their ideas with management. This is important as employees are
able to transition from the education phase to the early participation phase where they
can begin to shape and influence the internal branding. While destiny helps employees
to understand the tourism product’s cause, internal branding helps employees even
Internal branding
Engage
Excite
Exchange
Exemplify Educate

A conceptual instrument to measure the success of branding in the tourism industry 83
more by reminding them how they fit in and how they contribute. This helps to furnish
meaning to their work.
3.4.9.3 Excite
Tourism products that market internally win over employees who, in return, attract
customers. An absence of marketing, no matter how good, will kill a product. This is
also true for internal branding. The secret to internal branding is to be visible and
interesting, otherwise no one will know what to expect; let alone care about the tourism
brand.
3.4.9.4 Engage
Engagement involves employees in directly working on projects in support of the
internal branding. Contributions made to new products, new processes and appointing
new employees all form part of engagement and contribute to reinforcing a tourism
brand.
3.4.9.5 Exemplify
After the thinking (education and exchange) and doing (excite and engage), the living
follows. This is demonstrated by all employees committed and understanding the
special place they work for and is characterised by improvements in quality, generation
of new ideas, co-worker enthusiasm, customer appreciation and market / social
recognition.
From the above it can be concluded that building a tourism brand culture also involves
internal branding. This means that the tourism brand must be vitalised for employees by
doing the following:
The tourism product owner needs to educate the employees about the brand or
new brand initiative to gain their acceptance.
Exchange involves inviting employees to share their ideas with management.

A conceptual instrument to measure the success of branding in the tourism industry 84
The secret to internal branding is to be visible and interesting, otherwise no one
will know what to expect; much less, care about the tourism brand.
Contributions made to new products, new processes and appointing new
employees all form part of engagement and contribute to reinforcing a brand.
If these four aspects have been achieved it will lead to employees’ commitment
and understanding and is characterised by improvements in quality, generation
of new ideas, co-worker enthusiasm, customer appreciation and market / social
recognition.
Brands have the unique ability to influence the way people view products (Tybout &
Calkins, 2005:2). Consumers perceive the product together with the brand and their
perception is consequently ultimately shaped by the brand. This can be explained with
reference to the brand prism.
3.4.10 Brand prism
Tybout and Calkins (2005:2) declare that perceptions matter most – how consumers
perceive the tourism brand matters far more than the absolute truth. The actual features
and attributes of the product and the brand itself help to shape the way consumers
regard a branded product. Brands therefore function like prisms, as shown in Figure 3.4,
and can either elevate or diminish the tourism product (Kapferer, 2008:42).

A conceptual instrument to measure the success of branding in the tourism industry 85
Figure 3.4: Brand prism
Source: Tybout and Calkins (2005:3)
From Figure 3.4 it can be seen that the brand is the link between the tourism product
and consumer. The brand therefore needs to be a true reflection of the tourism product
it represents. Because of the intangible nature of tourism products (cf. 2.4.1), the brand
is the only tangible aspect the consumer can relate to (cf. 3.5.3). Creating, naming and
developing a brand are therefore discussed in more detail in section 3.6 of this chapter.
Most tourism products include a minor or major service aspect. The next section
therefore deals with the importance and challenges associated with service brands.
3.5 SERVICE BRANDS
A service, according to Kapferer (2008:103), Palmer (2005:12), Zethami and Bitner
(2003:8), Lovelock (2001:4) and Jordaan and Prinsloo (2001:35), is anything offered
within the destination to consumers based on their needs and may be tangible or
Brand
Perceptions
Product & service
specifications

A conceptual instrument to measure the success of branding in the tourism industry 86
intangible. The various services offered may differ in degree of tangibility and
employees highly influence the delivery of these services. Therefore the importance of
services is discussed next.
3.5.1 The importance of services
According to Price, Arnould and Zinkhan (2009:1), the service sector has become a
dominant force in the economy of many tourism-related countries and in return created
many new jobs. Price, Arnould and Zinkhan (2009:2) further add that the service sector
has not only contributed to economic growth but is also challenging the traditional
approach of doing business by creating innovative service solutions. One such a
solution is known as service blueprinting. This method involves information on flow,
stock, cost and bottlenecks within the delivery process (Jordaan & Prinsloo, 2001:202).
Price et al. (2009:3) add that innovative entrepreneurs have set new standards of
service quality where other competitors failed to satisfy today’s demanding consumers.
The success of service organisations has been stimulated by dramatic global trends
which, in turn, have created sustainable competitive advantages (Tybout & Calkins,
2005:186). They add that computerisation and technical innovation, especially in
telecommunications, have enabled tourism products to establish service brands by
radically innovating the way they do business with their target consumers.
Tybout and Calkins (2005:188) finally mention that the use of franchising agreements
and the worldwide trend to remove trade barriers have allowed many tourism-related
services to profit from increased globalisation of their operations. The researchers
indicate that service providers such as airlines, hotel chains and car rental firms are
able to deliver their services internationally through distribution systems owned by local
investors. Tourism product owners who decide to go global with their brand, should be
aware of possible cultural differences, for neglecting cultural issues can have disastrous
consequences even for strong and popular brands (Kapferer, 2008:103).
A conceptual instrument to measure the success of branding in the tourism industry 87
From the above it can be concluded that the service sector has become a dominant
force in the economy of many tourism-related countries and in return created many new
jobs. Computerisation and technical innovation enables tourism product owners to do
business directly with their target consumers. Lastly, franchising agreements have
allowed many service businesses to profit from increased globalisation.
On understanding the importance of service brands, the next important aspect is to
identify the unique challenges associated with service brands.
3.5.2 The challenges of services brands
According to Kotler et al. (2006:132-135), consumers have become comfortable with
switching back and forth between well-known tourism brands and because of this has
increased the significance and the need for branding. Adding the intangibility of a
tourism-related service even further increases the need for branding.
Kotler et al. (2006:133) add that the key to a true tourism brand is consistency but in the
case of a tourism-related service this may be a problem. This is due to the fact that it is
not easy to specify the delivery of the tourism-related service although the core tourism
product is easy to describe. This means that no matter what the tourism brand is, the
delivery process needs to stay the same.
Being an integral part of the tourism offering and reflecting the values that the target
market is looking for, give the tourism brand a true meaning. According to Kotler et al.
(2006:132-135), the tourism brand can help to develop the real value of a service
through:
Clearly indicating the service that is offered.
Protecting the service from competitors by becoming a legal trademark.
Certifying quality or consistency to the consumer before buying and also
assisting the choice of purchase.

A conceptual instrument to measure the success of branding in the tourism industry 88
Creating a character of the service which consumers can identify the service
with.
From the above it can be concluded that consumers have become comfortable with
switching back and forth between well-known tourism brands and owing to this, has
increased the importance and the need for branding. A true tourism brand is consistent,
but in the case of a tourism-related service it can create a problem owing to the fact that
it is delivered by human beings. Lastly, Kotler et al. (2006:132-135) indicate four ways a
tourism brand can help to develop real value.
One of the most problematic aspects associated with tourism brands is its intangible
nature. Palmer (2005:9-15) therefore explains how to make an intangible product
tangible. This is discussed in the next section.
3.5.3 Branding to make tangible the intangible
Palmer (2005:9) states that in an attempt to overcome this intangibility problem,
marketers are emphasising the tourism brand in an effort to make the tourism product
more tangible to consumers. According to Kapferer (2008:109) and Palmer (2005:10),
tourism brands pose the risk of being perceived as commodities owing to their
intangible nature. The researchers identified the following aspects that can help a
tourism product overcome this problem:
It is essential that the tourism brand must have a clear set of values to help
create positive perceptions among consumers. A car rental company like Avis,
for example, focuses on customer care.
By using as many physical elements as possible that can be associated with the
tourism brand, such as staff uniforms, office décor, and the type of music played
to consumers waiting on the telephone, are some of the effective ways to make a
tourism brand tangible.

A conceptual instrument to measure the success of branding in the tourism industry 89
Effective differentiation can be achieved through package designs. In the case of
an intangible tourism brand, tangibility and differentiation can be achieved by
what the confirmation document / ticket looks like. The use of colour and the
tourism product logo clearly displayed on the confirmation document helps to
differentiate and tangibilise the tourism
From the above it can be concluded that tourism marketers are increasingly
emphasising the brand in an effort to make a tourism product more tangible to
consumers. The use of a clear set of brand values, the use of physical elements, such
as staff uniforms, and achieving distinction by means of package design are some of
the effective ways to make a tourism brand more tangible.
The above discussion indicates that it is possible to create a brand for an intangible
tourism product. In order to develop winning brands in a competitive environment it is
important to understand how brands are created.
3.6 CREATING TOURISM BRANDS
3.6.1 Steps to create a new brand
According to Van Auken (2005:43-53) and Jobber (2001:231), a new brand can be
created by augmenting the core product. This is done by distinguishing the brand values
of that product from those of competitors (Figure 3.5).
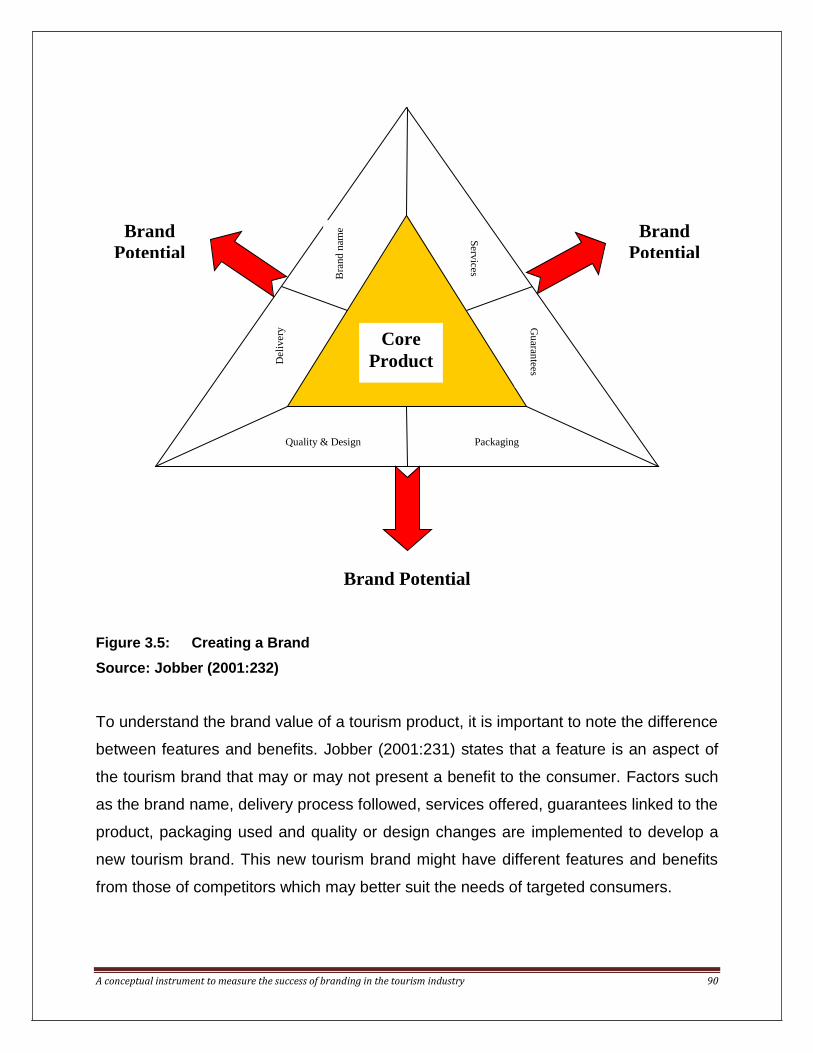
A conceptual instrument to measure the success of branding in the tourism industry 90
Figure 3.5: Creating a Brand
Source: Jobber (2001:232)
To understand the brand value of a tourism product, it is important to note the difference
between features and benefits. Jobber (2001:231) states that a feature is an aspect of
the tourism brand that may or may not present a benefit to the consumer. Factors such
as the brand name, delivery process followed, services offered, guarantees linked to the
product, packaging used and quality or design changes are implemented to develop a
new tourism brand. This new tourism brand might have different features and benefits
from those of competitors which may better suit the needs of targeted consumers.
Core
Product
Brand Potential
Brand
Potential
Brand
Potential
Quality & Design Packaging
Del
iver
y G
uaran
tees
Bra
nd
nam
e
Serv
ices

A conceptual instrument to measure the success of branding in the tourism industry 91
According to Duncan (2005:75), building a successful tourism brand requires strategic
planning and a major financial investment. Hollis (2008:35-37), Duncan (2005:75-82)
and Davis (2005:206-210) indicate that the following three steps can lead to successful
brand creation:
Step 1: Selecting the desired brand position
Brand position is the standing of the tourism brand in comparison with its competitors in
the minds of customers. Section 3.4.7 of this chapter already indicated positioning
strategies that can be followed during this step.
Step 2: Developing brand identification
The brand name and symbol chosen to represent the brand must work as identification
cues. A good brand name communicates one or more of the following characteristics:
Benefit
Association
Distinctiveness
Simplicity
A brand symbol/ logo can greatly increase a brand’s recognition and a distinctive
symbol/ logo is often used to indicate a product’s source of ownership.
Step 3: Creating a brand image
Giving the tourism brand an identity and position is not enough to make the brand come
alive and connect with consumers. A brand image is an impression created by brand
messages and experiences, and assimilated into a perception or impression of the
brand. The brand image makes a statement about the brand’s personality.
From the above it can be concluded that a tourism brand can be created by firstly
selecting the desired brand position, secondly by developing a brand name and symbol

A conceptual instrument to measure the success of branding in the tourism industry 92
and lastly by creating a brand image. Step 2 of the process above indicates that a
brand’s identification is partly created through the name of the brand. The next section
therefore discusses the process involved in naming a tourism brand.
3.6.2 Naming a brand
Brand naming involves a relatively straightforward process according to Shimp
(2007:193-194) and Lindstorm (2005:145-160). This process is illustrated by Figure 3.6.
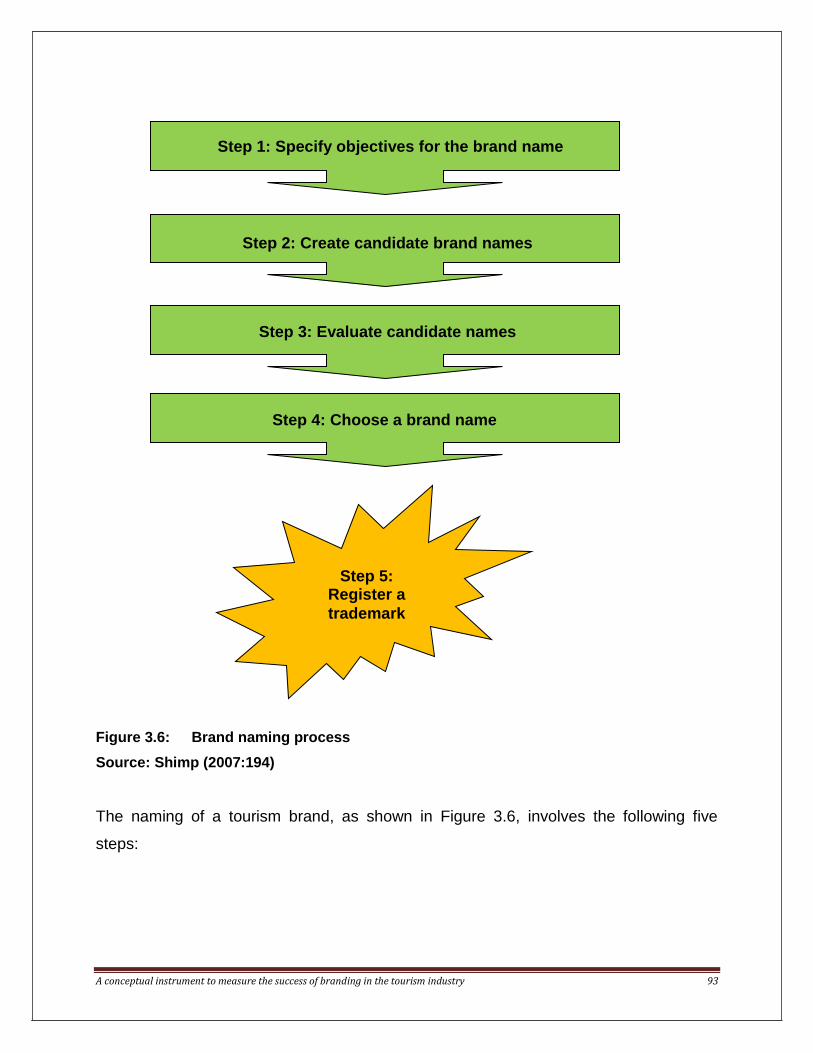
A conceptual instrument to measure the success of branding in the tourism industry 93
Figure 3.6: Brand naming process
Source: Shimp (2007:194)
The naming of a tourism brand, as shown in Figure 3.6, involves the following five
steps:
Step 1: Specify objectives for the brand name
Step 2: Create candidate brand names
Step 3: Evaluate candidate names
Step 4: Choose a brand name
Step 5: Register a
trademark

A conceptual instrument to measure the success of branding in the tourism industry 94
Step 1: Specify objectives for the brand name
The initial step is to identify the objectives to be accomplished. These objectives may be
to select a name that will successfully position the brand in the minds of the target
market (cf. 3.4.7), provide an appropriate image for the brand (cf. 3.4.10) or to
distinguish the brand from competitors (cf. 3.4.6).
Step 2: Create candidate brand names
Brand name candidates are often selected using creative thinking exercises or
brainstorm sessions. A good brand name communicates one or more of the following
characteristics: benefit, association, distinctiveness and simplicity. The service of a
third-party or outside consultant may also be used.
Step 3: Evaluate candidate names
The names generated in step 2 are evaluated during this step by using criteria such as
relevance to product category, favourability of associations and overall appeal.
Step 4: Choose a brand name
The criteria from steps 1 and 3 are used to select a final name from the candidate list.
Step 5: Register a trademark
Most companies apply for trademark registration. Some submit only a single name
whereas others submit five names on average. These names are compared against a
database to eliminate duplication. This also applies to the tourism industry.
From the above it can be concluded that the naming of a brand firstly involves
specifying objectives for the brand name, secondly creating possible brand names,
thirdly evaluating those possible names, fourthly choosing one of the brand names and
lastly registering the name as a trademark.
According to Trump (2007:1), a brand is the single most valuable asset to a tourism
product and indicates what that product stands for to the rest of the world. Aspects to
consider during brand development are summarised in the next section.

A conceptual instrument to measure the success of branding in the tourism industry 95
3.6.4 Aspects to consider during the development of a tourism brand
Gregory (2004:59-200) and Trump (2007:3) both identify various aspects to consider
when developing a tourism brand. A combination of these aspects includes the
following:
3.6.3.1 Establish a clear brand position (cf. 3.4.7)
This is a statement that communicates in a clear and unmistakable way what the brand
stands for and what it offers. This can be achieved by focusing on only one or two
benefits of the brand and by avoiding vagueness on what the brand offers to the
potential consumer. Resorts like Forever and ATKV, for example, tend to focus on the
family fun aspect.
3.6.3.2 Build a brand on an emotional benefit
There are two reasons why a tourism product owner must build his or her brand on
emotional benefits: It is hard to copy emotional benefits and people’s behaviour is more
affected by emotional benefits. These emotional benefits are hard to build and pose a
great challenge for any tourism product. What must be remembered is that a brand is a
promise and must therefore deliver what was promised to consumers in order to build
trust in the brand.
3.6.3.3 Build a brand as early as possible
The position that the tourism brand wants to fulfil might be lost to another competitor if
the brand is not built as soon as possible. There are two issues to remember: firstly, that
the brand must be ready from the outset as consumers create images of the brand
almost immediately and secondly, that competitors are fast followers that may steal
loyal consumers if the brand is not established early.

A conceptual instrument to measure the success of branding in the tourism industry 96
3.6.3.4 Be consistent over time and across markets
Consistency over time and across markets develops brand associations. This means
that the brand must move in the same direction as consumers even if there are
challenges to overcome. Tourism product owners can use market research to assist
them in indentifying possible changes within the target market. As discussed in section
3.5 of this chapter, a tourism product involves a service aspect and its delivery is
rendered by human beings. This may lead to inconsistency. Some suggestions were
also indicated on how to improve consistency.
3.6.3.5 Make sure that employees know the brand position
The content of the tourism brand must be repeatedly communicated in order for
consumers to remember the brand. This can be done by using employees, business
cards, ambience, signage, stationery, bulletin boards and even brochures.
3.6.3.6 Make sure all products and services are embodied in the brand
It is important to remember that the tourism brand will have no credibility and will soon
fail if the brand does not embody the products and services it represents. Section 3.6 as
well as 3.4.10 of the chapter also highlights this aspect.
3.6.3.7 Make sure all customers know the brand’s position
It would be useless if consumers did not know the tourism brand and what it offers. This
can be achieved by reminding consumers constantly what the tourism brand includes
and represents and should extend across all aspects of any external communications.
The use of social media such as Twitter and Facebook is becoming increasingly popular
and gives the tourism product owner the opportunity to interact directly and in real-time
with the target market.

A conceptual instrument to measure the success of branding in the tourism industry 97
3.6.3.8 Do not dilute the brand
This means that the tourism brand should not keep on extending and adding to the core
brand. Never extend the brand to other products if the consumers do not want to or,
even worse, if the consumers are not the same.
3.6.3.9 Always monitor the brand
This simply means asking consumers regularly what they think of the tourism brand.
Ways to obtain this feedback include hot-cold testing, consumer surveys and focus
groups. The goal of this study is also to provide tourism product owners with an
instrument that can give them valuable feedback.
3.6.3.10 Protect the brand as the most valuable asset
This can be done by doing all nine aspects mentioned above.
Ten aspects to consider during brand development were highlighted above. According
to Davis (2005:129), consumer trends can help guide the direction of a brand. Knowing
what aspects to consider during brand development may not be enough, as current
trends may also influence brand development. These are discussed in the next section.
3.6.4 Current trends in branding
Knowledge of trends can be applied to generate ideas or campaigns, or be fed into a
longer-term brand strategy (Davis, 2005:130). The researcher further indicates that
trends do not work in isolation and that brand trends often respond to social issues. The
following trends were identified by Davis (2005:130-148) as well as by Page and
Connell (2009:182-200):
3.6.4.1 Individual targeting
Brands used to target whole sections of populations but now target individuals; those
who can think for themselves. Various elements have led to the rise of this individual
targeting. More buying power has broken down previous barriers where high-end
A conceptual instrument to measure the success of branding in the tourism industry 98
tourism products and services were limited to the elite. Consumers have turned to
smaller more innovative tourism brands as an alternative to global tourism brands.
Greater individual wealth, awareness of trends, accessibility and choice have made
consumers more confident in expressing themselves as individuals.
3.6.4.2 Simplicity
Simplicity sticks. A simple idea behind a creative output is much easier to grasp than a
collection of complex ideas. Consumers are surrounded by so much noise and brand
clutter (advertising messages, bill boards and Internet sites) and they have shorter
attention spans and less time. Only clear, simple messages are likely to stick.
3.6.4.3 Less branding
Some tourism brands are so recognised by their design, products or tone of voice, they
do not need to promote themselves through a logo. If the name is not known and the
campaign or reputation of the tourism brand is sound, consumers will investigate the
brand themselves. As a consequence, branding is now becoming more subtle and
clever. This subtlety is a way of standing out by doing things differently. If the execution
is clever it will make people talk. The tactic is like a viral campaign, travelling by word-
of-mouth and recommendation rather than being forced on people.
3.6.4.4 More fun
Tourism brands that provide enjoyment stand out from among the others. It is a
differentiator and a way to get noticed. Brands take the dullness out of life.
3.6.4.5 Better service
For many tourism brands today, service is the key differentiator. This is due to the fact
that it is often difficult to distinguish one product from another if they are sold at similar
prices. Consumers prefer to deal with another person, particularly if something goes
wrong; they want a human contact with whom to discuss their needs.

A conceptual instrument to measure the success of branding in the tourism industry 99
3.6.4.6 User-friendly technology
Technology can contribute to a great brand experience by making services run more
smoothly, adding extra benefits to the customers and improving communication. As
access to technology becomes easier and cheaper to the world, technology will become
the facilitator for tourism brands, rather than a substitute for services.
3.6.4.7 Responsible brands
A tourism brand that behaves responsibly is able to boost its reputation, motivate staff
and build a positive profile. Responsible branding demands more of the tourism product
owner than donations. It concerns the behaviour of the brand as a whole. Tourism
brands need to behave responsibly in their product sourcing, supply chain and staff
behaviour towards consumers as well as conserving the environment.
3.6.4.8 Branding of countries
Countries have long been undertaking brand exercises to compete for tourist dollars.
What is shifting is that many countries now see the need to create an identity for
themselves in a global society.
3.6.4.9 Own brands
Own brands are those which introduce new product lines under their own label, outside
their core business. The aim is often to extend the tourism brand by building on their
existing and established brand name. The own brand also offers a one-stop shop for
consumers – if they trust the brand, they buy all their goods under the same label.
From the above it can be concluded that the new trends in branding tend to focus on the
individual, is moving in the direction of simplicity and lesser branding, tend to
concentrate on fun and better service, make use of user-friendly technology, conduct
business in a responsible manner such as conservation, introduce new extended
brands under their own brand and lastly brand a country in order to compete for
international consumers.
A conceptual instrument to measure the success of branding in the tourism industry 100
Consumers are the ones who choose and use brands. The next section will deal with
aspects related to how consumers go about choosing a brand.
3.7 HOW CONSUMERS CHOOSE BRANDS
Marketers need to understand what motivates consumers to purchase tourism brands
and they further need to know the process consumers go through when deciding to buy
(George, 2008:131; Swarbrooke & Horner, 2007:23). Brand experiences, the influence
of brand equity, the buying decision process and factors influencing brand selection are
therefore discussed below.
3.7.1 Brand experiences
Experiences describe the complete range of associations, direct and indirect, a
consumer has with a tourism brand, before during and after the purchase of a product
(Davis, 2010:216). Often the product on its own is not as attractive as the product
combined with the correct ambience.
3.7.2 The influence of brand equity on consumers
According to Kerin et al. (2004:245), brand equity is a concept that takes time to form
and must be carefully crafted and nurtured. This is done by creating strong, favourable
and unique associations and experiences with the brand by using marketing
programmes. What consumers have heard, seen, felt and learned about the tourism
brand over time forms the brand equity in their minds. Figure 3.7 indicates in four steps
how brand equity is formed.

A conceptual instrument to measure the success of branding in the tourism industry 101
Figure 3.7: Customer based brand equity pyramid
Source: Kerin et al. (2004:245)
The first step, according to Kerin et al., is to give the tourism brand an identity by
developing a positive brand awareness and association in consumers’ minds. This is
done by using a product class or focusing on a need.
Brand importance
Brand
performance
Brand
imagery
Consumer
judgments
Consumer
feelings
Consumer-
brand
connection
Step: 4
Relationships =
What about you?
Step: 3 Response
= What about
you?
Intense, active
loyalty
Positive,
accessible
reactions
Strong,
favorable and
unique brand
associations
Deep, broad
brand awareness
SteStep: 2
MeSSaning =
What are you?
Step:2
Meaning ?
Step: 1
Identity =
Who are you?

A conceptual instrument to measure the success of branding in the tourism industry 102
In the second step the tourism brand’s meaning must be established in consumers’
minds. Meaning arises from what a brand stands for and two dimensions may be used
for this – a functional, performance-related dimension or an abstract, imagery-related
dimension.
In the third step proper response to the brand identity and meaning from consumers
must be developed. This is done by focusing on consumers and how they think and feel
about the brand. Thinking focuses on a brand’s perceived quality, credibility and
superiority relative to other brands while feeling relates to consumers’ emotional
reaction.
An active, loyal relationship between consumers and the brand is the final and most
difficult step. This is characterised by a deep psychological bond between consumers
and the brand and consumers’ personal identification with the brand. At this stage the
brand is used by consumers to distinguish themselves from other consumers.
From the above it can be concluded that brand equity is formed by what consumers
have heard, seen, felt and learned about the tourism brand over time. This involves a
four-step process. Firstly, a tourism brand identity is developed by focusing on positive
brand awareness and association by using, for example, marketing campaigns.
Secondly, through these marketing campaigns meaning emerges from what the tourism
brand represents. The third step involves marketers focusing on consumers and how
they think and feel about the brand. Thinking focuses on a brand’s perceived quality,
credibility and superiority relative to other brands while feeling relates to consumers’
emotional reaction. The fourth and final step is the most difficult and involves an active,
loyal relationship between consumers and the tourism brand. This is characterised by a
deep psychological bond between consumer and tourism brand. Loyalty reward
programmes are often used by airlines, hotels and resorts to help create and maintain
this psychological bond.

A conceptual instrument to measure the success of branding in the tourism industry 103
Knowing the influence of brand equity, the next important aspect that needs explanation
is how the consumers decide on a specific tourism brand.
3.7.3 Brands and the buyer decision process
Many theories exist about the way consumers buy brands. Morrison (2010:123-125),
Lee and Johnson (2005:109), Bowie & Buttle (2004:60-61), Blackwell, Miniard and
Engel (2001:151-153) and Kotler et al. (2003:201) identify the following process:
Figure 3.8: Buyer decision process
Source: Bowie & Buttle (2004:60)
The researchers above explain the buyer decision process linked to branding as
follows:
The decision process starts when the consumer becomes aware of a problem or need,
therefore recognising a need.
An information search would start first in the tourist’s own memory or mind and
evaluating the available tourism brands will continue if the consumers feel confident
that they have sufficient information already about the brands. Highly involved
Need
recognition
Information
search
Evaluation of
alternatives
Purchase
decision Post-purchase
behaviour

A conceptual instrument to measure the success of branding in the tourism industry 104
consumers will start to learn how to interpret the information as they continue to obtain
more information that would then help them to evaluate competing brands. Often
external sources like brochures, magazine, website en even recommendations from
others can be used in this evaluating process.
After evaluation, purchase of the tourism brand would take place. During post-purchase
evaluation, satisfaction with the different aspects of the tourism brand will strengthen
the consumer’s positive beliefs and attitudes towards that tourism brand. The consumer
would then be proud of his/ her purchase and praise the tourism brand’s attributes to
peer groups. The consumer would then look favourably at that tourism brand in any
future purchase if a high level of satisfaction had been achieved.
From the above it can be concluded that all consumer purchases of any tourism-related
brand goes through a five-step buyer decision process. This process starts when a
consumer recognises a need, for example, to go away on a weekend break. The
second step then involves the consumer searching for possibilities by firstly evaluating
tourism brands he or she is familiar with and then externally by using brochures,
magazines, websites and recommendations. A decision is then made and purchase and
consumption take place. The last step involves the evaluation of the tourism brand after
consumption. If satisfaction had been obtained, the consumer would then look
favourably at that tourism brand in any future purchase.
Step four of the above process involves selection. According to Lee & Johnson
(2005:222) brand selection is often influenced by the different phases in brand
acquaintance and acceptance and is therefore discussed next.
3.7.4 Factors influencing brand selection
The different phases are shown in Figure 3.9.

A conceptual instrument to measure the success of branding in the tourism industry 105
Figure 3.9: Phases in brand acquaintance and acceptance
Sources: Lee & Johnson (2005:222) and Duncan (2005:6)
According to Duncan (2005:6), Van Auken (2005:203-206) and Lee & Johnson
(2005:223), the five phases indicated above are characterised by the following:
Brand unawareness and insistence represent the two extreme phases
regarding a consumer’s acquaintance and acceptance of a tourism brand.
Brand unawareness indicates that the consumer views the specific tourism
brand similar to other tourism products that provide similar services and therefore
does not recognise the specific tourism brand.
BRAND
UNAWARENESS
Brand
recognition
Brand acceptance /
rejection
Brand
preference
BRAND
INSISTENCE

A conceptual instrument to measure the success of branding in the tourism industry 106
Brand recognition indicates the consumer has seen or heard of the tourism
brand before, understands it and therefore remembers it.
Brand rejection indicates that the tourism brand and what it offers are
unacceptable to the consumer.
Brand acceptance exists as soon as a specific tourism brand is accepted by the
consumer from among similar tourism brands. The tourism brand then complies
with at least the consumer’s minimum expectations.
Acceptance of the tourism brand is soon followed by brand preference. This is
often based on past experiences and consumers will prefer this tourism brand to
those of competitors.
The final phase is brand insistence and is characterised by consumers refusing
to use other tourism brands than the ones they know and prefer. These tourism
brands are then known as speciality brands in the eyes of consumers.
From the above it can be concluded that in order for a tourism brand to reach the brand
insistence phase, the consumer must first be made aware of the tourism brand. This is
done through marketing. The next phase involves the consumer recognising the tourism
brand among other similar tourism brands and remembering what the tourism brand
represents. The tourism brand can then either be rejected or accepted if that tourism
brand meets the consumers’ minimum requirements. Through experiencing the tourism
brand, the consumer starts to prefer the tourism brand to other competing brands if that
experience is positive and satisfying (cf. 3.7.3). The final phase is brand insistence and
is characterised by consumers refusing to use other tourism brands than the ones they
know and prefer.

A conceptual instrument to measure the success of branding in the tourism industry 107
3.8 CONCLUSION
The purpose of this chapter was to conduct a literature review on the role of branding in
tourism marketing. This was done by highlighting five aspects. Firstly, the term branding
was explained according to various authors, followed by the importance of branding.
Part three of the chapter explained some basic aspects of branding by focusing on
aspects such as the different levels of a brand; functions of brands in consumer
relationship building; advantages of branding within the tourism industry; aspects
influencing brand potential; myths about branding; how powerful brands beat
competitors; ways to position a brand; components of brand distinction; the five E’s of
branding; the brand prism and aspects related to service brands. These aspects
included the importance of services; challenges of service branding and branding to
make tangible the intangible. Part four of the chapter discussed how brands are created
by explaining aspects of the brand naming process to consider during brand
development and current trends in branding according to Davis. Part five of this chapter
outlined how consumers choose brands by explaining how equity influences
consumers; the buyer decisions process of brands and factors influencing brand
selection.
Throughout this chapter various aspects of branding were discussed. In summarising
this chapter there was one aspect that was touched on or highlighted by all: the fact that
in order for a tourism brand to be successful, the consumer needs to be aware of the
tourism brand, be able to use and experience the tourism brand; through usage and
experience the consumer will either be satisfied or not and if satisfaction was reached a
number of times that consumer will start to prefer and become loyal to that tourism
brand. It therefore means that brand awareness, brand usage, brand experience, brand
satisfaction and brand loyalty might play a vital role in the evaluation of a tourism brand.
These aspects together with current measurement tools will be further investigated in
the next chapter.

A conceptual instrument to measure the success of branding in the tourism industry 108
CHAPTER 4
A REVIEW OF CURRENT BRAND
MEASUREMENT INSTRUMENTS
4.1 INTRODUCTION
Brand measurement is an important business activity which can be utilised to attract
new customers; to share business value propositions; to impress with the results
obtained; to drive action and improve sales; to identify how to break through the daily
clutter; to destroy competition and to be able to better emboss the brand in someone’s
mind (Kaushik, 2012:1-7). “When setting out to measure a brand, the starting point
should always be a thorough survey of the current perception of the brand, from the
point of view of current and potential customers” (De Chernatony, 2006:303;
Riesenbeck & Perry, 2007:40).
According to Riesenbeck and Perry (2007:51), there is hardly a product today that does
not hope to profit from the growing value of its brand. De Chernatony and McDonald
(2003:402) assert that for a brand to be considered by consumers as potentially useful
the brand must have a presence, both physically in terms of availability and
psychologically in terms of awareness. If these consumers find the promise inherent in
the brand to be relevant to their particular needs, they are expected to progress to trying
the brand for the first time and therefore forming a view about its performance. De
Chernatony and McDonald (2003:402) further declare that consumers are led to a view
about the brand’s relative advantages by evaluating the brand’s functional and
emotional performance capabilities relative to competing brands. De Chernatony and
McDonald (2003:402) lastly state that if these advantages about the brand are

A conceptual instrument to measure the success of branding in the tourism industry 109
particularly strong, they are likely to continue buying the brand and over time form a
bonded relationship with that brand.
Given the importance of measuring the success of a brand as stated by these
researchers, the goal of this chapter is therefore twofold. Firstly, to identify and analyse
current models and tools used to measure brand effectiveness by means of an in-depth
literature review. Secondly, to conduct a literature review to establish which brand
elements should be included in the conceptual tourism brand measurement instrument.
4.2 BRAND EVALUATION METHODS
Brands are multidimensional entities and, according to De Chernatony (2006:303),
Duncan (2005:700) and Tybout and Calkins (2005:244), any brand evaluation needs to
assess a variety of parameters. According to the researchers, these parameters may
come from using the relevant building blocks from the brand-building process or even
internal and external criteria to the organisation. These parameters can provide insight
into a brand’s health (De Chernatony, 2006:303).
Table 4.1 summarises some of the previous tourism-related branding research by
highlighting the evaluation methods used in each study.
Table 4.1: Previous tourism brand research studies
Author(s) Study completed Evaluation method used
What was evaluated?
Clarke (2000:329-344)
Tourism brands: an exploratory study of the brands box model
Chernatony and McWilliam’s brands box model
The application of the brand box model’s four-cell matrix on two dimensions of a brand
Yoo and Donthu (2001:1-14)
Developing and validating a multidimensional consumer-based brand equity scale
22 dimensions of brand equity
Evaluated dimensions of brand equity
Cai (2002:720-742) Cooperative branding for rural destinations
Conceptual model for destination branding
Examined destination image through conceptual destination brand model
Gnoth (2002:262-179)
Leveraging export brands through a tourism destination brand
Theoretical model Examined the development of a country as its tourism

A conceptual instrument to measure the success of branding in the tourism industry 110
brand became international
Kim and Kim (2005:549-560)
The relationship between brand equity and firms’ performance in luxury hotels and chain restaurants
Application of Aaker’s perceptual brand equity components
Examined the underlying dimensions of brand equity and how they affect company performance
Yeoman, Durie, Beattie and Palmer (2005:134-147)
Capturing the essence of a brand from its history: the case of Scottish tourism marketing
Brand essence wheel Examined how the history of Scottish tourism becomes a pattern for the future
Konecnik and Gartner (2006:400-421)
Customer-based brand equity for a destination
Exploring and evaluating brand equity using four dimensions: brand loyalty, brand awareness, brand image and perceived quality
Customer-based brand equity applied to a destination
Lee and Back (2007:331-344)
Attendee-based brand equity
Evaluating brand equity using four dimensions: brand loyalty, brand awareness, brand image and perceived quality
Investigated conference attendee behaviours from brand equity perspective
Murphy et al. (2007:5-14)
Using brand personality to differentiate regional tourism destinations
Application of Aaker’s personality dimension
Examined the value of destination brand personality
Tasci, Gartner and Cavusgil (2007:1529-1540)
Measurement of destination brand bias using a quasi-experimental design
Quasi-experimental design Measured three different spaces of destination image
Konecnik and Go (2008:177-189)
Tourism destination brand identity: the case of Slovenia
Theoretical framework to analyse tourism destination identity
Explored concept of destination brand identity from supply-side
Tores and Bijmolt (2008:628-640)
Assessing brand image through communalities and asymmetries in brand-to-attribute and attribute-to-brand associations
Assessing communalities and asymmetries between brand-to-attribute and attribute-to-brand associations
Assessed communalities and asymmetries between brand-to-attribute and attribute-to-brand associations
Boo, Busser and Baloglu (2009:219-231)
A model of customer-based brand equity and its application to multiple destinations
Customer-based brand equity model
Examined empirical information to develop a destination brand model
Marzano and Scott (2009:247-267)
Power in destination branding
Australia’s Golden Coast branding process (forms of power)
Examined forms of social power evident in a destination branding process
According to Table 4.1, branding consists of various elements that make the
development of standardised measuring instruments more difficult. The research by
Tasci, Gartner & Cavusgil (2007:1529-1540) evaluated 22 image dimensions of a

A conceptual instrument to measure the success of branding in the tourism industry 111
modified Gensch’s methodology. The thrust of Gensch’s methodology measured three
different perception spaces of a brand to distil possible biases held by current and
potential users. Limitations to this study indicated that the sample population was
relatively young as the study was conducted only among a student population.
Furthermore, a movie clip was used as a substitute for firsthand experiences of the
destination brand; thus the realism was influenced. Lastly, the study was only
conducted on one destination brand.
The research by Murphy et al. (2007:5-14) also made use of a questionnaire consisting
of three components. In the first component respondents were asked to describe their
perception of the destination’s brand by using only three words. In the second
component respondents had to indicate on a 1 to 5 Likert scale their associations with
the five brand dimensions and fifteen corresponding brand facets as identified by Aaker.
The last component of the questionnaire explored the link between the destination
brand and the self-image/ identity using Sirgy and Su’s proposed measures of self-
congruity. Limitations to this study indicated a low visitation to the destination and the
fact that there was a strong indication that Aaker’s traditional product brand personality
model did not translate directly to a tourism destination brand.
Finally the research by Boo et al. (2009:219-231), Kim and Kim (2005:549-560),
Konecnik and Gartner (2006:400-421), Lee and Back (2007:331-344) and Yoo and
Donthu (2001:1-14) all examined the underlying dimensions of brand equity and how
they affect an organisation’s or destination’s brand performance. In all of these studies
the measurement of brand equity consisted of five dimensions, namely brand loyalty,
brand awareness, brand recognition, perceived quality and brand image. Table 4.2
summarises these five dimensions.
Table 4.2: Summary of equity dimensions tested in previous studies
Equity dimension tested What did the study include? Type of questions used
Brand loyalty Measured six items Seven-point Likert scale
Brand awareness Measured three items Open-ended questions

A conceptual instrument to measure the success of branding in the tourism industry 112
Brand recognition Respondent chose from a list Open-ended question
Multiple choice questions
Perceived quality Focused on respondents’
perceptions
Seven-point Likert scale
Brand image Focused on items specific to
the product category
Seven-point Likert scale
According to Table 4.2, the studies by Boo et al. (2009:219-231), Kim and Kim
(2005:549-560), Konecnik and Gartner (2006:400-421), Lee and Back (2007:331-344)
and Yoo and Donthu (2001:1-14) mostly employed six measurement items of brand
loyalty on a seven-point Likert scale. Brand awareness that refers to “the strength of a
brand presence in the respondent’s minds”, was evaluated based on three scale items,
namely: top-of-mind brand, unaided brand recall and brand recognition. These were
mostly evaluated by open-ended questions such as “Write down the name of the luxury
hotel situated in Seoul that first comes to mind” or “List three other luxury hotels situated
in Seoul that come to mind”. Brand recognition was measured by asking respondents to
choose brand names that they are familiar with from a list. The questions were mostly
open-ended or multiple choice. Perceived quality was mostly measured by using a
seven-point Likert scale and questions focused only on the respondent’s perceptions
rather than their expectations. Brand image included the development of scale items
specific to the product category and all items were measured on a seven-point Likert
scale. These researchers assumed that a high scale point of brand image indicated that
the brand not only had a positive image to the respondent, but also exhibited a greater
level of brand image strength in comparison with other brands.
It is thus clear that researchers do not use the same measures for measuring the
success of a brand, the types of questions are not the same and the number of items
differs among the various studies. Many different brand evaluation methods are
currently available. Some commonly used methods that may be useful in the tourism
product environment are discussed next.

A conceptual instrument to measure the success of branding in the tourism industry 113
4.2.1 Multidimensional evaluation
According to De Chernatony (2006:303-304), the following is a summary of the
sequential stages in building a brand and also shows how brand evaluation fits into the
process.
Figure 4.1: Brand evaluation: process of building and sustaining brands
Source: De Chernatony (2006:304)
Brand vision
Internal implementation
Brand objectives
Organisational Culture
Brand resourcing
Audit brand sphere
Brand essence
Brand
Evaluation

A conceptual instrument to measure the success of branding in the tourism industry 114
If the brand follows the sequential stages as indicated in the above brand building
process (Figure 4.1), there is a high likelihood of the brand being integrated and
respected by all stakeholders (De Chernatony, 2006:303). The researcher further found
that decisions were taken about how the brand should be adapted to achieve specific
objectives at each stage. Different researchers have proposed alternative criteria to
asses a brand. Haig (2007:10) claim that a brand should be assessed by considering its
financial value, while Ambler (2003:15) states that measurement should focus on brand
equity. Keller (2002:24) suggests the use of a brand report card. These mentioned
measures provide useful data about aspects of the brand’s performance and tap some
of the building blocks, according to De Chernatony (2006:305), but they do not address
all relevant blocks.
It is evident that brands are complex entities that cannot be measured by just one
parameter. De Chernatony (2006:306) suggests the following holistic approach to brand
evaluation as shown in Table 4.3.
Table 4.3: A holistic approach to brand evaluation
Brand building block Internal assessment External assessment
Vision
Strong leadership and
conviction
Bringing about envisioned
future
Staff aware of brand vision
Inspire staff Make world a better place
Staff recognise values, are
aligned, genuinely committed
and can translate values into
expected behaviour
Stakeholders recognise and
appreciate values
Organisational culture
Supports vision
Enhancing subcultures
Strong, appropriate and
adaptable culture
Recruitment reinforces
culture

A conceptual instrument to measure the success of branding in the tourism industry 115
Objectives
Stretching objectives force
change
Staff aware and committed Achieving long-/ short –
term objectives
Catalytic mechanisms
appropriate
Brand essence
Staff aware and committed
with appropriate brand
citizenship behaviour
Positioning, personality and
promise recognised and
appreciated
Coherence of brand pyramid
Implementation and
brand resourcing
Protect core competencies
and benefit from learning
Nomenclature provokes
rapid result of benefits
Appropriate value delivery
system
Welcome the relationship
Attractive employer brand Good service
Confidence in brand
Confirmation of self-identities
among team
Legally tight
Genuine relationship with
wisely selected stakeholders
Emotional rewards
recognised
Suitable approach to
empowerment
Doesn’t over-promise
Integrated offering
Source: De Chernatony (2006:306)
Table 4.3 summarises the criteria to evaluate a brand’s performance. By monitoring a
brand against these criteria, underperforming areas can be identified and changes can
then be made to strengthen these areas. Each of the above mentioned brand blocks in
Table 4.3 are evaluated on a five-point likert scale by answering the following questions:

A conceptual instrument to measure the success of branding in the tourism industry 116
Brand vision
Issues to be assessed internally are:
How strong is the leadership provided either by the most senior influential person
or brand team?
How involved is staff in brand visioning?
What level of awareness is there among staff about the brand vision?
How committed is the senior team to the brand vision?
To what extent does the most senior influential person, or the brand’s team,
inspire staff about their roles as brand builders?
To what extent do staff know the values of the brand they support?
How committed is the staff to their brand values?
To what extent do the values of the brand concur with the values of staff working
on that brand?
How closely do the actions of senior management and other employees reflect
the values being espoused?
How confident is staff in translating the values of their brand into actions they
should undertake in their daily roles?
Issues to be evaluated among external stakeholders are:
What progress is being made in bringing about a welcomed envisioned future?
Thinking of the domain where the brand seeks to add value to people’s lives, to
what extent is the brand making their world a better place?
How accurate are the assessments of stakeholders about the brand’s values?
When told the brand’s values, how much do stakeholders appreciate these
values?
Brand vision therefore deals with issues related to staff awareness of the value of the
brand, their involvement and commitment to the brand.
Organisational structure
The internal issues to be evaluated are:

A conceptual instrument to measure the success of branding in the tourism industry 117
How well do the artefacts of the organisational structure support the brand
vision?
How well do the values of the organisational structure support the brand vision?
How well do the assumptions of the organisational structure support the brand
vision?
When considering the subcultures that exist in different parts of the organisation,
what proportions are
Enhancing subcultures?
Orthogonal subcultures?
Counter subcultures?
To what extent is the organisational culture
Appropriate for the current environment?
Adaptable to environmental change?
Respectful of leadership at all levels?
Attentive to satisfying the needs of staff, customers and shareholders?
How do recruitment programmes reinforce the desired culture?
Organisational structure measures how well the values and assumptions of the
organisational structure support the brand vision, how adaptable the organisational
structure is to environmental changes and how recruitment reinforces the desirable
brand culture.
Brand objectives
The internal issues to be evaluated are:
How stretching are the brand objectives?
What must be done differently to achieve the brand objectives?
How aware is staff of the brand’s
Short-term objectives?
Long-term objectives?
How committed is staff to helping achieve the brand’s
Short-term objectives?

A conceptual instrument to measure the success of branding in the tourism industry 118
Long-term objectives?
How appropriate are the catalytic mechanisms in guiding management and
employees to achieve the brand objectives?
To what extent is the brand under- or over-achieving on its
Short-term objectives?
Long-term objectives?
Brand objectives measure the awareness and commitment of staff to long- and short-
term brand objectives and to what extent the brand is under- or over-achieving on its
long- and short-term objectives.
Brand essence
The internal issues to be addressed are:
How aware is staff of the elements of the brand pyramid and the resulting brand
promise?
How committed is staff to delivering the promise inherent in the brand pyramid?
How coherent are the elements of the brand pyramid?
How supportive is the brand citizenship behaviour of employees?
The external issues to be assessed are:
How well do customers’ perceptions of the brand’s positioning match the benefits
in the bottom part of the brand pyramid?
How much does the brand’s target market welcome the brand’s functional
benefits?
How well do customers’ perceptions of the brand’s personality match the
personality traits or personality at the top of the brand pyramid?
How much does the brand’s target market welcome the brand’s personality
traits?
How well do customers associate the brand with its promise?
How much do customers welcome the brand’s promise?

A conceptual instrument to measure the success of branding in the tourism industry 119
Brand essence measures staff awareness and commitment to appropriate brand
citizenship behaviour and coherence to the brand pyramid.
Implementation and brand resourcing
The internal issues to be evaluated are:
To what extent are the core competencies underpinning the brand benefiting
from organisational learning and being protected against outsourcing?
How appropriate is the value delivery system for the brand?
How attractive is the employer brand?
How much do team members confirm one another’s self-identities?
How appropriate is the policy on empowerment for the brand?
How genuine are staff when building relationships with their stakeholders?
How well managed are the terminations of relationships?
The external issues to be evaluated are:
How well does the brand nomenclature provide recall of the brand’s benefits?
How strong is the brand’s relationship with its external stakeholders?
How well rated is the service supporting the brand?
How confident are stakeholders with the brand?
To what extent is the brand able to take legal action against infringements?
How well are the emotional rewards correctly recognised?
To what degree do stakeholders perceive any conflicts between the brand’s
promise and their experiences with the brand?
To what extent do elements of the brand reinforce the brand promise?
Implementation and resourcing measure how well core competencies are protected, the
appropriateness of the delivery system, the attractiveness of the employer brand,
confirmation of self-identities among team members, the relationship with wisely
selected stakeholders and the suitability of the approach to empowerment.

A conceptual instrument to measure the success of branding in the tourism industry 120
In the above brand evaluation process five categories (brand vision, organisational
culture, objectives, brand essence, implementation and brand resourcing) were
evaluated by asking detailed questions under each. For each of these categories an
average score is then calculated. This is done by adding the score of the internal and
external issues and then dividing it by the total questions within that category. The
results can then be displayed on a bar chart known as a “brand health chart”. An
example of such a chart is shown in Figure 4.2.
Very
weak
Very
strong
1 2 3 4 5
Brand vision
Organisational culture
Brand objectives
Brand essence
Implementation & brand
resourcing
Figure 4.2: Brand health bar chart – a hypothetical example
Source: De Chernatony (2006:311)
The above brand health chart can then indicate areas of the brand that need to be
addressed. By undertaking this evaluation annually (De Chernatony, 2006:311),
changes and trends can be identified and supportive activities implemented.
The brand health bar chart can therefore be summarised as follows:
Table 4.4 Summary of brand health bar chart
Evaluation done by: Employees, stakeholders and customers
Applied to: Manufacturing industry
Aspects measured: Brand vision; organisational culture objectives;
brand essence; implementation; brand resourcing

A conceptual instrument to measure the success of branding in the tourism industry 121
Can it work for the tourism industry? This method is more focused on an internal brand
analysis than an external analysis and does not
make provision for measuring the brand from the
customer’s point of view.
The second evaluation method is a diagnostic tool designed for the business
community.
4.2.2 Brand assessment questionnaire (Singapore Government)
Developed by the Singapore Government in collaboration with Enterprise IG, the brand
assessment is a diagnostic tool designed for the business community. It is a
straightforward analytical virtual scorecard which can be used to conduct internal
assessment for a brand in order to understand current brand position and possible
issues to consider for international branding success.
It comprises two sections: Section 1 asks ten questions which are rated on a scale of 1
to 10 and in Section 2 international brand issues can be indicated.
Section 1 consists of the following questions:
(Brand awareness) How would you characterise your company’s level of brand
understanding and brand awareness?
(Brand management) At what level in your company are decisions made that
impact on your brand?
(Brand strategy) How much weight does brand carry in your business strategy?
(Brand investment) Describe your company’s financial commitment to brand
growth.
(Brand value) How does your company measure brand in the local market?
(Brand presence) How would you rank the current strength of your brand in the
local market?
(Brand process) Describe your company’s commitment to brand development.

A conceptual instrument to measure the success of branding in the tourism industry 122
(Brand behaviour) How much effort is spent on making sure internal audiences
understand and faithfully represent your brand?
(Brand research) How good is your company at assessing the relevance and
relationship of your brand to customers’ needs?
(Brand consistency) By what means does your company ensure the
consistency of brand communication?
Section 1 therefore measures aspects related to awareness, management, strategy,
investment, value, presence, process, behaviour, research and consistency.
Section 2 consists of the following ten frequently encountered issues experienced by
companies who want to take their brand internationally. One or more of the following
can or may be applicable:
Centralisation versus decentralisation of brand management
Brand pricing and commoditisation
Brand architecture
Brand globalisation versus localisation
Brand positioning
Different legal/ regulatory context for brands
Cultural translation of brand attributes
Competition with big brands
Naming/ renaming of brands
People development of local brand champions
Section 2 therefore measures ten frequently issues related to international branding.
Based on the answers from sections 1 and 2, a final score out of 100 is given.
A score of 1 to 49 indicates that the brand needs help, and recommended steps
to improve each of the ten aspects asked in section 1 are given.
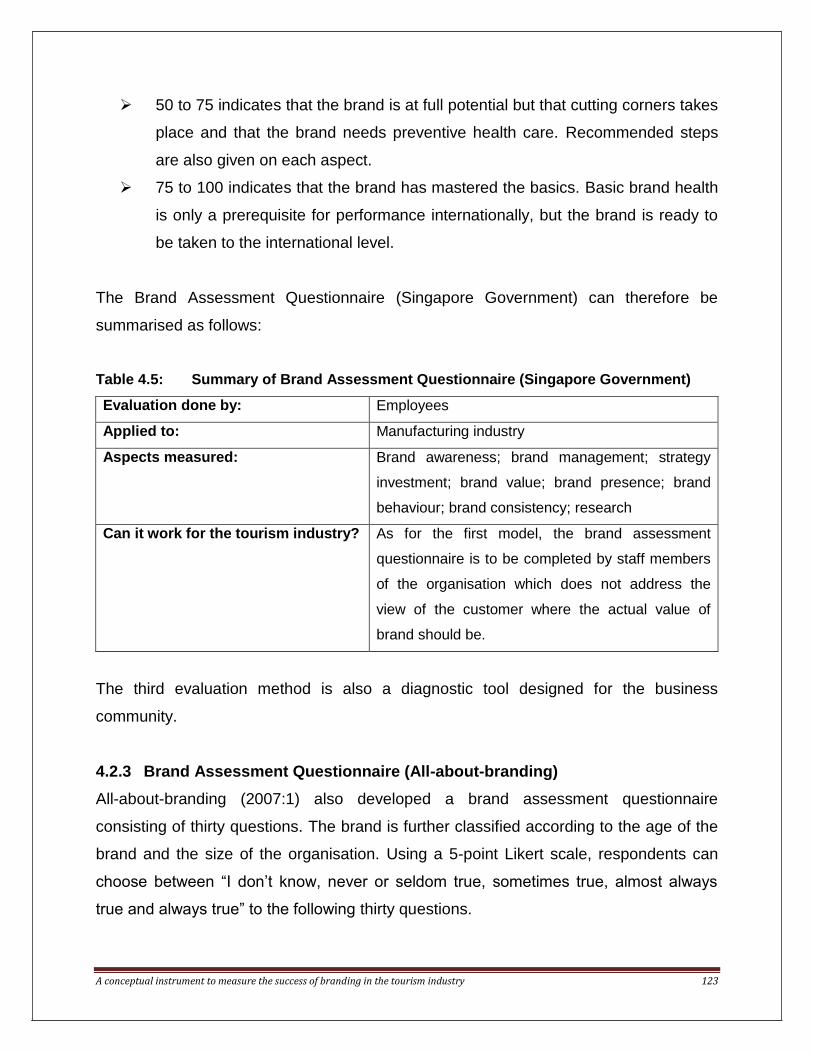
A conceptual instrument to measure the success of branding in the tourism industry 123
50 to 75 indicates that the brand is at full potential but that cutting corners takes
place and that the brand needs preventive health care. Recommended steps
are also given on each aspect.
75 to 100 indicates that the brand has mastered the basics. Basic brand health
is only a prerequisite for performance internationally, but the brand is ready to
be taken to the international level.
The Brand Assessment Questionnaire (Singapore Government) can therefore be
summarised as follows:
Table 4.5: Summary of Brand Assessment Questionnaire (Singapore Government)
Evaluation done by: Employees
Applied to: Manufacturing industry
Aspects measured: Brand awareness; brand management; strategy
investment; brand value; brand presence; brand
behaviour; brand consistency; research
Can it work for the tourism industry? As for the first model, the brand assessment
questionnaire is to be completed by staff members
of the organisation which does not address the
view of the customer where the actual value of
brand should be.
The third evaluation method is also a diagnostic tool designed for the business
community.
4.2.3 Brand Assessment Questionnaire (All-about-branding)
All-about-branding (2007:1) also developed a brand assessment questionnaire
consisting of thirty questions. The brand is further classified according to the age of the
brand and the size of the organisation. Using a 5-point Likert scale, respondents can
choose between “I don’t know, never or seldom true, sometimes true, almost always
true and always true” to the following thirty questions.

A conceptual instrument to measure the success of branding in the tourism industry 124
We actively investigate what is important to our customers, using research, face
to face interviews, questionnaires, suggestion boxes, etc.
We understand how our customers feel about our products and services.
We judge the effectiveness of our brand in terms of how it looks and feels to our
customers – not how it seems to us.
We understand the attitudes of our customers and their changing views and
needs.
We don’t have to discount prices in order to attract and keep our customers.
Our customers can state quite clearly and simply what is important about our
brand to them, and why they think it is different.
Our communication plan includes all the various places and ways in which we
interact with our customers.
We have aligned our organisational structure, operations and culture with our
brand values.
Our induction programme includes education on our brand and the role it plays in
enhancing our competitiveness.
We understand in our own minds what differentiates our brand from our
competitors.
Everyone in our organisation knows what our brand stands for and can articulate
that idea simply and clearly.
Everyone in our organisation knows what they have to do to deliver on our brand
promise.
Included in our performance management systems is an assessment of the
contribution each individual makes to growing and enhancing the brand.
Our communications, marketing, service delivery, finance and HR functions are
all aligned with our brand objectives.
Branding is championed throughout our organisation, from the CEO down.

A conceptual instrument to measure the success of branding in the tourism industry 125
We receive regular internal communications detailing what our brand is about.
Strengthening and protecting the company’s brand is a fundamental driver
behind our organisation’s long-term goals.
We have a brand management programme in place that is continually looking for
new and more effective ways to protect and enhance our brand throughout the
organisation.
Our branding strategies are proactively driven. They do not depend on what our
competitors are up to.
Accounts quantifying the value of our brand to our business are included in our
financial systems.
Details of our brand and the strategy that drives it are well documented and that
information is available to those who need and desire it.
All key stakeholders are involved in our brand creation process.
Our company has systems in place for carefully monitoring the appropriateness,
timeliness, integration and consistency of our branded communications.
We view brand as applying to far more than just our visual identity and our
marketing communications.
Our brand includes not just our core organisation but also our partners and key
third party suppliers.
We regard our brand agency(ies) as our strategic partner(s) and actively involve
it(them) in organisational and communications planning and review sessions.
Our marketing and communications team has an integrated understanding of our
brand and is in constant communication over brand-related activities and issues.
The consistency of our brand is paramount. It reaches way beyond just tactical
brand campaigns and it is deeper than even key personnel changes.
We review our brand and what it stands for with all our agencies at least once a
year.
A conceptual instrument to measure the success of branding in the tourism industry 126
If our brand did not exist, the vast majority of our customers would notice our
absence and really miss having us in their lives.
The brand assessment questionnaire therefore measures whether research is done to
identify what is important to customers, whether the organisational structure is aligned
with brand values, whether a brand induction programme exists for new employees,
whether staff is involved with and understand the brand, whether the business functions
are aligned to the brand objectives, the effectiveness of internal communication, the
consistency of the brand and lastly, whether the brand is reviewed at least once a year.
Based on the answers from all thirty questions, a final score out of 100 is given.
A score of 1 to 40 indicates that the company understands to a limited extent
that the brand is important. The company is vulnerable to competition because
its brand is not a priority.
41 to 70 indicates that the brand is on an upward trend and the company is well
placed to continue to grow its importance by incorporating more of the ideas
and practices included in this assessment.
71+ indicates that the brand is inspirational. Staff has a full understanding of
what it really means to deliver brand promises. Exceptional attention to the
importance of the brand means that consumers carefully and consciously
choose that brand over those of competitors. Communications are consistent
over time while remaining relevant to various audiences. The brand is
distinctive and memorable (All-About-Branding, 2007:5).
The brand assessment questionnaire (All-about-branding) can therefore be summarised
as follows:
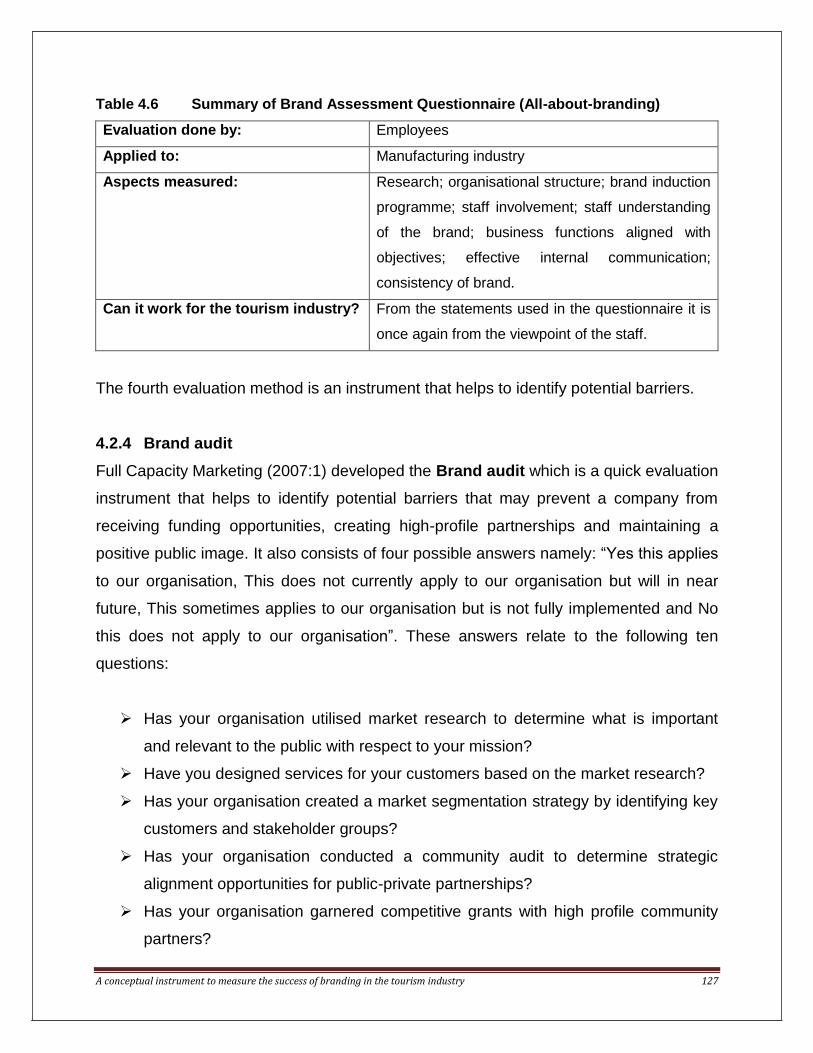
A conceptual instrument to measure the success of branding in the tourism industry 127
Table 4.6 Summary of Brand Assessment Questionnaire (All-about-branding)
Evaluation done by: Employees
Applied to: Manufacturing industry
Aspects measured: Research; organisational structure; brand induction
programme; staff involvement; staff understanding
of the brand; business functions aligned with
objectives; effective internal communication;
consistency of brand.
Can it work for the tourism industry? From the statements used in the questionnaire it is
once again from the viewpoint of the staff.
The fourth evaluation method is an instrument that helps to identify potential barriers.
4.2.4 Brand audit
Full Capacity Marketing (2007:1) developed the Brand audit which is a quick evaluation
instrument that helps to identify potential barriers that may prevent a company from
receiving funding opportunities, creating high-profile partnerships and maintaining a
positive public image. It also consists of four possible answers namely: “Yes this applies
to our organisation, This does not currently apply to our organisation but will in near
future, This sometimes applies to our organisation but is not fully implemented and No
this does not apply to our organisation”. These answers relate to the following ten
questions:
Has your organisation utilised market research to determine what is important
and relevant to the public with respect to your mission?
Have you designed services for your customers based on the market research?
Has your organisation created a market segmentation strategy by identifying key
customers and stakeholder groups?
Has your organisation conducted a community audit to determine strategic
alignment opportunities for public-private partnerships?
Has your organisation garnered competitive grants with high profile community
partners?

A conceptual instrument to measure the success of branding in the tourism industry 128
Has your organisation developed a proactive plan to engage secondary target
audiences to market your mission?
Has your organisation developed a single brand identity and single point of
contact for your customers?
Has your organisation used customer feedback on a regular basis to improve
services?
Has your organisation created a monthly rate of investment snapshot that
includes metrics such as brand awareness, market penetration, service
outcomes, new customers, strategic partnerships and market position?
Have your organisation’s customer contact teams been trained in customer
service?
The Brand audit therefore measures potential barriers that may prevent a company from
receiving funding opportunities, creating high-profile partnerships and maintaining a
positive public image.
Based on the answers to all ten questions, a final score out of 100 is given.
A score of 1 to 49 indicates that a brand make-over is needed and that the way
of communication to consumers is poor.
50 to 75 indicates that the brand needs a consistent strategy in order to make a
shift to a more customer service friendly model.
75+ indicates that the brand is well on its way to become relevant to customers’
and stakeholders’ needs.
The gaps identified through the Brand Audit are addressed by using the Customer-
Centric Roadmap. It is a simple 3-step process to track and monitor the destinations
market position. It is based on continuous customer feedback that will enable the
destination to adapt to changes and remain relevant in the market.
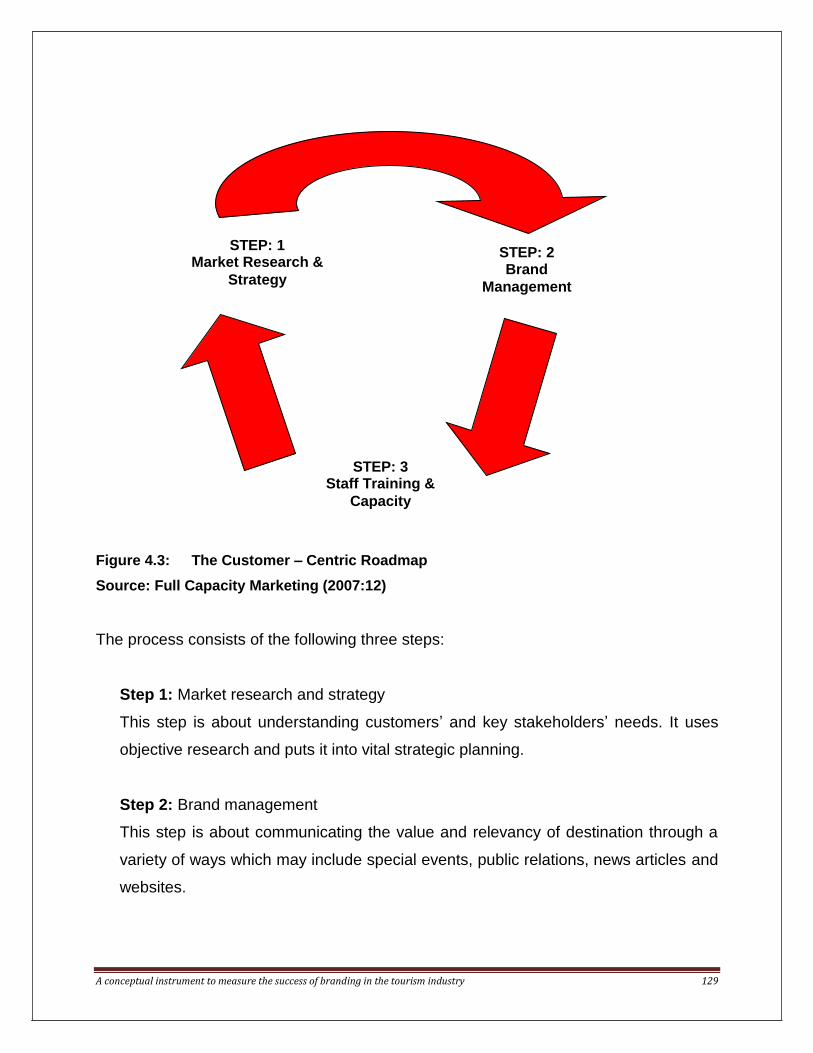
A conceptual instrument to measure the success of branding in the tourism industry 129
Figure 4.3: The Customer – Centric Roadmap
Source: Full Capacity Marketing (2007:12)
The process consists of the following three steps:
Step 1: Market research and strategy
This step is about understanding customers’ and key stakeholders’ needs. It uses
objective research and puts it into vital strategic planning.
Step 2: Brand management
This step is about communicating the value and relevancy of destination through a
variety of ways which may include special events, public relations, news articles and
websites.
STEP: 2 Brand
Management
STEP: 1 Market Research &
Strategy
STEP: 3 Staff Training &
Capacity

A conceptual instrument to measure the success of branding in the tourism industry 130
Step 3: Staff training and capacity
This is the most important brand touch-point for any destination. Employees must be
trained to deliver what was promised through advertising (Full Capacity Marketing,
2007:2).
The brand audit can therefore be summarised as follows:
Table 4.7 Summary of Brand Audit
Evaluation done by: Employees and management
Applied to: Manufacturing industry
Aspects measured: Potential barriers to receiving funding; creating high
profile partnerships; maintaining a positive public
image
Can it work for the tourism industry? The Brand Audit to a greater extent addresses the
financial side of the brand and does not entail a full
spectrum of aspects that can measure the success
of a brand.
The fifth evaluation method has a greater focus on brand equity.
4.2.5 Criteria to assess the strength of a brand
According to De Chernatony and McDonald (2003:402), Millward Brown International
has devised a helpful diagnostic tool which enables managers to understand the basis
for their brand’s equity compared to competing brands. Millward Brown International
developed a Brand Dynamics Pyramid model (Figure 3.7).

A conceptual instrument to measure the success of branding in the tourism industry 131
Figure 4.4: Brand dynamics pyramid
Source: De Chernatony & McDonald (2003:401)
De Chernatony and McDonald (2003:402) point out that for a brand to be considered by
consumers as potentially useful, the brand must have a presence, both physically in
terms of availability, and psychologically in terms of awareness. If these consumers find
the promise inherent in the brand to be relevant to their particular needs, they are
expected to progress to trying the brand for the first time and therefore forming a view
about its performance. De Chernatony and McDonald (2003:402) further state that
consumers are led to a view about the brand’s relative advantages by evaluating the
brand’s functional and emotional performance capabilities relative to competing brands.
De Chernatony and McDonald (2003:402) lastly indicate that if these advantages about
Weak relationship/
Low share of
category expenditure
Strong relationship/
High share of
category expenditure
PRESENCE
RELEVANCE
PERFORMANCE
ADVANTAGE
BONDING
Do I know about it?
Does it offer me
something?
Can it deliver?
Does it offer something
better than the others?
Nothing else beats it!

A conceptual instrument to measure the success of branding in the tourism industry 132
the brand are particularly strong, they are likely to continue buying the brand and over
time a bonded relationship is formed with that brand.
The Brand Dynamics Pyramid can therefore be summarised as follows:
Table 4.8 Summary of brand dynamics pyramid
Evaluation done by: Employees and customers
Applied to: Manufacturing industry
Aspects measured: Brand presence; what can brand offer; does brand
have a competitive advantage?
Can it work for the tourism industry? The brand dynamics pyramid measures limited
brand variables related to the tourism industry.
The sixth evaluation method focuses more on brand relevance.
4.2.6 Brand relevance tachometer
According to Riesenbeck and Perry (2007:51), there is hardly an industry today that
does not hope to profit from the growing value of brands. Although the power of brands
is increasing, the researchers further warn not to jump blindly onto the brand wagon.
The mere assumption that brands are always important is misleading and can result in
poor investment decisions.
Based on the above statement, the starting point is therefore to establish how relevant
the brand is in shaping purchasing behaviour. With the help of a group of researchers
from three well-respected German research institutions, the Marketing Centrum Munster
at the University of Munster, the Institute of Innovation Research at the University of Kiel
and the Institute for Retail and Marketing at the University of Hamburg, a
comprehensive scale was developed to measure brand relevance. The brand relevance
measurement scale does not only capture the overall relevance of brands as perceived
by customers, but also breaks it down into the following three functional components:

A conceptual instrument to measure the success of branding in the tourism industry 133
Information efficiency as the time factor – brands makes it easier for customers
to gather and process information about the product.
Risk reduction as the trust factor – selecting a brand name product reduces the
customers’ subjective risk of making a purchase mistake.
Image benefit as the expressive factor – brands may offer the additional benefit
of helping the customer foster a desired image.
The brand relevance tachometer can therefore be summarised as follows:
Table 4.9 Summary of brand relevance tachometer
Evaluation done by: Customers
Applied to: Manufacturing industry
Aspects measured: Relevance of brand; information efficiency; risk
reduction; brand image
Can it work for the tourism industry? The brand relevance tachometer also measures a
limited number of variables and might thus
measure only a section of the success of the brand.
The competitive levels in the tourism industry is
high, given the number of destinations and should
therefore encompass a more detailed analysis.
As soon as the market segments have been determined and the target groups
identified, the image of the brand can be ascertained by using the seventh evaluation
method known as the McKinsey Brand Diamond.
4.2.7 McKinsey brand diamond
According to Riesenbeck and Perry (2007:78), McKinsey developed its own empirically-
based structuring approach for analysing a brand image. This method uses the
attributes and benefits associated with the brand image and divide them into the
following four elements:
Tangible factors – the associations in this category are generally those that arise
first in the perception of customers. It includes all the characteristics that can be

A conceptual instrument to measure the success of branding in the tourism industry 134
perceived by the customers’ five senses and form the basis for the strength of
the brand’s image.
Intangible factors – comprise the characteristics associated with the brand’s
origin, reputation and personality. These factors are not visible.
Rational benefits – these include all the measureable benefits of the brand and
are directly related to the tangible factors of the brand.
Emotional benefits – consumers associate an emotional benefit with a brand if it
reinforces their self-image. Brands are therefore often used by consumers as
status symbols.
Figure 4.5: McKinsey brand diamond
Source: Riesenbeck and Perry (2007:78)
The above brand diamond can be used to fully analyse the brand image and is
conducted by following these three steps:
Intangible
What does the brand
provide?
Who or what is
the brand?
Tangible
Brand value Brand attributes
Rational values
Function
Process
Relationship
Tangible attributes
Properties
Presence
Emotional values
Self-portrayal
Self -realisation
Intangible attributes
Heritage
Reputation
Personality

A conceptual instrument to measure the success of branding in the tourism industry 135
Step 1: Determine all the relevant or potentially relevant brand associations. The four
dimensions of the brand diamond act as a structural aid that helps to assert accurately
all the attributes influencing the brand image. These can be identified through interviews
or preliminary quantitative market research.
Step 2: Once the image dimensions have been selected, the next step is to evaluate
these dimensions by potential customers in a quantitative market research study. The
images of the essential brands are generally measured with the help of rating scales.
Step 3: The final step is to compare the image of the company’s own brand with that of
a competing brand. In order to avoid an exceedingly high degree of complexity and
cost, it is recommended to do a comparison of only those dimensions in which the
brand possesses critical strengths or weaknesses.
The McKinsey brand diamond can therefore be summarised as follows:
Table 4.10: Summary of McKinsey brand diamond
Evaluation done by: Customers
Applied to: Manufacturing and tourism industry
Aspects measured: Brand image based on tangible and intangible
factors; rational and emotional benefits
Can it work for the tourism industry? The McKinsey brand diamond focuses mainly on
the measurement of image which can be of value
to a tourism brand but does not make provision for
other related variables.
Once the brand diamond has been used to reveal all the associations linked to the
brand, the next task is to shape the brand image in the desired direction. This can be
done by using the eighth evaluation method known as the brand purchase funnel.

A conceptual instrument to measure the success of branding in the tourism industry 136
4.2.8 Brand purchase funnel
According to Riesenbeck and Perry (2007:83), a brand’s impact on the behaviour of
customers can be measured by making use of the brand purchase funnel. This is based
on the AIDA model (attention, interest, desire, action) and represents the purchase
process in five stages. The stages are shown in Figure 4.7 and include what percentage
of the target group is firstly, aware of the brand; secondly, familiar with its products and
services prior to buying; thirdly, how many will consider buying the brand; fourthly, how
many have already purchased it once; and lastly, who will purchase the brand again?
Figure 4.6: Brand purchase funnel
Source: Riesenbeck and Perry (2007:84)
According to Figure 4.7, strong brands tend to be successful at all stages and the last
two stages of the brand funnel are crucial as this is where consumer behaviour has a
direct impact on the level of satisfaction and earnings. In order to measure the
performance of a brand, research data on consumer behaviour is collected at each
stage. This data is then used to calculate the respective number of customers the brand
retains from stage to stage.
The brand purchase funnel can therefore be summarised as follows:
Aided
awareness Familiarity Consideration Purchase Loyalty

A conceptual instrument to measure the success of branding in the tourism industry 137
Table 4.11 Summary of brand purchase funnel
Evaluation done by: Customers
Applied to: Manufacturing and tourism industry
Aspects measured: Awareness; familiarity; considered buying; already
purchased; will purchase in future
Can it work for the tourism industry? The brand purchase funnel focuses on a process to
create loyalty to the brand and not necessarily on
measuring the success of the brand.
Table 4.12 summarises the aspects measured, evaluation scale used and outcome of
each of the above methods discussed.
Table 4.12: Summary of brand evaluation methods
Aspect measured
Ev
alu
ati
on
scale
us
ed
Mu
lti-
dim
en
sio
nal
eva
lua
tio
n (
inte
rnal)
Bra
nd
ass
es
sm
en
t –
Sin
ga
po
re (
exte
rna
l)
Bra
nd
ass
es
sm
en
t – A
ll
Ab
ou
t B
ran
din
g (
inte
rna
l)
Bra
nd
au
dit
(in
tern
al)
Bra
nd
Dy
na
mic
Py
ram
id
(exte
rnal)
Bra
nd
Dia
mo
nd
(exte
rnal)
Bra
nd
Pu
rch
ase
Fu
nn
el
(exte
rnal)
Vision
5-p
oin
t L
ikert
sca
le
X
Organisational
culture
X
Objectives X
Brand essence X
Implementation &
resourcing
X
Awareness
10-p
oin
t
Lik
ert
sca
le X X X
Management X X
Strategy X X
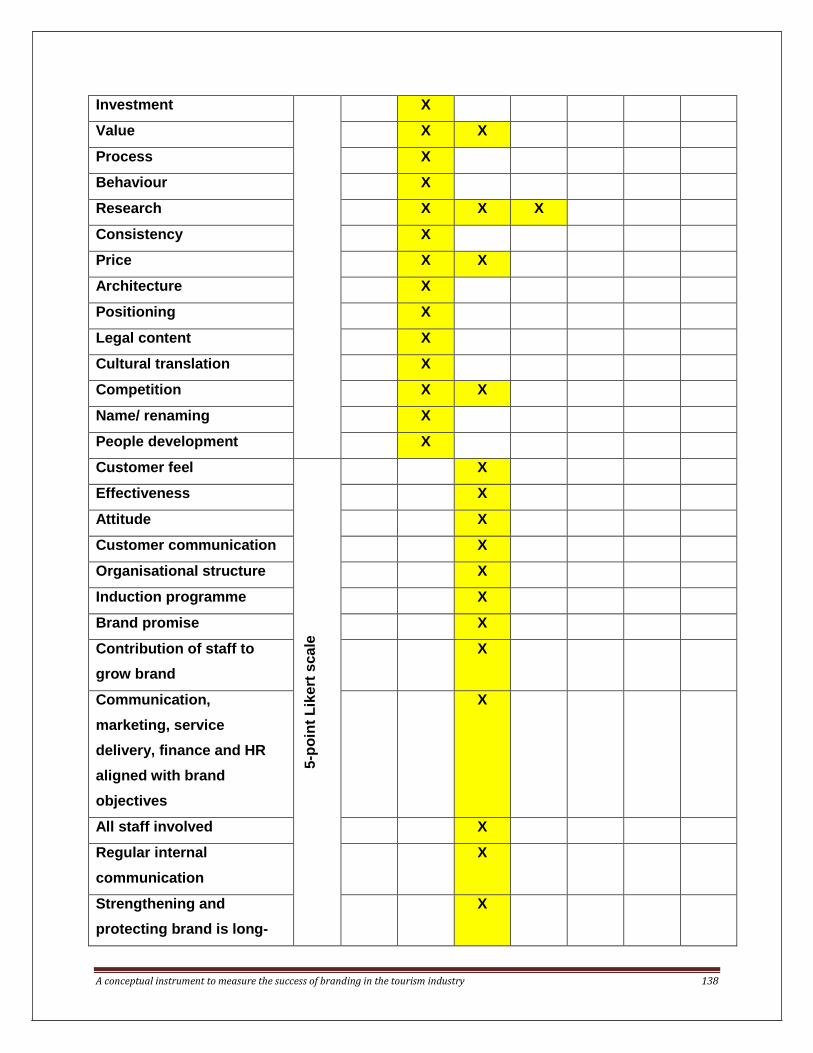
A conceptual instrument to measure the success of branding in the tourism industry 138
Investment X
Value X X
Process X
Behaviour X
Research X X X
Consistency X
Price X X
Architecture X
Positioning X
Legal content X
Cultural translation X
Competition X X
Name/ renaming X
People development X
Customer feel
5-p
oin
t L
ikert
sca
le
X
Effectiveness X
Attitude X
Customer communication X
Organisational structure X
Induction programme X
Brand promise X
Contribution of staff to
grow brand
X
Communication,
marketing, service
delivery, finance and HR
aligned with brand
objectives
X
All staff involved X
Regular internal
communication
X
Strengthening and
protecting brand is long-
X
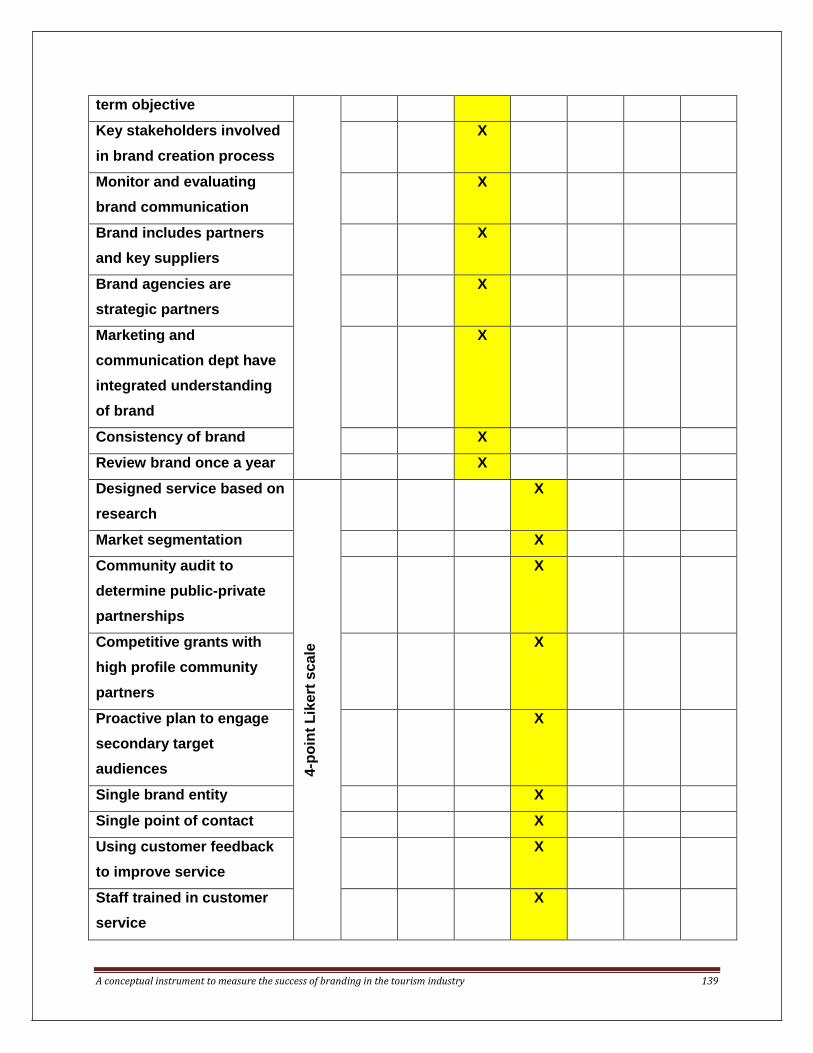
A conceptual instrument to measure the success of branding in the tourism industry 139
term objective
Key stakeholders involved
in brand creation process
X
Monitor and evaluating
brand communication
X
Brand includes partners
and key suppliers
X
Brand agencies are
strategic partners
X
Marketing and
communication dept have
integrated understanding
of brand
X
Consistency of brand X
Review brand once a year X
Designed service based on
research
4-p
oin
t L
ikert
sca
le
X
Market segmentation X
Community audit to
determine public-private
partnerships
X
Competitive grants with
high profile community
partners
X
Proactive plan to engage
secondary target
audiences
X
Single brand entity X
Single point of contact X
Using customer feedback
to improve service
X
Staff trained in customer
service
X

A conceptual instrument to measure the success of branding in the tourism industry 140
Presence
5-p
oin
t L
ikert
sca
le
X
Relevance X
Performance X
Advantage X
Branding X
Tangible factors
5-p
oin
t
Lik
ert
sca
le X
Intangible factors X
Rational benefits X
Emotional benefits X
Familiarity
5-p
oin
t
Lik
ert
sca
le X
Consideration X
Purchase X
Loyalty X
Outcome given
Bra
nd
hea
lth
bar
ch
art
Sc
ore
ou
t o
f 1
00
Sc
ore
ou
t o
f 1
00
Sc
ore
ou
t o
f 1
00
+ C
usto
me
r
cen
tric
ro
ad
ma
p
Bra
nd
dyn
am
ics p
yra
mid
Co
mp
ari
so
n b
etw
een
se
lf a
nd
co
mp
eti
ng
bra
nd
No
ne
From the above Table 4.12 it can be concluded that various aspects were measured by
every brand evaluation method. All brand evaluation methods made use of a likert scale
of between 4 and 10. The brand evaluation methods were designed to measure either
internal or external brand aspects. Only seven brand aspects measured (awareness,
management, strategy, value, research, price, competition) were similar in some of the
brand evaluation methods. The outcome of each of the brand evaluation methods was
either in figure format, given as a score out of 100, or shown as a comparison. None of
these evaluation methods could be applied, as is, to a tourism product.
A conceptual instrument to measure the success of branding in the tourism industry 141
The second outcome of this chapter was to conduct a literature review to establish
which brand elements should be included in the conceptual tourism brand measurement
instrument. This will be discussed in the next section.
4.3 BRAND MEASUREMENT ASPECTS AND ELEMENTS
Table 4.13 summarises the brand aspects as well as brand elements that were included
in previous tourism-related studies. These studies revealed the main aspects and
elements that were used to measure the success of a brand from the perspective of the
tourist/ visitor.
4.3.1 Brand awareness
Brand awareness is the probability that consumers are familiar with a brand. It is also
the degree to which consumers can associate the brand with the specific product (Kotler
& Keller, 2007:13). There are two types of brand awareness:
Aided awareness – this means that on mentioning the product category, the
consumer can recognise the brand from a given list.
Top of mind awareness – this means that on mentioning the product category,
the consumer can recall the specific brand from memory.
The elements that were used to test brand awareness in previous tourism-related
studies are shown in Table 4.13 below.

A conceptual instrument to measure the success of branding in the tourism industry 142
Table 4.13: Brand awareness elements
Brand awareness
Chan
don (
200
3:2
)
Boo,
Busser
and
Ba
log
lu (
2009:2
19
-231)
Kon
ecnik
and G
art
ner
(20
06:4
11)
Kim
an
d K
im (
200
4:5
54)
Tasci, G
art
ner
and C
avusgil
(200
7:1
532)
Murp
hy,
Moscard
o a
nd B
enckendorf
f (2
007
:8)
Fung S
o a
nd K
ing (
200
9:5
98)
Jale
es (
2006:7
)
Name all the hotel-related tourism brands you
can think of.
X X
Do you remember seeing this brand? X X
Complete the following word: R-S-RT. X
This brand has a good name and reputation. X
This brand is very famous. X
The characteristics of this brand come to my
mind quickly.
X
When I am thinking of ..., this brand comes to
my mind immediately.
X
Name this tourism destination. X
What characteristics make this tourism
destination recognisable?
X
Write down the name of a luxury hotel in Seoul. X
Identify the luxury hotel from the following list: X
Rate a destination by only providing the
destination name.
X
Describe the destination by using three words. X
I am aware of this hotel. X
I am familiar with this hotel. X

A conceptual instrument to measure the success of branding in the tourism industry 143
I know what this hotel looks like. X
I recognise this hotel. X
Rate the following brands in terms of your
awareness.
X
From Table 4.13 above, “name all the hotel related tourism brands you can think of” and
“do you remember seeing this brand?” were the only two similar elements tested under
brand awareness.
4.3.2 Brand usage
According to Healy (2008:45), brand usage refers to deliberate purchase of a brand in
order to enjoy its benefits as advertised. The elements that were used to test brand
usage in previous tourism-related studies are shown in Table 4.14 below.
Table 4.14: Brand usage elements
Brand usage
Fung S
o a
nd K
ing (
200
9:5
97)
Aaker
(19
96:1
09)
Sm
ith (
2012:1
)
Brand suits my needs X X
Brand is reliable X X
Brand is superior X
Good service linked to brand X
Quality service linked to brand X
I trust the brand X X
I like the brand X
The brand is credible X X X
The brand has high quality X
The brand has consistent quality X

A conceptual instrument to measure the success of branding in the tourism industry 144
From Table 4.14 above, “the brand suits my needs; the brand is reliable; I trust the
brand; and the brand is credible” were the only similar elements tested under brand
usage.
4.3.3 Brand satisfaction According to He, Li and Harris (2012:3), satisfaction occurs when a brand’s
performance meets the purchaser’s expectations. The elements that were used to test
brand satisfaction in previous tourism-related studies are shown in Table 4.15 below.
Table 4.15: Brand satisfaction elements
Brand satisfaction T
asci, G
art
ner
and C
avusgil
(200
7:1
532)
Fung S
o a
nd
Kin
g (
200
9:5
98)
Aaker
(19
96:1
09)
Sm
ith (
2012:1
)
Jale
es (
2006:7
)
Rate the destination by showing pictures of the
destination
X X
This hotel is value for money X X
I consider this hotel a good buy X
I got more than my money’s worth X
Makes sense to use this hotel instead of
another one
X X X X
Prefer to use this hotel even if it has same
features as another
X X X X
Prefer to use this hotel even if another has
better features
X
Seems smarter to use this hotel X

A conceptual instrument to measure the success of branding in the tourism industry 145
This hotel is the best X
From Table 4.15 above, “rate the destination by showing pictures of the destination;
makes sense to use this hotel instead of another one; and I prefer to use this hotel even
if it has same features as another” were the only similar elements tested under brand
satisfaction.
4.3.4 Brand loyalty According to Kotler and Keller (2007:15), brand loyalty refers to a consumer’s repeated
purchase of a product from a familiar supplier. Suppliers often employ a loyalty reward
system to try to keep existing users. The elements that were used to test brand loyalty
in previous tourism-related studies are shown in Table 4.16 below.
Table 4.16: Brand loyalty elements
Brand loyalty
Boo,
Busser
and B
alo
glu
(2
009:2
19
)
231)
Kon
ecnik
and G
art
ner
(20
06:4
11)
Kim
an
d K
im (
200
4:5
54)
Aaker
(19
96:1
08)
Sm
ith (
2012:1
)
I enjoy visiting the destination X
The destination would be my preferred choice
for a vacation
X X
Overall I am loyal to this destination X X
I would advise friends to visit this destination X X X X X
Number of previous visits X
Time of last visit X
Destination provides more benefits X

A conceptual instrument to measure the success of branding in the tourism industry 146
I will visit this destination in the future X X X X
I regularly visit this hotel X
I usually use this hotel X
I am satisfied with this visit X X
I will not switch to another hotel next time I visit X X
From Table 4.16 above, “the destination would be my preferred choice for a vacation;
overall I am loyal to this destination; I would advise friends to visit this destination; I will
visit this destination in the future; I am satisfied with this visit and I will not switch to
another hotel next time I visit” were the only similar elements tested under brand loyalty.
4.3.5 Brand experience Brand experience is a personal source of information that can be utilised to form the
bases of future repurchase intentions (Brakus, Schmitt & Zarantonello, 2009:4). The
elements that were used to test brand experience in previous tourism-related studies
are shown in Table 4.17 below.
Table 4.17: Brand experience elements
Brand experience
Fung S
o a
nd
Kin
g (
200
9:5
97)
Aaker
(19
96:1
09)
Sm
ith (
2012:1
)
Jale
es (
2006:7
)
Bra
kus, S
ch
mitt an
d Z
ara
nto
ne
llo (
200
9:5
8)
(2009:5
8)y
ear:
p)
(2009
:58)
Chin
om
ona (
201
3:1
316)
I like the brand X X
React favourably to the brand X
I feel positive towards the brand X X

A conceptual instrument to measure the success of branding in the tourism industry 147
This brand is innovative X
I feel uplifted by using the brand X
I feel relaxed after using the brand X
I feel fulfilled by experiencing the brand X
I feel soothed after using the brand X
How satisfied are you with this brand? X
This brand brings pleasant memories to me X
This brand makes a strong impression on my
visual sense
X X
I find this brand interesting in a sensory way X X
This brand does not appeal to my senses X X
This brand induces feelings and sentiments X X
I do not have strong emotions for this brand X X
This brand is an emotional brand X X
I engage in physical actions and behaviour
when I use this brand
X X
This brand results in bodily experiences X X
This brand is not action-oriented X X
I engage in a lot of thinking when I encounter
this brand
X X
This brand stimulates my curiosity and problem
solving
X X
From Table 4.17 above, “I like the brand; I feel positive towards the brand; this brand
makes a strong impression on my visual sense; I find this brand interesting in a sensory
way; this brand does not appeal to my senses; this brand induces feelings and
sentiments; I do not have strong emotions for this brand; this brand is an emotional
brand; I engage in physical actions and behaviour when I use this brand; this brand
results in bodily experiences; this brand is not action-oriented; I engage in a lot of
thinking when I encounter this brand; and this brand stimulates my curiosity and
problem solving” were the similar elements tested under brand experience.

A conceptual instrument to measure the success of branding in the tourism industry 148
From Tables 4.13 to 4.17 above it can be concluded that brand awareness, brand
usage, brand satisfaction, brand loyalty and brand experience were the aspects
included within the previous tourism-related studies. The elements tested under each of
these five aspects tend to differ and were applied to the specific tourism product tested.
Brand awareness, brand usage, brand satisfaction, brand loyalty and brand experience
were also identified in the literature review of the previous chapter as being important in
the evaluation of a tourism brand. These five aspects will therefore form part of the
conceptual instrument to measure the success of branding within the tourism industry.
4.4 CONCLUSION
The goals of this chapter are twofold. The first goal was to identify and analyse current
models and tools used to measure brand effectiveness by means of an in-depth
literature review. Eight different evaluation methods were analysed and it was found that
various aspects were measured by each brand evaluation method; that all brand
evaluation methods made use of a Likert scale of between four to ten; that all the brand
evaluation methods were designed to measure either internal or external brand aspects;
that only seven brand aspects measured (awareness, management, strategy, value,
research, price, competition) were similar in some of the brand evaluation methods; that
the outcome of each of the brand evaluation methods were either in figure format, given
as a score out of 100, or shown as a comparison. None of the eight evaluation methods
could be applied, as is, to a tourism-related product.
The second goal was to conduct a literature review to establish which brand elements
should be included in the conceptual tourism brand measurement instrument. This was
done by evaluating previous tourism brand-related studies. It was found that brand
awareness, brand usage, brand satisfaction, brand loyalty and brand experience were
the aspects included in the previous tourism-related studies. The elements tested under
each of the above mentioned five aspects tend to differ and were applied to the specific
tourism product tested. These elements will all form part of the exploratory part of this
study.

A conceptual instrument to measure the success of branding in the tourism industry 149
CHAPTER 5
METHOD OF RESEARCH
5.1 INTRODUCTION
The word “research” is used on a daily basis and refers to various situations (Leedy &
Ormrod, 2010:1). It may firstly refer to finding information, making notes and writing a
documented paper on the topic. Secondly, it may refer to the act of informing people of
facts not known to them. Lastly, merchandisers often make use of the word to suggest
that they discovered a groundbreaking product. According to Zikmund and Babin
(2010:5), Malhotra and Birks (2006:6), Malhotra & Peterson (2006:9) and Franses and
Paap (2003:3), research refers to the systematic process of collecting, analysing and
interpreting data in order to better understand a known or unknown phenomenon. The
researchers further mention that research consists of the following characteristics,
namely: research originates with a question or problem; research requires clearly
indicated goals; a specific plan; research divides a problem into smaller manageable
sub-problems; research is guided by a specific problem, question or hypothesis;
research accepts certain assumptions; research requires the collection and
interpretation of primary or secondary data and lastly, research is cyclical by nature.
The goal of this chapter is to briefly summarise the research process and to elaborate
on the research process followed during this study.
5.2 RESEARCH DESIGN
The research process starts with the research design. According to Saunders et al.
(2009:137) and Robson (2002:58), research design refers to the general plan of how
the researcher will go about answering the research questions. It must further contain

A conceptual instrument to measure the success of branding in the tourism industry 150
specific objectives that are derived from the research questions, specify the sources
from which to collect data, consider constraints as well as discussing ethical issues. It
should also reflect the fact that the researcher has thought carefully about the particular
research design chosen (Kumar, 2011:94). Research design further includes three
types of studies. These are discussed in the next section.
5.2.1 Exploratory studies
An exploratory study may be used when the researcher needs to find out what is
happening, to seek insights, to ask questions and to assess a phenomenon from a new
perspective (Zikmund & Babin, 2010:44; Saunders, Lewis & Thornhill, 2009:139;
Robson, 2002:59). Exploratory studies are particularly useful to clarify understanding a
problem.
5.2.2 Descriptive studies
A descriptive study can be used to portray an accurate profile of persons, events or
situations (Zikmund & Babin, 2010:44; Saunders et al., 2009:140; Robson, 2002:59).
Descriptive research can also be an extension or forerunner of exploratory or
explanatory research.
5.2.3 Explanatory studies
An explanatory study may be used to establish causal relationships between variables
(Saunders et al., 2009:140; Malhotra & Peterson, 2006:74-76; Robson, 2002:59). The
emphasis is to explain the relationship between variables by studying a situation or
problem.
The method of research for this study was exploratory in nature owing to the gap in
literature and practice of a measurement to assess the success of a brand in the
tourism industry. It was conducted in different phases. Phase A refers to the literature
analysis, Phase B to the qualitative research and Phases C and D to the quantitative
research. Phase A of the research process involved the collection of data or information
that had already been published. This is referred to as secondary data.

A conceptual instrument to measure the success of branding in the tourism industry 151
5.3 SECONDARY DATA
According to McDaniel and Gates (2010:72-83), Saunders et al. (2009:258), Shui, Hair,
Bush and Ortinau (2009:137-158), Wiid and Diggines (2009:70-84), Cant, Gerber-Nel,
Nel and Kotze (2008:65-83), Aaker, Kumar and Day (2007:109-114), Malhotra and Birks
(2006:83-100), Malhotra and Peterson (2006:100-109), Crouch and Housden (2003:19),
Churchill and Lacobucci (2002:243-256), Webb (2002:30) and Robson (2002:121),
secondary data can include both quantitative and qualitative data and are used in both
descriptive and explanatory research.
Secondary data can be firstly classified as documentary secondary data. This can
include written materials such as notices, correspondence, minutes of meetings, reports
to shareholders, diaries, transcripts of speeches and administrative and public records.
Secondly, secondary data can be classified as written documents that may include
books, journals, magazine articles and newspapers. Lastly, secondary data may also be
results from surveys completed. See chapters 2, 3 and 4 for the information pertaining
to the literature review of this study.
After the collection of relevant secondary data, the researcher must decide on one of
the following seven research strategies to follow.
5.4 RESEARCH STRATEGIES
According to Burns and Bush (2010:45-50), Saunders et al. (2009:141), Robson
(2002:123) and Hakim (2000:98), each of the following strategies can be used to
conduct research. The researchers further mention that no selected research strategy is
inherently superior or inferior to any other. What is most important is not the label that is
attached to the particular strategy, but whether it will enable the researcher to answer
the research question(s) and meet the objectives. The following is a brief summary of
research strategies that a researcher can choose from.
5.4.1 Experiment
An experiment strategy is a form of research that owes much to the natural sciences,

A conceptual instrument to measure the success of branding in the tourism industry 152
although it features strongly in much social science research, particularly psychology.
The purpose of an experiment is to study causal links, that is, whether a change in one
independent variable produces a change in another dependent variable (Hakim,
2000:100; Kumar, 2011:113).
5.4.2 Survey
The survey strategy is a popular and common strategy in business and management
research and is most frequently used to answer who, what, where, how much and how
many. The popularity of surveys is due to the fact that they allow the collection of a
large amount of data from a sizeable population in a highly economical way (Saunders
et al., 2009:144).
5.4.3 Case study
A case study is defined by Robson (2002:178) as “a strategy for doing research which
involves an empirical investigation of a particular contemporary phenomenon within its
real life context using multiple sources of evidence”. Yin (2003:132) also highlights the
importance of context and adds that, with a case study, the boundaries between the
phenomenon being studied and the context within which it is being studied are not
clearly evident.
5.4.4 Action research
Action research has been interpreted by management researchers under four common
themes. The first focuses on and emphasises the purpose of research; the second
relates to the involvement of practitioners; the third emphasises the iterative nature of
the process of diagnosing, planning, taking action and evaluating; and the fourth theme
suggests that action research should have implications beyond the immediate project
(Coghlan & Brannick, 2005:58).
5.4.5 Grounded theory
According to Goulding (2002:149), it is more effective to think of this theory as theory-
building through a combination of induction and deduction. This strategy is particularly

A conceptual instrument to measure the success of branding in the tourism industry 153
helpful for research to predict and explain behaviour with the emphasis being upon
developing and building theory.
5.4.6 Ethnography
This strategy is firmly rooted in the inductive approach and emanates from the field of
anthropology. The purpose of ethnography is to describe and explain the social world
the research subjects inhabit in the way in which they would describe and explain it.
This research strategy is very time consuming (Saunders et al., 2009:149).
5.4.7 Archival research
This strategy makes use of administrative records and documents as the principal
source of data. These documents may be recent or historical documents (Saunders et
al., 2009:150).
For the purpose of this study survey design (cf. 5.9) was utilised to address the goal of
the study. Because not every person in the targeted research population could be
included in the research, the researcher made use of a sample. The available sampling
techniques are discussed in the next section.
5.5 SAMPLING TECHNIQUES
According to Kumar (2011:194), Saunders et al. (2009:212) and Malhotra and Peterson
(2006:330), it is possible for some research questions to collect data from an entire
population if the population is a manageable size. For all research questions where this
is impractical, the researcher needs to collect a sample. This sampling is broadly
divided into probability and non-probability sampling.
5.5.1 Probability sampling
With this type of sampling the chance of each case being selected from the population
is known and is usually equal for all cases. This means that it is possible to answer
research questions and to achieve objectives that require one to estimate statistically
the characteristics of the population from the sample. Probability sampling is often

A conceptual instrument to measure the success of branding in the tourism industry 154
associated with survey and experimental strategies (Kumar, 2011:199; Saunders et al.,
2009:213; Malhotra & Peterson, 2006:330-333).
The following are different types of probability sampling:
5.5.1.1 Simple random
This sampling technique involves the selection of a sample at random from the
sampling frame using random number tables, a computer or an online random number
generator (Saunders et al., 2009:222; Kumar, 2011:203).
5.5.1.2 Systematic
This sampling technique involves the selection of a sample at regular intervals from the
sampling frame (Saunders et al., 2009:226).
5.5.1.3 Stratified random
This sampling technique is a modification of random sampling in which the population is
divided into two or more relevant and significant strata, based on one or a number of
attributes or subsets. A random sample (simple or systematic) is then drawn from each
of the strata (Saunders et al., 2009:228; Kumar, 2011:203).
5.5.1.4 Cluster
This sampling technique is similar to stratified sampling as the population is divided into
discrete groups prior to sampling. These groups are known as clusters. For sampling,
the researcher then samples from the list of clusters rather than from a list of
individuals. Data are then collected from each case within the selected cluster
(Saunders et al., 2009:230; Kumar, 2011:204).
5.5.1.5 Multi-stage
This technique is also known as multi-stage cluster sampling. It is normally used to
overcome problems associated with a geographically dispersed population when face to
face contact is needed or where it is expensive and time consuming to construct a

A conceptual instrument to measure the success of branding in the tourism industry 155
sampling frame for a large geographical area. The technique involves taking a series of
cluster samples, each involving some form of random sampling (Saunders et al.,
2009:231).
5.5.2 Non-probability sampling
For this type of sampling the probability of each case being selected from the total
population is not known and it is impossible to answer research questions or to address
objectives that require one to make statistical inferences about the population (Kumar,
2011:206; Saunders et al., 2009:213; Malhotra & Peterson, 2006:334-338).
The following are different types of non-probability sampling:
5.5.2.1 Quota
This sampling technique is entirely non-random and is normally used for interview
surveys. Quota sampling is therefore a type of stratified sample in which selection cases
within strata is entirely non-random (Kumar, 2011:206; Cant et al., 2008:66; Saunders
et al., 2009:235).
5.5.2.2 Purposive
Also known as judgemental sampling, researchers use their judgement to select cases
that will best enable them to answer the research questions and meet set objectives
(Kumar, 2011:207; Saunders et al., 2009:237; Malhotra & Peterson, 2006:358).
5.5.2.3 Snowball
This sampling technique is commonly used when it is difficult to identify members of the
desired population. The main problem with this technique is to make initial contact.
Once this is achieved, the one case identifies further members of the population
(Kumar, 2011:208; McDaniel & Gates, 2010:333; Saunders et al., 2009:240).
5.5.2.4 Self-selection
This sampling technique occurs when one allows each case, usually individuals, to

A conceptual instrument to measure the success of branding in the tourism industry 156
identify their desire to take part in the research. Publicity to participate in the survey is
done through articles, advertisements in magazines, newspapers and via the Internet,
and via invitation letters sent electronically to friends and colleagues (Kumar, 2011:207;
Smith, 2010:95; Saunders et al., 2009:241).
5.5.2.5 Convenience
Also known as haphazard sampling, this technique involves selecting haphazardly
those cases that are easiest to obtain for the sample. The sample selection process
continues until the required sample size has been reached (Saunders et al., 2009:241;
McDaniel & Gates, 2006:320; McDaniel & Gates, 2005:289).
This study utilised judgement sampling (non-probability) for the qualitative phase and
random sampling (probability) in the quantitative phase (See 1.5.3 and 1.5.4 for detailed
information).
5.6 SAMPLE SIZE
According to Kumar (2011:210), McDaniel and Gates (2010:352), Zikmund and Babin
(2010:328), Shui et al. (2009:460), Aaker et al. (2007:408), Cooper and Schindler
(2006:478), Stutely (2003:58) and Churchill and Lacobucci (2002:498), calculating
sample size will depend on whether probability or non-probability sampling is used. For
probability sampling, a table is used to calculate the sample size. Table 5.1 indicates
the sample size for different sizes of population at a 95% confidence level.
Table 5.1: Sample sizes for different sizes of population at a 95% confidence level
Population
Margin of error
5% 3% 2% 1%
50 44 48 49 50
100 79 91 96 99
150 108 132 141 148
200 132 168 185 196
250 151 203 226 244
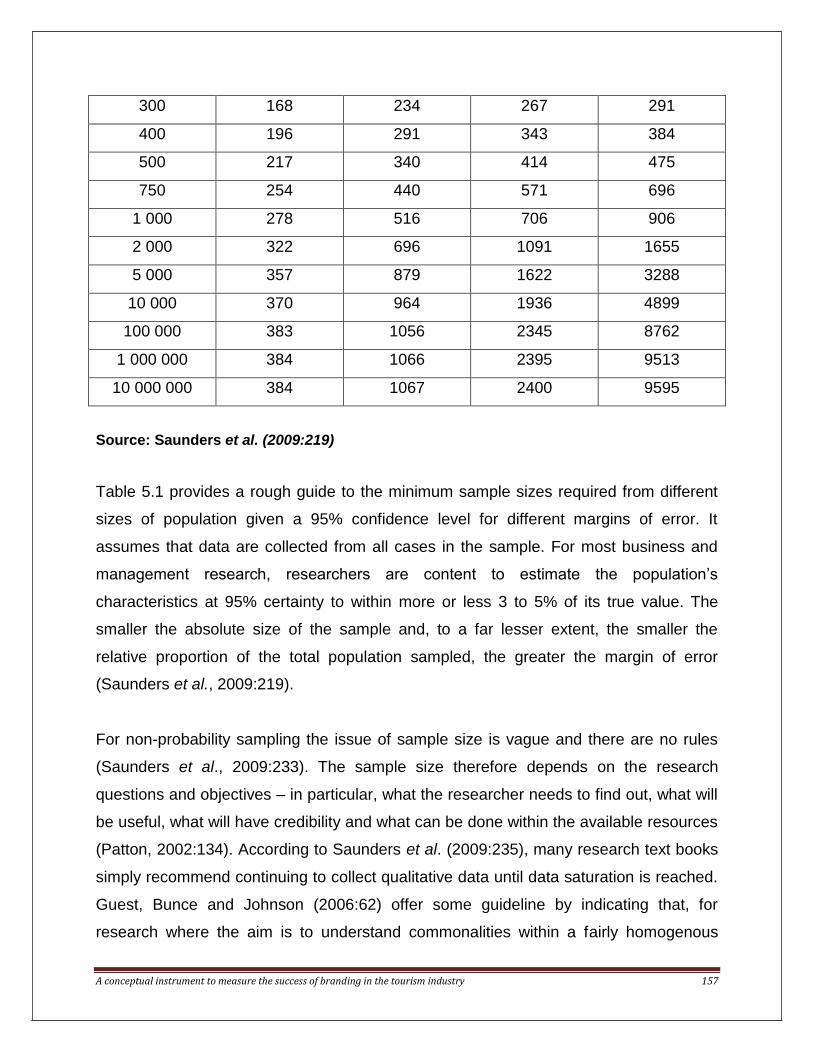
A conceptual instrument to measure the success of branding in the tourism industry 157
300 168 234 267 291
400 196 291 343 384
500 217 340 414 475
750 254 440 571 696
1 000 278 516 706 906
2 000 322 696 1091 1655
5 000 357 879 1622 3288
10 000 370 964 1936 4899
100 000 383 1056 2345 8762
1 000 000 384 1066 2395 9513
10 000 000 384 1067 2400 9595
Source: Saunders et al. (2009:219)
Table 5.1 provides a rough guide to the minimum sample sizes required from different
sizes of population given a 95% confidence level for different margins of error. It
assumes that data are collected from all cases in the sample. For most business and
management research, researchers are content to estimate the population’s
characteristics at 95% certainty to within more or less 3 to 5% of its true value. The
smaller the absolute size of the sample and, to a far lesser extent, the smaller the
relative proportion of the total population sampled, the greater the margin of error
(Saunders et al., 2009:219).
For non-probability sampling the issue of sample size is vague and there are no rules
(Saunders et al., 2009:233). The sample size therefore depends on the research
questions and objectives – in particular, what the researcher needs to find out, what will
be useful, what will have credibility and what can be done within the available resources
(Patton, 2002:134). According to Saunders et al. (2009:235), many research text books
simply recommend continuing to collect qualitative data until data saturation is reached.
Guest, Bunce and Johnson (2006:62) offer some guideline by indicating that, for
research where the aim is to understand commonalities within a fairly homogenous

A conceptual instrument to measure the success of branding in the tourism industry 158
group, 12 in-depth interviews must be conducted. If the sample is drawn from a
heterogeneous population or the research question is wide ranging, the researcher
should undertake between 25 and 30 interviews (Creswell, 2007:58).
Random sampling was used for this study in the quantitative phase since Resort group
1 had a membership total of more than 70 000 at the time of this study. Thus, according
to Table 5.1, a sample size of 370 questionnaires was needed. A total of 2 152 fully
completed questionnaires were collected and analysed, thus far exceeding the required
sample size. Resort group 2 had a database bank of more than 20 000 at the time of
this study. Thus, according to Table 5.1, a sample size of 370 questionnaires was
needed. A total of 599 fully completed questionnaires was collected and analysed,
exceeding the required sample size.
There are two types of questionnaires available to the researcher. These are discussed
in the next section.
5.7 QUESTIONNAIRES
5.7.1 Types of questionnaires
Questionnaires are divided into those that are administered by the respondent or those
administrated by the interviewer (Kumar, 2011:145; McDaniel & Gates, 2010:286;
Smith, 2010:61; Zikmund & Babin, 2010:269; Saunders et al., 2009:362; Shui et al.,
2009:327; Wiid & Diggines, 2009:158; Brace, 2008:45; Cant et al., 2008:147; Aaker et
al., 2007:316; Cooper & Schindler, 2006:390; Malhotra & Birks, 2006:324; Malhotra &
Peterson, 2006:284; Roe, 2004:187; Crouch & Housden, 2003:169; Churchill &
Lacobucci, 2002:280; Webb, 2002:89).
5.7.1.1 Self-administered
According to the above mentioned researchers, this type of questionnaire is completed
by the respondent and is administrated by using the Internet, intranet, posted to
respondents or delivered by hand and collected later.

A conceptual instrument to measure the success of branding in the tourism industry 159
5.7.1.2 Interviewer administered
This type of questionnaire, according to the above mentioned researchers, is recorded
by the interviewer on the basis of each respondent’s answers. Questionnaires are
administrated using a telephone or face to face structured interview.
The type of questionnaire used for this study was self-administered, as an e-mail
invitation was send to both databases. This invitation included a link to the
questionnaire in Survey Monkey.
The choice of questionnaire can be influenced by a number of factors. These factors are
indicated in the next section.
5.7.2 Choice of questionnaire
According to Kumar (2011:148), Saunders et al. (2009:363) and Salzberger (2009:3),
the choice of questionnaire is influenced by the following factors related to the research
questions and objectives:
Characteristics of the respondents from whom data are collected
Importance of reaching a particular person or respondent
Importance of respondents’ answers not being contaminated or distorted
Size of the sample that is required for analysis
Types of questions asked to collect data
The number of questions asked to collect data
After considering the above factors, an electronic questionnaire was designed on
Survey Monkey. The next section explains the process followed during this study.

A conceptual instrument to measure the success of branding in the tourism industry 160
5.8 THE RESEARCH PROCESS FOLLOWED TO REACH THE GOAL
OF THE STUDY
The research process indicated below was followed for this study and consisted of
different phases. Figure 5.1 summarise this process.
Figure 5.1 Research process applied
5.8.1 Phase A: Literature study
In formulating the literature study, relevant academic articles, tourism, marketing and
management books as well as existing brand measurement instruments were used.
Journals such as Annals of Tourism Research, Tourism Management and the Journal
for Brand Management as well as postgraduate studies were used to gather secondary
information. Further information was obtained by using academic Internet search
engines such as Science Direct, Ebsco-Host and Emerald. The purpose of the literature
study was to establish which brand measurement tools currently exist and how they
PHASE A LITERATURE REVIEW
To establish which brand measurement tools currently exist
and how these were applied to the tourism industry
PHASE C EXPLORATORY RESEARCH To determine the reliability of the data
PHASE B QUALITATIVE RESEARCH To gather and analyse information
from a group of experts
PHASE D EXPLORATORY RESEARCH To validate the reliability of the
data

A conceptual instrument to measure the success of branding in the tourism industry 161
were applied by previous researchers to the tourism industry. It was also important to
determine the elements relevant to a brand instrument for the tourism industry in this
phase.
The following keywords were used for search purposes: brand, brand awareness, brand
loyalty, destination image, brand personality, tourism marketing, tourism promotion,
brand equity, experience and brand perception.
5.8.2 Phase B: Qualitative research
This section highlights the first method chosen to conduct the empirical analysis.
5.8.2.1 Research design, method of collecting data and test plan
The research for this part of the study was exploratory, as the Delphi technique was
used to gather and analyse the data. This technique is described by researchers as a
qualitative method but with quantitative elements (Malhotra & Birks, 2006:75). The
Delphi technique involves the gathering and analysis of information from a panel of
experts in a particular field of interest. The experts in the field completed a
questionnaire indicating their views on the likelihood of certain developments taking
place in future. These views were then collated and circulated to panel members for
further comment and repeated for a second time before final results are collated (Veal,
2006:105; Jennings, 2001:283). The Delphi process comprised of the following steps:
Step 1: Develop the research question – A review of the literature was conducted to
determine the theoretical gap and gather the necessary information to minimise the
identified gap. From this, fifty-seven possible brand measure elements were identified
and included in the Delphi questionnaire.
Step 2: Design the research – The Delphi method was selected as judgements of
experts in a group decision-making setting was needed (Cant, Gerber-Nel, Nel & Kotze,
2003:27). During this step, a total of sixteen invitations were sent to domestic experts,
eighteen to domestic experts from the industry and seventy to international experts to

A conceptual instrument to measure the success of branding in the tourism industry 162
participate in this research. Those who had previous knowledge on tourism branding or
who were currently working on aspects of branding were given priority placement in
either the domestic or international groups. Selecting the research participants was a
critical component (cf. Table 1.3), since it was these participants’ expertise on which the
outcome of the Delphi method was based (Chrisnall, 2001:34). There were four
requirements for ‘expertise’. Firstly, they had to have knowledge and/ or experience with
branding and its application. Secondly, they had to have the capacity and willingness to
participate. Thirdly, they had to have sufficient time to participate. Fourthly, effective
communication skills were needed (Chrisnal, 2001:34; Adler & Ziglio, 1996:25). Since
expert opinions were sought, a purposive sample was necessary where participants
were not selected to represent the general population, but rather for their expert ability
to answer the research question. During the initial contact, the potential respondents
were invited via e-mail, informed about the research process and invited to participate.
They were assured of anonymity in the sense that none of their statements would be
attributed to them by name. After securing the participation of the respondents, the
questionnaire was finalised for Round 1 of the Delphi technique.
Step 3: Develop Delphi Round 1 questionnaire – The initial broad questions were
developed through careful analysis and evaluation of the literature and formed the focus
of the Delphi technique. This was because, if respondents did not understand the
question, they may have provided inappropriate answers and/ or may become
frustrated. The initial fifty-seven brand measurement elements identified through the in-
depth literature review were included in the draft questionnaire (see Annexure A). This
draft questionnaire made use of a 5-point Likert scale to rate each element. The
respondents had to rate each of the identified fifty-seven brand measure elements
based on the Likert scale where 1 was ‘extremely important’ and 5 was ‘not important at
all’.
Step 4: Release and analyse Round 1 questionnaire – The draft questionnaire was then
distributed via e-mail to the Delphi participants who had accepted the invitation. A total
of sixteen experts accepted the previous e-mail invitation. These included a mix of

A conceptual instrument to measure the success of branding in the tourism industry 163
domestic, industry and international experts and therefore formed part of this first round
questionnaire. The draft questionnaire was compiled in an Excel format with a clear
description for each part to be completed. The participants were given 10 days to
complete the draft questionnaire and they were also allowed to add elements they
considered appropriate. Each of the fifty-seven elements was rated on a 5-point Likert
scale and returned to the researcher via e-mail. The results of Round 1 was then
analysed according to the research paradigm. This allowed the researcher to eliminate
irrelevant elements by making use of the median values. Owing to the fact that 1 =
extremely important and 5 = not important at all, all elements higher than 2.5 (mean
value) were eliminated.
Step 5: Develop Round 2 questionnaire – The responses from Round 1 form the basis
of the questions in the Round 2 questionnaire. The researcher was directed by the
opinions of the sixteen participants. The purpose of Round 2 was to pare down on the
identified brand measurement elements (Veal, 2006:107). The format of the questions
remained the same.
Step 6: Release and analyse Round 2 questionnaire – The Round 2 questionnaire
consisted of fifty-two elements and was released to the sixteen research participants for
the second time via e-mail. They were once again requested to complete and return the
questionnaire to the researcher for analysis. However, the participants were firstly given
the opportunity to verify that the Round 1 responses did, indeed, reflect their opinions
and that they were further afforded the opportunity to change or expand their Round 1
responses now that the other research participants’ answers were shared with them
(Veal, 2006:107). Continuous verification throughout the Delphi process was critical to
improve the reliability of the results (Chrisnall, 2001:34) and was factored into the
research design. After analysis, non-valid elements were eliminated from the
questionnaire by applying the median values. Owing to the fact that 1 = extremely
important and 5 = not important at all, all elements higher than 2.5 (mean value) were
eliminated.
A conceptual instrument to measure the success of branding in the tourism industry 164
Step 7: Round 3
In the final phase, a list of the remaining elements was e-mailed to the participants. The
sixteen research participants were again given the opportunity to change their answers
and to comment on the emerging and collective perspective of the research
participants. The purpose of this phase was to reach consensus on the final elements to
be included in the conceptual instrument. This conceptual instrument then formed the
basis of Phase C of this study. This final questionnaire consisted of fifty-one elements.
5.8.2.2 Sampling framework and sampling technique
During Phase B, the potential respondents were contacted via e-mail, informed about
the research process and invited to participate. They were assured of anonymity in the
sense that none of their statements would be attributed to them by name. A total of
sixteen invitations were sent to domestic experts, eighteen to domestic experts from the
industry and seventy to international experts. Purposive sampling was therefore
implemented in this part of the study.
5.8.2.3 Data analysis
The data was coded on SPSS (Version 18) and analysed according to the research
paradigm (statistical summarising into medians plus upper and lower quartiles). The
results were then presented with descriptive tables (Field, 2005:10).
5.8.3 Quantitative research (Phase C)
5.8.3.1 Research design and method of collecting data
The research design was of an exploratory nature, since this research focused on
developing a questionnaire. The questionnaire (as completed in Phase B) was finalised
and distributed electronically through the marketing department of a well-known resort
group in South Africa (for the purpose of this study referred to as ‘resort group 1’) to its
members. This resort group was chosen since its brand was already well established
and well-known. The purpose of Phase C was to determine the reliability of the data.

A conceptual instrument to measure the success of branding in the tourism industry 165
5.8.3.2 Sampling framework and sampling technique
Resort group 1 has been operational for 85 years and currently had more than 200 000
members. An e-mail invitation was sent by the resort’s group marketing department to
all their members stating the purpose and importance of the research. A link to the
brand questionnaire in Survey Monkey was included in this invitation (see Annexure B).
The sampling used for this part of the research was random sampling which is the
purest form of probability sampling. Every member of the population had an equal and
known chance of being selected. When there is a very large population, it is often
difficult or impossible to identify every member of the population, so the pool of available
subjects becomes biased. On completion of the questionnaire, all respondents were
automatically thanked for their participation and the completed questionnaire was
available to the researcher via the Survey Monkey website. A total of 2 152 fully
completed questionnaires were collected and analysed.
5.8.3.3 Data analysis
Because of the electronic nature of the surveys, the data was captured automatically via
the Survey Monkey website. The data from every survey could be viewed individually on
the Survey Monkey website. The data from resort group 1 was first cleaned by the
researcher by deleting any uncompleted surveys. The total of fully completed surveys
for resort group 1 was 2 152. This data was then exported to Excel and underwent a
second cleaning process. The data was then further analysed by Statistical Consultation
Services at the North-West University and interpreted by the researcher.
According to Saunders et al. (2009:414), Blaxter, Hughes and Tight (2010:238),
Zikmund and Babin (2010:352) and Crouch and Housden (2003:226), quantitative data
in a raw form convey very little meaning. This data must be processed to make them
useful and turn them into information. Analysis techniques such as graphs, charts and
statistics are used to explore, present and examine relationships and trends within the
data (Zikmund & Babin, 2010:352-365; Shui et al., 2009:529-533; Cant et al., 2008:204-
224; Aaker et al., 2007:509-513; Malhotra & Birks, 2006:510-530; Malhotra & Peterson,
2006:434-450; Churchill & Lacobucci, 2002:674-690). A few methods were thus

A conceptual instrument to measure the success of branding in the tourism industry 166
appropriate for the analysis of this phase. To examine the factors underlying
satisfaction, loyalty and experience, a principle component axis factor analysis with
oblique rotation (direct oblimin) was undertaken. Reliability (Cronbach’s alpha) was
computed to verify the internal consistency of aspects of every factor. This was very
important as the purpose of this phase was to assess the reliability of the data.
5.8.4 Quantitative research (Phase D)
5.8.4.1 Research design and method of collecting data
Research design was of an exploratory nature, since this research focuses on the
second step to validate the conceptual instrument that can measure the success of
branding in the tourism industry. Following Phase C, and once the results of the factor
analysis had been obtained, changes were made to the conceptual instrument and
distributed through the marketing department of a second well-known resort group in
South Africa (for the purpose of this study known as ‘resort group 2’) to all members on
their database. The data and results of Phase D were compared to those of Phase C to
determine the validity and reliability of the instrument. The purpose of this phase was
thus to validate the reliability of the data.
5.8.4.2 Sampling framework and sampling technique
Resort group 2 was bought by an international company and therefore underwent a
brand change a few years ago. Their brand is therefore relatively young compared to
the brand of resort group 1. An e-mail invitation was sent by the resort’s group
marketing department to all members on their current database stating the purpose and
importance of the research. Their database totalled a number of almost twelve thousand
e-mail addresses. A link to the brand questionnaire in Survey Monkey was included in
this invitation (see Annexure C). Random sampling was used for this part of the
research as this type of sampling is the purest form of probability sampling. Every
member of the population had an equal and known chance of being selected. When
there is a very large population, it is often difficult or impossible to identify every
member of the population, so the pool of available subjects becomes biased. On

A conceptual instrument to measure the success of branding in the tourism industry 167
completion of the questionnaire, all respondents were automatically thanked for their
participation and the completed questionnaire was available to the researcher via the
Survey Monkey website. A total of 599 fully completed questionnaires was collected and
analysed.
5.8.4.3 Data analysis
Because of the electronic nature of the surveys, the data was captured automatically via
the Survey Monkey website. The data from every survey could be viewed individually on
the Survey Monkey website. The data from resort group 2 were first cleaned by the
researcher by deleting any uncompleted surveys. The total of fully completed surveys
for resort group 2 was 599. This data was then exported to Excel and underwent a
second cleaning process. The data was then further analysed by Statistical Consultation
Services at the North-West University and interpreted by the researcher.
According to Saunders et al. (2009:414), Blaxter, Hughes and Tight (2010:238),
Zikmund and Babin (2010:352) and Crouch and Housden (2003:226), quantitative data
in a raw form convey very little meaning. This data must be processed to make them
useful and turn them into information. Analysis techniques such as graphs, charts and
statistics are used to explore, present and examine relationships and trends within the
data (Zikmund & Babin, 2010:352-365; Shui et al., 2009:529-533; Cant et al., 2008:204-
224). A few methods were thus appropriate for the analysis of this phase. To examine
the factors underlying satisfaction, loyalty and experience, a principle component axis
factor analysis with oblique rotation (direct oblimin) was undertaken. Reliability
(Cronbach’s alpha) was computed to verify the internal consistency of aspects of every
factor. This was very important as the purpose of this phase was to assess the reliability
of the data.
5.9 CONCLUSION
The goal of this chapter was to elaborate on the research process followed during this
study. This was done by firstly explaining three different research designs. The method
of research for this study was exploratory by nature and included different phases. This
A conceptual instrument to measure the success of branding in the tourism industry 168
was followed by a discussion on how secondary data was examined. Secondary data
were classified as documentary secondary data that included written materials, written
documents and results from previous surveys completed. Thirdly, seven research
strategies were discussed with the focus on the survey strategy that was utilised to
address the goal of the study. Fourthly, the research process followed for this study was
explained and consisted of different phases. Phase A included a literature study to
establish which brand measurement tools currently exist and how these were applied by
previous researchers to the tourism industry. It was important to analyse literature in
depth to ensure that all the elements contributing to branding were identified for
inclusion in Phase B, the Delphi phase. Phase B involved a number of steps. Firstly,
brand measure elements were indentified through an in-depth literature review.
Secondly, a process was followed to invite and finalise the participation of a panel of
domestic academic, international academic and industry experts. These experts then
formed part of Step 3 that included a process whereby the indentified brand measure
elements of Phase A were rated by them and if necessary eliminated. The process was
repeated until the brand measure elements were finalised that needed to form part of
the draft questionnaire. During Phase C, the questionnaire (as completed in Phase B)
was finalised and distributed electronically through the marketing department of a well-
known resort group in South Africa (resort group 1) to its members. This resort group
was chosen since their brand has already been well established and well-known. The
purpose of Phase C was to determine the reliability of the data. Following Phase C, and
once the results of the factor analysis had been obtained, changes were made to the
conceptual instrument and distributed through the marketing department of a second
well-known resort group in South Africa (resort group 2) to all members on their
database. The data and results of Phase D were compared to those of Phase C to
determine the validity and reliability of the instrument. The purpose of this phase was
thus to validate the reliability of the data.
The ultimate goal of this study was to develop a conceptual instrument to measure the
success of branding in the tourism industry. It is clear that this can be done by following
the research process described in this chapter.

A conceptual instrument to measure the success of branding in the tourism industry 169
CHAPTER 6
EMPIRICAL RESULTS AND
FINDINGS
6.1 INTRODUCTION
The previous chapter described the methods used as well as the statistical analyses
which were applied in the empirical phase of the study. The purpose of this chapter is
twofold. Firstly, the descriptive results for the five categories (brand awareness, brand
usage, brand satisfaction, brand loyalty, brand experience) will be discussed to portray
the basic features of the data collected for both resort groups 1 and 2. Secondly, the
development of the conceptual instrument will be discussed by explaining and providing
the results of the four phases followed.
A literature study of relevant academic articles was conducted during phase A. The goal
of this phase was twofold. Firstly, to identify and analyse current models and tools used
to measure brand effectiveness by means of an in-depth literature review. The second
goal was to conduct a literature review to establish which brand elements should be
included in the conceptual tourism brand measuring instrument. Phase B of this study
was exploratory, as the Delphi technique was used to gather and analyse data from a
panel of experts. This involved a seven-step process to reach consensus on the final
elements to be included in the conceptual instrument. Phase C of this study was also
exploratory by nature, since this research focused on developing a brand measuring
instrument (questionnaire). The purpose of phase C was to determine the reliability of
the data. The purpose of the last phase (D) was to validate the proposed measuring
instrument.

A conceptual instrument to measure the success of branding in the tourism industry 170
6.2 DESCRIPTIVE RESULTS
The purpose of the descriptive results is to provide an overview of the basic assessment
of the data in the study and to summarise the large set of quantitative data. The layout
and compilation of the questions as part of the development of the conceptual
instrument are also discussed.
A RESORT GROUP 1
The questionnaire (as completed in phase B) was distributed electronically (October
2013) through the marketing department of Resort Group 1 to its members. Resort
Group 1 had a membership of 70 000 at the time of this study. An e-mail invitation was
sent by the resort’s group marketing department to all their members stating the
purpose and importance of the research. A link to the brand questionnaire in Survey
Monkey was included in this invitation. A total of 2 152 fully completed questionnaires
were collected and analysed. The descriptive results are discussed in the next five
sections.
6.2.1 Demographic information
Questions one to nine of the questionnaire focused on demographic information. This
part of the conceptual instrument is the only part that can be adapted to each brand
being assessed. The questions in this part of the instrument were mainly closed-ended
questions. This allows for easy completion and is always an effective introduction to any
questionnaire. Where other options (for example: other home language) were also
possible, space was provided for the respondents to include their responses. These
demographic information questions are next discussed in greater detail.
Table 6.1: Summary of demographic info: resort group 1
Ho
me
la
ng
ua
ge Afrikaans English Other
92.7% 7.2% 0.1%
Dutch
Arabic

A conceptual instrument to measure the success of branding in the tourism industry 171
Pro
vin
ce Gauteng Limpopo Mpuma-
langa
KwaZulu-
Natal
Western
Cape
Northern
Cape
North-
West
Free State Outside
SA
74.1% 0.4% 0.7% 0.2% 21.3% 0.1% 0.7% 2.4% 0.1%
Ge
nd
er Female Male
55.4% 44.6%
Ag
e 18 - 20 21 - 29 30 -39 40 - 49 50 - 59 60+
0.1% 4.1% 18.8% 36.7% 28.6% 11.6%
Hig
he
st
qu
alifi
cati
on
No matric Matric Diploma/d
egree
Post-
graduate
4.5%
34.9% 43.7% 16.9%
Table 6.1 summarises the demographic information of the respondents in the Resort
Group 1 survey. The majority of respondents were Afrikaans-speaking (92.7%); living in
Gauteng (74.1%) and the Western Cape (21.3%); female (55.4%); aged between 40 -
49 (36.7%) and 50 – 59 (28.6%); have completed a diploma or degree (43.7%); married
(82.8%); have no (47.3%) or two children (21.9%) and are a total of four (29.8%) or two
(27.4%) people living in one household.
Ma
rita
l
sta
tus
Single Married Widow(ed) Divorced Living
together
3.3% 82.8% 2.1% 7.5% 4.3%
Ch
ild
ren
in
ho
useh
old
None 1 2 3 4 More than
4
47.3% 21.9% 24.3% 5.2% 0.8% 0.4%
To
tal p
eo
ple
in
ho
useh
old
1 2 3 4 5 6+
2.9% 27.4% 21.2% 29.8% 12.4% 6.3%
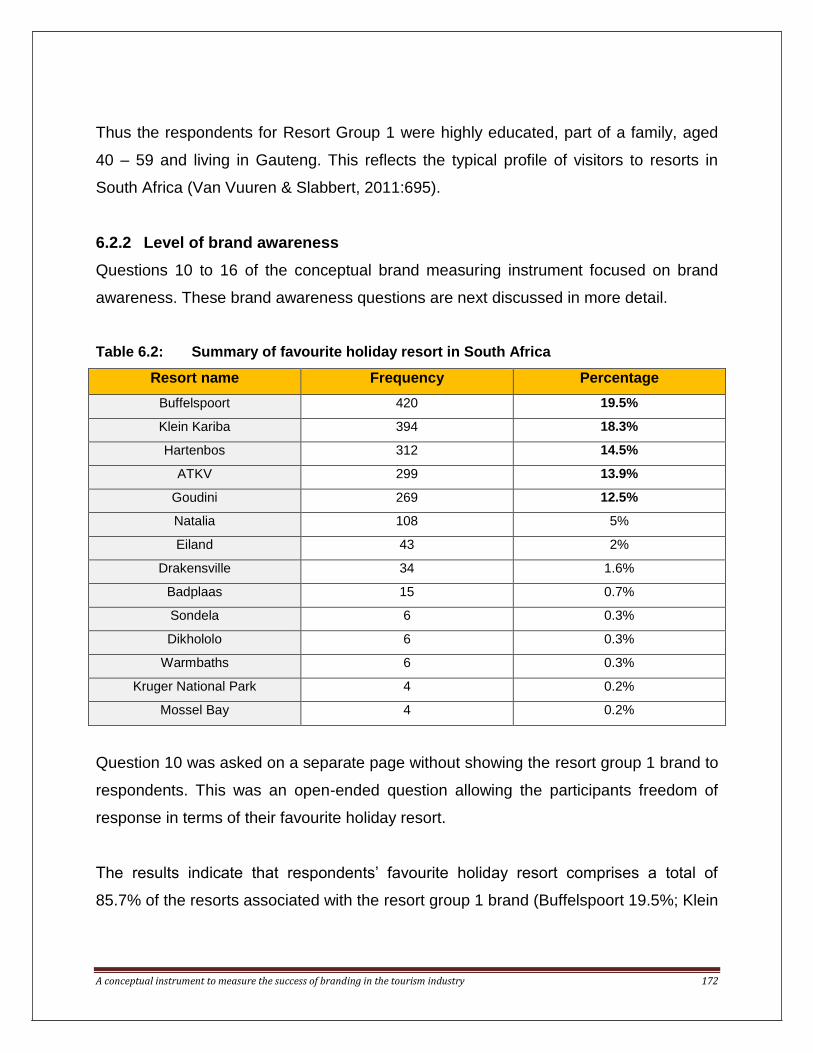
A conceptual instrument to measure the success of branding in the tourism industry 172
Thus the respondents for Resort Group 1 were highly educated, part of a family, aged
40 – 59 and living in Gauteng. This reflects the typical profile of visitors to resorts in
South Africa (Van Vuuren & Slabbert, 2011:695).
6.2.2 Level of brand awareness
Questions 10 to 16 of the conceptual brand measuring instrument focused on brand
awareness. These brand awareness questions are next discussed in more detail.
Table 6.2: Summary of favourite holiday resort in South Africa
Resort name Frequency Percentage
Buffelspoort 420 19.5%
Klein Kariba 394 18.3%
Hartenbos 312 14.5%
ATKV 299 13.9%
Goudini 269 12.5%
Natalia 108 5%
Eiland 43 2%
Drakensville 34 1.6%
Badplaas 15 0.7%
Sondela 6 0.3%
Dikhololo 6 0.3%
Warmbaths 6 0.3%
Kruger National Park 4 0.2%
Mossel Bay 4 0.2%
Question 10 was asked on a separate page without showing the resort group 1 brand to
respondents. This was an open-ended question allowing the participants freedom of
response in terms of their favourite holiday resort.
The results indicate that respondents’ favourite holiday resort comprises a total of
85.7% of the resorts associated with the resort group 1 brand (Buffelspoort 19.5%; Klein

A conceptual instrument to measure the success of branding in the tourism industry 173
Kariba 18.3%; Hartenbos 14.5%; ATKV 13.9%; Goudini 12.5%; Natalia 5% and Eiland
2%). This shows their commitment toward this specific brand.
Table 6.3: Summary of brand awareness items tested: resort group 1
Brand awareness Totally
agree
Agree Unknown Disagree Totally
disagree
“I am aware of this brand” 77.2% 21% 1.7% 0.4% 0%
“I can remember what this brand
represents”
59.4% 30.1% 8.1% 1.3% 1.2%
“I have noticed marketing campaigns
linked to this brand”
56.5% 34.6% 7.6% 1.1% 0.2%
“I know everything about this brand” 57.1% 33.8% 7.4% 1.5% 0.2%
“I have a favourable attitude towards
this brand”
66.4% 30.1% 2.6% 0.7% 0.1%
“This brand brings pleasant memories
to me”
70.9% 24.9% 3% 1% 0.2%
“Overall I am satisfied with the
products/services associated with this
brand”
64.3% 31.6% 2.5% 1.3% 0.4%
“I would recommend this brand to
friends and family”
72.9% 23.8% 1.8% 1.3% 0.3%
Every page of the questionnaire, starting from this section onwards, contained the
name/logo of the resort in question (in this case resort group 1) and thus the questions
were related to the respondents' perceptions of this particular brand. Question 11 asked
respondents to rate, on a five-point likert scale, to what extent they agree with
statements regarding the resort group 1 brand specifically focused on the awareness of
the brand. Table 6.3 indicates that respondents totally agreed with the following
statements (only percentages above 65%):
77.2% totally agreed that they were aware of the brand;
72.9% totally agreed that they would recommend the resort group 1 brand to
friends and family;
70.9% totally agreed that the brand brought pleasant memories to them;

A conceptual instrument to measure the success of branding in the tourism industry 174
66.4% totally agreed that they had a favourable attitude toward the brand.
The second highest percentage in all the above mentioned questions fell within the
agree category. All of the unknown, disagree and totally disagree categories were less
than 8.1% for all of the above aspects tested. Thus the respondents are very aware of
this particular brand and would recommend the brand to friends and family (See Table
6.3).
Table 6.4: The first word to mind when seeing the resort group 1 brand
Frequency Percentage
Vacation 495 23%
Afrikaans 420 19.5%
Sun 118 5.5%
Rest 164 7.6%
Joyful 129 6%
Fun 88 4.1%
Family 62 2.9%
Culture 34 1.6%
Goudini 32 1.5%
Pride 30 1.4%
Good times 26 1.2%
Buffelspoort 22 1%
Klein Kariba 13 0.6%
Hartenbos 13 0.6%
ATKV 11 0.5%
Camping 9 0.4%
Service 4 0.2%
Question 12 was an open-ended question where respondents were asked to write down
the first word that comes to mind when seeing the resort group 1 brand. Table 6.4
indicates that 23% of respondents wrote down the word “vacation” followed by 19.5%
who wrote down “Afrikaans”. The first impression is thus linked to the main purpose of
this resort: to provide opportunities for vacation and the second impression is linked to
the specific target market of this resort, namely Afrikaans-speaking visitors.

A conceptual instrument to measure the success of branding in the tourism industry 175
Table 6.5: Summary of recognisable brand characteristics: resort group 1
Frequency Percentage
Sun 297 13.8%
ATKV 125 5.8%
Vacation 41 1.9%
Afrikaans 37 1.7%
Colour 34 1.6%
Logo 47 2.2%
Resorts 22 1%
Affordability 4 0.2%
Question 13 was also an open-ended question and requested respondents to write
down the characteristics of the resort group 1 brand that makes it recognisable to them.
Table 6.5 indicates that the sun (13.8%) and the acronym ATKV (5.8%) were the most
recognisable characteristics. It is clear that the ATKV brand has become very well
known to their followers.
Table 6.6: Summary of appealing brand aspects: resort group 1
Frequency Percentage
Sun 269 12.5%
Vacation 95 4.4%
Afrikaans 88 4.1%
ATKV 75 3.5%
Resorts 58 2.7%
Colour 54 2.5%
Everything 39 1.8%
Nothing 26 1.2%
Simplicity 22 1%
Logo 22 1%
Culture 6 0.3%
Question 14 was an open-ended question, asking respondents to list the aspects of the
resort group 1 brand that appealed to them. According to Table 6.6 the sun (12.5%),

A conceptual instrument to measure the success of branding in the tourism industry 176
vacation (4.4%), Afrikaans (4.1%) and ATKV (3.5%) formed the majority aspects. It is
clear that respondents associate specific terms with this brand. This becomes
significant in future marketing strategies.
Table 6.7: Summary of recognisable brand aspects: resort group 1
Frequency Percentage
ATKV 93 4.3%
Sun 82 3.8%
Nothing 65 3%
Afrikaans 62 2.9%
Clear logo 56 2.6%
Colour 47 2.2%
Simplicity 41 1.9%
Do not know 37 1.7%
Vacation 17 0.8%
Everything 11 0.5%
Question 15 was an open-ended question, asking respondents what made the resort
group 1 brand more recognisable than other competing brands they were familiar with.
According to Table 6.7 the acronym ATKV (4.3%) and the sun (3.8%) were indicated by
the majority of respondents. These two aspects also formed the majority in Table 6.5.
Three percent of respondents indicated that nothing about the resort group 1 brand
made it more recognisable than competing brands. Although a small percentage, it
questions the uniqueness or unique elements of the brand. Afrikaans (2.9%); a clear
logo (2.2%) and simplicity (1.9%) formed the other majority aspects while 1.7% did not
know.
Table 6.8: Brand exposure in last month: resort group 1
Not once Once Twice Three times More than
three times
5.9% 10.6% 20.1% 15.8% 47.5%

A conceptual instrument to measure the success of branding in the tourism industry 177
The last question analysing brand awareness asked respondents how many times they
have seen the resort group 1 brand within the last month. According to Table 6.8, 47.5%
saw it more than three times, 20.1% saw it twice, 15.8% saw it three times, 10.6% saw
it only once and 5.9% of respondents did not see it once during the past month. This
brand is clearly visible and respondents can remember seeing it.
Overall this part of the questionnaire measures brand awareness which is the first step
in creating a strong brand. In this section a variety of questions were set to assess the
levels of awareness. The validity of these items is tested later in this chapter. It is clear
in this case of resort group 1 that there is a fair amount of awareness of this brand.
6.2.3 Brand usage and satisfaction
Questions 17 to 20 of the conceptual brand measuring instrument focused on brand
usage and satisfaction. These brand usage and satisfaction questions are next
discussed in greater detail.
Table 6.9: Usage of brand in past 12 months: resort group 1
Not once Once Twice Three times More than
three times
Do not know
13.6% 26.7% 26.4% 13.4% 15% 4.9%
Question 17 asked respondents how many times during the past twelve months they
made use of services linked to the resort group 1 brand. According to Table 6.9, 26.7%
made use of the brand only once; 26.4% used it twice; 15% used it more than three
times and 13.4% made use of the brand three times during the past 12 months. A total
of 13.6% of respondents did not make use of the brand at all and 4.9% did not know if
the brand they made use of, was linked to that of Resort Group 1. The brand is thus
fairly often used by respondents.

A conceptual instrument to measure the success of branding in the tourism industry 178
Table 6.10: Summary of brand usage and satisfaction items tested: resort group 1
Brand usage &
brand satisfaction
Totally
agree
Agree Unknown Disagree Totally
disagree
“Offers value for money” 52.4% 39.9% 3.5% 3.8% 0.4%
“Delivers what was promised” 53.7% 40% 3.9% 1.9% 0.5%
“Use healthy business ethics” 52.4% 39.5% 6.3% 1.3% 0.4%
“Is attractive” 58.2% 38.1% 2.6% 0.9% 0.1%
“Captures the essence of the tourism
product/service”
55.4% 38.2% 4.6% 1.5% 0.3%
“Is associated with high levels of
service”
61.4% 34.9% 2.4% 1.1% 0.3%
“Is associated with good quality
products”
60.2% 36% 2.5% 1% 0.3%
“Is associated with integrity” 61.2% 34.1% 3.7% 0.7% 0.4%
“Is easy to distinguish from competing
brands”
59% 34.4% 5.4% 0.9% 0.3%
“Is associated with a proud history of
the tourism product/service”
62.2% 33.1% 3.6% 0.8% 0.3%
“Is much talked about” 45.9% 38.4% 12.5% 2.9% 0.3%
“I will make use of this brand in the next
12 months”
66.6% 27.1% 4.8% 1% 0.5%
“Is innovative” 43.5% 45.9% 7.8% 2.6% 0.3%
“Is highly visible” 50.5% 40.6% 5.6% 2.9% 0.4%
“Is easily recognisable” 62.3% 35.2% 1.8% 0.6% 0.1%
“Is credible” 58.8% 36.9% 3.2% 1% 0.2%
“Is well established as a tourism brand” 64.5% 30.3% 4.3% 0.8% 0.1%
“Is relevant to the tourism
product/service it represents”
59.9% 36.1% 3.3% 0.7% 0.1%
“Is creative” 53.9% 38.1% 5.5% 2.2% 0.2%
“Is proudly South African” 72.9% 24.8% 1.2% 0.9% 0.2%
“Portrays value for money” 54.8% 36.5% 4.8% 3.4% 0.5%
“Portrays a good image” 63.3% 33.6% 2.2% 0.7% 0.1%
“Portrays reliability” 61.9% 34.3% 2.7% 0.9% 0.2%
Questions 18 and 19 asked respondents to rate on a five-point likert scale to what
extent they agree with statements regarding the use of the brand and satisfaction with

A conceptual instrument to measure the success of branding in the tourism industry 179
the brand for resort group 1. Table 6.10 indicates that respondents totally agreed with
the following statements (only percentages above 65%):
72.9% totally agreed that the brand was proudly South African
66.6% totally agreed that they would make use of the Resort Group 1 brand in
the next twelve months
The second highest percentage in all the above mentioned questions fell within the
agree category except for the aspect related to innovation that fell within the totally
agree category. All of the unknown, disagree and totally disagree categories were less
than 12.5% for all of the above aspects tested. Thus the respondents see the brand as
proudly South African and will make use of it in the coming year.
Table 6.11: Summary of influential aspects during decision making: resort group 1
Frequency Percentage
Affordability/price 288 13.4%
Value for money 247 11.5%
Nothing 129 6%
Reliability 86 4%
Service 56 2.6%
Quality 54 2.5%
Availability 47 2.2%
Afrikaans 37 1.7%
Cleanliness 17 0.8%
Distance 7 0.3%
The last question within the usage and satisfaction section was an open-ended question
asking respondents to write down aspects that may influence their decision when they
consider making use of services associated with the resort group 1 brand. According to
Table 6.11, affordability and price (13.4%) and value for money (11.5%) were the top
influencers. Nothing (6%) and reliability (4%) also had a big influence followed by
service (2.6%); quality (2.5%); availability (2.2%) and Afrikaans-speaking personnel

A conceptual instrument to measure the success of branding in the tourism industry 180
(1.7%). Respondents’ decisions are therefore greatly influenced by price and value for
money.
Overall this part of the questionnaire measures brand usage and satisfaction which is
the second step in creating a strong brand. In this section a variety of questions was
used to assess the levels of usage and satisfaction. The validity of these items is
assessed later in this chapter.
6.2.4 Brand loyalty
Questions 21 to 25 of the conceptual brand measuring instrument focused on brand
loyalty. These brand loyalty questions are next discussed in more detail.
Table 6.12: Summary of the meaning of brand loyalty to respondents: resort group 1
Frequency Percentage
Loyal to brand 809 41%
Delivers what was promised 724 40.3%
First choice 204 10.3%
The best 84 3.8%
Trust it 78 3%
Value for money 30 1.6%
Question 21 was an open-ended question that asked respondents to write down the
meaning of brand loyalty. Table 6.12 indicates that 41% wrote down “loyal to a brand”;
40.3% wrote down that the brand “delivers what was promised” and 10.3% indicated
that brand loyalty means “first choice”.
Thus the respondents saw brand loyalty as being loyal to a brand from their side but
also that a brand needs to deliver what was promised.

A conceptual instrument to measure the success of branding in the tourism industry 181
Table 6.13: Summary of brand loyalty items tested: resort group 1
Brand loyalty Totally
agree
Agree Unknown Disagree Totally
disagree
“I am loyal to the brand” 55.1% 39.7% 3.6% 1.3% 0.2%
“I rely on the brand” 53.8% 38.9% 5.1% 2% 0.3%
“I trust the brand” 58.7% 37.3% 2.7% 1.1% 0.2%
“The brand is important to me when considering a breakaway/holiday”
64.3% 30% 2.6% 2.6% 0.5%
“The brand will influence my decision to purchase”
47.7% 38% 8.1% 4.9% 1.3%
“The public image of the brand will influence my purchase decision”
46.9% 38.3% 8% 5.6% 1.1%
“If the brand would change in the future, I will still make use of it”
40.9% 38.5% 15.2% 4.1% 1.2%
“If the brand would change in the future, I will not make use of it anymore”
17.9% 14.3% 23.8% 22.8% 21.1%
“I will switch brands if alternative brands offer a similar service”
14.8% 40.6% 10.8% 25% 8.7%
“I will switch brands if alternative brands offer better quality”
28.6% 47.6% 5.6% 12.6% 5.6%
“I will switch brands if alternative brands are more effective”
27.6% 47.8% 6.5% 12.5% 5.7%
“I will switch brands if alternative brands are sold in a more convenient location/way”
19.7% 35% 12.5% 24.6% 8.2%
“I will switch brands if alternative brands had a more popular image”
16.3% 36.7% 16.6% 22.3% 8.1%
“I will switch brands if alternative brands are sold at a better price”
32.6% 40.1% 8.4% 13.1% 5.8%
“I will switch brands if alternative brands will better satisfy my needs”
32.4% 44.4% 6.3% 11.2% 5.6%
Questions 22 and 24 asked respondents to rate on a five-point likert scale to what
extent they agree with statements on the brand loyalty of the resort group 1 brand.
Table 6.13 indicates that respondents totally agreed with the following statements (only
percentages above 60%):
64.3% totally agreed that the brand was important when considering a break
away or holiday;
Thus the respondents see the brand as very important during decision making, trust the
brand and are loyal to it.
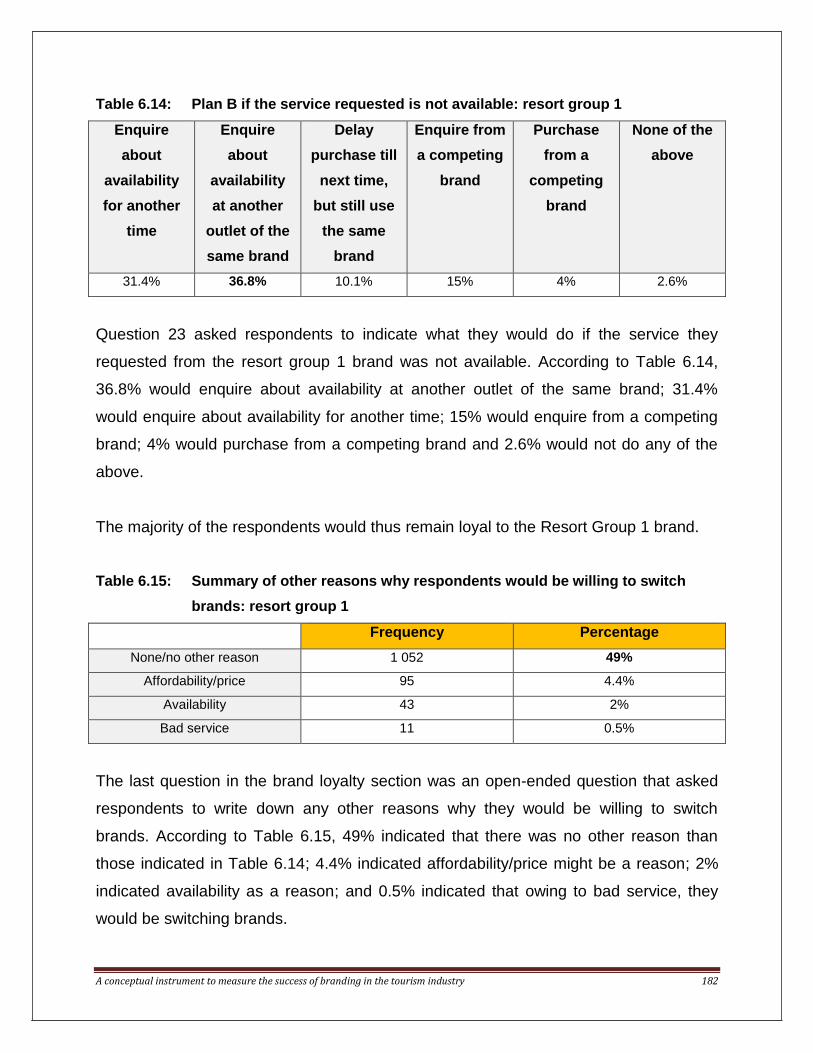
A conceptual instrument to measure the success of branding in the tourism industry 182
Table 6.14: Plan B if the service requested is not available: resort group 1
Enquire
about
availability
for another
time
Enquire
about
availability
at another
outlet of the
same brand
Delay
purchase till
next time,
but still use
the same
brand
Enquire from
a competing
brand
Purchase
from a
competing
brand
None of the
above
31.4% 36.8% 10.1% 15% 4% 2.6%
Question 23 asked respondents to indicate what they would do if the service they
requested from the resort group 1 brand was not available. According to Table 6.14,
36.8% would enquire about availability at another outlet of the same brand; 31.4%
would enquire about availability for another time; 15% would enquire from a competing
brand; 4% would purchase from a competing brand and 2.6% would not do any of the
above.
The majority of the respondents would thus remain loyal to the Resort Group 1 brand.
Table 6.15: Summary of other reasons why respondents would be willing to switch
brands: resort group 1
Frequency Percentage
None/no other reason 1 052 49%
Affordability/price 95 4.4%
Availability 43 2%
Bad service 11 0.5%
The last question in the brand loyalty section was an open-ended question that asked
respondents to write down any other reasons why they would be willing to switch
brands. According to Table 6.15, 49% indicated that there was no other reason than
those indicated in Table 6.14; 4.4% indicated affordability/price might be a reason; 2%
indicated availability as a reason; and 0.5% indicated that owing to bad service, they
would be switching brands.

A conceptual instrument to measure the success of branding in the tourism industry 183
The majority of the respondents indicated no other reason and thus confirmed their
brand loyalty as indicated in Table 6.14.
Overall this part of the questionnaire measures brand loyalty which is the third step in
creating a strong brand. In this section a variety of questions was used to assess the
levels of loyalty. The validity of these items is tested later in this chapter.
6.2.5 Brand experience
Question 26 of the conceptual brand measuring instrument focused on the brand
experience. These brand experience questions are discussed next in greater detail.
Table 6.16: Summary of brand experience items tested: resort group 1
Brand experience Totally
agree
Agree Unknown Disagree Totally
disagree
“It makes a strong visual impression” 43.4% 46.9% 5.9% 3.5% 0.2%
“I find it interesting in a sensory way” 34.2% 48.1% 12.8% 4.5% 0.4%
“It does not appeal to my senses” 10.5% 18.5% 23% 38% 10%
“It induces feelings and sentiments” 41% 45.6% 8.9% 3.8% 0.7%
“I do not have strong emotions for it” 10.1% 17.8% 21.4% 38.3% 12.3%
“I have an emotional connection with it” 30.8% 42.4% 16.8% 8.4% 1.6%
“I engage in physical actions and
behaviours when I use it”
24.2 37.6% 25.7% 10.5% 2%
“It results in bodily experiences” 22.9% 33% 27.7% 13.8% 2.6%
“It is not action oriented” 8.6% 16.3% 32.6% 33% 9.6%
“I engage in a lot of thinking when I
encounter it”
26.9% 42.9% 20.1% 8.4% 1.7%
“It stimulates my curiosity and problem
solving”
21.7% 36.7% 27.2% 12.1% 2.2%
Question 26 asked respondents to rate, on a five-point likert scale, to what extent they
agree with statements regarding the resort group 1 brand. According to Table 6.16
respondents totally agreed with the following statements (only percentages above 45%):

A conceptual instrument to measure the success of branding in the tourism industry 184
48.1% agreed that they found the brand interesting in a sensory way
46.9% agreed that the brand made a strong visual impression
45.6% agreed that the brand induces feelings and sentiments
The majority of respondents thus found the brand interesting and agreed that the brand
is visual.
Overall this part of the questionnaire measures brand experience which is the fourth
step in creating a strong brand. In this section a variety of questions was used to assess
the levels of experience. The validity of these items is tested later in this chapter.
B RESORT GROUP 2
The questionnaire (as completed in phase C) was distributed electronically through the
marketing department of resort group 2 during May 2014. Resort group 2 had a
database of 20 000 at the time of this study. An e-mail invitation was sent by the resort’s
group marketing department to prospective respondents stating the purpose and
importance of the research. A link to the brand questionnaire in Survey Monkey was
included in this invitation. A total of 599 fully completed questionnaires were collected
and analysed. The results are discussed in the next five sections.
The questionnaire utilised for resort group 2 was the same as for resort group 1. In this
section attention is therefore only given to the descriptive results and not the layout of
the questionnaire.
6.2.6 Demographic information
Table 6.17 summarises the demographic information of the respondents to the resort
group 2 survey.

A conceptual instrument to measure the success of branding in the tourism industry 185
Table 6.17: Summary of demographic info: resort group 2 H
om
e l
an
gu
ag
e English Afrikaans Northern
Sotho
Tswana Zulu Southern
Sotho
Venda Other
41.6% 38.6% 5%
4.2% 3.2% 2.5% 1.8% 3.2%
Swazi, Xhosa,
Ndebele, Tsonga,
French, German
Pro
vin
ce
Gauteng Limpopo Mpuma-
langa
KwaZulu-
Natal
Western
Cape
Northern
Cape
North-
West
Free State Outside
SA
68.4% 4.5% 11.5% 3.8% 4.2% 0.2% 1.7% 1.2% 2.2%
Ge
nd
er
Female Male
64.3% 35.7%
Ag
e
18 - 20 21 - 29 30 -39 40 - 49 50 - 59 60+
0.5% 15% 36.2% 27.7% 14.5% 6%
Hig
he
st
qu
alifi
cati
on
No
matric
Matric Diploma/d
egree
Post-
graduate
2.8% 30.6% 52.6% 14%
Ma
rita
l sta
tus
Single Married Widow/ed Divorced Living
together
13.2% 71% 0.3% 5.2% 10.4%
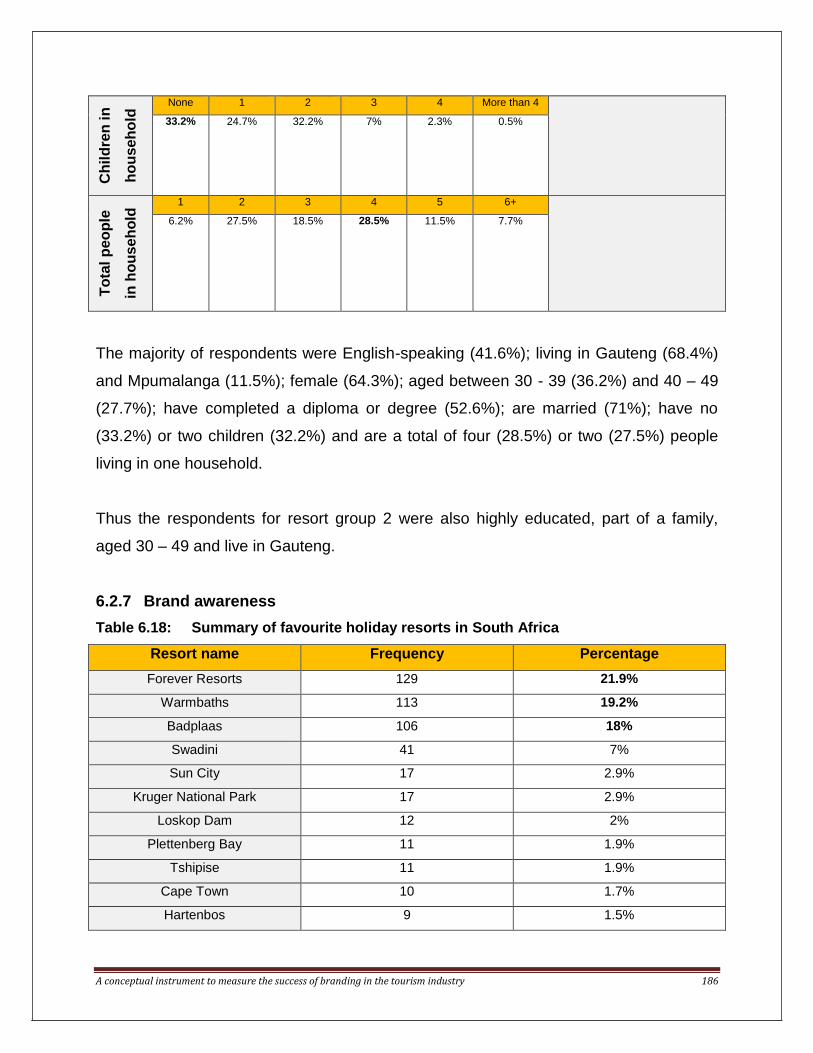
A conceptual instrument to measure the success of branding in the tourism industry 186
The majority of respondents were English-speaking (41.6%); living in Gauteng (68.4%)
and Mpumalanga (11.5%); female (64.3%); aged between 30 - 39 (36.2%) and 40 – 49
(27.7%); have completed a diploma or degree (52.6%); are married (71%); have no
(33.2%) or two children (32.2%) and are a total of four (28.5%) or two (27.5%) people
living in one household.
Thus the respondents for resort group 2 were also highly educated, part of a family,
aged 30 – 49 and live in Gauteng.
6.2.7 Brand awareness
Table 6.18: Summary of favourite holiday resorts in South Africa
Resort name Frequency Percentage
Forever Resorts 129 21.9%
Warmbaths 113 19.2%
Badplaas 106 18%
Swadini 41 7%
Sun City 17 2.9%
Kruger National Park 17 2.9%
Loskop Dam 12 2%
Plettenberg Bay 11 1.9%
Tshipise 11 1.9%
Cape Town 10 1.7%
Hartenbos 9 1.5%
Ch
ild
ren
in
ho
useh
old
None 1 2 3 4 More than 4
33.2% 24.7% 32.2% 7% 2.3% 0.5%
To
tal p
eo
ple
in h
ou
seh
old
1 2 3 4 5 6+
6.2% 27.5% 18.5% 28.5% 11.5% 7.7%
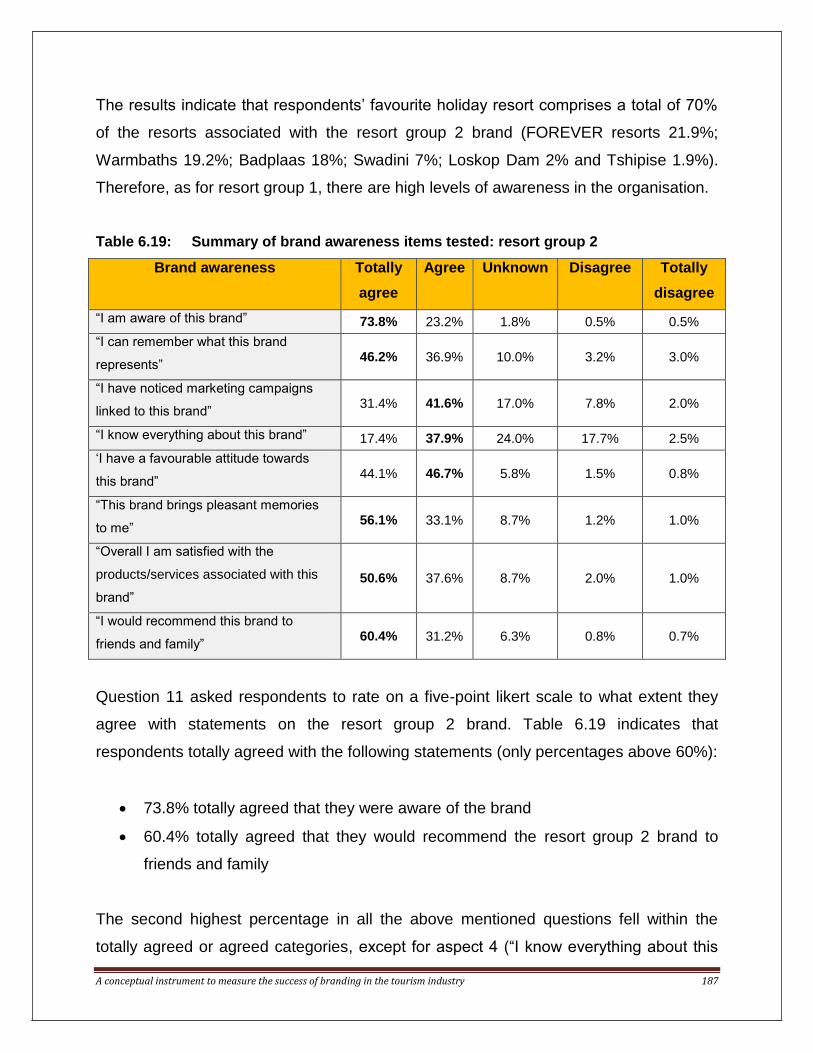
A conceptual instrument to measure the success of branding in the tourism industry 187
The results indicate that respondents’ favourite holiday resort comprises a total of 70%
of the resorts associated with the resort group 2 brand (FOREVER resorts 21.9%;
Warmbaths 19.2%; Badplaas 18%; Swadini 7%; Loskop Dam 2% and Tshipise 1.9%).
Therefore, as for resort group 1, there are high levels of awareness in the organisation.
Table 6.19: Summary of brand awareness items tested: resort group 2
Brand awareness Totally
agree
Agree Unknown Disagree Totally
disagree
“I am aware of this brand” 73.8% 23.2% 1.8% 0.5% 0.5%
“I can remember what this brand
represents” 46.2% 36.9% 10.0% 3.2% 3.0%
“I have noticed marketing campaigns
linked to this brand” 31.4% 41.6% 17.0% 7.8% 2.0%
“I know everything about this brand” 17.4% 37.9% 24.0% 17.7% 2.5%
‘I have a favourable attitude towards
this brand” 44.1% 46.7% 5.8% 1.5% 0.8%
“This brand brings pleasant memories
to me” 56.1% 33.1% 8.7% 1.2% 1.0%
“Overall I am satisfied with the
products/services associated with this
brand”
50.6% 37.6% 8.7% 2.0% 1.0%
“I would recommend this brand to
friends and family” 60.4% 31.2% 6.3% 0.8% 0.7%
Question 11 asked respondents to rate on a five-point likert scale to what extent they
agree with statements on the resort group 2 brand. Table 6.19 indicates that
respondents totally agreed with the following statements (only percentages above 60%):
73.8% totally agreed that they were aware of the brand
60.4% totally agreed that they would recommend the resort group 2 brand to
friends and family
The second highest percentage in all the above mentioned questions fell within the
totally agreed or agreed categories, except for aspect 4 (“I know everything about this

A conceptual instrument to measure the success of branding in the tourism industry 188
brand”). All the unknown, disagree and totally disagree categories were less than 17%
for all the above aspects tested.
Thus the respondents are very aware of the brand and would recommend the brand to
friends and family.
Table 6.20: The first word that comes to mind when seeing the resort group 2 brand
Frequency Percentage
Holiday 116 19.8%
Resort 78 13.3%
Fun 70 11.9%
Relax 64 10.9%
Family 32 5.5%
Pools 20 3.4%
Nice 12 2.0%
Memories 10 1.7%
Camping 9 1.5%
Clean 9 1.5%
Question 12 was an open-ended question where respondents were asked to write down
the first word that came to mind when seeing the resort group 2 brand. Table 6.20
indicates that 19.8% of respondent indicated the word “holiday” followed by 13.3% who
indicated “resort”. The words “fun” at 11.9% and “relax” at 10.9% were also indicated.
The first impression is thus linked to the main purpose of this resort: to provide
opportunities for holidays, to have fun and also relax.
Table 6.21: Summary of recognisable brand characteristics: resort group 2
Frequency Percentage
Eagle/Logo 212 35.4%
Colour 44 7.2%
Resorts 42 7.0%
Forever 34 5.7%
Family 31 5.2%
Pools 21 3.5%
Holiday 18 3.0%

A conceptual instrument to measure the success of branding in the tourism industry 189
Fun 18 3.0%
Friendly 17 2.8%
Service 15 2.5%
Clean 13 2.2%
Question 13 was also an open-ended question and requested respondents to write
down the characteristics of the resort group 2 brand that make it recognisable to them.
Table 6.21 indicates that the eagle/logo (35.4%) and the colours used (7.2%) were the
most recognisable characteristics. It is clear that the resort group 2 brand has become
very well known to the respondents.
Table 6.22: Summary of appealing brand aspects: resort group 2
Frequency Percentage
Resorts 83 13.9%
Family 46 7.7%
Holiday 27 4.5%
Colours 24 4.0%
Activities 21 3.5%
Accommodation 20 3.3%
Service 19 3.2%
Eagle 18 3.0%
Affordable 17 2.9%
Water 17 2.9%
Quality 14 2.3%
Clean 13 2.2%
Question 14 was an open-ended question that asked respondents to list the aspects of
the resort group 2 brand that appealed to them. According to Table 6.22 resorts
(13.9%), family (7.7%), holiday (4.5%) and the colours used (4%) formed the majority of
aspects. Colour was also the second recognisable aspect according to Table 6.21. It is
clear that respondents associate specific terms with this brand. This becomes important
in future marketing strategies.

A conceptual instrument to measure the success of branding in the tourism industry 190
Table 6.23: Summary of recognisable brand aspects: resort group 2
Frequency Percentage
Eagle/Logo 136 22.7%
Resorts 69 11.5%
Colour 35 5.9%
Forever 42 7.0%
Service 25 4.2%
Family 21 3.5%
Holiday 17 2.9%
Quality 17 2.9%
Variety 12 2.0%
Known brand 11 1.9%
Question 15 was an open-ended question that asked respondents what made the resort
group 2 brand more recognisable than other competing brands they were familiar with.
According to Table 6.23, the Eagle/Logo (22.7%) and the word, resorts, (11.5%) formed
the majority. These two aspects also form the majority in Table 6.21.
Table 6.24: Brand exposure in last month: resort group 2
Not once Once Twice Three times More than
three times
22.4% 24.5% 22.2% 8.8% 22%
The last question analysing brand awareness asked respondents how many times they
had seen the resort group 2 brand within the last month. According to Table 6.24,
24.5% saw it only once, 22.4% of respondents did not see it at all during the past
month, 22.2% saw it twice, 22% saw it more than three times and 8.8% saw it three
times. More can be done in terms of the visibility of the brand.
Overall this part of the questionnaire measures brand awareness which is the first step
in creating a strong brand. In this section a variety of questions was used to assess the
levels of awareness. The validity of these items is tested later in this chapter.
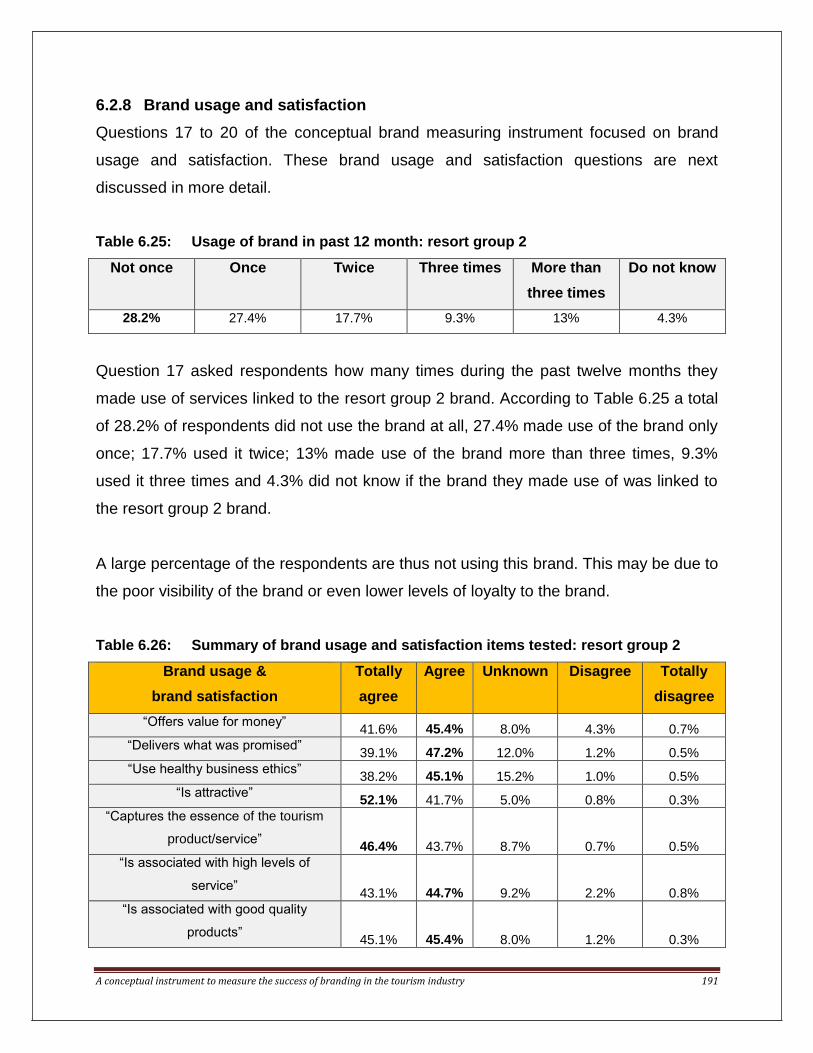
A conceptual instrument to measure the success of branding in the tourism industry 191
6.2.8 Brand usage and satisfaction
Questions 17 to 20 of the conceptual brand measuring instrument focused on brand
usage and satisfaction. These brand usage and satisfaction questions are next
discussed in more detail.
Table 6.25: Usage of brand in past 12 month: resort group 2
Not once Once Twice Three times More than
three times
Do not know
28.2% 27.4% 17.7% 9.3% 13% 4.3%
Question 17 asked respondents how many times during the past twelve months they
made use of services linked to the resort group 2 brand. According to Table 6.25 a total
of 28.2% of respondents did not use the brand at all, 27.4% made use of the brand only
once; 17.7% used it twice; 13% made use of the brand more than three times, 9.3%
used it three times and 4.3% did not know if the brand they made use of was linked to
the resort group 2 brand.
A large percentage of the respondents are thus not using this brand. This may be due to
the poor visibility of the brand or even lower levels of loyalty to the brand.
Table 6.26: Summary of brand usage and satisfaction items tested: resort group 2
Brand usage &
brand satisfaction
Totally
agree
Agree Unknown Disagree Totally
disagree
“Offers value for money” 41.6% 45.4% 8.0% 4.3% 0.7%
“Delivers what was promised” 39.1% 47.2% 12.0% 1.2% 0.5%
“Use healthy business ethics” 38.2% 45.1% 15.2% 1.0% 0.5%
“Is attractive” 52.1% 41.7% 5.0% 0.8% 0.3%
“Captures the essence of the tourism
product/service” 46.4% 43.7% 8.7% 0.7% 0.5%
“Is associated with high levels of
service” 43.1% 44.7% 9.2% 2.2% 0.8%
“Is associated with good quality
products” 45.1% 45.4% 8.0% 1.2% 0.3%

A conceptual instrument to measure the success of branding in the tourism industry 192
“Is associated with integrity” 42.7% 44.4% 11.7% 0.5% 0.7%
“Is easy to distinguish from competing
brands” 47.2% 40.9% 9.7% 1.7% 0.5%
“Is associated with a proud history of
the tourism product/service” 43.1% 42.6% 13.4% 0.7% 0.3%
“Is much talked about” 35.1% 38.1% 20.4% 5.5% 1.0%
“I will make use of this brand in the next
12 months” 52.4% 30.6% 15.4% 0.8% 0.8%
“Is innovative” 30.7% 50.1% 15.4% 3.5% 0.3%
“Is highly visible” 35.1% 44.6% 12.0% 7.7% 0.7%
“Is easily recognisable” 47.6% 45.1% 5.0% 2.0% 0.3%
“Is credible” 41.4% 47.6% 10.2% 0.3% 0.5%
“Is well established as a tourism brand” 48.9% 41.2% 8.5% 1.0% 0.3%
“Is relevant to the tourism
product/service it represents” 47.7% 43.6% 7.7% 0.7% 0.3%
“Is creative” 38.2% 40.9% 16.7% 3.7% 0.5%
“Is proudly South African” 51.8% 35.4% 11.2% 0.7% 1.0%
“Portrays value for money” 40.6% 46.9% 8.2% 3.7% 0.7%
“Portrays a good image” 46.4% 46.1% 6.3% 1.0% 0.2%
“Portrays reliability” 44.9% 46.9% 7.5% 0.5% 0.2%
Questions 18 and 19 asked respondents to rate on a five-point likert scale to what
extent they agree with statements on the resort group 2 brand. Table 6.26 indicates that
respondents totally agreed with the following statements (only percentages above 50%):
52.4% totally agreed that they would make use of the resort group 2 brand in the
next twelve months
52.1% totally agreed that the brand was attractive
51.8% totally agreed that the brand was proudly South African
50.1% agreed that the resort group 2 brand was innovative
The second highest percentage in all the above mentioned questions fell either within
the totally agreed or agreed categories. All the unknown, disagree and totally disagree
categories were less than 20.4% for all the above aspects tested.
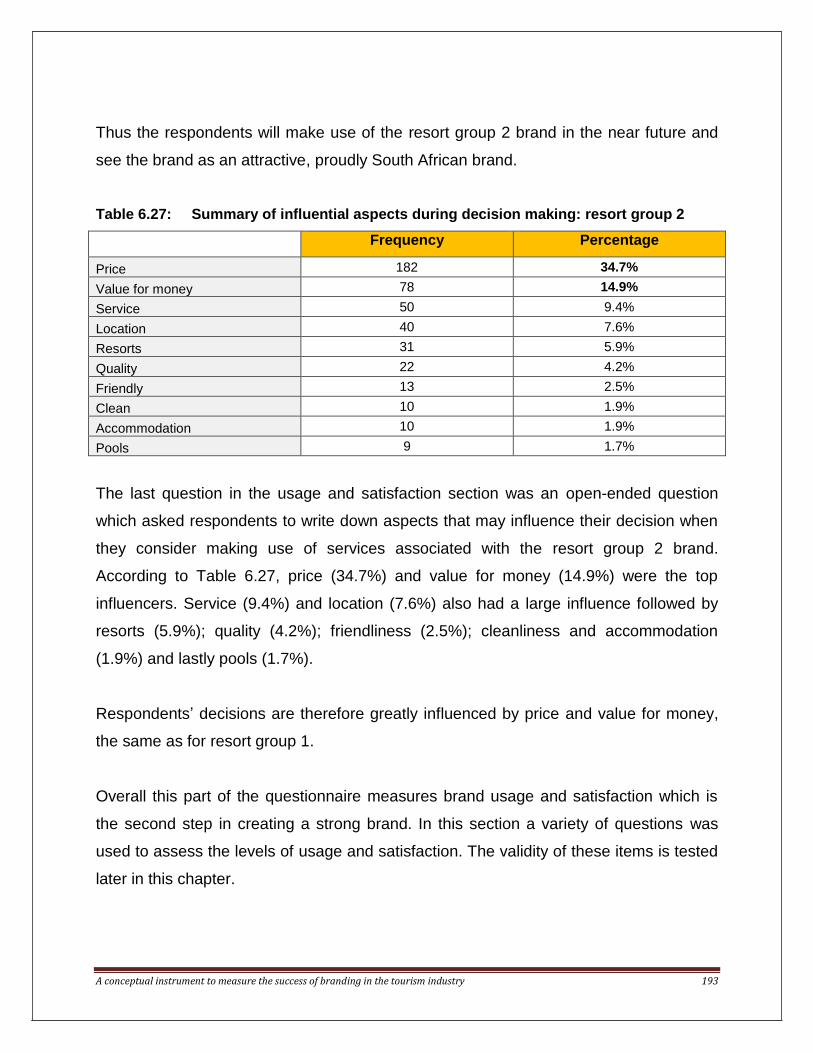
A conceptual instrument to measure the success of branding in the tourism industry 193
Thus the respondents will make use of the resort group 2 brand in the near future and
see the brand as an attractive, proudly South African brand.
Table 6.27: Summary of influential aspects during decision making: resort group 2
Frequency Percentage
Price 182 34.7%
Value for money 78 14.9%
Service 50 9.4%
Location 40 7.6%
Resorts 31 5.9%
Quality 22 4.2%
Friendly 13 2.5%
Clean 10 1.9%
Accommodation 10 1.9%
Pools 9 1.7%
The last question in the usage and satisfaction section was an open-ended question
which asked respondents to write down aspects that may influence their decision when
they consider making use of services associated with the resort group 2 brand.
According to Table 6.27, price (34.7%) and value for money (14.9%) were the top
influencers. Service (9.4%) and location (7.6%) also had a large influence followed by
resorts (5.9%); quality (4.2%); friendliness (2.5%); cleanliness and accommodation
(1.9%) and lastly pools (1.7%).
Respondents’ decisions are therefore greatly influenced by price and value for money,
the same as for resort group 1.
Overall this part of the questionnaire measures brand usage and satisfaction which is
the second step in creating a strong brand. In this section a variety of questions was
used to assess the levels of usage and satisfaction. The validity of these items is tested
later in this chapter.

A conceptual instrument to measure the success of branding in the tourism industry 194
6.2.9 Brand loyalty
Questions 21 to 25 of the conceptual brand measuring instrument focused on brand
loyalty. These brand loyalty questions are discussed next in greater detail.
Table 6.28 Summary of the meaning of brand loyalty to respondents: resort group 2
Frequency Percentage
Stick to it 127 27.6%
Service delivered 47 10.2%
Delivers what was promised 38 8.3%
Forever 29 6.3%
Product 29 6.3%
Reliable 28 6.1%
Value 26 5.6%
Support 22 4.8%
Making 18 3.9%
Customer 18 3.9%
Question 21 was an open-ended question that asked respondents to write down the
meaning of brand loyalty. Table 6.28 indicates that 27.6% indicated “stick to it”; 10.2%
associated brand loyalty with “service” and 8.3% indicated that brand loyalty means to
“deliver what was promised”.
Thus the respondents see brand loyalty as being loyal to a brand from their side (also
the top category with resort group 1), but also that brand loyalty is linked to service
delivery.

A conceptual instrument to measure the success of branding in the tourism industry 195
Table 6.29: Summary of brand loyalty items tested: resort group 2
Brand loyalty Totally
agree
Agree Unknown Disagree Totally
disagree
“I am loyal to the brand” 31.9% 45.7% 15.4% 6.2% 0.8%
“I rely on the brand” 29.2% 44.2% 16.7% 9.0% 0.8%
“I trust the brand” 37.4% 52.8% 8.0% 1.2% 0.7%
“The brand is important to me when considering a breakaway/holiday” 45.4% 42.4% 7.3% 4.3% 0.5%
“The brand will influence my decision to purchase” 37.7% 43.6% 11.7% 5.8% 1.2%
“The public image of the brand will influence my purchase decision” 31.2% 42.6% 14.9% 9.0% 2.3%
“If the brand would change in the future, I will still make use of it” 31.9% 40.1% 24.7% 2.7% 0.7%
“If the brand would change in the future, I will not make use of it anymore” 11.9% 14.2% 34.2% 22.2% 17.5%
“I will switch brands if alternative brands offer a similar service” 15.9% 42.2% 20.7% 15.7% 5.5%
“I will switch brands if alternative brands offer better quality” 31.6% 47.2% 10.0% 8.0% 3.2%
“I will switch brands if alternative brands are more effective” 26.9% 48.2% 12.2% 9.3% 3.3%
“I will switch brands if alternative brands are sold in a more convenient
location/way” 25.5% 35.4% 16.5% 17.9% 4.7%
“I will switch brands if alternative brands had a more popular image” 14.2% 30.2% 23.4% 25.2% 7.0%
“I will switch brands if alternative brands are sold at a better price” 35.1% 37.2% 12.9% 10.4% 4.5%
“I will switch brands if alternative brands will better satisfy my needs” 34.7% 43.2% 10.0% 8.5% 3.5%
Questions 22 and 24 asked respondents to rate on a five-point likert scale to what
extent they agree with statements on the resort group 2 brand. Table 6.29 indicates that
respondents totally agreed with the following statements (only percentages above 45%):
52.8% agreed that they trust the brand
48.2% agreed that they would switch brands if alternative brands were more
effective
47.2% agreed that they would switch brands if alternative brands offered better
quality
45.7% agreed that they were loyal to the brand

A conceptual instrument to measure the success of branding in the tourism industry 196
45.4% totally agreed that the brand was important when considering a break
away or holiday
Thus the respondents trust the brand, but are willing to switch brands if alternative
brands are more effective or offered better quality. This worrying fact corresponds with
Table 6.27 where respondents indicated that their decisions are greatly influenced by
price and value for money.
Table 6.30: Plan B if the service requested is not available: resort group 2
Enquire
about
availability
for another
time
Enquire
about
availability
at another
outlet of the
same brand
Delay
purchase till
next time,
but still use
the same
brand
Enquire from
a competing
brand
Purchase
from a
competing
brand
None of the
above
39.7% 26% 6.7% 19% 5.5% 3%
Question 23 asked respondents what they would do if the service they requested from
the resort group 2 brand was not available. According to Table 6.30, 39.7% would
enquire about availability for another time; 26% would enquire about availability at
another outlet of the same brand; 19% would enquire from a competing brand; 6.7%
would delay purchase till next time, but still make use of the same brand; 5.5% would
purchase from a competing brand and 3% would not do any of the above.
The majority of the respondents would thus stay loyal to the resort group 2 brand.
Table 6.31: Summary of the other reasons why respondents would be willing to
switch brands: resort group 2
Frequency Percentage
Price 87 18.1%
Service 38 7.8%
None 22 4.4%

A conceptual instrument to measure the success of branding in the tourism industry 197
The last question in the brand loyalty section was an open-ended question that asked
respondents to indicate any other reasons why they would be willing to switch brands.
According to Table 6.31, 18.1% indicated that price would influence their choice and
7.8% indicated service. This corresponds with results shown under aspect 9 and 14 in
Table 6.29. Finally, 4.4% indicated that there were no other reasons for them to switch
brands.
Respondents’ loyalty is thus greatly influenced by price and service.
Overall this part of the questionnaire measures brand loyalty which is the third step in
creating a strong brand. In this section a variety of questions was used to assess the
levels of loyalty. The validity of these items is tested later in this chapter.
6.2.10 Brand experience
Question 26 of the conceptual brand measuring instrument focused on the brand
experience. These brand experience questions are next discussed in more detail.
Table 6.32: Summary of brand experience items tested: resort group 2
Brand experience Totally
agree
Agree Unknown Disagree Totally
disagree
“It makes a strong visual impression” 39.9% 49.1% 6.5% 4.0% 0.5%
“I find it interesting in a sensory way” 30.7% 45.1% 16.9% 7.0% 0.3%
“It does not appeal to my senses” 8.2% 15.4% 21.9% 39.1% 15.5%
“It induces feelings and sentiments” 29.5% 45.4% 17.9% 5.7% 1.5%
“I do not have strong emotions for it” 8.2% 20.0% 23.9% 32.9% 15.0%
“I have an emotional connection with it” 26.2% 38.9% 22.4% 11.2% 1.3%
“I engage in physical actions and behaviours when I use it” 22.2% 37.2% 28.0% 9.8% 2.7%
“It results in bodily experiences” 23.4% 34.6% 31.2% 8.7% 2.2%
“It is not action oriented” 8.0% 15.5% 36.2% 29.4% 10.9%
“I engage in a lot of thinking when I encounter it” 17.9% 35.1% 28.9% 15.5% 2.7%
“It stimulates my curiosity and problem solving” 18.4% 35.6% 32.7% 11.2% 2.2%

A conceptual instrument to measure the success of branding in the tourism industry 198
Question 26 asked respondents to rate on a five-point likert scale to what extent they
agree with statements regarding the resort group 2 brand. Table 6.32 indicates that
respondents totally agreed with the following statements (only percentages above 45%):
49.1% agreed that the brand made a strong visual impression
45.4% agreed that the brand induced feelings and sentiments
45.1% agreed that they found the brand interesting in a sensory way
The majority of the respondents thus found the brand visual and interesting, but there is
room for improvement.
Overall this part of the questionnaire measures brand experience which is the fourth
step in creating a strong brand. In this section a variety of questions was used to assess
the levels of experience. The validity of these items is tested later in this chapter.
The purpose of the descriptive results was to provide an overview of the layout and
structure of the questionnaire as well as to report the frequencies of the responses
related to resort groups 1 and 2. A successful brand is important in both cases but the
testing of the questionnaire at both resorts allowed for the verification of the questions
and scales used in the questionnaire. This will be explained in the exploratory results.
6.3 EXPLORATORY RESULTS
The purpose of the exploratory results was to develop and assess the conceptual
instrument to measure the success of branding in the tourism industry. The method of
research for this study was exploratory by nature and was conducted in different phases
as stated previously.
6.3.1 Results of phase A
A literature study using relevant academic articles was conducted during phase A.
Tourism, marketing and management books as well as existing brand measurement
instruments were also used. The goal of this phase was twofold. The first goal was to

A conceptual instrument to measure the success of branding in the tourism industry 199
identify and analyse current models and tools used to measure brand effectiveness by
means of an in-depth literature review. Eight different evaluation methods were
analysed (refer to chapter 4).
The second goal was to conduct a literature review to establish which brand statements
and questions should be included in the conceptual instrument to measure the success
of branding in the tourism industry. This was done by evaluating previous tourism brand
related studies. Table 6.33 summarises the brand categories, brand statements and/or
brand questions that were included in previous tourism-related studies. The question
format for these differed between the various studies and it was the purpose of Table
6.33 to identify the most important and frequently used brand related measurements.
Table 6.33: Brand categories and statements included in previous research
Brand awareness
Chan
don (
200
3:2
)
Boo,
Busser
& B
alo
glu
(20
09:2
19
-23
1)
Kon
ecnik
& G
art
ner
(200
6:4
11)
Kim
& K
im (
2004:5
54)
Tasci, G
art
ner
& C
avusg
il (2
007
:15
32)
Murp
hy,
Moscard
o &
Benckendorf
f (2
008
:8)
Fung S
o &
Kin
g (
20
09:5
98)
Jale
es (
2006:7
)
1. Name all the hotel related tourism brands you can think of
X X
2. Do you remember seeing this brand? X X
3. Complete the following word: N-KE X
4. This brand has a good name and reputation X
5. This brand is very famous X
6. The characteristics of this brand come to my mind quickly
X
7. When I am thinking of ..., this brand comes to my mind immediately
X
8. Name this tourism destination X
9. What characteristics make this tourism X

A conceptual instrument to measure the success of branding in the tourism industry 200
destination recognisable?
10. Write down the name of a luxury hotel in Seoul?
X
11. Identify the luxury hotel from the following list
X
12. Rate a destination by only providing the destination name
X
13. Describe the destination by using three words
X
14. I am aware of this hotel X
15. I am familiar with this hotel X
16. I know what this hotel looks like X
17. I recognise this hotel X
18. Rate the following brands in terms of your awareness
X
Studies that measured brand awareness at tourism destinations and hotels were
included. These studies were conducted between 2003 and 2009 and resulted in 18
important aspects.
Brand usage
Fung S
o &
Kin
g (
20
09:5
97)
Aaker
(19
96:1
09)
Sm
ith (
2012:1
)
1. Brand suits my needs X X
2. Brand is reliable X X
3. Brand is superior X
4. Good service linked to brand X
5. Quality service linked to brand X
6. I trust the brand X X
7. I like the brand X
8. The brand is credible X X X
9. The brand has high quality X
10. The brand has consistent quality X

A conceptual instrument to measure the success of branding in the tourism industry 201
These studies focused mainly on a brand and partly a service and measured brand
usage. Recent studies were conducted in 2009 and 2012. This category was not
previously assessed in tourism research.
Brand satisfaction
Tasci, G
art
ner
& C
avusg
il (2
007
:15
32)
Fung S
o &
Kin
g (
20
09:5
98)
Aaker
(19
96:1
09)
Sm
ith (
2012:1
)
Jale
es (
2006:7
)
1. Rate the destination by showing pictures of the destination
X X
2. This hotel is value for money X X
3. I consider this hotel a good buy X
4. I got more than my money’s worth X
5. Makes sense to use this hotel instead of another one
X X X X
6. Prefer to use this hotel even if it has same features as another
X X X X
7. Prefer to use this hotel even if another has better features
X
8. Seems smarter to use this hotel X
9. This hotel is the best X
10. This image brings pleasant memories to me X X
11. Are you overall satisfied? X X
12. Was the promise delivered? X X
13. Do you think this hotel use healthy business ethics?
X
14. This hotel offers easy payment options X
15. Is the logo attractive? X
16. Does this capture the essence of the product?
X
17. Do you think this enhances marketing efforts?
X X
18. Are the colours appealing? X X
19. This hotel has high levels of service X X
20. I associate this with good quality X X
21. Do you associated this hotel with integrity? X X
22. This logo is easy to distinguish from X

A conceptual instrument to measure the success of branding in the tourism industry 202
competing logos
23. Do you consider this an international hotel? X X
24. Do you associate this with a proud history? X X
25. This logo is much talked about X X
26. This logo is innovative X X
27. This logo is highly visible X X
28. This logo is easily recognisable X X
29. This logo is credible X X
30. Is this logo well established? X X
31. This is relevant to the product it represents X X
32. This logo is creative X X
33. This logo is simplistic X X
34. This logo portrays value for money X X
35. This logo portrays good image X X
36. This logo portrays reliability X X
37. I have a negative attitude towards this X X
These studies focused mainly on hotels, logos and measured brand satisfaction. These
studies were conducted between 2006 and 2012.
Brand loyalty
Boo,
Busser
& B
alo
glu
(20
09:2
19
-23
1)
Kon
ecnik
& G
art
ner
(200
6:4
11)
Kim
& K
im (
2004:5
54)
Aaker
(19
96:1
08)
Sm
ith (
2012:1
)
1. I enjoy visiting the destination X
2. The destination would be my preferred choice for a vacation
X X
3. Overall I am loyal to this destination X X
4. I would advise friends to visit this destination X X X X X
5. Number of previous visits X
6. Time of last visit X
7. Destination provides more benefits X
8. I will visit this destination in the future X X X X
9. I regularly visit this hotel X
10. I usually use this hotel X
11. I am satisfied with this visit X X
12. I will not switch to another hotel next time I visit
X X
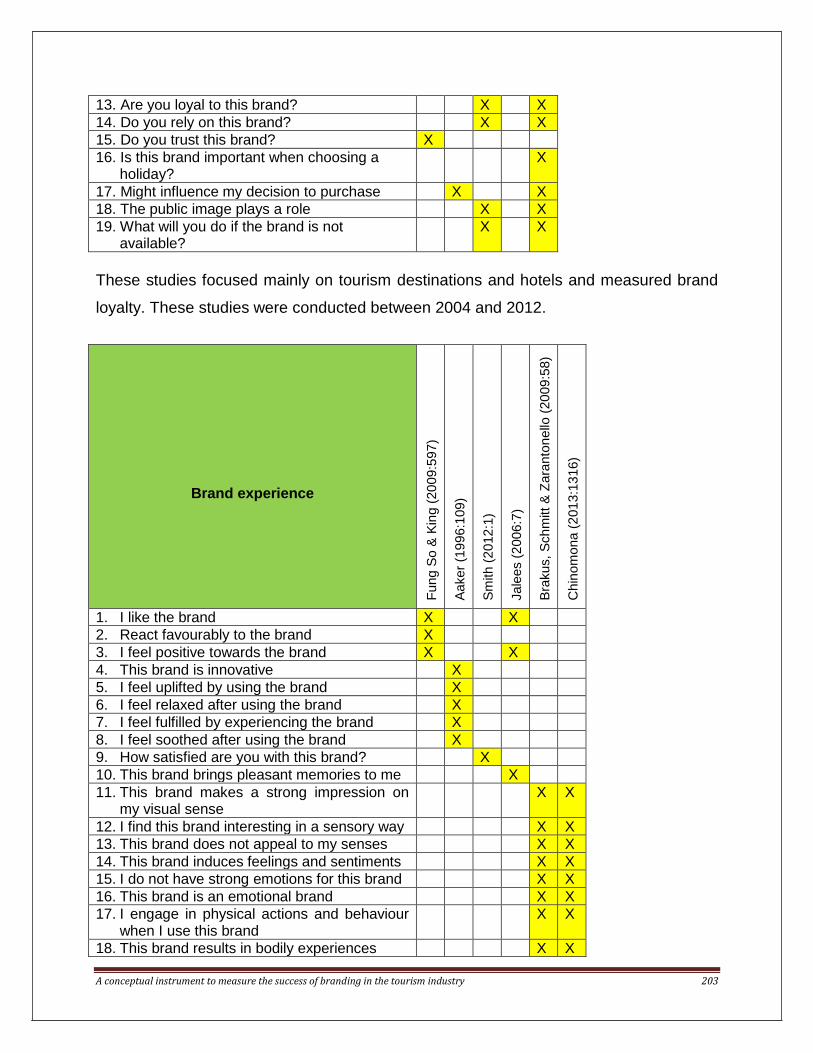
A conceptual instrument to measure the success of branding in the tourism industry 203
13. Are you loyal to this brand? X X
14. Do you rely on this brand? X X
15. Do you trust this brand? X
16. Is this brand important when choosing a holiday?
X
17. Might influence my decision to purchase X X
18. The public image plays a role X X
19. What will you do if the brand is not available?
X X
These studies focused mainly on tourism destinations and hotels and measured brand
loyalty. These studies were conducted between 2004 and 2012.
Brand experience
Fung S
o &
Kin
g (
20
09:5
97)
Aaker
(19
96:1
09)
Sm
ith (
2012:1
)
Jale
es (
2006:7
)
Bra
kus, S
ch
mitt
& Z
ara
nto
nello
(20
09:5
8)
Chin
om
ona (
201
3:1
316)
1. I like the brand X X
2. React favourably to the brand X
3. I feel positive towards the brand X X
4. This brand is innovative X
5. I feel uplifted by using the brand X
6. I feel relaxed after using the brand X
7. I feel fulfilled by experiencing the brand X
8. I feel soothed after using the brand X
9. How satisfied are you with this brand? X
10. This brand brings pleasant memories to me X
11. This brand makes a strong impression on my visual sense
X X
12. I find this brand interesting in a sensory way X X
13. This brand does not appeal to my senses X X
14. This brand induces feelings and sentiments X X
15. I do not have strong emotions for this brand X X
16. This brand is an emotional brand X X
17. I engage in physical actions and behaviour when I use this brand
X X
18. This brand results in bodily experiences X X

A conceptual instrument to measure the success of branding in the tourism industry 204
19. This brand is not action oriented X X
20. I engage in a lot of thinking when I encounter this brand
X X
21. This brand stimulates my curiosity and problem solving
X X
These studies focused mainly on a tourism brand such as hotels and measured brand
experience and were conducted between 2006 and 2013. There has been a significant
growth in the number of studies in general tourism research that measure experience.
Firstly, it was clear from Table 6.33 that brand awareness, brand usage, brand
satisfaction, brand loyalty and brand experience were the brand categories included
within the previous tourism related studies. Authors agreed to a high level that these five
categories may be seen as the core contributing factors to building a strong brand.
Secondly, it was also evident that various brand statements/ideas were tested under
each of the mentioned five categories. However, these brand statements tend to differ
from study to study in terms of wording, types of questions, types of analyses and the
combination of statements used. The absence of a universal, standardised
questionnaire for measuring brand success in the tourism industry was evident. Thirdly,
the researcher used the above 105 brand statements/questions as a guideline and
adapted them where necessary to relate to a tourism brand. Seventy brand statements
relating specifically to a tourism product/service were identified (refer to Tables 6.34 and
6.35). These 70 brand statements were included in the initial questionnaire that formed
the basis of phase B and are discussed in greater detail in the next section. It was thus
necessary at this stage to include as many of these brand statements as possible to
determine their relevance to a tourism case study.
6.3.2 Results of phase B
Phase B of this study was exploratory by nature owing to a lack of a standardised
measuring instrument. The goal of phase B was to assess the relevance of the adapted
70 brand statements identified in phase A to the tourism industry, based on the opinions
and assessment of academic and industry leaders. The Delphi technique was used to

A conceptual instrument to measure the success of branding in the tourism industry 205
gather and analyse data during the period June to August 2013. This consisted of three
rounds for which the results are reported below.
Results for Delphi round 1
The adapted 70 brand statements identified through Table 6.33 above focused on
tourism destinations and hotels and partially on services. The identified five categories
(brand awareness, brand usage, brand satisfaction, brand loyalty and brand
experience) plus these 70 brand statements then formed the initial questionnaire of the
Delphi phase. Each of the brand statements (refer to Table 6.34), regardless of their
previous question format being multiple choice or open-ended questions in each
category, were then assessed on a 5-point likert scale by academic and industry
leaders. Participants were expected to rate the relevance of the question content by
indicating their level of agreement or disagreement for the particular statement to be
included in the measuring instrument. The adapted brand statements relevant to the
tourism product, as used during this round, are indicated under each of the five
categories in Table 6.34. Brand awareness decreased from 18 to three; brand usage
decreased from ten to three; brand satisfaction decreased from 37 to 30; brand loyalty
increased from 19 to 23; (four more specific options were added to what a respondent
would do if the brand was not available – see statement 19 of Table 6.34 under brand
loyalty); and brand experience also decreased from 21 to 11.
Table 6.34: Brand categories and statements adapted from the literature review and
included in the initial questionnaire
Brand
categories Brand statements
Type of question in the
questionnaire
Brand
awareness
"I have noticed marketing campaigns linked to this brand"
Closed-ended question
"I am aware of this brand" Closed-ended question "I can remember what this brand represents" Closed-ended question
Brand usage
“How many times, during the past 12 months, did you make use of this brand?”
Multiple choice
“I will make use of this brand in the next 12 months”
Closed-ended question
“When you consider using services associated with this brand, what aspects
Open question

A conceptual instrument to measure the success of branding in the tourism industry 206
may influence your decision”
Brand
satisfaction
"This brand brings pleasant memories to me" Closed-ended question "Overall I am satisfied with the products/services linked to this brand"
Closed-ended question
"This brand offers value for money" Closed-ended question "This brand delivers what was promised" Closed-ended question "This brand uses healthy business ethics" Closed-ended question "This brand offers easy payment options" Closed-ended question "This brand is attractive" Closed-ended question "This brand captures the essence of the tourism product/service"
Closed-ended question
"This brand enhances marketing efforts" Closed-ended question "This brand’s colours are appealing" Closed-ended question "This brand is associated with high levels of service"
Closed-ended question
"This brand is associated with good quality products/services"
Closed-ended question
"This brand is associated with integrity" Closed-ended question "This brand is easy to distinguish from competing brands"
Closed-ended question
"This brand is considered an international brand"
Closed-ended question
"This brand is associated with a proud history"
Closed-ended question
"This brand is much talked about" Closed-ended question "This brand is innovative" Closed-ended question "This brand is highly visible" Closed-ended question "This brand is easily recognisable" Closed-ended question "This brand is credible" Closed-ended question "This brand is well established as a tourism brand"
Closed-ended question
"This brand is relevant to the tourism product/service it represents"
Closed-ended question
"This brand is creative" Closed-ended question "This brand is simplistic" Closed-ended question "This brand portrays value for money" Closed-ended question "This brand portrays good image" Closed-ended question "This brand portrays reliability" Closed-ended question "I have a negative attitude towards this brand"
Closed-ended question
"I have a favourable attitude towards this brand"
Closed-ended question
Brand loyalty
"I am loyal to this brand" Closed-ended question "I rely on this brand" Closed-ended question "I trust this brand" Closed-ended question "This brand is important to me when considering a breakaway/holiday"
Closed-ended question
"This brand will influence my decision to purchase"
Closed-ended question

A conceptual instrument to measure the success of branding in the tourism industry 207
"The public image of this brand will influence my decision"
Closed-ended question
"I would recommend this brand to friends and family"
Closed-ended question
"I will switch brands if alternative brands offer a similar service"
Closed-ended question
"I will switch brands if alternative brands offer better quality"
Closed-ended question
"I will switch brands if alternative brands are more effective"
Closed-ended question
"I will switch brands if alternative brands are sold in a more convenient location/way"
Closed-ended question
"I will switch brands if alternative brands had a more popular image"
Closed-ended question
"I will switch brands if alternative brands had a larger public following"
Closed-ended question
"I will switch brands if alternative brands are sold at a better price"
Closed-ended question
"I will switch brands if alternative brands will better satisfy my needs"
Closed-ended question
"If the service I requested from this brand is unavailable, I would enquire about availability for another time"
Closed-ended question
"If the service I requested from this brand is unavailable, I would enquire about availability at another outlet of the same brand"
Closed-ended question
"If the service I requested from this brand is unavailable, I would delay purchase till next time, but still use the same brand"
Closed-ended question
"If the service I requested from this brand is unavailable, I would enquire availability from a competing brand"
Closed-ended question
"If the service I requested from this brand is unavailable, I would purchase from a competing brand"
Closed-ended question
"If the brand would change in future, I would be happy with the change and still make use of the brand"
Closed-ended question
"If the brand would change in future, I would be unhappy with the change but still make use of the brand"
Closed-ended question
"If the brand would change in future, I will not make use of the brand anymore"
Closed-ended question
Brand
experience
“It makes a strong visual impression” Closed-ended question “I find it interesting in a sensory way” Closed-ended question “It does not appeal to my senses” Closed-ended question “It induces feelings and sentiments” Closed-ended question “I do not have strong emotions for it” Closed-ended question “I have an emotional connection with it” Closed-ended question

A conceptual instrument to measure the success of branding in the tourism industry 208
“I engage in physical actions and behaviours when using it”
Closed-ended question
“It results in bodily experiences” Closed-ended question “It is not action oriented” Closed-ended question “I engage in a lot of thinking when I encounter it”
Closed-ended question
“It stimulates my curiosity and problem solving”
Closed-ended question
The task of the experts was to assess the relevance of each of the above 70 brand
statements identified in phase A. The results of this initial questionnaire were then
analysed using Excel. This allowed the researcher to eliminate non-relevant/less
important statements by making use of the median values. Table 6.35 summarises the
median values of each of the brand statements identified during phase A as well as
those statements that were deleted or added during this phase (phase B).
According to Table 6.35, the following seven brand statements were deleted after round
1:
"This brand offers easy payment options" (brand category: satisfaction; type of question:
closed-ended);
"This brand enhances marketing efforts" (brand category: satisfaction; type of question:
closed-ended);
"This brand’s colours are appealing" (brand category: satisfaction; type of question:
closed-ended);
"This brand is considered an international brand" (brand category: satisfaction; type of
question: closed-ended);
"This brand is simplistic" (brand category: satisfaction; type of question: closed-ended);
"I have a negative attitude towards this brand" (brand category: satisfaction; type of
question: closed-ended);
"If the brand would change in future, I would be unhappy with the change but still make
use of the brand" (brand category: satisfaction; type of question: closed-ended).
Feedback/comments from the panel on the above deleted brand statements included
that payment options are not supposed to be part of a brand evaluation; that marketing

A conceptual instrument to measure the success of branding in the tourism industry 209
efforts are supposed to enhance a brand and not vice versa; that appealing colours are
very similar to the statement of the brand being highly visible; not all brands need to be
known as international brands in order to be successful; that a tourism brand may be
more complex than other brands owing to its nature; that a low rating on the statement
“I have a favourable attitude towards the brand” is the same as a high rating on “I have
a negative attitude towards this brand" and lastly that a low rating on the statement “If
the brand would change in future, I would be happy with the change and still make use
of the brand" is the same as a high rating on "If the brand would change in future, I
would be unhappy with the change but still make use of the brand".
The following five brand statements were added based on recommendations from the
panel after round 1:
“What is your favourite holiday resort in South Africa?” (brand category: awareness;
type of question: open-ended);
“I know everything about this brand” (brand category: awareness; type of question:
closed-ended);
“What is the first word that comes to mind when seeing this brand?” (brand category:
awareness; type of question: open-ended);
“What characteristics of this brand make it recognisable?” (brand category: awareness;
type of question: open-ended);
“What aspects of this brand appeals to you?” (brand category: awareness; type of
question: open-ended).
Feedback/comments from the panel regarding the above added brand statements
included that the four mentioned open-ended questions are very important in brand
evaluation and would allow respondents the freedom to express their views. The
closed-ended question “I know everything about the brand” would give a general
awareness rating to the brand evaluated.
These five brand statements were added to the initial questionnaire and rated by the
participants from this point onwards. The total number of brand statements therefore

A conceptual instrument to measure the success of branding in the tourism industry 210
decreased from the initial 70 to 68 after round 1. For the next round the format of the
initial questionnaire remained the same.
Results of Delphi round 2
According to Table 6.35, no brand statements were deleted in round 2 but the following
four brand elements were added:
“What makes this brand more recognisable than other competing brands?” (brand
category: awareness; type of question: open-ended);
“How often have you seen this brand in the past month?” (brand category: awareness;
type of question: closed-ended);
“What does the term brand loyalty mean to you?” (brand category: loyalty; type of
question: open-ended);
“Are there any other reasons why you would be willing to switch brands?” (brand
category: loyalty; type of question: open-ended).
Feedback/comments from the panel on the above added brand statements included
that the three mentioned open-ended questions are very important in brand awareness
and evaluation and would allow respondents the freedom to express their views. The
closed-ended question “How often have you seen this brand in the past month?” would
give a general awareness rating to the brand evaluated.
These four brand statements were added to the initial questionnaire and rated by the
participants from this point onwards. The total number of brand statements therefore
increased from 68 to 72 after round 2. For the next round the format of the initial
questionnaire remained the same.
Results of Delphi round 3
According to Table 6.35, no brand statements were deleted or added in this final round.
The total brand categories remaining after phase B was therefore still five and the total
brand statements 72 (brand awareness = 10; brand usage = 3; brand satisfaction = 25;
brand loyalty = 23; brand experience = 11). By comparing the initial identified categories

A conceptual instrument to measure the success of branding in the tourism industry 211
and brand statements (refer to Table 6.34), the five brand categories remained the
same, but brand awareness increased by seven, brand usage remained the same,
brand satisfaction decreased by five and brand loyalty and brand experience remained
the same.
Table 6.35: Summary of phase B of the Delphi process
Brand
category Brand statement
Question type
Median value
Added Deleted Round
1
Round
2
Round
3
Bra
nd
aw
are
ne
ss
"I have noticed marketing campaigns linked to this
brand"
Likert scale 1.8 1.63 1.61
"I am aware of this brand" Likert scale 1.87 1.81 1.7
"I can remember what this brand represents"
Likert scale 1.8 1.81 1.8
“What is your favourite holiday resort in South
Africa?”
Open-ended question N.A 1.88 1.8
Round 1
“I know everything about this brand”
Likert scale N.A 1.73 1.7
Round 1
“What is the first word that comes to mind when seeing
this brand?”
Open-ended question N.A 1.88 1.8
Round 1
“What characteristics of this brand make it recognisable?”
Open-ended question
N.A 2 1.88 Round
1
“What aspects of this brand appeal to you?”
Open-ended question
N.A 2 1.88 Round
1
“What makes this brand more recognisable than other
competing brands?”
Open-ended question N.A N.A 2
Round 2
“How often have you seen this brand in the past
month?”
Likert scale N.A N.A 2
Round 2
Bra
nd
us
ag
e
“How many times, during the past 12 months, did you make use of this brand?”
Likert scale 1.8 1.7 1.7
“I will make use of this brand in the next 12 months”
Likert scale 1.9 1.8 1.8
“When you consider using services associated with this
brand, what aspects may influence your decision?”
Open-ended question
1.5 1.5 1.4
Bra
nd
sati
sfa
cti
on
"This brand brings pleasant memories to me"
Likert scale 1.87 1.75 1.7
"Overall I am satisfied with the products/services linked
to this brand"
Likert scale 1.87 1.81 1.8
"This brand offers value for money"
Likert scale 1.53 1.44 1.4

A conceptual instrument to measure the success of branding in the tourism industry 212
"This brand delivers what was promised"
Likert scale 1.73 1.63 1.6
"This brand uses healthy business ethics"
Likert scale 2.07 1.88 1.9
"This brand offers easy payment options"
Likert scale 2.73 N.A N.A Round 1
"This brand is attractive" Likert scale 2.4 1.94 1.9
"This brand captures the essence of the tourism
product/service"
Likert scale 2.2 1.63 1.88
"This brand enhances marketing efforts"
Likert scale 2.87 N.A N.A Round 1
"This brand’s colours are appealing"
Likert scale 2.67 N.A N.A Round 1
"This brand is associated with high levels of service"
Likert scale 1.47 1.63 1.5
"This brand is associated with good quality
products/services"
Likert scale 1.47 1.56 1.5
"This brand is associated with integrity"
Likert scale 1.8 1.63 1.6
"This brand is easy to distinguish from competing
brands"
Likert scale 1.67 1.56 1.5
"This brand is considered an international brand"
Likert scale 2.8 N.A N.A Round 1
"This brand is associated with a proud history"
Likert scale 2.07 2 2
"This brand is much talked about"
Likert scale 2.13 2 2
"This brand is innovative" Likert scale 1.87 1.69 1.6
"This brand is highly visible" Likert scale 1.8 1.7 1.7
"This brand is easily recognisable"
Likert scale 1.6 1.7 1.7
"This brand is credible" Likert scale 1.8 1.63 1.6
"This brand is well established as a tourism
brand"
Likert scale 1.73 1.56 1.5
"This brand is relevant to the tourism product/service it
represents"
Likert scale 2.13 1.88 1.88
"This brand is creative" Likert scale 1.93 1.88 1.88
"This brand is proudly South African"
Likert scale 2 2 2
"This brand is simplistic" Likert scale 3 N.A N.A Round 1
"This brand portrays value for money"
Likert scale 1.4 1.38 1.4
"This brand portrays a good image"
Likert scale 1.6 1.81 1.7
"This brand portrays reliability"
Likert scale 1.67 1.63 1.6
"I have a negative attitude towards this brand"
Likert scale 2.07 N.A N.A Round 1
"I have a favourable attitude towards this brand"
Likert scale 1.8 1.75 1.7

A conceptual instrument to measure the success of branding in the tourism industry 213
Bra
nd
lo
yalt
y
"I am loyal to this brand" Likert scale 1.73 2 1.88
"I rely on this brand" Likert scale 1.87 1.88 1.8
"I trust this brand" Likert scale 1.6 1.5 1.6
"This brand is important to me when considering a
break-away/holiday"
Likert scale 1.93 1.88 1.8
"This brand will influence my decision to purchase"
Likert scale 1.8 1.8 1.9
"The public image of this brand will influence my
decision"
Likert scale 2.27 2.05 2
"I would recommend this brand to friends and family"
Likert scale 1.73 1.69 1.7
"I will switch brands if alternative brands offer a
similar service"
Likert scale 1.93 1.56 1.6
"I will switch brands if alternative brands offer better
quality"
Likert scale 1.8 1.38 1.7
"I will switch brands if alternative brands are more
effective"
Likert scale 1.6 1.94 1.7
"I will switch brands if alternative brands are sold in
a more convenient location/way"
Likert scale
1.6 1.81 1.7
"I will switch brands if alternative brands had a
more popular image"
Likert scale 2 2.1 2
"I will switch brands if alternative brands are sold at
a better price"
Likert scale 1.87 1.56 1.5
"I will switch brands if alternative brands will better
satisfy my needs"
Likert scale 1.53 1.56 1.5
"If the service I requested from this brand is
unavailable, I would enquire about availability for another
time"
Likert scale
1.93 1.88 1.8
"If the service I requested from this brand is
unavailable, I would enquire about availability at another outlet of the same brand"
Likert scale
1.8 1.94 1.8
"If the service I requested from this brand is
unavailable, I would delay purchase till next time, but still use the same brand"
Likert scale
1.8 2 1.88
"If the service I requested from this brand is
unavailable, I would enquire availability from a competing
brand"
Likert scale
1.73 1.88 1.7

A conceptual instrument to measure the success of branding in the tourism industry 214
"If the service I requested from this brand is
unavailable, I would purchase from a competing
brand"
Likert scale
1.8 2 1.8
"If the brand would change in future, I would be happy with
the change and still make use of the brand"
Likert scale
1.8 2 1.8
"If the brand would change in future, I would be unhappy
with the change but still make use of the brand"
Likert scale
2.73 N.A N.A Round 1
"If the brand would change in future, I will not make use of
the brand anymore"
Likert scale 1.4 1.8 1.6
“What does the term brand loyalty mean to you”
Open-ended question
N.A N.A 1.7 Round
2
“Are there any other reasons why you would be willing to
switch brands?”
Open-ended question N.A N.A 1.88
Round 2
Bra
nd
exp
eri
en
ce
“It makes a strong visual impression”
Likert scale 2 2 2
“I find it interesting in a sensory way”
Likert scale 2.07 2 2
“It does not appeal to my senses”
Likert scale 1.9 1.88 1.8
“It induces feelings and sentiments”
Likert scale 1.9 1.88 1.8
“I do not have strong emotions for it”
Likert scale 1.8 1.8 1.88
“I have an emotional connection with it”
Likert scale 2.1 2 2
“I engage in physical actions and behaviours when using
it”
Likert scale 2.2 2 2
“It results in bodily experiences”
Likert scale 2 2 2
“It is not action oriented” Likert scale 2 1.88 1.88
“I engage in a lot of thinking when I encounter it”
Likert scale 2.2 1.88 1.88
“It stimulates my curiosity and problem solving”
Likert scale 2 2 2
Table 6.35 summarises the three rounds of the Delphi process followed. The identified
five brand categories and 72 brand statements (that include eight open-ended
questions) were then included in the conceptual questionnaire that formed the basis of
phase C of this study.

A conceptual instrument to measure the success of branding in the tourism industry 215
6.3.3 Results of Phase C
Phase C of this study was exploratory by nature, since this research focused on
developing a brand measuring instrument (questionnaire) directed at the tourism
industry. The purpose of phase C was to gather data for specific tourism case studies
and, based on that, determine the reliability and validity of the questionnaire. This also
meant that items can shift between the categories identified in the literature review and
Delphi process.
The conceptual questionnaire consisted of open-ended and closed-ended questions.
The closed-ended questions used a 5 point likert scale where 1 was “totally agree” and
5 was “totally disagree”.
Table 6.36: Layout of the final questionnaire
Brand category Final number of brand
statements included
Number of questions per type of
question
Brand awareness 10 statements Likert-scale questions: 5
Open-ended questions: 5
Brand usage 3 statements Likert-scale questions: 2
Open-ended questions: 1
Brand satisfaction 25 statements Likert-scale questions: 25
Open-ended questions: 0
Brand loyalty 23 statements Likert-scale questions: 21
Open-ended questions: 2
Brand experience 11 statements Likert-scale questions: 11
Open-ended questions: 0
Reliability can only be assessed with likert scale type questions; thus 64 questions were
assessed by means of a likert scale and eight by means of open-ended questions.
Resort group 1 had a membership of 70 000 at the time of this study. An e-mail
invitation was sent to all members and a total of 2 152 fully completed questionnaires

A conceptual instrument to measure the success of branding in the tourism industry 216
were collected and analysed for this phase. A response rate of 3% was therefore
achieved.
A factor analysis was performed to synthesise the large amount of data. This was done
on all of the brand statements identified in phase B. According to Leedy and Ormrod
(2010:282), a factor analysis enables the researcher to examine the correlations among
a number of variables to identify clusters of highly interrelated variables that reflect
underlying themes. To assess the validity of a questionnaire, there must be
randomisation of the sample group and appropriate care and consistency must be
evident in the allocation of controls. To assess reliability of the same questionnaire, the
questionnaire must be able to be repeated under the same conditions and be able to
generate the same results. These two aspects are incorporated into the next section.
6.3.3.1 Brand category 1: brand awareness (resort group 1)
Brand awareness may be considered as the first main category to evaluate the success
of a brand as determined in the literature review. The brand awareness statements
included in the conceptual questionnaire totalled ten with five being open-ended
questions. This means that five brand statements could be statistically validated. To
examine the factors underlying the brand awareness category, a principal component
axis factor analysis with oblique rotation (direct oblimin) was undertaken. The five brand
awareness statements yielded only one factor with Eigen value greater than 1.0 (Field,
2005:633). It was clear that the five brand statements included in this factor measured
the same category namely “awareness”. This factor explained 60.6% of the variance,
was thus labelled: “brand awareness” and had a factor loading of more than 0.490.
Bartlett’s test of sphericity was significant (p<0.001) and the Kaiser-Meyer-Olkin
measure of sampling adequacy (KMO) was 0.835, which are both highly acceptable.
Reliability (Cronbach alpha) was computed to verify the internal consistency of brand
statements with one another and is considered an important element in the
development of a questionnaire. A Cronbach alpha of 0.859 was deemed highly

A conceptual instrument to measure the success of branding in the tourism industry 217
acceptable for the purpose of this study. The inter-item correlation was 0.616 which
again showed the inter-relatedness of these brand statements.
Table 6.37: Brand awareness – resort group 1
Question
Brand awareness statements included
Factor
identified
Bra
nd
aw
are
ne
ss
Q11.4 I know everything about the brand 0.887
Q11.3 I have noticed marketing campaigns linked to this brand 0.878
Q11.2 I can remember what this brand represents 0.812
Q11.1 I am aware of this brand 0.758
Q16 How often have you seen this brand in the past month? 0.490
Cronbach alpha reliability coefficient 0.859
Inter-item correlation 0.616
Mean value (standard deviation) 1.95 (±0.44)
From the above Table 6.36, statement 5 (Q16) had a factor loading of 0.490. Although
still relevant in the measurement of brand awareness, this statement has to be
reconsidered when again measuring brand awareness with this questionnaire.
6.3.3.2 Brand category 2: brand usage (resort group 1)
Brand usage may be considered as the second main category to evaluate the success
of a brand as determined in the literature review. The brand usage category included in
the conceptual questionnaire totalled three with one being an open-ended question. A
factor analysis could not be done on only the two remaining brand statements as this is
statistically too few. “Brand usage” included how many times during the past month a
respondent made use of services linked to the brand and whether the respondent would
make use of the indicated brand in the next twelve months.

A conceptual instrument to measure the success of branding in the tourism industry 218
6.3.3.3 Brand category 3: brand satisfaction (resort group 1)
Brand satisfaction was identified through the literature as the third main category to
measure the success of a brand. The brand satisfaction statements included in the
conceptual questionnaire totalled 25 with none being open-ended questions. This
means that all 25 brand statements could be statistically validated.
To examine the factors underlying the brand satisfaction category, a principle
component axis factor analysis with oblique rotation (direct oblimin) was undertaken.
The 25 brand satisfaction statements yielded three factors with Eigen values greater
than 1.0 (Field, 2005:633). These factors explained 63% of the variance and were
labelled: “brand functionality, brand characteristics and brand image”. All statements
had factor loadings greater than 0.447. Bartlett’s test of sphericity was significant
(p<0.001) and the Kaiser-Meyer-Olkin measure of sampling adequacy (KMO) was
0.973, which are both highly acceptable.
Reliability (Cronbach alpha) was computed to verify the internal consistency of brand
statements with each factor. All three factors had a Cronbach alpha above 0.930 and
were deemed highly acceptable for the purpose of this study and the development of
the questionnaire. The inter-item correlations of all three factors were higher than 0.642
which again showed the inter-relatedness of these statements.
Table 6.38: Brand satisfaction – resort group 1
Question
Brand satisfaction statements included
Factor identified
Bra
nd
fun
cti
on
ality
Bra
nd
ch
ara
cte
ris
tic
s
Bra
nd
im
ag
e
Q18.2 Delivers what was promised 0.923
Q18.1 Offers value for money 0.866
Q18.6 Is associated with high levels of service 0.849
Q18.3 Uses healthy business ethics 0.841
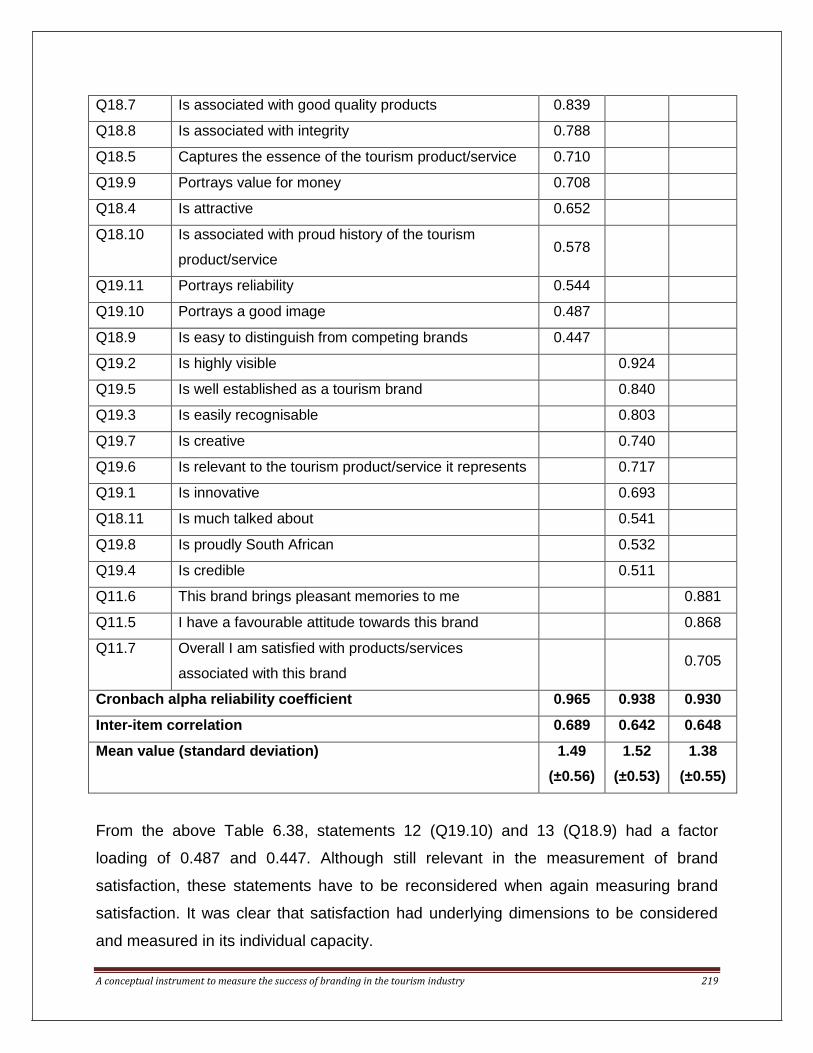
A conceptual instrument to measure the success of branding in the tourism industry 219
Q18.7 Is associated with good quality products 0.839
Q18.8 Is associated with integrity 0.788
Q18.5 Captures the essence of the tourism product/service 0.710
Q19.9 Portrays value for money 0.708
Q18.4 Is attractive 0.652
Q18.10 Is associated with proud history of the tourism
product/service 0.578
Q19.11 Portrays reliability 0.544
Q19.10 Portrays a good image 0.487
Q18.9 Is easy to distinguish from competing brands 0.447
Q19.2 Is highly visible 0.924
Q19.5 Is well established as a tourism brand 0.840
Q19.3 Is easily recognisable 0.803
Q19.7 Is creative 0.740
Q19.6 Is relevant to the tourism product/service it represents 0.717
Q19.1 Is innovative 0.693
Q18.11 Is much talked about 0.541
Q19.8 Is proudly South African 0.532
Q19.4 Is credible 0.511
Q11.6 This brand brings pleasant memories to me 0.881
Q11.5 I have a favourable attitude towards this brand 0.868
Q11.7 Overall I am satisfied with products/services
associated with this brand 0.705
Cronbach alpha reliability coefficient 0.965 0.938 0.930
Inter-item correlation 0.689 0.642 0.648
Mean value (standard deviation) 1.49
(±0.56)
1.52
(±0.53)
1.38
(±0.55)
From the above Table 6.38, statements 12 (Q19.10) and 13 (Q18.9) had a factor
loading of 0.487 and 0.447. Although still relevant in the measurement of brand
satisfaction, these statements have to be reconsidered when again measuring brand
satisfaction. It was clear that satisfaction had underlying dimensions to be considered
and measured in its individual capacity.

A conceptual instrument to measure the success of branding in the tourism industry 220
6.3.3.4 Brand category 4: brand loyalty (resort group 1)
Brand loyalty was identified through the literature as the fourth main category to
measure the success of a brand. The brand loyalty statements included in the
conceptual questionnaire totalled 19 with two being open-ended questions. This means
that 17 brand statements could be statistically evaluated.
To examine the factors underlying the loyalty category, a principle component axis
factor analysis with oblique rotation (direct oblimin) was undertaken. The 17 brand
loyalty statements yielded two factors with Eigen values greater than 1.0 (Field,
2005:633). These factors explained 66.3% of the variance and were labelled: “brand
competitiveness and brand trust”. Both had factor loadings of more than 0.379 and
reliability (Cronbach alpha) was computed to verify the internal consistency of brand
statements with each factor. Both factors had a Cronbach alpha above 0.834 and were
deemed acceptable for the purpose of this study. Bartlett’s test of sphericity was
significant (p<0.001) and the Kaiser-Meyer-Olkin measure of sampling adequacy (KMO)
was 0.896, which are both highly acceptable.
Reliability (Cronbach alpha) was computed to verify the internal consistency of
statements with each factor. Both factors had a Cronbach alpha above 0.834 and were
deemed highly acceptable for the purpose of this study and development of the
questionnaire. The inter-item correlations of both factors were higher than 0.565 which
again shows the inter-relatedness of these statements.

A conceptual instrument to measure the success of branding in the tourism industry 221
Table 6.39: Brand loyalty – resort group 1
Question
Brand loyalty statements included
Factor identified
Bra
nd
co
mp
eti
tiv
en
es
s
Bra
nd
tru
st
Q24.2 Will switch brands if alternative brands offer better quality 0.922
Q24.3 Will switch brands if alternative brands are more effective 0.920
Q24.7 Will switch brands if alternative brands will better satisfy my needs
0.902
Q24.6 Will switch brands if alternative brands are sold at a better price
0.868
Q24.5 Will switch brands if alternative brands had a more popular image
0.833
Q24.4 Will switch brands if alternative brands are sold in a more convenient location/way
0.788
Q24.1 Will switch brands if alternative brands offer a similar service 0.770
Q22.3 I trust it 0.882
Q22.1 I am loyal to it 0.860
Q22.2 I rely on it 0.851
Q22.8 If it would change in future I would not make use if it anymore 0.817
Q22.4 It is important when considering a breakaway/holiday 0.793
Q11.8 I would recommend this brand to friends and family 0.732
Q22.7 If it would change in future I would still make use of it 0.615
Q22.5 It will influence my decision to purchase 0.577
Q22.6 The public image of it will influence my purchase decision 0.561
Q23 What would you do if the service you requested from this
brand is not available? 0.379
Cronbach alpha reliability coefficient 0.939 0.834
Inter-item correlation 0.639 0.565
Mean value (standard deviation) 2.40
(±1.02)
1.81
(±0.54)
From the above Table 6.39, statement 17 (Q23) had a factor loading of 0.379. Although
still relevant in the measurement of brand loyalty, this statement has to be reconsidered

A conceptual instrument to measure the success of branding in the tourism industry 222
when again measuring brand loyalty. Brand loyalty clearly can be measured by taking
into account competitiveness and trust.
6.3.3.5 Brand category 5: brand experience (resort group 1)
Brand experience was identified through the literature as the fifth main category to
measure the success of a brand. The brand experience statements included in the
interim questionnaire totalled eleven with none being open-ended questions. This
means that all eleven statements could be statistically evaluated.
To examine the factors underlying the experience category, a principle component axis
factor analysis with oblique rotation (direct oblimin) was undertaken. The eleven brand
experience statements yielded two factors with Eigen values greater than 1.0 (Field,
2005:633). These factors explained 64.7% of the variance and were labelled: “personal
positive brand behaviour and personal negative brand behaviour”. Both had factor
loadings greater than 0.742. Reliability (Cronbach alpha) was computed to verify the
internal consistency of brand statements with each factor. Both factors had a Cronbach
alpha above 0.817 and were deemed acceptable for the purpose of this study. Bartlett’s
test of sphericity was significant (p<0.001) and the Kaiser-Meyer-Olkin measure of
sampling adequacy (KMO) was 0.864, which are both highly acceptable.
Reliability (Cronbach alpha) was computed to verify the internal consistency of
statements with each factor. Both factors had a Cronbach alpha above 0.817 and were
deemed highly acceptable for the purpose of this study and development of the
questionnaire. The inter-item correlations of both factors were higher than 0.542 which
again showed the inter-relatedness of these statements.

A conceptual instrument to measure the success of branding in the tourism industry 223
Table 6.40: Brand experience – resort group 1
Question Brand experience statements included
Factor identified
Pe
rso
nal
po
sit
ive
bra
nd
be
ha
vio
ur
Pe
rso
nal
neg
ati
ve
bra
nd
be
ha
vio
ur
Q26.7 I engage in physical actions and behaviours when I use it 0.847
Q26.8 It results in bodily experiences 0.793
Q26.11 It stimulates my curiosity and problem solving 0.792
Q26.6 I have an emotional connection with it 0.788
Q26.10 I engage in a lot of thinking when I encounter it 0.776
Q26.2 I find it interesting in a sensory way 0.771
Q26.1 It makes a strong visual impression 0.754
Q26.4 It induces feelings and sentiments 0.742
Q26.5 I do not have strong emotions for it 0.872
Q26.3 It does not appeal to my senses 0.847
Q26.9 It is not action oriented 0.831
Cronbach alpha reliability coefficient 0.892 0.817
Inter-item correlation 0.542 0.599
Mean value (standard deviation) 2.08
(±0.73)
3.21
(±0.98)
The purpose of phase C was to determine the reliability of the five brand categories
identified through the literature. This was done by calculating the Cronbach alphas and
inter-item correlations. Table 6.41 summarises these results according to brand
category.

A conceptual instrument to measure the success of branding in the tourism industry 224
Table 6.41: Summary of Cronbach alphas and inter-item correlations – resort group 1
Brand category Cronbach alphas Inter-item Correlation Mean value and
Standard deviation
Brand Awareness 0.859 0.616 1.95 (±0.44)
Brand Functionality 0.965 0.689 1.49 (±0.56)
Brand Characteristics 0.938 0.642 1.52 (±0.53)
Brand Image 0.930 0.648 1.38 (±0.38)
Brand Competitiveness 0.939 0.639 2.40 (±1.02)
Brand Trust 0.834 0.565 1.81 (±0.54)
Personal Positive
Brand Experience
0.892 0.542 2.08 (±0.73)
Personal Negative
Brand Experience
0.817 0.599 3.21 (±0.98)
The results from the above Table 6.41 indicate a high reliability and inter-item
correlation of the initial five brand categories identified through the literature review.
These results also indicate that the initial identified satisfaction category was divided
into brand functionality, brand characteristics and brand image. The initial identified
loyalty category was divided into brand competitiveness and brand trust and the initial
identified experience category resulted in personal positive and personal negative brand
experience. An additional three brand categories were therefore identified during this
phase.
Owing to the high reliability results obtained through phase C, none of the 73 brand
statements used was changed for the next phase (phase D). The only change was an
extra demographic question that the management of resort group 2 requested.
Similar to the process followed during the resort group 1 survey, the conceptual
instrument (see annexure A) was once again distributed through the marketing
department of a second well-known resort group in South Africa (for the purpose of this
study known as ‘resort group 2’) to potential respondents on their database. This took
place during May 2014. This final questionnaire consisted of open-ended and closed-
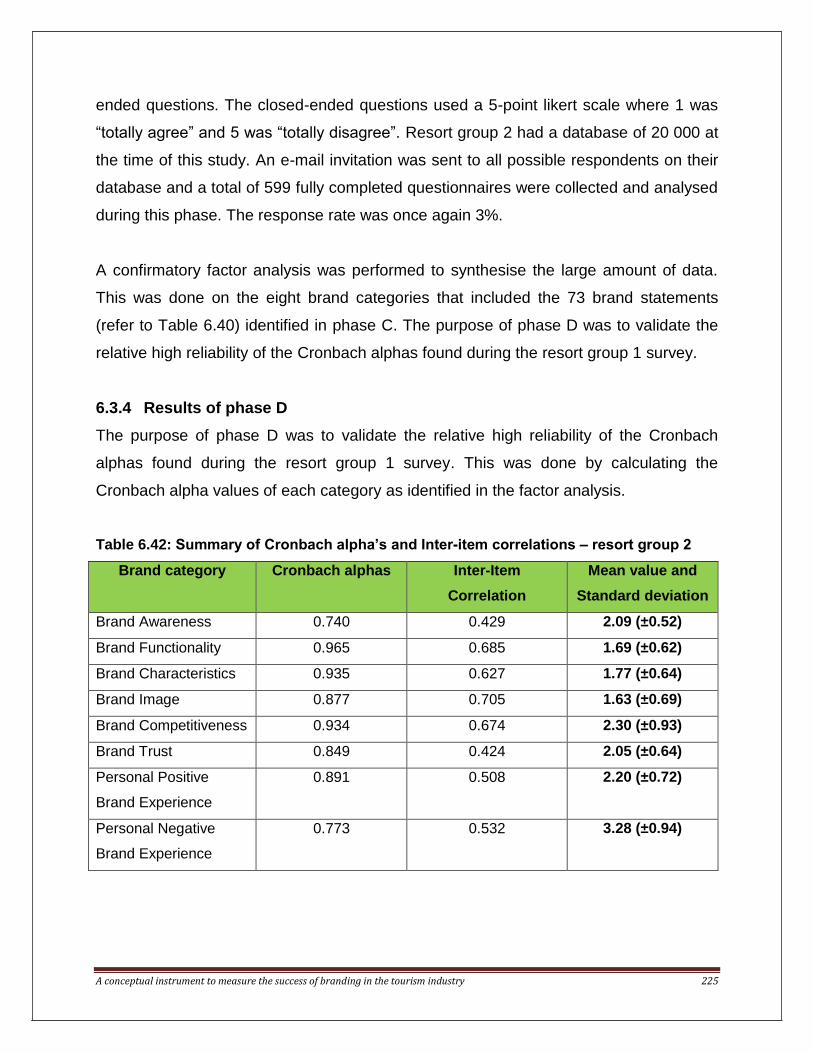
A conceptual instrument to measure the success of branding in the tourism industry 225
ended questions. The closed-ended questions used a 5-point likert scale where 1 was
“totally agree” and 5 was “totally disagree”. Resort group 2 had a database of 20 000 at
the time of this study. An e-mail invitation was sent to all possible respondents on their
database and a total of 599 fully completed questionnaires were collected and analysed
during this phase. The response rate was once again 3%.
A confirmatory factor analysis was performed to synthesise the large amount of data.
This was done on the eight brand categories that included the 73 brand statements
(refer to Table 6.40) identified in phase C. The purpose of phase D was to validate the
relative high reliability of the Cronbach alphas found during the resort group 1 survey.
6.3.4 Results of phase D
The purpose of phase D was to validate the relative high reliability of the Cronbach
alphas found during the resort group 1 survey. This was done by calculating the
Cronbach alpha values of each category as identified in the factor analysis.
Table 6.42: Summary of Cronbach alpha’s and Inter-item correlations – resort group 2
Brand category Cronbach alphas Inter-Item
Correlation
Mean value and
Standard deviation
Brand Awareness 0.740 0.429 2.09 (±0.52)
Brand Functionality 0.965 0.685 1.69 (±0.62)
Brand Characteristics 0.935 0.627 1.77 (±0.64)
Brand Image 0.877 0.705 1.63 (±0.69)
Brand Competitiveness 0.934 0.674 2.30 (±0.93)
Brand Trust 0.849 0.424 2.05 (±0.64)
Personal Positive
Brand Experience
0.891 0.508 2.20 (±0.72)
Personal Negative
Brand Experience
0.773 0.532 3.28 (±0.94)

A conceptual instrument to measure the success of branding in the tourism industry 226
6.3.4.1 Brand category 1: brand awareness (resort group 2)
Reliability (Cronbach’s Alpha) was computed to verify the internal consistency of brand
statements with each other and is considered an important element in the development
of a questionnaire. The confirmatory analyses revealed a Cronbach Alpha of 0.740
which was deemed highly acceptable for the purpose of verifying the reliability of the
questionnaire. The inter-item correlation was 0.429 which again shows the inter-
relatedness of these statements.
6.3.4.2 Brand category 3: brand satisfaction (resort group 2)
Reliability (Cronbach’s) was computed to verify the internal consistency of brand
statements with each factor. The confirmatory analyses revealed a Cronbach Alpha
above 0.877 and were deemed highly acceptable for the purpose of verifying the
reliability of the questionnaire. The inter-item correlations of both factors were higher
than 0.627 which again shows the inter-relatedness of these statements.
6.3.4.3 Brand category 4: brand loyalty (resort group 2)
The confirmatory analyses revealed that all factors had a Cronbach Alpha above 0.849
and were deemed acceptable for the purpose of verifying the reliability of the
questionnaire. The inter-item correlations of both factors were higher than 0.425 which
again shows the inter-relatedness of these statements.
6.3.4.4 Brand category 5: brand experience (resort group 2)
Reliability (Cronbach’s) was computed to verify the internal consistency of brand
statements with each factor. The confirmatory analyses revealed that all factors had a
Cronbach Alpha above 0.773 and were deemed highly acceptable for the purpose of
verifying the reliability of the questionnaire. The inter-item correlations of both factors
were higher than 0.508 which again shows the inter-relatedness of these statements.
The purpose of phase D was to validate the reliability of the initial identified five brand
categories through the literature plus the three extra categories identified through phase
C. This was done by calculating the Cronbach alphas and Inter-item correlations.

A conceptual instrument to measure the success of branding in the tourism industry 227
The results from the above Table 6.42 indicate a high reliability and inter-item
correlation of the initial five brand categories identified through the literature review.
These results also indicate that the initial identified satisfaction category was divided
into brand functionality and brand characteristics. The initial identified loyalty category
was divided into brand competitiveness and brand trust and the initial identified
experience category resulted in personal positive- and personal negative brand
experience. The categories identified in the exploratory phase were confirmed in phase
D. Table 6.43 shows a comparison between the identified brand categories, Cronbach
alpha’s and Inter-item correlations of resort group 1 and 2.
Table 6.43: Comparison of Cronbach alpha’s and Inter-item correlations – resort group
1 & 2
Brand category
Resort Group 1
(Phase C)
Resort Group 2
(Phase D)
Cronbach
Alpha’s
Inter-Item
Correlation
Cronbach
Alpha’s
Inter-Item
Correlation
Brand Awareness .859 .616 .740 .429
Brand Functionality .965 .689 .965 .685
Brand Characteristics .938 .642 .935 .627
Brand Image .930 .648 .877 .705
Brand Competitiveness .939 .639 .934 .674
Brand Trust .834 .565 .849 .424
Personal Positive Brand
Experience
.892 .542 .891 .508
Personal Negative Brand
Experience
.817. .599 .773 .532
The results from the above Table 6.43 firstly indicate that a total of eight brand
categories were identified during the resort group 1 survey (phase C) compared to the
seven of the resort group 2 survey (phase D). Secondly, the results indicate a high
reliability and inter-item correlation of the eight brand categories identified during the

A conceptual instrument to measure the success of branding in the tourism industry 228
resort group 1 survey (phase C). These high reliability and inter-item correlation were
validated by the results of the resort group 2 survey (phase D).
6.3.5 Correlation between the brand factors
Spearman rank order correlations were used to describe the strength and direction of
the linear relationship between two variables, in this case between the confirmed brand
factors included in the brand measuring instrument. A correlation 0 indicates no
relationship at all, a correlation of 1.0 indicates a perfect positive correlation and a value
of -1.0 indicates a perfect negative correlation. The correlations were interpreted
according to the guidelines of Cohen (1988) that suggested; small rho = .10-.29,
medium rho = .30-.49 and large rho = .50-1.0.
Table 6.44: Spearman Rank order correlations between the brand factors
BRAND FACTORS
Bra
nd
Aw
are
ness
Bra
nd
Fu
ncti
on
ality
Bra
nd
Ch
ara
cte
risti
cs
Bra
nd
Im
ag
e
Bra
nd
Co
mp
eti
tiven
ess
Bra
nd
Tru
st
Pers
on
al
Po
sit
ive
Bra
nd
Beh
avio
ur
Pers
on
al N
eg
ati
ve
Bra
nd
Beh
avio
ur
Bra
nd
Aw
are
ne
ss
Correlation Coefficient
1.000 .381** .397** .560** .009 .350** .255** -.063**
Sig. (2-tailed) .000 .000 .000 .651 .000 .000 .001
N 2751 2751 2751 2751 2751 2751 2751 2751
Bra
nd
Fu
ncti
on
ality
Correlation Coefficient
1.00
0 .866** .681** -.198** .745** .611** -.174**
Sig. (2-tailed)
0.000
0.000 .000 0.000 .000 .000
N
2751 2751 2751 2751 2751 2751 2751
Bra
nd
Ch
ara
cte
risti
cs
Correlation Coefficient
1.00
0 .655** -.151** .742** .641** -.164**
Sig. (2-tailed) 0.000 .000 0.000 0.000 .000
N
2751 2751 2751 2751 2751 2751

A conceptual instrument to measure the success of branding in the tourism industry 229
* small sr = .10-.29; ** medium sr =.30-.49; *** large sr =.50-1.0.
It is evident from Table 6.44 that the brand measuring factors correlate on a high level
with one another also contributing to the importance of measuring (and managing)
these elements in an integrated manner. Brand functionality and Brand characteristics
correlated statistically (p=<0.000) and practically ( sr = >.50) with respectively four and
three of the other brand factors showing the interdependence of these factors. Brand
competitiveness only showed small correlations with the other brand factors.
Bra
nd
Imag
e
Correlation Coefficient
1.000 -.144** .610** .448** -.155**
Sig. (2-tailed) .000 .000 .000 .000
N
2751 2751 2751 2751 2751
Bra
nd
Co
mp
eti
tiven
ess
Correlation Coefficient
1.000 -.128** -.115** .197**
Sig. (2-tailed) .000 .000 .000
N
2751 2751 2751 2751
Bra
nd
Tru
st
Correlation Coefficient
1.000 .628** -.068**
Sig. (2-tailed) .000 .000
N
2751 2751 2751
Pers
on
al
Po
sit
ive B
ran
d
Beh
avio
ur
Correlation Coefficient
1.000 -.141**
Sig. (2-tailed) .000
N
2751 2751
Pers
on
al
Neg
ati
ve
Bra
nd
Beh
avio
ur
Correlation Coefficient
1.000
Sig. (2-tailed)
N
2751
A conceptual instrument to measure the success of branding in the tourism industry 230
This therefore means that the purpose of phase D was achieved by validating the high
reliable results of the identified brand categories and therefore also achieving the overall
goal of the chapter.
6.4 CONCLUSION
The purpose of this chapter was twofold. Firstly the descriptive results for the five
categories (brand awareness, brand usage, brand satisfaction, brand loyalty, brand
experience) was discussed to portray the basic features of the data collected for both
resort group 1 and 2. Secondly the development of the conceptual instrument was
discussed by explaining and providing the results of the four phases followed.
During phase A, a literature study was conducted using relevant academic articles. The
goal of this phase was twofold. The first goal was to identify and analyse current models
and tools used to measure brand effectiveness by means of an in-depth literature
review. The second goal was to conduct a literature review to establish which brand
elements should be included in the conceptual tourism brand measure instrument.
Phase B of this study was exploratory, as the Delphi technique was used to gather and
analyse data from a panel of experts. This involved a seven step process to reach
consensus on the final elements to be included in the conceptual instrument. Phase C
of this study was also of an exploratory nature, since this research focused on
developing a brand measure instrument (questionnaire). The purpose of phase C was
to determine the reliability of the data. The purpose of the last phase (D) was to validate
the reliability of the proposed measure instrument.

A conceptual instrument to measure the success of branding in the tourism industry 231
CHAPTER 7
CONCLUSIONS AND
RECOMMENDATIONS
7.1 INTRODUCTION
The purpose of this chapter is to draw conclusions and make recommendations
regarding the literature review and empirical analyses of the study. Ultimately the main
contribution of the study, namely the measuring instrument, will be presented with
implementation guidelines and recommendations.
The main goal of this study was to develop a conceptual instrument to measure the
success of branding in the tourism industry. To achieve this goal, objectives were set in
chapter 1 and achieved in the chapters thereafter.
The first objective was to conduct a literature review on the role of branding in
tourism marketing. This was done in chapter 2 by highlighting seven aspects. Part 1
explained the four evolution eras of marketing; in part 2 the definitions pertaining to
marketing and tourism marketing was indicated; part 3 explained the basic aspects
of tourism marketing; part 4 focused on the scale of market entities and molecular
models; part 5 explained the factors that influence the experience of services; part 6
explained consumer behaviour in services by highlighting the four main factors that
influence consumer behaviour and finally the seven stages of the consumer buying
decision process were discussed. This objective was further achieved in chapter 3
by highlighting five aspects. Firstly, the term, branding, was explained according to
various authors, followed by the significance of branding. Part 3 of this chapter
explained some basic aspects of branding. Part 4 discussed how brands are
A conceptual instrument to measure the success of branding in the tourism industry 232
created, aspects to consider during brand development and current trends in
branding. Part 5 indicated how consumers choose brands by explaining how equity
influences consumers, the buyer decision process and factors influencing brand
selection.
The second objective was to identify and analyse current models and tools used to
measure brand effectiveness. This was done in chapter 4 (cf. 4.2) by firstly
evaluating eight brand methods currently used. It was found that various aspects
were measured by each brand evaluation method; that all brand evaluation methods
utilised a Likert scale of between four and ten; that all the brand evaluation methods
were designed to measure either internal or external brand aspects; that only seven
brand aspects measured (awareness, management, strategy, value, research, price,
competition) were similar in some of the brand evaluation methods; that the outcome
of each of the brand evaluation methods was either in figure format, given as a score
out of 100 or shown as a comparison and that none of the eight evaluation methods
could be applied, as is, to a tourism-related product. A summary of the evaluation
methods was also compiled (cf. Table 4.12).
The third objective was to conduct a literature review to establish which brand
categories should be included in the tourism brand measure instrument. This was
done firstly by evaluating previous tourism brand related studies. It was found that
brand awareness, brand usage, brand satisfaction, brand loyalty and brand
experience were the brand categories included within the previous tourism-related
studies. The elements tested under each of these five aspects tended to differ and
were applied to the specific tourism product tested (cf. Tables 4.13 to 4.17).
Secondly, this objective involved using the Delphi technique to further explore these
brand categories. Phase A (cf. 1.4.1) involved a review of the literature in chapters 2
and 3 and the summaries of each of the evaluation methods in chapter 4 (cf. Tables
4.2; 4.4 to 4.11). From this only five similar categories were identified, namely brand
awareness, brand usage, brand satisfaction, brand loyalty and brand experience.
These five categories then formed the basis of the conceptual instrument to measure

A conceptual instrument to measure the success of branding in the tourism industry 233
the success of branding in the tourism industry. Phase B (cf. 1.4.2 and 6.3.2)
involved the gathering and analysis of information from a panel of experts in a
particular field of interest. The experts in the field completed a questionnaire
indicating their views on the likelihood of certain developments taking place in future.
These views were then collated and circulated to panel members for further
comment and repeated a number of times before final results were collated.
The fourth objective was to evaluate and test the conceptual tourism brand measure
instrument on at least two well-known and established tourism brands in South
Africa. This was done in chapter 6 as part of Phases C and D (cf. 1.4.3 and 6.3.3)
during the period October 2013 and May 2014. Phase C of this study was of an
exploratory nature, since this research focused on developing a brand measure
instrument (questionnaire). The purpose of Phase C was to assess the relevance of
the brand items and to determine the reliability of the first set of data (cf. Tables 6.40
and 6.45). The purpose of the last phase (D) was to validate and determine the
reliability of the proposed measuring instrument on the second set of data (cf. Tables
6.44 and 6.45).
The fifth and final objective was to draw conclusions and make recommendations for
the application of the tourism brand measure instrument. The purpose of this chapter
is therefore to achieve this final objective.
7.2 RESEARCH CONCLUSIONS
7.2.1 Conclusions from literature review
Significant developments were made during the four evolution eras of marketing
where the consumer is currently the most important element in the societal
marketing orientation eras.
The basic aspects of service marketing entail the fact that tourism products
include services and services tourism products.

A conceptual instrument to measure the success of branding in the tourism industry 234
Gaining a competitive advantage over other tourism related products is key to
survival in the current tourism industry.
A tourism brand’s unique characteristics are intangibility, inseparability, variability
and perishability, so it relies heavily on means to overcome these.
Brands are created by various processes and are influenced by current trends in
branding.
Current brand evaluation methods were not suitable to use, as is, in the tourism
industry and no standardised method was available.
Previous tourism brand-related studies focused on brand evaluation categories
that included brand awareness, brand usage, brand satisfaction, brand loyalty
and brand experience.
Ultimately the consumer needs to be aware of the tourism brand, and be able to
use and experience the tourism brand. Through usage and experience the
consumer will either be satisfied or not and if satisfaction was achieved for a
number of times that consumer will start to prefer and become loyal to that
tourism brand.
7.2.2 Conclusions from data collected
To achieve the main goal of this study (to develop a conceptual instrument to measure
the success of branding in the tourism industry), data collected involved both a
descriptive and exploratory analysis whose conclusions are explained in the next
section.
7.2.2.1 Conclusions from the descriptive results
The purpose of the descriptive results was to provide an overview of the basic features
of the data in the study and to summarise the large set of quantitative data. The layout
and compilation of the questions as part of the conceptual instrument also formed part
of the descriptive analysis. It was divided into an analysis of Resort Groups 1 and 2 and
are summarised in the following section.

A conceptual instrument to measure the success of branding in the tourism industry 235
A Resort group 1
Major findings from the resort group 1 survey were the following:
Respondents were highly educated, formed part of a family, were between the
ages of 40-59 and the majority lived in Gauteng.
The majority associated the applicable brand with matching resorts of that brand.
Respondents were totally aware of what the brand represents and associated it
with vacation/breakaway.
The most recognisable characteristics of the brand were the sun and the
acronym that formed part of the logo. These two aspects also differentiated the
brand from other competing brands.
Almost 50% of respondents saw the brand more than three times in the past
month, a third made use of the brand in the past year and two-thirds indicated
that they would use the brand in the next 12 months.
Affordability and value for money were the top influencers during travel decision
making.
A third totally agreed that the brand was important to them when considering a
holiday/breakaway and almost half of them would enquire for another date with
the same brand if it was not available as requested.
More than half of the respondents were positive and had positive experiences
with the brand concerned.
Thus respondents were aware of the brand, used it often and would be using it in future;
they were overall satisfied with the brand, are loyal to it and had a positive brand
experience.
B Resort group 2
Major findings from the resort group 2 survey were the following:
Respondents were highly educated, formed part of a family, were between the
ages of 30 - 39 and the majority lived in Gauteng.
The majority associated the brand concerned with matching resorts of that brand.
A conceptual instrument to measure the success of branding in the tourism industry 236
Respondents were totally aware of what the brand represents and associated it
with fun and relaxation.
The most recognisable characteristics of the brand were the eagle and the
colours used that formed part of the logo. These two aspects also differentiated
the brand from other competing brands.
Only one-quarter saw the brand more than three times in the past month, a third
made use of the brand in the past year and only half indicated that they would
use the brand in the next 12 months.
Affordability and price were the top influencers during decision making.
Almost half of the respondents totally agreed that the brand was important to
them when considering a holiday/breakaway and that they would also enquire for
another date with the same brand if it was not available as requested.
More than half of the respondents were positive and had positive experiences
with the applicable brand.
Thus respondents were aware of the brand, did not use it often but would be using it in
future, are overall satisfied with the brand, are loyal to it and had a positive brand
experience.
When comparing the major findings for these two resorts groups, the following
conclusions are evident regarding the five brand categories:
In both cases the respondents were highly aware of the brand evaluated. They
were familiar with the products and service linked to each brand and could link
the correct resorts to each brand. However, respondents from resort group 1 had
more marketing exposure over a specific time than those from resort group 2.
This is vital information that needs to be communicated to the marketing
department of resort group 2. It can therefore be concluded that marketing
exposure should influence brand awareness and lead to higher levels of brand
awareness.
In both cases the respondents indicated that they would be using
products/services linked to each brand in the near future. In both cases the

A conceptual instrument to measure the success of branding in the tourism industry 237
respondents also indicated that price and value for money were the main
influencers during decision making. However, the respondents from resort group
2 did not make use of the brand as often in the past as the respondents from
resort group 1 did. This might be due to the conclusion above that resort group 2
respondents had less marketing exposure or that it is a less known brand. It may
therefore be concluded that marketing exposure directly influences brand usage.
In both cases the respondents were very satisfied with the aspects assessed
under brand satisfaction. However, the percentages of resort group 1 were much
higher than those of resort group 2. It may therefore be concluded that brand
satisfaction can be indicated by overall high percentages of the identified brand
statements. High levels of satisfaction are needed for consumers to remain loyal
to a certain brand.
In both cases respondents were very loyal to the respective brands evaluated but
resorts need to be aware that respondents would be willing to switch brands if
competing brands would better satisfy their pockets and needs. This information
also needs to be communicated to the management of both resort groups. It may
therefore be concluded that competing brands influence brand loyalty and that
loyal customers are willing to switch brands. Given the current economic
circumstances, consumers are looking for value for money and the best travel
options for their money.
In both cases respondents experienced the brands evaluated as positive.
However, the percentages of respondents of resort group 2 were lower than
those of resort group 1. This is therefore another aspect management of resort
group 2 needs to investigate further. It may therefore be concluded that a positive
brand experience can be summarised by overall high percentages of the
identified brand statements.
The purpose of the descriptive results was to provide an overview of the layout and
structure of the questionnaire as well as to report the frequencies of the responses
related to resort groups 1 and 2. A successful brand is evident in both cases but the
assessment of the questionnaire at both resort groups allowed for the verification of

A conceptual instrument to measure the success of branding in the tourism industry 238
brand statements under each brand category. It is thus possible to measure brand
success with this instrument and respondents completed the questionnaire with ease.
The conclusions drawn are explained in the next section.
7.2.2.2 Conclusions from exploratory results
The purpose of the exploratory results was to develop the conceptual instrument to
measure the success of branding in the tourism industry. The method of research for
this study was exploratory by nature and was conducted in different phases as stated
previously. The conclusions of each phase are briefly summarised in the following
sections.
Conclusions of phase A
During phase A a literature study was conducted using relevant academic articles.
Tourism, marketing and management books as well as existing brand measurement
instruments were also analysed. The goal of this phase was twofold. The first goal was
to identify and analyse current models and tools used to measure brand effectiveness
by means of an in-depth literature review. The following conclusions are therefore
drawn:
Various brand evaluation methods are available but none of these could be
applied, as is, to a tourism product which differs from other consumer products.
Various brand aspects were measured by every brand evaluation method and no
consensus was reached on what should and should not be included in such
measurement.
The various brand aspects in each evaluation method were applied to the
specific brand measured.
The brand evaluation methods used Likert scales between 4 and 10 and again
non-consensus was evident.
The brand evaluation methods were designed to measure either internal or
external brand aspects with less focus on intangible products such as the tourism
experience.
Awareness, management, strategy, value, research, price and competition were

A conceptual instrument to measure the success of branding in the tourism industry 239
the only similar brand aspects measured in some of the brand evaluation
methods.
The second goal was to conduct a literature review to establish which brand statements
should be included in the conceptual instrument to measure the success of branding in
the tourism industry. This was done by evaluating previous tourism brand-related
studies. The following conclusions were therefore drawn:
Brand awareness, brand usage, brand satisfaction, brand loyalty and brand
experience were the brand categories included in the previous tourism-related
studies. Authors agreed to a high level that these five categories may be
regarded as the core contributing factors even though they had been used in
different ways in previous studies.
It was also evident that various brand statements were tested under each of the
mentioned five categories. However, these brand statements tend to differ from
one study to the next and were adapted by researchers to suit the specific
product tested. A universal, structured questionnaire was thus not available or
being implemented in the tourism industry - which necessitated this study.
Conclusions of phase B
Phase B of this study was exploratory by nature owing to a lack of a standardised
measuring instrument (as concluded from phase A). The goal of phase B was to assess
the relevance of the seventy brand statements, identified from phase A. The following
conclusions may thus be drawn:
The Delphi technique proved to be successful in this research since it allowed
the gathering and analysis of data in an exploratory manner. This consisted of
three rounds where participants had the freedom to provide their opinions and
ideas, allowing for in-depth analysis of the various statements.
It further provided insight into the elimination of non-relevant brand aspects
identified in the literature review.
The use of the Delphi technique further assisted the researcher in developing an
interim questionnaire that formed the basis of Phase C of this study.

A conceptual instrument to measure the success of branding in the tourism industry 240
Conclusions of phases C and D
Phase C of this study was exploratory by nature, since this research focused on
developing a brand measuring instrument (questionnaire) directed at the tourism
industry. The purpose of phase C was to gather data for a specific tourism case study
(resort group 1) and, based on that, to determine the reliability and validity of the
questionnaire. The following conclusions were therefore drawn:
A high reliability and inter-item correlation was the result of a statistical analysis
of the initial five brand categories identified through the literature review.
These results also indicate that the initial identified satisfaction category was
divided into brand functionality, brand characteristics and brand image. The initial
identified loyalty category was divided into brand competitiveness and brand trust
and the initial identified experience category resulted in personal positive and
personal negative brand experience; an additional three brand categories were
therefore identified during this phase.
The purpose of phase D was to validate the reliability of the eight brand categories
identified through phase C. This again involved gathering data for a specific tourism
case study (resort group 2) and, based on that, to determine the reliability and validity of
the questionnaire. The following conclusions may therefore be drawn:
Once again high reliability and inter-item correlations were the result of a
statistical analysis of the eight brand categories identified through phase C.
The high reliability and inter-item correlations were confirmed by the results of
the resort group 2 survey (phase D).
It can therefore be concluded that the purpose of phase D was achieved by
validating the high reliability results of the identified brand categories and
therefore also achieving the overall goal of this study.

A conceptual instrument to measure the success of branding in the tourism industry 241
7.3 RESEARCH CONTRIBUTION
The contribution of this research is threefold:
7.3.1 Methodology contribution
The main goal of this study was to develop a reliable conceptual instrument to measure
the success of branding in the tourism industry. This was done by using the Delhi
technique. The conceptual instrument is indicated by Table 7.1.
Table 7.1: A conceptual instrument to measure the success of branding in the tourism
industry
DEMOGRAPHIC INFORMATION
1. What language do you mainly speak at home?
Afrikaans Ndebele Zulu
English Tswana Portuguese
Swazi Tsonga French
Xhosa Northern Sotho German
Venda Southern Sotho Other
If other, please specify.
2. In what province do you currently live?
Gauteng Western Cape
Limpopo Northern Cape
Mpumalanga North West
KwaZulu-Natal Free State
Eastern Cape I do not live in SA
3. If not in SA, please specify your country of residence.
4. What is your gender?
Female
Male
5. What is your age?
Under 17 30 – 39 60 +
18 - 20 40 – 49
21 - 29 50 - 59
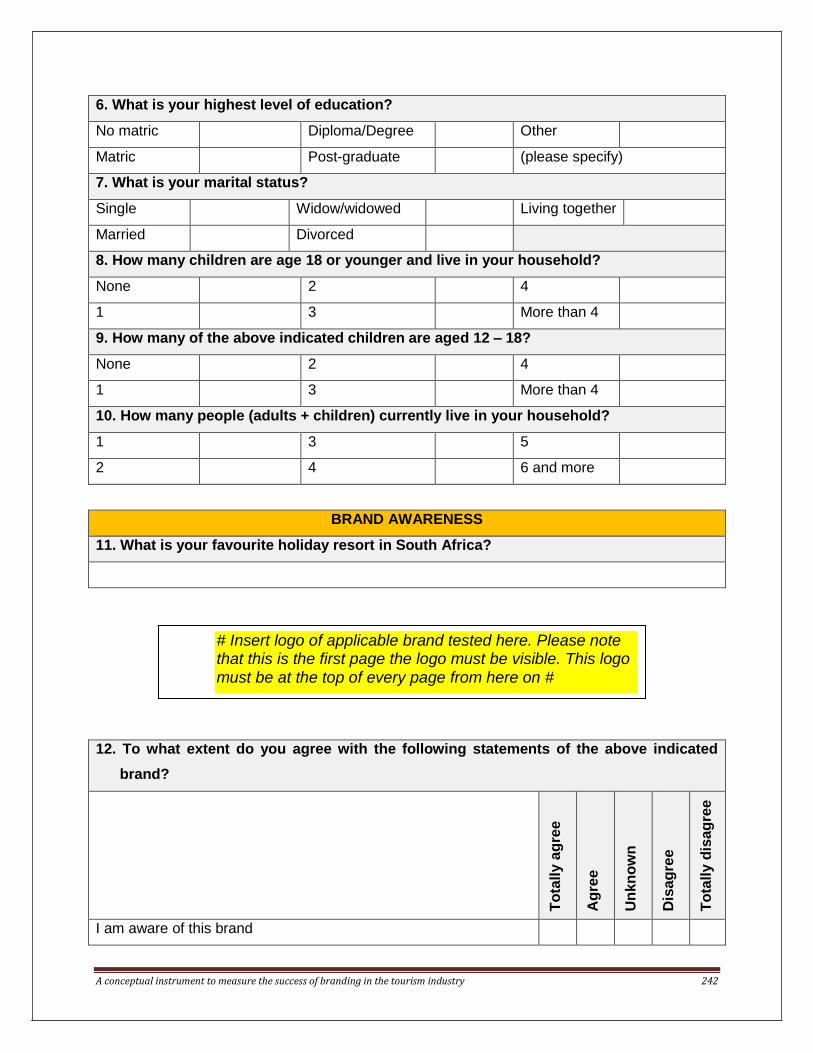
A conceptual instrument to measure the success of branding in the tourism industry 242
6. What is your highest level of education?
No matric Diploma/Degree Other
Matric Post-graduate (please specify)
7. What is your marital status?
Single Widow/widowed Living together
Married Divorced
8. How many children are age 18 or younger and live in your household?
None 2 4
1 3 More than 4
9. How many of the above indicated children are aged 12 – 18?
None 2 4
1 3 More than 4
10. How many people (adults + children) currently live in your household?
1 3 5
2 4 6 and more
BRAND AWARENESS
11. What is your favourite holiday resort in South Africa?
12. To what extent do you agree with the following statements of the above indicated
brand?
To
tally
ag
ree
Ag
ree
Un
kn
ow
n
Dis
ag
ree
To
tally
dis
ag
ree
I am aware of this brand
# Insert logo of applicable brand tested here. Please note that this is the first page the logo must be visible. This logo must be at the top of every page from here on #
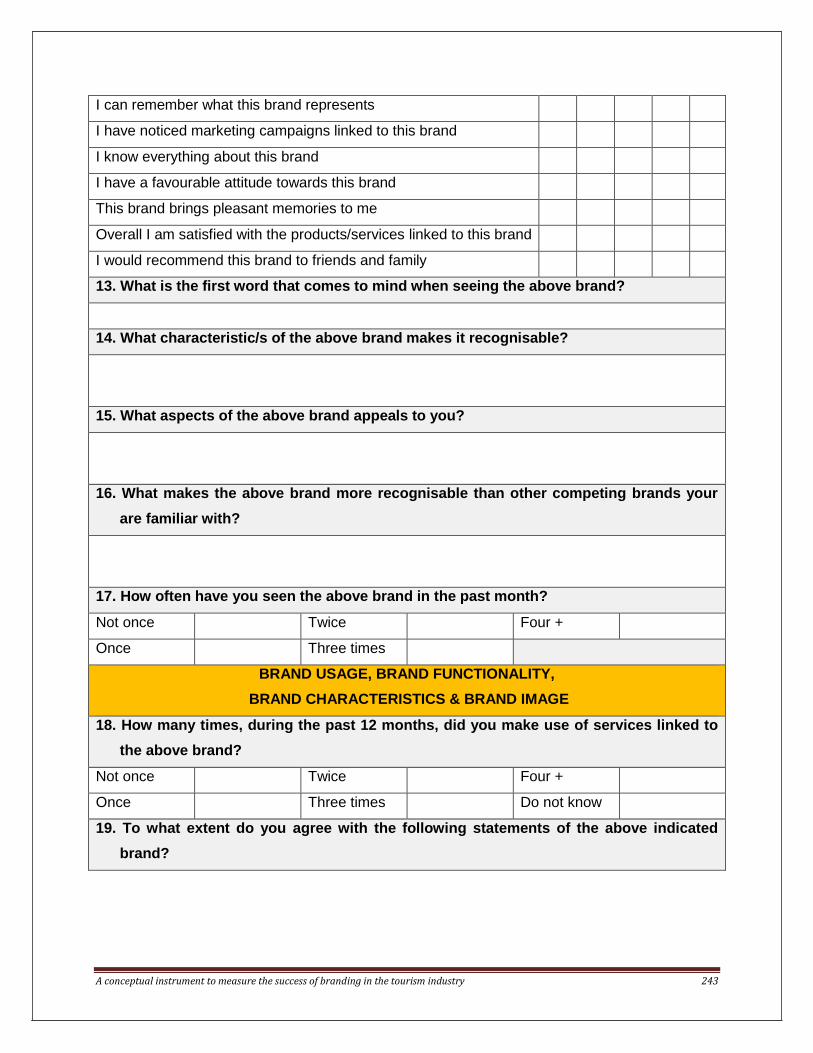
A conceptual instrument to measure the success of branding in the tourism industry 243
I can remember what this brand represents
I have noticed marketing campaigns linked to this brand
I know everything about this brand
I have a favourable attitude towards this brand
This brand brings pleasant memories to me
Overall I am satisfied with the products/services linked to this brand
I would recommend this brand to friends and family
13. What is the first word that comes to mind when seeing the above brand?
14. What characteristic/s of the above brand makes it recognisable?
15. What aspects of the above brand appeals to you?
16. What makes the above brand more recognisable than other competing brands your
are familiar with?
17. How often have you seen the above brand in the past month?
Not once Twice Four +
Once Three times
BRAND USAGE, BRAND FUNCTIONALITY,
BRAND CHARACTERISTICS & BRAND IMAGE
18. How many times, during the past 12 months, did you make use of services linked to
the above brand?
Not once Twice Four +
Once Three times Do not know
19. To what extent do you agree with the following statements of the above indicated
brand?

A conceptual instrument to measure the success of branding in the tourism industry 244
To
tally
ag
ree
Ag
ree
Un
kn
ow
n
Dis
ag
ree
To
tally
dis
ag
ree
This brand offers value for money
This brand delivers what was promised
This brand uses healthy business ethics
This brand is attractive
This brand captures the essence of the tourism product/service
This brand is associated with high levels of service
This brand is associated with good quality products/services
This brand is associated with integrity
This brand is easy to distinguish from competing brands
This brand is associated with a proud history
This brand is much talked about
I will make use of this brand in the next 12 months
20. To what extent do you agree with the following statements of the above indicated
brand?
To
tally
ag
ree
Ag
ree
Un
kn
ow
n
Dis
ag
ree
To
tally
dis
ag
ree
This brand is innovative
This brand is highly visible
This brand is easily recognisable
This brand is credible
This brand is well established as a tourism brand
This brand is relevant to the tourism product/service it represents
This brand is creative
This brand is proudly South African

A conceptual instrument to measure the success of branding in the tourism industry 245
This brand portrays value for money
This brand portrays a good image
This brand portrays reliability
21. When you consider using services associated with the above brand, what aspects
may influence your decision?
BRAND COMPETITIVENESS & BRAND TRUST
22. What does the term “brand loyalty” mean to you?
23. To what extent do you agree with the following statements of the above indicated
brand?
To
tally
ag
ree
Ag
ree
Un
kn
ow
n
Dis
ag
ree
To
tally
dis
ag
ree
I am loyal to this brand
I rely on this brand
I trust this brand
This brand is important to me when considering a breakaway/ holiday
This brand will influence my decision to purchase
The public image of this brand will influence my decision
If the brand should change in future, I will still make use of it
If the brand should change in future, I will not make use of it
anymore
24. What will you do if the service you requested from the above brand is not available?
Enquire about availability for another time
Enquire about availability at another outlet of the same brand
Delay purchase till next time, but still use the same brand
Enquire from a competing brand
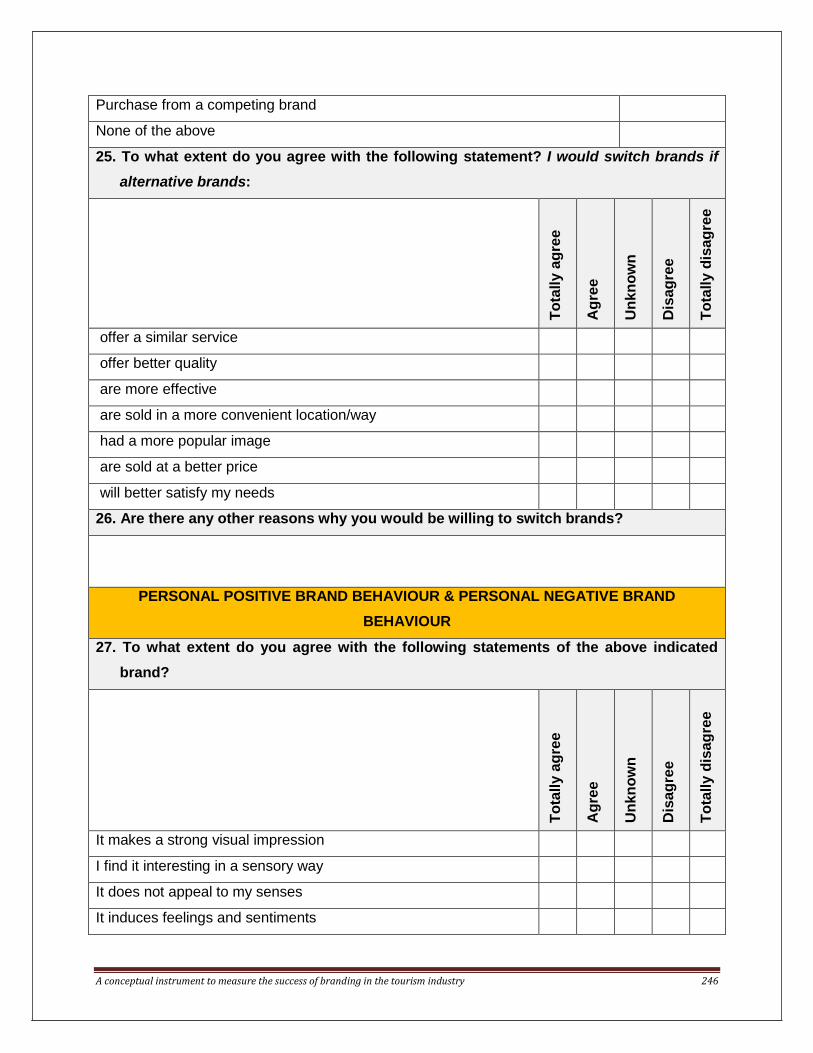
A conceptual instrument to measure the success of branding in the tourism industry 246
Purchase from a competing brand
None of the above
25. To what extent do you agree with the following statement? I would switch brands if
alternative brands:
To
tally
ag
ree
Ag
ree
Un
kn
ow
n
Dis
ag
ree
To
tally
dis
ag
ree
offer a similar service
offer better quality
are more effective
are sold in a more convenient location/way
had a more popular image
are sold at a better price
will better satisfy my needs
26. Are there any other reasons why you would be willing to switch brands?
PERSONAL POSITIVE BRAND BEHAVIOUR & PERSONAL NEGATIVE BRAND
BEHAVIOUR
27. To what extent do you agree with the following statements of the above indicated
brand?
To
tally
ag
ree
Ag
ree
Un
kn
ow
n
Dis
ag
ree
To
tally
dis
ag
ree
It makes a strong visual impression
I find it interesting in a sensory way
It does not appeal to my senses
It induces feelings and sentiments

A conceptual instrument to measure the success of branding in the tourism industry 247
I do not have strong emotions about it
I have an emotional connection with it
I engage in physical actions and behaviours when using it
It results in bodily experiences
It is not action oriented
I engage in a lot of thinking when I encounter it
It stimulates my curiosity and problem solving
Table 7.2 summarises additional notes to the above conceptual instrument to measure
the success of branding in the tourism industry.

A conceptual instrument to measure the success of branding in the tourism industry 248
Table 7.2: Additional notes to the conceptual instrument
Brand
category
Question number
Question
type
Brand aspect
B
ran
d a
ware
nes
s
B
ran
d a
ware
nes
s
11* Open-ended
What is your favourite holiday resort in South Africa?
12.1 Closed-ended
I am aware of this brand
12.2 Closed-ended
I can remember what this brand represents
12.3 Closed-ended
I have noticed marketing campaigns linked to this brand
12.4 Closed-ended
I know everything about this brand
13* Open-ended
What is the first word that comes to mind when seeing the indicated brand?
14* Open-ended
What characteristic/s of the indicated brand makes it recognisable?
15* Open-ended
What aspects of the indicated brand appeals to you?
16* Open-ended
What makes the indicated brand more recognisable than other competing brands you are familiar with?
17 Closed-ended
How often have you seen the indicated brand in the past month?
B
ran
d
usag
e
18 Closed-ended
How many times, during the past 12 months, did you make use of services linked to the indicated brand?
19.12 Closed-ended
I will make use of the indicated brand in the next 12 months
21* Open-ended
When you consider using services associated with the indicated brand, what aspects may influence your decision?
B
ran
d f
un
cti
on
ality
19.1 Closed-ended
Offers value for money
19.2 Closed-ended
Deliver what was promised
19.3 Closed-ended
Use healthy business ethics
19.4 Closed-ended
Is attractive
19.5 Closed-ended
Captures the essence of the tourism product/service
19.6 Closed-ended
Is associated with high levels of service
19.7 Closed-ended
Is associated with good quality products
19.8 Closed-ended
Is associated with integrity
19.9 Closed-ended
Is easy to distinguish from competing brands
19.10 Closed-ended
Is associated with a proud history of tourism product/service
20.9 Closed-ended
Portrays value for money

A conceptual instrument to measure the success of branding in the tourism industry 249
20.10 Closed-ended
Portrays a good image
20.11 Closed-ended
Portrays reliability
Bra
nd
ch
ara
cte
risti
cs
19.11 Closed-ended
Is much talked about
20.1 Closed-ended
Is innovative
20.2 Closed-ended
Is highly visible
20.3 Closed-ended
Is easily recognisable
20.4 Closed-ended
Is credible
20.5 Closed-ended
Is well established as a tourism brand
20.6 Closed-ended
Is relevant to the tourism product/service it represents
20.7 Closed-ended
Is creative
20.8 Closed-ended
Is proudly South African
Bra
nd
ima
ge
12.5 Closed-ended
I have a favourable attitude towards this brand
12.6 Closed-ended
This brand brings pleasant memories to me
12.7 Closed-ended
Overall I am satisfied with the products/services associated with this brand
B
ran
d c
om
peti
tiv
en
es
s
22 * Open-ended
What does the term “brand loyalty” mean to you?
23.1 Closed-ended
I am loyal to it
23.2 Closed-ended
I rely on it
23.3 Closed-ended
I trust it
23.4 Closed-ended
It is important to me when considering a breakaway/holiday
23.5 Closed-ended
It will influence my decision to purchase
23.6 Closed-ended
Its public image will influence my purchase decision
23.7 Closed-ended
If it should change in future, I will still make use of it
23.8 Closed-ended
If it should change in future, I will not make use of it anymore
24.1 Closed-ended
Enquire about availability for another time
24.2 Closed-ended
Enquire about availability at another outlet of the same brand
24.3 Closed-ended
Delay purchase till next time, but still use the same brand
24.4 Closed-ended
Enquire from competing brands

A conceptual instrument to measure the success of branding in the tourism industry 250
24.5 Closed-ended
Purchase from competing brands
26* Open-ended
Are there any other reasons why you would be willing to switch brands?
Bra
nd
tru
st
12.8 Closed-ended
I would recommend this brand to friends and family
25.1 Closed-ended
Offer a similar service
25.2 Closed-ended
Offer better service
25.3 Closed-ended
Is more effective
25.4 Closed-ended
Is sold in a more convenient location/way, e.g. Internet bookings
25.5 Closed-ended
Has a more popular image
25.6 Closed-ended
Is sold at a better price
25.7 Closed-ended
Will better satisfy my needs
P
ers
on
al
po
sit
ive b
ran
d
exp
eri
en
ce
27.1 Closed-ended
It makes a strong visual impression
27.2 Closed-ended
I find it interesting in a sensory way
27.4 Closed-ended
It induces feelings and sentiments
27.6 Closed-ended
I have an emotional connection with it
27.7 Closed-ended
I engage in physical actions and behaviours when I use it
27.8 Closed-ended
It results in bodily experiences
27.10 Closed-ended
I engage in a lot of thinking when I encounter it
27.11 Closed-ended
It stimulates my curiosity and problem solving
Pe
rso
nal
neg
ati
ve
bra
nd
ex
pe
rie
nc
e
27.3 Closed-ended
It does not appeal to my senses
27.5 Closed-ended
I do not have strong emotions about it
27.9 Closed-ended
It is not action oriented
7.3.2 Scholarly contributions
This study firstly identified important brand categories through a literature review. These
brand categories were then applied to the tourism industry (resorts) by using the Delphi

A conceptual instrument to measure the success of branding in the tourism industry 251
technique and it resulted in a reliable conceptual instrument that can be used in the
tourism industry to measure a brand. By applying the brand categories identified
through the literature review to a tourism product, three new brand categories were also
identified. This study therefore made a unique contribution to the literature of tourism as
a science.
7.3.3 Practical contributions
The above conceptual instrument to measure the success of branding in the tourism
industry can be used by any tourism-related product to assess its brand. This will give
the owner/management an overall view of the performance of the tourism brand under
the eight brand categories (brand awareness, brand functionality, brand characteristics,
brand image, brand competitiveness, brand trust, personal positive brand behaviour,
personal negative brand behaviour) identified. This will allow the owner/management to
identify underperforming brand categories of their overall brand. The owner/
management can then use the above brand statements, under the weak performing
brand category, as a guideline to develop strategies for improving that specific brand
category. Repeating the above process, after implementing the strategies identified and
comparing the results of both, will indicate whether the identified strategies were
successful in improving the overall tourism brand.
The conceptual instrument to measure the success of branding in the tourism industry
can also be applied as is by a tourism-related product. The measuring instrument
therefore has a practical application that can assist the tourism product to compete at
higher levels of branding. This may result in having a competitive edge that can draw
more tourists, retain existing tourists and ultimately result in a higher turnover.
The conceptual instrument to measure the success of branding in the tourism industry
can further be used by academics as a foundation for the development of a
standardised instrument to be used in the tourism industry worldwide. Measuring brand
success in the tourism industry is unique since it mainly deals with experiences and
services.

A conceptual instrument to measure the success of branding in the tourism industry 252
7.4 RESEARCH RECOMMENDATION
This study provided a new perspective on how a tourism brand can be evaluated.
However, the study also presents opportunities for further research in a number of
ways.
This study could be of value to assess the degree to which the findings of this study
correlate with those of similar resort brands in other countries.
Although it is outside the scope of the present study, it would have been noteworthy
to assess the influence of client demographics on brand evaluation.
The study also presents the opportunity to be replicated in other tourism sectors.
This study is a first step towards building a generic model through which any tourism
brand (locally and internationally) could be measured.
Because of a highly competitive tourism market, tourist choices play a critical role in
attracting new and keeping existing consumers. The conceptual brand measure
instrument can therefore be used to measure all tourism-related products in order to
better understand consumer choices.
7.5 RESEARCH LIMITATIONS
For the purpose of this research the measuring instrument was only applied to
tourism resorts.
Owing to the above limitation the measuring instrument might change when
applied to hotels and other types of tourism products.
A conceptual instrument to measure the success of branding in the tourism industry 253
REFERENCES
A
Aaker, D.A. 1996. Measuring brand equity across products and markets. California
management review, 38(3)102-119.
Aaker, D.A. 2002. Building strong brands. New York: The Free Press.
Aaker, D.A., Kumar, V. & Day, G.S. 2007. Marketing research. New York: John Wiley &
Sons.
Adler, M. & Ziglio, E. 1996. Gazing into the oracle: The Delphi method and its
application to social policy and public health. London: Jessica Kingsley Publishers.
Allen, J., O’Toole, W., Harris, R. & McDannell, I. 2008. Festival and special event
management. Milton: John Wiley & Sons.
B
Backer, E. 2009. VFR tourism. Ballarat: University Press.
Baker, B. 2007. Destination branding for small cities – the essential for successful place
branding. Portland: Creative Leap Books.
Balmer, J.M.T. 2001. The three virtues and seven deadly sins of corporate branding.
Journal of general management, 27(1):1-17.
Balmer, J.M.T. & Gray, E.R. 2000. Corporate identity and cooperate communication.
Journal of general management, 32(7):256-997.
Belch, G.E. & Belch, M.A. 1998. Advertising and promotion. 4th ed. New York: Irwin
McGraw–Hill.
A conceptual instrument to measure the success of branding in the tourism industry 254
Belz, F.M. & Peattie, K. 2012. Sustainable marketing. Chichester, Sussex: John Wiley &
Sons.
Bennett, J.A. 2000. Managing tourism services: A South African perspective. Pretoria:
Van Schaik Publishers.
Bennett, J.A. & George, R. 2004. South African travel and tourism cases. Pretoria: Van
Schaik.
Bergvall, J. 2007. A brand is a memory. http://www.allaboutbranding.com/index Date of
access: 26 January 2010.
Blackwell, R.D., Miniard, P.W. & Engel, J.F. 2001. Consumer behaviour. New York:
Harcourt College Publishers.
Blaxter, L., Hughes, C. & Tight, M. 2010. How to research. 4th ed. New York: McGraw-
Hill.
Blem, N. 2001. Achieving excellence in selling. New York: Oxford.
Boo, S., Busser, J. & Baloglu, S. 2009. A model of customer-based brand equity and its
application to multiple destinations. Tourism management, 30(2):219-231.
Bowie, D. & Buttle, F. 2004. Hospitality marketing: An introduction. Oxford: Elsevier
Butterworth Heinemann.
Bowdin, G., McDonnell, I., Allen, J. & O’Toole, W. 2003. Events management. Oxford:
Butterworth-Heinemann.
Brace, I. 2008. Questionnaire design. 2nd ed. London: Kogan Page.
Brakus, J.J., Schmitt, B.H. & Zarantonello, L. 2009. Brand experience, what is it, how is
it measured and does it affect loyalty? Journal of marketing, 73(1):52-68.
Brown, I.R. 2006. Mastering marketing. 2nd ed. London: Torogood.

A conceptual instrument to measure the success of branding in the tourism industry 255
Burke, J.F. & Resnick, B. 2000. Marketing and selling the tourism product. 2nd ed.
Vancouver: Thomson Learning.
Burns, A.C. & Bush, R.F. 2010. Marketing research. 6th ed. Boston: Pearson Prentice
Hall.
C
Cahill, D.J. 2006. Lifestyle market segmentation. New York: Haworth Press.
Cant, M. 2010. Marketing: An introduction. Cape Town: Juta and Company Ltd.
Cant, M., Gerber-Nel C., Nel D. & Kotze, T. 2003. Marketing research. Claremont: New
African Books.
Cant, M., Gerber-Nel C., Nel D. & Kotze, T. 2008. Marketing research. 2nd ed. Pretoria:
Van Schaik Publishers.
Cai, L.A. 2002. Cooperative branding for rural destinations. Annals of tourism research,
29(3):720-742.
Chacko, H.E. 1997. Positioning a tourism destination to gain a competitive edge. Asia
Pacific journal of tourism research, 1(2):69-75.
Chandon, P. 2003. Note on measuring brand awareness, brand image, brand equity
and brand value. France: INSEAD. (Published PhD thesis).
Cheverton, P. 2006. Understanding brands. London: Kogan Page.
Chinomona, R. 2013. The influence of brand experience on brand satisfaction, trust and
attachment in South Africa. International business and economics research journal,
12(10):1303-1316.
Chrisnall, P. 2001. Marketing research. London: McGraw-Hill.

A conceptual instrument to measure the success of branding in the tourism industry 256
Churchill, G.A. & Lacobucci, D. 2002. Marketing research. 8th ed. Mason, OH: Thomson
Learning.
Clarke, J. 2000. Tourism brands: An exploratory study of the brands box model. Journal
of vocational marketing, 6(4):329-344.
Cohen, J. 1988. Statistical power analysis for behavioural sciences. 2nd ed. Hillsdale
NJ: Erlbaum.
Coghlan, D. & Brannick, T. 2005. Doing action research in your own organisation. 2nd
ed. London: Sage.
Cooper, C., Fletcher, J., Fyall, A., Gilbert, D. & Wanhill, S. 2005. Tourism: Principle and
practice. 3rd ed. New York: Longman.
Cooper, D.R. & Schindler, P.S. 2006. Marketing research. New York: McGraw-Hill.
Creswell. J. 2007. Qualitative inquiry and research design: Choosing among five
approaches. 2nd ed. Thousand Oaks, CA: Sage.
Crouch, S. & Housden, M. 2003. Marketing research for managers. 3rd ed. Oxford:
Butterworth-Heinemann.
Czinkola, M.R. & Ronkainen, I.A. 1991. International marketing. London: Dryden Press.
D
Dahringer, M. 1992. International marketing. New York: Addison-Wesley Publishing
Company.
Danesi, M. 2006. Brands. London: Routledge.
Davis, J. 2007. More than a name: An introduction to branding. London: AVA publishing
Ltd.
Davis, J.A. 2010. Competitive success: How branding adds value. London: John Wiley
& Sons.

A conceptual instrument to measure the success of branding in the tourism industry 257
Davis, M. 2005. More than a name: An introduction to branding. London: AVA
Publishing.
Davis, M. 2005. Measuring marketing: 103 key metrics every marketer needs. London:
John Wiley & Sons.
De Chernatony, L. 2006. From brand vision to brand evaluation. London: Elsevier.
De Chernatony, L. & McDonald, M. 2003. Creating powerful brands. 3rd ed. London:
Butterworth-Heinemann.
De Mooij, M. 2005. Global marketing and advertising. London: Sage.
Donald, S.H. & Gammack, J.G. 2007. Tourism and the branded city: Film and identity
on the Pacific Rim. Aldershot: Ashgate.
Drummond, G. & Ensor, J. 2005. Introduction to marketing concepts. London:
Butterworth Heinemann.
Duncan, T. 2005. Principles of advertising and IMC. London: McGraw-Hill.
Duval, D.T. 2007. Tourism and transport: Modes, networks and flows. Clevedon:
Channel View.
E
Engelbrecht, E. 2005. Fundamentals of sales and marketing. Pretoria: Van Schaik
Publishers.
F
Ferrell, O.C., Hartline, M.D. & Lucas, G.H. 2002. Marketing strategy. 2nd ed. New York:
Harcourt College Publishers.

A conceptual instrument to measure the success of branding in the tourism industry 258
Field, A. 2005. Discovering statistics using SPSS. Thousand Oaks: Sage.
Franses, P.H. & Paap, R. 2003. Quantitative models in marketing research. New York:
Cambridge University Press.
Fung So, K.K. & King, C. 2009. When experience matters: Building and measuring hotel
brand equity. International journal of contemporary hospitality management, 22(5)589-
608.
G
Gallarza, M.G., Saura, I.G. & Garcia, H.C. 2002. Destination image: Towards a
conceptual framework. Annals of tourism research, 29(1):56-78.
George, R. 2001. Marketing South African tourism and hospitality. Cape Town: Oxford
University Press.
George, R. 2004. Marketing South African tourism. 2nd ed. Cape Town: Oxford
University Press.
George, R. 2007. Managing tourism in South African. Cape Town: Oxford University
Press.
George, R. 2008. Marketing tourism in South African. Cape Town: Oxford University
Press.
George, R. 2014. Marketing tourism in South African. 5th ed. Cape Town: Oxford
University Press.
Gnoth, J. 2002. Leveraging export brands through a tourism destination brand. Brand
management, 9(1):262-179.
Go, F.M. & Govers, R. 2010. International place branding yearbook 2010. London:
Palgrave.
Goulding, C. 2002. Grounded theory: A practical guide for management. London: Sage.

A conceptual instrument to measure the success of branding in the tourism industry 259
Gregory, J.R. 2004. Best of branding. New York: McGraw-Hill.
Guest, G., Bunce, A. & Johnson, L. 2006. How many interviews are enough? An
experiment with data saturation and validity. Field methods, 18(1):59-82.
H
Haig, M. 2007. The rules of attraction. http://www.allaboutbranding.com/index/article
403 Date of access: 14 August 2007.
Hakim, C. 2000. Research design: Successful designs for social and economic
research. 2nd ed. London: Routledge.
Hankinson, G. 2001. Location branding: A study of the branding practices of 12 English
cities. Journal of brand management, 9(2):127-142.
He, H., Li, Y. & Harris, L. 2012. Social identity perspectives on brand loyalty. Journal of
business research, 65:648-657.
Healy, M. 2008. What is branding? New York: Rota Vision.
Henderson, J. 2000. Selling places: The New Asia-Singapore brand. Journal of tourism
studies, 11(1):36-44.
Hingston, P. 2001. Effective marketing. London: Darling Kindersley Limited.
Hoffman, K.D. & Bateson, J.E.G. 2001. Essentials of service marketing. Colorado:
Thomson Learning.
Hollis, N. 2008. The global brand. New York: Palgrave MacMillan.
Holloway, J.C. 2004. Marketing for tourism. 4th ed. London: Prentice-Hall.
Holloway, J.C. 2009. The business of tourism. 8th ed. London: Prentice-Hall.
Holloway, J.C. & Robinson, C. 2000. Marketing for tourism. 3rd ed. New York: Longman.

A conceptual instrument to measure the success of branding in the tourism industry 260
Horner, S. & Swarbrooke, J. 2005. Leisure marketing: A global perspective. Oxford:
Butterworth-Heinemann.
J
Jalees, T. 2006. Market snap shot: A brand tracking survey. Market forces, 2(3)1-8.
Jennings, G. 2001. Tourism research. Sydney: John Wiley & Sons.
Jobber, D. 2001. Principles and practice of marketing. London: McGraw-Hill.
Jordaan, Y. & Prinsloo, M. 2001. Grasping service marketing. Cape Town: Grape Vine
News.
K
Kaushik, A. 2012. Brand measurement: Analytics and metrics for branding campaigns.
http://www.kaushik.net/avinask/brand-measurement-analytics-metrics-branding-camp
Date of access: 1 August 2012.
Kapferer, J.N. 2004. The new strategic brand management: Creating and sustaining
brand equity long term. 3rd ed. London: Kogan Page.
Kapferer, J.N. 2008. The new strategic brand management. 4th ed. London: Kogan
Page.
Keller, K.L. 2002. Strategic brand management: Building, measuring and managing
brand equity. New York: Prentice-Hall.
Keller, K.L. 2003. Strategic brand management: Building, measuring and managing
brand equity. 2nd ed. New York: Prentice-Hall.
Kerin, R.A., Hartley, S.W. & Rudelius, W. 2004. Marketing the core. New York: Irwin.
Keyser, H. 2002. Tourism development. Cape Town: Oxford.
A conceptual instrument to measure the success of branding in the tourism industry 261
Kim, H.B. & Kim, W.G. 2004. Measuring customer-based restaurant brand equity.
Cornell hotel and restaurant administration quarterly, 45(2):115 - 131.
Kim, H.B. & Kim, W.G. 2005. The relationship between brand equity and firms’
performance in luxury hotels and chain restaurants. Tourism management, 26(2):549-
560.
Klenosky, D.B. & Gitelson, R.E. 1997. Characteristics of effective tourism promotion
strategies. Annals of tourism research, 24(1):235-238.
Kotler, P. 2000. Marketing management millennium edition. New York: Prentice-Hall.
Kotler, P. & Amstrong, G. 1999. Principles of marketing. New York: Prentice-Hall.
Kotler, P. & Amstrong, G. 2006. Principles of marketing. 5th ed. New York: Prentice-Hall.
Kotler, P. & Armstrong, G. 2010. Principles of marketing: Global and Southern African
perspectives. Cape Town: Pearson Education.
Kotler, P., Bowen, J. & Makens, J. 2003. Marketing for hospitality and tourism. 3rd ed.
New York: Prentice-Hall.
Kotler, P., Bowen, J. & Makens, J. 2006. Marketing for hospitality and tourism. 4th ed.
New York: Prentice-Hall.
Kotler, P., Bowen, J. & Makens, J. 2010. Marketing for hospitality and tourism. 5th ed.
New Jersey: Prentice-Hall.
Kotler, P. & Gertner. D. 2002. Country as brand, product and beyond: A place marketing
and brand management perspective. Brand management (special issue: nation
branding), 9 (4-5): 149-61.
A conceptual instrument to measure the success of branding in the tourism industry 262
Kotler, P. & Keller, K.L. 2006. Marketing management. 12th ed. New Jersey: Prentice-
Hall.
Kotler, P. & Keller, K.L. 2007. A framework for marketing management. 3rd ed. New
Jersey: Prentice-Hall.
Konecnik, M. & Gartner, W.C. 2006. Customer-based brand equity for a destination.
Annals of tourism research, 34(2):400-421.
Konecnik, M. & Go, F. 2008. Tourism destination brand identity: The case of Slovenia.
Brand management, 15(3):177-189.
Kumar, R. 2011. Research methodology: A step by step guide for beginners. 3rd ed.
Sage: London.
Kuzwayo, M. 2000. Marketing theory through mud and dust. Cape Town: Ink Inc.
L
Lamb, C.W., Hair, J.F., McDaniel, C., Boshoff, C. & Terblanche, N.S. 2004. Marketing.
2nd ed. Cape Town: Oxford University Press.
Lamb, C.W., Hair, J.F. & McDaniel, C. 2005. Essentials of marketing. 4th ed. London:
Thomson Learning.
Lamb, C.W., Hair, J.F. & McDaniel, C. 2006. Marketing. 8th ed. London: Thomson
Learning.
Lancaster, G. & Reynolds, P. 2002. Marketing made simple. London: Oxford.
Laws, E. 1997. Tourism marketing. London: Stanley Thorns Publishers.
Laws, E. 2002. Tourism marketing: Quality and service management perspectives.
London: Continuum.

A conceptual instrument to measure the success of branding in the tourism industry 263
Lee, J.S. & Back, K.I. 2007. Attendee-based brand equity. Tourism management,
29(2):331-344.
Lee, M. & Johnson, C. 2005. Principles of advertising. 2nd ed. New York: Haworth
Press.
Leedy, P.D. & Ormrod, J.E. 2010. Practical research: Planning and design. 9th ed. New
York: Pearson Education International.
Lindstorm, M. 2005. Brand sense: Building powerful brands through touch, taste, smell,
sight and sound. New York: Free Press.
Lovelock, D. 2001. Service marketing: People, technology & strategy. 4th ed. New
Jersey: Prentice-Hall.
Lozito, W. 2005. Developing a brand name. http://www.namedevelopment.com Date of
access: 24 August 2007.
Lubbe, B.A. 2003. Tourism management in South Africa. Cape Town: Pearson.
M
Machado, R. & Cassim, S. 2002. Marketing for entrepreneurs. Cape Town: Juta & Co.
Ltd.
Malhotra, N.K. & Birks, D.F. 2006. Marketing research: An applied approach. 2nd ed.
London: Pearson Prentice Hall.
Malhotra, N.K. & Petterson, M. 2006. Basic marketing research. 2nd ed. New Jersey:
Pearson Prentice-Hall.
Marzano, G. & Scott, N. 2009. Power in destination branding. Annals of tourism
research, 36(1):247-267.
Mawson, S. 2000. The fundamentals of hospitality marketing. London: Continuum.

A conceptual instrument to measure the success of branding in the tourism industry 264
McCabe, S. 2009. Marketing communications in tourism and hospitality. New York:
Butterworth-Heinemann.
McDaniel, C. & Gates, R. 2005. Marketing research essentials. 5th ed. New York: John
Wiley & Sons.
McDaniel, C. & Gates, R. 2006. Marketing research essentials. 6th ed. New York: John
Wiley & Sons.
McDaniel, C. & Gates, R. 2010. Marketing research essentials. 7th ed. New York: John
Wiley & Sons.
McDaniel, C., Lamb, C.W. & Hair, J.F. 2009. Introduction to marketing. 10th ed. Japan:
Cengage Learning.
Middleton, T.C. 2001. Marketing in travel & tourism. 3rd ed. London: Butterworth-
Heinemann.
Middleton, T.C. & Clarke, J. 2001. Marketing in travel & tourism. 4th ed. Oxford:
Butterworth-Heinemann.
McEwen, W.J. 2005. Married to the brand. New York: Gallup Press.
Morgan, N., Pritchard, A. & Pride, R. 2002. Destination branding: Creating the unique
destination proposition. Oxford: Butterworth-Heinemann.
Morrison, A.M. 2002. Hospitality and travel marketing, 3rd ed. Delmar: Thomson
Learning.
Morrison, A.M. 2010. Hospitality and travel marketing, 4th ed. London: Cengage
Learning.
Murphy, L., Moscardo, G. & Benckendorff, P. 2007. Using brand personality to
differentiate regional tourism destinations. Journal of travel research, 46(8):5-14.

A conceptual instrument to measure the success of branding in the tourism industry 265
Moser, M. 2003. United we brand. Boston: Harvard Business School Publishing.
P
Page, S. 2007. Tourism management: Managing for change. 2nd ed. Oxford:
Butterworth-Heinemann.
Page, S. & Connell, J. 2009. Tourism: A modern synthesis. 3rd ed. London: Thomson
Learning.
Palmer, A. 2005. Principles of service marketing. 4th ed. Berkshire: McGraw-Hill.
Patton, M.Q. 2002. Qualitative research and evaluation methods. 3rd ed. Thousand
Oaks, CA: Sage.
Perreault, W.D. & McCarthy, E.J. 2003. Essentials of marketing. New York: McGraw-
Hill.
Pike, S. 2002. Destination image analysis: A review of 142 papers from 1973-2000.
Tourism management, 22(3/4):67-78.
Pike, S. 2009. Destination brand positions of a competitive set of near home
destinations. Tourism management, 1(10):1-3.
Rix, P. 2004. Marketing: A practical approach. North Ryde: McGraw-Hill.
Plog, S.C. 2004. Leisure travel. New Jersey: Prentice-Hall.
Price, L.L., Arnould, E.J. & Zinkhan, G.M. 2009. Consumers. New York: McGraw-Hill.
Pritchard, G. 1982. Tourism promotion: Big business for the States. The Cornell hotel
and restaurant administration quarterly, 23(2):48-57.
Q

A conceptual instrument to measure the success of branding in the tourism industry 266
Qu, H., Kim, L.H. & Im, H.H. 2010. A model of destination branding: Integrating the
concepts of the branding and destination image. Tourism management, 32(2011):465-
476.
R
Rao, K.R.M. 2007. Service marketing. New Delhi: Pearson Education.
Reich, A.Z. 1997. Improving the effectiveness of destination positioning. Tourism
analysis, 2(3):37-53.
Reid, R.D. & Bojanic, D.C. 2001. Hospitality marketing management. 3rd ed. London:
John Wiley & Sons.
Richardson, J. & Cohen, J. 1993. State slogans: The case of the missing USP. Journal
of travel & tourism marketing, 2(2/3):91-109.
Riesenbeck, H. & Perrey, J. 2007. Power brands. London: John Wiley & Sons.
Robinson, M. & Novelli, M. 2005. Niche tourism: Contemporary issues, trends and
cases. Oxford: Butterworth-Heinemann.
Robson, C. 2002. Real world research. 2nd ed. Oxford: Blackwell.
Roe, M. 2004. Market research in action. London: Thomson Learning.
S
Saayman, M. 2002. Hospitality, leisure & tourism management. Potchefstroom: Ons
Drukkers.
Salzberger, T. 2009. Measurement in marketing research. Cheltenham, UK: Edward
Elgar.
Saunders, M., Lewis, P. & Thornhill, A. 2009. Research methods for business students.
5th ed. London: Prentice Hall.

A conceptual instrument to measure the success of branding in the tourism industry 267
Saxena, R. 2007. Marketing management. 4th ed. New Delhi: Tata McGraw-Hill.
Seaton, A.V. & Bennett, M.M. 2001. Marketing tourism products. London: Thomson.
Sherrington, M. 2006. Added value. New York: Palgrave.
Shimp, T.A. 2007. Advertising and promotion. 7th ed. New York: Thomson Learning.
Shimp, T.A. 2010. Advertising, promotion and other aspects of integrated marketing
communications. 8th ed. Mason, OH: Cengage Learning.
Shui, E., Hair, J., Bush, B. & Ortinau, D. 2009. Marketing research. New York: McGraw-
Hill.
Smith, S.L.J. 2010. Practical tourism research. Cambridge: Cambridge University Press.
Smith, S. 2012. How to measure customer satisfaction: Do you overlook these 4 key
customer satisfaction measurements? http://www.qualtrics.com/blog/customer-
satisfaction-measurement. pdf. Date of access: 9 July 2013.
Smith, C. & Allexander, H. 2006. Marketing for dummies. Chichester, Sussex: John
Wiley & Sons.
Srivastava, R.P. 2000. Tourists’ expenditure: Development planning unit, ministry of
France, government of the British Virgin Islands.
http://www.dup.gov.vg/Archives/Archives99/doc/TouristsExp.doc Date of access: 27
March 2008.
Stokes, D. & Lomax, W. 2008. Marketing: A brief introduction. London: Thomson
Learning.
Strydom, J. 2004. Introduction to marketing. Cape Town: Juta.
A conceptual instrument to measure the success of branding in the tourism industry 268
Stutely, M. 2003. Numbers guide: The essentials of business numeracy. London:
Bloomberg Press.
Swarbrooke, J. & Horner, S. 2007. Consumer behaviour in tourism. 2nd ed. Oxford:
Butterworth-Heinemann.
T
Tasci, W., Gartner, W.C. & Cavusgil, S.T. 2007. Measurement of destination brand bias
using a quasi-experimental design. Tourism management, 28(2):1529-1540.
Tassiopoulos, D. 2004. Event management: A professional and developmental
approach. 2nd ed. Cape Town: Juta & Co Ltd.
Tobak, S. 2011. Myths about branding. http://www.cbsnews.com/8301-505125162-
57328226/tenmythsbranding.doc Date of access: 26 January 2010.
Tores, A. & Bijmolt, T.H.A. 2008. Assessing brand image through communalities and
asymmetries in brand-to-attribute and attribute-to-brand associations. European journal
of operational research, 195(2):628-640.
Trump, D. 2007. Ten Commandments of a successful brand.
http://www.trumpuniversity.com Date of access: 7 July 2007.
Tybout, A.M. & Calkins, T. 2005. Kellogg on branding. New Jersey: John Wiley & Sons.
V
Van Auken, B. 2005. The brand management checklist. London: Kogan Page.
Van Gelder, S. 2003. Global brand strategy: Unlocking brand potential across countries,
cultures and markets. London: Koran Page.
Van Vuuren, C. & Slabbert, E. 2011. Travel motivations and behaviour of tourists to a
South African resort. Paper presented at the International Conference on Tourism and

A conceptual instrument to measure the success of branding in the tourism industry 269
Management Sciences, Algarve, 25 November. http://www.tmstudies.net Date of
access: 3 October 2015.
Veal, A.J. 2006. Research methods for leisure and tourism: A practical guide. London:
Prentice-Hall.
W
Webb, J.R. 2002. Understanding and designing marketing research. 2nd ed. London:
Thomson Learning.
West, D., Ford, J. & Ibrahim, E. 2006. Strategic marketing: Creating competitive
advantage. New York: Oxford University Press.
Wiid, J. & Diggines, C. 2009. Marketing research. Cape Town: Juta and Company Ltd.
Wood, L. 2002. Brands and brand equity. Journal of general management, 38(9):226-
269.
Woodside, A.G. 1982. Positioning a province using travel research. Journal of travel
research, 36(7):2-6.
Y
Yeoman, I., Durie, A., Beattie, U.M. & Palmer, A. 2005. Capturing the essence of a
brand from its history: The case of Scottish tourism marketing. Brand management,
13(2):134-147.
Yeshin, T. 2006. Sales promotion. London: Thomson Learning.
Yin, R.K. 2003. Case study research: Design and method. 3rd ed. London: Sage.
Yoo, B. & Donthu, N. 2001. Developing and validating a multidimensional consumer
based brand equity scale. Journal of business research, 52(2):1-14.
Z

A conceptual instrument to measure the success of branding in the tourism industry 270
Zeithami, V.A. & Bitner, M.J. 2003. Service marketing. 3rd ed. New York: McGraw-Hill.
Zikmund, W.G. & Babin, B.J. 2010. Essentials of marketing research. 4th ed. Mason,
OH: Cengage Learning.

A conceptual instrument to measure the success of branding in the tourism industry 271
Addendum A

1. What language do you mainly speak at home?
2. In what province do you currently live?
3. If not in South Africa, please specify your country of residents?
4. What is your gender?
5. What is your age?
6. What is the highest level of education you have completed?
Demographic information
*
*
55
66
*
*
*
Afrikaans
nmlkj
English
nmlkj
Swazi
nmlkj
Xhoza
nmlkj
Venda
nmlkj
Ndebele
nmlkj
Tswana
nmlkj
Tsonga
nmlkj
Northern Sotho
nmlkj
Southern Sotho
nmlkj
Zulu
nmlkj
Portuguese
nmlkj
French
nmlkj
German
nmlkj
Other (please specify)
Gauteng
nmlkj
Limpopo
nmlkj
Mpumalanga
nmlkj
KwazuluNatal
nmlkj
Eastern Cape
nmlkj
Western Cape
nmlkj
Northern Cape
nmlkj
North West
nmlkj
Free State
nmlkj
I do not live in South Africa
nmlkj
Female
nmlkj
Male
nmlkj
younger than 17
nmlkj
18 20
nmlkj
21 29
nmlkj
30 39
nmlkj
40 49
nmlkj
50 59
nmlkj
60 +
nmlkj
No matric
nmlkj
Matric
nmlkj
Diploma / Degree
nmlkj
Post graduate
nmlkj
Other (please specify)

7. What is your marital status?
8. How many children are age 18 or younger and live in your household?
9. How many of the above indicated children are age 12 18?
10. How many people (adults + children) currenly live in your household?
*
*
*
*
Single
nmlkj
Married
nmlkj
Widow / widowed
nmlkj
Divorced
nmlkj
Living together
nmlkj
None
nmlkj
1
nmlkj
2
nmlkj
3
nmlkj
4
nmlkj
More than 4
nmlkj
None
nmlkj
1
nmlkj
2
nmlkj
3
nmlkj
4
nmlkj
More than 4
nmlkj
1
nmlkj
2
nmlkj
3
nmlkj
4
nmlkj
5
nmlkj
6 and more
nmlkj

11. What is your favorite holiday resort in South Africa?
Awareness
55
66

12. To what extent do you agree with the following statements regarding FOREVER as a brand:
13. What is the first word that comes to mind when seeing the FOREVER brand?
14. What characteristic/s of the FOREVER brand, makes it recognisable?
*Totally agree Agree Unknown Disagree Totally disagree
"I am aware of this brand" nmlkj nmlkj nmlkj nmlkj nmlkj
"I can remember what this brand represents"
nmlkj nmlkj nmlkj nmlkj nmlkj
"I have noticed marketing campaigns linked to this brand"
nmlkj nmlkj nmlkj nmlkj nmlkj
"I know everything about this brand"
nmlkj nmlkj nmlkj nmlkj nmlkj
"I have a favourable attitude towards this brand"
nmlkj nmlkj nmlkj nmlkj nmlkj
"This brand brings pleasant memories to me"
nmlkj nmlkj nmlkj nmlkj nmlkj
"Overall I am satisfied with products / services associated with this brand"
nmlkj nmlkj nmlkj nmlkj nmlkj
"I would recommend this brand to friends and family"
nmlkj nmlkj nmlkj nmlkj nmlkj
55
66
*55
66

15. What aspect/s of the FOREVER brand appeals to you?
16. What makes the FOREVER brand more recognisable than other competing brands you are familiar with?
17. How often have you seen the FOREVER brand in the past month?
*55
66
*
55
66
*
Not once
nmlkj
Once
nmlkj
Twice
nmlkj
Three times
nmlkj
More than three times
nmlkj

18. How many times, during the past 12 months, did you make use of services linked to the FOREVER brand?
19. To what extent do you agree with the following statements regarding FOREVER as a brand:
Usage & Satisfaction
*
*Totally agree Agree Unknown Disagree Totally disagree
"Offers value for money" nmlkj nmlkj nmlkj nmlkj nmlkj
"Delivers what was promised"
nmlkj nmlkj nmlkj nmlkj nmlkj
"Use healthy business ethics"
nmlkj nmlkj nmlkj nmlkj nmlkj
"Is attractive" nmlkj nmlkj nmlkj nmlkj nmlkj
"Captures essence of tourism product / service"
nmlkj nmlkj nmlkj nmlkj nmlkj
"Is associated with high levels of service"
nmlkj nmlkj nmlkj nmlkj nmlkj
"Is associated with good quality products"
nmlkj nmlkj nmlkj nmlkj nmlkj
"Is associated with integrity"
nmlkj nmlkj nmlkj nmlkj nmlkj
"Is easy to distinguish from competing brands"
nmlkj nmlkj nmlkj nmlkj nmlkj
"Is associated with a proud history of the tourism product / service"
nmlkj nmlkj nmlkj nmlkj nmlkj
"Is much talked about" nmlkj nmlkj nmlkj nmlkj nmlkj
"I will make use of the indicated brand in the next 12 months"
nmlkj nmlkj nmlkj nmlkj nmlkj
Not once
nmlkj
Once
nmlkj
Twice
nmlkj
Three times
nmlkj
More than three times
nmlkj
Do not know
nmlkj

20. To what extent do you agree with the following statements regarding FOREVER as a brand:
21. When you consider using services associated with the FOREVER brand, what aspects may influence your decision?
*Totally agree Agree Unknown Disagree Totally disagree
"Is innovative" nmlkj nmlkj nmlkj nmlkj nmlkj
"Is highly visible" nmlkj nmlkj nmlkj nmlkj nmlkj
"Is easily recognisable" nmlkj nmlkj nmlkj nmlkj nmlkj
"Is credible" nmlkj nmlkj nmlkj nmlkj nmlkj
"Is well established as a tourism brand"
nmlkj nmlkj nmlkj nmlkj nmlkj
"Is relevant to the tourism product / service it represents"
nmlkj nmlkj nmlkj nmlkj nmlkj
"Is creative" nmlkj nmlkj nmlkj nmlkj nmlkj
"Is proudly South African" nmlkj nmlkj nmlkj nmlkj nmlkj
"Portrays value for money" nmlkj nmlkj nmlkj nmlkj nmlkj
"Portrays a good image" nmlkj nmlkj nmlkj nmlkj nmlkj
"Portrays reliability" nmlkj nmlkj nmlkj nmlkj nmlkj
55
66

22. What does the term "brand loyalty" mean to you?
23. To what extent do you agree with the following statements regarding FOREVER as a brand:
Loyalty
55
66
*Totally agree Agree Unknown Disagree Totally disagree
"I am loyal to it" nmlkj nmlkj nmlkj nmlkj nmlkj
"I rely on it" nmlkj nmlkj nmlkj nmlkj nmlkj
"I trust it" nmlkj nmlkj nmlkj nmlkj nmlkj
"It is important to me when considering a break away / holiday"
nmlkj nmlkj nmlkj nmlkj nmlkj
"It will influence my decision to purchase"
nmlkj nmlkj nmlkj nmlkj nmlkj
"The public image of it will influence my purchase decision"
nmlkj nmlkj nmlkj nmlkj nmlkj
"If it would change in future, I would still make use of it"
nmlkj nmlkj nmlkj nmlkj nmlkj
"If it would change in future, I would not make use of it anymore"
nmlkj nmlkj nmlkj nmlkj nmlkj

24. What will you do if the service you requested from the FOREVER brand, are not avialable?
25. To what extent do you agree with the following statements; "I would switch brands if alternative brands:"
26. Are there any other reasons why you would be willing to switch brands?
*
*Totally agree Agree Unknown Disagree Totally disagree
offer a similar service? nmlkj nmlkj nmlkj nmlkj nmlkj
offer better quality? nmlkj nmlkj nmlkj nmlkj nmlkj
are more effective? nmlkj nmlkj nmlkj nmlkj nmlkj
are sold in a more convenient location / way eg. internet bookings?
nmlkj nmlkj nmlkj nmlkj nmlkj
had a more popular image?
nmlkj nmlkj nmlkj nmlkj nmlkj
are sold at a better price? nmlkj nmlkj nmlkj nmlkj nmlkj
will better satisfy you needs?
nmlkj nmlkj nmlkj nmlkj nmlkj
55
66
Enquire about availabililty for another time
nmlkj
Enquire about availability at another outlet of the same brand
nmlkj
Delay purchase till next time, but still use the same brand
nmlkj
Enquire from a competing brand
nmlkj
Purchase from a competing brand
nmlkj
None of the above
nmlkj

27. To what extent do you agree with the following statements regarding FOREVER as a brand:
28. To stand a chance to win on of the three holiday breaks with Forever, please provide us with a contact number?
Experience
*Totally agree Agree Unknown Disagree Totally disagree
"It makes a strong visual impression"
nmlkj nmlkj nmlkj nmlkj nmlkj
"I find it interesting in a sensory way"
nmlkj nmlkj nmlkj nmlkj nmlkj
"It does not appeal to my senses"
nmlkj nmlkj nmlkj nmlkj nmlkj
"It induces feelings and sentiments"
nmlkj nmlkj nmlkj nmlkj nmlkj
"I do not have strong emotions for it"
nmlkj nmlkj nmlkj nmlkj nmlkj
"I have an emotional connection with it"
nmlkj nmlkj nmlkj nmlkj nmlkj
"I engage in physical actions and behaviours when I use it"
nmlkj nmlkj nmlkj nmlkj nmlkj
"It results in bodily experiences"
nmlkj nmlkj nmlkj nmlkj nmlkj
"It is not action oriented" nmlkj nmlkj nmlkj nmlkj nmlkj
"I engage in alot of thinking when I encounter it"
nmlkj nmlkj nmlkj nmlkj nmlkj
"It stimulates my curiosity and problem solving"
nmlkj nmlkj nmlkj nmlkj nmlkj
Top Related