![[FI1] BANKING & INVESTMENT: COMPARATIVE PERSPECTIVES ...](https://static.fdocuments.in/doc/165x107/61e317045f30d403773e0273/fi1-banking-amp-investment-comparative-perspectives-.jpg)


Languages
Pages
Legal

M. L Ranjini, K. R Mahesh Kumar, International Journal of Advance Research, Ideas and Innovations in Technology.
© 2017, www.IJARIIT.com All Rights Reserved Page | 667
ISSN: 2454-132X
Impact factor: 4.295 (Volume 3, Issue 6)
Available online at www.ijariit.com
A Comparative Study on E–Banking Services at Bangalore City
Ranjini M L Research Scholar
Jain University, Bengaluru, Karnataka
Dr. Mahesh Kumar K R Research Guide
Director, Community Institute of Management Studies,
Bengaluru, Karnataka
Abstract: Technology in Indian banking has evolved substantially from the days of back office automation to today's online,
centralized and integrated solutions. Banking is now no longer confined to the branches where one has to approach the
branch in person, to withdraw cash or deposit a cheque or request a statement of accounts. With the expansion of internet
usage, e-banking has become one of the most revolutionized components of today’s economic growth. E-banking is powerful
value added tool to attract new customers and retain the existing ones. With the proliferation of internet and computer usage,
the electronic delivery of e-banking service has become ideal for banks to meet customer expectations.
Keywords: Indian Banking, Customers, Online, Economic Growth.
REVIEW OF LITERATURE
R. C. Dangwal, Kailash Sakalani and Swate Anand, 2010.
Dangwal R. C., Kailash Sakalani and Swate Anand, the upcoming Technology and the associated innovations, by Pg.26,
Professional banker. January 2010. The ICFAI University Press.
Technology has become the engine for triggering rapid change. It is no longer considered merely for transaction processing or
confined to management information systems. It implies the integration of information system with the communication
technology and of innovative application to product manufacturing, design and control. With the development of technology, the
world has become a global village and ushered in a revolution in the banking industry.
Servon and Kaestner, (2008).
Servon, L.J. and Kaestner, R. (2008) ‘Consumer financial literacy and the impact of online .Internet banking is changing the
banking industry and is having the major effects on banking relationships. Banking is now no longer confined to the branches
were one has to approach the branch in person, to withdraw cash or deposit a cheque or request a statement of accounts. E-
banking technologies have proliferated in recent years, and the availability of a wide range of products has led to increasing
adoption among consumers. These technologies include direct deposit, computer banking, stored value cards, and debit cards
P. George, Dr. S. Mercia Selva Malar, Mr. Sudheendran 2009
Filomina P. George, Dr. S. Mercia Selva Malar, M. Sudheendran, Technology enhanced service – scape commercial banks
in India, Pg.39, August 2009, professional banker. The ICFAI University press.]
Internet banking (IB) is a radical technological innovation with potential to change the structure and nature of banking. To
sustain business competitiveness, more and more banks are transforming from their traditional.
Miranda-Petronella, (2009)
Miranda-Petronella, E-banking-Modern Banking Services, Economic Science Series, 2009, Vol. 18 Issue 4, p1093-1096.
M. L Ranjini, K. R Mahesh Kumar, International Journal of Advance Research, Ideas and Innovations in Technology.
© 2017, www.IJARIIT.com All Rights Reserved Page | 668
E-banking is the first of those banking services that really economize time, because it allows to the user to accomplish from behind
the computer many operations in the bank account, represents the computational solution that allows to the holder to have access at
distance at the capitals from his account, purposing to obtain information about his account situation and the situation of the effected
operations, of the payment and of the capitals transfers over a beneficiary, by a computational application, of a authentication
method and of a communicational average, the e-banking is absolutely necessary in the integration conditions. Technology
enhances Commercial Bank’s ability to deliver financial services in new and innovative ways.
Cristina, Beatrice, (2008)
Cristina, Titrade; Beatrice, E-Banking-Impact, Risks, Security, Economic Science Series, 2008, Vol. 17 Issue 4, p1537-1542
The evolution of electronic banking (e- banking) started with the use of automatic teller machines (ATMs) and has included
telephone banking, direct bill payment, electronic fund transfer and online banking.
(Saleh and Andrea, 2002)
Saleh and Anderea 2002 challenges of the e-banking revolution, a quarterly magazine of international monetory fund (IMF), vol.
39, no.3, pp 34-56.
E-banking has been around for some time in the form of automated teller machine and telephone transactions. More recently, it has
been transformed by the internet – a new delivery channel that is fast, convenient, available round the clock, and from whatever the
customer’s location.
(Rose and Hudgins, 2005)
Rose, P.S. and Hudgins, S.C. (2005) Bank Management and Financial Services, New York: McGraw-Hill Irwin.
The use of paper cheque has been supplemented step-by-step with e- cheque (i.e., electronic images) allowing banks to have more
storage capacity, reduce costs, and improve customer services
STATEMENT OF PROBLEM
The government is launching many new programs in the country which are suitable to people’s community in order to meet the
objective of country’s development. One such program is launching of e-banking services. As the e- banking services have started
flourishing in the district in the past few years, the banking organizations have to meet the competition among the banking sector.
Al. Hawari .M and W. Tony 2006) The effect of automated service quality on Australian banks financial performance and the
mediating role of customer satisfaction. Market intelligence planning vol.24, pp 127-147
Durkin, M. (2007) ‘On the role of bank staff in online customer purchase’, Marketing Intelligence & Planning Journal, Vol. 25,
No. 1, pp.82–97.
Hence they are forced to do the various forms of e –banking services. It is very important in the point of view of the banks to have
a study about the opinion and satisfaction of the customers. So the purpose of the research is to study the views of the customers in
using the e-banking services. This study is conducted in selective nationalized and private commercial banks in Bangalore City.
The respondents of the study were the customers of the banks using various e-banking services. (ATM/Debit card, credit card,
online banking, mobile banking and Tele banking). Therefore the researcher will be identified the research area to find the geniuses
of e-banking and it will be found to be important to have a comparison between the nationalized banks and private banks. Therefore
an attempt will make by the researcher to have a comparative study between the nationalized banks and the private banks on the
basis of opinions of customers.
SCOPE OF THE STUDY
The research is based on the customers’ perception regarding e-banking services. The research will be discusses the opinion of the
customers regarding the e- banking services provided by the selected banks and the qualities of the e- banking services in the area
of reliability, responsiveness, security, easy use, accessibility and efficiency. Also the research will be analyses the problems faced
by the customers while using the e-banking services. The research will be evaluates the relationship between the activities
undertaken through e-banking services by the customers, the qualities of e-banking services and the problems of e-banking services.
The researcher will be taken ATM/debit card, credit card, mobile banking, online banking and Tele banking as the e-banking
services which the customer uses for various modes of services like mobile recharge, payment of telephone bill, payment of electric
bill, money transfer, railway ticket booking, air ticket booking, filing of tax returns , investments etc.). The researcher will be also
analyses the problems faced by the customers while dealing with the e-banking services.

M. L Ranjini, K. R Mahesh Kumar, International Journal of Advance Research, Ideas and Innovations in Technology.
© 2017, www.IJARIIT.com All Rights Reserved Page | 669
OBJECTIVES
1. To study the nature of e-banking services provided by the selected nationalized and private commercial banks in
Bangalore City.
2. To evaluate, analyze and compare the opinions and satisfaction level of customers of e-banking services provided by the
selected nationalized and private banks in Bangalore City.
3. To understand and compare the problems faced by the customers of nationalized and private commercial banks in using
e-banking services.
4. To offer suggestions to improve the e-banking customer services.
HYPOTHESIS
1. There will be a significant difference between nationalized banks and private banks of the respondents and the e-
banking services.
2. There will be a significant difference between nationalized banks and private banks of the respondents and the problems
of e-banking services.
3. There will be a significant difference between age, gender, occupation, education, monthly income of the respondents
and the qualities of overall e-banking services.
4. There will be a significant difference between account access through internet of the respondents and the qualities of
overall e-banking services.
5. There will be a significant relationship between nature of services like ATM/debit card, Credit card, Mobile banking,
online banking and Tele- banking of the respondents and their overall e-banking services.
6. There will be a significant relationship between various modes of services( mobile recharge, payment of telephone bill,
payment of electric bill, money transfer, railway ticket booking, air ticket booking, filing of tax returns , investments
and others) of the respondents and their overall e- banking services.
7. There will be a significant relationship between various modes of services( mobile recharge, payment of telephone bill,
payment of electric bill, money transfer, railway ticket booking, air ticket booking, filing of tax returns ,
investments and others) of the respondents and their various problems of e-banking.
METHODOLOGY
TYPE OF RESEARCH AND SAMPLING METHOD
The customers who are making use of the electronic banking services provided by nationalized and private banks in Bangalore City
constitute the universe. Since the study are comparative study on E-banking services among the banks, the total commercial banks
are classified into two namely, nationalized banks and private banks. The researcher will be randomly selecting two nationalized
banks and two private banks from among the banks which are popularly known for e-banking services.
State bank of India and Bank of Baroda, will be banks selected from the nationalized category. ICICI Bank and HDFC Bank will
be selected from private bank sector. The nature of study will be the combination of comparative and exploratory study.
SAMPLING SIZE
The researcher has identified and has selected for sample respondents who will be provided e-banking services by the selected
nationalized and private banks not exceeding 48 number from each of the nationalized bank category and private bank category
under simple random sampling technique. Therefore sample size may be 192.
STATISTICAL METHODS USED FOR ANALYZING THE DATA
Analysis of the study has done with the help of the relevant statistical tools like Kruskal-Wallis test, Mann Whitney test, Chi square
test, T-test, Correlation Analysis, One way Anova & Inter Correlation Matrix Analysis.
Sample Size Calculation
Margin of Error: 5%
Confidence Level: 95%
Population Size: 947169 As per BBMP South Zone of Bangalore City
Response Distribution: 50%
Answer will be: 384 response
=384/4 = 96 response for each bank
Here 4 means = 4 banks equally distribution
For Pre Test the Sample Size will be = 96 response divided by 50% =96*50/100 = 48
Answer will be = 48 response from each bank chosen for research work
M. L Ranjini, K. R Mahesh Kumar, International Journal of Advance Research, Ideas and Innovations in Technology.
© 2017, www.IJARIIT.com All Rights Reserved Page | 670
RESEARCH DESIGN
Sl.no
Name of banks
Nature of bank
National (n=96) Private
(n=96)
1 State Bank of India 48 0
2 Bank of Baroda 48 0
3 HDFC Bank 0 48
4 ICICI Bank 0 48
LIMITATION OF THE STUDY
The study will be restricted to the customers’ perspectives. Therefore it does not cover any performance appraisal or opinion on e-
banking services from bankers’ perspective. The results of the study cannot be substantiated to other areas of the state and
country.
ANALYSIS AND INTERPRETATION OF DATA
This chapter deals with the descriptive and statistical analysis of primary data collected with regard to e-banking services, qualities
of e-banking services and problems perceived by the respondents of 04 different banks doing e- banking services. The hypotheses
framed by the researcher are tested with the help of statistical tools and results are interpreted. Five points scale have been used in
the analysis with the following options;
VS – Very Satisfied S – Satisfied N – Neutral DS – Dissatisfied VS –
Very Dissatisfied
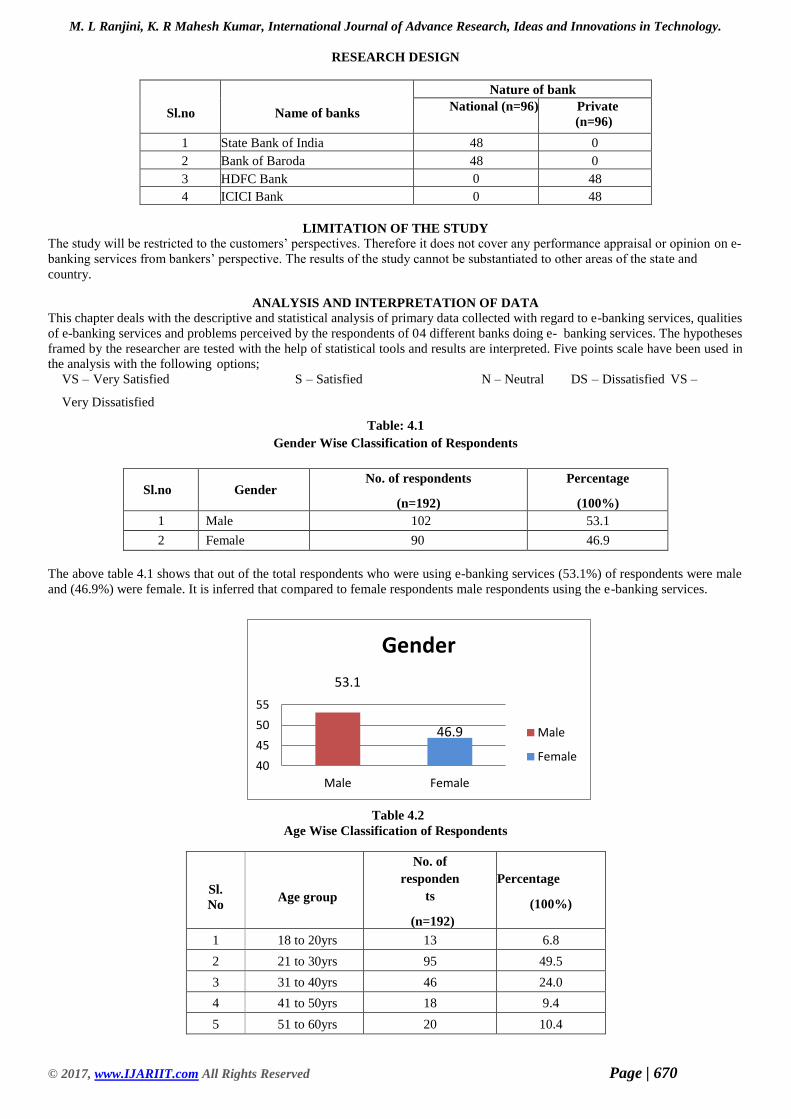
Table: 4.1
Gender Wise Classification of Respondents
Sl.no Gender No. of respondents
(n=192)
Percentage
(100%)
1 Male 102 53.1
2 Female 90 46.9
The above table 4.1 shows that out of the total respondents who were using e-banking services (53.1%) of respondents were male
and (46.9%) were female. It is inferred that compared to female respondents male respondents using the e-banking services.
Table 4.2
Age Wise Classification of Respondents
Sl.
No Age group
No. of
responden
ts
(n=192)
Percentage
(100%)
1 18 to 20yrs 13 6.8
2 21 to 30yrs 95 49.5
3 31 to 40yrs 46 24.0
4 41 to 50yrs 18 9.4
5 51 to 60yrs 20 10.4
40
45
50
55
Male Female
Gender
Male
Female
53.1
46.9

M. L Ranjini, K. R Mahesh Kumar, International Journal of Advance Research, Ideas and Innovations in Technology.
© 2017, www.IJARIIT.com All Rights Reserved Page | 671
The above table 4.2 shows that out of the total respondents using e-banking services a vast majority (49.5 %) of respondents belong
to the age group between 21 to 30 years. Exactly one fourth (24.0%) of the respondents belong to the age group of 31 to 40 years.
Nearly (10.4%) of the respondents belong to the age group of 51 to 60 years, 9.4 % of the respondents belong to the age group of
41 - 50 years and above and 6.8 percent of the respondents belong to below 18 - 20 years age group. It is inferred that maximum no
of respondents belonging to the age group of 21 to 30 years are using the e- banking services.
Table 4.3
Occupation Wise Classification of Respondents
Sl.n
o Occupation
No of
respondents
(n=192)
Percentag
e
(100%)
1 Student 20 10.4
2 Salaried 107 55.7
3 Businessman 26 13.5
4 Professional 37 19.3
5 Others 2 1.0
The table 4.3 shows that out of the total respondents using e-banking services a maximum (55.7%) of respondents belong to salaried
class, 19.3 percent are professional group, 13.5 percent of respondents are businessmen. 10.4 percent are Student and 1.0 percent
belong to other occupational group. It is inferred that e-banking services mostly been utilized by salaried class people.
Awareness level of e-banking services next prevails with professionals. 13.5 percent of respondents are from Businessman using e-
banking services and 10.4 and 1.0 percent of respondents who are using e-banking services are from student and other occupational
group.

M. L Ranjini, K. R Mahesh Kumar, International Journal of Advance Research, Ideas and Innovations in Technology.
© 2017, www.IJARIIT.com All Rights Reserved Page | 672
Table 4.4
Education Wise Classification of Respondents
Sl no Education No of respondents
(n=192)
Percentage
(100%)
1 Below HSC 10 5.2
2 Graduate 110 57.3
3 Postgraduate 52 27.1
4 Professional 20 10.4
5 Others 0 0
The table 4.4 indicates that among the total respondents using e-banking services 57.3 percent of respondents were Graduate 27.1
percent of respondents were postgraduate 10.4 percent of respondents were professional and 5.2 percent of respondents were below
higher secondary.
It is inferred that compared to other educational class people who have qualification of graduation utilize the e-banking
services to the maximum.
Table 4.5
Income Level Classification of Respondents (Per Annam)
Sl.no Particulars
No of
respondents
(n=192)
Percentage
(100%)
1 < 1 Lakh 8 4.2
2 2 to 4 Lakhs 76 39.6
3 5 to 7 Lakhs 59 30.7
4 8 to 10 Lakhs 24 12.5
5 10 Lakhs & above 8 4.2
6 No Income 17 8.9
Table 4.5 shows that out of the total respondents doing e-banking services a maximum (39.6 %) of respondents belong to the
monthly income group of 2 to 4 Lakhs. 30.7 percent respondents belong to 5 to 7Lakhs, 12.5 percent belong to 8 to 10Lakhs, 4.2
percent belong to < 1 Lakh and 10 Lakhs and above, 8.9 percent belong to below No income group. It is inferred that compared to
other income group people respondents belonging to the income group of 2 to 4 Lakhs are using the e-banking services to a
maximum extent.
5.2
57.3
10.4
27.1

M. L Ranjini, K. R Mahesh Kumar, International Journal of Advance Research, Ideas and Innovations in Technology.
© 2017, www.IJARIIT.com All Rights Reserved Page | 673
Table 4.6
Opinion on the Security of Financial Information Available and Managed Over Internet
Sl.no Particulars
No of
respondents
(n=192)
Percentage
(100%)
1 Very Secured 50 26.0
2 Secured 100 52.1
3 Not Sure 31 16.1
4 Unsecured 10 5.2
5 Highly Unsecured 1 .5
Out of the total number of respondents taken for analysis 26.0 percent of respondents felt very secure with their financial
information available and managed over internet. 16.1 percent of the respondents were not sure about security managed over
internet. 52.1 percent of the respondents felt secured about their financial information available and managed over internet.
5.2 percent of the respondents felt unsecured about their financial information available and managed over internet and .5
percent of the respondents felt highly unsecured. It is inferred that out of total percentage of respondents nearly 52.1 percent
of respondents felt secured with managing their financial information available and managed over internet. This indicates that
though there are many fraudulent activities over internet the steps taken by the banks in providing secured services over internet
has created confidence in respondents’ thoughts.
This part of the analysis provides the information regarding the preference of respondents in the usage of e-banking services
Table 4.7
E-banking Services Used by Respondents
Sl. No Particulars Yes No
1 ATM/ Debit card 175 (91.1%) 17 (8.9%)
2 Credit card 81 (42.2%) 111(57.8%)
3 Online banking 152 (79.2%) 40 (20.8%)
4 Mobile banking 107 (55.7%) 85 (44.3%)
5 Tele banking 37(19.3%) 155 (80.7%)
Table 4.7 shows that out of the total respondents a maximum of 91.1 percent of the respondents are using ATM/Debit card
and only 8.9 percent of the respondents are not using the ATM/Debit card. It shows the how much familiar and useful the ATM
/Debit card service is to the respondents.
The above table 4.7 depicts the very low frequency of usage of credit card by the respondents. Out of the total respondents
only 42.2 percent of the respondents are using the credit card service. 57.8 percent of the respondents are not using the service. It is
M. L Ranjini, K. R Mahesh Kumar, International Journal of Advance Research, Ideas and Innovations in Technology.
© 2017, www.IJARIIT.com All Rights Reserved Page | 674
perceived that the awareness of the benefit of credit card services have not reached the respondents of the bank.
The above table 4.7 depicts the information that out of the total percent of the respondents using e-banking services only
55.7 percent of the respondents are using the mobile banking services. 44.3 percent of the respondents are not using the mobile
banking service. it is perceived that a maximum of 55.7 percent of the respondents were using the mobile banking services and the
benefits of the services still not yet reached the respondents.
Out of total percentage of respondents using e-banking services 79.2 percent of respondents are using the online banking
services.44.3 percent of respondents are not using the online banking services. It is perceived that 79.2 percent of respondents are
aware of facilities of online banking services.
Out of total percentage of respondent using e-banking services 19.3 percent of the respondents are using the Tele banking
services. 80.7 percent of respondent did not using the Tele banking services at all. As other e-banking services played a full-
fledged role respondents were interested in the other e-banking services they did not bother to use the Tele banking services.
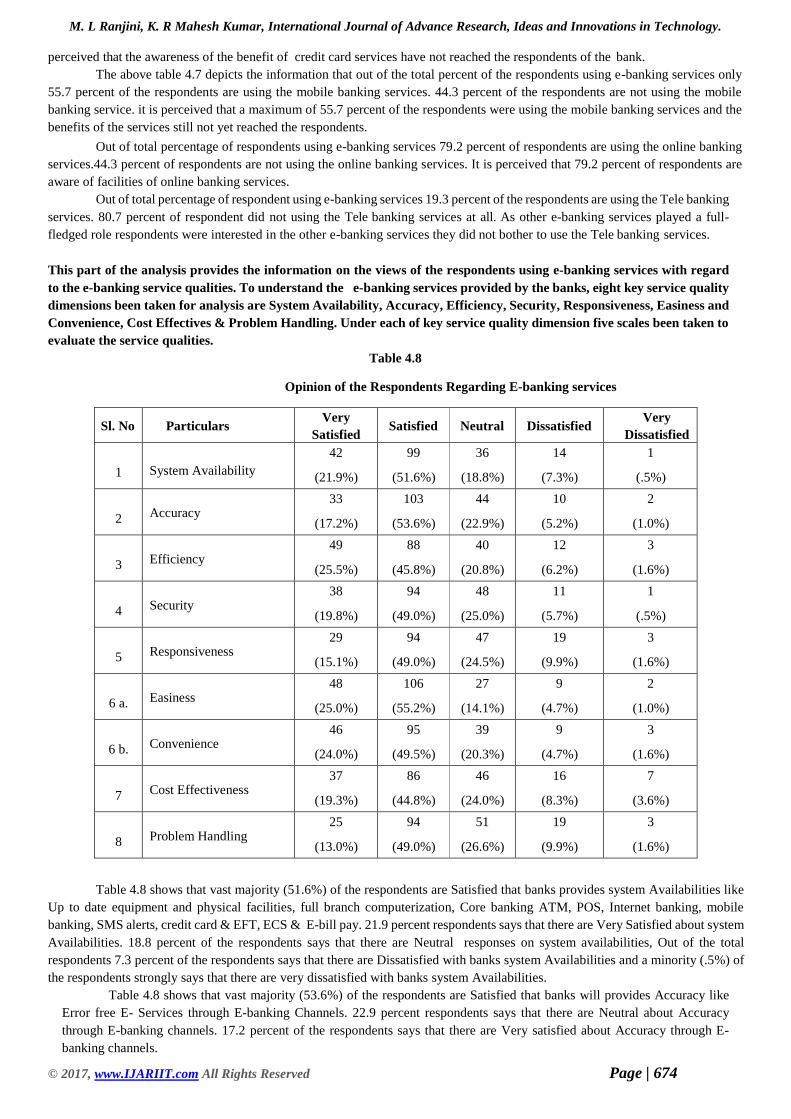
This part of the analysis provides the information on the views of the respondents using e-banking services with regard
to the e-banking service qualities. To understand the e-banking services provided by the banks, eight key service quality
dimensions been taken for analysis are System Availability, Accuracy, Efficiency, Security, Responsiveness, Easiness and
Convenience, Cost Effectives & Problem Handling. Under each of key service quality dimension five scales been taken to
evaluate the service qualities.
Table 4.8
Opinion of the Respondents Regarding E-banking services
Sl. No Particulars Very
Satisfied Satisfied Neutral Dissatisfied
Very
Dissatisfied
1 System Availability
42
(21.9%)
99
(51.6%)
36
(18.8%)
14
(7.3%)
1
(.5%)
2 Accuracy 33
(17.2%)
103
(53.6%)
44
(22.9%)
10
(5.2%)
2
(1.0%)
3 Efficiency 49
(25.5%)
88
(45.8%)
40
(20.8%)
12
(6.2%)
3
(1.6%)
4 Security 38
(19.8%)
94
(49.0%)
48
(25.0%)
11
(5.7%)
1
(.5%)
5 Responsiveness 29
(15.1%)
94
(49.0%)
47
(24.5%)
19
(9.9%)
3
(1.6%)
6 a. Easiness 48
(25.0%)
106
(55.2%)
27
(14.1%)
9
(4.7%)
2
(1.0%)
6 b. Convenience 46
(24.0%)
95
(49.5%)
39
(20.3%)
9
(4.7%)
3
(1.6%)
7 Cost Effectiveness 37
(19.3%)
86
(44.8%)
46
(24.0%)
16
(8.3%)
7
(3.6%)
8 Problem Handling 25
(13.0%)
94
(49.0%)
51
(26.6%)
19
(9.9%)
3
(1.6%)
Table 4.8 shows that vast majority (51.6%) of the respondents are Satisfied that banks provides system Availabilities like
Up to date equipment and physical facilities, full branch computerization, Core banking ATM, POS, Internet banking, mobile
banking, SMS alerts, credit card & EFT, ECS & E-bill pay. 21.9 percent respondents says that there are Very Satisfied about system
Availabilities. 18.8 percent of the respondents says that there are Neutral responses on system availabilities, Out of the total
respondents 7.3 percent of the respondents says that there are Dissatisfied with banks system Availabilities and a minority (.5%) of
the respondents strongly says that there are very dissatisfied with banks system Availabilities.
Table 4.8 shows that vast majority (53.6%) of the respondents are Satisfied that banks will provides Accuracy like
Error free E- Services through E-banking Channels. 22.9 percent respondents says that there are Neutral about Accuracy
through E-banking channels. 17.2 percent of the respondents says that there are Very satisfied about Accuracy through E-
banking channels.
M. L Ranjini, K. R Mahesh Kumar, International Journal of Advance Research, Ideas and Innovations in Technology.
© 2017, www.IJARIIT.com All Rights Reserved Page | 675
Out of the total respondents 5.2 percent of the respondents says that there are Dissatisfied with banks Accuracy in e-
banking channels and a minority (1.0%) of the respondents strongly says that there are very dissatisfied with banking Accuracy
of Error free e-services through e-banking channels.
Table 4.8 shows that vast majority (45.8%) of the respondents are Satisfied about Efficiency in E-banking services
like Speed of service (Money transfer, depositing, enquiry getting information, response clearing) immediate and quick
transaction and check out with minimal time. 25.5 percent respondents says that there are Very satisfied about Efficiency in
E-banking services. 20.8 percent of the respondents says that there are Neutral about Efficiency in E-banking services. Out of
the total respondents 6.2 percent of the respondents says that there are Dissatisfied with Efficiency in e-banking channels and
a minority (1.6%) of the respondents strongly says that there are very dissatisfied with Efficiency in E-banking services.
Table 4.8 shows that vast majority (49.0%) of the respondents are Satisfied about Security in E-banking services like Trust,
Privacy, believability, truthfulness freedom from danger about money losses, fraud. PIN. Password theft & hacking. 25.0 percent
respondents says that there are Neutral about Security in E-banking services. 19.8 percent of the respondents says that there are
Very satisfied about Security in E-banking services. Out of the total respondents 5.7 percent of the respondents says that there are
Dissatisfied with Security in e-banking channels and a minority (.5%) of the respondents strongly says that there are very dissatisfied
with Security in E-banking services.
Table 4.8 shows that vast majority (49.0%) of the respondents are Satisfied that banks are providing prompt responses for
Problem handling, recovery of the problem, prompt service, timeliness service, recovery of Pin and Password and money losses.
24.5 percent respondents says that there are Neutral on banks providing prompt responses. 15.1 percent of the respondents says that
there are Very Satisfied on banks providing prompt responses. Out of the total respondents 9.9 percent of the respondents says that
there are Dissatisfied with banks are providing prompt responses and a minority (1.6%) of the respondents strongly says that there
are Very dissatisfied with banks are providing prompt responses.
Table 4.8 shows that vast majority (55.2%) of the respondents are Satisfied about Easiness in E-banking services like ase
to use and functioning of ATM, Mobile banking, internet banking credit card & debit card. 25.0 percent respondents says that there
are Very satisfied about Easiness in E-banking services. 14.1 percent of the respondents says that there are Neutral about Easiness
in E-banking services. Out of the total respondents 4.7 percent of the respondents says that there are Dissatisfied with Easiness in
e-banking channels and a minority (1.0%) of the respondents strongly says that there are very dissatisfied with Easiness in E-
banking services.
Table 4.8 shows that vast majority (49.5%) of the respondents are Satisfied about convenience in E-banking services like
Customized services, anywhere and anytime banking, appropriate language support and time saving. 24.0 percent respondents says
that there are Very satisfied about Convenience in E-banking services. 20.3 percent of the respondents says that there are Neutral
about Convenience in E-banking services. Out of the total respondents 4.7 percent of the respondents says that there are Dissatisfied
with Convenience in e-banking channels and a minority (1.6%) of the respondents strongly says that there are very dissatisfied with
Convenience in E-banking services.
Table 4.8 shows that vast majority (44.8%) of the respondents are Satisfied about Cost Effectiveness in E-banking services
like Price, Fee, Charges that is commission for fund transfer, interest rate, clearing charges, bill collection and payments, charges
on switching of ATM & Processing fees. 24.0 percent respondents says that there are Neutral about Cost Effectiveness in E-banking
services. 19.3 percent of the respondents says that there are Very satisfied about Convenience in E-banking services. Out of the total
respondents 8.3 percent of the respondents says that there are Dissatisfied with Cost effectiveness in e-banking channels and a
minority (3.6%) of the respondents strongly says that there are very dissatisfied with Cost effectives in E-banking services.
Table 4.8 shows that vast majority (49.0%) of the respondents are Satisfied about Problem Handling in E-banking services it refers
to problem solving process regarding computerized banking services. 26.6 percent respondents says that there are Neutral about in
Problem Handling E-banking services. 13.0 percent of the respondents says that there are very satisfied about in Problem Handling
E-banking services. Out of the total respondents 9.9 percent of the respondents says that there are Dissatisfied with Problem
Handling in e-banking channels and a minority (1.6%) of the respondents strongly says that there are very dissatisfied with in
Problem Handling E-banking services.

M. L Ranjini, K. R Mahesh Kumar, International Journal of Advance Research, Ideas and Innovations in Technology.
© 2017, www.IJARIIT.com All Rights Reserved Page | 676
This part of the analysis deals with the problems faced by the respondents while dealing with the e-banking services of the
banks.
1 = Very Problematic 3 = No Opinion 5 = Not at all Problematic
2 = Problematic 4 = Not Problematic
Table 4.9
Ranking Of Problem of E-Banking Services
The table 4.9 shows that majority (31.2%) of the respondents have given fifth rank for the problems faced by forgotten password
about the usage of e- services, 24.5 percent of the respondents have given third rank, 15.6 percent of the respondents have given
first rank, 15.1 percent of the respondents have given fourth rank, and a minority (13.5%) of the respondents have given second
rank for the problem.
The table 4.9 shows that majority (29.2%) of the respondents have given fifth rank for the problems faced because of insufficient
number of ATM’s, 27.1 percent of the respondents have given third rank, 16.7 percent of the respondents have given second rank,
14.1 percent of the respondents have given first rank, and a minority (13.0%) of the respondents have given fourth rank for the
problem.
The table 4.9 shows that majority (29.2%) of the respondents have given fifth rank for the Location is unsuitable for ATM’s, 22.4
percent of the respondents have given third rank, 18.2 percent of the respondents have given fourth rank, 17.7 percent of the
respondents have given second rank, and a minority (12.5%) of the respondents have given first rank for the problem.
The table 4.9 shows that majority (25.0%) of the respondents have given third rank for the Network Issues, 22.4 percent of the
respondents have given fourth rank, 20.8 percent of the respondents have given fifth rank, 16.1 percent of the respondents have
given first rank, and a minority (15.6%) of the respondents have given second rank for the problem.
The table 4.9 shows that majority (36.5%) of the respondents have given fifth rank for lack of inadequate knowledge about the
usage of E-channels, 19.8 percent of the respondents have given fourth rank, 19.3 percent of the respondents have given third rank,
13.5 percent of the respondents have given second rank, and a minority (10.9%) of the respondents have given first rank for the
problem.
The table 4.9 shows that majority (32.8%) of the respondents have given fifth rank for lack of Confidence (Security PIN
Code, Card Number, CVV Number) OTP Number about the usage of E-channels, 24.5 percent of the respondents have given third
rank, 19.3 percent of the respondents have given fourth rank, 12.5 percent of the respondents have given second rank, and a minority
(10.9%) of the respondents have given first rank for the problem.
Ranks
Problems
faced by
forgotten
password
Problems
faced
because of
insufficient
number of
ATM’s
Location is
Unsuitable
of ATM’s
Network
Issues
Inadequ
ate
Knowled
ge about
the
usage of
E-
channels
Lack of
Confiden
ce
Technical
issues in
ATM’s
smart
card and
credit
card
Probl
em in
Mispl
ace of
card
Misuse of
card &
frauds
N % N % N % N % N % N % N % N % N %
1 30 15.6 27 14.1 24 12.5 31 16.1 21 10.9 21 10.9 30 15.6 30 15.6 36 18.8
2 26 13.5 32 16.7 34 17.7 30 15.6 26 13.5 24 12.5 30 15.6 35 18.2 34 17.7
3 47 24.5 52 27.1 43 22.4 48 25.0 37 19.3 47 24.5 39 20.3 35 18.2 23 12.0
4 29 15.1 25 13.0 35 18.2 43 22.4 38 19.8 37 19.3 39 20.3 22 11.5 26 13.5
5 60 31.2 56 29.2 56 29.2 40 20.8 70 36.5 63 32.8 54 28.1 70 36.5 73 38.0

M. L Ranjini, K. R Mahesh Kumar, International Journal of Advance Research, Ideas and Innovations in Technology.
© 2017, www.IJARIIT.com All Rights Reserved Page | 677
The table 4.9 shows that majority (28.1%) of the respondents have given fifth rank for Problem in technical issues in ATM’s,
smart card, credit card about the usage of E-channels, 20.3 percent of the respondents have given third rank & fourth rank, and
minority (15.6%) of the respondents have given first rank and second for the problem.
The table 4.9 shows that majority (36.5%) of the respondents have given fifth rank for Problem in Misplace of card about
the usage of E-channels, 18.2 percent of the respondents have given third rank and second rank, 15.6 percent of the respondents
have given first rank, and minority (11.5%) of the respondents have given fourth rank for the problem.
The table 4.9 shows that majority (38.0%) of the respondents have given fifth rank for Misuse of card and frauds about the
usage of E-channels, 18.8 percent of the respondents have given first rank, 17.7 percent of the respondents have given second rank,
13.5 percent of the respondents have given fourth rank, and a minority (12.0%) of the respondents have given third rank for the
problem.
TEST OF HYPOTHESES
In this section, the hypotheses formulated are verified and tested using the various statistical techniques and inference drawn
based on the result
HYPOTHESIS: 1
There is a significant difference between nationalized banks and private banks of the respondents and their e-banking services.
Table 4.10
Mann-Whitney Test
Difference between nationalized banks and private banks of the respondents and their e-banking services
Sl. No Nature of bank Mean Rank Sum of Ranks
1 ATM/ Debit card
National (n=96) 94.00 9024.00
Private (n=96) 99.00 9504.00
2 Credit card
National (n=96) 101.00 9696.00
Private (n=96) 92.00 8832.00
3 Online banking
National (n=96) 99.50 9552.00
Private (n=96) 93.50 8976.00
4 Mobile banking
National (n=96) 94.00 9024.00
Private (n=96) 99.00 9504.00
5 Tele banking
National (n=96) 95.00 9120.00
Private (n=96) 98.00 9408.00
Test Statistics (1)
ATM/ Debit
card
Credit
card
Online
banking
Mobile
banking
Tele
banking
Mann-
Whitney U 4368.000 4176.000 4320.000 4368.000 4464.000
Wilcoxon W 9024.000 8832.000 8976.000 9024.000 9120.000
Z -1.267 -1.312 -1.063 -.725 -.547
Asymp. Sig.
(2 -tailed) .205 .190 .288 .469 .584
The table 4.10 indicates the respondents’ opinion perceived regarding the e-banking services provided by nationalized
banks and private banks. The respondents perceived that the private banks are providing best ATM/Debit card services with the
mean value 99.00, the best credit card services are provided by nationalized banks with the mean value 101.00, mobile banking
services are provided in the best way by the private banks with the mean value 99.00, Online banking services are provided in the
best manner by nationalized banks with the mean value 99.50 and Tele banking services are provided in a best manner by private
banks with the mean value 98.00, though the highest mean value shows the best services by the banks are also providing the e-
banking services in the best manner with not much difference in the mean value.

M. L Ranjini, K. R Mahesh Kumar, International Journal of Advance Research, Ideas and Innovations in Technology.
© 2017, www.IJARIIT.com All Rights Reserved Page | 678
There is much less difference between the services provided by the nationalized banks and the private banks.
The table 4.10 reveals that there is no significant difference between nationalized banks and private banks of the respondents and
their nature of e- banking services.
Research Hypothesis
H1 : There is a significant difference between nationalized banks and private banks of the respondents and their e-
banking services.
Null hypothesis
H 0: There is no significant difference between nationalized banks and private banks of the respondents and their e-
banking services.
Statistical test
Mann-Whitney test was used to test the above hypothesis
Findings
The table 4.10 reveals that there is no significant difference between nationalized banks and private banks of the
respondents and their e-banking services.
[ATM/Debit card=.205>0.05 / Credit card=.190>.0.05 / mobile banking=.469>0.05 / online banking=.288>0.05 / Tele
banking =.584>0.05]
Hence, the calculated value is greater than the table value. So the research hypothesis is rejected and the null
hypothesis is accepted.
HYPOTHESIS: 2
There is a significant difference between nationalized banks and private banks of the respondents and their various
problems faced in e-banking services.
Table 4.11
Mann-Whitney Test
Difference between Nature of Bank of the Respondents and the Various Problems Faced By the Respondents of E-
Banking Channels
Sl.
No
Nature of banks Mean
Rank
Sum of ranks
1 Problems faced by forgotten password
National (n=96) 90.64 8701.00
Private (n=96) 102.36 9827.00
2 Problems faced because of insufficient number of ATM’s
National (n=96) 95.52 9170.00
Private (n=96) 97.48 9358.00
3 Location is Unsuitable for ATM’s
National (n=96) 98.96 9500.00
Private (n=96) 94.04 9027.00
4 Network Issues
National (n=96) 91.44 8778.00
Private (n=96) 101.56 9750.00
5 Lack of inadequate knowledge about the usage of E-Channels
National (n=96) 94.61 9083.00
Private (n=96) 98.39 9445.00
6 Lack of Confidence (Security PIN Code, Card Number, CVV
number)OPT Number
National (n=96) 86.90 8342.00
Private (n=96) 106.10 10186.00
7 Problem in technical issues in ATM’s Smart Card & Credit Card
National (n=96) 95.97 9213.00
Private (n=96) 97.03 9315.00
8 Problem in Misplace of Card
National (n=96) 92.88 8916.50
Private (n=96) 100.12 9611.50
9 There is Misuse of card and frauds
National (n=96) 89.69 8610.00
Private (n=96) 103.31 9918.00

M. L Ranjini, K. R Mahesh Kumar, International Journal of Advance Research, Ideas and Innovations in Technology.
© 2017, www.IJARIIT.com All Rights Reserved Page | 679
The table 4.11 indicates the problems faced by the respondents while using the e-banking services. According to the
opinions given by the respondents it is perceived that the respondents using e-banking services of Private banks are facing problems
by forgotten password about the usage of e channels with the highest mean value of 102.36. The respondents opinion that Private
banks are facing problems of insufficient number of ATM’s with the highest mean value of 97.48. The respondents of nationalized
banks feel that the Location is unsuitable for with the highest mean value of 98.96. The respondents of the private banks perceive
that the private banks are having Network issue with the highest mean value of 101.56. The respondent of the Private bank with the
highest mean value of 98.39 perceive that Lack of inadequate knowledge about the usage of E-channels. The respondents of the
private bank with the highest mean value of 106.10 perceive that they are Lack of confidence (Security PIN Code, Card Number,
and CVV Number) OPT Number. The respondents of the private banks perceive that they are facing problem in technical issues in
ATM’s Smart Card and Credit card with the mean value of 97.03. The respondents of private banks view that there is a problem in
misplace of card with the mean value of 100.12. The respondents of the private banks report that they is misuse of card and frauds
with a mean value of 103.31.
The table 4.11 reveals that there is no significant difference between nationalized banks and private banks of
the respondents and their various problems faced in E-banking services.
Research hypothesis
H1 : There is a significant difference between nationalized banks and private banks of the respondents and their various problems
faced in e-banking services.
Null hypothesis
H0 : There is no significant difference between nationalized banks and private banks of the respondents and the various problems
faced in e-banking services.
Statistical test
Mann Whitney test was used to test the above hypothesis
Findings
The table 4.11 reveals that there is no significant difference between nature of bank of the respondents and their various problems
faced in e-banking services. [Problems faced by forgotten password about the usage of e channels =.133>0.05 / insufficient number
of ATMs=.802>0.05/, Location is unsuitable for ATM’s=.529>0.05, Network Issue=0.197<0.05/ lack of inadequate knowledge
about the usage of E-Channels =.626>0.05/Lack of confidence (Security PIN Code, Card Number, CVV Number)OPT Number
=.013<0.05/ Problem in technical issues in ATM’s Smart card and credit card = .892>0.05/Problem in Misplace of card =.350>0.05/,
Misuse of card and frauds =.078>0.05. Therefore, the calculated value is greater than table value. So the research hypothesis rejected
and the null hypothesis accepted.
Problems
faced by
forgotten
password
Problems
faced
because
of
insufficie
nt number
of ATM's
Locatio
n is
Unsuita
ble for
ATM's
Network
Issues
Lack of
inadequat
e
knowledg
e about
the usage
of E-
Channels
Lack of
confidence
(Security
PIN Code,
card
Number,
CVV
Number)OP
T Number
Problem I
technical
issues in
ATM's
Smart
Card and
Credit
Card
Proble
m in
Mispla
ce of
Card
There is
Misuse of
card and
frauds
Mann-
Whitney
U
4045.000 4514.000 4371.50
0 4122.000 4427.000 3686.000 4557.000
4260.5
00 3954.000
Wilcoxon
W 8701.000 9170.000
9027.50
0 8778.000 9083.000 8342.000 9213.000
8916.5
00 8610.000
Z -1.504 -0.251 -0.63 -1.291 -0.487 -2.471 -0.136 -0.934 -1.763
Asymp.
Sig. re (2-
tailed)
0.133 0.802 0.529 0.197 0.626 0.013 0.892 0.350 0.078

M. L Ranjini, K. R Mahesh Kumar, International Journal of Advance Research, Ideas and Innovations in Technology.
© 2017, www.IJARIIT.com All Rights Reserved Page | 680
HYPOTHESIS: 3
There is a significant difference between age, gender, occupation, education and monthly income of the respondents and their overall
e-banking services qualities.
Research hypothesis: 3.1
H 1 : There is a significant association between age of the respondents and their overall e-banking services qualities.
Null hypothesis
H 0 : There is no significant association between age of the respondents and their overall e-banking services qualities.
Statistical test
Chi-square test was used to test the above hypothesis
Table 4.12
Association between age of the respondents and their
overall e-banking services qualities.
Sl. No. Factors Chi-Square
Value
Degree of
Freedom
Asymp.
Sig.(2-sided)
Significant /
Not Significant
1 System Availability 13.449 16 0.640 Not Significant
2 Accuracy 19.437 16 0.247 Not Significant
3 Efficiency 15.424 16 0.494 Not Significant
4 Security 32.948 16 0.008 Significant
5 Responsiveness 21.929 16 0.145 Not Significant
6 (a) Easiness 16.16 16 0.442 Not Significant
6 (b) Convenience 19.676 16 0.235 Not Significant
7 Cost Effectiveness 15.333 16 0.500 Not Significant
8 Problem Handling 20.247 16 0.209 Not Significant
9 Overall E-banking service 26.516 16 0.047 Significant
Interpretation
It is seen that the chi-square value is 13.449 and the Asymp. Sig. value is .640 which is greater than the critical value (P = 0.05)
Hence Null hypothesis is accepted and there is no significant relationship associate between age and satisfaction with System
availability.
Interpretation
It is seen that the chi-square value is 19.437 and the Asymp. Sig. value is .247 which is greater than the critical value (P = 0.05)
Hence Null hypothesis is accepted and there is no significant relationship associate between age and satisfaction with Accuracy.
Interpretation
It is seen that the chi-square value is 15.424 and the Asymp. Sig. value is .494 which is greater than the critical value (P = 0.05)
Hence Null hypothesis is accepted and there is no significant relationship associate between age and satisfaction with Efficiency.
Interpretation
It is seen that the chi-square value is 32.948 and the Asymp. Sig. value is .008 which is lesser than the critical value (P = 0.05)
Hence Null hypothesis is rejected and there is significant relationship associate between age and satisfaction with Security.
Interpretation
It is seen that the chi-square value is 21.929 and the Asymp. Sig. value is .145 which is greater than the critical value (P = 0.05)
Hence Null hypothesis is accepted and there is no significant relationship associate between age and satisfaction with
responsiveness.
Interpretation
It is seen that the chi-square value is 16.160 and the Asymp. Sig. value is .442 which is greater than the critical value (P = 0.05)
Hence Null hypothesis is accepted and there is no significant relationship associate between age and satisfaction with Easiness.

M. L Ranjini, K. R Mahesh Kumar, International Journal of Advance Research, Ideas and Innovations in Technology.
© 2017, www.IJARIIT.com All Rights Reserved Page | 681
Interpretation It is seen that the chi-square value is 19.676 and the Asymp. Sig. value is .235 which is greater than the critical value (P = 0.05)
Hence Null hypothesis is accepted and there is no significant relationship associate between age and satisfaction with convenience.
Interpretation It is seen that the chi-square value is 15.333 and the Asymp. Sig. value is .500 which is greater than the critical value (P = 0.05)
Hence Null hypothesis is accepted and there is no significant relationship associate between age and satisfaction with Cost
Effectiveness.
Interpretation It is seen that the chi-square value is 20.247 and the Asymp. Sig. value is .209 which is greater than the critical value (P = 0.05)
Hence Null hypothesis is accepted and there is no significant relationship associate between age and satisfaction with Problem
Handling.
Interpretation It is seen that the chi-square value is 26.516 and the Asymp. Sig. value is .047 which is lesser than the critical value (P = 0.05)
Hence Null hypothesis is rejected and there is significant relationship associate between age and satisfaction with Overall E-banking
services.
Research hypothesis: 3.2
H 1: There is a significant difference between gender of the respondents and their overall e-banking services
qualities.
Null hypothesis
H 0: There is no significant difference between gender of the respondents and their overall e-banking services
qualities.
Statistical test
Student‘t’ test was used to test the above hypothesis
Table 4.13
Cross tabulation on gender and the qualities of E-banking services T-Test
Sl.No. Gender Mean S.D Statistical inference
1 System Availability T = .984
P > 0.05
Not Significant
Male = 102 2.08 0.875
Female = 90 2.19 0.833
2 Accuracy T = .136
P > 0.05
Not Significant
Male = 102 2.12 0.800
Female = 90 2.28 0.835
3 Efficiency T = .053
P > 0.05
Not Significant
Male = 102 1.94 0.854
Female = 90 2.33 0.948
4 Security T = .002
P < 0.05
Significant
Male = 102 2.10 0.764
Female = 90 2.28 0.900
5 Responsiveness T = .070
P > 0.05
Not Significant
Male = 102 2.27 0.846
Female = 90 2.41 0.970
6 (a) Easiness T = .114
P > 0.05
Not Significant
Male = 102 1.95 0.750
Female = 90 2.09 0.895
6 (b) Convenience T = .586
P > 0.05
Not Significant
Male = 102 2.08 0.864
Female = 90 2.13 0.889
7 Cost Effectiveness T = .172
P > 0.05
Not Significant
Male = 102 2.38 1.053
Female = 90 2.26 0.931
8 Problem Handling T = .435
P > 0.05
Not Significant
Male = 102 2.39 0.846
Female = 90 2.37 0.942
9 Overall E-Banking Services T = .689
P > 0.05
Not Significant
Male = 102 2.06 0.701
Female = 90 1.94 0.740

M. L Ranjini, K. R Mahesh Kumar, International Journal of Advance Research, Ideas and Innovations in Technology.
© 2017, www.IJARIIT.com All Rights Reserved Page | 682
The table 4.13 shows the mean value depicting gender level satisfaction with regard to each service quality dimension and
overall e-banking services qualities. Compared to mean value of female gender 1.94 the mean value of male gender 2.06 shows
the male gender satisfied with the e-banking services qualities.
The above table 4.13 reveals that there is a significant difference between gender of the respondents and their overall e-
banking services qualities [System Availability = .984 > 0.05/ Accuracy = .136 > 0.05/ Efficiency = .053 > 0.05/ Security = .002
< 0.05 / Responsiveness = .070 > 0.05/ Easiness = .114 > 0.05/ Convenience = .586 > 0.05/ Cost Effectiveness = .172 > 0.05/
Problem Handling = .435 > 0.05 Overall e-banking services qualities = .689 > 0.05].
Findings
The table 4.13 reveals that there is a significant difference between gender of the respondents and their overall e-banking
services qualities. [System Availability = .984 > 0.05/ Accuracy = .136 > 0.05/ Efficiency = .053 > 0.05/ Security = .002 < 0.05 /
Responsiveness = .070 < 0.05/ Easiness = .114 < 0.05/ Convenience = .586 < 0.05/ Cost Effectiveness = .172 < 0.05/ Problem
Handling = .435 < 0.05 Overall e-banking services qualities = .689 < 0.05]. As the calculated value less than table value, the research
hypothesis is accepted and the null hypothesis is rejected. It is inferred that the different age group of respondents are getting
satisfaction with few qualities of e-banking services.
Research hypothesis: 3.3
H1: There is a significant difference between occupation of the respondents and their overall e-banking services qualities.
Null hypothesis
H0: There is no significant difference between occupation of the respondents and their overall e-banking services qualities.
Statistical test
Onaway ANOVA ‘f’ test was used to test the above hypothesis
Table 4.14
Association between occupation and the qualities of e-banking services Oneway ANOVA
Sl.No. Occupation Mean S.D S S DF MS Statistical Inference
1 System Availability
Between Groups 7.140 4 1.785
F = 0.043
P < 0.05
Significant
Student (n=20) 2.20 0.834
Salaried (n=107) 2.01 0.771
Businessman (n=26) 2.58 1.027
Professional (n=37) 2.11 0.906
Others (n=2) 2.50 0.707
Within Groups 132.604 187 0.709
2 Accuracy
Between Groups 5.891 4 1.473
F = 0.065
P > 0.05
Not Significant
Student (n=20) 2.40 0.940
Salaried (n=107) 2.07 0.717
Businessman (n=26) 2.54 0.811
Professional (n=37) 2.19 0.967
Others (n=2) 2.50 0.707
Within Groups 121.979 187 0.652
3 Efficiency
Between Groups 16.794 4 4.198 F = 0.000
P < 0.05
Significant
Student (n=20) 2.70 1.129
Salaried (n=107) 1.90 0.776

M. L Ranjini, K. R Mahesh Kumar, International Journal of Advance Research, Ideas and Innovations in Technology.
© 2017, www.IJARIIT.com All Rights Reserved Page | 683
Businessman (n=26) 2.46 0.811
Professional (n=37) 2.19 1.023
Others (n=2) 3.00 1.414
Within Groups 144.206 187 0.771
4 Security
Between Groups 5.964 4 1.491
F = 0.070
P > 0.05
Not Significant
Student (n=20) 2.60 1.095
Salaried (n=107) 2.07 0.821
Businessman (n=26) 2.08 0.688
Professional (n=37) 2.32 0.747
Others (n=2) 2.50 0.707
Within Groups 126.656 187 0.677
5 Responsiveness
Between Groups 8.213 4 2.053
F = 0.039
P < 0.05
Significant
Student (n=20) 2.80 1.105
Salaried (n=107) 2.28 0.899
Businessman (n=26) 2.15 0.675
Professional (n=37) 2.32 0.884
Others (n=2) 3.50 0.707
Within Groups 148.782 187 0.796
6 (a) Easiness
Between Groups 5.387 4 1.347
F = 0.091
P > 0.05
Not Significant
Student (n=20) 2.45 1.191
Salaried (n=107) 1.94 0.787
Businessman (n=26) 2.15 0.784
Professional (n=37) 1.89 0.658
Others (n=2) 2.00 0.000
Within Groups 123.566 187 0.661
6 (b) Convenience
Between Groups 4.159 4 1.040
F = 0.245
P > 0.05
Not Significant
Student (n=20) 2.50 1.000
Salaried (n=107) 2.02 0.879
Businessman (n=26) 2.19 0.694
Professional (n=37) 2.08 0.894
Others (n=2) 2.00 0.000
Within Groups 141.758 187
0.758
7 Cost Effectiveness
Between Groups 3.146 4 0.786 F = 0.535
P > 0.05
Not Significant
Student (n=20) 2.55 1.099
Salaried (n=107) 2.25 1.065

M. L Ranjini, K. R Mahesh Kumar, International Journal of Advance Research, Ideas and Innovations in Technology.
© 2017, www.IJARIIT.com All Rights Reserved Page | 684
The table 4.14 shows the mean value calculated on the opinions perceived by the respondents of different occupational groups
regarding the e- banking services qualities provided by banks.
The respondents belonging to the occupation group of Student group shows the highest mean value of 2.35. the respondents of the
Business class ranks next with the mean value of 2.08, the respondents of the Professional class has ranks next with the mean value
of 2.16, the respondents of the salaried group of ranks next with the mean value of 1.88, the respondents of the other group of ranks
next with the mean value of 1.50. Among all the respondents there is no much difference in the mean value as they show the
satisfaction with regard to the service qualities of banks.
Findings
The table 4.14 reveals that there is significant difference between occupation of the respondents and the qualities of the overall e-
banking services [System Availability = .0.043 < 0.05/ Efficiency = .000 < 0.05/ Responsiveness = .039 < 0.05/ Overall e-banking
services qualities = .026 < 0.05]. Hence, the calculated value is lesser than table value, the research hypothesis is accepted and the
null hypothesis is rejected.
The table 4.14 reveals that there is no significant difference between occupation of the respondents and the qualities of the overall
e-banking services [Accuracy = .0.065 > 0.05/ Security = .070 > 0.05/ Easiness = .091 > 0.05/ Convenience = .245 > 0.05/ Cost
Effectiveness= .0535 > 0.05/ Problem Handing = .173 > 0.05 ]. Hence, the calculated value is greater than table value, the research
hypothesis is rejected and the null hypothesis is accepted.
Research hypothesis: 3.4
H 1 : There is a significant difference between educational qualification of the respondents and their overall e-banking services
qualities.
Null hypothesis
H0 : There is no significant difference between educational qualification of the respondents and their overall e-banking services
qualities.
Statistical test
Oneway ANOVA ‘f’ test was used to test the above hypothesis
Businessman (n=26) 2.23 0.652
Professional (n=37) 2.43 0.959
Others (n=2) 3.00 0.000
Within Groups 186.833 187 0.999
8 Problem Handling
Between Groups 5.035 4 1.259
F = 0.173
P > 0.05
Not Significant
Student (n=20) 2.60 0.940
Salaried (n=107) 2.31 0.817
Businessman (n=26) 2.15 0.881
Professional (n=37) 2.62 1.037
Others (n=2) 2.50 0.707
Within Groups 146.21 187 0.782
9 Overall E-Banking
Services
Between Groups 5.651 4 1.413
F = 0.026
P < 0.05
Significant
Student (n=20) 2.35 0.988
Salaried (n=107) 1.88 0.669
Businessman (n=26) 2.08 0.628
Professional (n=37) 2.16 0.688
Others (n=2) 1.50 0.707
Within Groups 93.344 187 0.499

M. L Ranjini, K. R Mahesh Kumar, International Journal of Advance Research, Ideas and Innovations in Technology.
© 2017, www.IJARIIT.com All Rights Reserved Page | 685
Table 4.15
One way NOVA difference between educational qualification of the respondents and the qualities of overall e-banking
services
Sl. No. Educational Qualification Mean S.D S S DF MS Statistical Inference
1 System Availability
Between Groups 0.371 3 0.124
F = 0.919
P > 0.05
Not Significant
Below HSC (n=10) 2.00 0.471
Graduate (n=110) 2.16 0.873
Post Graduate (n=52) 2.10 0.869
Professional Degree (n=20) 2.10 0.912
Within Groups 139.374 188 0.741
2 Accuracy
Between Groups 1.139 3 0.38
F = 0.640
P > 0.05
Not Significant
Below HSC (n=10) 2.30 0.949
Graduate (n=110) 2.25 0.837
Post Graduate (n=52) 2.12 0.808
Professional Degree (n=20) 2.05 0.686
Within Groups 126.73 188 0.674
3 Efficiency
Between Groups 5.894 3 1.965
F = 0.071
P > 0.05
Not Significant
Below HSC (n=10) 2.70 1.252
Graduate (n=110) 2.18 0.921
Post Graduate (n=52) 1.92 0.837
Professional Degree (n=20) 2.05 0.826
Within Groups 155.106 188 0.825
4 Security
Between Groups 1.274 3 0.425
F = 0.611
P > 0.05
Not Significant
Below HSC (n=10) 2.50 0.972
Graduate (n=110) 2.15 0.890
Post Graduate (n=52) 2.21 0.75
Professional Degree (n=20) 2.10 0.641
Within Groups 131.346 188 0.699
5 Responsiveness
Between Groups 1.672 3 0.557
F = 0.569
P > 0.05
Not Significant
Below HSC (n=10) 2.50 1.08
Graduate (n=110) 2.40 0.94
Post Graduate (n=52) 2.21 0.871
Professional Degree (n=20) 2.25 0.716
Within Groups 155.323 188 0.826
6 (a) Easiness
Between Groups 3.155 3 1.052
F = 0.198
P > 0.05
Not Significant
Below HSC (n=10) 2.30 0.823
Graduate (n=110) 2.09 0.863
Post Graduate (n=52) 1.87 0.768
Professional Degree (n=20) 1.85 0.671
Within Groups 125.799 188 0.669

M. L Ranjini, K. R Mahesh Kumar, International Journal of Advance Research, Ideas and Innovations in Technology.
© 2017, www.IJARIIT.com All Rights Reserved Page | 686
6 (b) Convenience
Between Groups 1.376 3 0.459
F = 0.618
P > 0.05
Not Significant
Below HSC (n=10) 2.30 0.823
Graduate (n=110) 2.11 0.86
Post Graduate (n=52) 2.00 0.84
Professional Degree (n=20) 2.25 1.07
Within Groups 144.541 188 0.769
7 Cost Effectiveness
Between Groups 0.625 3 0.208
F = 0.892
P > 0.05
Not Significant
Below HSC (n=10) 2.20 0.919
Graduate (n=110) 2.36 0.955
Post Graduate (n=52) 2.25 1.135
Professional Degree (n=20) 2.35 0.933
Within Groups 189.355 188 1.007
8 Problem Handling
Between Groups 0.959 3 0.320
F = 0.753
P > 0.05
Not Significant
Below HSC (n=10) 2.30 0.675
Graduate (n=110) 2.36 0.916
Post Graduate (n=52) 2.48 0.918
Professional Degree (n=20) 2.25 0.786
Within Groups 150.285 188 0.799
9 Overall E-Banking Services
Between Groups 0.627 3 0.209
F = 0.754
P > 0.05
Not Significant
Below HSC (n=10) 2.20 1.033
Graduate (n=110) 2.01 0.748
Post Graduate (n=52) 1.94 0.639
Professional Degree (n=20) 2.05 0.605
Within Groups 98.368 188 0.523
The above table 4.15 exhibits the mean value calculated on the opinion perceived by the respondents of different
educational group regarding overall e- banking services qualities provided by banks.
The respondents belonging to the education qualification group of HSC group shows the highest mean value of 2.20. The
respondents of the Professional group’s ranks next with the mean value of 2.05, the respondents of the Graduate groups follows
next with the mean value of 2.01 and respondents of the Post Graduate group of ranks the mean value of 1.9. Among all the
respondents there is no much difference in the mean value as they show the satisfaction with regard to the service qualities of banks.
Findings
The table 4.15 reveals that there is no significant difference between educational qualification of the respondents and the
qualities of the overall e-banking services [System Availability = .0.919 > 0.05/ Accuracy = .640 > 0.05/ Efficiency = .071 > 0.05/
Security = .611 > 0.05 / Responsiveness = .569 > 0.05/ Easiness = .198 > 0.05/ Convenience = .618 > 0.05/ Cost Effectiveness=
.0892 > 0.05/ Problem Handing = .753 > 0.05/ Overall E-banking service = .754 > 0.05]. Hence, the calculated value is greater
than table value, the research hypothesis is rejected and the null hypothesis is accepted.
Research hypothesis: 3.5
H 1 : There is a significant difference between income of the respondents and their overall e-banking services qualities.
Null hypothesis
H0 : There is no significant difference between income of the respondents and their overall e-banking services qualities.
Statistical test
Oneway ANOVA ‘f’ test was used to test the above hypothesis.
Table 4.16
Oneway ANOVA difference between income of the respondents and their overall e-banking services qualities

M. L Ranjini, K. R Mahesh Kumar, International Journal of Advance Research, Ideas and Innovations in Technology.
© 2017, www.IJARIIT.com All Rights Reserved Page | 687
Sl.No. Educational Qualification Mean S.D S S DF MS Statistical Inference
1 System Availability
Between Groups 1.792 5 0.358
F = 0.789
P > 0.05
Not Significant
< 1 Lakh (n = 8) 2.50 0.535
2-4 Lakhs (n = 76) 2.09 0.851
5-7 Lakhs (n = 59) 2.15 0.887
8-10 Lakhs (n = 24) 2.12 0.947
10 > (n = 8) 1.88 0.641
No Income (n=17) 2.18 0.883
Within Groups 137.953 186 0.742
2 Accuracy
Between Groups 1.097 5 0.219
F = 0.899
P > 0.05
Not Significant
< 1 Lakh (n = 8) 2.25 0.463
2-4 Lakhs (n = 76) 2.18 0.828
5-7 Lakhs (n = 59) 2.22 0.852
8-10 Lakhs (n = 24) 2.08 0.776
10 > (n = 8) 2.00 0.756
No Income (n=17) 2.35 0.931
Within Groups 126.772 186 0.682
3 Efficiency
Between Groups 5.662 5 1.132
F = 0.243
P > 0.05
Not Significant
< 1 Lakh (n = 8) 2.00 0.535
2-4 Lakhs (n = 76) 2.07 0.914
5-7 Lakhs (n = 59) 2.08 0.915
8-10 Lakhs (n = 24) 2.17 0.868
10 > (n = 8) 1.88 0.641
No Income (n=17) 2.65 1.169
Within Groups 155.338 186 0.835
4 Security
Between Groups 4.917 5 0.983
F = 0.214
P > 0.05
Not Significant
< 1 Lakh (n = 8) 2.25 0.707
2-4 Lakhs (n = 76) 2.24 0.862
5-7 Lakhs (n = 59) 2.10 0.824
8-10 Lakhs (n = 24) 1.96 0.624
10 > (n = 8) 2.00 0.000
No Income (n=17) 2.59 1.121
Within Groups 127.703 186 0.687
5 Responsiveness
Between Groups 7.483 5 1.497
F = 0.103
P > 0.05
Not Significant
< 1 Lakh (n = 8) 2.62 0.744
2-4 Lakhs (n = 76) 2.41 0.982
5-7 Lakhs (n = 59) 2.1 0.803
8-10 Lakhs (n = 24) 2.3 0.761
10 > (n = 8) 2.25 0.463
No Income (n=17) 2.76 1.147
Within Groups 149.512 186 0.804
6 (a) Easiness

M. L Ranjini, K. R Mahesh Kumar, International Journal of Advance Research, Ideas and Innovations in Technology.
© 2017, www.IJARIIT.com All Rights Reserved Page | 688
The table 4.16 depicts the mean value calculated on the opinion perceived by the respondents of different income group regarding
Between Groups 7.501 5 1.500
F = 0.047
P < 0.05
Significant
< 1 Lakh (n = 8) 2.12 0.641
2-4 Lakhs (n = 76) 1.96 0.886
5-7 Lakhs (n = 59) 1.85 0.551
8-10 Lakhs (n = 24) 2.29 0.908
10 > (n = 8) 1.88 0.354
No Income (n=17) 2.47 1.179
Within Groups 121.452 186 0.653
6 (b) Convenience
Between Groups 3.788 5 0.758
F = 0.424
P > 0.05
Not Significant
< 1 Lakh (n = 8) 2.12 0.641
2-4 Lakhs (n = 76) 2.05 0.862
5-7 Lakhs (n = 59) 2.07 0.868
8-10 Lakhs (n = 24) 2.12 0.992
10 > (n = 8) 1.88 0.354
No Income (n=17) 2.53 1.007
Within Groups 142.129 186 0.764
7 Cost Effectiveness
Between Groups 3.701 5 0.740
F = 0.595
P > 0.05
Not Significant
< 1 Lakh (n = 8) 2.38 0.916
2-4 Lakhs (n = 76) 2.39 1.096
5-7 Lakhs (n = 59) 2.12 0.93
8-10 Lakhs (n = 24) 2.46 0.932
10 > (n = 8) 2.5 0.756
No Income (n=17) 2.41 1.004
Within Groups 186.278 186 1.001
8
Problem Handling
Between Groups 2.527 5 0.505
F = 0.675
P > 0.05
Not Significant
< 1 Lakh (n = 8) 2.75 0.707
2-4 Lakhs (n = 76) 2.32 0.867
5-7 Lakhs (n = 59) 2.34 0.976
8-10 Lakhs (n = 24) 2.46 0.884
10 > (n = 8) 2.25 0.463
No Income (n=17) 2.59 0.939
Within Groups 148.717 186 0.8
9 Overall E-Banking Services
Between Groups 4.462 5 0.892
F = 0.124
P > 0.05
Not Significant
< 1 Lakh (n = 8) 2.00 0.000
2-4 Lakhs (n = 76) 2.00 0.712
5-7 Lakhs (n = 59) 1.86 0.681
8-10 Lakhs (n = 24) 2.12 0.68
10 > (n = 8) 1.88 0.354
No Income (n=17) 2.41 1.064
Within Groups 94.533 186 0.508

M. L Ranjini, K. R Mahesh Kumar, International Journal of Advance Research, Ideas and Innovations in Technology.
© 2017, www.IJARIIT.com All Rights Reserved Page | 689
e-banking service qualities provided by the banks.
The respondents belonging to the income group of No Income group shows the highest mean value of 2.41. the respondents of the
income group of 8 – 10 Lakhs ranks next with the mean value of 2.12, the respondents of the income group of below Rs. 1 Lakh
and 2-4 Lakhs both has same ranks next with the mean value of 2.00, the respondents of the income group of above10 Lakhs ranks
next with the mean value of 1.88, the respondents of the income group of 5 to 7 Lakhs ranks next with the mean value of 1.86.
Among all the respondents there is no much difference in the mean value as they show the satisfaction with regard to the service
qualities of banks.
Research hypothesis
H1 : There is a significant difference between income of the respondents and the qualities of overall e-banking services
H 0 : There is no significant difference between income of the respondents and the qualities of overall e-banking services
Findings
The above table 4.16 reveals that there is no significant difference between income of the respondents and their overall e-
banking services qualities. [System Availability = .0.789 > 0.05/ Accuracy = .899 > 0.05/ Efficiency = .0243 > 0.05/ Security =
.214 > 0.05 / Responsiveness = .103 > 0.05/ Convenience = .424 > 0.05/ Cost Effectiveness= .0595 > 0.05/ Problem Handing =
.675 > 0.05/ Overall E-banking service = .124 > 0.05]. Hence, the calculated value is greater than table value, the research
hypothesis is rejected and the null hypothesis is accepted.
The above table 4.16 reveals that there is significant difference between income of the respondents and their overall e-
banking services qualities. [Easiness = .198 > 0.05]. Hence, the calculated value is lesser than table value, the research hypothesis
is accepted and the null hypothesis is rejected.
It is inferred that the respondents of different income groups are getting satisfaction with regard to the qualities of the e-
banking services.
HYPOTHESIS: 4
There is a significant difference between account access through internet of the respondents and their overall e-banking services.
Table 4.17
Significance of account access through internet and the qualities of E- banking services T-Test
Sl. No. Access of e-banking services Mean S.D Statistical Inference
1 System Availability
a) Home T = .408
P > 0.05
Not Significant
Yes (n=34) 2.21 0.914
No (n=158) 2.11 0.844
b) Office T = .421
P > 0.05
Not Significant
Yes (n=33) 2.12 0.82
No (n=159) 2.13 0.865
c) Mobile T = .154
P > 0.05
Not Significant
Yes (n=52) 2.25 0.926
No (n=140) 2.09 0.827
d) All the above T = .191
P > 0.05
Not Significant
Yes (n=104) 2.06 0.834
No (n=88) 2.22 0.877
2 Accuracy
a) Home T = .627
P > 0.05
Not Significant
Yes (n=34) 2.32 0.806
No (n=158) 2.16 0.821
b) Office
Yes (n=33) 2.33 0.777
M. L Ranjini, K. R Mahesh Kumar, International Journal of Advance Research, Ideas and Innovations in Technology.
© 2017, www.IJARIIT.com All Rights Reserved Page | 690
No (n=159) 2.16 0.826
T = .888
P > 0.05
Not Significant
c) Mobile T = .017
P < 0.05
Significant
Yes (n=52) 2.38 0.932
No (n=140) 2.12 0.763
d) All the above T = .005
P < 0.05
Significant
Yes (n=104) 2.06 0.735
No (n=88) 2.35 0.885
3 Efficiency
a) Home T = .167
P > 0.05
Not Significant
Yes (n=34) 2.32 0.976
No (n=158) 2.08 0.903
b) Office T = .655
P > 0.05
Not Significant
Yes (n=33) 2.39 0.864
No (n=159) 2.07 0.922
c) Mobile T = .280
P > 0.05
Not Significant
Yes (n=52) 2.31 0.981
No (n=140) 2.06 0.888
d) All the above T = .089
P > 0.05
Not Significant
Yes (n=104) 1.97 0.864
No (n=88) 2.31 0.951
4 Security
a) Home T = .307
P > 0.05
Not Significant
Yes (n=34) 2.44 0.894
No (n=158) 2.13 0.812
b) Office T = .243
P > 0.05
Not Significant
Yes (n=33) 2.12 0.781
No (n=159) 2.19 0.846
c) Mobile T = .057
P > 0.05
Not Significant
Yes (n=52) 2.23 0.962
No (n=140) 2.16 0.783
d) All the above T = .031
P < 0.05
Significant
Yes (n=104) 2.12 0.754
No (n=88) 2.26 0.916
5 Responsiveness
a) Home T = .464
P > 0.05
Not Significant
Yes (n=34) 2.50 0.961
No (n=158) 2.30 0.894
b) Office T = .551
P > 0.05
Not Significant
Yes (n=33) 2.55 0.905
No (n=159) 2.30 0.904
c) Mobile T = .005
P < 0.05
Significant
Yes (n=52) 2.62 1.069
No (n=140) 2.24 0.819
d) All the above
M. L Ranjini, K. R Mahesh Kumar, International Journal of Advance Research, Ideas and Innovations in Technology.
© 2017, www.IJARIIT.com All Rights Reserved Page | 691
Yes (n=104) 2.15 0.747 T = .000
P < 0.05
Significant No (n=88) 2.56 1.027
6 (a) Easiness
a) Home T = .005
P < 0.05
Significant
Yes (n=34) 2.29 1.031
No (n=158) 1.96 0.76
b) Office T = .832
P > 0.05
Not Significant
Yes (n=33) 2.18 0.727
No (n=159) 1.98 0.838
c) Mobile T = .006
P < 0.05
Significant
Yes (n=52) 2.23 1.002
No (n=140) 1.94 0.732
d) All the above T = .041
P < 0.05
Significant
Yes (n=104) 1.89 0.709
No (n=88) 2.16 0.921
6 (b) Convenience
a) Home T = .300
P > 0.05
Not Significant
Yes (n=34) 2.47 0.861
No (n=158) 2.03 0.859
b) Office T = .190
P > 0.05
Not Significant
Yes (n=33) 2.18 0.683
No (n=159) 2.09 0.91
c) Mobile T = .046
P < 0.05
Significant
Yes (n=52) 2.25 1.007
No (n=140) 2.05 0.816
d) All the above T = .240
P > 0.05
Not Significant
Yes (n=104) 1.96 0.835
No (n=88) 2.27 0.893
7 Cost Effectiveness
a) Home T = .246
P > 0.05
Not Significant
Yes (n=34) 2.38 1.155
No (n=158) 2.31 0.964
b) Office T = .892
P > 0.05
Not Significant
Yes (n=33) 2.45 0.971
No (n=159) 2.30 1.003
c) Mobile T = .612
P > 0.05
Not Significant
Yes (n=52) 2.40 0.891
No (n=140) 2.29 1.035
d) All the above T = .319
P > 0.05
Not Significant
Yes (n=104) 2.24 0.990
No (n=88) 2.42 0.961
8 Problem Handling
a) Home
Yes (n=34) 2.47 0.961

M. L Ranjini, K. R Mahesh Kumar, International Journal of Advance Research, Ideas and Innovations in Technology.
© 2017, www.IJARIIT.com All Rights Reserved Page | 692
No (n=158) 2.36 0.876
T = .545
P > 0.05
Not Significant
b) Office T = .853
P > 0.05
Not Significant
Yes (n=33) 2.52 0.870
No (n=159) 2.35 0.894
c) Mobile T = .001
P < 0.05
Significant
Yes (n=52) 2.50 1.076
No (n=140) 2.34 0.81
d) All the above T = .000
P < 0.05
Significant
Yes (n=104) 2.27 0.753
No (n=88) 2.51 1.017
9 Overall E-Banking Services
a) Home T = .953
P > 0.05
Not Significant
Yes (n=34) 2.21 0.729
No (n=158) 1.96 0.713
b) Office T = .409
P > 0.05
Not Significant
Yes (n=33) 2.06 0.609
No (n=159) 1.99 0.742
c) Mobile T = .001
P < 0.05
Significant
Yes (n=52) 2.13 0.950
No (n=140) 1.96 0.610
d) All the above T = .110
P > 0.05
Not Significant
Yes (n=104) 1.90 0.616
No (n=88) 2.12 0.814
Research hypothesis
H 1: There is a significant difference between account access through internet of the respondents and the qualities of the overall e-
banking services.
Null hypothesis
H 0: There is no significant difference between the account access through internet of the respondents and the qualities of the overall
e-banking services.
Statistical test
Students’’ test has used to test the above hypothesis.
The table 4.17 shows the correlation between access through internet and the qualities of overall e-banking services. The
mean values of the respondents who have more access through internet show a satisfied mean value of 2.21. And those who have
less access through internet using the e-banking services show a satisfied mean value of 1.90.
Findings
The table 4.17 reveals that there is no significant difference between the respondents who are having account access through internet
and the qualities of overall e-banking services. [System Availability – a) Home = .408 > 0.05/ b) Office = .421 > 0.05/ c) Mobile
= .154 >0.05/ d)All the above = .191 > 0.05 / Efficiency - a) Home = .167> 0.05/ b) Office = .655 > 0.05/ c) Mobile = .280 >0.05/
d)All the above = .089 > 0.05/ Cost Effectiveness - a) Home = .246 > 0.05/ b) Office = .892 > 0.05/ c) Mobile = .612 >0.05/ d)All
the above = .319 > 0.05. Therefore, the calculated value is greater than the table value. So, the research hypothesis is rejected and
null hypothesis is accepted. It is inferred that the level of Satisfaction is more through access of e-banking services through home,
office, mobile and also all the above. But the mean difference is not much difference between each e-banking service qualities.
Findings
The table 4.17 reveals that there is significant difference between the respondents who are having account access through internet
and the qualities of overall e-banking services. [Accuracy – a) Home = .627 > 0.05/ b) Office = .888 > 0.05/ c) Mobile = .017 <
0.05/ d)All the above = .005 < 0.05 / Security - a) Home = .307> 0.05/ b) Office = .243> 0.05/ c) Mobile = .057 >0.05/ d)All the
above = .031 < 0.05/ Responsiveness - a) Home = .464 > 0.05/ b) Office = .551 > 0.05/ c) Mobile = .005 < 0.05/ d)All the above
= .000<0.05/ Easiness - a) Home = .005 < 0.05/ b) Office = .832 > 0.05/ c) Mobile = .006 <0.05/ d)All the above = .041<0.05/

M. L Ranjini, K. R Mahesh Kumar, International Journal of Advance Research, Ideas and Innovations in Technology.
© 2017, www.IJARIIT.com All Rights Reserved Page | 693
Convenience - a) Home = .300 > 0.05/ b) Office = .190 > 0.05/ c) Mobile = .046 < 0.05/ d)All the above = .240 > 0.05/ Problem
Handling - a) Home = .545 > 0.05/ b) Office = .853 > 0.05/ c) Mobile = .001 < 0.05/ d)All the above = .000 < 0.05/ Overall
E-banking service - a) Home = .953 > 0.05/ b) Office = .409 > 0.05/ c) Mobile = .001 < 0.05/ d) All the above = .110 > 0.05.
Therefore, the calculated value is less than the table value. So, the research hypothesis is accepted and null hypothesis is rejected. It
is inferred that the level of Satisfaction is less through access of e-banking services through mobile and also all the above. But the
mean difference is not much difference between each e-banking service qualities.
HYPOTHESIS: 5
There is a significant relationship between nature of services like ATM/Debit card, Credit Card, Mobile banking, Online banking
and Tele banking of the respondents and their overall e-banking services.

M. L Ranjini, K. R Mahesh Kumar, International Journal of Advance Research, Ideas and Innovations in Technology.
© 2017, www.IJARIIT.com All Rights Reserved Page | 694
The table 4.18 reveals that there is no significant relationship between nature of e banking e banking services like ATM/Debit card,
Table – 4.18 Correlations
Debit Card Credit
Card
Online
Banking
Mobile
Banking
Tele
Banking
System
availabil
ity
Accuracy Efficiency Security Responsi
veness Easiness
Conveni
ence
Cost
Effectiv
eness
Problem
Handing
Overall
E-
banking
service
Debit Card 1 0.081 -0.024 0.128 0.013 -0.091 0.016 0.058 -0.068 0.005 -0.051 0.026 0.046 -0.092 -0.002
Credit Card 0.081 1 0.023 0.103
0.224(**
) 0.155(*) 0.098 0.059
0.187(**
) 0.179(*) 0.081 0.066 0.129 0.021 0.006
Online
Banking -0.024 0.023 1
0.188(**
) 0.153(*) 0.117 -0.011 0.070 0.026 0.035 0.037 0.042 -0.012 0.084 0.032
Mobile
Banking 0.128 0.103
0.188(*
*) 1
0.302(**
) 0.061 0.098 0.198(**) 0.170(*) 0.176(*) 0.162(*) 0.146(*) 0.059
0.303(**
) 0.154(*)
Telebanking 0.013
0.224(**
) 0.153(*)
0.302(**
) 1 0.059 0.083 0.081 0.075 0.022 -0.087 -0.017 0.066 0.164(*) -0.070
System
availability -0.091 0.155(*) 0.117 0.061 0.059 1
0.652(**
) 0.479(**)
0.355(**
)
0.320(**
)
0.399(**
)
0.492(*
*)
0.349(*
*)
0.347(**
)
0.466(*
*)
Accuracy 0.016 0.098 -0.011 0.098 0.083
0.652(*
*) 1 0.636(**)
0.347(**
)
0.405(**
)
0.416(**
)
0.491(*
*)
0.391(*
*)
0.416(**
)
0.513(*
*)
Efficiency 0.058 0.059 0.070
0.198(**
) 0.081
0.479(*
*)
0.636(**
) 1
0.414(**
)
0.395(**
)
0.427(**
)
0.427(*
*)
0.373(*
*)
0.428(**
)
0.490(*
*)
Security -0.068
0.187(**
) 0.026 0.170(*) 0.075
0.355(*
*)
0.347(**
) 0.414(**) 1
0.500(**
)
0.408(**
)
0.462(*
*)
0.338(*
*)
0.329(**
)
0.408(*
*)
Responsivene
ss 0.005 0.179(*) 0.035 0.176(*) 0.022
0.320(*
*)
0.405(**
) 0.395(**)
0.500(**
) 1
0.569(**
)
0.510(*
*)
0.353(*
*)
0.430(**
)
0.438(*
*)
Easiness -0.051 0.081 0.037 0.162(*) -0.087
0.399(*
*)
0.416(**
) 0.427(**)
0.408(**
)
0.569(**
) 1
0.624(*
*)
0.409(*
*)
0.450(**
)
0.548(*
*)
Convenience 0.026 0.066 0.042 0.146(*) -0.017
0.492(*
*)
0.491(**
) 0.427(**)
0.462(**
)
0.510(**
)
0.624(**
) 1
0.417(*
*)
0.480(**
)
0.548(*
*)
Cost
Effectiveness 0.046 0.129 -0.012 0.059 0.066
0.349(*
*)
0.391(**
) 0.373(**)
0.338(**
)
0.353(**
)
0.409(**
)
0.417(*
*) 1
0.433(**
)
0.457(*
*)
Problem
Handing -0.092 0.021 0.084
0.303(**
) 0.164(*)
0.347(*
*)
0.416(**
) 0.428(**)
0.329(**
)
0.430(**
)
0.450(**
)
0.480(*
*)
0.433(*
*) 1
0.585(*
*)
Overall E-
banking
service
-0.002 0.006 0.032 0.154(*) -0.070 0.466(*
*)
0.513(**
) 0.490(**)
0.408(**
)
0.438(**
)
0.548(**
)
0.548(*
*)
0.457(*
*)
0.585(**
) 1
N 192 192 192 192 192 192 192 192 192 192 192 192 192 192 192
**. Correlation is significant at the 0.01 level (2-tailed).
*. Correlation is significant at the 0.05 level (2-tailed).

M. L Ranjini, K. R Mahesh Kumar, International Journal of Advance Research, Ideas and Innovations in Technology.
© 2017, www.IJARIIT.com All Rights Reserved Page | 695
Credit card, Mobile banking, online banking and Tele banking of the respondents and their overall e- banking services. Hence, the calculated value greater than table value.
Research hypothesis
H1 : There is a significant relationship between nature of e-banking services like ATM/Debit card, Credit card, Mobile banking, Online banking and Tele banking of the respondents and
their overall e-banking services.
Null hypothesis
H0 : There is no significant relationship between nature of e banking services like ATM/Debit card, Credit card, Mobile banking, Online banking and Tele banking of the respondents and
their overall e-banking services.
Statistical test
Pearson correlation test was used the above hypothesis
Findings
The table 4.18 reveals that there is no significant relationship between nature of e banking services like ATM/Debit card, Credit card, Mobile banking, Online banking and Tele banking of the
respondents and their overall e-banking services. Therefore, the calculated value is greater than the table value. So the research hypothesis is rejected and the null hypothesis is accepted. It is
inferred that respondents using the e-banking services and getting satisfied with the services.
HYPOTHESIS: 6
There is a significant relationship between various modes of services (mobile recharge, payment of telephone bill, payment of electric bill, money transfer, railway ticket booking, air ticket
booking, filing of tax returns, investments and others) of the respondents and their overall e-banking services.
Table 4.19
Inter correlation between various modes of e-banking services qualities of overall E-banking services Correlations

M. L Ranjini, K. R Mahesh Kumar, International Journal of Advance Research, Ideas and Innovations in Technology.
© 2017, www.IJARIIT.com All Rights Reserved Page | 696
Correlations
Fund
Trans
fer
Shop
ping
Payme
nt of
telepho
ne bill
Payme
nt of
Electric
ity bill
Air
Ticke
t
Book
ing
Tax
Boo
king
Mobil
e
Recha
rge
Investm
ent
Purposes
Railw
ay
ticket
booki
ng
Payme
nt of
DTH
Bill
Syste
m
availa
bility
Accur
acy
Efficie
ncy
Securi
ty
Resp
onsiv
eness
Easin
ess
Conv
enien
ce
Cost
Effect
ivene
ss
Prob
lem
hand
ing
Overa
ll
E-
banki
ng
servic
e
Fund
Transfer 1 .156* .164* .225**
.252*
*
.355
**
.288*
* .306** .178* .153* 0.039 0.053 0.099 0.055 0.056
-
0.046
-
0.031 0.01
0.10
3 0.07
Shopping .156* 1 .310** .254** .325*
*
.225
**
.286*
* .224**
.198*
* .189**
.221*
* .149* .275** 0.117 .147* 0.096 0.093 0.071
.218
** 0.14
Payment of
telephone
bill
.164* .310*
* 1 .670**
.571*
*
.399
**
.398*
* .433**
.381*
* .423** .155* 0.091 0.089 0.125 0.081 0.066 0.051 0.08
0.08
1 -0.018
Payment of
Electricity
bill
.225*
*
.254*
* .670** 1
.487*
*
.430
**
.313*
* .374**
.281*
* .410** .154* 0.133 0.094 .170* 0.041 0.093 0.102 0.127
0.06
6 0.013
Air Ticket
Booking
.252*
*
.325*
* .571** .487** 1
.566
**
.404*
* .460**
.462*
* .541** .170* 0.124 0.124 .148*
.206*
* 0.139
.245*
* 0.049
.152
* 0.099
For Tax
Booking
.355*
*
.225*
* .399** .430**
.566*
* 1
.347*
* .545**
.358*
* .359** 0.031 0.018 0.084 .148* 0.095 0.037 0.075 0.097
.168
* 0.021
Mobile
Recharge
.288*
*
.286*
* .398** .313**
.404*
*
.347
** 1 .389**
.303*
* .292** .180* .147* 0.138 0.099 0.124 0.094 0.111 0.035
.189
** 0.082
Investment
Purposes
.306*
*
.224*
* .433** .374**
.460*
*
.545
**
.389*
* 1
.400*
* .467** 0.017 0.079 0.11 0.1 .143* 0.087 0.029 0.035
.160
* 0.006
Railway
ticket
booking
.178* .198*
* .381** .281**
.462*
*
.358
**
.303*
* .400** 1 .455** .144* 0.018 0.041 .146*
.199*
* .144* 0.04 0.058
0.09
4 0.085
Payment of
DTH Bill .153*
.189*
* .423** .410**
.541*
*
.359
**
.292*
* .467**
.455*
* 1 .146* 0.111 .145*
.199*
* .164* 0.128 0.123 .171*
0.10
4 0.065
System
availability 0.039
.221*
* .155* .154* .170*
0.03
1 .180* 0.017 .144* .146* 1
.652*
* .479**
.356*
*
.321*
*
.399*
*
.493*
*
.349*
*
.347
**
.467*
*
Accuracy 0.053 .149* 0.091 0.133 0.124 0.01
8 .147* 0.079 0.018 0.111
.652*
* 1 .637**
.348*
*
.406*
*
.416*
*
.492*
*
.392*
*
.417
**
.514*
*
Efficiency 0.099 .275*
* 0.089 0.094 0.124
0.08
4 0.138 0.11 0.041 .145*
.479*
*
.637*
* 1
.415*
*
.395*
*
.428*
*
.427*
*
.373*
*
.429
**
.490*
*
Security 0.055 0.117 0.125 .170* .148* .148
* 0.099 0.1 .146* .199**
.356*
*
.348*
* .415** 1
.500*
*
.409*
*
.463*
*
.338*
*
.330
**
.409*
*
Responsiven
ess 0.056 .147* 0.081 0.041
.206*
*
0.09
5 0.124 .143*
.199*
* .164*
.321*
*
.406*
* .395**
.500*
* 1
.569*
*
.510*
*
.353*
*
.430
**
.438*
*
Easiness -
0.046 0.096 0.066 0.093 0.139
0.03
7 0.094 0.087 .144* 0.128
.399*
*
.416*
* .428**
.409*
*
.569*
* 1
.625*
*
.409*
*
.450
**
.549*
*
Convenience -
0.031 0.093 0.051 0.102
.245*
*
0.07
5 0.111 0.029 0.04 0.123
.493*
*
.492*
* .427**
.463*
*
.510*
*
.625*
* 1
.418*
*
.481
**
.548*
*

M. L Ranjini, K. R Mahesh Kumar, International Journal of Advance Research, Ideas and Innovations in Technology.
© 2017, www.IJARIIT.com All Rights Reserved Page | 697
Cost
Effectiveness 0.01 0.071 0.08 0.127 0.049
0.09
7 0.035 0.035 0.058 .171*
.349*
*
.392*
* .373**
.338*
*
.353*
*
.409*
*
.418*
* 1
.433
**
.457*
*
Problem
handing 0.103
.218*
* 0.081 0.066 .152*
.168
*
.189*
* .160* 0.094 0.104
.347*
*
.417*
* .429**
.330*
*
.430*
*
.450*
*
.481*
*
.433*
* 1
.585*
*
Overall E-
banking
service
0.07 0.14 -0.018 0.013 0.099 0.02
1 0.082 0.006 0.085 0.065
.467*
*
.514*
* .490**
.409*
*
.438*
*
.549*
*
.548*
*
.457*
*
.585
** 1
192 192 192 192 192 192 192 192 192 192 192 192 192 192 192 192 192 192 192 192
*. Correlation is significant at the 0.05 level (2-tailed).
**. Correlation is significant at the 0.01 level (2-tailed).

M. L Ranjini, K. R Mahesh Kumar, International Journal of Advance Research, Ideas and Innovations in Technology.
© 2017, www.IJARIIT.com All Rights Reserved Page | 698
The table 4.19 reveals that there is no significant relationship between various modes of e-banking services of the respondents and
the qualities of overall e-banking services. Hence, the calculated value greater than table value.
Research hypothesis
H1 : There is a significant relationship between various modes of e-banking services of the respondents and the qualities of overall
e-banking services.
Null hypothesis
H0 : There is no significant relationship between various modes of e-banking services of the respondents and the qualities of overall
e-banking services.
Statistical test
Pearson correlation test was used the above hypothesis
Findings
The table 4.19 reveals that there is no significant relationship between various modes of e-banking services of the respondents and
the qualities of overall e-banking services. The calculated value is greater than the table value. So the research hypothesis is rejected
and the null hypothesis is accepted. The respondents using the various modes of e-banking services contribute their level satisfaction
through frequent usage of the services.
HYPOTHESIS: 7
There is a significant relationship between various modes of services(mobile recharge, payment of telephone bill, payment of
electric bill, money transfer, railway ticket booking, air ticket booking, filing of tax returns, investments and others) of the
respondents and their various problems of e- banking.

M. L Ranjini, K. R Mahesh Kumar, International Journal of Advance Research, Ideas and Innovations in Technology.
© 2017, www.IJARIIT.com All Rights Reserved Page | 699
Table 4.20 - Correlations
Fund
Transf
er
Shoppi
ng
Payme
nt of
teleph
one
bill
Payme
nt of
Electric
ity bill
Air
Ticket
Booki
ng
Tax
Booki
ng
Mobile
Rechar
ge
Inves
tmen
t
Purp
oses
Railw
ay
ticket
booki
ng
Paym
ent of
DTH
Bill
Proble
ms
faced
by
forgott
en
passw
ord
Insuffici
ent
number
of
ATM's
Locatio
n is
Unsuita
ble for
ATMs
Netwo
rk
Issues
Lack of
inadequ
ate
knowle
dge
Lack of
Confide
nce
Techni
cal
issues
Mispla
ce of
card
Misu
se of
Card
&
Frau
ds
Fund
Transfer 1 .156* .164* .225**
.252*
*
.355*
* .288**
.306*
* .178* .153* -0.004 .147* -0.017 -0.08 -0.082 -0.093 -0.072 -0.01
-
0.03
7
Shoppin
g .156* 1 .310** .254**
.325*
*
.225*
* .286**
.224*
*
.198*
*
.189*
* -0.071 .168* 0.114 0.042 -0.022 -0.047 0.036 -.155* -0.02
Payment
of
telephon
e bill
.164* .310** 1 .670** .571*
*
.399*
* .398**
.433*
*
.381*
*
.423*
* -0.103 0.098 0.114 0.005 -0.066 -0.067 -0.057 -0.108
-
0.12
7
Payment
of
Electrici
ty bill
.225*
* .254** .670** 1
.487*
*
.430*
* .313**
.374*
*
.281*
*
.410*
* -0.12 0.044 .165* 0.109 -0.05 -0.051 0 -0.017
-
0.08
4
Air
Ticket
Booking
.252*
* .325** .571** .487** 1
.566*
* .404**
.460*
*
.462*
*
.541*
* 0.04 .199** 0.137 0.055 0.011 0.023 0.033 0.007
0.01
1
For Tax
Booking
.355*
* .225** .399** .430**
.566*
* 1 .347**
.545*
*
.358*
*
.359*
* 0.013 0.051 0.042 0.009 0.014 0.097 0.074 -0.024
-
0.08
3
Mobile
Recharg
e
.288*
* .286** .398** .313**
.404*
*
.347*
* 1
.389*
*
.303*
*
.292*
* 0.016 .169* 0.095 0.082 -0.074 -0.004 .191** -0.021
0.00
6
Investm
ent
Purpose
s
.306*
* .224** .433** .374**
.460*
*
.545*
* .389** 1
.400*
*
.467*
* -0.02 0.072 0.069 0.093 0.044 0.005 -0.017 -0.054
-
0.06
5
Railway
ticket
booking
.178* .198** .381** .281** .462*
*
.358*
* .303**
.400*
* 1
.455*
* 0.052 0.086 0.095 -0.089 -0.045 0.025 0.06 0.018
0.05
4
Payment
of DTH
Bill
.153* .189** .423** .410** .541*
*
.359*
* .292**
.467*
*
.455*
* 1 0.04 0.047 -0.024 0.094 0.003 0.032 0.039 0.036
0.03
8
Problem
s faced -0.004 -0.071 -0.103 -0.12 0.04 0.013 0.016 -0.02 0.052 0.04 1 .245** .346** .185* .174* .243** .244** .302**
.380
**
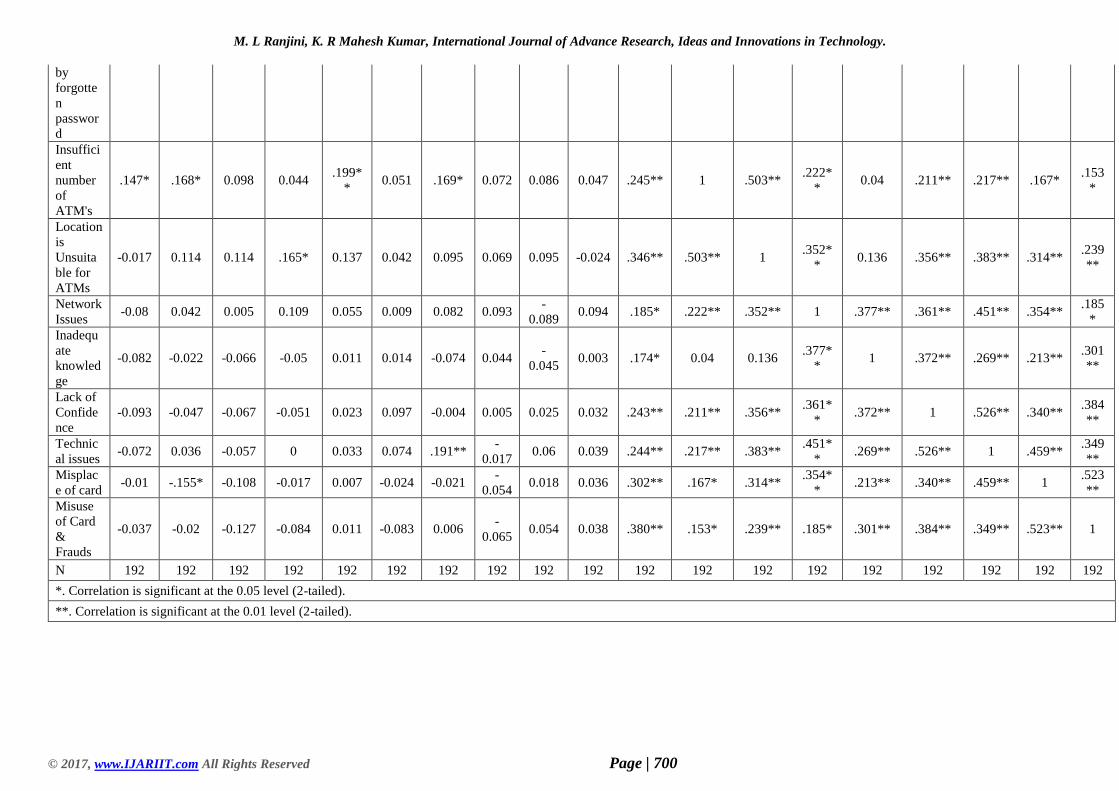
M. L Ranjini, K. R Mahesh Kumar, International Journal of Advance Research, Ideas and Innovations in Technology.
© 2017, www.IJARIIT.com All Rights Reserved Page | 700
by
forgotte
n
passwor
d
Insuffici
ent
number
of
ATM's
.147* .168* 0.098 0.044 .199*
* 0.051 .169* 0.072 0.086 0.047 .245** 1 .503**
.222*
* 0.04 .211** .217** .167*
.153
*
Location
is
Unsuita
ble for
ATMs
-0.017 0.114 0.114 .165* 0.137 0.042 0.095 0.069 0.095 -0.024 .346** .503** 1 .352*
* 0.136 .356** .383** .314**
.239
**
Network
Issues -0.08 0.042 0.005 0.109 0.055 0.009 0.082 0.093
-
0.089 0.094 .185* .222** .352** 1 .377** .361** .451** .354**
.185
*
Inadequ
ate
knowled
ge
-0.082 -0.022 -0.066 -0.05 0.011 0.014 -0.074 0.044 -
0.045 0.003 .174* 0.04 0.136
.377*
* 1 .372** .269** .213**
.301
**
Lack of
Confide
nce
-0.093 -0.047 -0.067 -0.051 0.023 0.097 -0.004 0.005 0.025 0.032 .243** .211** .356** .361*
* .372** 1 .526** .340**
.384
**
Technic
al issues -0.072 0.036 -0.057 0 0.033 0.074 .191**
-
0.017 0.06 0.039 .244** .217** .383**
.451*
* .269** .526** 1 .459**
.349
**
Misplac
e of card -0.01 -.155* -0.108 -0.017 0.007 -0.024 -0.021
-
0.054 0.018 0.036 .302** .167* .314**
.354*
* .213** .340** .459** 1
.523
**
Misuse
of Card
&
Frauds
-0.037 -0.02 -0.127 -0.084 0.011 -0.083 0.006 -
0.065 0.054 0.038 .380** .153* .239** .185* .301** .384** .349** .523** 1
N 192 192 192 192 192 192 192 192 192 192 192 192 192 192 192 192 192 192 192
*. Correlation is significant at the 0.05 level (2-tailed).
**. Correlation is significant at the 0.01 level (2-tailed).

M. L Ranjini, K. R Mahesh Kumar, International Journal of Advance Research, Ideas and Innovations in Technology.
© 2017, www.IJARIIT.com All Rights Reserved Page | 701
The above table 4.20 reveals that there is no significant relationship between various modes of e-banking services of the respondents
and their various problems of overall e-banking services. The calculated value is greater than the table value.
Research hypothesis
H1 : There is a significant relationship between various modes of e-banking services of the respondents and their various problems
of overall e- banking services.
Null hypothesis
H0 : There is no significant relationship between various modes of e-banking services of the respondents and their various problems
of overall e- banking services.
Statistical test
Pearson correlation test was used the above hypothesis
Findings
The above table 4.20 reveals that there is no significant relationship between various modes of e-banking services of the respondents
and their various problems of overall e-banking services. The calculated value is greater than the table value. So the research
hypothesis is rejected and the null hypothesis is accepted. It is inferred that even though the respondents are facing various problems
while using the e-banking services speed and developed technology makes them use the services in a frequent manner.
SUMMARY OF FINDINGS, SUGGESTIONS, RECOMMENDATIONS AND CONCLUSION
This chapter sums up all the findings of the study, suggestions, recommendations to the banks and conclusion and
suggestions for the future research.
Data was collected from customers who use electronic banking in the banks. Consequently, the collected data was analyzed and
interpreted in line with the aims of the study on which is to compare the banks in the customers’ perspectives. This analysis is focused
on relevant dimensions of services qualities and the problems faced by the customers for the purpose of comparison between
themselves and across respondents.
The respondents using e-banking services been taken equally from all the 4 banks. Out of the total respondents using e-
banking services 50 percent of the respondents belong to nationalized banks and 50 percent belong to the private sector banks.
Demographic breakdown of the sample presents the frequencies and percentages of the respondents divided according to gender,
age, education, occupation and personal monthly income. The majority of the respondents were male (53.1%). As for the age
distribution, most of the respondents fall between the age group of 21 to 30 years (49.5%). With respect to education, 57.3 percent
of the respondents are holders of graduate degrees, 55.7 percent of the respondents belong to salaried class and 39.6 percent had
monthly income between the ranges 2 to 4 Lakhs.
Usage of e-banking services
The respondents were asked how frequency they have used the e- banking services. It was revealed that 36.5 percent of
respondents are use for Fund transfer, 41.1 percent are using the e-banking services for shopping purpose, 26.6 percent use for
payment of Telephone bill, 22.9 percent use for payment of electricity bill, 16.7 percent use for air ticket booking, 14.6 percent of
respondents use for tax returns, 32.8 percent use for mobile recharge, 15.6 percent use for investment purpose, 14.1 percent use
for railway ticket booking and 17.2 percent for payment DTH bill. 17.7 percent of the respondents are having access of e-banking
services at home, 17.2 percent of the respondents are having access of e-banking services at office, 27.1 percent of the respondents
are having access of e-banking services at Mobile and 54.2 percent of the respondents are having access of e-banking services at
home, office and mobile.
This part of the analysis provides the information on the views of the respondents using e-banking services with regard
to the e-banking service qualities.
To understand the e-banking services provided by the banks, nine key service quality dimensions been taken for analysis
are system availability, accuracy, efficiency, security, responsiveness, easiness and convenience, cost effectiveness and problem
handling. Under each of key service quality dimension five scales been taken to evaluate the service qualities
The performance of electronic banking channels with respect to the service quality dimensions. The respondents were
asked the latest electronic service they have used. It was revealed that more customers have adopted ATM banking (91.1%) than
M. L Ranjini, K. R Mahesh Kumar, International Journal of Advance Research, Ideas and Innovations in Technology.
© 2017, www.IJARIIT.com All Rights Reserved Page | 702
online banking, mobile banking, credit card and Tele banking. This implies that banking customers are more familiar with the ATM
technology as compared to online banking, mobile banking, credit card and Tele banking.
The inter correlation matrix between e-banking services and qualities of e- banking services inferred that there is a highly significant
relationship between credit card and telebanking, system availability, security and responsiveness. Inferred that there is a highly
significant relationship between online banking and mobile banking, telebanking, Inferred that there is a highly significant
relationship between mobile banking and online banking, telebanking, efficiency security, responsiveness, easiness and convenience
and problem handling. Inferred that there is a highly significant relationship between telebanking and credit card, online banking,
problem handling.
Opinion regarding the problems of e-banking services;
Table 4.9 indicates the opinions of the respondents regarding the problems faced by them while dealing with the e-banking
services. A majority (24.5%) of the respondents have given third rank for the problem faced by forgotten password about the usage
of e-channels , a majority(29.2%) have given fifth rank for the problem faced of insufficient number of ATM’s, majority (29.2%)
of the respondents have given fifth rank for the location is unsuitable of ATM’s, majority(25%) of the respondents have given third
rank for the problem network issues, majority (36.5%) of the respondents have given fifth rank for the inadequate knowledge
about the usage of E-channels, majority (32.8%) of the respondents have given fifth rank for the Lack of confidence, majority
(28.1%) of the respondents have given fifth rank the technical issues, majority(36.5 %) of the respondent have given fifth rank for
the problem misplace of card, vast majority (38%) of the respondents have given fifth rank for the problem of misuse of card and
frauds.
Cross tabulation on age of the respondents and the qualities of overall e- banking services.
Out of the total respondents 30.7 percent of the respondents of the age group of 21 to 30 years, perceived that the overall
e-banking services qualities are high. 1.0 percent of age group of 18 to 20 and 31 to 40 years perceived that the overall e-banking
services qualities are low.Cross tabulation on gender and the qualities of e-banking services
This indicates that there is no significant association between age of the respondents and their overall e-banking services
qualities. The mean value depicting gender level satisfaction with regard to each service quality dimension and overall e-banking
services qualities. Compared to mean value of female gender 1.94 the mean value of male gender 2.06 shows the male gender
satisfied with the e-banking services qualities.
Cross tabulation on association between occupation and the qualities of e- banking services.
The mean value calculated on the opinions perceived by the respondents of different occupational groups regarding the e-
banking services qualities provided by banks.
The system availability of businessman regarding e-banking service quality shows the highest mean value of 2.58
The accuracy of banks in providing e- banking services in the opinion of the businessman shows the highest mean value of
2.54
The efficiency provided by the banks viewed by the other occupational group with the high mean value of 3.00
The security of banks in providing e- banking services in the opinion of the student shows the highest mean value of 2.60
The responsiveness of banks in providing e- banking services in the opinion of the other occupation groups shows the
highest mean value of 3.50
The easiness & convenience of banks in providing e- banking services in the opinion of the students shows the highest
mean value of 2.45 & 2.50
The cost effectiveness of banks in providing e- banking services in the opinion of the other occupation groups shows the
highest mean value of 3.00
The problem handling of banks in providing e-banking in the opinion of professional group has perceived with the highest
mean value of 2.62
The overall mean value of students respondents is 2.35, is 116.22, businessman is 2.08, salaried class is 1.88, professional
respondents is 2.16 and others is 1.50 with regard to overall e-banking services qualities.
Cross tabulation on difference between educational qualification of the respondents and the qualities of overall e-
banking services
The respondents of HSC level have high level of mean value 2.20, professional degree level have mean value of 2.05, graduate level
have the mean value of 2.01 and post graduate level have a mean value of 1.94.
Cross tabulation on difference between income of the respondents and the overall e-banking services qualities.
The respondents belonging to the income group of no income group have the highest mean value of 2.41. the respondents of the
income group of 8 to 10 Lakhs to ranks next with the mean value of 2.12, the respondents of the income group of less than Lakh
M. L Ranjini, K. R Mahesh Kumar, International Journal of Advance Research, Ideas and Innovations in Technology.
© 2017, www.IJARIIT.com All Rights Reserved Page | 703
and 2 to 4 Laksh has same ranks with the mean value of 2.00, the respondents of the income group of 10 and above ranks next with
the mean value of 1.88, the respondents of the income group of 5 to 7 Lakhs ranks next with the mean value of 1.86.
Cross tabulation between name of bank of the respondents and the overall e-banking services qualities
According to the opinions of the respondents, the State Bank of India have the highest mean value of 2.12, the ICICI Bank
rank the second with the mean value of 2.06, the Bank of Baroda Bank is in the third rank with the mean value of 1.94, the HDFC
bank is in the fourth place with mean value of 1.90. The ranking indicates the level of satisfaction of the bank customers with the
service qualities provided by the bank.
FINDINGS BASED ON THE RESULTS OF TEST OF HYPOTHESES
1. H1: There is no significant difference between nationalized banks and private banks of the respondents and the e-banking
services
i. Tools used
The hypothesis given above is tested using Mann-Whitney test
ii. Results
The table 4.10 reveals that there is no significant difference between nationalized banks and private banks of the respondents
and their e-banking services.
[ATM/Debit card=.205>0.05 / Credit card=.190>.0.05 / mobile banking=.469>0.05 / online banking=.288>0.05 / Tele banking
=.584>0.05]. It is clear that the customers are willing to use the e-banking services but they do not give much consideration
whether the bank is nationalized or private.
2. H1 : There is no significant difference between nationalized banks and private banks of the respondents and their various
problems faced in e-banking services.
i. Tools used
The hypothesis given above is tested using Mann-Whitney test
ii. Results
The table 4.11 reveals that there is no significant difference between nature of bank of the respondents and their various
problems faced in e-banking services. [Problems faced by forgotten password about the usage of e channels =.133>0.05 / insufficient
number of ATMs=.802>0.05/, Location is unsuitable for ATM’s=.529>0.05, Network Issue=0.197<0.05/ lack of inadequate
knowledge about the usage of E-Channels =.626>0.05/Lack of confidence (Security PIN Code, Card Number, CVV Number)OPT
Number =.013<0.05/ Problem in technical issues in ATM’s Smart card and credit card = .892>0.05/ Problem in Misplace
of card =.350>0.05/, Misuse of card and frauds =.078>0.05. it is clear that the problems faced by the respondents may decrease
their e-banking habits.
3. H1: 3 there is no significant difference between gender, occupation, area of residence, monthly income of the respondents and
the qualities of overall e-banking services.
H1 : There is a significant difference between gender of the respondents and their overall e-banking services qualities.
i. Tools used
The hypothesis given above is tested using students t test.
ii. Results
The above table 4.13 reveals that there is a significant difference between gender of the respondents and their overall e-
banking services qualities [System Availability = .984 > 0.05/ Accuracy = .136 > 0.05/ Efficiency = .053 > 0.05/ Security = .002
< 0.05 / Responsiveness = .070 > 0.05/ Easiness = .114 > 0.05/ Convenience = .586 > 0.05/ Cost Effectiveness = .172 > 0.05/
Problem Handling = .435 > 0.05 Overall e-banking services qualities = .689 > 0.05]. it is clear that female category still not ready
with full confidence in their opinion to deal with e-banking services.
H1 : There is a significant difference between occupation of the respondents and the qualities overall e-banking services.
i. Tools used
The hypothesis given above is tested using one way ANOVA ‘F’ test.
ii. Results
The table 4.15 reveals that there is significant difference between occupation of the respondents and the qualities of the
overall e-banking services [System Availability = .0.043 < 0.05/ Efficiency = .000 < 0.05/ Responsiveness = .039 < 0.05/ Overall
e-banking services qualities = .026 < 0.05]. Hence, the calculated value is lesser than table value, the research hypothesis is accepted
and the null hypothesis is rejected.

M. L Ranjini, K. R Mahesh Kumar, International Journal of Advance Research, Ideas and Innovations in Technology.
© 2017, www.IJARIIT.com All Rights Reserved Page | 704
The table 4.15 reveals that there is no significant difference between occupation of the respondents and the qualities of the
overall e-banking services [Accuracy = .0.065 > 0.05/ Security = .070 > 0.05/ Easiness = .091 > 0.05/ Convenience = .245 > 0.05/
Cost Effectiveness= .0535 > 0.05/ Problem Handing = .173 > 0.05]. Hence, the calculated value is greater than table value, the
research hypothesis is rejected and the null hypothesis is accepted. It is clear from the results that the respondents will be utilizing
the e-banking services according to their necessity.
H1: There is no significant difference between educational qualification of the respondents and the qualities overall e-banking
services.
i. Tools used
The hypothesis given above is tested using one way anova ‘f’ test
ii. Results
The table 4.16 reveals that there is no significant difference between educational qualification of the respondents and the qualities
of the overall e-banking services [System Availability = .0.919 > 0.05/ Accuracy = .640 > 0.05/ Efficiency = .071 > 0.05/ Security
= .611 > 0.05 / Responsiveness = .569 > 0.05/ Easiness = .198 > 0.05/ Convenience = .618 > 0.05/ Cost Effectiveness= .0892 >
0.05/ Problem Handing = .753 > 0.05/ Overall E-banking service = .754 > 0.05]. It is clear that the respondents are using the e-
banking services based on their occupational needs.
H1: There is a significant difference between income of the respondents and their overall e-banking services qualities.
i. Tools used:
The hypothesis given above is tested using one way ANOVA ‘f’ test.
ii. Results
The above table 4.17 reveals that there is no significant difference between income of the respondents and their overall e-
banking services qualities. [System Availability = .0.789 > 0.05/ Accuracy = .899 > 0.05/ Efficiency = .0243 > 0.05/ Security =
.214 > 0.05 / Responsiveness = .103 > 0.05/ Convenience = .424 > 0.05/ Cost Effectiveness= .0595 > 0.05/ Problem Handing =
.675 > 0.05/ Overall E-banking service = .124 > 0.05]. Hence, the calculated value is greater than table value, the research
hypothesis is rejected and the null hypothesis is accepted.
The above table 4.17 reveals that there is significant difference between income of the respondents and their overall e-
banking services qualities. [Easiness = .198 > 0.05]. Hence, the calculated value is lesser than table value, the research hypothesis
is accepted and the null hypothesis is rejected. It is clear that in spite of the income level all the income group people are utilizing
the e-banking services.
4. H1: There is significant difference between account access through internet of the respondents and the qualities of the overall e-
banking services.
i. Tools used
The hypothesis given above is tested using students t test.
ii. Results
The table 4.18 reveals that there is no significant difference between the respondents who are having account access through internet
and the qualities of overall e-banking services. [System Availability – a) Home = .408 > 0.05/ b) Office = .421 > 0.05/ c) Mobile
= .154 >0.05/ d)All the above = .191 > 0.05 / Efficiency - a) Home = .167> 0.05/ b) Office = .655 > 0.05/ c) Mobile = .280 >0.05/
d)All the above = .089 > 0.05/ Cost Effectiveness - a) Home = .246 > 0.05/ b) Office = .892 > 0.05/ c) Mobile = .612 >0.05/ d)All
the above = .319 > 0.05. Therefore, the calculated value is greater than the table value. So, the research hypothesis is rejected and
null hypothesis is accepted. It is inferred that the level of Satisfaction is more through access of e-banking services through home,
office, mobile and also all the above. But the mean difference is not much difference between each e-banking service qualities.
The table 4.18 reveals that there is significant difference between the respondents who are having account access through internet
and the qualities of overall e-banking services. [Accuracy – a) Home = .627 > 0.05/ b) Office = .888 > 0.05/ c) Mobile = .017 <
0.05/ d)All the above = .005 < 0.05 / Security - a) Home = .307> 0.05/ b) Office = .243> 0.05/ c) Mobile = .057 >0.05/ d)All the
above = .031 < 0.05/ Responsiveness - a) Home = .464 > 0.05/ b) Office = .551 > 0.05/ c) Mobile = .005 < 0.05/ d)All the above
= .000<0.05/ Easiness - a) Home = .005 < 0.05/ b) Office = .832 > 0.05/ c) Mobile = .006 <0.05/ d)All the above = .041<0.05/
Convenience - a) Home = .300 > 0.05/ b) Office = .190 > 0.05/ c) Mobile = .046 < 0.05/ d)All the above = .240 > 0.05/ Problem
Handling - a) Home = .545 > 0.05/ b) Office = .853 > 0.05/ c) Mobile = .001 < 0.05/ d)All the above = .000 < 0.05/ Overall E-
banking service - a) Home = .953 > 0.05/ b) Office = .409 > 0.05/ c) Mobile = .001 < 0.05/ d)All the above = .110 > 0.05.
Therefore, the calculated value is less than the table value. So, the research hypothesis is accepted and null hypothesis is rejected. It
is inferred that the level of Satisfaction is less through access of e-banking services through mobile and also all the above. But the
mean difference is not much difference between each e-banking service qualities.
5. H1: There is significant relationship between the e-banking services like ATM/ Debit card, Credit Card, Mobile banking, online
M. L Ranjini, K. R Mahesh Kumar, International Journal of Advance Research, Ideas and Innovations in Technology.
© 2017, www.IJARIIT.com All Rights Reserved Page | 705
banking and Tele banking of the respondents and the overall e-banking services.
i. Tools used
The hypothesis given above is tested using Pearson correlation test.
ii. Results
The table 4.19 reveals that there is no significant relationship between nature of e- banking services like ATM/Debit card,
Credit card, Mobile banking, Online banking and Tele banking of the respondent and their overall e-banking service. it is clear that
the nature of e-banking services are connected to each other in one way or another.
6. H1:
There is a significant relationship between various modes of e-banking services (mobile recharging, payment of telephone bill,
payment of electric bill, money transfer, railway ticket booking, air ticket booking, filing of tax returns, investment etc) of the
respondents and the qualities of overall e- banking services.
i. Tools used
The hypothesis given above is tested using pearson correlation t test.
ii. Results
The table 4.32 reveals that there is no significant relationship between various modes of e-banking services (mobile
recharging, payment of telephone bill, payment of electric bill, money transfer, railway ticket booking, air ticket booking, filing of
tax returns, investment etc) of the respondents and the qualities of overall e-banking services. The speed and facility of the e-
banking services has made customers to utilize the facility in spite of the qualities of e-banking services.
7. H1: There is a significant relationship between various modes of e-banking services (mobile recharging, payment of telephone
bill, payment of electric bill, money transfer, railway ticket booking, air ticket booking, filing of tax returns, investment etc) of the
respondents and their various problems of overall e-banking services.
i. Tools used
The hypothesis given above is tested using pearson correlation test.
ii. Results
The table 4.20 reveals that there is no significant relationship between various modes of e-banking services (mobile
recharging, payment of telephone bill, payment of electric bill, money transfer, railway ticket booking, air ticket booking, filing of
tax returns, investment etc) of the respondents and their various problems of overall e-banking services. It is clear that the problems
related to the e-banking services may reduce the habits of e-banking services.
SUGGESTIONS
The analysis of work with different aspects of e-banking services shows the satisfaction level of the customers which can be used
by banks as guide line for necessary actions leading to improvements of the quality of the e-banking services they offer.
The study was carried out to determine the opinions and problems of customers. This will enable the banks to understand at which
point the customers cease to be satisfied with service they are receiving.
Measuring customer satisfaction is paramount importance for improving service quality and retaining customers on a long-
term basis. The study demonstrates that there are 9 factors that affect satisfaction with regard to e-banking services in the study area.
The study reveals that the insufficient number of ATM’s Improper location of ATMs not maintaining adequate cash with full
denomination, security concern, connectivity, fees and charges, frequents out of order of ATMs, restriction for use other cards are
some of the major problem faced by the e-banking users in the study areas.
Majority of Customers are satisfied with online service because it saves their time and efforts. Besides, the system, being
cost effective, enables them to accomplish their banking transactions by sitting anywhere and anytime. Respondent also find
convenient to transfer money from one account to another from one place to another, 90% of respondents committed to use online
banking only. The use of technology in banking enhances the service offering to the customers. Efficiency from bank side should
increase to the customer. Promotion tool should use by banks very effectively to the e-banking service to the e-banking services and
awareness of e-banking services should be done to e-banking user. Banks must take more steps to introduce the e-banking habits
among the age group below 25 years. This can be done through the educational institutions. The banks must take necessary steps
to improve the efficiency in the service delivery hence boosts up customers’ confidence.
The bank must make the e-banking services to general public in easy and under stable way like payment of electricity bill, payment
of telephone bill, tax payer, making investment. So that the customer can feel free to use these service. The bank must welcome the
complaints and feedback from customer so that bank can improve their services in e-banking.

M. L Ranjini, K. R Mahesh Kumar, International Journal of Advance Research, Ideas and Innovations in Technology.
© 2017, www.IJARIIT.com All Rights Reserved Page | 706
Out dated machine and e-service should be removed and welcome for new and modern machine and introduction of new e-banking
service should be create awareness among customer it is very important so that the customers come to know about the services
provided by the bank and upcoming innovations in banks should be informed to customer. Banks have to meet the needs of
customers. Bank should able to gain the customer loyalty by providing them adequate security in e-banking services. Good
connectivity and power base the will enable them to serve customer faster and there should not be any problem in network while
using the e-banking services.
Future research
This research reveals certain aspects of customer satisfaction in context of e-banking, there is lot of room for future research in
order to ascertain and enrich online banking service in India.
1. Broader concept of e-banking service should be taken into account such as online shopping, online ticketing etc.
2. By taking into consideration research ought to apply for more comprehensive approach by making a comparative
analysis of branch and online/e-banking service to the same aspect of study
3. Different types of e-banking services modes can be taken as research are to have depth study.
4. Problem of E-banking can be taken as the research areas in depth and dealt as a broader area of research.
Conclusions
Banking sector today has a compelling demand for improvement, to survive the substantial competition in today’s scenario. Today
the click of the mouse offers customers banking services at a much lower coat and also empowers them with unprecedented freedom
in choosing the service needs. Banks have to upgrade and constantly thin of new innovative customized packages and services to
remain competitive. The Invasion of banking y technology has created an information age and commoditization of banking services
Therefore, E-banking has become a strategic weapon for banks to remain profitable. Electronic banking has become a necessary
survival weapon and is fundamentally changing the banking industry worldwide. Today, the click of a mouse offers bank customers
services at a much lower cost and also empowers them with unprecedented freedom in choosing vendors for their financial service
needs. The study finds that many banks’ customers are fully aware of e-banking services. Most customers however still patronize
the bank branches and find interaction with human tellers as very important as they got distracted with the problems (inadequate
knowledge about the usage of e-banking services, lack of interest, poor network, pass word forgotten, card misplace and lack of
confidence. It also finds that customers enjoying electronic banking services are still not satisfied with quality and efficiency of the
services. Customers perception of and reactions to the developments of e-banking services are issues of concern to both government
and banking industry. A lot need to be done to create confidence in the minds of customers about the benefits and security of the e-
banking services.
Bibliography
1. http://www.banknet india.com
2. http://rbi.co.in
3. http://indianbankassociation.org
4. http://www.sbi.co.in
5. http://bankofbaroda.co.in
6. http://icici.com
7. http://hdfcbank.com
Books and Journals referred
1. E-service journal
2. Journal of financial services marketing
3. Business review
4. Journal of marketing management
5. RBI Bulletins
Top Related