


Languages
Pages
Legal

Jordan Journal of Pharmaceutical Sciences, Volume 4, No. 3, 2011
- 237 - © 2011 DAR Publishers/University of Jordan. All Rights Reserved.
Received on 12/7/2010 and Accepted for Publication on
2/2/2011. E-mail: [email protected]
Encapsulation of Theophylline into Binary Blend of Ethylcellulose and EudragitMicroparticles: Development, Characterization and Kinetic Release.
Gowda D.V., Mohammed S. Khan., Aravindram A.S., Shivakumar H.G.
1 Department of Pharmaceutics, JSS College of Pharmacy, JSS University, Mysore, Karnataka, India.
ABSTRACT
The objective of this study was to prepare and evaluate microparticles of Eudragit and Ethyl cellulose binary
blend loaded with theophylline for controlled release. Microparticles were prepared by Phase separation method.
The method is quite simple, rapid, and economical and does not imply the use of toxic organic solvents. Solid,
discrete, reproducible free flowing microparticles were obtained. The yield of the microparticles was up to 92%.
More than 85% of the isolated microparticles were of particle size range of 325 to 455 µm. The obtained angle
of repose, % carr’s index and tapped density values were well within the limits, indicating that prepared
microparticles had smooth surface, free flowing and good packing properties. Scanning Electron Microscopy
photographs and calculated sphericity factor confirms that the prepared formulations are spherical in nature.
Prepared microparticles were sTab. and compatible, as confirmed by DSC and FT-IR studies. The prepared
formulations were quantitatively analyzed for the amount of encapsulated drug. It was observed that there is no
significant release of the drug at gastric pH. The drug release was controlled more than 12 h. Intestinal drug
release from microparticles was studied and compared with the release behavior of commercially available oral
formulation Duralyn CR 400. The release kinetics followed different transport mechanisms.
Keywords: Microparticles, Phase Separation, Theophylline, Fickian Release, Eudragit.
INTRODUCTION
The oral drug delivery has its own importance
because of its ease of administration and patient
compliance. Though the conventional oral drug delivery
systems achieve both local and systemic effects, there is
no control over drug release from dosage forms that may
lead to local or systemic toxicity.
These limitations shifted the focus of pharmaceutical
scientists towards the novel drug delivery systems (NDDS),
where the required amount of drug is made available at
desired time and site of action in the body. These systems
maintain plasma concentrations with in the therapeutic
range, which minimizes side effects and also reduces
frequency of administration. Multiparticulates offer greater
advantages over single unit system as they disperse
uniformly in GI tract, offer flexibility and less inter and
intra individual variability in formulation process.
Multiparticulates present several advantages in comparison
with single unit forms that they exhibit higher colonic
residence time and more predicTab. gastric emptying 1.
One such novel approach is the administration of
drug orally in the form of microparticles. A
‘microparticle’ may be defined as particle with size
varying from 1 to 1000μm containing a drug dissolved,
dispersed or adsorbed on to the surface of the particle.
Asthma is a chronic obstructive lung disease
characterized by airways inflammation and
hyperreactivity. In most patients, conditions worsen at
night with acute exacerbation being in most common 2.
Clinical and epidemiological studies suggest that asthma
is several hundred folds more likely at night than during
day with disturbance of sleep. The heightened risk of

Encapsulation of Theophylline… Gowda D. V. et al
- 238 -
asthma at night coincides with the trough of circadian
rhythm. A colonic drug delivery system would be
valuable when a delay in absorption of drug is
therapeutically desirable in treatment of chronic
conditions like nocturnal asthma, which coincides with
trough of circadian rhythm 3.
The model drug used in the present study is
Theophylline. Theophylline belongs to anti-asthmatic
category, lipophilic in nature with narrow therapeutic index
and short half life 4, hence a controlled release product is
advisable than conventional dosage form.
Conventional dosage forms are to be taken several times
a day in divided doses, a controlled release product will
definitely reduce the dose requirements and, in turn reduces
the patient health care costs and toxic side effects.
Eudragit and ethylcellulose have been used as drug
carriers to achieve controlled drug delivery for the past few
decades. These polymers have gained a lot of interest owing
to their versatile properties. These polymers are bio
compatible and gastro-resistant, and due to its non
immunogenic properties, they have been employed for many
type of biomedical applications. Many researchers had
already worked on the suitability of blend of polymers for
controlled drug delivery. Huang et al.5 prepared nifedipine
molecular dispersion using binary blends of ammonia
methacrylate copolymer and ethylcellulose for controlled
drug delivery. Besides, Das et al.,6 prepared microparticulate
dosage form for a highly soluble drug, diltiazem
hydrochloride, with Eudragit RS100 and RL100 using a
novel dual polymer technique.
The objective of this study was to prepare and evaluate
microparticles of Eudragit and Ethyl cellulose binary blend
loaded with theophylline for controlled release.
Microparticles were prepared by Phase separation method.
The method is quite simple, rapid, and economical and does
not imply the use of toxic organic solvents. The formulations
were prepared using different polymer ratios. The prepared
microparticles were characterized by FT-IR analysis, DSC,
particle size analysis, micromeritic properties and SEM. They
were further evaluated for drug loading, encapsulation
efficiency, in vitro drug release.
EXPERIMENTAL SECTION
Materials
Theophylline hydrochloride (TH) was a gift sample from
French Pharma, Chandigarh, India. Ethylcellulose (EC) was
purchased from S. D. Fine-Chem Limited, Mumbai, India.
Eudragit RL100 was a gift sample from Cadila, Ahmedabad,
India. All other chemicals used were of analytical reagent
grade.
Preparation of Theophylline microparticles
Drug-loaded microparticles were prepared by phase
separation 7 method as shown in Table 1. Weighed amounts
of theophylline were dissolved in 20ml of
dimethylformamide, and this solution was added to 30ml
acetone solution containing eudragit and ethyl cellulose
polymer blend at different EU/EC ratios. Under constant
stirring at 600 rpm, a 30ml of non solvent (pH 10.0
Ammonia buffer) was added drop wise to the drug and the
polymer solution. In the course of the water addition, the drug
and the polymer were co-precipitated out to form
microparticles. The resultant microparticle suspension was
vacuum filtered with a whatmann # 5 and then vacuum dried
at room temperature for 72 hours. The dried microparticles
were stored in a desiccator at room temperature until use.
Table 1: Formulation chart of different batches of TH microparticles prepared.
Ingredients F1 F2 F3 F4 F5 F6 F7 F8 F9 F10
TH (mg) 400 400 400 400 400 400 400 400 400 400
EU RL100 (mg) 200 133 267 100 300 200 133 267 100 300
EC (mg) 200 267 133 300 100 200 267 133 300 100
DMF (ml) 20 20 20 20 20 - - - - -
Acetone(ml) 30 30 30 30 30 50 50 50 50 50
Ammonia buffer (pH 10) 30 30 30 30 30 30 30 30 30 30
*TH-Theophylline, EU Rl- Eudragit RL, EC- Ethyl cellulose, DMF- Dimethylformamide
Jordan Journal of Pharmaceutical Sciences, Volume 4, No. 3, 2011
- 239 -
Characterization of Microparticles
The prepared microparticles were characterized by
particle size analysis, angle of repose, compressibility,
sphericity and compatibility studies by Fourier transform
infra red spectroscopic analysis, Differential scanning
calorimetric analysis and surface morphology by
Scanning electron microscopy. The obtained
microparticles formulations were also evaluated for
percentage yield, drug loading and encapsulation
efficiency, in vitro drug release studies.
Particle size analysis
The particle size was measured using a Malvern
mastersizer 2000 version 5.1 (Malvern, UK.) The samples
of theophylline microparticles were dispersed in 1:20 with
methanol and measured at temperature of 37°C 8, 9.
Angle of Repose
Fixed funnel method was employed for determining
angle of repose. The angle of repose () for samples was
calculated using the formula,
Angle of Repose () = tan-1 (h / r) (1)
Where 'h' is height of heap and 'r' is radius of the heap.
Compressibility
Apparent bulk density was determined by pouring the
bulk samples into a graduated cylinder. Tapped density
was determined by placing a graduated cylinder
containing a known mass of powder on a mechanical
tapper apparatus (Electro lab tap density tester). Carr’s
index is calculated using the formula given below:
Carr’s index = (tapped density – bulk density) /
tapped density
Sphericity of the Microparticles
The sphericity of the prepared microparticles can be
determined by using a camera lucida by taking the
tracings of the microparticles on a black paper. The
tracings help calculate the circulatory factor and confirm
the sphericity of microparticles if the obtained values are
nearer to 1. The sphericity was determined by tracings
of Theophylline microparticles (magnification 45x)
which were taken on a black paper using camera lucida,
(Model -Prism type, Rolex, India) and circulatory factor
(S) was calculated as
S = P2 (2)
12.56 X A
Where A is area (cm2) and P is the perimeter of the
circular tracing
Fourier Transform Infrared Spectroscopy (FT-
IR)
Drug polymer interactions were studied by FT-IR
spectrophotometer (Shimadzu, 8033, USA) by KBr
pellet method. The IR spectrum of the pellet from 400 –
4000 cm-1 was recorded 10.
Differential Scanning Calorimetry (DSC)
All dynamic DSC studies were carried out on Dupont
thermal analyzer with 2010 DSC module. The
instrument was calibrated using high purity indium metal
as standard. The dynamic scans were taken in nitrogen
atmosphere at the heating rate of 10ºC/min heating rate
of 10ºC/min 11.
Scanning Electron Microscopy (SEM)
SEM photographs were taken for the prepared
microparticles with a scanning electron microscope,
Joel- LV-5600, USA, at the required magnification in
room temperature. The photographs were observed for
morphological characteristics. Photographs were taken at
the magnifications of 400X, 1500X and 3000X 12, 13.
Percentage Yield
Determining whether the preparation procedure
chosen for incorporating a drug into the polymers is
efficient and is of prime importance. The raw materials,
amount of active compound, Eudragit RL 100, Ethyl
cellulose, and other process parameters are deciding
factors for the yield of the product during the preparation
of microparticles.
The yield was determined by weighing the
microparticles and then finding out the percentage yield
with respect to the weight of the input materials, i.e.,
weight of drug and polymers used. The formula for
calculation of % yield is as follows;
% yield = wt. of drug + wt. of polymers x 100 (3)
wt. of microparticles
Drug Loading and Encapsulation Efficiency
100 mg of Theophylline microparticles were weighed
and transferred to 100 ml volumetric flask containing pH

Encapsulation of Theophylline… Gowda D. V. et al
- 240 -
7.4 phosphate buffer. From this, 1 ml of solution was
transferred to 10 ml volumetric flask and diluted up to
the mark. Further 1 ml of this solution is diluted to 10 ml
and absorbance was measured at 270 nm. The drug
content was calculated by using the formula
Amount of drug =
Conc. from standard graph X dilution factor (4)
1000
Percentage encapsulation efficiency (EE) 14 is found
out by calculating the amount of drug present in 100 mg
of microparticles. It is further calculated by using
formula
% EE = Tot. amt. of drug added - Amt. of drug in supernatant liquid X100 (5)
Total amt. of drug added
In Vitro Drug Release Studies
The in vitro release of drug from the microparticles
was carried out in basket type dissolution tester USP
XXIII, TDT-08L, with auto sampler containing 900 ml
of pH 1.2 buffer for the first 2 hrs and in 7.4 pH
phosphate buffer for the next 10 hrs. The volume of the
dissolution media was maintained at 900 ml while
constant stirring (100 rpm) and temperature of bath was
maintained at 37 ± 0.5°C. Aliquots (10 ml) of dissolution
media were sampled at specified time points and
replaced with fresh media immediately after sampling.
The samples are analyzed for drug content by UV visible
spectroscopy (Shimadzu UV 1601).The release data
obtained were fitted into various mathematical models to
know which mathematical model is best fitting for the
obtained release profile. Dissolution studies were carried
out for all the batches of the prepared formulations and
commercial formulation (Duralyn CR 400).
Drug Release Kinetics
In order to understand the mechanism and kinetics of
drug release, the drug release data of the in vitro
dissolution study was analyzed with various kinetic
equations. Coefficient of correlation (r) values were
calculated for the linear curves obtained by regression
analysis of the above plots. A difference factor (f1) and
similarity factor (f2) were calculated from dissolution
data according to the following equations;
(6)
(7)
where, f1 - difference factor, f2 - similarity factor, n –
number of time point, Rt – dissolution value of the
reference at time, ‘t’ and Tt - dissolution value of test
formulation at time ‘t’. Difference factor, f1 was
calculated by the percentage difference between the two
curves at each time point and measured the relative error
between the two curves. The accepTab. range for
difference factor, f1 is 0 -15. The similarity factor, f2,
was logarithmic reciprocal square root transformation of
the sum-squared error and is a measure of the similarity
in the percentage dissolution between the reference and
test products. If dissolution profile to be considered
similar, the values for f2 should be in the range 50 - 100.
RESULTS AND DISCUSSION
Ten formulations were prepared using different
polymer blend ratios: 1:1, 1:2, 1:3, 2:1 & 3:1. In the first
five formulations (F1 – F5), TP was dissolved in DMF
and in the next five formulations TP was dispersed in
acetone. The drug: polymer ratio used in all the
Jordan Journal of Pharmaceutical Sciences, Volume 4, No. 3, 2011
- 241 -
formulations was 1:1.
Various formulation and process variables that could
affect the preparation and properties of the
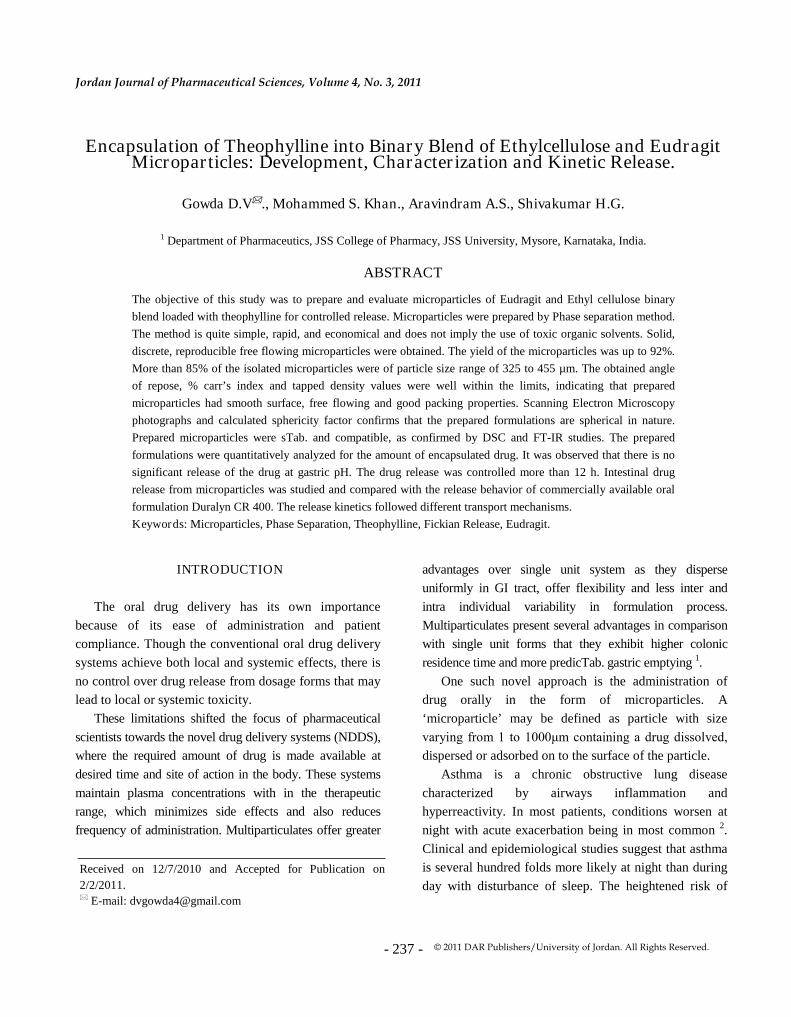
microparticles were identified and optimized to get
small, discrete, uniform, smooth-surfaced, and spherical
microparticles as shown in Figure 1.
The formulation variables included concentration of
the polymer blend and the solvents used. The process
variables included the stirring speed & time.
Added volume of Acetone and DMF affects the drug
loading. In the first five formulations (F1-F5), the drug
was dissolved in 20 ml of DMF, and in the next five
formulations (F6-F10), the drug was dispersed in 50ml
of acetone.
The important factor that influences the size
distribution of microparticles is the optimum stirring
speed and time. A stirring speed of 600 rpm and 40
minutes stirring time was used to obtain reproducible
microparticles. It was observed that with the increase in
the stirring speed from 600-900 rpm; there was a
decrease in the average size of the microparticles and
recovery yield of the microparticles. It was due to the
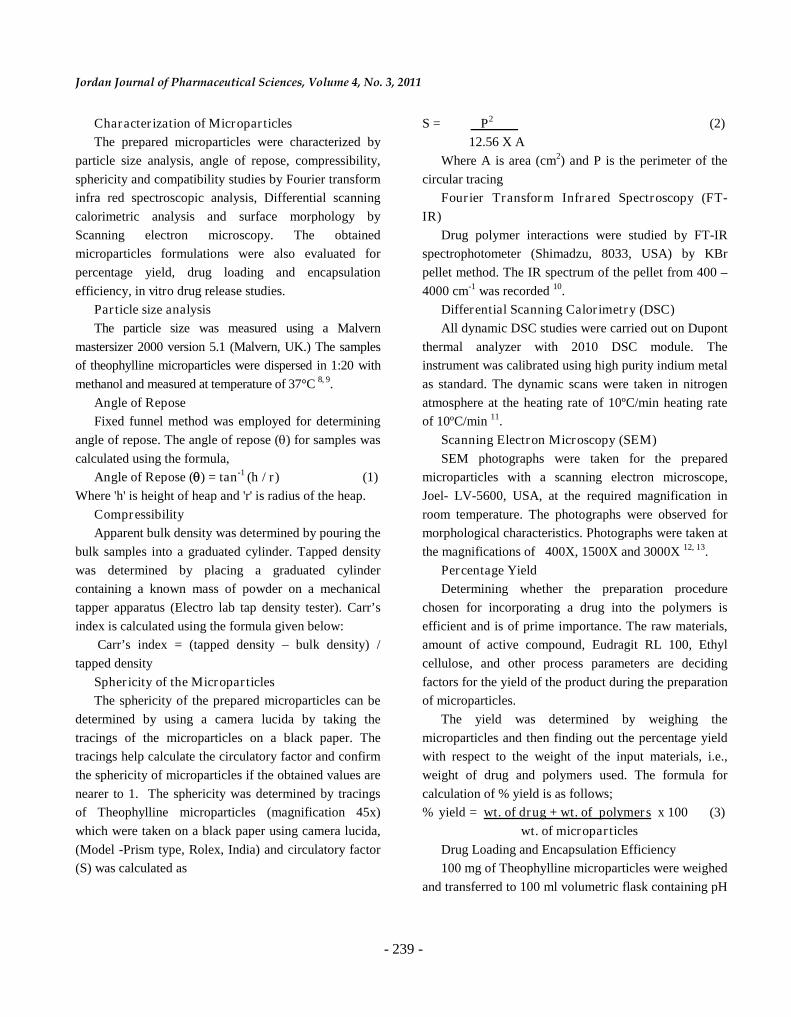
loss that occurred during successive filtration. When the
stirring speed was lower than 600 rpm, larger
microparticles were formed. Resulted microparticles
were composed of irregular masses, which were not
possible to distinguish as individual microparticles as
shown in the Figure 2.
Figure 1: Prepared TP loaded microparticles.
Figure 2: SEM images of prepared TP loaded
microparticles showing irregular masses.

Encapsulation of Theophylline… Gowda D. V. et al
- 242 -
When the stirring time was lower than 40 minutes, it
was observed that some amount of the dissolved mass
adhered to the inner sides of the beaker, resulting in
lower percentage yield shown in Table 2. Repeat
batches treated at an optimized rate proved to produce
reproducible sizes showing that stirring speed and
stirring time were well controlled.
Table 2: Effect of stirring time on percentage yield of
TP loaded Microparticles.
Time in minutes % yeild
10 55.14
20 65.32
30 81.1
40 92.36
Time in minutes % yeild
50 90.12
60 75.12
70 67.56
Micromeritic Properties
The flow property of the prepared theophylline
microparticles was studied by determining the angle of
repose (θ) and % compressibility index (CI). The
obtained data along with related parameters are
presented in Table 3. The values of θ ranged from 26.11
to 29.22, and the Carrs index was found to be between
11.01% to 14.11%. These results indicated that the
prepared microparticles exhibited good flow properties.
Table 3: Micromeritic properties and % yield of TP microparticles.
Formulation0
mean SD*
CI%
mean SD*
Tapped density
gm/cm3
mean SD*
% Yield
F1
27.10 ± 0.55 12.35 0.26 0.499 ± 0.04 88.24 ± 1.44
F2 26.45 ± 0.32 11.01 0.56 0.525 ± 0.01 92.36 ± 1.56
F3 28.44 ± 0.30 12.22 0.17 0.492 ± 0.06 90.24 ± 1.24
F4 27.45 ± 0.45 13.33 0.23 0.515 ± 0.02 88.42 ± 1.54
F5 28.44 ± 0.36 14.11 0.67 0.535 ± 0.03 87.56 ± 1.36
F6
26.11 ± 0.26 12.45 0.26 0.535 ± 0.06 87.12 ± 1.72
F7 27.34 ± 0.33 11.22 0.65 0.515 ± 0.02 86.32 ± 1.12
F8 28.12 ± 0.42 12.36 0.44 0.495 ± 0.06 85.33 ± 1.32
Jordan Journal of Pharmaceutical Sciences, Volume 4, No. 3, 2011
- 243 -
Formulation0
mean SD*
CI%
mean SD*
Tapped density
gm/cm3
mean SD*
% Yield
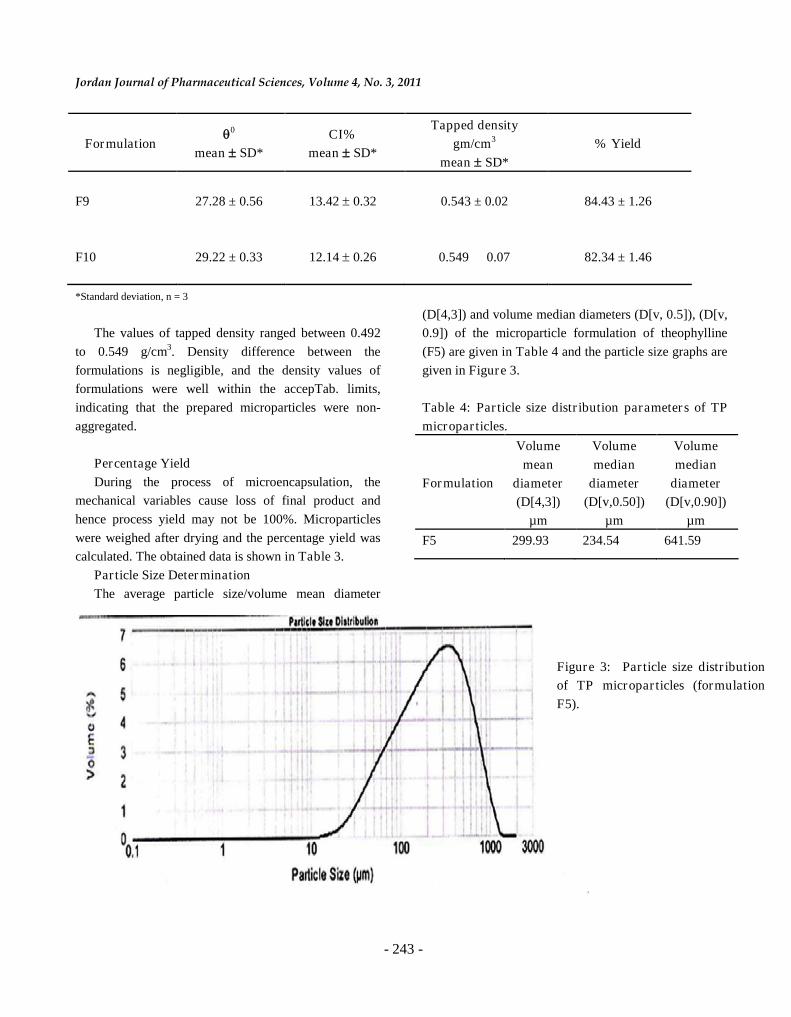
F9 27.28 ± 0.56 13.42 0.32 0.543 ± 0.02 84.43 ± 1.26
F10 29.22 ± 0.33 12.14 0.26 0.549 0.07 82.34 ± 1.46
*Standard deviation, n = 3
The values of tapped density ranged between 0.492
to 0.549 g/cm3. Density difference between the
formulations is negligible, and the density values of
formulations were well within the accepTab. limits,
indicating that the prepared microparticles were non-
aggregated.
Percentage Yield
During the process of microencapsulation, the
mechanical variables cause loss of final product and
hence process yield may not be 100%. Microparticles
were weighed after drying and the percentage yield was
calculated. The obtained data is shown in Table 3.
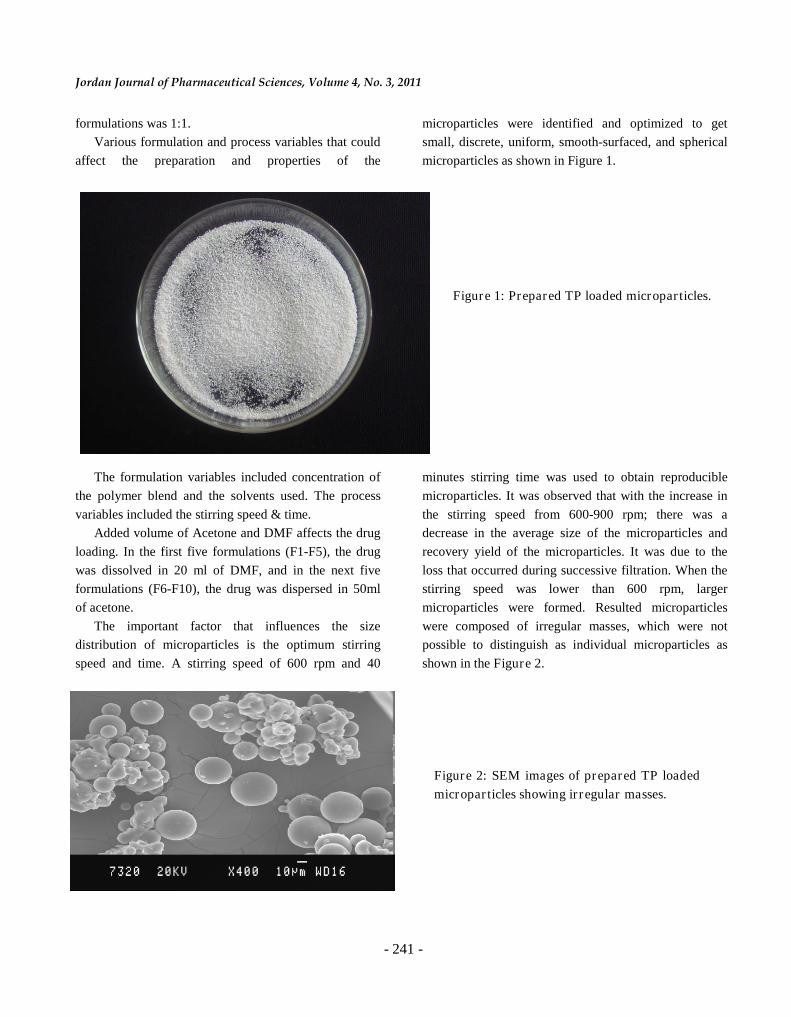
Particle Size Determination
The average particle size/volume mean diameter
(D[4,3]) and volume median diameters (D[v, 0.5]), (D[v,
0.9]) of the microparticle formulation of theophylline
(F5) are given in Table 4 and the particle size graphs are
given in Figure 3.
Table 4: Particle size distribution parameters of TP
microparticles.
Formulation
Volume
mean
diameter
(D[4,3])
µm
Volume
median
diameter
(D[v,0.50])
µm
Volume
median
diameter
(D[v,0.90])
µm
F5 299.93 234.54 641.59
Figure 3: Particle size distribution
of TP microparticles (formulation
F5).
Encapsulation of Theophylline… Gowda D. V. et al
- 244 -
D[4,3] is the volume mean diameter and the diameter
of the sphere having the same volume as that of the
microspheres of which size is being determined.
D[v,0.50] is the median diameter, and it is the value of
particle size that divides the population in to two equal
halves, i.e., there is 50% of distribution above this and
50% below this value. D[v,0.90] is the median diameter
and it is value for the particle size distribution, which
means 90% of the particle size distribution is below the
value shown in Table 5.
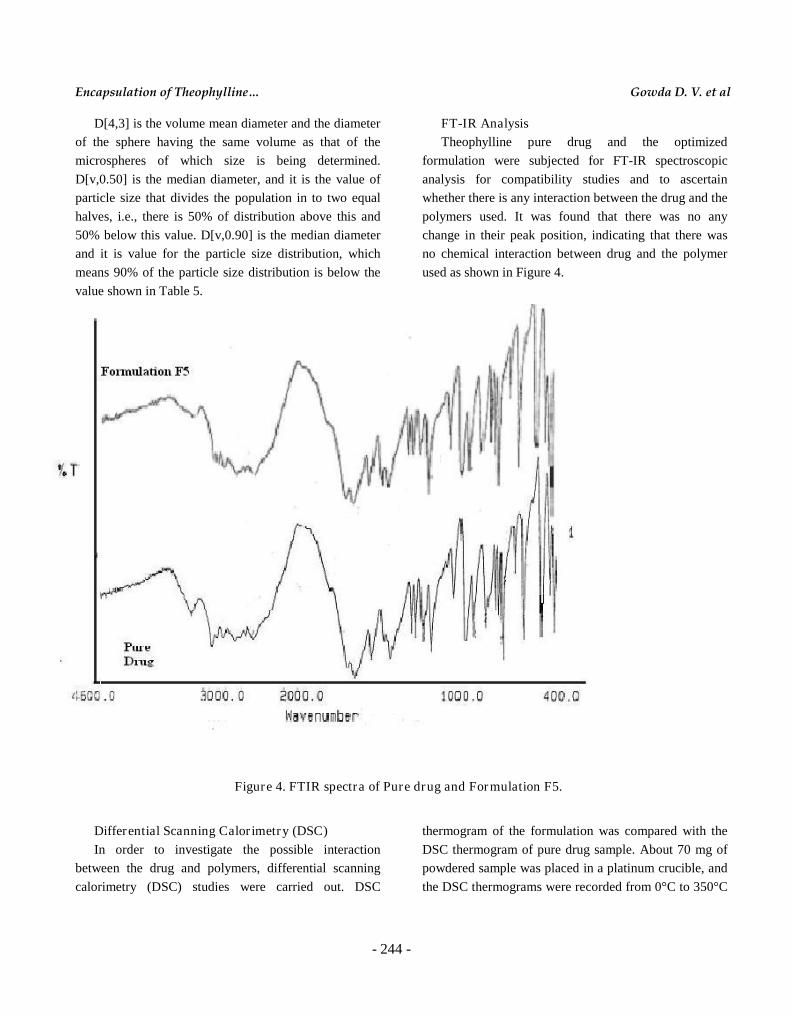
FT-IR Analysis
Theophylline pure drug and the optimized
formulation were subjected for FT-IR spectroscopic
analysis for compatibility studies and to ascertain
whether there is any interaction between the drug and the
polymers used. It was found that there was no any
change in their peak position, indicating that there was
no chemical interaction between drug and the polymer
used as shown in Figure 4.
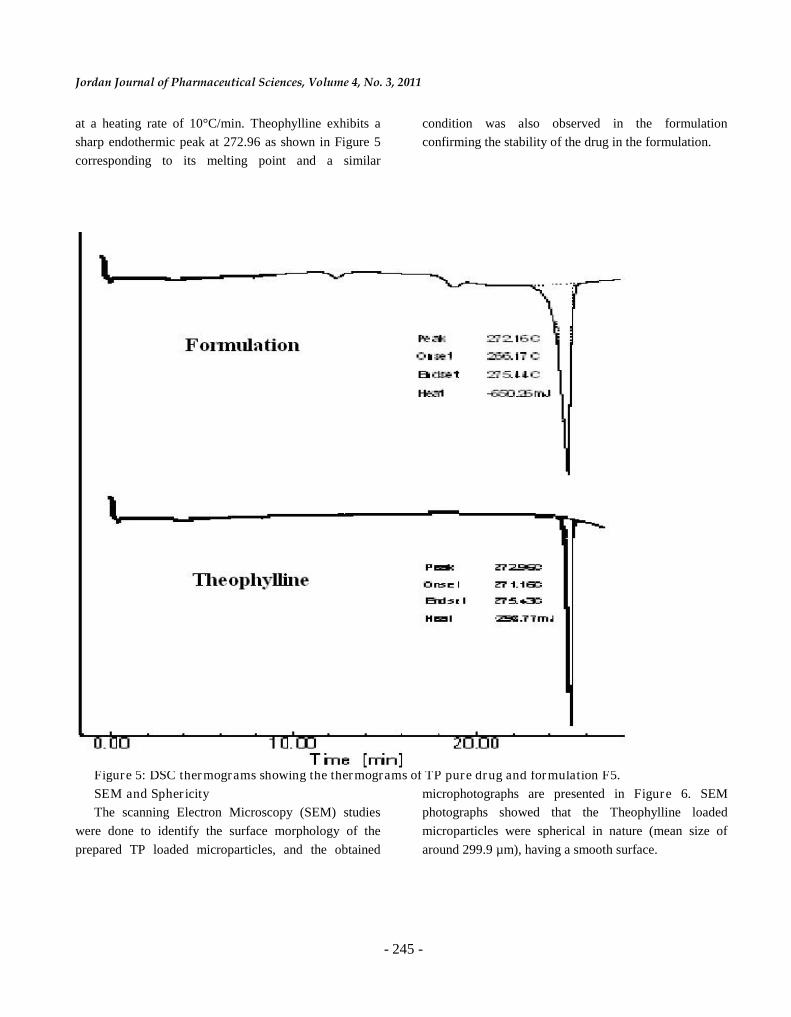
Differential Scanning Calorimetry (DSC)
In order to investigate the possible interaction
between the drug and polymers, differential scanning
calorimetry (DSC) studies were carried out. DSC
thermogram of the formulation was compared with the
DSC thermogram of pure drug sample. About 70 mg of
powdered sample was placed in a platinum crucible, and
the DSC thermograms were recorded from 0°C to 350°C
Figure 4. FTIR spectra of Pure drug and Formulation F5.
Jordan Journal of Pharmaceutical Sciences, Volume 4, No. 3, 2011
- 245 -
at a heating rate of 10°C/min. Theophylline exhibits a
sharp endothermic peak at 272.96 as shown in Figure 5
corresponding to its melting point and a similar
condition was also observed in the formulation
confirming the stability of the drug in the formulation.
Figure 5: DSC thermograms showing the thermograms of TP pure drug and formulation F5.
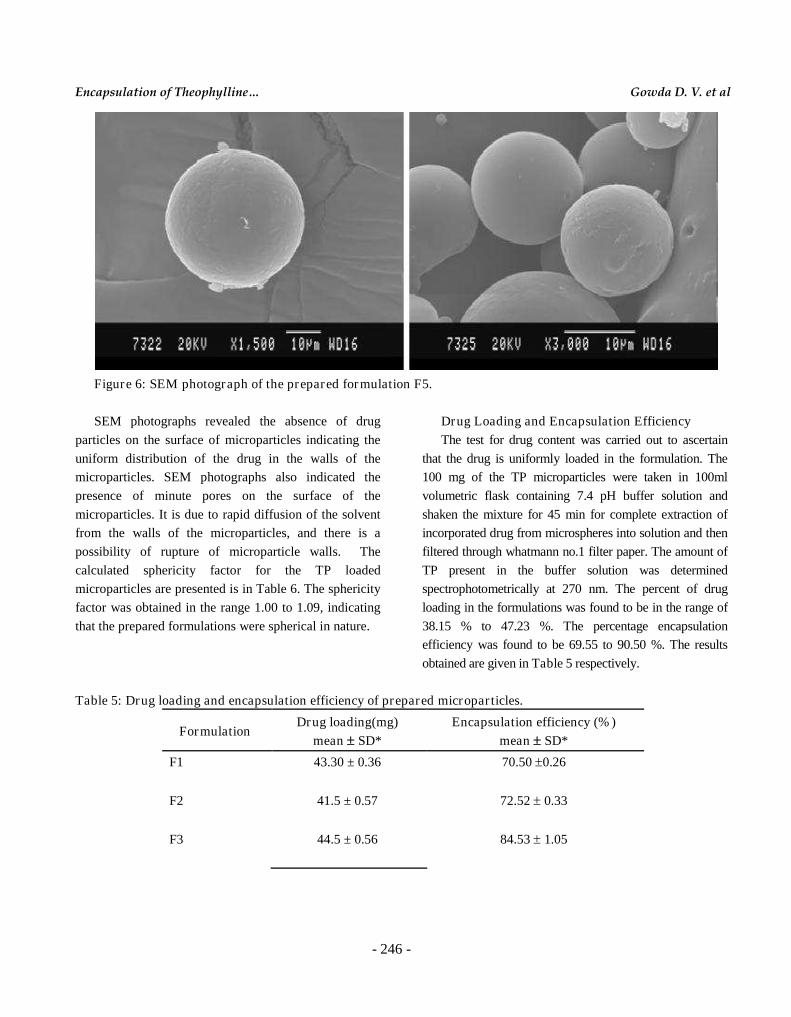
SEM and Sphericity
The scanning Electron Microscopy (SEM) studies
were done to identify the surface morphology of the
prepared TP loaded microparticles, and the obtained
microphotographs are presented in Figure 6. SEM
photographs showed that the Theophylline loaded
microparticles were spherical in nature (mean size of
around 299.9 µm), having a smooth surface.
Encapsulation of Theophylline… Gowda D. V. et al
- 246 -
Figure 6: SEM photograph of the prepared formulation F5.
SEM photographs revealed the absence of drug
particles on the surface of microparticles indicating the
uniform distribution of the drug in the walls of the
microparticles. SEM photographs also indicated the
presence of minute pores on the surface of the
microparticles. It is due to rapid diffusion of the solvent
from the walls of the microparticles, and there is a
possibility of rupture of microparticle walls. The
calculated sphericity factor for the TP loaded
microparticles are presented is in Table 6. The sphericity
factor was obtained in the range 1.00 to 1.09, indicating
that the prepared formulations were spherical in nature.
Drug Loading and Encapsulation Efficiency
The test for drug content was carried out to ascertain
that the drug is uniformly loaded in the formulation. The
100 mg of the TP microparticles were taken in 100ml
volumetric flask containing 7.4 pH buffer solution and
shaken the mixture for 45 min for complete extraction of
incorporated drug from microspheres into solution and then
filtered through whatmann no.1 filter paper. The amount of
TP present in the buffer solution was determined
spectrophotometrically at 270 nm. The percent of drug
loading in the formulations was found to be in the range of
38.15 % to 47.23 %. The percentage encapsulation
efficiency was found to be 69.55 to 90.50 %. The results
obtained are given in Table 5 respectively.
Table 5: Drug loading and encapsulation efficiency of prepared microparticles.
FormulationDrug loading(mg)
mean SD*
Encapsulation efficiency (%)
mean SD*
F1 43.30 ± 0.36 70.50 0.26
F2 41.5 ± 0.57 72.52 0.33
F3 44.5 ± 0.56 84.53 1.05
Jordan Journal of Pharmaceutical Sciences, Volume 4, No. 3, 2011
- 247 -
FormulationDrug loading(mg)
mean SD*
Encapsulation efficiency (%)
mean SD*
F4 39.50 ± 0.44 77.55 0.33
F5 47.23 ± 0.36 90.50 0.56
F6 41.11 ± 0.26 69.55 0.32
F7 38.15 ± 0.33 71.50 0.44
F8 43.50 ± 0.42 87.50 0.66
F9 38.50 ± 0.38 73.70 0.48
F10 41.20 ± 0.44 82.60 0.67
* Standard deviation, n = 3
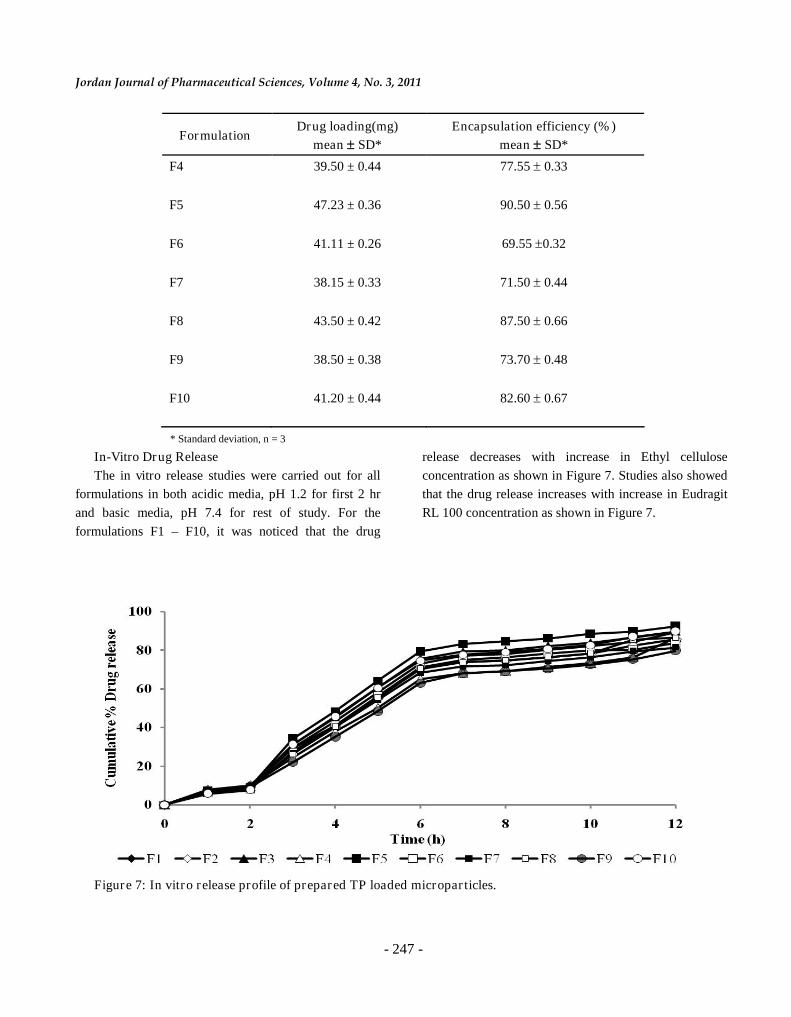
In-Vitro Drug Release
The in vitro release studies were carried out for all
formulations in both acidic media, pH 1.2 for first 2 hr
and basic media, pH 7.4 for rest of study. For the
formulations F1 – F10, it was noticed that the drug
release decreases with increase in Ethyl cellulose
concentration as shown in Figure 7. Studies also showed
that the drug release increases with increase in Eudragit
RL 100 concentration as shown in Figure 7.
Figure 7: In vitro release profile of prepared TP loaded microparticles.
Encapsulation of Theophylline… Gowda D. V. et al
- 248 -
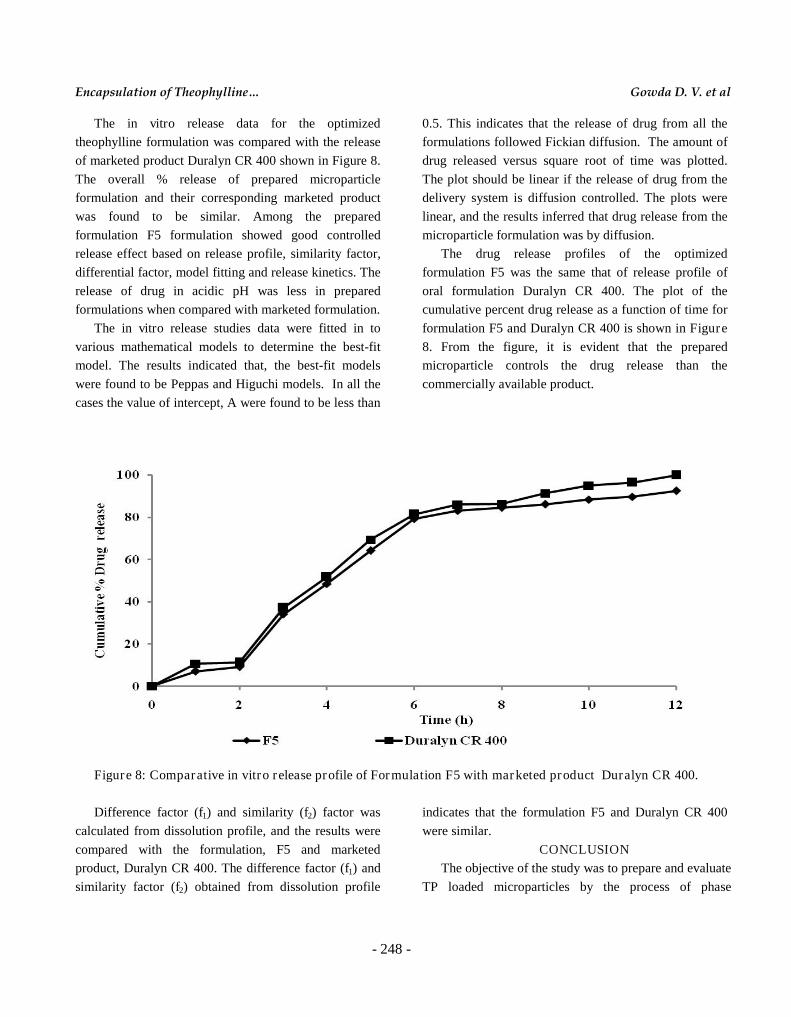
The in vitro release data for the optimized
theophylline formulation was compared with the release
of marketed product Duralyn CR 400 shown in Figure 8.
The overall % release of prepared microparticle
formulation and their corresponding marketed product
was found to be similar. Among the prepared
formulation F5 formulation showed good controlled
release effect based on release profile, similarity factor,
differential factor, model fitting and release kinetics. The
release of drug in acidic pH was less in prepared
formulations when compared with marketed formulation.
The in vitro release studies data were fitted in to
various mathematical models to determine the best-fit
model. The results indicated that, the best-fit models
were found to be Peppas and Higuchi models. In all the
cases the value of intercept, A were found to be less than
0.5. This indicates that the release of drug from all the
formulations followed Fickian diffusion. The amount of
drug released versus square root of time was plotted.
The plot should be linear if the release of drug from the
delivery system is diffusion controlled. The plots were
linear, and the results inferred that drug release from the
microparticle formulation was by diffusion.
The drug release profiles of the optimized
formulation F5 was the same that of release profile of
oral formulation Duralyn CR 400. The plot of the
cumulative percent drug release as a function of time for
formulation F5 and Duralyn CR 400 is shown in Figure
8. From the figure, it is evident that the prepared
microparticle controls the drug release than the
commercially available product.
Figure 8: Comparative in vitro release profile of Formulation F5 with marketed product Duralyn CR 400.
Difference factor (f1) and similarity (f2) factor was
calculated from dissolution profile, and the results were
compared with the formulation, F5 and marketed
product, Duralyn CR 400. The difference factor (f1) and
similarity factor (f2) obtained from dissolution profile
indicates that the formulation F5 and Duralyn CR 400
were similar.
CONCLUSION
The objective of the study was to prepare and evaluate
TP loaded microparticles by the process of phase

Jordan Journal of Pharmaceutical Sciences, Volume 4, No. 3, 2011
- 249 -
separation method for controlled release. Method
employed was simple, rapid and economical. The results
of micromeritic properties of the microparticles were well
within the limits, which indicate good flow potential for
the prepared microparticles. Drug loaded microparticles
exhibited spherical nature as evidenced by SEM
photomicrographs and sphericity studies. From the FTIR
and DSC studies, it was observed that there was no
chemical interaction between the drug and polymer
indicating that drug is in sTab. state. The drug content
study revealed uniform distribution of the drug in the
microparticles. The drug release rate was found vary
among the formulations depending on the compositions
of polymer used. The obtained dissolution data indicated
that the drug release through the microparticles follows
fickian diffusion. Optimized formulation F5 and
marketed product Duralyn CR 400 showed similarity in
drug release profile. Formulation F5 is an ideal
formulation for once daily administration. From the
results of the present experimental work, it is stated that
Theophylline could be formulated successfully into
microparticles as controlled drug release dosage form by
Phase separation method.
REFERENCES
(1) Asghar ALF, Chandran S. Mulltiparticulate formulation
approach to colon specific drug delivery: Current
perspectives. J Pharm Pharm Sci 2006;9:327-38.
(2) Smolensky MH, Lemmer B, Reinberg AE. Chronobiology
and chronotherapy of allergic rhinitis and bronchial
asthma. Adv Drug Del Rev 2007;59:852-82.
(3) Shivakumar HN, Suresh S, Desai BG. Design and
evaluation of pH sensitive mini Tab.ts for
chronotherapeutic delivery of theophylline. Indian J
Pharm Sci 2007;69:73-9.
(4) Tripathi KD. Essentials of Medical Pharmacology. JP
publishers: India. 2009, 217.
(5) Huang J, Wigent RJ and Schwartz JB. Nifedipine
Molecular Dispersion in Microparticles of Ammonio
Methacrylate Copolymer and Ethylcellulose Binary
Blends for Controlled Drug Delivery: Effect of Matrix
Composition. Drug Dev Ind pharm., 32; 2006: 1185-
1197.
(6) Das SK, Das NG. Preparation and in vitro dissolution
profile of dual polymer (Eudragit RS100 and RL 100)
using a novel dual polymer technique. J Microencapsul
(0) 15: 445-52
(7) Husmaan M.,Schenderlein S., Luck M., Lindner H.,
Kleinebudde P., Polymer erosion in PLGA
microparticles produced by phase separation method.
Int J Pharm., 2002; 242: 277-280.
(8) Ohwavworhu F, Adelakun T. Phosphoric acid-mediated
depolymerization and decrystallization of α-cellulose
obtained from Corn Cob: Preparation of low
crystallinity cellulose and some physicochemical
properties. Trop J Pharm Res 2004; 4: 509–516.
(9) Cui F et al. Preparation and characterization of melittin-
loaded poly (DL-lactic acid) or poly (DL-lactic-co-
glycolic acid) microspheres made by the double
emulsion method, J Control Rel 2005; 107: 310-319.
(10) Sultana Y, Shalini Mall, Maurya DP, Kumar D, Das M.
Preparation and in vitro characterization of diltiazem
hydrochloride loaded aliginate microspheres. Pharm
Dev Tech 2009; 14: 321-331.
(11) Hekmatara T, Regdon G , Sipos P, Erős I, Pintye-Hódi
K. Thermoanalytical study of microspheres containing
diltiazem hydrochloride. J Therm Anal Cal 2006; 86:
287-290.
(12) Yan X, Gemeinhart RA. Cisplatin delivery from
Poly(acrylic acid-co-methyl methacrylate)
Microparticles. J Control Rel 2005; 106: 198–208.
(13) Amit Kumara, Sitanshu S, Lahiri B, Harpal Singh.
Development of PEGDMA: MAA based hydrogel
microparticles for oral insulin delivery. Int J Pharm
2006; 323: 117–124.
(14) United States of Pharmacopoeia, 22nd Revision, The
United State Pharmacopoeial Convention,
Rockville.1989.
Encapsulation of Theophylline… Gowda D. V. et al
- 250 -
طويرالت: و جسيمات يودراجيت دقيقةإيثيل سيللولوز من تغليف الثيوفيلين في مزيج ثنائي
. حركية الإطلاقتوصيف وال،
شيفاكومار و ارافيندرام و محمد صالح خانو جودا
. صيدلة ، جامعة ميسور ، كارناتاكا ، الهندلل JSS قسم الصيدلانيات ، كلية
ملخـص
ثيل سيليلوز الإيتكون من اليودراجيت و مزيج ثنائي جسيمات دقيقة مكونة من وتقييم تحضير الى هذه الدراسةت هدف
. الطوريفصل ال الدقيقة باستخدام طريقة الجسيمات أعدت . الثيوفيلينبهدف التحكم بسرعة إطلاق الثيوفيلين بمحملة و
تم الحصول على . استخدام مذيبات عضوية سامةلىتحتاج اقتصادية ، ولا إسريعة ، ، بسيطة جدا تعتبر هذة الطريقة
٪ 85أكثر من . ٪92إلى ناتج الجسيمات الدقيقة وصل . تدفق، متماثلة ، وحرة الصلبة ، منفصلة جسيمات دقيقة ،زاوية أظهر مسحوق الجزيئات المحضرة قيم . ميكرون455-325 يتراوح بين حجم لها المعزولة من الجسيمات الدقيقة
والذي بدوره يشير الى أن الجسيمات ،المقبولة ضمن الحدود ة وجيدنقرية كثافة المئوي ومؤشر كار إسترخاء و صور الميكروسكوب الالكتروني أكدت . جيدة خصائص تعبئةة التدفق و لها سطح أملس ، حرالدقيقة المجهزة لها
متوافقة ، وهو وكانت الجسيمات الدقيقة المعدة . الشكل كروية المحسوب أن الجزيئات المعدة كروية ال وعامل يمسحال
لمعرفة مقدار اًوقد تم تحليل التركيبات المعدة كمي. الأشعة تحت الحمراء و فرق المسح الحراري ما أكدته دراسات لدواء أطلق كما أن ا. يةعلى درجة الحموضة المعدللدواء اطلاق ذو قيمة إحصائية ولوحظ أنه لا يوجد. مغلفالدواء ال
معوية في أجواء الجسيمات المحضرةمن تم فحص اطلاق الدواء و. ساعة12كثر من بشكل متحكم به و ثابت لأ
Duralynلمستحضر طلاق ومقارنتها مع سلوك الإ CR طلاق حركية الا حيث ظهر أن الفموي المتوفر تجاريا400ً. في الحالتينتبع آليات نقل مختلفةت
.يودراجيت ، اطلاق فيكيان ، الثيوفيلين ، الطوريفصل ال، الجسيمات الدقيقة :الكلمات الدالة
____________________________________________
.2/2/2011 للنشر وتاريخ قبوله12/7/2010 تاريخ استلام البحث
Top Related