


Languages
Pages
Legal

6M Group Interim Report January 1 to June 30, 2015
Contents
Group Interim Management Report 1
Overview of Business Development 1
Situation of the Group 2
Changes during the Reporting Period 2
Economic Report 2
General Statement of the Executive Board 2
Economic and Industry-Specific Conditions 2
Significant Events 3
Business Development 3
Results of Operations 5
Asset and Financial Position 10
Value Management 11
Non-financial Performance Indicators 12
Employees 13
Research and Development 13
Share 14
Significant Events after the Balance Sheet Date 16
Outlook Report 16
General Statement of the Executive Board 16
Risk and Opportunities Report 17
Business Outlook 17
Group Interim Financial Statements 20
Consolidated Income Statement 20
Consolidated Statement of Comprehensive Income 21
Consolidated Statement of Financial Position 22
Consolidated Statement of Cash Flows 23
Consolidated Statement of Changes in Equity 24
Segment Reporting 25
Selected Notes 26
Accounting and Valuation Policies 26
Disclosures on Carrying Amounts and Fair Values 27
Companies included in Consolidation 32
Disclosures on Related Parties 32
Disclosures on the Procedure for Determining Taxes on Income 32
Disclosures on the Calculation of Earnings per Share 33
Disclosures on the Development of Shareholders’ Equity 33
Disclosures on Contingent Liabilities and Other Financial Commitments 33
Further Information 34
Responsibility Statement 34
Financial Calendar 35
Traffic Calendar 35
Imprint 35

Group Interim Management Report
Information about reportingAn overview of the calculation of financial key figures and a description
of specialist terms are presented on page 206 of the 2014 Annual
Report.
Key figures
Overview of Business Development
> 4.1 % passenger growth at the Frankfurt site. > Mixed performance at Group airports outside of Frankfurt. > Significant rise in Group revenue by 10.6 % to €1,241.9 million
due to traffic and price developments, new Group companies,
and exchange rate effects. > Revenue adjusted by IFRIC 12 at €1,234.7 million (+10.5 %).
> Group EBITDA at €385.0 million, an increase of 8.7 % against the
previous year. > €11.3 million improvement in the Group result to €103.0 million. > Basic earnings per share at €1.06 (+€0.10). > €70.7 million increase in operating cash flow to €276.6 million. > Lower cash flow used in investing activities led to improvement in
free cash flow from €107.6 million to €189.7 million.
€ million 6M 2015 6M 2014 Change Change in %
Revenue 1,241.9 1,122.4 119.5 10.6
Revenue adjusted by IFRIC 12 1,234.7 1,117.4 117.3 10.5
EBITDA 385.0 354.2 30.8 8.7
EBIT 221.9 205.7 16.2 7.9
EBT 152.2 129.1 23.1 17.9
Group result 103.0 91.7 11.3 12.3
Earnings per share in € (basic) 1.06 0.96 0.10 10.4
Operating cash flow 276.6 205.9 70.7 34.3
Free cash flow 189.7 107.6 1) 82.1 76.3
Shareholders’ equity 3,300.9 3,286.0 2) 14.9 0.5
Liquidity 1,056.6 1,179.6 2) – 123.0 – 10.4
Net financial debt 2,993.5 3,012.8 2) – 19.3 – 0.6
Total assets 8,894.3 9,013.2 2) – 118.9 – 1.3
Average number of employees 20,691 20,180 511 2.5
€ million Q2 2015 Q2 2014 Change Change in %
Revenue 666.0 602.7 63.3 10.5
Revenue adjusted by IFRIC 12 662.3 600.1 62.2 10.4
EBITDA 231.9 219.7 12.2 5.6
EBIT 149.9 144.5 5.4 3.7
EBT 136.6 120.7 15.9 13.2
Group result 92.4 85.7 6.7 7.8
Earnings per share in € (basic) 0.96 0.89 0.07 7.9
Operating cash flow 162.7 131.5 31.2 23.7
Free cash flow 124.5 73.5 1) 51.0 69.4
Average number of employees 20,740 20,120 620 3.1
1) Value adjusted to new definition.2) Value as at 31 December 2014.
Table 1
1Fraport Group Interim Report 6M 2015 Group Interim Management Report / Overview of Business Development
Situation of the Group
Changes during the Reporting Period
During the reporting period, there were no significant changes to the
situation of the Fraport Group presented in the 2014 Group manage-
ment report with respect to operating activities, strategy, and control
(see 2014 Annual Report beginning on page 30). With regard to Group
structure, a new service unit “Airport Expansion South” was set up as at
June 1, 2015. The new unit is part of the External Activities & Services
segment and brings together the activities related to the construction
of Terminal 3. No significant changes for the Fraport Group have arisen
from the adjustment to Group structure.
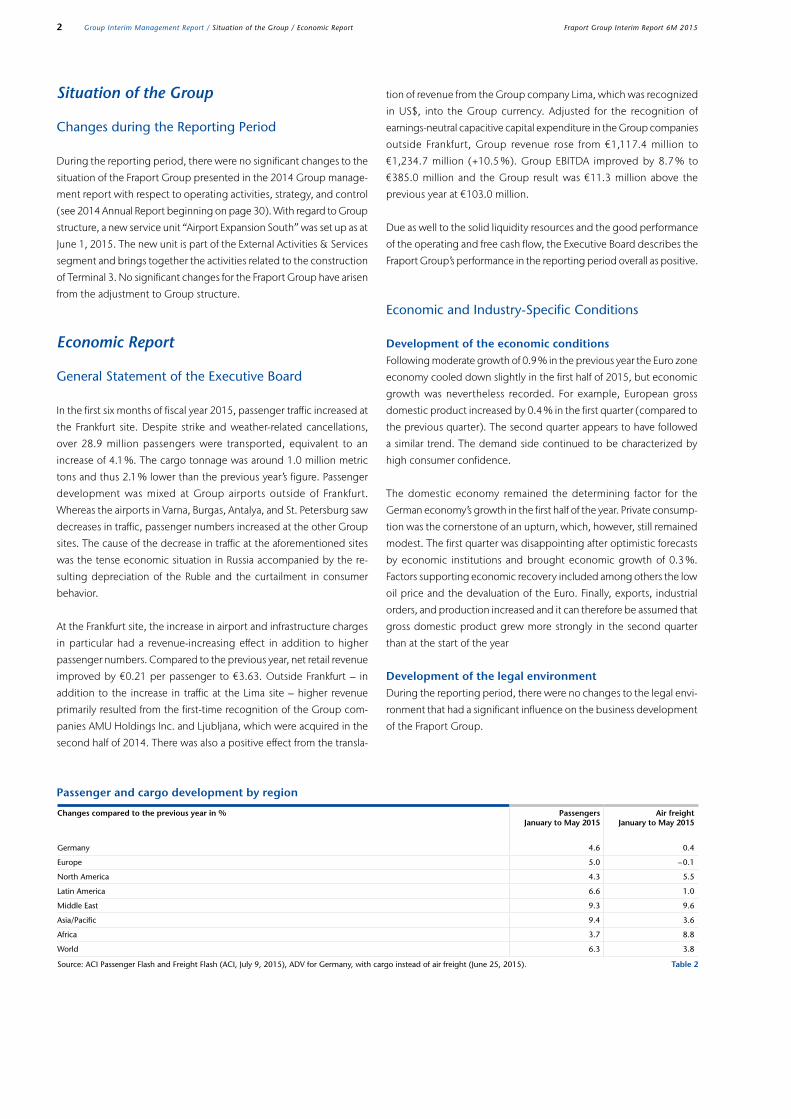
Passenger and cargo development by region
Economic and Industry-Specific Conditions
Development of the economic conditionsFollowing moderate growth of 0.9 % in the previous year the Euro zone
economy cooled down slightly in the first half of 2015, but economic
growth was nevertheless recorded. For example, European gross
domestic product increased by 0.4 % in the first quarter (compared to
the previous quarter). The second quarter appears to have followed
a similar trend. The demand side continued to be characterized by
high consumer confidence.
The domestic economy remained the determining factor for the
German economy’s growth in the first half of the year. Private consump-
tion was the cornerstone of an upturn, which, however, still remained
modest. The first quarter was disappointing after optimistic forecasts
by economic institutions and brought economic growth of 0.3 %.
Factors supporting economic recovery included among others the low
oil price and the devaluation of the Euro. Finally, exports, industrial
orders, and production increased and it can therefore be assumed that
gross domestic product grew more strongly in the second quarter
than at the start of the year
Development of the legal environmentDuring the reporting period, there were no changes to the legal envi-
ronment that had a significant influence on the business development
of the Fraport Group.
Economic Report
General Statement of the Executive Board
In the first six months of fiscal year 2015, passenger traffic increased at
the Frankfurt site. Despite strike and weather-related cancellations,
over 28.9 million passengers were transported, equivalent to an
increase of 4.1 %. The cargo tonnage was around 1.0 million metric
tons and thus 2.1 % lower than the previous year’s figure. Passenger
development was mixed at Group airports outside of Frankfurt.
Whereas the airports in Varna, Burgas, Antalya, and St. Petersburg saw
decreases in traffic, passenger numbers increased at the other Group
sites. The cause of the decrease in traffic at the aforementioned sites
was the tense economic situation in Russia accompanied by the re-
sulting depreciation of the Ruble and the curtailment in consumer
behavior.
At the Frankfurt site, the increase in airport and infrastructure charges
in particular had a revenue-increasing effect in addition to higher
passenger numbers. Compared to the previous year, net retail revenue
improved by €0.21 per passenger to €3.63. Outside Frankfurt – in
addition to the increase in traffic at the Lima site – higher revenue
primarily resulted from the first-time recognition of the Group com-
panies AMU Holdings Inc. and Ljubljana, which were acquired in the
second half of 2014. There was also a positive effect from the transla-
Changes compared to the previous year in % Passengers January to May 2015
Air freight January to May 2015
Germany 4.6 0.4
Europe 5.0 – 0.1
North America 4.3 5.5
Latin America 6.6 1.0
Middle East 9.3 9.6
Asia/Pacific 9.4 3.6
Africa 3.7 8.8
World 6.3 3.8
Source: ACI Passenger Flash and Freight Flash (ACI, July 9, 2015), ADV for Germany, with cargo instead of air freight (June 25, 2015). Table 2
tion of revenue from the Group company Lima, which was recognized
in US$, into the Group currency. Adjusted for the recognition of
earnings-neutral capacitive capital expenditure in the Group companies
outside Frankfurt, Group revenue rose from €1,117.4 million to
€1,234.7 million (+10.5 %). Group EBITDA improved by 8.7 % to
€385.0 million and the Group result was €11.3 million above the
previous year at €103.0 million.
Due as well to the solid liquidity resources and the good performance
of the operating and free cash flow, the Executive Board describes the
Fraport Group’s performance in the reporting period overall as positive.
2 Fraport Group Interim Report 6M 2015Group Interim Management Report / Situation of the Group / Economic Report

Significant Events
Audit of the demand forecasts for passenger growth at Frankfurt Airport presentedIn early March, the Hesse state government presented the results of
the quality audit of the expert reports published by Fraport on future
capacity requirements at Frankfurt Airport. Essentially, the results of
the review confirm the statements in the expert reports presented by
Fraport in September 2014. These forecast that passenger numbers
at Frankfurt Airport will rise to between 68 and 73 million passengers
by 2021, meaning that the airport’s current terminal capacity of 64
million passengers will be significantly exceeded by 2021. Fraport
therefore still considers the opening of new capacities as necessary.
On April 14, after detailed analysis of the audit reports, the Fraport
Supervisory Board confirmed its decision to implement the planned
Terminal 3 in the southern part of the airport. Fraport has issued a
Europe-wide notice and invitation to tender for the first phase of the
excavation work. Due to the corresponding deadlines, ground works
are scheduled to start at the end of the year. Construction time for the
terminal, including test phases, is scheduled to be at least seven years,
meaning the new terminal is expected to be inaugurated in 2022.
Sale of the Group company Air-Transport IT Services Fraport AG sold its shares in the Group company Air-Transport IT Ser-
vices, Inc., USA for a price of US$13.0 million with effect as at April 22,
2015. The company was allocated to the External Activities & Services
segment and generated revenue of €12.5 million and a net result of
€0.6 million in the previous fiscal year. A gain on disposal of €8.0 million
resulted from the sale of Air-Transport IT Services.
Business Development
Development at Frankfurt siteAt over 28.9 million passengers, the highest passenger numbers to
date within a first half year were achieved. The numbers for the previ-
ous year were exceeded by around 1.1 million passengers (4.1 %). In
the months of March to June, new peaks were achieved. Without strike
and weather-related cancellations, growth would have been 4.7 %.
In the first half of 2015, intercontinental traffic (+3.9 %), among
others, provided growth in passenger numbers. The key driver was
Asian traffic, which saw gains not only in the Far Eastern markets, such
as China or India, but also in Dubai in the Middle East. The temporary
re surgence of North Africa as a tourist destination (which now contin-
ues to stagnate following attacks) changed traffic flows, meaning that
the Canary Islands and Balearic Islands lost passengers despite the
vacation starting earlier. Domestic traffic proved dynamic and grew
by 6.2 % compared to the first half of the previous year, but also ben-
efited from cancellations in the previous year.
In the first half year, cargo volume fell by 2.1 % to around 1.0 million
metric tons. A noticeable decrease in cargo throughput with the Far
East and Latin America regions had a negative effect on the cargo
result.
Due to the strike-related cancellations in the reporting period and the
continuing trend towards using larger aircraft, there was only a weak
increase in aircraft movements of 0.2 % to around 230 thousand in
the first six months. Adjusted for the cancellations in the first half of
2015, growth would have been approximately 0.9 %. In contrast,
maximum take-off weights increased significantly (+3.3 %).
Development of the global aviation marketAccording to the preliminary figures from Airports Council International
(ACI), global passenger traffic grew by 6.3 % in the January to May 2015
period. In the same period, air freight volume rose by 3.8 %. European
airports achieved a slightly lower growth in passenger numbers of
5.0 %. In air freight, the performance of the European airports at – 0.1 %
was significantly lower than the overall performance. Passenger num-
bers at German airports grew by 4.6 % up to and including May 2015.
Cargo tonnage (air freight and air mail) saw weak development with an
increase of 0.4 % and, like passenger traffic, was below the global level.
Proposal for charge development at the Frankfurt site submitted On June 12, 2015, Fraport consulted on the intended adjustment of
airport charges for the Frankfurt site in an average amount of 1.9 %
for 2016. On July 1, 2015, the corresponding charge proposal was
submitted to the competent authority, the Hessian Ministry of Eco-
nomics, Energy, Transport and Regional Development, for approval.
The airport charges serve to refinance the chargeable costs and are
essential to the Aviation segment’s revenue performance. According
to Section 19b of the German Air Traffic Law (LuftVG), the Hessian
Ministry of Economics, Energy, Transport and Regional Development
makes the final decision on the proposed regulation of charges in its
role as the regulatory authority for Frankfurt Airport.
During the reporting period, there were no further events that had
a significant influence on the business development of the Fraport
Group.
3Fraport Group Interim Report 6M 2015 Group Interim Management Report / Economic Report

Fraport Group traffic figures
Development outside the Frankfurt siteAt Ljubljana Airport, passenger numbers in the first six months of 2015
were 9.7 % higher than the previous year at around 627 thousand.
While there were more passengers on routes to and from Belgrade
and Zurich, passenger numbers fell on routes to and from Moscow.
At Lima Airport, the number of passengers in the first half of 2015
increased significantly by 8.7 % to nearly 8.1 million. Both domestic
traffic (+11.5 %) and international traffic (+5.6 %) grew in the reporting
period. At around 131 thousand metric tons, cargo throughput was
slightly higher than the previous year (+0.3 %).
The Bulgarian airports in Varna and Burgas carried some 949 thousand
passengers in the reporting period and thus around 12.8 % fewer than
in the previous year. It is primarily passengers from Russia who were
no longer using the two sites.
In the first six months of 2015, around 10.5 million passengers meant
a 4.2 % decrease at Antalya Airport. Whereas the number of Turkish
domestic passengers again rose significantly by 12.1 % to almost
3.0 million, the number of international passengers decreased by 9.3 %
to around 7.6 million. The cause of the decrease was primarily fewer
travelers from Russia.
At just under 6.1 million travelers, passenger traffic at St. Petersburg
Airport saw a decrease of 4.3 % in the reporting period compared with
the previous year. Whereas international traffic significantly decreased
by 21.5 %, national traffic increased 12.9 %.
Around 2.5 million passengers meant growth of 5.3 % in the first six
months of the fiscal year for the Hanover site. There was, in particular,
a positive trend in tourism traffic.
Xi’an Airport continued to show a dynamic performance as passenger
numbers increased by 15.3 % to just over 15.7 million. High-volume
domestic traffic rose by 12.3 % to around 14.7 million passengers.
International traffic grew by 85.1 % to around 1.0 million passengers.
In the reporting period, Delhi Airport achieved significant growth
of 13.2 % compared to the previous year with around 22.1 million
travelers. Significant growth continued to be reported in domestic
traffic, with a strong increase of 17.7 %. International passenger
numbers increased by 4.4 %. Air freight also significantly increased
again (+12.1 %).
Table 3
Airport 1) Fraport share in %
Passengers 2) Cargo (air freight and air mail in m. t.) Movements
6M 2015 Change in % 6M 2015 Change in % 6M 2015 Change in %
Frankfurt 100 28,922,862 4.1 1,021,113 – 2.1 229,582 0.2
Ljubljana 100 626,525 9.7 4,790 – 1.1 15,511 0.4
Lima 70.01 8,058,507 8.7 130,933 0.3 78,502 5.3
Burgas 60.00 546,404 – 18.0 5,189 88.4 5,063 – 12.2
Varna 60.00 402,115 – 4.4 46 >100.0 4,034 – 5.0
Antalya 51.00/50.00 3) 10,543,711 – 4.2 n.a. n.a. 69,104 – 4.8
St. Petersburg 35.50 6,093,989 – 4.3 n.a. n.a. 67,094 – 2.7
Hanover 30.00 2,458,218 5.3 8,612 17.3 36,141 – 2.4
Xi’an 24.50 15,749,784 15.3 95,900 10.8 127,958 10.3
Delhi 10.00 22,143,671 13.2 372,186 12.1 164,409 1.7
Airport 1) Fraport share in %
Passengers 2) Cargo (air freight and air mail in m. t.) Movements
Q2 2015 Change in % Q2 2015 Change in % Q2 2015 Change in %
Frankfurt 100 16,414,580 5.1 518,167 – 1.8 124,802 2.3
Ljubljana 100 390,262 16.7 2,494 0.8 8,875 4.9
Lima 70.01 4,034,976 8.7 66,223 – 5.1 39,671 4.5
Burgas 60.00 516,471 – 19.0 3,831 >100.0 4,513 – 15.5
Varna 60.00 335,227 – 6.7 28 78.1 3,083 – 7.1
Antalya 51.00/50.00 3) 8,124,278 – 6.9 n.a. n.a. 50,766 – 6.8
St. Petersburg 35.50 3,620,035 – 7.1 n.a. n.a. 36,558 – 6.4
Hanover 30.00 1,483,731 5.3 3,724 10.7 20,546 0.2
Xi’an 24.50 8,144,970 13.3 48,757 12.6 66,042 8.7
Delhi 10.00 11,456,855 13.4 199,055 18.7 87,611 6.7
1) In addition, Fraport holds 100 % of the shares in the operating company of the new Dakar Airport which is currently under construction. 2) Commercial traffic only, in + out + transit. 3) Voting rights: 51 %, Dividend share: 50 %.
4 Fraport Group Interim Report 6M 2015Group Interim Management Report / Economic Report
Results of Operations
GroupIn the first six months of fiscal year 2015, the Fraport Group generated
revenue of €1,241.9 million. Compared with the same period of the
previous year, this was equivalent to an increase of €119.5 million, or
10.6 %. Adjusted for the recognition of earnings-neutral capacitive
capital expenditure in the Group companies outside Frankfurt in con-
nection with the application of IFRIC 12, revenue of €1,234.7 million
was €117.3 million (+10.5 %) higher than the corresponding figure
for the previous year.
At the Frankfurt site, the higher passenger numbers and the increase
in airport and infrastructure charges in particular contributed to the
rise in revenue. Compared to the previous year, net retail revenue also
increased from €3.42 per passenger to €3.63. Outside Frankfurt – in
addition to the increase in traffic at the Lima site – higher revenue
primarily resulted in an amount of €44.7 million from the first-time
recognition of the Group companies AMU Holdings Inc. and Ljubljana,
which were acquired in the second half of 2014. There were further
positive effects from the translation of revenue from the Group com-
pany Lima, which was recognized in US$, into the Group currency.
Despite the gain from the disposal of the Group company Air-Transport
IT Services, other operating income at €17.9 million was €5.7 million
below the figure for the previous year (– 24.2 %). The key reason for the
decrease was lower releases of provisions in the Aviation and Ground
Handling segments.
At €1,274.5 million, total revenue grew by €114.6 million compared
to the previous year (+9.9 %). When adjusted for the application of
IFRIC 12, at €1,267.3 million, this was €112.4 million above the corre-
sponding figure for the previous year (+9.7 %).
The cost of materials rose in the reporting period from €245.4 million
to €289.3 million (+17.9 %). At €20.8 million, this increased particularly
as a result of the first-time recognition of the Group companies AMU
Holdings Inc. and Ljubljana, which were acquired in the previous year,
and for reasons relating to currency and traffic volumes in the Lima
Group company. Adjusted for the recognition of capacitive capital
expenditure in Group companies outside Frankfurt, the cost of mate-
rials was €282.1 million and was thus €41.7 million above the adjusted
figure for the previous year (+17.3 %).
At €521.8 million, personnel expenses were €34.0 million higher
than the previous year’s level of €487.8 million (+7.0 %). The increase
in expenses was particularly due to collective wage agreements in the
public sector and security business, and to the new Group companies
Ljubljana and AMU Holdings Inc.
Other operating expenses rose from €72.5 million to €78.4 million
(+8.1 %) primarily due to the new Group companies AMU Holdings
Inc. and Ljubljana.
The increase in revenue meant that Group EBITDA rose by
€30.8 million to €385.0 million (+8.7 %) in the reporting period.
The EBITDA margin decreased by 0.6 percentage points to 31.0 %.
Adjusted for the revenue and expenses from the recognition of capaci-
tive capital expenditure in connection with the application of IFRIC 12,
the EBITDA margin decreased from 31.7 % to 31.2 %.
A €14.6 million increase in depreciation and amortization to
€163.1 million (+9.8 %), primarily resulting from the new Group
companies AMU Holdings Inc. and Ljubljana, led to Group EBIT of
€221.9 million. Compared with the previous year, this corresponded
to an increase of €16.2 million or 7.9 %.
The financial result improved from – €76.6 million to – €69.7 million
(+€6.9 million). The reason for the positive performance was a better
interest and other financial result. The other financial result improved
despite unrealized foreign currency exchange losses from the fair value
measurement of a CHF loan mainly as a result of changes in the fair
value of derivatives. The capitalization of interest expenses relating
to construction work amounting to €7.7 million reduced interest
expenses (6M 2014: €7.5 million).
At €152.2 million, Group EBT exceeded the figure of the previous year
by €23.1 million (+17.9 %). At a tax rate of 32.3 % (6M 2014: 29.0 %),
the Group result was up by €11.3 million to €103.0 million compared
with the previous year (+12.3 %). At €1.06, basic earnings per share
were €0.10 higher than the figure for the previous year (+10.4 %).
5Fraport Group Interim Report 6M 2015 Group Interim Management Report / Economic Report

In the first six months of 2015, revenue in the Aviation segment
increased from €418.4 million to €444.0 million (+6.1 %). The key
reasons for the higher revenue were passenger growth at the Frankfurt
site and the increase in airport charges by an average of 2.9 % as at
January 1, 2015. Despite an increase in revenue of €25.6 million, seg-
ment EBITDA decreased by €2.0 million to €102.4 million (– 1.9 %).
Key reasons for the decrease were an increase in personnel expenses,
lower other operating income, and higher non-staff costs (cost of ma-
terials and other operating expenses). Personnel expenses increased by
€9.9 million to €158.3 million (+6.7 %) mainly due to collective wage
agreements in the security business and public sector. Other operat-
ing income for the segment fell compared to the previous year from
€16.7 million to €10.1 million (– €6.6 million), mainly due to lower
releases of provisions. Higher non-capitalizable expenses relating to
capital expenditure and the creation of provisions, among others, led
to an increase in non-staff costs.
Depreciation and amortization increased slightly by €1.2 million to
€59.5 million (+2.1 %). Segment EBIT decreased correspondingly
from €46.1 million to €42.9 million, which equates to a fall of 6.9%.
Aviation Retail & Real Estate
The Retail & Real Estate segment achieved revenue of €233.1 million
and thus an increase of €14.4 million in the first half of 2015 compared
to the previous year (+6.6 %). The growth in revenue was primarily due
to the higher passenger numbers in Frankfurt, and particularly due to
the increase in the number of intercontinental passengers, who show
above-average spending behavior in retail businesses. The devalua-
tion of the € against many international currencies continued to have
a positive effect. “Net retail revenue per passenger” increased from
€3.42 in the first half of 2014 to €3.63 in the reporting period (+6.1 %).
Higher operating expenses led to segment EBITDA of €183.9 million.
Compared with the same period of the previous year, this was equiv-
alent to an increase of €11.6 million (+6.7 %). Nearly flat depreciation
and amortization meant that the increase in EBITDA was reflected
almost entirely in EBIT. At €142.6 million, this was €11.5 million higher
than the figure of the previous year (+8.8 %).
Segments
Table 4 Table 5
€ million Q2 2015 Q2 2014 Change Change in %
Revenue 243.6 229.0 14.6 6.4
Personnel expenses 81.6 76.1 5.5 7.2
EBITDA 71.7 74.1 – 2.4 – 3.2
EBITDA margin 29.4 % 32.4 % – 3.0 PP –
EBIT 42.7 44.5 – 1.8 – 4.0
Average number of employees 6,015 5,974 41 0.7
€ million Q2 2015 Q2 2014 Change Change in %
Revenue 119.7 112.2 7.5 6.7
Personnel expenses 12.6 12.0 0.6 5.0
EBITDA 94.8 89.9 4.9 5.5
EBITDA margin 79.2 % 80.1 % – 0.9 PP –
EBIT 74.3 69.2 5.1 7.4
Average number of employees 623 611 12 2.0
€ million 6M 2015 6M 2014 Change Change in %
Revenue 444.0 418.4 25.6 6.1
Personnel expenses 158.3 148.4 9.9 6.7
EBITDA 102.4 104.4 – 2.0 – 1.9
EBITDA margin 23.1 % 25.0 % – 1.9 PP –
EBIT 42.9 46.1 – 3.2 – 6.9
Average number of employees 5,995 6,080 – 85 – 1.4
€ million 6M 2015 6M 2014 Change Change in %
Revenue 233.1 218.7 14.4 6.6
Personnel expenses 24.7 23.9 0.8 3.3
EBITDA 183.9 172.3 11.6 6.7
EBITDA margin 78.9 % 78.8 % 0.1 PP –
EBIT 142.6 131.1 11.5 8.8
Average number of employees 617 620 – 3 – 0.5
6 Fraport Group Interim Report 6M 2015Group Interim Management Report / Economic Report

Ground Handling External Activities & Services
The higher passenger numbers, the increase in maximum take-off
weights, and the increase in infrastructure charges led to a growth
in revenue of 4.9 % to €333.0 million (+€15.5 million) in the Ground
Handling segment in the first six months of 2015. A traffic-volume-
related increase in personnel and the collective wage agreement in
the public sector noticeably increased personnel expenses in the first
half year.
Despite the increase in personnel expenses and lower other oper-
ating income, which largely resulted from releases of provisions in
the previous year, segment EBITDA improved from €11.2 million to
€12.6 million (+12.5 %) owing to the increase in revenue. Higher
depreciation and amortization led to a decrease in segment EBIT to
– €8.6 million. Compared with the previous year, this meant a decrease
of €1.3 million.
The External Activities & Services segment reported a significant in-
crease in revenue by €64.0 million to €231.8 million (+38.1 %) in the
first six months of 2015. Adjusted for the recognition of earnings-neutral
capacitive capital expenditure in connection with the application of
IFRIC 12, revenue in the reporting period rose from €162.8 million in the
previous year to €224.6 million (+38.0 %). In addition to the increase in
traffic at the Lima site, higher revenue of €44.7 million resulted from the
first-time recognition of the Group companies AMU Holdings Inc. and
Ljubljana, which were acquired in the second half of 2014. There were
further positive effects from the translation of revenue from the Group
company Lima, which was recognized in US$, into the Group currency.
Operating expenses also rose in the reporting period, largely as a result
of the first-time recognition of the new Group companies AMU Holdings
Inc. and Ljubljana, and for reasons relating to currency and traffic volumes
in the Lima Group company.
Segment EBITDA increased by €19.8 million to €86.1 million (+29.9 %)
due to the increase in revenue. The increase in depreciation and amor-
tization, which primarily resulted from the new Group companies AMU
Holdings Inc. and Ljubljana, led to a segment EBIT of €45.0 million
(+25.7 %).
Table 6 Table 7
€ million Q2 2015 Q2 2014 Change Change in %
Revenue 178.3 168.8 9.5 5.6
Personnel expenses 113.0 106.1 6.9 6.5
EBITDA 12.7 14.0 – 1.3 – 9.3
EBITDA margin 7.1 % 8.3 % – 1.2 PP –
EBIT 0.9 4.6 – 3.7 – 80.4
Average number of employees 9,179 8,791 388 4.4
€ million Q2 2015 Q2 2014 Change Change in %
Revenue 124.4 92.7 31.7 34.2
Personnel expenses 58.7 53.2 5.5 10.3
EBITDA 52.7 41.7 11.0 26.4
EBITDA margin 42.4 % 45.0 % – 2.6 PP –
EBIT 32.0 26.2 5.8 22.1
Average number of employees 4,923 4,744 179 3.8
€ million 6M 2015 6M 2014 Change Change in %
Revenue 333.0 317.5 15.5 4.9
Personnel expenses 220.9 208.5 12.4 5.9
EBITDA 12.6 11.2 1.4 12.5
EBITDA margin 3.8 % 3.5 % 0.3 PP –
EBIT – 8.6 – 7.3 – 1.3 –
Average number of employees 9,342 9,020 322 3.6
€ million 6M 2015 6M 2014 Change Change in %
Revenue 231.8 167.8 64.0 38.1
Personnel expenses 117.9 107.0 10.9 10.2
EBITDA 86.1 66.3 19.8 29.9
EBITDA margin 37.1 % 39.5 % – 2.4 PP –
EBIT 45.0 35.8 9.2 25.7
Average number of employees 4,737 4,460 277 6.2
7Fraport Group Interim Report 6M 2015 Group Interim Management Report / Economic Report
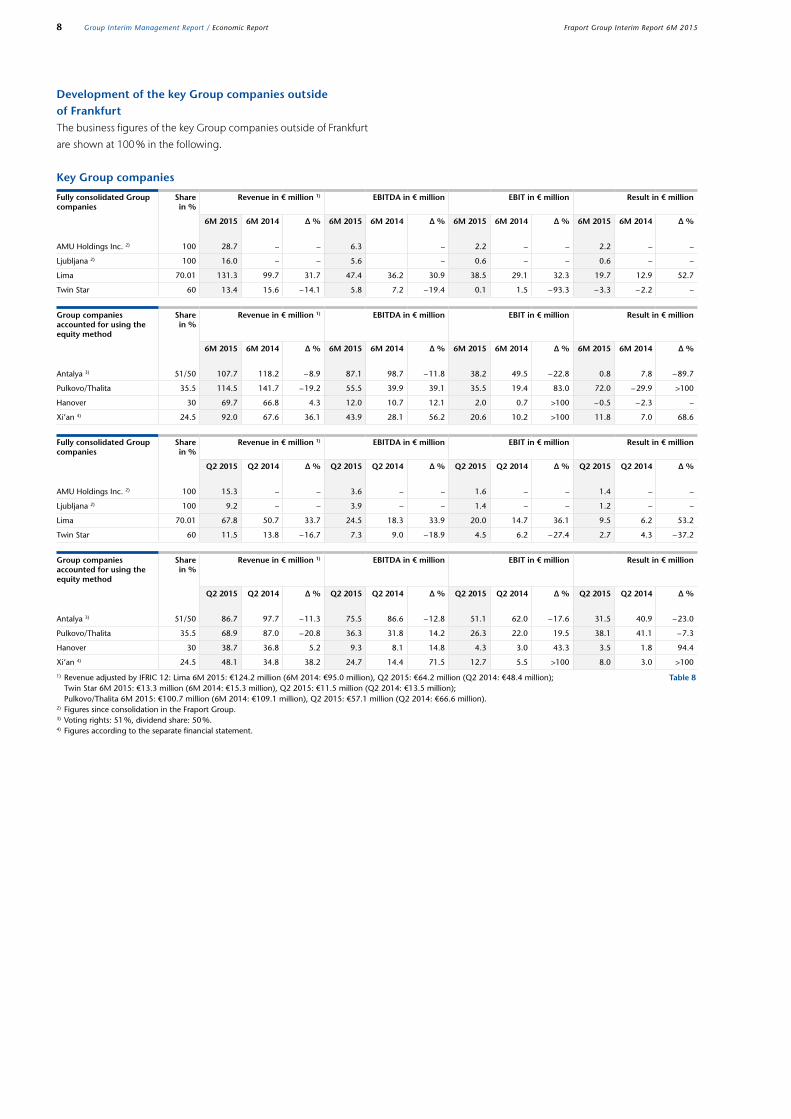
Development of the key Group companies outside of FrankfurtThe business figures of the key Group companies outside of Frankfurt
are shown at 100 % in the following.
Key Group companies
Table 8
Fully consolidated Group companies
Share in %
Revenue in € million 1) EBITDA in € million EBIT in € million Result in € million
6M 2015 6M 2014 Δ % 6M 2015 6M 2014 Δ % 6M 2015 6M 2014 Δ % 6M 2015 6M 2014 Δ %
AMU Holdings Inc. 2) 100 28.7 – – 6.3 – 2.2 – – 2.2 – –
Ljubljana 2) 100 16.0 – – 5.6 – 0.6 – – 0.6 – –
Lima 70.01 131.3 99.7 31.7 47.4 36.2 30.9 38.5 29.1 32.3 19.7 12.9 52.7
Twin Star 60 13.4 15.6 – 14.1 5.8 7.2 – 19.4 0.1 1.5 – 93.3 – 3.3 – 2.2 –
Group companies accounted for using the equity method
Share in %
Revenue in € million 1) EBITDA in € million EBIT in € million Result in € million
6M 2015 6M 2014 Δ % 6M 2015 6M 2014 Δ % 6M 2015 6M 2014 Δ % 6M 2015 6M 2014 Δ %
Antalya 3) 51/50 107.7 118.2 – 8.9 87.1 98.7 – 11.8 38.2 49.5 – 22.8 0.8 7.8 – 89.7
Pulkovo/Thalita 35.5 114.5 141.7 – 19.2 55.5 39.9 39.1 35.5 19.4 83.0 72.0 – 29.9 >100
Hanover 30 69.7 66.8 4.3 12.0 10.7 12.1 2.0 0.7 >100 – 0.5 – 2.3 –
Xi’an 4) 24.5 92.0 67.6 36.1 43.9 28.1 56.2 20.6 10.2 >100 11.8 7.0 68.6
Fully consolidated Group companies
Share in %
Revenue in € million 1) EBITDA in € million EBIT in € million Result in € million
Q2 2015 Q2 2014 Δ % Q2 2015 Q2 2014 Δ % Q2 2015 Q2 2014 Δ % Q2 2015 Q2 2014 Δ %
AMU Holdings Inc. 2) 100 15.3 – – 3.6 – – 1.6 – – 1.4 – –
Ljubljana 2) 100 9.2 – – 3.9 – – 1.4 – – 1.2 – –
Lima 70.01 67.8 50.7 33.7 24.5 18.3 33.9 20.0 14.7 36.1 9.5 6.2 53.2
Twin Star 60 11.5 13.8 – 16.7 7.3 9.0 – 18.9 4.5 6.2 – 27.4 2.7 4.3 – 37.2
Group companies accounted for using the equity method
Share in %
Revenue in € million 1) EBITDA in € million EBIT in € million Result in € million
Q2 2015 Q2 2014 Δ % Q2 2015 Q2 2014 Δ % Q2 2015 Q2 2014 Δ % Q2 2015 Q2 2014 Δ %
Antalya 3) 51/50 86.7 97.7 – 11.3 75.5 86.6 – 12.8 51.1 62.0 – 17.6 31.5 40.9 – 23.0
Pulkovo/Thalita 35.5 68.9 87.0 – 20.8 36.3 31.8 14.2 26.3 22.0 19.5 38.1 41.1 – 7.3
Hanover 30 38.7 36.8 5.2 9.3 8.1 14.8 4.3 3.0 43.3 3.5 1.8 94.4
Xi’an 4) 24.5 48.1 34.8 38.2 24.7 14.4 71.5 12.7 5.5 >100 8.0 3.0 >100
1) Revenue adjusted by IFRIC 12: Lima 6M 2015: €124.2 million (6M 2014: €95.0 million), Q2 2015: €64.2 million (Q2 2014: €48.4 million); Twin Star 6M 2015: €13.3 million (6M 2014: €15.3 million), Q2 2015: €11.5 million (Q2 2014: €13.5 million); Pulkovo/Thalita 6M 2015: €100.7 million (6M 2014: €109.1 million), Q2 2015: €57.1 million (Q2 2014: €66.6 million).2) Figures since consolidation in the Fraport Group.3) Voting rights: 51 %, dividend share: 50 %.4) Figures according to the separate financial statement.
8 Fraport Group Interim Report 6M 2015Group Interim Management Report / Economic Report

In the first half of 2015, AMU Holdings Inc., which has been consoli-
dated in the Fraport Group since August 2014, generated revenue of
€28.7 million, EBITDA of €6.3 million, EBIT of €2.2 million and a result
of €2.2 million. Whereas the appreciation of the US$ had a negative
impact on the purchasing power of international passengers, this
appreciation increased the consolidated result of the company in €.
With rising passenger numbers, the Group company Ljubljana,
which has been included in the consolidation of the Fraport Group
since October 2014, reported revenue of €16.0 million, EBITDA of
€5.6 million, EBIT of €0.6 million and a result of €0.6 million in the first
six months of 2015.
Helped by good traffic development and a positive exchange rate effect
from the translation of the US$, the Lima Group company reported
strong growth in revenue, EBITDA, EBIT, and the result in the first half
of 2015 with growth of €31.6 million, €11.2 million, €9.4 million, and
€6.8 million respectively. The exchange rate effect increased revenue
by around €24.4 million, EBITDA by around €8.8 million, EBIT by
approximately €7.1 million, and the result by around €3.6 million.
For reasons relating to traffic volumes, the Group company Twin Star
recorded a decrease in revenue, EBITDA, EBIT, and the result in the
low single-digit million € range in the first half of 2015.
Likewise due to a lower volume of traffic, the Antalya Group company,
which is accounted for using the equity method, saw a decrease in
revenue, EBITDA, and EBIT in a range of around €10 million in the
first six months of 2015. The Group company’s result decreased from
€7.8 million to €0.8 million (– 89.7 %).
Adjusted for the recognition of earnings-neutral capacitive capital
expenditure in connection with the application of IFRIC 12 on the reve-
nue side, the Group company Pulkovo/Thalita, which is accounted
for using the equity method, showed a decrease in revenue from
€109.1 million to €100.7 million (– 7.7 %) in the reporting period due
to the exchange rate. The Group company’s EBITDA of €55.5 million
(+39.1 %), EBIT of €35.5 million (+83.0 %), and result of €72.0 million
(>100 %) significantly exceeded the figures for the previous year.
While currency translation of financial liabilities had a significant
negative impact of – €10.1 million on the previous year’s financial
result, currency translation had a positive effect of €97.2 million in
the reporting period.
The increase in traffic experienced by the Hanover Group company,
which is accounted for using the equity method, led to growth in reve-
nue, EBITDA, EBIT, and the result in the low single-digit million € range.
The Xi’an Group company, which is accounted for using the equity
method, saw an increase in traffic in the first six months of 2015, which
was reflected in its revenue, EBITDA, EBIT, and result for the period.
9Fraport Group Interim Report 6M 2015 Group Interim Management Report / Economic Report

Asset and Financial Position
Asset and capital structureIn comparison to the 2014 balance sheet date, the total assets
of the Fraport Group as at June 30, 2015 decreased slightly from
€9,013.2 million to €8,894.3 million (– 1.3 %). The reasons for the
decrease were lower non-current assets and non-current liabilities.
Non-current assets decreased 2.2 % compared to December 31, 2014
from €8,081.8 million to €7,906.3 million. The reason for the decrease
was largely reclassifications of non-current “other financial assets” to cur-
rent “other financial assets” on the grounds of maturity. The decrease in
“property, plant, and equipment” was primarily due to regular depreci-
ation and amortization. Current assets increased from €931.9 million to
€988.0 million (+6.0 %) in the reporting period. On one hand, the
item “trade accounts receivable” rose mainly due to the reporting
date while the item “other receivables and financial assets” increased
by €15.5 million. This reflected, among others, the aforementioned
reclassifications on the grounds of maturity as well as additions and
disposals of current financial assets. The item “non-current assets held
for sale” as at June 30, 2015 was linked to the intention to sell 51 %
of the capital shares in the Group company Fraport Cargo Services
GmbH (FCS) (see Significant Events after the Balance Sheet Date
beginning on page 16).
Despite the pay-out of the profit earmarked for distribution for the
previous fiscal year, shareholders’ equity in the reporting period
increased slightly from €3,286.0 million to €3,300.9 million (+0.5 %).
The rise was due to the positive Group result and exchange rate effects.
After deducting “non-controlling interests”, the shareholders’ equity
ratio was 36.4 % as at June 30, 2015 and was thus 2.0 percentage
points higher than the figure as at December 31, 2014 (+34.4 %).
At €4,457.6 million, non-current liabilities were €450.5 million below
the figure as at the 2014 balance sheet date (– 9.2 %). The main reason
for the lower figure was a decrease of €420.5 million in non-current
financial liabilities, which were reclassified to current financial liabilities
due to their remaining term. Current liabilities recorded an increase
from €819.1 million to €1,135.8 million (+38.7 %). The reason for
the increase was particularly an increase in current financial liabili-
ties. Whereas the reclassifications on grounds of maturity as well as
additions of current financial liabilities led to an increase, repayments
reduced the item.
As at June 30, 2015, gross debt stood at €4,050.1 million, a
€142.3 million decrease from the level on December 31, 2014
(– 3.4 %). After deducting the Group’s liquidity of €1,056.6 million
(December 31, 2014: €1,179.6 million), the net financial debt of
€2,993.5 million was 0.6 % lower in comparison with the 2014 balance
sheet date (December 31, 2014: €3,012.8 million). The gearing ratio
reached a level of 92.5 % (December 31, 2014: 97.3 %).
Additions to non-current assetsIn the first six months of fiscal year 2015, additions to non-current assets
of the Fraport Group were €108.1 million and thus €112.0 million lower
than the figure for the previous year (6M 2014: €220.1 million). Of this
amount, €87.4 million related to “property, plant, and equipment”
(6M 2014: €134.5 million), €4.5 million to “financial assets” (Q1 2014:
€74.8 million), €5.1 million to “investment property” (6M 2014:
€3.9 million) and €11.1 million to “other intangible assets” and “airport
operating projects” (6M 2014: €6.9 million). Capitalization of interest
expenses related to construction work amounted to €7.7 million
(6M 2014: €7.5 million).
At €90.6 million, the greater part of additions related to Fraport AG
(6M 2014: €132.9 million). The focus was on capital expenditure on the
existing infrastructure and preparations for Terminal 3.
10 Fraport Group Interim Report 6M 2015Group Interim Management Report / Economic Report

Reconciliation to the cash and cash equivalents as at the consolidated statement of financial position
Table 9
€ million June 30, 2015 June 30, 2014 December 31, 2014
Cash and cash equivalents as at the consolidated statement of cash flows 189.5 139.3 167.8
Time deposits with a duration of more than three months 185.0 202.8 210.0
Restricted cash 23.3 23.3 23.3
Cash and cash equivalents as at the consolidated statement of financial position 397.8 365.4 401.1
Statement of cash flowsIn the first half of 2015, the Fraport Group generated cash flow from
operating activities (operating cash flow) of €276.6 million, which
was €70.7 million higher compared to the previous year (6M 2014:
€205.9 million). The rise in operating activities resulted firstly from the
improvement in the operating result and secondly from cash inflows
to current assets. Payments for interest and taxes on income totaling
€73.9 million were lower than in the same period of the previous year
(6M 2014: €90.2 million).
At €75.7 million, cash flow used in investing activities without
investments in cash deposits and securities was lower than the
previous year particularly due to lower capital expenditure in property,
plant, and equipment (6M 2014: €97.7 million). Correspondingly, free
cash flow improved in the first half of 2015 from €107.6 million to
€189.7 million (+€82.1 million). The sale of consolidated subsidiaries
related to the sale of shares in Air-Transport IT Services Inc. as at April
22, 2015. Including financial investments in and proceeds from secu-
rities and promissory note loans, as well as returns from time deposits
with a term of more than three months, the cash flow from investing
activities was €58.2 million in the first half of 2015. In the same period
of the previous year it was €73.9 million.
Within financing activities, non-current financial liabilities of
€272.0 million (6M 2014: €154.3 million) were repaid, meaning that
the cash flow used in financing activities was €320.8 million in the
reporting period (6M 2014: €272.2 million). The acquisition of “non-
controlling interests” resulted from the takeover of the remaining shares
in the Group company Ljubljana following the squeeze-out resolution
by the general meeting of Aerodrom Ljubljana, d.d. of January 19, 2015.
In connection with the financing for the Antalya concession, bank
deposits of €23.3 million remained subject to drawing restrictions
as at June 30, 2015. Cash and cash equivalents in the statement of
cash flows therefore came to €189.5 million as at June 30, 2015. The
following table shows a reconciliation to cash and cash equivalents as
shown in the statement of financial position.
Value Management
The schedule for reporting value management is once a year at the
end of the fiscal year. It is not reported quarterly.
11Fraport Group Interim Report 6M 2015 Group Interim Management Report / Economic Report

Non-financial performance indicators
Table 10
Non-financial Performance Indicators
Customer satisfaction and product qualityGlobal satisfactionAt 80 % in the first half of 2015, global satisfaction (general passenger
satisfaction with the Frankfurt site) was slightly below the previous
year’s level (6M 2014: 81 %). Following 79 % in the first quarter, global
satisfaction in the second quarter was 80 % (in each case – 1 percentage
points compared to the same quarter of the previous year).
Punctuality rateThe punctuality rate at the Frankfurt site in the first half of 2015 was
80.2 % (6M 2014: 84.9 %). After the first quarter, at a level of 81.5 %,
it was already significantly below the previous quarter’s record level of
88.3 %, which was brought about by favorable weather conditions. The
ratio in the second quarter was 79.2 %, 2.6 percentage points lower
than in the second quarter of the previous year (81.8 %).
Baggage connectivityAt 98.7 %, baggage connectivity at the Frankfurt site remained at
the high level of the previous year in the first half of 2015. After a
slight decrease in the first quarter of 2015 (98.7 % compared to
98.9 % in the first quarter of 2014), the connectivity improved by
0.1 percentage points to 98.7 % in the second quarter of the fiscal year
(Q2 2014: 98.6 %).
Equipment availability rateThe equipment availability rate reached a value of 99.0 % in the
reporting period and was thus 1.0 percentage points above the pre-
vious year’s figure. The figure increased from 97.4 % to 98.9 % in the
second quarter (+1.5 percentage points). With an average availability
of 98.6 %, the availability of escalators showed particular improvement
compared to the previous year (6M 2014: 96.8 %).
Attractiveness as an employerEmployee satisfactionThe employee satisfaction survey will be started toward the end of the
third quarter of 2015 in the 14 participating Group companies. The
survey will be carried out online for the first time this year at Fraport AG
and at the Group companies that fulfill the necessary conditions.
Employee safety and health managementThe total number of work accidents in the first six months of 2015 was
697 compared to 662 work accidents in the previous year (+5.3 %).
The reason for the increase was, in particular, more accidents in the
Group company FraSec Fraport Security Services.
Indicators 6M 2015 6M 2014 Change Change in %
Global satisfaction (Frankfurt) 1) 80 % 81 % – 1.0 PP –
Punctuality rate (Frankfurt) 80.2 % 84.9 % – 4.7 PP –
Baggage connectivity (Frankfurt) 98.7 % 98.8 % – 0.1 PP –
Equipment availability rate (Frankfurt) 99.0 % 98.0 % 1.0 PP –
Employee satisfaction 2) – – – –
Total number of work accidents 3) 697 662 35 5.3
Indicators Q2 2015 Q2 2014 Change Change in %
Global satisfaction (Frankfurt) 1) 80 % 81 % – 1.0 PP –
Punctuality rate (Frankfurt) 79.2 % 81.8 % – 2.6 PP –
Baggage connectivity (Frankfurt) 98.7 % 98.6 % 0.1 PP –
Equipment availability rate (Frankfurt) 98.9 % 97.4 % 1.5 PP –
Employee satisfaction 2) – – – –
Total number of work accidents 3) 383 343 40 11.7
1) Global satisfaction is only surveyed quarterly at the Frankfurt site. The Group airports in which Fraport holds a share of at least 50 % are surveyed on this on an annual basis. 2) Employee satisfaction is only surveyed on an annual basis. 3) The work accident figures relate to the reporting date. Due to late registrations, these figures may change.
12 Fraport Group Interim Report 6M 2015Group Interim Management Report / Economic Report

Development of headcount
Development of total employees
Employees
Research and Development
As stated in the 2014 Group management report, as a service-sector
group, Fraport does not engage in research and development in
the strict sense, meaning that further disclosures in accordance with
DRS 20 do not apply (see 2014 Annual Report, page 70). However,
Fraport continues to utilize suggestions for improvements and inno-
vations from employees, which play a successful role in retaining and
expanding its international competitiveness (see 2014 Annual Report
beginning on page 74).
There were no significant changes resulting from ideas and innovations
influencing the business development in the reporting period.
Compared with the same period of the previous year, the average
number of employees in the Fraport Group (excluding apprentices
and employees on leave) increased to 20,691 in the first half of
2015 (6M 2014: 20,180). In Germany, the need for staff increased
particularly in the Group companies APS Airport Personal Service
and FraCareServices due to the increase in passenger numbers at the
Frankfurt site (+378 and +95 employees, respectively). The reduction
in headcount at Fraport AG (– 208 employees), which was primarily
due to the use of fluctuation combined with higher employment in
Compared with the same date in the previous year, the total number of
employees in the Fraport Group (employees including joint ventures,
apprentices, and employees on leave) increased by 880 to 23,973
as at June 30, 2015 (June 30, 2014: 23,093 employees). Despite a
decrease of 250 employees at Fraport AG, there was an increase in
the Group-wide headcount as at the balance sheet date as a result of
higher employment in the Group companies. In Germany, the increase
was primarily due to the Group company APS Airport Personal Service
(+421 employees). Outside Germany, primarily the incorporation of the
new Group companies Ljubljana (+414 employees) and AMU Holdings
Inc. (+27 employees) led to a higher headcount.
the Group companies, had the opposite effect on the Group-wide
headcount. Outside of Germany, headcount increased by 255 to 1,794
despite a decrease in employment in the Group company Twin Star for
reasons relating to traffic volumes (– 100 employees) and despite the
sale of the Group company Air-Transport IT Services (– 23 employees).
The increase was primarily due to the incorporation of the new Group
companies Ljubljana (+400 employees) and AMU Holdings Inc.
(+27 employees).
Table 11
Table 12
Average number of employees 6M 2015 6M 2014 Change Change in %
Fraport Group 20,691 20,180 511 2.5
thereof Fraport AG 10,581 10,789 – 208 – 1.9
thereof Group companies 10,110 9,391 719 7.7
thereof in Germany 18,897 18,641 256 1.4
thereof abroad 1,794 1,539 255 16.6
Q2 2015 Q2 2014 Change Change in %
Fraport Group 20,741 20,120 621 3.1
thereof Fraport AG 10,565 10,762 – 197 – 1.8
thereof Group companies 10,176 9,358 818 8.7
thereof in Germany 18,767 18,307 460 2.5
thereof abroad 1,974 1,813 161 8.9
Total employees as at the reporting date June 30, 2015 June 30, 2014 Change Change in %
Fraport Group 23,973 23,093 880 3.8
thereof Fraport AG 11,537 11,787 – 250 – 2.1
thereof Group companies 12,436 11,306 1,130 10.0
thereof in Germany 20,919 20,214 705 3.5
thereof abroad 3,054 2,879 175 6.1
13Fraport Group Interim Report 6M 2015 Group Interim Management Report / Economic Report

Share performanceThe German equity markets performed positively in the first half of
2015. At 10,945 points, Germany’s benchmark DAX closed 11.6 %
higher than the 2014 fiscal year’s closing price. The MDAX achieved
an increase of 15.9 % in the same period. After significant gains in the
first quarter (DAX +22.0 % and MDAX +22.1 %), development cooled
in the second quarter of 2015, primarily due to the uncertain economic
development of Greece and the consequences for the European
economy that may result. The low interest rates and overall favorable
economic conditions continued to have a positive impact. The Euro-
pean Central Bank’s decision to purchase €60 billion in government
bonds and other securities from Euro zone countries each month until
the end of September 2016 also stimulated equity markets.
Within this favorable market environment, the Fraport share also per-
formed well. Following share price growth of 15.9 % in the first quarter
of the fiscal year, the Fraport share gained again in the second quarter,
increasing 1.2 % to €56.34. Cumulatively, the growth in the first half
was therefore 17.3 % or, taking account of the dividend payment of
€1.35 per share on June 1, 2015, 20.1 %.
The shares of other stock-exchange listed European airports performed
as follows in the reporting period: Aéroports de Paris +1.7 %, Vienna
Airport +1.3 %, and Zurich Airport +8.6 %. Compared with its issue
price of €58 per share, the Spanish airport operator AENA gained
61.6 % between its initial listing on February 11, 2015 and June 30, 2015.
Fraport share
Table 13
6M 2015 Q2 2015
Opening price in € 48.04 55.67
Closing price in € 56.34 56.34
Change 1) 8.30 0.67
Change in % 2) 17.3 % 1.2 %
Highest price in € (daily closing price) 62.30 62.30
Lowest price in € (daily closing price) 48.04 55.72
Average price in € (daily closing prices) 55.74 58.11
Average trading volume per day (number) 137,589 148,938
Market capitalization in € million (quarterly closing price) 5,203 5,203
1) Change including dividends: 6M 2015: +€9.65, Q2 2015: +€2.02.2) Change including dividends: 6M 2015: +20.1 %, Q2 2015: +3.6 %
in %
Share price performance, index base 100
100
150
180
90
January 1, 2015
Fraport AG DAX MDAX AENA Aéroports de Paris Vienna Airport Zurich Airport
Source: Bloomberg
June 30, 2015
Graphic 1
Share
14 Fraport Group Interim Report 6M 2015Group Interim Management Report / Economic Report
Notification of voting rights pursuant to Section 21 of the German Securities Trading Act (WpHG)
Development in shareholder structureFraport was notified of the following changes in shareholder structure
in the reporting period:
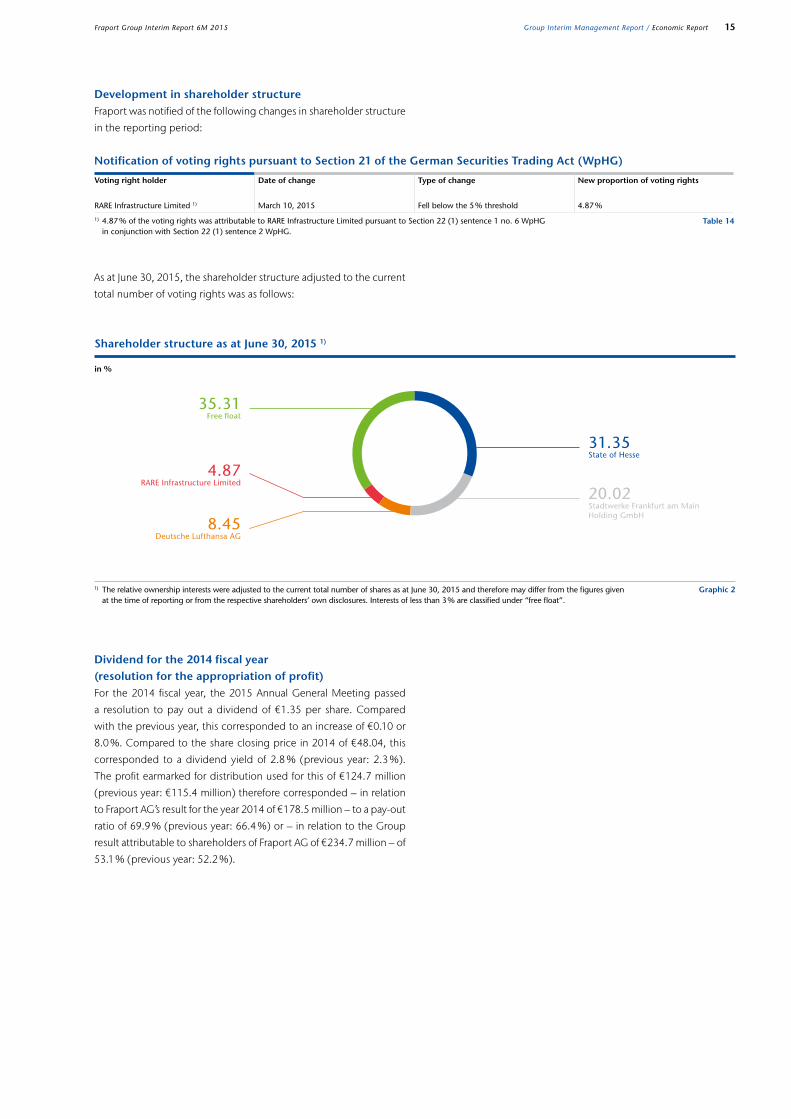
As at June 30, 2015, the shareholder structure adjusted to the current
total number of voting rights was as follows:
Dividend for the 2014 fiscal year (resolution for the appropriation of profit)For the 2014 fiscal year, the 2015 Annual General Meeting passed
a resolution to pay out a dividend of €1.35 per share. Compared
with the previous year, this corresponded to an increase of €0.10 or
8.0 %. Compared to the share closing price in 2014 of €48.04, this
corresponded to a dividend yield of 2.8 % (previous year: 2.3 %).
The profit earmarked for distribution used for this of €124.7 million
(previous year: €115.4 million) therefore corresponded – in relation
to Fraport AG’s result for the year 2014 of €178.5 million – to a pay-out
ratio of 69.9 % (previous year: 66.4 %) or – in relation to the Group
result attributable to shareholders of Fraport AG of €234.7 million – of
53.1 % (previous year: 52.2 %).
Shareholder structure as at June 30, 2015 1)
in %
1) The relative ownership interests were adjusted to the current total number of shares as at June 30, 2015 and therefore may differ from the figures given at the time of reporting or from the respective shareholders’ own disclosures. Interests of less than 3 % are classified under “free float”.
31.35State of Hesse
4.87RARE Infrastructure Limited
20.02Stadtwerke Frankfurt am Main Holding GmbH
35.31Free float
8.45Deutsche Lufthansa AG
Graphic 2
Table 14
Voting right holder Date of change Type of change New proportion of voting rights
RARE Infrastructure Limited 1) March 10, 2015 Fell below the 5 % threshold 4.87 %
1) 4.87 % of the voting rights was attributable to RARE Infrastructure Limited pursuant to Section 22 (1) sentence 1 no. 6 WpHG in conjunction with Section 22 (1) sentence 2 WpHG.
15Fraport Group Interim Report 6M 2015 Group Interim Management Report / Economic Report

Outlook Report
General Statement of the Executive Board
The Executive Board continues to expect that the economic and
industry-specific conditions in 2015 will have a positive impact on
passenger numbers in the Fraport Group. At the Frankfurt site, this will
primarily lead to higher revenue in the Aviation and Retail & Real Estate
segments. In addition to traffic growth, the increase in airport and infra-
structure charges will have a revenue-increasing effect at the Frankfurt
site. In external business, the Executive Board expects higher contribu-
tions primarily from the Group company Lima and from the first-time
full-year consolidation of the Group companies AMU Holdings Inc.
and Ljubljana. Across the Group, positive as well as negative effects
may continue to arise from exchange rate fluctuations, which may
impact the purchasing power of passengers in the retail businesses.
Furthermore, in particular the development of the St. Petersburg,
Antalya, Varna, and Burgas sites may be influenced by the continuing
tense economic and political situation in Russia. Despite these uncer-
tainties, the Executive Board continues to expect an increase in Group
revenue and the Group results.
At the end of the reporting period, the Executive Board continues
to assess that there are no significant risks that might jeopardize the
Fraport Group as a going concern. The Executive Board continues to
examine opportunities for optimizing the asset and financial position
and aims to expand the external business with a focus on earnings.
In connection with the planned acquisition of the concession agree-
ments to operate 14 Greek regional airports, it is currently not certain
whether or when the transaction can be completed in view of the
political and macroeconomic development in Greece. The forecast
for the current 2015 fiscal year does not include any effects from this
transaction. Further acquisitions or disposals of businesses are likewise
not included in the forecast. The Executive Board continues to assess
the financial situation in the forecasted period as stable.
Significant Events after the Balance Sheet Date
Fraport agrees strategic partnership for freight handling at Frankfurt AirportOn July 7, 2015, Fraport concluded a strategic partnership with
Worldwide Flight Services (WFS) in the area of freight handling at the
Frankfurt site. As part of this agreement, Fraport will sell 51 % of the
Group company FCS. FCS generated revenue of €59.6 million and a
net result of – €6.3 million in the previous fiscal year. Subject to the
approval of the antitrust authorities, the sale of the interest is expected
to close by September 2015. The remaining capital shares in the Group
company FCS will subsequently be included in the Group using the
equity method.
There were no other significant events for the Fraport Group after the
balance sheet date.
16 Fraport Group Interim Report 6M 2015Group Interim Management Report / Significant Events after the Balance Sheet Date / Outlook Report

Business outlook
Forecasted situation of the Group for 2015The forecasted situation of the Fraport Group for 2015 as presented in
the 2014 Group management report remains unchanged with respect
to operating activities, structure, strategy, and control of the Group
(see 2014 Annual Report beginning on page 91).
Forecasted economic and industry-specific conditions for 2015 Development of the economic conditionsFollowing global economic growth of around 3.4 % in 2014, financial
and economic institutions continue to expect the global economy to
expand in the 2015 fiscal year. Generally, a growth rate of 3.2 % to 3.3 %
is assumed and a growth rate of 4.1 % is assumed for global trade.
The turbulences surrounding Greece and China’s stock exchanges
are not expected to represent a serious risk for the global economy
– despite significant effects in both countries. With regard to the
€ to US$ exchange rate, it is assumed that the depreciation trend will
continue in a weakened form if at all in the rest of 2015, partly because
the impact of the European bond purchase program has largely been
included in the current prices. Whether the currently relatively low
oil price will continue is questionable. While various forecasts assume
an increase in the next twelve months, the agreement on the nuclear
dispute with Iran, which could now export oil again, could militate
against these forecasts.
German industry’s order development recently gained momen-
tum. However, developments in Greece will have to be kept under
observation. The crisis there could break through to other Euro
countries and lead to less investments, which would affect the export-
dependent German economy. The forecasts of German GDP growth
in 2015 currently range from 1.6 % to 1.9 %.
Risk and Opportunities Report
The Fraport Group has a comprehensive, Group-wide risk and op-
portunities management system, which makes it possible for Fraport
to identify and analyze risks at an early stage, and to control and limit
those risks using appropriate measures, as well as to take advantage of
opportunities. This results in the early identification of potential material
risks that could jeopardize the Fraport Group. The revised policy for
the Fraport AG risk management system and the Group policy for the
Group companies involved came into force as at January 1, 2015. As
part of the revision/preparation, the Group-wide risk matrix, with its
dimensions of the levels of financial impact, probability, and risk, was
redefined and each was extended by an additional level. The extension
that took place had no impact on the reporting in the Group Interim
Report for the period ended June 30, 2015.
Changes during the reporting periodThe 2014 Annual Report beginning on page 86 reported on the risk
that describes the negative equity situation of Northern Capital Gate-
way. The shareholders of Thalita Trading Limited, Cyprus, restructured
the loans granted by them to Northern Capital Gateway in the second
quarter of 2015. This will involve the assumption of the existing liabil-
ities of Northern Capital Gateway by Thalita Trading Limited, Cyprus,
followed by their conversion into equity in Northern Capital Gateway,
thus remedying its negative shareholders’ equity.
There were no further material changes to the risks and opportunities
presented in the Group management report as at December 31, 2014
(see 2014 Annual Report beginning on page 74). The Executive Board
believes that the changes to individual risks did not have any material
impact on Fraport’s overall risk and opportunity profile. Furthermore,
in the Executive Board’s estimation, there are no discernible risks that
could jeopardize the Fraport Group as a going concern.
17Fraport Group Interim Report 6M 2015 Group Interim Management Report / Outlook Report

Forecasted business development for 2015 Taking the economic and industry-specific conditions into account
and the business development in the first half of 2015, the Executive
Board continues to expect a growth rate of between 2 % and 3 % for
passenger traffic at the Frankfurt site for full year 2015. Although pas-
senger traffic grew in the first half of 2015 above the aforementioned
range at 4.1 %, the Executive Board cannot rule out further strikes in
air traffic and therefore abides by the stated outlook. Further negative
effects may continue to result from the airlines’ short-term yield and
capacity management and from the extraordinarily favorable weather
conditions in the 2014 fiscal year. With regard to cargo tonnage han-
dled, the Executive Board expects development below that of the
market of between 0 % and – 2 % for the Frankfurt site for 2015 (forecast
at the start of the fiscal year: growth of up to 3 %). Due to economic
and political crises, particularly in some emerging countries, the cargo
outlook continues to be subject to uncertainty.
Due to the fact that predicting Russia’s economic and political devel-
opment remains difficult, the traffic outlook for the St. Petersburg,
Antalya, Varna, and Burgas sites is still subject to high uncertainty.
Whereas growth rates of approximately 4 % were still anticipated for
the Antalya, Varna, and Burgas airports at the start of the fiscal year,
these will be lower and will probably be negative due to the continuing
tense situation in Russia – as already happened in the first six months
2015. As a result of the positive economic assumptions and tourism
forecasts, the Executive Board expects further significant growth at
the Lima site at a high single-digit growth rate and at the Xi’an site
at a low double-digit growth rate in the 2015 fiscal year. The growth
rate of the new Ljubljana Group company is forecasted at a higher
single-digit growth rate.
Forecasted results of operations for 2015On the basis of business development in the first six months of 2015
and the aforementioned forecasted business development, the Exec-
utive Board maintains its earnings outlook for the fiscal year (see 2014
Annual Report beginning on page 93). Group revenue – adjusted
by IFRIC 12 – of between approximately €2.55 billion and some
€2.6 billion continues to be expected. Group EBITDA will lie between
approximately €820 million and some €840 million, and Group EBIT
between approximately €500 million and some €520 million. A level
between some €405 million and some €425 million is forecasted for
Group EBT and a figure of between approximately €265 million and
some €285 million is forecasted for the Group result.
The USA will continue to show positive growth in 2015 (GDP forecast
of 2.3 % to 2.5 %), although the weather-related slump in the first
quarter led to less growth. China is likely to grow by about 7 % this
year and therefore remain behind the performance of previous years.
For most of the emerging countries, growth rates are expected that
will be significantly higher than the growth of industrial countries. A
slight upturn is anticipated in the Euro zone – which will continue
to be burdened with uncertainty regarding financial policy. After
growth of 0.8 % in 2014, economic growth of approximately 1.5 % is
forecasted for 2015.
The following growth rates are expected for the countries with sig-
nificant Fraport investments: Slovenia +2.1 %, Peru +3.3 %, Bulgaria
+1.2 %, Turkey +3.0 %, Russia – 3.2 %, and China +7.0 %.
Sources: IMF (April, July 2015), Deutsche Bank Research (July 2015), DekaBank (July, August 2015).
Development of the legal environmentNo changes to the legal environment that would have a significant
influence on the business development of Fraport can currently be
discerned.
Development of the global aviation marketAccording to the latest forecast, IATA expects growth of 6.7 % for
global air traffic in the 2015 fiscal year based on revenue passenger
kilometers (RPK). Regionally IATA anticipates the following growth rates
(also based on RPK): Europe: 6.8 %, North America: 3.0 %, Asia-Pacific:
8.1 %, Latin America: 5.1 %, Middle East: 12.9 %, and Africa: 3.2 %.
Cargo is expected to grow by 5.3 %. Positive stimulus is expected
from the low price for crude oil, which will allow ticket prices to fall
and make new routes economic.
Source: IATA “Economic Performance of the Airline Industry” (June 2015).
18 Fraport Group Interim Report 6M 2015Group Interim Management Report / Outlook Report
Where the statements made in this document relate to the future rather than the past, these statements are based on a number of assumptions about future events and are subject to a number of uncertainties and other factors, many of which are beyond the control of Fraport AG Frankfurt Airport Services Worldwide and which could have the effect that the actual results will differ materially from these statements. These factors include, but are not limited to, the competitive environment in deregulated markets, regulatory changes, the success of business operations, and a substantial deterioration in basic economic conditions in the markets in which Fraport AG Frankfurt Airport Services Worldwide and its Group companies operate. Readers are cautioned not to rely to an inappropriately large extent on statements made about the future.
Forecasted segment development for 2015Compared to the forecasted segment development of the Ground
Handling and External Activities & Services segments, there have been
no significant improvements or deteriorations in the first six months of
2015, with the result that the forecast given by the Executive Board
at the start of the fiscal year is still valid (see 2014 Annual Report
beginning on page 93).
With regard to the Aviation segment, following the end of the first six
months the Executive Board expects an increase in revenue that will be
slightly higher than the forecast at the start of the fiscal year (forecast at
the start of the fiscal year: increase of up to 5 %). The segment EBITDA
and EBIT will largely be within the range given at the start of the fiscal
year (forecast at the start of the fiscal year: growth between around
€5 million and €15 million).
With regard to the Retail & Real Estate segment, following the first six
months of 2015, the Executive Board expects better revenue perfor-
mance than forecasted at the start of the fiscal year (forecast at the start
of the fiscal year: increase of up to approximately 5 %). The Executive
Board also expects development of segment EBITDA and EBIT to be
above the values forecasted in the 2014 Annual Report (forecast at the
start of the fiscal year: values at approximately the previous year’s level).
In the further course of the fiscal year, positive as well as negative effects
may continue to arise from exchange rate fluctuations, which may
impact the purchasing power of passengers in the retail businesses.
Also the development of the Group companies Twin Star, Antalya, and
St. Petersburg, which are allocated to the External Activities & Services
segment, may be positively as well as negatively influenced by the
further economic and political development in Russia.
Forecasted asset and financial position for 2015Following the end of the first six months of the 2015 fiscal year, the Ex-
ecutive Board expects a higher increase in Group shareholders’ equity
and the shareholders’ equity ratio than assumed at the start of the fiscal
year (forecast at the start of the fiscal year: a slight increase compared
to the figure as at the 2014 balance sheet date in each case). As a
consequence of the higher shareholders’ equity and the continuing
positive development of the free cash flow, the gearing ratio will also
decrease more than forecasted (forecast at the start of the fiscal year:
decrease of up to approximately five percentage points). The Executive
Board confirms its other forecasts for the asset and financial position
(see 2014 Annual Report beginning on page 93).
Forecasted non-financial performance indicators for 2015The Executive Board also confirms its forecast for the development of
the non-financial performance indicators in the 2015 fiscal year (see
2014 Annual Report beginning on page 93).
19Fraport Group Interim Report 6M 2015 Group Interim Management Report / Outlook Report

Consolidated Income Statement
Group Interim Financial Statements
Table 15
€ million 6M 2015 6M 2014 Q2 2015 Q2 2014
Revenue 1,241.9 1,122.4 666.0 602.7
Change in work-in-process 0.5 0.4 0.3 0.3
Other internal work capitalized 14.2 13.5 7.1 6.8
Other operating income 17.9 23.6 13.3 18.5
Total revenue 1,274.5 1,159.9 686.7 628.3
Cost of materials – 289.3 – 245.4 – 146.0 – 123.6
Personnel expenses – 521.8 – 487.8 – 265.9 – 247.4
Other operating expenses – 78.4 – 72.5 – 42.9 – 37.6
EBITDA 385.0 354.2 231.9 219.7
Depreciation and amortization – 163.1 – 148.5 – 82.0 – 75.2
EBIT/Operating result 221.9 205.7 149.9 144.5
Interest income 14.3 18.6 6.5 9.5
Interest expenses – 82.8 – 91.7 – 40.7 – 47.0
Result from companies accounted for using the equity method 1.9 3.6 15.0 17.4
Other financial result – 3.1 – 7.1 5.9 – 3.7
Financial result – 69.7 – 76.6 – 13.3 – 23.8
EBT/Result from ordinary operations 152.2 129.1 136.6 120.7
Taxes on income – 49.2 – 37.4 – 44.2 – 35.0
Group result 103.0 91.7 92.4 85.7
thereof profit attributable to non-controlling interests 5.0 3.4 4.3 3.9
thereof profit attributable to shareholders of Fraport AG 98.0 88.3 88.1 81.8
Earnings per €10 share in €
basic 1.06 0.96 0.96 0.89
diluted 1.06 0.95 0.95 0.88
20 Fraport Group Interim Report 6M 2015Group Interim Financial Statements / Consolidated Income Statement
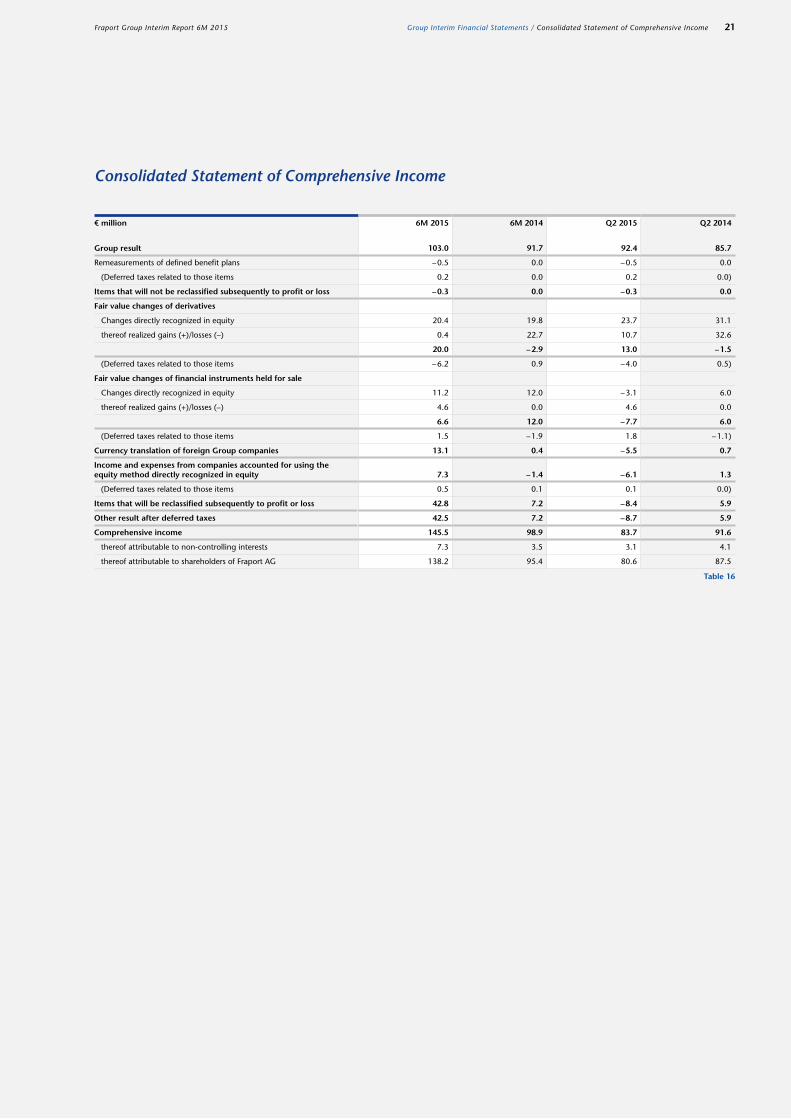
Consolidated Statement of Comprehensive Income
Table 16
€ million 6M 2015 6M 2014 Q2 2015 Q2 2014
Group result 103.0 91.7 92.4 85.7
Remeasurements of defined benefit plans – 0.5 0.0 – 0.5 0.0
(Deferred taxes related to those items 0.2 0.0 0.2 0.0)
Items that will not be reclassified subsequently to profit or loss – 0.3 0.0 – 0.3 0.0
Fair value changes of derivatives
Changes directly recognized in equity 20.4 19.8 23.7 31.1
thereof realized gains (+)/losses (–) 0.4 22.7 10.7 32.6
20.0 – 2.9 13.0 – 1.5
(Deferred taxes related to those items – 6.2 0.9 – 4.0 0.5)
Fair value changes of financial instruments held for sale
Changes directly recognized in equity 11.2 12.0 – 3.1 6.0
thereof realized gains (+)/losses (–) 4.6 0.0 4.6 0.0
6.6 12.0 – 7.7 6.0
(Deferred taxes related to those items 1.5 – 1.9 1.8 – 1.1)
Currency translation of foreign Group companies 13.1 0.4 – 5.5 0.7
Income and expenses from companies accounted for using the equity method directly recognized in equity 7.3 – 1.4 – 6.1 1.3
(Deferred taxes related to those items 0.5 0.1 0.1 0.0)
Items that will be reclassified subsequently to profit or loss 42.8 7.2 – 8.4 5.9
Other result after deferred taxes 42.5 7.2 – 8.7 5.9
Comprehensive income 145.5 98.9 83.7 91.6
thereof attributable to non-controlling interests 7.3 3.5 3.1 4.1
thereof attributable to shareholders of Fraport AG 138.2 95.4 80.6 87.5
21Fraport Group Interim Report 6M 2015 Group Interim Financial Statements / Consolidated Statement of Comprehensive Income
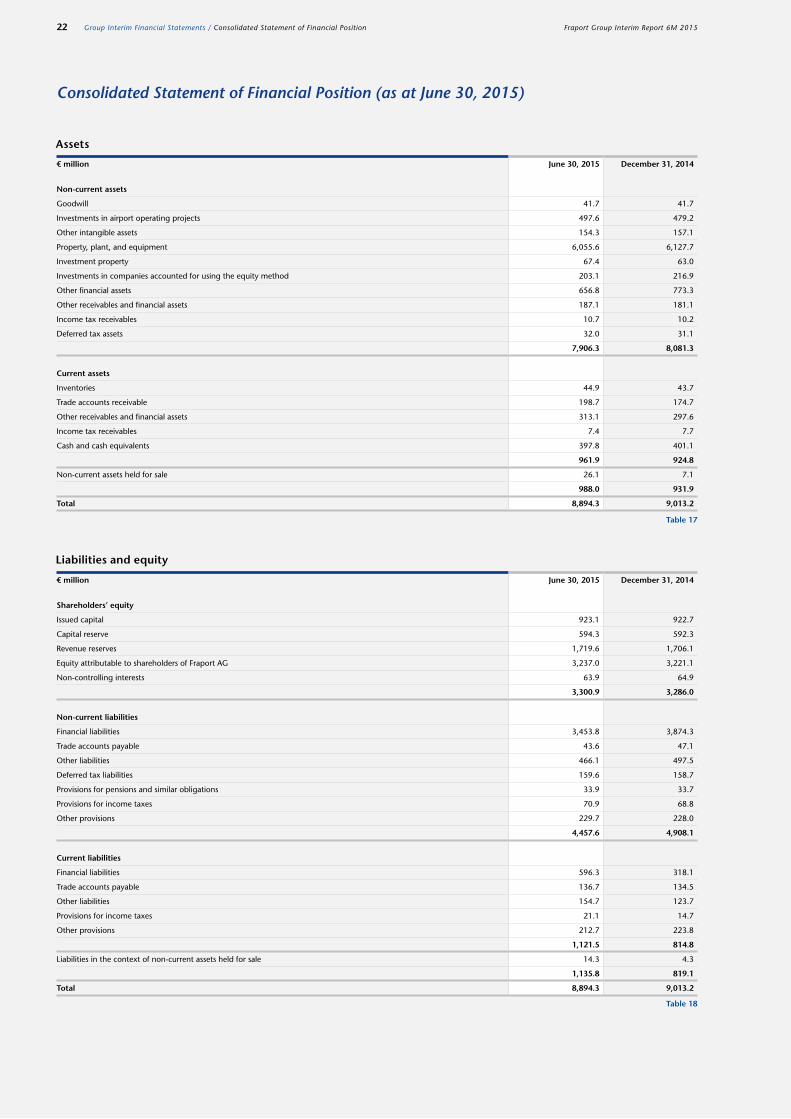
Consolidated Statement of Financial Position (as at June 30, 2015)
Table 18
Table 17
€ million June 30, 2015 December 31, 2014
Non-current assets
Goodwill 41.7 41.7
Investments in airport operating projects 497.6 479.2
Other intangible assets 154.3 157.1
Property, plant, and equipment 6,055.6 6,127.7
Investment property 67.4 63.0
Investments in companies accounted for using the equity method 203.1 216.9
Other financial assets 656.8 773.3
Other receivables and financial assets 187.1 181.1
Income tax receivables 10.7 10.2
Deferred tax assets 32.0 31.1
7,906.3 8,081.3
Current assets
Inventories 44.9 43.7
Trade accounts receivable 198.7 174.7
Other receivables and financial assets 313.1 297.6
Income tax receivables 7.4 7.7
Cash and cash equivalents 397.8 401.1
961.9 924.8
Non-current assets held for sale 26.1 7.1
988.0 931.9
Total 8,894.3 9,013.2
€ million June 30, 2015 December 31, 2014
Shareholders’ equity
Issued capital 923.1 922.7
Capital reserve 594.3 592.3
Revenue reserves 1,719.6 1,706.1
Equity attributable to shareholders of Fraport AG 3,237.0 3,221.1
Non-controlling interests 63.9 64.9
3,300.9 3,286.0
Non-current liabilities
Financial liabilities 3,453.8 3,874.3
Trade accounts payable 43.6 47.1
Other liabilities 466.1 497.5
Deferred tax liabilities 159.6 158.7
Provisions for pensions and similar obligations 33.9 33.7
Provisions for income taxes 70.9 68.8
Other provisions 229.7 228.0
4,457.6 4,908.1
Current liabilities
Financial liabilities 596.3 318.1
Trade accounts payable 136.7 134.5
Other liabilities 154.7 123.7
Provisions for income taxes 21.1 14.7
Other provisions 212.7 223.8
1,121.5 814.8
Liabilities in the context of non-current assets held for sale 14.3 4.3
1,135.8 819.1
Total 8,894.3 9,013.2
Assets
Liabilities and equity
22 Fraport Group Interim Report 6M 2015Group Interim Financial Statements / Consolidated Statement of Financial Position

Consolidated Statement of Cash Flows
Table 19
€ million 6M 2015 6M 2014 Q2 2015 Q2 2014
Profit attributable to shareholders of Fraport AG 98.0 88.3 88.1 81.8
Profit attributable to non-controlling interests 5.0 3.4 4.3 3.9
Adjustments for
Taxes on income 49.2 37.4 44.2 35.0
Depreciation and amortization 163.1 148.5 82.0 75.2
Interest result 68.5 73.1 34.2 37.5
Gains/losses from disposal of non-current assets 3.0 – 0.1 2.9 0.0
Others 1.3 1.0 – 6.5 0.5
Fair value changes of companies accounted for using the equity method – 1.9 – 3.6 – 15.0 – 17.4
Changes in inventories – 1.2 – 1.0 – 0.4 – 0.7
Changes in receivables and financial assets – 23.6 – 41.9 – 3.9 6.8
Changes in liabilities – 7.1 13.6 – 25.6 2.5
Changes in provisions – 3.8 – 22.6 5.5 – 30.3
Operating activities 350.5 296.1 209.8 194.8
Financial activities
Interest paid – 46.5 – 55.2 – 32.1 – 38.6
Interest received 10.6 14.3 6.3 8.5
Taxes on income paid – 38.0 – 49.3 – 21.3 – 33.2
Cash flow from operating activities 276.6 205.9 162.7 131.5
Investments in airport operating projects – 7.7 – 6.0 – 3.7 – 3.3
Capital expenditure for other intangible assets – 3.4 – 0.9 – 0.7 0.8
Capital expenditure for property, plant, and equipment – 92.5 – 110.7 – 46.2 – 63.7
Investment property – 6.1 – 5.9 – 2.4 – 2.4
Sale of fully consolidated subsidiaries 10.0 0.0 10.0 0.0
Dividends from companies accounted for using the equity method 22.8 25.2 14.8 10.6
Proceeds from disposal of non-current assets 1.2 0.6 – 0.9 – 0.3
Cash flow used in investing activities without investments in cash deposits and securities – 75.7 – 97.7 – 29.1 – 58.3
Financial investments in securities and promissory note loans – 125.9 – 375.3 – 50.0 – 162.1
Proceeds from disposal of securities and promissory note loans 234.8 417.3 128.9 232.8
Decrease of time deposits with a duration of more than three months 25.0 129.6 – 30.0 91.2
Cash flow from investing activities 58.2 73.9 19.8 103.6
Dividends paid to shareholders of Fraport AG – 124.6 – 115.3 – 124.6 – 115.3
Dividends paid to non-controlling interests – 3.6 – 2.4 – 1.0 – 1.3
Capital increase 2.4 2.5 – 0.7 2.5
Acquisition of non-controlling interests – 4.1 0.0 2.4 0.0
Repayment of long-term financial liabilities – 272.0 – 154.3 – 266.7 – 90.0
Changes in short-term financial liabilities 81.1 – 2.7 76.1 – 4.5
Cash flow used in financing activities – 320.8 – 272.2 – 314.5 – 208.6
Change in cash and cash equivalents 14.0 7.6 – 132.0 26.5
Cash and cash equivalents as at January 1 and April 1 167.8 131.2 325.5 112.1
Foreign currency translation effects on cash and cash equivalents 7.7 0.5 – 4.0 0.7
Cash and cash equivalents as at June 30 189.5 139.3 189.5 139.3
23Fraport Group Interim Report 6M 2015 Group Interim Financial Statements / Consolidated Statement of Cash Flows

Consolidated Statement of Changes in Equity
Table 20
€ million Issued capital
Capital reserve
Revenue reserves
Foreign currency
reserve
Financial instruments
Revenue reserves
(total)
Equity attribut -
able to sharehol-
ders of Fraport AG
Non- controlling
interests
Equity (total)
Balance as at January 1, 2015 922.7 592.3 1,731.8 26.6 – 52.3 1,706.1 3,221.1 64.9 3,286.0
Foreign currency translation effects – – – 10.8 – 10.8 10.8 2.3 13.1
Income and expenses from companies accounted for using the equity method directly recognized in equity – – – 9.9 – 2.1 7.8 7.8 – 7.8
Remeasurements of defined benefit plans – 0.3 – 0.3 – 0.3 – 0.3
Fair value changes of financial instruments held for sale – – – – 8.1 8.1 8.1 – 8.1
Fair value changes of derivatives – – – 13.8 13.8 13.8 – 13.8
Other result 0.0 0.0 – 0.3 20.7 19.8 40.2 40.2 2.3 42.5
Issue of shares for employee investment plan 0.4 2.0 – – – – 2.4 – 2.4
Distributions – – – 124.6 – – – 124.6 – 124.6 – 3.6 – 128.2
Group result – – 98.0 – – 98.0 98.0 5.0 103.0
Transactions with non-controlling interests – – – – – – – 4.7 – 4.7
Consolidation activities/other changes – – – 0.1 – – – 0.1 – 0.1 0.0 – 0.1
Balance as at June 30, 2015 923.1 594.3 1,704.8 47.3 – 32.5 1,719.6 3,237.0 63.9 3,300.9
Balance as at January 1, 2014 922.1 590.2 1,618.4 3.7 – 81.3 1,540.8 3,053.1 45.7 3,098.8
Foreign currency translation effects – – – 0.3 – 0.3 0.3 0.1 0.4
Income and expenses from companies accounted for using the equity method directly recognized in equity – – – – 1.0 – 0.3 – 1.3 – 1.3 – – 1.3
Fair value changes of financial instruments held for sale – – – – 10.1 10.1 10.1 – 10.1
Fair value changes of derivatives – – – – – 2.0 – 2.0 – 2.0 – – 2.0
Other result 0.0 0.0 0.0 – 0.7 7.8 7.1 7.1 0.1 7.2
Issue of shares for employee investment plan 0.5 2.0 – – – – 2.5 – 2.5
Management stock options plan
Capital increase for exercise of subscription rights 0.1 0.1 – – – – 0.2 – 0.2
Value of performed services (fair value) – – – – – – 0.0 – 0.0
Distributions – – – 115.3 – – – 115.3 – 115.3 – 2.4 – 117.7
Group result – – 88.3 – – 88.3 88.3 3.4 91.7
Consolidation activities/other changes – – 0.2 – – 0.2 0.2 – 0.3 – 0.1
Balance as at June 30, 2014 922.7 592.3 1,591.6 3.0 – 73.5 1,521.1 3,036.1 46.5 3,082.6
24 Fraport Group Interim Report 6M 2015Group Interim Financial Statements / Consolidated Statement of Changes in Equity

Segment Reporting
Table 21
€ million Aviation Retail & Real Estate
Ground Handling
External Activities &
Services
Adjustment Group
Revenue
6M 2015 444.0 233.1 333.0 231.8 1,241.9
6M 2014 418.4 218.7 317.5 167.8 1,122.4
Other income
6M 2015 10.1 5.3 5.2 12.0 32.6
6M 2014 16.7 5.8 8.5 6.5 37.5
Third-party revenue
6M 2015 454.1 238.4 338.2 243.8 1,274.5
6M 2014 435.1 224.5 326.0 174.3 1,159.9
Inter-segment revenue
6M 2015 40.3 118.9 21.8 180.1 – 361.1
6M 2014 38.4 115.2 16.5 174.2 – 344.3
Total revenue
6M 2015 494.4 357.3 360.0 423.9 – 361.1 1,274.5
6M 2014 473.5 339.7 342.5 348.5 – 344.3 1,159.9
EBITDA
6M 2015 102.4 183.9 12.6 86.1 385.0
6M 2014 104.4 172.3 11.2 66.3 354.2
Depreciation and amortization of segment assets
6M 2015 59.5 41.3 21.2 41.1 163.1
6M 2014 58.3 41.2 18.5 30.5 148.5
Segment result (EBIT)
6M 2015 42.9 142.6 – 8.6 45.0 221.9
6M 2014 46.1 131.1 – 7.3 35.8 205.7
Carrying amount of segment assets
June 30, 2015 3,983.2 2,466.5 653.3 1,741.2 50.1 8,894.3
December 31, 2014 4,049.8 2,538.0 668.4 1,708.0 49.0 9,013.2
25Fraport Group Interim Report 6M 2015 Group Interim Financial Statements / Segment Reporting

Selected Notes
Accounting and Valuation Policies
The 2014 consolidated financial statements were prepared in compliance with the International Financial Reporting Standards
(IFRS) issued by the International Accounting Standards Board (IASB) and the interpretations thereof by the International
Financial Reporting Interpretations Committee (IFRIC) as applicable in the European Union. These abbreviated interim financial
statements of the Fraport Group for the period ending June 30, 2015 have been prepared in accordance with IAS 34. As far
as they apply to the Fraport Group, all official bulletins of the IASB as at January 1, 2015 have been taken into account. The
interim report also meets the requirements of German Accounting Standard No. 16 (DRS 16) on interim financial reporting.
With respect to the accounting and valuation policies applied in Group accounting, please see the 2014 Annual Report
(see 2014 Annual Report beginning on page 111).
The interim financial statements were not reviewed or audited by an independent auditor.
26 Fraport Group Interim Report 6M 2015Group Interim Financial Statements / Selected Notes
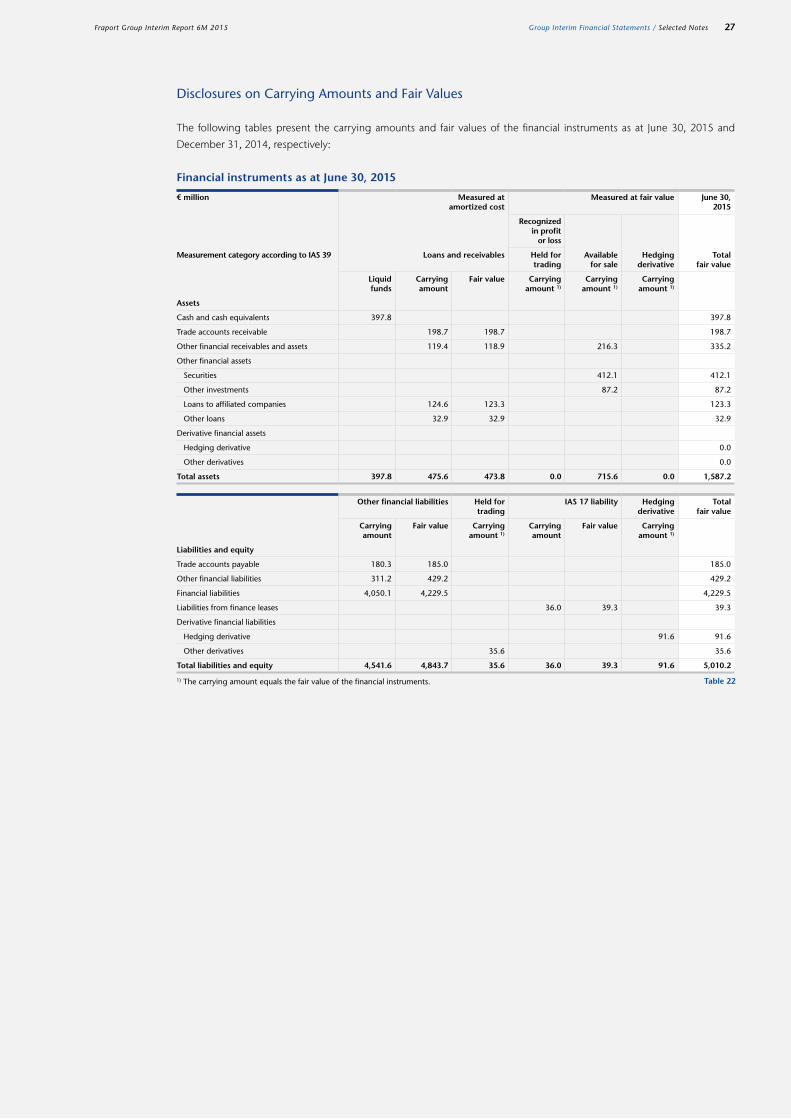
Disclosures on Carrying Amounts and Fair Values
The following tables present the carrying amounts and fair values of the financial instruments as at June 30, 2015 and
December 31, 2014, respectively:
Table 22
€ million Measured at amortized cost
Measured at fair value June 30, 2015
Recognized in profit
or loss
Measurement category according to IAS 39 Loans and receivables Held for trading
Available for sale
Hedging derivative
Total fair value
Liquid funds
Carrying amount
Fair value Carrying amount 1)
Carrying amount 1)
Carrying amount 1)
Assets
Cash and cash equivalents 397.8 397.8
Trade accounts receivable 198.7 198.7 198.7
Other financial receivables and assets 119.4 118.9 216.3 335.2
Other financial assets
Securities 412.1 412.1
Other investments 87.2 87.2
Loans to affiliated companies 124.6 123.3 123.3
Other loans 32.9 32.9 32.9
Derivative financial assets
Hedging derivative 0.0
Other derivatives 0.0
Total assets 397.8 475.6 473.8 0.0 715.6 0.0 1,587.2
Other financial liabilities Held for trading
IAS 17 liability Hedging derivative
Total fair value
Carrying amount
Fair value Carrying amount 1)
Carrying amount
Fair value Carrying amount 1)
Liabilities and equity
Trade accounts payable 180.3 185.0 185.0
Other financial liabilities 311.2 429.2 429.2
Financial liabilities 4,050.1 4,229.5 4,229.5
Liabilities from finance leases 36.0 39.3 39.3
Derivative financial liabilities
Hedging derivative 91.6 91.6
Other derivatives 35.6 35.6
Total liabilities and equity 4,541.6 4,843.7 35.6 36.0 39.3 91.6 5,010.2
1) The carrying amount equals the fair value of the financial instruments.
Financial instruments as at June 30, 2015
27Fraport Group Interim Report 6M 2015 Group Interim Financial Statements / Selected Notes
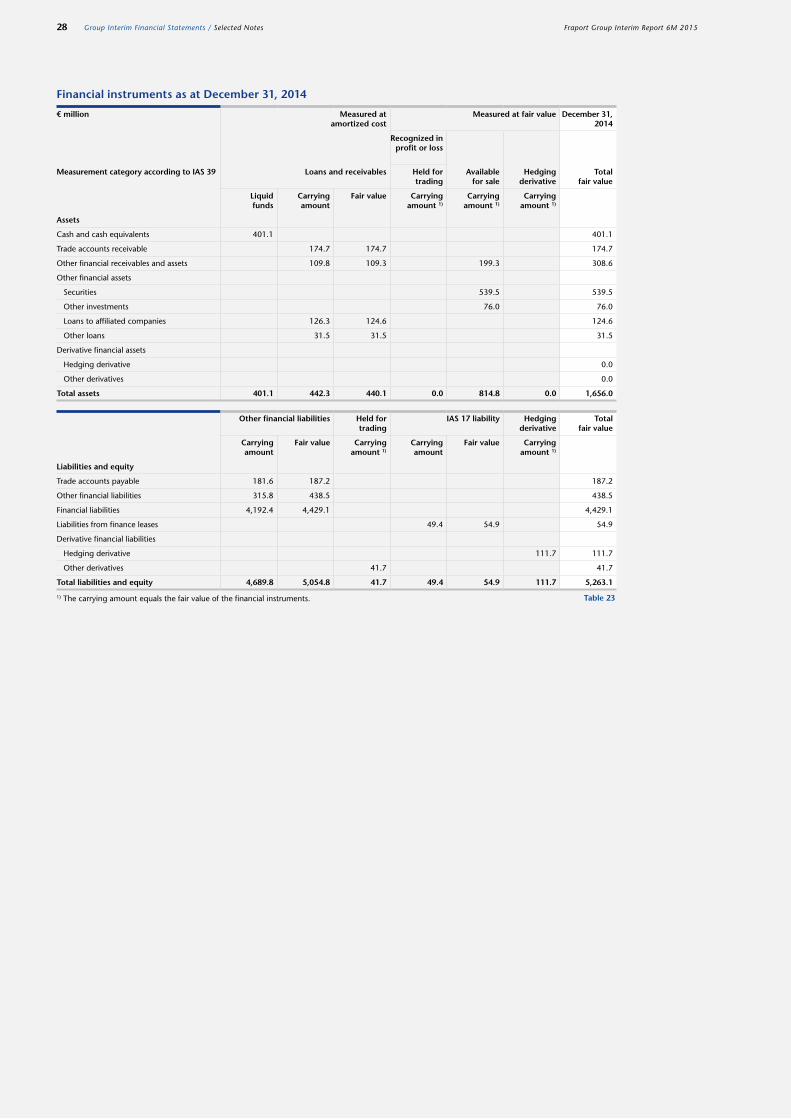
Table 23
€ million Measured at amortized cost
Measured at fair value December 31, 2014
Recognized in profit or loss
Measurement category according to IAS 39 Loans and receivables Held for trading
Available for sale
Hedging derivative
Total fair value
Liquid funds
Carrying amount
Fair value Carrying amount 1)
Carrying amount 1)
Carrying amount 1)
Assets
Cash and cash equivalents 401.1 401.1
Trade accounts receivable 174.7 174.7 174.7
Other financial receivables and assets 109.8 109.3 199.3 308.6
Other financial assets
Securities 539.5 539.5
Other investments 76.0 76.0
Loans to affiliated companies 126.3 124.6 124.6
Other loans 31.5 31.5 31.5
Derivative financial assets
Hedging derivative 0.0
Other derivatives 0.0
Total assets 401.1 442.3 440.1 0.0 814.8 0.0 1,656.0
Other financial liabilities Held for trading
IAS 17 liability Hedging derivative
Total fair value
Carrying amount
Fair value Carrying amount 1)
Carrying amount
Fair value Carrying amount 1)
Liabilities and equity
Trade accounts payable 181.6 187.2 187.2
Other financial liabilities 315.8 438.5 438.5
Financial liabilities 4,192.4 4,429.1 4,429.1
Liabilities from finance leases 49.4 54.9 54.9
Derivative financial liabilities
Hedging derivative 111.7 111.7
Other derivatives 41.7 41.7
Total liabilities and equity 4,689.8 5,054.8 41.7 49.4 54.9 111.7 5,263.1
1) The carrying amount equals the fair value of the financial instruments.
Financial instruments as at December 31, 2014
28 Fraport Group Interim Report 6M 2015Group Interim Financial Statements / Selected Notes

Given the short maturities, the carrying amounts of cash and cash equivalents, trade accounts receivable, and current other
financial receivables and assets as at the reporting date correspond to the fair value.
The fair values of listed securities are identical to the stock market prices on the reporting date. The valuation of unlisted
securities was based on market data applicable on the valuation date using reliable and specialized sources and data providers.
The values are determined using established valuation models.
The derivative financial instruments relate to interest rate hedging transactions. The fair values of these financial instruments
are determined on the basis of discounted future expected cash flows, using market interest rates corresponding to the
terms to maturity.
In order to determine the fair value of financial liabilities, the future expected cash flows are determined and discounted based
on the yield curve on the reporting date. The market-driven and maturity-linked risk premium of the respective borrower on
the reporting date is added to the cash flows.
There is no price quotation or market price for shares in partnerships as there is no active market for them. Shares in partner-
ships are recognized at acquisition costs since the fair value cannot be determined reliably. These assets are not intended for
sale as at the balance sheet date.
Other investments mainly concern shares in Delhi International Airport Private Ltd. The fair value was determined based on
a current bid and taking current foreign currency rates into account.
The fair values of loans to affiliated companies and other financial non-current assets are determined as the present value of
future cash flows. Discounting was applied using the current maturity-linked interest rate as at the balance sheet date. The fair
value of the loan including interest receivables to NCG is mainly affected by cash flow forecasts and interest rate developments.
The carrying amounts of other loans correspond to the respective fair values. Some of the other loans are subject to a mar-
ket interest rate, and their carrying amounts therefore represent a reliable valuation for their fair values. Another part of the
other loans is reported at present value as at the balance sheet date. Here, it is also assumed that the present value equals
the fair value. The remaining other loans are promissory note loans with a remaining term of less than four years. Due to the
lack of an active market, no information is available on the risk premiums of their respective issuers. As a result, their carrying
amounts were used as the most reliable value for their fair values. There is no intention to sell as at the balance sheet date.
Non-current liabilities are recognized at their present value. Interest rates with similar terms on the date of addition are used
as a basis for discounting future cash outflows. To determine fair value, the respective cash outflows are discounted at interest
rates with similar terms and with the Fraport credit risk as at the reporting date. The carrying amounts of current liabilities
are equal to the fair value.
29Fraport Group Interim Report 6M 2015 Group Interim Financial Statements / Selected Notes

The fair values of financial instruments belong to the following measurement categories of the hierarchy within the meaning
of IFRS 13:
Table 24
€ million June 30, 2015 Level 1 Quoted prices
Level 2 Derived prices
Level 3 Prices that cannot be
derived
Assets
Other financial receivables and financial assets
Available for sale 216.3 216.3 0.0 0.0
Loans and receivables 118.9 0.0 71.2 47.7
Other financial assets
Securities available for sale 412.1 311.2 100.9 0.0
Other investments 87.2 0.0 87.2 0.0
Loans to affiliated companies 123.3 0.0 4.2 119.1
Other loans 32.9 0.0 32.9 0.0
Total assets 990.7 527.5 296.4 166.8
Liabilities and equity
Trade accounts payable 185.0 0.0 185.0 0.0
Other financial liabilities 429.2 0.0 429.2 0.0
Financial liabilities 4,229.5 0.0 4,229.5 0.0
Liabilities from finance leases 39.3 0.0 39.3 0.0
Derivative financial liabilities
Derivatives without hedging relationships 35.6 0.0 35.6 0.0
Derivatives with hedging relationships 91.6 0.0 91.6 0.0
Total liabilities and equity 5,010.2 0.0 5,010.2 0.0
30 Fraport Group Interim Report 6M 2015Group Interim Financial Statements / Selected Notes

As at December 31, 2014, the financial instruments recognized at fair value in the statement of financial position belonged
to the following measurement categories of the hierarchy within the meaning of IFRS 13:
Table 25
€ million December 31, 2014 Level 1 Quoted prices
Level 2 Derived prices
Level 3 Prices that cannot be
derived
Assets
Other financial receivables and financial assets
Available for sale 199.3 199.3 0.0 0.0
Loans and receivables 109.3 0.0 68.0 41.3
Other financial assets
Securities available for sale 539.5 469.6 69.9 0.0
Other investments 76.0 0.0 76.0 0.0
Loans to affiliated companies 124.6 0.0 5.8 118.8
Other loans 31.5 0.0 31.5 0.0
Total assets 1,080.2 668.9 251.2 160.1
Liabilities and equity
Trade accounts payable 187.2 0.0 187.2 0.0
Other financial liabilities 438.5 0.0 438.5 0.0
Financial liabilities 4,429.1 0.0 4,429.1 0.0
Liabilities from finance leases 54.9 0.0 54.9 0.0
Derivative financial liabilities
Derivatives without hedging relationships 41.7 0.0 41.7 0.0
Derivatives with hedging relationships 111.7 0.0 111.7 0.0
Total liabilities and equity 5,263.1 0.0 5,263.1 0.0
31Fraport Group Interim Report 6M 2015 Group Interim Financial Statements / Selected Notes

Companies included in Consolidation
Fraport AG sold its shares in Air-Transport IT Services, Inc., USA with effect as at April 22, 2015. A profit of €8.0 million resulted
from the sale. In addition, the scope of consolidation changed as a result of the establishment of two subsidiaries that are fully
consolidated in the Fraport Group and not operationally active at this time. Within the scope of consolidation, due to the
intention to sell shares in FCS, assets and liabilities of the company are reported as ”held for sale“ and measured at fair value
in accordance with IFRS 5. Furthermore, the remaining shares in the already fully consolidated GCS Gesellschaft für Cleaning
Services mbH Co. Airport Frankfurt/Main KG, Frankfurt am Main, were acquired in the reporting period
As at June 30, 2015, a total of 68 companies including associates were consolidated in the Fraport Group.
Disclosures on Related Parties
There were no material changes arising regarding type and scope as at June 30, 2015. As disclosed in note 50 of the Group
notes to the 2014 Annual Report (see 2014 Annual Report beginning on page 185), there continue to be numerous business
relationships with related parties, which continue to be concluded under conditions customary in the market.
Disclosures on the Procedure for Determining Taxes on Income
In the interim reporting period, taxes on income are recognized on the basis of the best estimates made for the weighted
average annual income tax rate expected for the full year.
32 Fraport Group Interim Report 6M 2015Group Interim Financial Statements / Selected Notes

Disclosures on the Development of Shareholders’ Equity
The breakdown and development of shareholders’ equity from January 1 to June 30, 2015 is presented in the statement of
changes in equity in the Group interim financial statements as at June 30, 2015. The statement of changes in equity also shows
the development for the previous year.
Disclosures on Contingent Liabilities and Other Financial Commitments
Compared to December 31, 2014, order commitments related to capital expenditure on non-current assets increased by
€18.0 million from €175.0 million to €193.0 million.
Contingent liabilities and other financial commitments decreased by €7.9 million in the period ending June 30, 2015 due
to the sale of the shares in Air-Transport IT Services, Inc., USA. There were no further material changes in comparison to
December 31, 2014.
Disclosures on the Calculation of Earnings per Share
The calculation of earnings per share was based on the following parameters:
Table 26
6M 2015 basic
6M 2015 diluted
6M 2014 basic
6M 2014 diluted
Group result attributable to shareholders of Fraport AG in € million 98.0 98.0 88.3 88.3
Weighted average number of shares 92,271,967 92,530,295 92,215,667 92,866,323
Earnings per €10 share in € 1.06 1.06 0.96 0.95
Q2 2015 basic
Q2 2015 diluted
Q2 2014 basic
Q2 2014 diluted
Group result attributable to shareholders of Fraport AG in € million 88.1 88.1 81.8 81.8
Weighted average number of shares 92,278,552 92,536,880 92,217,684 92,868,343
Earnings per €10 share in € 0.96 0.95 0.89 0.88
33Fraport Group Interim Report 6M 2015 Group Interim Financial Statements / Selected Notes

Responsibility Statement
To the best of our knowledge, in accordance with the applicable accounting principles for interim financial reporting and taking the generally
accepted German accounting principles into account, the Group interim financial statements give a true and fair view of the asset, financial,
and earnings position of the Group. Furthermore, the Group interim management report presents the development and performance of the
business and situation of the Group in such a way as to give a true and fair view and describes the material opportunities and risks associated
with the expected development of the Group for the remaining fiscal year.
Frankfurt am Main, August 6, 2015
Fraport AG
Frankfurt Airport Services Worldwide
The Executive Board
Further Information
Dr Schulte Giesen Müller Dr Zieschang
34 Fraport Group Interim Report 6M 2015Further Information / Responsibility Statement

Financial Calendar
Thursday, November 5, 2015 Group Interim Report
January 1 to September 30, 2015
Online publication, press conference,
and conference call with analysts and
investors
Wednesday, March 16, 2016 Annual Report 2015
Online publication, press conference,
and conference call with analysts and
investors
Imprint
PublisherFraport AG
Frankfurt Airport Services Worldwide
60547 Frankfurt am Main
Germany
Phone: +49 (0)1806 3724636 1)
Internet: www.fraport.com
Contact Investor RelationsStefan J. Rüter
Head of Finance and Investor Relations
Phone: +49 (0)69 690-74840
Fax: +49 (0)69 690-74843
Internet: www.meet-ir.com
E-mail: [email protected]
Layout and Design heureka GmbH, Essen
PhotographyMichael Gernhuber, Essen
Publication dateAugust 6, 2015
DisclaimerIn case of any uncertainties which arise
due to errors in translation, the German
version of the Group interim report is the
binding one.
RoundingThe use of rounded amounts and
percentages means slight discrepancies
may occur due to commercial rounding.
1) 20 cents (€) per call from a German landline; maximum of 60 cents (€) per call from a German cell phone.
Wednesday, February 10, 2016 January 2016
Thursday, March 10, 2016 February 2016
Tuesday, April 12, 2016 March 2016/Q1 2016
Thursday, May 12, 2016 April 2016
Friday, June 10, 2016 May 2016
Tuesday, July 12, 2016 June 2016/6M 2016
Wednesday, May 4, 2016 Group Interim Report
January 1 to March 31, 2016
Online publication, conference call
with analysts and investors
Friday, May 20, 2016Annual General Meeting 2016
Frankfurt am Main, Jahrhunderthalle
Monday, May 23, 2016Dividend payment
Traffic Calendar (Online publication)
Wednesday, August 12, 2015July 2015
Thursday, September 10, 2015August 2015
Monday, October 12, 2015 September 2015/9M 2015
Wednesday, November 11, 2015October 2015
Thursday, December 10, 2015 November 2015
Friday, January 15, 2016 December 2015/FY 2015
Thursday, August 4, 2016Group Interim Report
January 1 to June 30, 2016
Online publication, conference call
with analysts and investors
Thursday, November 3, 2016Group Interim Report
January 1 to September 30, 2016
Online publication, press conference,
and conference call with analysts and
investors
Wednesday, August 10, 2016 July 2016
Monday, September 12, 2016 August 2016
Thursday, October 13, 2016 September 2016/9M 2016
Thursday, November 10, 2016 October 2016
Monday, December 12, 2016 November 2016
35Fraport Group Interim Report 6M 2015 Further Information / Financial Calendar / Traffic Calendar / Imprint

Top Related