


Languages
Pages
Legal

UNIFORMED SERVICES UNIVERSITY OF THE HEALTH SCIENCESF. EDWARD HEBERT SCHOOL OF MEDICINE
4301 JONES BRIDGE ROADBETHESDA, MARYLAND 20814-4799
September 14, 2006BIOMEDICAL
GRADUATE PROGRAMS
Ph.D. Degrees APPROVAL SHEET
Title of Dissertation: "Improving Ion Mobility Spectrometry Detection Methods forTrace Forensics and Military Field Applications"
David Cruess, Ph.D.Department of Preventive Medicine & BimoetricsCommittee Chairperson
IDate
LCDR Greg CookDoctor of Philosophy Degree11 October 2006
Dissertation and Abstract Approved:
Name of Candidate:
Physician Scientist (MD/Ph.D.)
Doctor ofPublic Health (Dr.P.H.)
Master ofScience Degrees
Departmental-Clinical Psychology-Environmental Health Sciences-Medical Psychology-Medical Zoology-Pathology
Interdisciplinary-Emerging Infectious Diseases-Molecular & Cell Biology-Neuroscience
-Molecular & Cell Biology-Public Health
Masters DegreesDate
-Comparative Medicine-Military Medical History-Public Health-Tropical Medicine & Hygiene
C~II)O£)
Date
6cfHJ
7J5Obate
. .See Du g, M.D.Department of MedicCommittee Member
'15~Brian Eckenrode, Ph.D.FBI Counterterrorism & Forensic Science Research UnitCommittee Member
Graduate Education OfficeDr. Eleanor S. Metcalf, Associate Dean
Janet Anastasi, Program CoordinatorTanice Acevedo, Education Technician
WebSitewww.usuhs.milfgeo/gradpgm index.html
Phone NumbersCommercial: .301-295-9474
Toll Free: 800-772-1747DSN: 295~9474
FAJ(:301-295-6772
The author hereby certifies that the use of any copyrighted material in the thesismanuscript entitled:
Improving Ion Mobility Spectrometry Detection Methods for TraceForensics and Military Field Applications
Beyond brief excerpts is with the permission of the copyright owner, and will save andhold harmless the Uniformed Services University of the Health Sciences from any
damage, which may arise from J:ghtviolations.
LCDR Ore . Cook, M USNDepartment ofPreventive Medicine and BiometricsUniformed Services University of the Health Sciences
This paper is declared the work of the U.S. Government and is not subject tocopyright protection in the United States. "The views expressed in this article arethose of the author and do not reflect the official policy of position of the UnitedStates Air Force, Department ofDefense or the U.S. Government."
11

iii
Abstract
Title: Improving Ion Mobility Spectrometry Detection Methods for
Trace Forensics and Military Field Applications Gregory Wayne Cook, Doctor of Philosophy, Environmental
Health Science, 2006 Directed By: David Cruess, PhD
Professor, Department of Preventive Medicine and Biometrics
Ion mobility spectrometry (IMS) is a proven technology for field portable detection
of vapor phase explosive compounds due to its high sensitivity and rapid analysis.
However, IMS technology is limited in identifying complex samples in the field due to
poor resolution and limited dynamic range. Combining gas chromatography (GC) to
IMS can overcome some of the limitations by separating the components in a mixture
before detection; however, the addition of GC increases system complexity and lengthens
analysis times. The performance characteristics of the IMS and GC/IMS operational
modes of the GC-IONSCAN® were evaluated to determine if GC/IMS is more reliable
than IMS in the detection of explosive compounds amidst interferents. Five explosive
compounds (HMTD, PETN, RDX, TATP, and TNT) and four were used.
IMS was more sensitive, provided higher signal response, and offered much higher
sample throughput than GC/IMS for analysis of the pure explosive compounds.
However, when analyzing the pure interferent substances IMS analysis yielded seven
false positives compared to zero false positives with GC/IMS (n=40). When attempting
to discern explosive compounds in the presence of the interferent substances, IMS
analysis yielded 21 false positive responses compared to one false positive with GC/IMS
(n=100). IMS signal response to the explosive compounds was suppressed in 8 of the 20
tests by the interferents when compared to the signal response of the pure explosives;
however, signal response suppression with GC/IMS was practically eliminated with
signal response suppression occurring in 1 of the 20 tests. For explosive compound field
search operations that demand high throughput, these systems could work well together

iv
by deploying IMS for rapid throughput and GC/IMS for confirmation of IMS.

v
Title Page
IMPROVING ION MOBILITY SPECTROMETRY DETECTION METHODS FOR TRACE FORENSICS AND MILITARY FIELD APPLICATIONS
By
Gregory Wayne Cook
Thesis submitted to the Faculty of the Graduate School of the Uniformed Services University of the Health Sciences in partial fulfillment
of the requirements for the degree of
Doctor of Philosophy in Environmental Health Science
2006
Advisory Committee: David F. Cruess, PhD (Chair) Brian A. Eckenrode, PhD CDR Gary L. Hook, PhD LtCol Peter T. LaPuma, PhD Steven J. Durning, MD LCDR Gary A. Morris, PhD

vi
Dedication
! God. His blessings, love, and goodness abound in my life.
! Sonja. My wonderful wife and best friend. It would be easy to give up military
life so we could enjoy some resemblance of ‘normalcy’. However, your constant
support, understanding, and encouragement make me a better husband, father, and
officer while serving our country. Our family’s bond will always strengthen and
prevail because you put our needs before yours.
! Aubrey & Tia. The reasons for my long hours away from home, not willing to
settle for mediocrity, were never apparent to you, though someday you will
identify. I thank you for and will never forget your screams, laughter, and hugs at
the door.

vii
Acknowledgements
I could not have accomplished this work without the help of many people and
organizations. I gratefully acknowledge the support I received from:
! Dr. Brian Eckenrode and the FBI Counterterrorism & Forensic Science Research
Unit for providing the funding and instrumentation used in this study. I am
indebted to you for our valuable discussions on concepts, theory, principles and
applications. You have helped develop my personal skills to that will benefit
DoD, government and civilian organizations. I pray our two institutions will
continue favorable and constructive collaborations.
! My advisory committee members, Dr. David Cruess, CDR Gary Hook, LtCol
Pete LaPuma, Dr. Steve Durning and LCDR Gary Morris, for their mentorship,
knowledge, and insight. I look forward to working with each of you at
USUHS.Mrs. Kelly Mount and Mr. David McCollam from the FBI Laboratory,
Explosives Unit for providing the research study along with many useful
discussions explosive compounds and analysis.
! Dr. Sabatino Nacson, Dr. Alexander Grigoriev and Smiths Detection
(Mississauga, Ontario) for their invaluable information on IMS and GC/IMS
operation and spectral interpretation.
! Ms. Cara Olsen of the Uniformed Services University of the Health Sciences for
her assistance with statistical analysis.
viii
Table of Contents
Approval Sheet ................................................................................................................. i Copyright Statement........................................................................................................ ii Abstract .......................................................................................................................... iii Title Page......................................................................................................................... v Dedication ...................................................................................................................... vi Acknowledgements ....................................................................................................... vii Table of Contents ......................................................................................................... viii List of Figures ................................................................................................................. x List of Equations ............................................................................................................ xi List of Tables................................................................................................................. xii List of Symbols and Abbreviations ............................................................................... xii 1 Introduction............................................................................................................. 1 1.1 Background......................................................................................................... 1
1.1.1 Terrorist Events and Sabotages................................................................... 1 1.1.2 The Need for Field Explosives Detectors ................................................... 1 1.1.3 Ion Mobility Spectrometry.......................................................................... 2 1.1.4 Gas Chromatography/Ion Mobility Spectrometry ...................................... 3 1.1.5 Military Relevance...................................................................................... 5
1.2 Research Question and Specific Aims................................................................ 5 2 Literature Review.................................................................................................... 7 2.1 Detection Instrumentation................................................................................... 7 2.2 Ion Mobility Spectrometry................................................................................ 10
2.2.1 Theory ....................................................................................................... 10 2.2.2 History....................................................................................................... 14
2.2.2.1 Explosive Compound Detection ........................................................... 17 2.2.3 Advantages................................................................................................ 18 2.2.4 Limitations ................................................................................................ 19 2.2.5 Field Applications..................................................................................... 20
2.3 Gas Chromatography ........................................................................................ 21 2.3.1 Theory ....................................................................................................... 21 2.3.2 History....................................................................................................... 22
2.4 Gas Chromatography/Ion Mobility Spectrometry ............................................ 23 2.4.1 GC/IMS Theory ........................................................................................ 23 2.4.2 History....................................................................................................... 25
2.4.2.1 Explosive Compound Detection ........................................................... 26 2.4.3 Limitations ................................................................................................ 27
2.5 Specific Explosive Compounds for Analysis ................................................... 27 2.5.1 Hexamethylene triperoxide diamine (HMTD).......................................... 31 2.5.2 Pentaerythritol tetranitrate (PETN)........................................................... 32 2.5.3 1,3,5-trinitro-1,3,5-triazacyclohexane (RDX) .......................................... 32 2.5.4 Triacetone triperoxide (TATP) ................................................................. 33 2.5.5 2,4,6 Trinitrotoluene (2,4,6 TNT)............................................................. 33
3 Methodology......................................................................................................... 36
ix
3.1 GC-IONSCAN®................................................................................................ 36 3.2 Instrument Setup ............................................................................................... 39
3.2.1 Data Acquisition and Processing .............................................................. 41 3.3 Sample Preparation ........................................................................................... 41 3.4 Methods............................................................................................................. 42
3.4.1 Evaluation of Sample Swabs .................................................................... 43 3.4.2 Evaluation with Explosive Compounds.................................................... 43 3.4.3 Evaluation with Interferents...................................................................... 44 3.4.4 Evaluation with Interferents and Explosive Compound Mixtures............ 45
3.5 Statistical Methods for Data Analysis............................................................... 45 4 Experimental Results ............................................................................................ 46 4.1 Instrument Output ............................................................................................. 46 4.2 Sample Swab Analysis...................................................................................... 49 4.3 Sample Throughput Rate .................................................................................. 50 4.4 Explosive Compounds Analysis ....................................................................... 52
4.4.1 Minimum Detection Limits....................................................................... 52 4.4.2 Upper Saturation Limit ............................................................................. 54 4.4.3 Precision.................................................................................................... 57
4.5 Interferent Analysis........................................................................................... 59 4.5.1 Accuracy ................................................................................................... 59
4.6 Interferent and Explosive Compound Mixture Analysis .................................. 64 4.6.1 Accuracy (Interferent and Explosive Compound Mixtures)..................... 64
4.6.1.1 False Positives....................................................................................... 66 4.6.1.2 False Negatives ..................................................................................... 67
4.6.2 Instrument Response (Interferents and Explosive Compound Mixtures). 69 4.6.2.1 Hexamethylene triperoxide diamine (HMTD)...................................... 71 4.6.2.2 Pentaerythritol tetranitrate PETN ......................................................... 71 4.6.2.3 1,3,5-trinitro-1,3,5-triazacyclohexane RDX ......................................... 72 4.6.2.4 Triacetone triperoxide TATP................................................................ 72 4.6.2.5 2,4,6 Trinitrotoluene (2,4,6 TNT)......................................................... 73
4.6.3 Precision (Interferents and Explosive Compound Mixtures).................... 75 5 Discussion and Conclusions ................................................................................. 78 5.1 Applications ...................................................................................................... 80 5.2 Study Limitations.............................................................................................. 81 5.3 Additional Research.......................................................................................... 82 Appendix A ................................................................................................................... 83 Appendix B.................................................................................................................... 85 Bibliography................................................................................................................ 111 Curriculum Vitae......................................................................................................... 117

x
List of Figures
Figure 2-1: Schematic of an ion mobility spectrometer (IMS)......................................... 10 Figure 2-2: RDX plasmagram plotting ion current against drift time. ............................. 13 Figure 2-3: Operation principle for field asymmetric waveform ion mobility spectrometry
(FAIMS).................................................................................................................... 15 Figure 2-4: Graphic representation of the gas chromatography (GC) process. ................ 21 Figure 2-5: Graphic representation of gas chromatograph/ion mobility spectrometry
(GC/IMS). ................................................................................................................. 24 Figure 2-6: GC/IMS chromatogram of RDX.................................................................... 25 Figure 3-1: Smiths Detection GC-IONSCAN® instrument .............................................. 37 Figure 3-2: Schematic of the GC-IONSCAN® ................................................................. 38 Figure 4-1: Plasmagram from an IMS ‘instrument blank’................................................ 46 Figure 4-2: Plasmagram from a 10ng TNT sample on a Teflon swab by IMS analysis... 47 Figure 4-3: GC/IMS chromatogram from an ‘instrument blank’. .................................... 48 Figure 4-4: GC/IMS chromatogram of 10ng TNT. .......................................................... 49 Figure 4-5: Results from comparing cotton swabs and Teflon" swabs as IMS maximum
peak response. ........................................................................................................... 50 Figure 4-6: Minimum detection limits (ng) with GC-IONSCAN®. ................................. 53 Figure 4-7: Response curves for HMTD, PETN, RDX, TATP, and TNT with IMS and GC/IMS ................................................................................................................... 55
Figure 4-8: Precision of five replicate samples 0.1ng, 1ng, 5ng, 10ng, 50ng, 100ng....... 58 Figure 4-9: IMS analysis of Interferent #3. ...................................................................... 60 Figure 4-10: GC/IMS analysis of Interferent #3............................................................... 61 Figure 4-11: IMS analysis of Interferent #4. .................................................................... 62 Figure 4-12: GC/IMS analysis of Interferent #4............................................................... 63 Figure 4-13: Effect of chemical matrix interferents on HMTD, PETN, RDX, TATP, and
TNT analysis............................................................................................................. 70 Figure 4-14: IMS plasmagrams and GC/IMS chromatograms of pure TNT and TNT with
Interferent #1............................................................................................................. 74 Figure 4-15: Precision of five replicate interferent/explosive combination samples as
percent RSD.. ............................................................................................................ 77

xi
List of Equations
Equation 2-1...................................................................................................................... 12 Equation 2-2...................................................................................................................... 12 Equation 2-3...................................................................................................................... 12 Equation 2-4...................................................................................................................... 12 Equation 2-5...................................................................................................................... 13

xii
List of Tables
Table 2-1: Main compositional mixtures of common military and industrial high explosives.................................................................................................................. 28
Table 2-2: Major chemical compounds of common military and industrial high explosives.................................................................................................................. 29
Table 2-3: Explosive compounds evaluated in current study. .......................................... 30 Table 2-4: Structure and properties of explosive compounds evaluated in current study.35 Table 3-1: GC-IONSCAN® data acquisition parameters.................................................. 40 Table 4-1: Minimum Detection Limits for the GC-IONSCAN®...................................... 53 Table 4-2: Precision of five replicate sample ................................................................... 57 Table 4-3: Summary of chemical matrix interferents analyzed by IMS and GC/IMS. .... 59 Table 4-4: Summary of IMS vs. GC/IMS analysis of explosive compounds in the
presence of interferents ............................................................................................. 65 Table 4-5: Precision of five replicate chemical matrix interferent/explosive samples as
percent (%) RSD. ...................................................................................................... 76
List of Symbols and Abbreviations AC Alternating Current AL Aluminum APD Advanced Portable Detector ATSA Aviation and Transportation Security Act CAM Chemical Agent Monitor CFSRU Counterterrorism and Forensic Science Research Unit CWA Chemical Warfare Agent DC Direct Current E Electric Field ECD Electron Capture Detector EDS Explosives Detection Systems ETD Explosives Trace Detectors FAIMS Field Asymmetric Waveform Spectrometry FBI Federal Bureau of Investigation FID Flame Ionization Detector GC-ECD Gas Chromatography-Electron Capture Detection GC-MS Gas Chromatography-Mass Spectroscopy GC-PID Gas Chromatography-Photoionization Detection HMTD Hexamethylene Triperoxide Diamine ICAM Improved Chemical Agent Monitor IMS Ion Mobility Spectrometry GC Gas Chromatography GC/IMS Gas Chromatography/Ion Mobility Spectrometry K Ion Mobility Constant Ko Reduced Ion Mobility Constant LC-MS Liquid Chromatography-Mass Spectrometry

xiii
ld Drift Tube Length LOD Limit of Detection LTM Low Thermal Mass ms Milliseconds NC Nitrocellulose PETN Pentaerythritol Tetranitrate PID Photometric Ionization Detector ppbw Parts Per Billion Weight ppbv Parts Per Billion Weight ppmv Parts Per Million Volume psi Pound-force Per Square Inch RDX 1,3,5-Trinitro-1,3,5-Triazine RSD Relative Standard Deviation SAW Surface Acoustical Wave SN Sodium Nitrate TATP Triacetone Triperoxide TCD Thermal Conductivity Detector td Drift Time Rt Retention Time 2,4,6 TNT 2,4,6 Trinitrotoluene TSA Transportation Security Administration µg Microgram Vd Drift Velocity W Watts

1
1
1 Introduction
1.1 Background
An important challenge facing law enforcement and military personnel is the ability
to detect, correctly identify, and interdict the illegal possession of explosives intended to
initiate terror and harm citizens, both nationally and internationally. Ion mobility
spectrometry (IMS) is a proven technology for trace detection of explosives in the field.
A well-known limitation of IMS instruments results when analyzing samples that contain
mixtures or complex matrices.1-3 When analyzing mixtures or complex matrices with
IMS, some of the compounds are preferentially ionized. Preferential ionization of non-
targeted substances can produce interference with trace detection capabilities via analyte
masking, which result in false positive or false negative responses. The use of gas
chromatography (GC) coupled to IMS can overcome the difficulty of identifying analytes
in component matrices by employing a separation step prior to detection. The purpose of
this research is to compare IMS and GC/IMS by analyzing five explosive compounds in
the presence of four interferents to determine if GC/IMS is more reliable than IMS in the
detection of explosive compounds.
1.1.1 Terrorist Events and Sabotages
This research project was initiated in response to a need of the Federal Bureau of
Investigation (FBI) to improve commercial airline passenger and baggage screening for
the detection, identification, and interdiction of illegal explosives. Over the years,
1
1
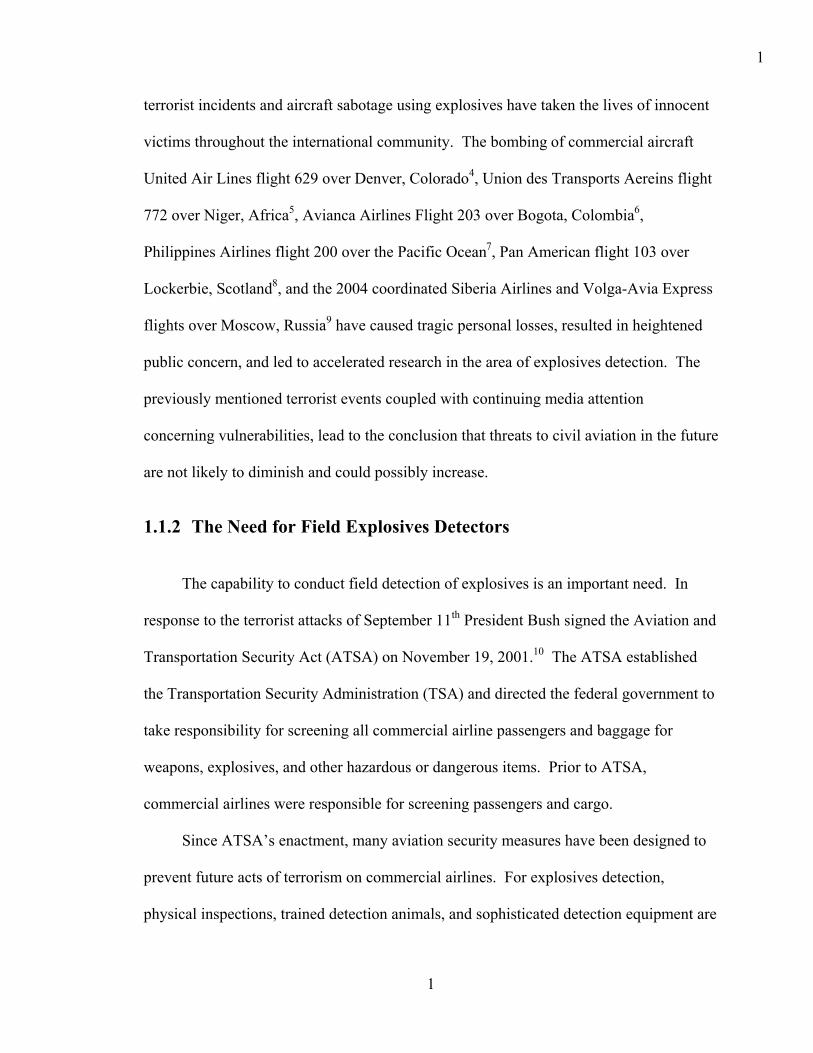
terrorist incidents and aircraft sabotage using explosives have taken the lives of innocent
victims throughout the international community. The bombing of commercial aircraft
United Air Lines flight 629 over Denver, Colorado4, Union des Transports Aereins flight
772 over Niger, Africa5, Avianca Airlines Flight 203 over Bogota, Colombia6,
Philippines Airlines flight 200 over the Pacific Ocean7, Pan American flight 103 over
Lockerbie, Scotland8, and the 2004 coordinated Siberia Airlines and Volga-Avia Express
flights over Moscow, Russia9 have caused tragic personal losses, resulted in heightened
public concern, and led to accelerated research in the area of explosives detection. The
previously mentioned terrorist events coupled with continuing media attention
concerning vulnerabilities, lead to the conclusion that threats to civil aviation in the future
are not likely to diminish and could possibly increase.
1.1.2 The Need for Field Explosives Detectors
The capability to conduct field detection of explosives is an important need. In
response to the terrorist attacks of September 11th President Bush signed the Aviation and
Transportation Security Act (ATSA) on November 19, 2001.10 The ATSA established
the Transportation Security Administration (TSA) and directed the federal government to
take responsibility for screening all commercial airline passengers and baggage for
weapons, explosives, and other hazardous or dangerous items. Prior to ATSA,
commercial airlines were responsible for screening passengers and cargo.
Since ATSA’s enactment, many aviation security measures have been designed to
prevent future acts of terrorism on commercial airlines. For explosives detection,
physical inspections, trained detection animals, and sophisticated detection equipment are

2
currently used. All of the previously mentioned security measures have advantages and
limitations with cost being a primary limitation for most methods. TSA currently uses
two types of equipment to screen commercial airline passengers and baggage: Explosives
Detection Systems (EDS) and Explosives Trace Detectors (ETD).11 EDSs are large units,
similar in size to a small automobile, that use x-ray technology to identify bulk quantities
of potentially explosive substances in checked baggage, cargo, and mail. Since this
research focuses on trace detection of explosives, EDS are not discussed further. ETDs
are much smaller, approximately the size of a large suitcase. The majority use IMS
technology to screen personal items or carry-on bags for the presence of explosive
compounds. Samples are collected through wipe or vacuum techniques using a cloth
sample pad (supplied by the manufacturer) and subsequently analyzed by an ETD for the
presence of trace explosive compounds. Since November 2001, TSA has deployed over
1,100 EDS and 7,263 ETD for use in the United States.10
1.1.3 Ion Mobility Spectrometry
IMS is one of the most widely used analytical techniques for detecting trace levels
of chemical compounds.12, 13 Conceptually, analytes are identified by the characterization
of their gas phase ion mobility in a weak electric field at ambient pressure. A sample is
introduced into the IMS through an inlet port; molecules are then ionized and carried into
a “drift tube”. The ionized molecules are accelerated under an electric field through the
drift tube and collide with a collector plate at the opposite end of the tube. The length of
time an ionized molecule travels in the drift tube (related to ion mobility) plotted against
the ion current detected by the collector plate produces a characteristic “signature” or
plasmagram that can be compared to a library of known reduced ion mobilities.14

3
Subsequently, a match of ion mobilities is the basis for identifying chemicals using IMS.
The ion mobility of a particular chemical is dependent on the shape, size, cross section,
and molecular mass of produced ions. IMS can provide a rapid means for detecting and
tentatively identifying chemicals, however IMS is not considered a confirmatory
method.15 While many IMS instruments are used in the field to locate contraband, as
with all detection techniques, IMS has limitations.
One limitation with IMS instruments is the poor ability to analyze samples
containing mixtures or complex matrices.1-3 IMS instruments are relatively easy to
overload due to the limited number of reactant ions available for ion/analyte reactions.
When all reactant ions are depleted, no further increase in product ion concentration is
possible.15-20 Two different ions of similar size and mass may appear to generate a single
peak rather than two distinct peaks in an IMS spectrum. When analyzing mixtures or
complex matrices with IMS, individual components can be undetected, false positive
results can be generated, or interferences can occur with the trace detection capability.
One method of addressing these limitations is to separate sample molecules utilizing gas
chromatography prior to entering the IMS.
1.1.4 Gas Chromatography/Ion Mobility Spectrometry
GC/IMS is classified as a dual analytical technology that merges two separate
techniques to produce a new configuration that takes advantage of their individual
capabilities. Coupling compatible GC and IMS analytical methods in tandem has shown
improved trace organic chemical detection through improved resolution of chemical
species, lower detection limits, improved quantitative response, and higher throughput of
complex samples.21, 22
4
In general, GC is an analytical method capable of separating a wide range of
complex chemical mixtures by a series of partitions between a moving gas phase and a
stationary liquid phase coating bonded to the inner surface of a small diameter fused
silica tube (column). As the moving gas phase carries chemical mixtures through the
column, the stationary phase interacts more effectively with some molecules than with
others. Consequently, a mixture is partitioned into individual components. While two
chemicals may have identical IMS ion mobilities, the chemicals almost certainly have
different GC retention times, which help resolve the two chemicals prior to entering an
IMS.12
While GC provides the advantage of separating analyte mixtures into individual
components for detection, the addition of GC increases analysis time, system complexity,
and power consumption, all of which work against the advantages of IMS.23
Consequently, if GC is to be added to an IMS detector for field applications, the addition
should strive to provide separation in less than one minute, to consume minimal power, to
be compact, and to be rugged.
The FBI Laboratory Division, Explosives Unit recently expressed interest in
GC/IMS technology as a valuable tool for reducing the number of false positive results
currently experienced from interferents in the field. A new GC/IMS instrument, that
permits pre-separation of complex samples prior to detection, has emerged that warrants
evaluation. Understanding the potential to reduce interferences, using this instrument,
will help ensure that new technologies are optimized for field operational units. The
evaluation will assess the instrument’s strengths and weaknesses in regards to sensitivity,

5
accuracy, and precision to five explosive compounds amidst four chemical matrix
interferents.
1.1.5 Military Relevance
IMS has been widely used in the military and other government organizations to
detect explosive compounds and chemical warfare agents (CWA) in wartime, treaty
verification, stockpile reductions, and to monitor building air quality and base
perimeters.24, 25 To date more than 50,000 handheld IMS detectors have been deployed
for use by Armed Forces from Britain, Canada, and the United States. 26 IMS
instrumentation currently used by military establishments include the: M-8A1 detector
system, Chemical Agent Monitor (CAM), Improved Chemical Agent Monitor (ICAM),
Advanced Portable Detector (APD 2000), M90 Chemical Agent System, and M-22
Automatic Chemical Agent Detector Alarm (ACADA) continuous air monitoring
systems. Potential use of IMS technology can be expanded to include monitoring for
emission control, environmental protection, air quality control for workplace safety, and
for the detection of narcotics and other controlled substances.
1.2 Research Question and Specific Aims
Research Question: Does the addition of GC to an IMS improve current detection
capabilities for trace organic explosive compounds in the presence of interferents?
Specific Aims:
1. Compare Cotton and Teflon® sample materials for the field portable IMS
(IONSCAN®) and GC/IMS (GC-IONSCAN®) systems.

6
2. Establish baseline performance of a field portable IMS (IONSCAN®) and
GC/IMS (GC-IONSCAN®) system in terms of detection limit, upper saturation
limit, sample throughput rate, and precision using five explosive compounds.
3. Assess the detection capabilities of the field portable IMS (IONSCAN®) and
GC/IMS (GC-IONSCAN®) systems amidst four chemical matrix interferents in
terms of accuracy.Assess the detection capabilities of five explosive compounds
amidst four chemical matrix interferents with the field portable IMS
(IONSCAN®) and GC/IMS (GC-IONSCAN®) systems in terms of accuracy,
signal response, and precision.

7
7
2 Literature Review
This research tested the capabilities of IMS and GC technologies to enhance field
sampling and analysis capabilities of explosive compounds. Field-portable IMS
technology development programs have existed since the early 1960’s.17 IMS use for
analytical field sampling and military preparedness has been well established and
successfully used for environmental pollutants, herbicides, pesticides, petroleum products
narcotics, CWAs, and explosives detection.1, 12, 15, 25, 27-33 GC is a separation technique
that was pioneered in the 1950s and has continued to be further developed for accurate,
rapid, field analysis methods. Current research in improving GC focuses on the
development of faster chromatography with lower power consumption while retaining
separation efficiency. The sections below provide insight into proven successes of IMS
and GC technologies, as well as promising potential future developments. The
motivation for combining GC and IMS analytical techniques in this research is also
discussed.
2.1 Detection Instrumentation
Many instruments are available for chemical detection. Today, trace detection
technologies are maturing on a variety of fronts and an expanding array of
instrumentation is available. Some systems are large, complicated, and expensive, while
others are smaller, easier to use, and less expensive; however, the latter tend to be less
effective. Competing trace detection technologies available for explosive compounds
include surface acoustical wave (SAW) sensors, Raman and infrared spectroscopy, and

8
8
hyphenated chromatographic techniques such as gas chromatography-electron capture
detection (GC-ECD), gas chromatography-photoionization detection (GC-PID), gas
chromatography-mass spectroscopy (GC-MS), and liquid chromatography-mass
spectrometry (LC-MS).
Surface acoustic wave (SAW) detection is based on piezoelectric crystals that
resonate at a specific, measurable frequency.12 Molecules bind to the surface of the
crystal and the resonant frequency shifts in proportion to the mass and other properties of
the material being deposited. While SAW devices are small and low-powered (battery
operation capability), major limitations of their use include cross-sensitivity and poor
selectivity.15
Raman and infrared spectroscopy techniques analyze molecules by irradiating
analytes with light and measuring the inelastically scattered (Raman), emitted, or
absorbed (infrared) wavelengths.12 Because molecules have different electronic,
vibrational and rotational energies, resulting data can provide reliable identification of
relatively pure unknown materials. Limitations with spectroscopic instrumentation
include: limited analysis of mixtures, sensitivity (dependant on weather conditions), and
potential decomposition or deflagration of unstable explosives when imparting energy
during analysis.34
High-quality, sensitive detectors such as GC-ECD, GC-PID, GC-MS and LC-MS
have been used for many years to detect and identify trace materials.35 However, with
the exception of GC-MS and LC-MS, the other techniques cannot easily identify
compounds. While the portability of such instruments is improving, combining GC or
LC with a sensitive and selective mass spectrometer detector for the field requires

9
considerable operating expertise and still presents significant design and performance
challenges for high-quality, high-speed, field-portable GC-MS or LC-MS.36, 35 Recently,
Smith, et al. explored new sampling techniques and column heating approaches to
expand and improve GC-MS for unknown chemical detection and identification in field
settings.37
This research focuses only on a field application of IMS and GC/IMS chemical
detection technologies. The advantages of IMS include high sensitivity, analytical
flexibility, near-real time monitoring, and comparatively low cost. The coupling of GC
to IMS has proven to be a good match in enabling IMS to overcome two vulnerabilities:
ease of overloading resulting in incomplete separations and susceptibility to interferences
that suppress ionization efficiency and sensitivity. By moderating the amount of analyte
introduced into the detector, the dynamic range can potentially be increased and
selectivity improved by separating complex matrixes into individual components.
Few specific studies of IMS performance with chemical interferents have been
reported.3, 19 Matz, et al. focused on air contaminant compounds with trinitrotoluene
(TNT) using a laboratory constructed instrument. Fytche, et. al. tested substances for
spectral interference with drugs of abuse; however, a close look at the substances
indicates these would not typically be found in an airport setting. To date, no detailed
studies of comparing IMS and GC/IMS detection methods of explosive compounds with
chemical interferents have been published.
10
2.2 Ion Mobility Spectrometry
2.2.1 Theory
IMS instrumentation was introduced as an analytical technique in 1970.38, 39
Originally known as plasma chromatography, IMS technology characterizes chemicals on
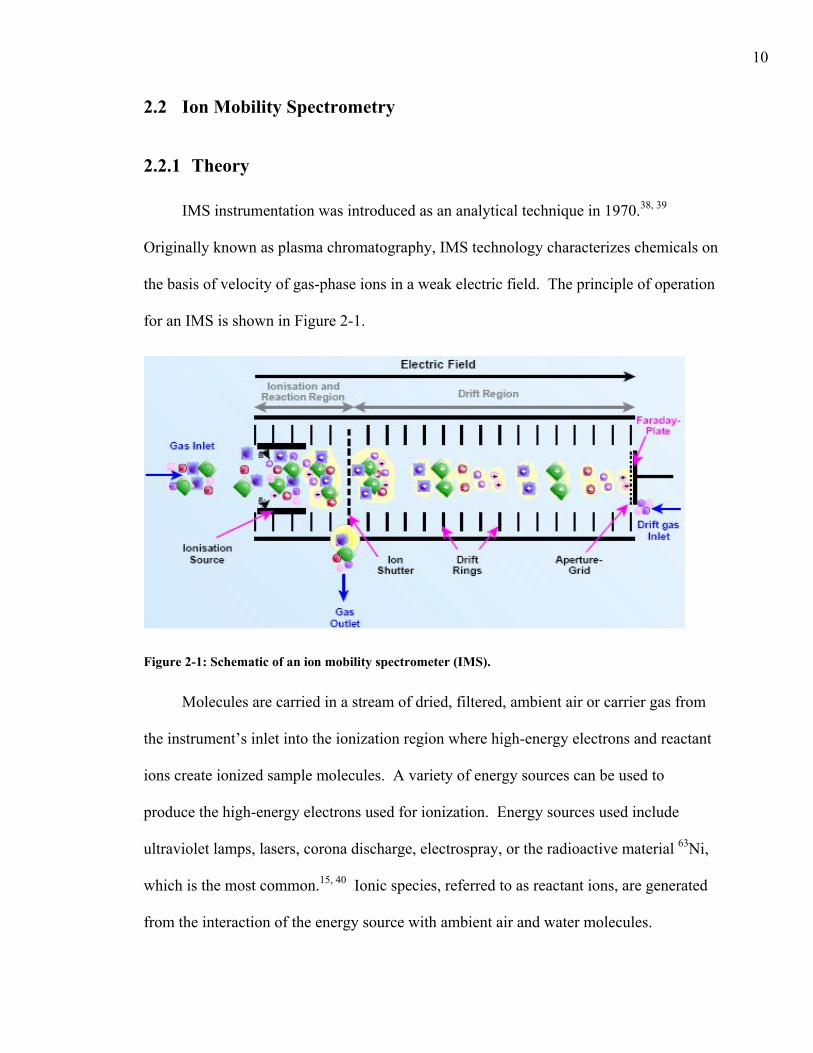
the basis of velocity of gas-phase ions in a weak electric field. The principle of operation
for an IMS is shown in Figure 2-1.
Figure 2-1: Schematic of an ion mobility spectrometer (IMS).
Molecules are carried in a stream of dried, filtered, ambient air or carrier gas from
the instrument’s inlet into the ionization region where high-energy electrons and reactant
ions create ionized sample molecules. A variety of energy sources can be used to
produce the high-energy electrons used for ionization. Energy sources used include
ultraviolet lamps, lasers, corona discharge, electrospray, or the radioactive material 63Ni,
which is the most common.15, 40 Ionic species, referred to as reactant ions, are generated
from the interaction of the energy source with ambient air and water molecules.
11
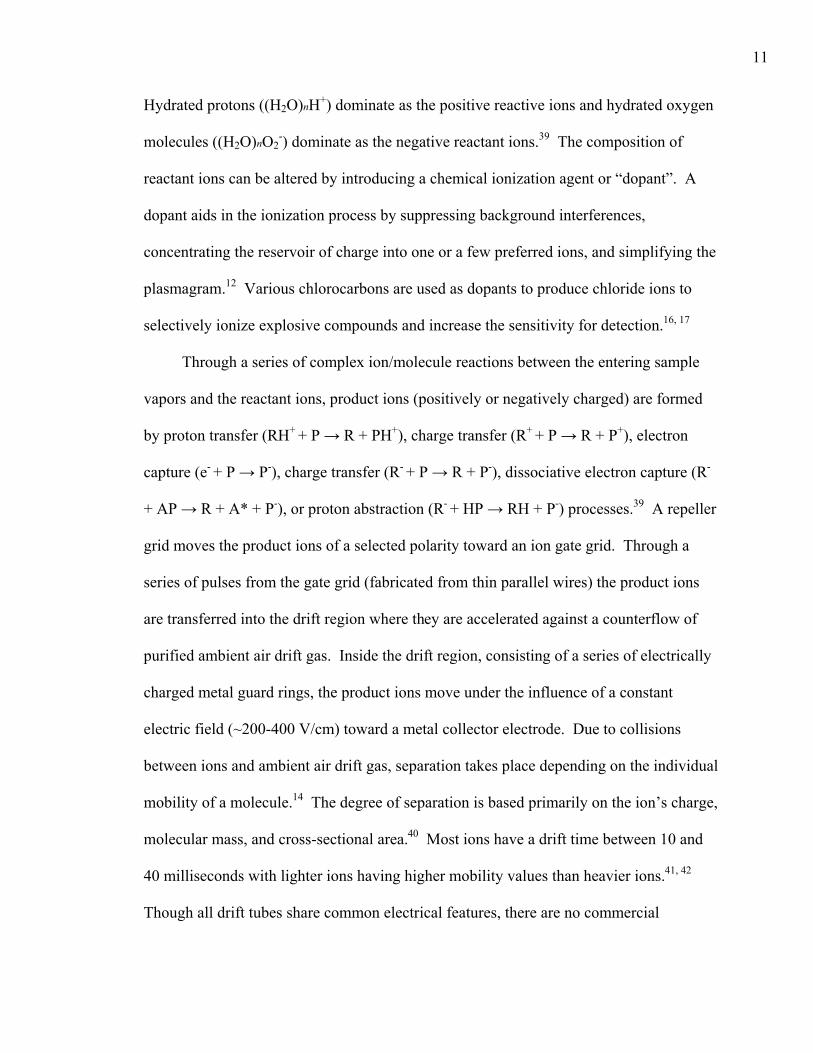
Hydrated protons ((H2O)nH+) dominate as the positive reactive ions and hydrated oxygen
molecules ((H2O)nO2-) dominate as the negative reactant ions.39 The composition of
reactant ions can be altered by introducing a chemical ionization agent or “dopant”. A
dopant aids in the ionization process by suppressing background interferences,
concentrating the reservoir of charge into one or a few preferred ions, and simplifying the
plasmagram.12 Various chlorocarbons are used as dopants to produce chloride ions to
selectively ionize explosive compounds and increase the sensitivity for detection.16, 17
Through a series of complex ion/molecule reactions between the entering sample
vapors and the reactant ions, product ions (positively or negatively charged) are formed
by proton transfer (RH+ + P ! R + PH+), charge transfer (R+ + P ! R + P+), electron
capture (e- + P ! P-), charge transfer (R- + P ! R + P-), dissociative electron capture (R-
+ AP ! R + A* + P-), or proton abstraction (R- + HP ! RH + P-) processes.39 A repeller
grid moves the product ions of a selected polarity toward an ion gate grid. Through a
series of pulses from the gate grid (fabricated from thin parallel wires) the product ions
are transferred into the drift region where they are accelerated against a counterflow of
purified ambient air drift gas. Inside the drift region, consisting of a series of electrically
charged metal guard rings, the product ions move under the influence of a constant
electric field (~200-400 V/cm) toward a metal collector electrode. Due to collisions
between ions and ambient air drift gas, separation takes place depending on the individual
mobility of a molecule.14 The degree of separation is based primarily on the ion’s charge,
molecular mass, and cross-sectional area.40 Most ions have a drift time between 10 and
40 milliseconds with lighter ions having higher mobility values than heavier ions.41, 42
Though all drift tubes share common electrical features, there are no commercial

12
standards on construction materials (commonly stainless steel) or dimensions (typically
4-20 centimeters in length).15
The collector electrode (Faraday plate) detects ions after they traverse the drift
region and generates an electromagnetic pulse. In low linear electric fields (<1000V/cm),
ions acquire a reproducible average velocity, or drift velocity, determined by the number
of collisions they make with other molecules in the drift region and the counterflow of
the drift gas (used to clear the drift region of molecules after sample analysis is
complete).14 The drift velocity, Vd, (cm/s), of the ions is equal to the drift tube length, ld,
(cm) divided by the drift time, td, (sec) as shown in Equation 2-1.43
d
dd t
l V # Equation (2-1)
The drift velocity is directly proportional to the strength of the electric field, E, (V/cm)
expressed by Equation 2-2, where the ion mobility, K, is constant, usually computed in
cm2/V-s.
KEVd # Equation (2-2)
The standard procedure to determine an ion’s mobility is to measure an ion’s drift time
(td), through a specified drift length (ld) under a known electric field (E). Ion mobility is
expressed by Equation 2-3.44
Etl
K d
d# Equation (2-3)
Since IMS instruments operate at ambient temperature and pressure, ion mobility is
normalized to correct for variations in gas density and is referred to as the reduced
mobility value (Ko).14

13
Ko is calculated using to Equation 2-4.44
$%&
'()$%&
'()#
760P
T273KK o Equation (2-4)
In some applications, a reference ion is used to calculate Ko as shown in Equation 2-5.43
$$%
&''(
) *#
tsampleK reference treferenceK sample
d
odo
Equation (2-5)
It is important to point out that the Ko of a particular chemical is a characteristic of that
chemical and not a unique identifier.14
Using a computer, the output of an IMS instrument can be displayed as an XY
graph, also known as a plasmagram to provide information contained in the ion mobility
measurement of a chemical. The plasmagram visually displays drift time, peak shape,
and fragmentation of a chemical from which the mobility coefficient can be determined.
A plasmagram from RDX at 71° F and 773.16 Torr is shown in Figure 2-2. The
cumulative signal intensity, digital units (du), is plotted against drift time (milliseconds
(ms)). The resulting drift time for RDX is 13.269 ms with a Ko of 1.4502 using
nitrobenzonitrile as the reference ion.
Figure 2-2: RDX plasmagram plotting ion current against drift time. (negative ion mode)
Cum
ulat
ive
Sign
al (d
u)
Drift Time (ms)
RD
X
(H2O
) nO2-
Rea
ctan
t Ion
s

14
In an IMS, reactant ions are continuously produced and extracted by the electric
field into the drift region. Reactant ions pass through the drift region and exhibit a
distinct spectrum. In the absence of other chemicals, a reactant ion peak will form the
largest peak in an IMS spectrum because the reactant ions are the only analyte, and thus
charge carriers present in the system. When molecules enter the detector the reactant ion
peak decreases in intensity as charge transfer reactions occur. The reactant ion peak re-
intensifies as molecules pass through the system and charge transfer reactions complete.
The product ion peak (RDX in Figure 2-2) represents the output of ionized
molecules, in a positive or negative ion mode depending on the polarity of the applied
electric field. A single or series of product ion peaks form a characteristic “signature” of
a compound. The height of the product ion peak(s) corresponds to the intensity of the
electromagnetic signal generated when ions strike the collector electrode. For an IMS to
identify a chemical, a product ion peak(s) must conform to parameters found in detection
algorithms and the onboard library of known reduced mobilities.14 Actual outputs from
an IMS are more complex than displayed in Figure 2-2 because field samples do not
normally consist of a single pure substance. As a consequence, IMS lacks the ability to
definitively identify individual components in sample mixtures or complex matrices.
2.2.2 History
During the 1970’s, researchers gathered basic information about the technology.38,
39 Reactant ions were identified, ion mobility constants for many organic compounds
(alcohols, nitrosamines, nitroaromatics) were measured, temperature effects were
evaluated and ion mass-to-mobility correlations were made.16 Early drift tube designs
were not fully enclosed and allowed molecules to diffuse into the drift cell creating

15
complex ion flow patterns, ion source overload, and erroneous concentration/mobility
coefficient correlations.17 These circumstances negatively affected the acceptance of
IMS and by 1980 the number of published scientific journal articles had declined to zero.
In the early 1980s, Baim designed an enclosed IMS drift cell with unidirectional gas flow
that could also be tuned to perform selective drift time mobility monitoring.43 Baim’s
design eliminated the complicating early analytical designs, resulting in the ability to
obtain more reproducible and sensitive measurements. Subsequently, the introduction of
dopants (ammonia45, acetone30, and chloride ions46) increased the specificity of IMS
detection capabilities. Additional work, pioneered in the 1980s, included the introduction
of new ionization sources: laser, photoionization, and electrospray.30
In the early 1990s, researchers from Russia developed what has become known as
field asymmetric waveform ion mobility spectrometry (FAIMS).47, 48 Different terms
have been used to describe this principle: differential mobility spectrometry (DMS), field
ion spectrometry (FIS), and radio-frequency ion mobility spectrometry (RFIMS). Figure
2-3 illustrates the operation of FAIMS.
Figure 2-3: Operation principle for field asymmetric waveform ion mobility spectrometry (FAIMS)

16
In traditional IMS instruments, the Ko for an ion is constant at low electric fields
(100-400 V/cm).14 If two ions have the same mobility in the low electric field they
cannot be separated. In the late 1980s, researchers discovered that at electric fields above
1000 V/cm, ion drift velocity is no longer proportional to the electric field, but nonlinear
and dependent on the strength of the electric field.47 In FAIMS, like traditional IMS,
ionized molecules are created using reactant ions and high-energy electrons. Ionized
molecules are separated based on their change of mobility. The difference between
FAIMS and traditional IMS exists within the strength of the electric field. Ionized
molecules enter the FAIMS drift region (see Figure 2-3) that contains two parallel plate
electrodes rather than a series of guard rings. One electrode is maintained at ground
potential, while an oscillating high voltage AC (~1,000-10,000 V/cm) is applied to the
other.48 Sample components are separated as voltage is scanned and the differences in
ion mobilities exploited. As ions traverse the drift tube, the asymmetric electric field
causes ion trajectories to deflect toward one of the plates. A compensating low voltage
direct current (DC) field is applied to the plate in opposition to the drift caused by the
asymmetric alternating current (AC) field, preventing ions from reaching the plate and
being deflected into the drift tube wall. Thus, selected ions can pass through to the
collector electrode while all other ions are deflected into one of the plate electrodes.
Unlike traditional IMS, FAIMS does not have an ion gate and ions are continuously
introduced into the drift region. While FAIMS has shown some success, the principle
limitation has been poor separation due to ion space charge repulsion effects and the
extremely fast movement of ions (<10 ms) through the drift region.48, 49
17
2.2.2.1 Explosive Compound Detection
The application of IMS to detect explosives is second only to its extensive use as
chemical warfare agent detectors.17 The strong electron affinity exhibited by explosive
compounds translates to a high efficiency for creating negative ions and allows part-per
billion (ppbw) or sub-nanogram detection limits with IMS.50 Karasak was the first to
report that IMS could be used to detect explosives; reporting detection of TNT at ppbw
levels in 1974.51 Spangler subsequently published manuscripts on the detection of TNT
and 1,3,5-Trinitro-1,3,5-Triazine (RDX) with IMS.1, 52 Fetterolf later showed detection
for common explosive compounds at levels as low as 200 picograms.44 The very low
vapor pressure of TNT, RDX, and Pentaerythritol Tetranitrate (PETN) makes it difficult
to detect explosive compounds by vapor methods alone.53 Explosive analytes must be
collected onto a sample media and thermally desorbed to facilitate transportation to the
ionization region. Carr was the first to successfully analyze explosive compounds with
low volatility using thermal desorption.41 The vapor generator/collector system described
herein is based on thermal desorption. There are many additional citations of IMS use for
detecting various explosive compounds over the last three decades; however the work
appears in conference/ symposium proceedings and government reports not readily
available to the public.
Commercial instruments for explosive compound detection were not fielded until
after the Pan Am flight 103 explosion over Lockerbie, Scotland in 1988.50 Subsequent
experiments showed successful implementation of IMS in this field application.44 Ion
Track developed the first field portable explosive vapor detector based on IMS
technology, the VaporTracer®, in 1997.50 In 1999, Barringer introduced a handheld IMS,
18
the SABRE®, that could operate in an explosive particle or vapor detecting mode.50 More
recently, due to fears of terrorism in commercial aviation, IMS has been more widely
implemented as a rapid, non-invasive screening tool for passengers and carry-on items.17
Currently, the IONSCAN® 54 and ITEMISER® are the most commonly used field
portable IMS instruments for explosives detection, 55 with more than 15,000 analyzers in
the field colectively.17
2.2.3 Advantages
When viewed in the context of other analytical instruments, IMS offers several
appealing features that have increased the use of IMS in detecting chemicals in field
settings. The main advantages of IMS include:
1) excellent detection method for single component samples,
2) fast analysis time (provides output data in seconds),
3) sensitive technique (picogram detection limits),
4) does not require sample pretreatment,
5) operates at atmospheric pressure (mass spectrometers, which operate under a
vacuum, make field use difficult),
6) selectively detects chemicals based on gas phase ion mobility (other simple
ionization instruments, flame ionization detector (FID) photometric ionization
detector (PID), electron capture detector (ECD) and thermal conductivity detector
(TCD), provide only a record of gas phase effluents that is not compound
specific),
7) loss of volatile samples does not occur (as with electrospray techniques),

19
8) polarity of the electric field can be altered so both positive and negative ions can
be detected,
9) solid samples as well as analytes in solution (with some preparation) can be
analyzed,
10) can be miniaturized and operated by battery power,
11) when compared to other technologies that are capable of identifying chemicals,
IMS is relatively inexpensive to purchase and operate.15, 26, 42, 56-59
2.2.4 Limitations
While IMS technology has demonstrated many positive characteristics, some limitations
are exhibited:
1) Chemical mixtures are not analyzed without problems due to complex
interactions that produce incomplete separation and obscure ion peaks, leading to
uncertain detection and identification. IMS instruments are prone to inaccurate
detection and false positive/false negative response when chemical interferents
are present in samples.
2) IMS signal response is strongly dependent on analyte concentration, vapor
pressure, and proton/electron affinity.
3) IMS signal response is influenced by atmospheric temperature and pressure
because IMS does not operate in a vacuum.
4) IMS instruments are relatively easy to saturate. Linear response is often limited
to two orders of magnitude of sample mass. IMS saturation is primarily due to
the limited number of reactant ions available for ion/analyte reactions. When all
reactant ions are depleted, no further increase in product ion concentration is
20
possible. Thus sample size must be carefully controlled at the instrument’s
entrance to prevent saturation or non-linear response due to the depletion of
reactant ions.15-20
If these limitations can be mitigated, IMS can be a better detector. One way to
overcome IMS limitations is by coupling GC to the front of the IMS detector.43 The
addition of GC can improve selectivity and specificity by controlling sample volume and
separating individual chemicals entering the detector, preventing detector saturation, and
increasing IMS dynamic range.
2.2.5 Field Applications
When sampling in the field it is impractical to assume that the conditions will be the
same as in the laboratory. Collected samples can potentially contain non-targeted
substances that create complex matrices (background composition of little analytical
interest) that interfere with analyses. Interference can occur primarily in two ways: (1)
ionization of the background composition at the expense of targeted ions inside the IMS
reaction region or (2) interferent compounds having similar drift times. While complete
suppression of targeted analyte signals can result in failure to detect (i.e. false negative)
similar drift times can result in an innocuous substance being identified as a targeted
substance (i.e. false positive). Matz, et al.19 investigated 17 different air contaminant
compounds as chemical interferents in IMS analysis of TNT using a laboratory
constructed instrument. Ten of the suspected interferents did not show IMS response and
one (4,6 dinitro-o-cresol) of the other seven had a similar ion mobility, which resulted in
ion peak overlap. Even with this interferent, TNT could be differentiated. Using IMS,

21
Fytche, et al. tested 139 substances of which 6 caused a false positive for heroin;
however the substances evaluated would not typically be found in an airport setting.
2.3 Gas Chromatography
2.3.1 Theory
GC has been a widely used separation technique for detecting and identifying many
kinds of chemicals over the last 50 years.60 Additionally, GC has become a mainstay in
research, industry, and government for analyzing air, water, and soil for numerous
chemicals. GC is a method capable of separating a wide range of complex chemical
mixtures by a series of partitions between a moving gas phase and a stationary phase held
in a small diameter tubular column. A volume of sample is carried down the column by a
flow of carrier gas and separated into individual components when interactions occur
with the stationary phase coating. The stationary phase coating interacts with some
molecules more than others; consequently, partitioning a sample mixture into individual
components.60 The speed at which analysis takes place is dependent on several factors
including the type, length, and temperature of the column and the velocity of the carrier
gas. In general, total analysis times are in minutes to hours. Figure 2-3 illustrates the GC
separation process.
DCB
A
Sample Mixture IN • A – Fastest• B – Fast• C – Slow• D - Slowest
ColumnABCD To
Detector(ECD, IMS, MS, etc.) DC
BA
Sample Mixture IN • A – Fastest• B – Fast• C – Slow• D - Slowest
ColumnABCD To
Detector(ECD, IMS, MS, etc.)
Figure 2-4: Graphic representation of the gas chromatography (GC) process.

22
2.3.2 History
The invention of GC is generally attributed to Martin and James, in 1952, who
demonstrated the ability to separate volatile fatty acids using two glass columns with a
silicone-based stationary phase and nitrogen carrier gas.61 The technique became popular
in the petroleum industry and biochemistry fields throughout the 1950s, as researchers
used 1-5 meter columns packed with liquid phase coated particles to analyze petroleum
products and amino acids.60 In 1957, Golay produced the first inner wall-coated capillary
column, a 1 m, 0.8 mm inner diameter glass tube with polyethylene glycol stationary
phase.62 The inner wall-coated capillary column provided much better analyte resolution
due to the removal of the airflow resistance generated in packed columns. In the early
development of capillary GC columns, researchers experimented with a variety of
materials (nylon, copper, nickel, and stainless steel) because difficulties were experienced
with analyte absorption into some column materials.60 In 1961, Desty fabricated a coiled
capillary column made from glass tubing that overcame the difficulties experienced with
analyte absorption into metal columns.63 Unfortunately, patent law restricted advances of
glass capillary columns until the late 1970’s so researchers focused efforts to improving
packed column designs and temperature programming.64 Glass capillary columns were
predominantly used until superseded by Dandeneau and Zerenner design of a fused silica
capillary column design in 1979.65 Fused silica columns proved more durable than glass
columns. Chemically inert fused silica columns also overcame recurring issues of polar
analyte absorption with glass columns.60 Today, manufacturers offer a wide range of
highly developed fused silica column lengths and diameters with stationary phases and
film thickness for achieving desired separations.

23
Originally, separations of analytes were achieved by holding column temperature
constant. In 1952, published work by Griffiths demonstrated the peak spread for late
eluting compounds could be minimized by increasing column temperature during the
run.60 In 1957, Dal Nogare further explored temperature programming by applying
current through a stainless steel column wrapped with insulation.62 This work
demonstrated that by applying a linear increase of temperature during a GC run, mixtures
could be more rapidly separated.
Most GC instruments still use an air circulation oven to heat a column. GC’s with
air circulation ovens are not easily portable or efficient with power. These systems also
limit sample throughput due to a narrow range of temperature heating rates and lengthy
cooling rates.66 Modern air circulation GC ovens can achieve temperature heating rates
of 75"C/min, but above 175"C the ramp rate is limited to approximately 30"C/min.66
2.4 Gas Chromatography/Ion Mobility Spectrometry
2.4.1 GC/IMS Theory
The principle of operation of GC/IMS is shown in Figure 2-5. In addition to the
individual GC and IMS components shown, GC/IMS systems require peripheral
equipment such as a carrier gas supply and a computer data system.

24
Sample Vapor IN
IMS
Sample Vapor OUT
Column
Drift Gas IN
Exhaust
GC-IMS Technology
Sample Vapor IN
IMSIMS
Sample Vapor OUT
Column
Drift Gas IN
Exhaust
GC-IMS Technology
Figure 2-5: Graphic representation of gas chromatograph/ion mobility spectrometry (GC/IMS).
In a GC/IMS instrument, column effluent is introduced into the IMS ionization
region over a period of minutes. Multiple IMS scans (on the order of 40-50 per second)
of the column effluent are performed. The pre-separation provided by the GC simplifies
the chemistry within the ionization region. By minimizing the number of constituents
present at any one time, product ions can be formed without competitive ionization
interferences. Figure 2-6 shows a characteristic three-axis graph (GC/IMS
chromatogram) from a GC/IMS. In the GC/IMS chromatogram of RDX, the white line
on the z-axis denotes a GC retention time (123 s), the x-axis denotes an IMS drift time
(13.269 ms) and the y-axis IMS denotes signal intensity (1100 du). IMS scans have been
compiled from front to back.

25
Figure 2-6: GC/IMS chromatogram of RDX. (td 13.269 ms, Rt 123 s.)
2.4.2 History
IMS was first coupled with a GC system, by Karasek and Keller in 1972 using a
conventional packed column.58 A number of researchers followed Karasek and Keller’s
work, demonstrating successful separation of analytes from complex liquid and vapor
mixtures.67-69 Though advances were realized throughout the 70’s, two technical
problems limited widespread use. First, the sensitivity of IMS instruments was
compromised when GC was added due to residual solvents, unresolved analytes, column
bleed, and carrier gas contamination from glass and metal packed columns. The factors
altered ionization region chemistry and affected the response and reliability of the IMS
detector. Secondly, the large volumes of IMS ionization cells (~7mL) caused loss of
reproducibility, sensitivity, and chromatographic resolution due to diffusion and
adsorption effects.43
GC/IMS shortcomings prompted the development of a new generation of IMS
systems. Baim introduced the first new IMS design in 1982.43 Baim’s design introduced
unidirectional gas flow with an enclosed and reduced drift tube volume. The design
IMS
Sign
al In
tens
ity (
du)
IMS Drift Time (ms)
GC
Ret
entio
n Ti
me
(s)
RD
X R
eact
ant I
on
(H2O
) nO2-
Bac
kgro
und

26
decreased residence time of ions in the drift region and improved resolution,
reproducibility, and sensitivity. Also in the 1980s, research with packed columns became
superseded by capillary columns.43, 59 In the 1990s, detection capabilities of trace organic
chemicals improved with better resolution of chemical matrices with GC/IMS. The
improved resolution provided by GC has resulted in lower detection limits, improved
quantitative response and higher sample throughput for IMS.21, 40, 70 In 1996, NASA
selected GC/IMS technology, in the form of an instrument called a Volatile Organic
Analyzer, to monitor for volatile organic compounds onboard the International Space
Station, where it remains to date.26
2.4.2.1 Explosive Compound Detection
While many commercial trace explosives detection systems are in use today, very
few use GC/IMS. One of the first commercial GC/IMS instruments developed for
detecting explosive compounds was the Orion® in 1997.50 Designed by Intelligent
Detection Systems, the large unit can be configured to screen personnel or vehicles.
Smiths Detection (formerly Barringer) began selling the GC-IONSCAN® in 1999 though
the instrument was not designed for high speed separation.50, 71 Varian Products
introduced the CP-4900, a micro-machined narrow-bore GC column with FAIMS, in
2003.72 However, the CP-4900 does not feature a temperature programmable oven and is
targeted toward analyzing hydrocarbons, chlorofluorocarbons, and halogenated
anesthetics.17 In 2005, Thermo Electron Corporation presented the EGIS Defender®.73
Advertised as a high-speed explosives detector, the instrument contains a 1-meter GC
with FAIMS.
27
2.4.3 Limitations
GC separation has offered the advantage of separating analyte mixtures into
individual components for improved detection. However, the addition of GC increases
system complexity, power consumption, and analysis time, slowing the measurement
from seconds to tens of minutes or more, all of which work against the advantages of
IMS.23
Within the last few years, new GC/IMS designs that offer improved speed and
portability have been developed. One way to overcome lengthy analysis times is to use
short (17 cm - 3 m) columns.74 22 While short GC methods can pre-separate analytes, the
specificity that can be obtained is limited because separation of analytes is not as efficient
as with longer columns.75 A second technique has been to use high speed or
multicapillary GC with FAIMS though the cost is high and commercial availability is
poor.76 While in some cases, improved pre-separation can be achieved by using GC,
some compounds may co-elute and interfere with the detection of compounds.77
2.5 Specific Explosive Compounds for Analysis
The detection of explosives is a very complicated task because they are typically
comprised of many chemicals, each with different properties. Secondly, some explosive
compounds typically have low vapor pressures. A technique must be used to collect low
volatile analytes or only a minimal amount of a sample can be measured in detection.53
A third factor that must be considered is that some chemicals that are major components
in explosives (i.e. nitrogen) have legitimate commercial uses. Thus the detection of a
particular chemical does not necessarily indicate the presence of an explosive material.
28
Furton and Myers 78 compiled two representative, but not exhaustive tables listing
the properties of explosives. Table 2-1 provides the typical mixtures of common military
and industrial high explosives.
Commonly Used Explosives Main Compositions
C-2 RDX+TNT+DNT+NC+MNT C-3 RDX+TNT+DNT+Tetryl+NC C-4 RDX+Polyisobutylene+Fuel oil Cyclotol RDX+TNT DBX TNT+RDX+AN+AL HTA-3 HMX+TNT+AL Pentolite PETN+TNT PTX-1 RDX+TNT+Tetryl PTX-2 RDX+TNT+PETN Tetryol TNT+Tetryl Dynamite NG+NC+SN Red Diamond NG+EGDN+SN+AN+Chalk+NaCl
Table 2-1: Main compositional mixtures of common military and industrial high explosives 78 Table 2-2 provides the major chemical compound classes found in common military and industrial high explosives.

29
Compound
Class Example Symbol Commonly found/used in the following
Aliphatic Nitro Nitromethane n/a Liquid fuel additive
Hydrazine n/a Rocket fuel and liquid component of two-part explosive
Aromatic nitro (C-NO2) Nitrobenzene NB Manufacturing process to produce
aniline Nitrotoluene NT Synthesis of explosives Dinitrobenzene DNB Synthetic substance used in explosives Dinitrotoluene DNT Air bags of automobiles amino-dinitrotoluene A-DNT Synthetic substance used in explosives Trinitrobenzene TNB Synthetic substance used in explosives
2,4,6-trinitrotoluene TNT Composition B with equal part RDX, Pentolite with equal part PETN
2,4-dinitrotoluene DNT gelatinizing and waterproofing agent in explosives
picric acid n/a Priming charge Nitrate ester (C-O-NO2) Methyl nitrate n/a Synthetic substance used in explosives
Nitroglycerin NG Certain dynamites, pharmaceutical Ethyl glycol dinitrate EGDN Some dynamites
Diethylene glycol dinitrate
DEGDN, MTN Synthetic substance used in explosives
Pentaerythitrol tetranitrate PETN Detonating cord, Detasheet (Flex-X
military name), Semtex with RDX
Nitrocellulose NC ‘Guncotton’ main component of single-based smokeless powder
Nitrocellulose and NG NC, NG Double-based smokeless powder
Nitrocellulose, NG and nitroguanidine NC, NG Triple-based smokeless powder
Nitramines (C-N-NO2) Methylamine nitrate n/a Propellant
Tetranitro-N-methyaniline Tetryl Booster explosive
Trinitro-triazacylohexane (cyclonite)
RDX C-4, tetrytol-military dynamite w/TNT
Tetranitro-tetracylooctane (octogen)
HMX Her Majesty’s Explosive
Acid salts (NH4+)
Ammonium nitrate AN ANFO with fuel oil, nitro-carbo-nitrates (NCN) w/oil
Ammonium perchlorate n/a Rocket fuel Potassium nitrate PN Black powder with charcoal and sulfur Primary Explosives Lead azide n/a Detonating fuses
Lead styphnate n/a Blasting caps; component in primers Mercury fulminate n/a Initiating explosive Tetramino nitrate n/a Initiating explosive
Hexamethylene triperoxide diamine HMTD Amateurs in detonators
Triacetone triperoxide TATP Amateurs in detonators Table 2-2: Major chemical components of common military and industrial high explosives 78
30
Table 2-2 also illustrates the many chemicals that constitute high explosive
materials. Complex mixtures of the chemicals as well as impurities found with explosive
materials can have major implications on an instrument’s ability to correctly identify
trace concentrations of contraband. Even when complex mixtures can be separated,
preferentially ionized compounds can further complicate detection. In today’s world,
many explosive compounds can be obtained from rogue military sources or individuals
can discover recipes to synthesize explosives by searching the Internet.79, 80
After consulting with representatives from the FBI Explosives Unit of the
Laboratory Division, five explosive compounds, listed in Table 2-3, were selected for
evaluation.
Explosive Compound Symbol Hexamethylene Triperoxide Diamine HMTD Pentaerythritol Tetranitrate PETN 1,3,5-Trinitro-1,3,5-Triazine RDX Triacetone Triperoxide TATP 2,4,6 Trinitrotoluene 2,4,6 TNT
Table 2-3: Explosive compounds evaluated in current study.
Selection of the explosives used in this research was based on several factors:
1) representative of the organic explosives compound classes (nitramines, nitro-
esters, nitro aromatics, and peroxides),
2) frequency of use in global occurrences,
3) ease of availability,
4) military relevance,
5) highly energetic,
6) ease of synthesis (i.e. peroxides).
31
Particularly, in the last factor, information and raw materials to make peroxide explosives
can be easily be obtained by a non-chemist.80-82 All five compounds are defined by the
Bureau of Alcohol, Tobacco and Firearms (ATF) as explosive materials and are subject
to United States (U.S.) regulations.82
Early manuscripts document IMS detection of nitrosamines with limits of 100ng/µl
(ethanol) and nitroaromatics with limits of .001mg/m3 in air.51, 52 Most explosives
possess relatively high electronegativities and will be best observed in negative ion mode;
however, TATP is an exception to this rule. TATP is best observed in positive ion mode
by most IMS instruments because the explosive contains no nitro groups.83
2.5.1 Hexamethylene triperoxide diamine (HMTD)
HMTD is a non-commercial, primary, organic peroxide high explosive that has
been previously used in detonators by terrorists groups and amateurs.84 A significant
concern is that the recipe for HMTD can easily be found on Internet web pages with
detailed descriptions on how to make the explosive compound from hexamine, hydrogen
peroxide, and citric acid.85 The Algerian terrorist, arrested upon entry to the US from
Canada prior to the millennium celebration, was found to possess HMTD.35 Presently,
there is no reported application of HMTD as a commercial or military explosive.86
Unlike most conventional explosive compounds, HMTD contains no nitro groups
or metallic elements, making detection by standard methods quite difficult. HMTD has
no significant UV, visible or fluorescence spectra with detection limited to IR/Raman
spectroscopy and LC/MS.86 Currently, no sensitive method for quantitative trace analysis
of HMTD is available.
32
2.5.2 Pentaerythritol tetranitrate (PETN)
PETN is a white crystalline explosive compound used widely as a priming
composition in detonators, a base charge in blasting caps of small caliber ammunition,
and the explosive core in detonating cords.87 The recipe for PETN can easily be found on
Internet web pages with comprehensive methods on how to synthesize the compound
from, nitric acid, urea, sodium carbonate, and acetone.80 PETN has been routinely
detected at nanogram levels using IMS.
2.5.3 1,3,5-trinitro-1,3,5-triazacyclohexane (RDX)
RDX, also known as Royal Demolition Explosive or hexogen, is a nitramine
compound, second in strength (8.7 km/s) to nitroglycerin among common explosive
compounds.88 RDX is often used in mixtures with other explosives, oils, waxes and
plasticizers to make C-4 or with PETN to make the most common explosive, Semtex.87
RDX has a high degree of stability in storage and is considered the most powerful
military high explosive. RDX is used as a base charge in detonators and in blasting caps.
The International Security and Arms Control reports that RDX is the most serious threat
in aircraft sabotage because it can be easily molded for concealment, remains stable, and
in small amounts can destroy a large airplane in flight.89 The Algerian terrorist, arrested
upon entry to the U.S. from Canada prior to the millennium celebration, was found to
possess RDX in addition to HMTD.35 IMS is an established method of choice for
detecting RDX.90
33
2.5.4 Triacetone triperoxide (TATP)
TATP is a sensitive and relatively easily produced home-made high explosive that
has been used in acts of terror and sabotage in the United States, Israel, and the United
Kingdom.35 Specific examples of TATP use include the explosion onboard Philippine
Airlines flight 200 in 1994 91 and the 2003 “shoe-bomber” incident where Richard Reid’s
hiking boots were found to be packed with TATP combined with PETN.7, 91, 92 In 2003, a
sixteen-year-old was arrested in Washington state for making TATP in his house.81
TATP can be prepared using the readily available commercial products, acetone,
hydrogen peroxide, and a strong acid (hydrochloric or sulfuric).93
Unlike most explosive compounds, TATP does not contain nitro groups or metallic
elements, making detection of concealed product difficult.83 Detection of TATP by IMS
was first reported by Buttigieg, et al. in 2003.83 A key finding in Buttigieg’s study
revealed that IMS detects TATP in positive mode, differing from most explosive
compounds that are identified in negative ion mode, because the explosive contains no
nitro groups. TATP is not used in military or commercial applications because of its low
chemical stability and high sensitivity to mechanical shock.94
2.5.5 2,4,6 Trinitrotoluene (2,4,6 TNT)
TNT was first used on a wide scale during World War I and is still used today by
the military and in civilian mining and quarrying activities.95 TNT is classified as a
secondary explosive because it is less susceptible to initiation and requires a primary or
initiating explosive to ignite. TNT can be used as a booster or as a bursting charge for
high-explosive shells and bombs. TNT may be mixed with other explosives such as

34
RDX and is a constituent of many other explosives, such as amatol, pentolite, tetrytol,
torpex, tritonal, picratol, and ednatol. TNT has been used under such names as Triton,
Trotyl, Trilite, Trinol, and Tritolo. Chemical names for TNT are trinitrotoluene and
trinitrotol. The advantages of TNT include low cost, safety in handling, high explosive
power, good chemical and thermal stability, and compatibility with other explosives.87
Karasek et al. was the first to report using IMS to detect TNT, obtaining a negative ion
response.96
Table 2-4, provides diagrams of the chemical structures and physical properties for
the five explosive compounds selected for evaluation.
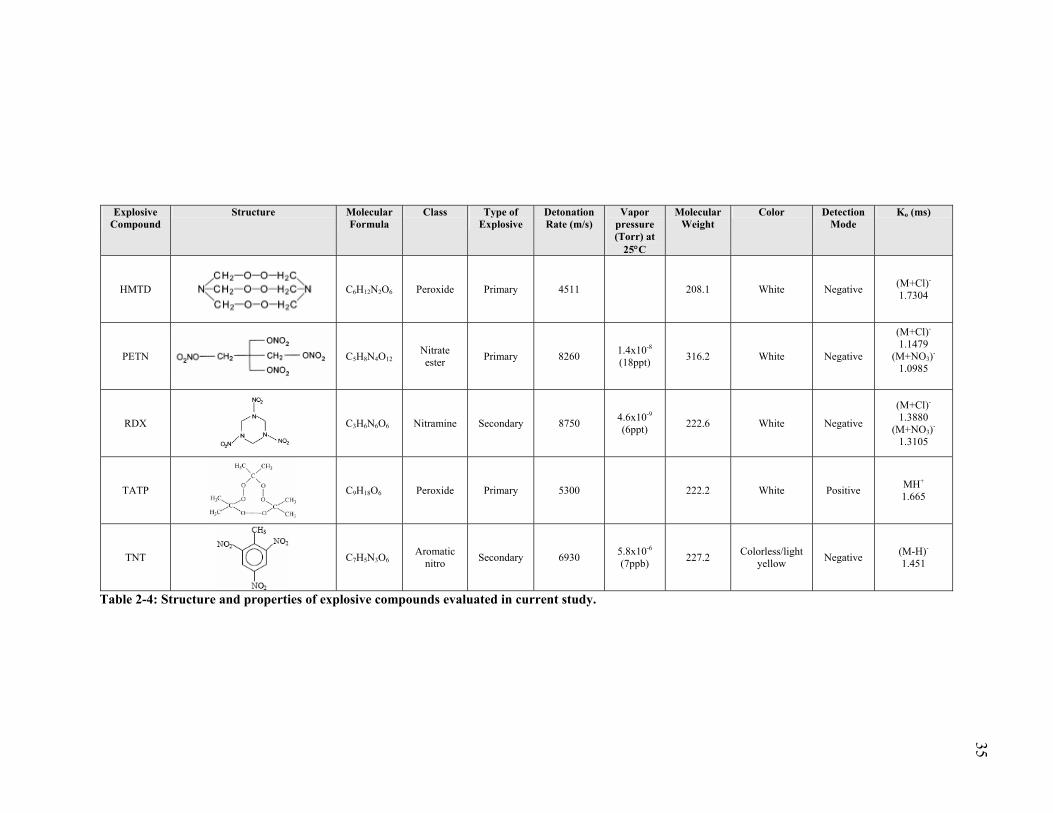
35
Explosive Compound
Structure Molecular Formula
Class Type of Explosive
Detonation Rate (m/s)
Vapor pressure (Torr) at
25+C
Molecular Weight
Color Detection Mode
Ko (ms)
HMTD
C6H12N2O6 Peroxide Primary 4511 208.1 White Negative (M+Cl)- 1.7304
PETN
C5H8N4O12 Nitrate ester Primary 8260 1.4x10⁻⁸
(18ppt) 316.2 White Negative
(M+Cl)-
1.1479 (M+NO3)-
1.0985
RDX
C3H6N6O6 Nitramine Secondary 8750 4.6x10⁻⁹
(6ppt) 222.6 White Negative
(M+Cl)-
1.3880 (M+NO3)-
1.3105
TATP
C9H18O6 Peroxide Primary 5300 222.2 White Positive MH+
1.665
TNT C7H5N3O6 Aromatic
nitro Secondary 6930 5.8x10⁻⁶
(7ppb) 227.2 Colorless/light yellow Negative (M-H)-
1.451
Table 2-4: Structure and properties of explosive compounds evaluated in current study.

36
3 Methodology
This chapter describes the methods used to answer the research question discussed in
Chapter 1. The primary objective was to determine if IMS chemical detection methods
could be improved for trace forensics and military field applications. A test plan was
developed to compare the performance characteristics of the IMS and GC/IMS
operational modes of the GC-IONSCAN®. Known liquid concentrations of HMTD,
PETN, RDX, TATP, and TNT were analyzed to determine instrument response (mean
sum of the product ion(s) maximum peak amplitude), detection limits, sensitivity, and
precision. In addition, compound specificity and resolution of four chemical interferent
products without and amidst the five explosive compounds was assessed with the IMS
and GC/IMS operational modes of the GC-IONSCAN®.
3.1 GC-IONSCAN®
The instrument used in this research, a GC-IONSCAN® manufactured by Smiths
Detection (Warren, NJ), weighs approximately 70 lbs., (see Figure 3-1) and was
introduced in 1999 as a transportable field-screening instrument for explosive or
narcotics detection. The instrument can be operated in two settings: explosives (negative
ion detection) or narcotics (positive ion detection). The GC-IONSCAN® can provide
semi-quantitative analysis of compounds based on ion mobility, retention time,
characteristic chemical ionization peaks (analyte product ions), drift time, and amplitude
of the response.

37
Figure 3-1: Smiths Detection GC-IONSCAN® instrument
GC oven (top view)
IMS inlet (side view)
SPD (front view)

38
The instrument can also be operated in two modes: IMS only and GC/IMS (which
combines GC and IMS). A flow schematic of the GC-IONSCAN® is shown in Figure 3-
2.
Figure 3-2: Schematic of the GC-IONSCAN®
Samples are obtained by wiping or deposition onto a Teflon® or cotton “swab”. In
the IMS mode, analytes are thermally desorbed in a solid phase desorber (SPD) and
combined with makeup gas (air filtered with charcoal and Drierite,). The GC column is
bypassed permitting quick and direct analysis of thermally desorbed molecules in
seconds. In the GC/IMS mode, solvent extracts can be directly injected onto the GC
column or solvents and solid particles can be thermally desorbed from a swab via an
SPD. When thermally desorbed, analyte enters a sample loop (10cm MXT-1; 0.53mm
internal diameter; 7.0µm film thickness) via a six-port valve. After desorption is

39
39
complete, the six-port valve switches, the sample loop (i.e sample trap) is heated, and
sample vapors are carried into the column.
In the positive setting, a trace amount of nicotinamide is automatically added into
the ionization region as a chemical ionization dopant and an internal calibrant. In the
negative setting, a trace amount hexachloroethane is automatically added as a chemical
ionization dopant. A trace amount of 4-nitro-benzylnitrile is automatically added as an
internal calibrant. The reagents are housed within the instrument as solids in permeation
tubes that are heated during operation. To ensure calibration of the instrument, the
software continuously monitors the drift times of the ions produced from the internal
calibrants. The software uses the internal calibrant drift time to calculate expected
reduced ion mobilities (Ko) for targeted compounds. The drift time of the calibrant ions
is compared to a reference value and the difference is reported as a "delta" value on the
instrument display. The calibrant position is monitored whenever the instrument is idle,
resulting in a continuous calibration process. The operating conditions of the
GC-IONSCAN® can be fully controlled from the instrument's front panel or via an
external computer via the GC-IONSCAN® software. The instrument requires either 110
or 220V AC power (1400W max) for operation.71
3.2 Instrument Setup
The GC-IONSCAN® instrument was used in accordance with the user manual and
manufacturer recommendations. In-house optimizations of the operating parameters
were not performed prior to data collection to maintain consistency with factory default
settings and following the recommendations provided by the manufacturer. Data
acquisition parameters are listed in Table 3-1.

40
40
Data Acquisition Parameters
HMTD* PETN RDX TATP* TNT IMS Experimental Conditions
Operating mode Negative Negative Negative Positive Negative Sampling time (s) 10 10 10 10 10 Desorber temperature (+C) 225 227 227 220 227 Inlet temperature (+C) 240 242 242 225 242 Drift tube temperature (+C) 105 112 112 150 112 Shutter gate width (ms) 0.02 IMS scan period (ms) 25 Segments per analysis 30 Scans added per segment 20 Analysis duration (s) 15 Electric field gradient (v/cm) 200 200 200 175 200 Product ion drift time variability (µs) 50 45 45 50 45
Product ion detection threshold (du)
(M+Cl)- (2)
(M+Cl)- (25)
(M+N03)- (50)
(M+Cl)- (25)
(M)2Cl- (40)
(M+N03)-
(50)
M+H+
(50) (M-H)-
(5)
GC/IMS Experimental Conditions Loop cycle program (s) sample (10); heat (3); purge (15); cool (15) Loop temperature (+C) 220 220 220 240 220 Valve temperature (+C) 200 200 200 220 200 GC column 15-m MXT-1; 0.53mm internal diameter; 1.0µm film thickness Oven initial temperature (+C) Oven initial hold (s) Oven ramp rate (ºC/min) Oven final temperature (+C) Final hold (s)
120 20 40
240 20
120 20 40
240 20
120 20 40 240 20
80 120
120 20 40 240 20
Transfer line temperature (+C) 180 220 220 240 220 Analysis duration (s) 220 Segments per analysis 300 Scans added per segment 20 (for the first 80s) 40 (for the last 140s) Product ion retention time (variability) (s) 90 (±5) 114 (±5) 117 (±5) 71 (±5) 100 (±5)
Table 3-1: GC-IONSCAN® data acquisition parameters *TATP and HMTD were not part of the original onboard library. Analysis was performed using parameters obtained from Smiths Detection.
When the GC-IONSCAN® was operated in IMS only mode, drift gas and carrier
gas were purified ambient air. The air was purified with activated charcoal and a
desiccant by drawing the air through the instrument purification unit. When operated in
GC/IMS mode, drift and carrier gas were BIP® helium (Airgas, Salem, NH) with less
41
41
than 10 ppbv oxygen, 20 ppbv water, 100 ppbv total hydrocarbons and 3 ppmv nitrogen.
Carrier gas pressure was set at 15 psi. The drift gas flow was set at 350 cc/min. HMTD
and TATP were not part of the original onboard library for the GC-IONSCAN®;
however, they were added using parameters obtained from the manufacturer.
3.2.1 Data Acquisition and Processing
All methods and data were analyzed and processed using the manufacturer’s
GC-IONSCAN® software (Instrument Manager version 5.114). Data was transferred via
an RS-232 cable linked to a remote 1.4 GHz Pentium notebook computer (Dell,
LATITUDE D600) for processing, display, and storage. MATLAB® (version R2006a)
was used to graphically display data.
3.3 Sample Preparation
Known masses of HMTD, PETN, RDX, TATP, and 2,4,6 TNT (all 99% or
greater in purity) were obtained from the FBI Explosives Unit of the Laboratory Division
(Quantico, VA). A stock solution of 100 ng/µL HMTD was prepared by dissolving the
solid compound in acetone (Optima, Fisher Scientific, Fair Lawn, NJ). Stock solution
standards of 100 ng/µL PETN, RDX, TATP, and TNT each were prepared by dissolving
the solid compounds in methanol (HPLC Grade, Fisher Scientific, Fair Lawn, NJ). The
stock solutions were used to make 100 ng/µL, 50 ng/µL, 10 ng/µL, 5 ng/µL, 1 ng/µL, and
0.1 ng/µL standards for the experiments. All standards were mixed in a vortex mixer
(Vortex-Genie 2, Scientific Industries, Bohemia, NY) for 30 seconds. All standards were
kept in amber glass vials with Teflon® lined screw caps (Supelco, Bellefonte, PA) and
refrigerated (8+C) when not in use.

42
42
3.4 Methods
The instrument was allowed to warm up for at least 30 minutes before analysis
began. Once the instrument was warm, the device parameters, listed in Table 3-1, were
verified and an instrument blank sample was collected prior to sample analysis. Second,
a swab blank was collected to record background generated by the swab. Third, a
swab/solvent blank was collected to record any background generated by the solvent. To
minimize any internal or external changes, the time between the blank samples and the
start of analyses was held to less than one minute. A new swab was used for each
analysis and an instrument blank was collected between analyses to ensure the samples
were not cross contaminated.
Samples were prepared by unscrewing the standard’s vial cap, collecting a 1µL
extraction with a 10µL (micro-liter) syringe (Hamilton, Reno, NV), and depositing
directly onto the swab, one explosive compound per sample. An air plug was used to
ensure the entire 1µL was forced out of the syringe. The solvent was allowed to
evaporate (approximately 5 s) before the swab was placed into the thermal desorption
unit. The desorption unit automatically vaporized the sample and subsequently
introduced the sample into the IMS or GC/IMS. Experiments with HMTD, PETN, RDX,
and TNT were performed in the negative setting. Experiments with TATP were
performed in the positive setting. The sum of the analytes ion(s) maximum peak
amplitudes were recorded and used for comparisons. For each sample, the result was
considered a positive identification if both of the following criteria were met:
1) Ion peaks in the IMS plasmagram or GC/IMS chromatogram could be attributed
to the analyte through ion mobility interpretation.

43
43
2) The analyte peaks of the IMS plasmagram or GC/IMS chromatogram were more
than three times the background noise.
3.4.1 Evaluation of Sample Swabs
Currently, the Transportation Security Administration (TSA) collects samples in
the field using rectangular (55mm x 75mm) cotton swabs (Smiths Detection, Warren,
NJ). Teflon® swabs (30mm diameter x 0.25mm) are also available (Smiths Detection,
Warren, NJ). A preliminary study was conducted to determine the swab material for
optimal adsorption, retention, and desorption of the selected analytes in this experiment.
To select the optimal swab, a clean background was established, 10 ng of an individual
explosive compound was deposited onto cotton and Teflon® swabs, and analyzed. Five
replicates of each explosive compound were collected for reproducibility. The sum of the
analyte ion(s) maximum peak amplitude was recorded after the analysis.
3.4.2 Evaluation with Explosive Compounds
After determining the optimal swab for all five explosive compounds, the IMS and
GC/IMS operational modes of the instrument were compared by analyzing the five
selected explosive compounds at concentrations ranging from 0.1 to 100 ng/µL. The
sensitivity of the operational modes was determined for each explosive compound by
stepping down the concentration of each to determine the lowest detectable quantity of
analyte loaded onto a swab. Five replicates at each analyte concentration were measured
for reproducibility.
44
44
3.4.3 Evaluation with Interferents
In the third experiment, four commercial products commonly found in airport
settings and identified as potential interferents by the FBI Counterterrorism & Forensic
Science Research Unit (CFSRU), (Quantico, VA) were analyzed as pure compounds by
both operational modes of the instrument to test the effect of chemical interferents on
analysis. For security purposes, the interferents will not be disclosed by name. The
interferents will be referred to as Interferent #1, Interferent #2, Interferent #3, and
Interferent #4. Interferents #1 and #2 were deposited onto sample swabs in 5 µL aliquots
and allowed to dry. The dry mass of Interferent #1 deposited on a sample swab was
approximately 700µg and the dry mass of Interferent #2 deposited on a sample swab was
approximately 420µg. A 100 mg droplet of Interferent #3 was placed on a 10 square inch
clean pane of glass and spread as evenly as possible using a gloved finger. One-
centimeter swab wipes were collected from the glass pane. The mass of Interferent #3
collected on a sample swab was approximately 500µg. For Interferent #4, 25mg of dry
particles were placed inside a 0.5-liter plastic bag and shaken. One-centimeter swab
wipes were collected from the bag interior. The dry mass of Interferent #4 collected on a
sample swab was approximately 450µg. Care was taken not to over-sample the
interferents by avoiding collection of visible particles on a swab. The approximate
weight was determined by weighing five of each interferent containing swab and
calculating the mean. For reproducibility, five replicates, one interferent per sample,
were analyzed by the IMS and GC/IMS operational modes of the instrument.
45
45
3.4.4 Evaluation with Interferents and Explosive Compound Mixtures
In the fourth experiment, the operational modes of the instrument were assessed to
determine the ability to discern a single target explosive compound (HMTD, PETN,
RDX, TATP, and TNT) in the presence of each of the four interferents (one at a time).
Sample swabs were prepared with the four interferents, with the same quantity as
previously described, and then spiked with the explosive compound (at least one order of
magnitude higher than the LOD). Five replicates of each single interferent/single
explosive combination sample were analyzed by the IMS and GC/IMS operational modes
of the instrument for reproducibility.
3.5 Statistical Methods for Data Analysis
The sum of the analytes product ion(s) maximum peak amplitude was recorded after
analyzing samples and the mean was computed for each set. Each set was compared for
reproducibility by determining the relative standard deviation (RSD) for the five
replicates in each sample set.

46
4 Experimental Results
4.1 Instrument Output
The instrument used in this research provides chemical analysis information
through output that is displayed as a plasmagram. A plasmagram of an ‘instrument
blank’ collected in the IMS mode, negative setting is displayed in Figure 4-1. Signal
intensity is plotted against drift time and analysis duration. The resulting ion peaks in
Figure 4-1 are the reactant ions, hydrated oxygen molecules (H2O)nO2- from ambient air
and chloride ions (H2O)nCl- from a dopant, hexachloroethane. In the absence of other
chemicals, reactant ion peak(s) form the largest peak(s) in a plasmagram because they are
the only charge carriers present in the detector.
Figure 4-1: Plasmagram from an IMS ‘instrument blank’.

47
47
A plasmagram from IMS analysis of a 10ng TNT sample is presented in Figure 4-2.
This plasmagram graphically illustrates the IMS drift time and peak shape of TNT as
(TNT-H)-. The resulting drift time for TNT was 12.637ms with a calculated ion mobility
(Ko) of 1.4502cm2/V-s using nitrobenzonitrile as the reference ion (Equation 2-5). When
TNT was analyzed, the reactant ion(s) [(H2O)nO2- and Cl-] decreased in intensity as the
TNT ions increased in intensity. The reactant ion(s) re-intensified as the TNT analyte
passed through the drift region and charge transfer reactions completed. Ions formed
from components in the Teflon® swab and background composition of little analytical
interest were observed in the plasmagram; however, these ions were much lower in
abundance and formed at times that did not interfere with the targeted analytes. For IMS
to identify a chemical, a product ion peak [(TNT-H)- in Figure 4-2] must conform to
detection algorithm parameters and the known Ko value in the onboard library.
Figure 4-2: Plasmagram from a 10ng TNT sample on a Teflon swab by IMS analysis.
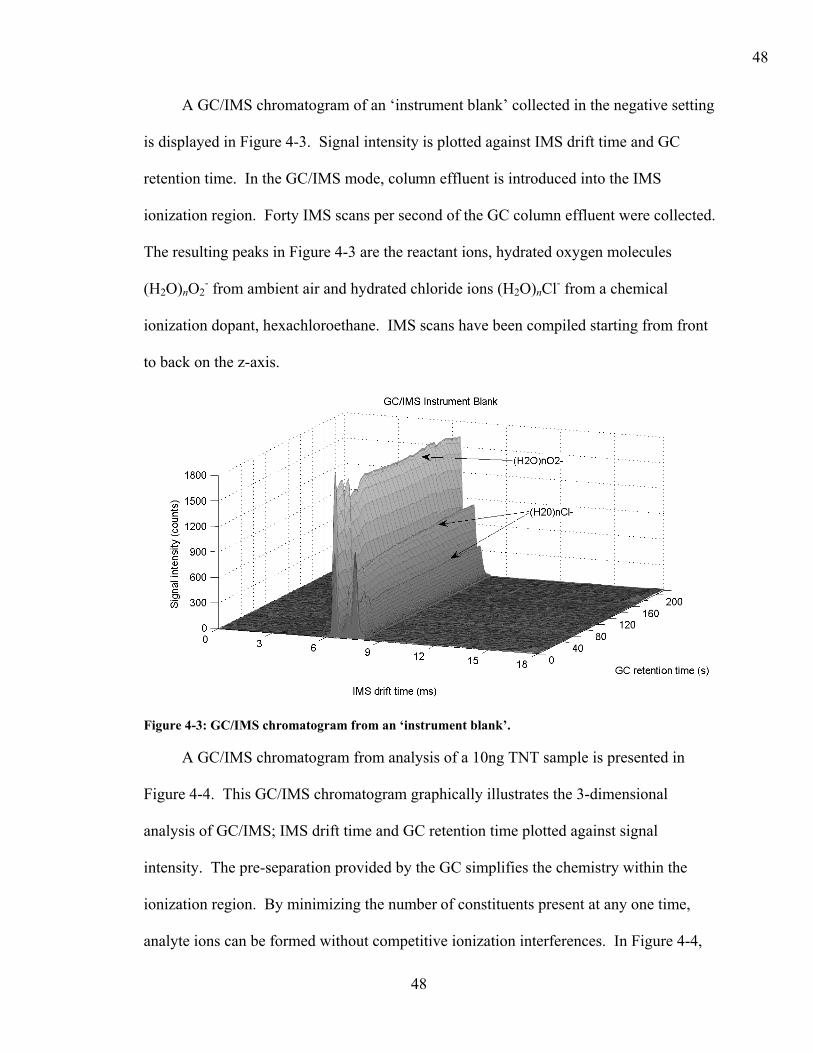
48
48
A GC/IMS chromatogram of an ‘instrument blank’ collected in the negative setting
is displayed in Figure 4-3. Signal intensity is plotted against IMS drift time and GC
retention time. In the GC/IMS mode, column effluent is introduced into the IMS
ionization region. Forty IMS scans per second of the GC column effluent were collected.
The resulting peaks in Figure 4-3 are the reactant ions, hydrated oxygen molecules
(H2O)nO2- from ambient air and hydrated chloride ions (H2O)nCl- from a chemical
ionization dopant, hexachloroethane. IMS scans have been compiled starting from front
to back on the z-axis.
Figure 4-3: GC/IMS chromatogram from an ‘instrument blank’.
A GC/IMS chromatogram from analysis of a 10ng TNT sample is presented in
Figure 4-4. This GC/IMS chromatogram graphically illustrates the 3-dimensional
analysis of GC/IMS; IMS drift time and GC retention time plotted against signal
intensity. The pre-separation provided by the GC simplifies the chemistry within the
ionization region. By minimizing the number of constituents present at any one time,
analyte ions can be formed without competitive ionization interferences. In Figure 4-4,

49
49
the z-axis denotes the GC retention time (104s), the x-axis denotes the IMS drift time
(12.737ms) and the y-axis denotes the signal intensity (765 counts) for the TNT peak.
The calculated ion mobility (Ko) of TNT was 1.4507cm2/V-s using nitrobenzonitrile as
the reference ion. Decrease of the reactant ions (H2O)nO2- and (H2O)nCl- from charge
transfer reactions can be observed in Figure 4-4. For GC/IMS to identify a chemical, a
product ion peak [(TNT-H)- in Figure 4-4] must conform to detection algorithm
parameters, the onboard library of known Ko, and the retention time (see Table 3-1).
Figure 4-4: GC/IMS chromatogram of 10ng TNT.
4.2 Sample Swab Analysis
Cotton and Teflon® swabs (Smiths Detection, Warren, NJ) were evaluated to
determine the optimal swab for adsorption, retention, and desorption. Ten ng of either
(HMTD, PETN, RDX, TATP, or TNT) was deposited on the swab surface, followed by
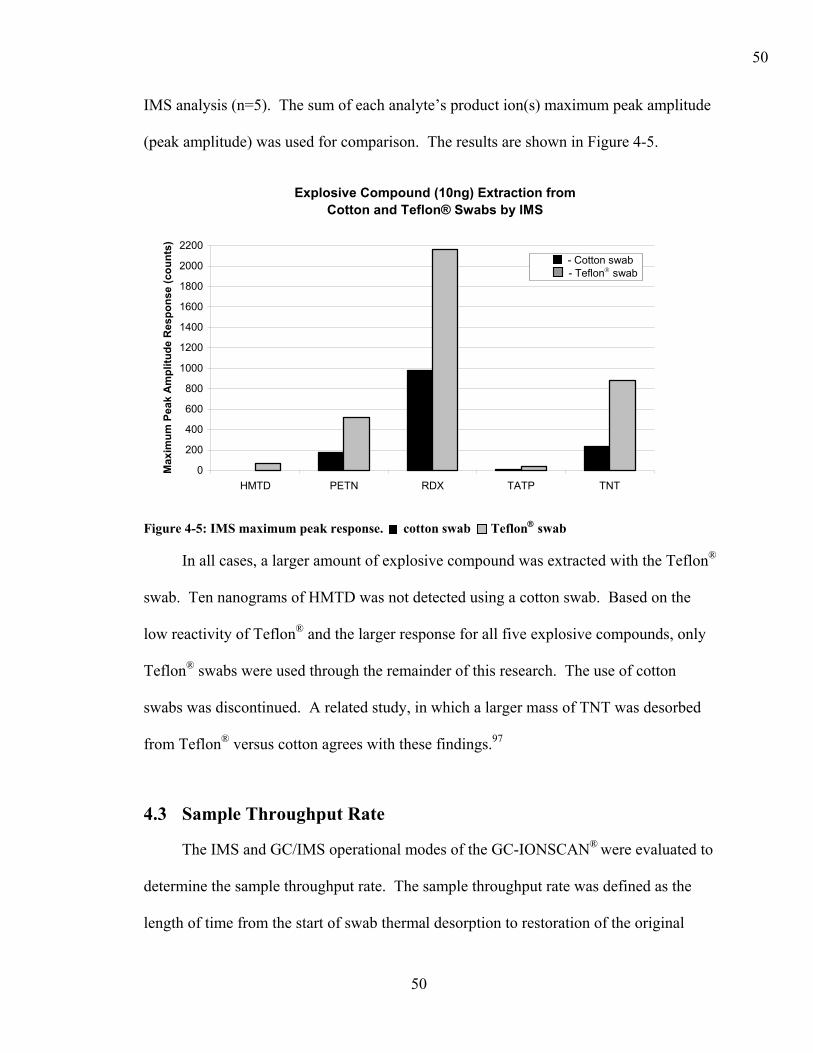
50
50
IMS analysis (n=5). The sum of each analyte’s product ion(s) maximum peak amplitude
(peak amplitude) was used for comparison. The results are shown in Figure 4-5.
Explosive Compound (10ng) Extraction fromCotton and Teflon® Swabs by IMS
0
200
400
600
800
1000
1200
1400
1600
1800
2000
2200
HMTD PETN RDX TATP TNT
Max
imum
Pea
k A
mpl
itude
Res
pons
e (c
ount
s)
Figure 4-5: IMS maximum peak response. cotton swab Teflon" swab
In all cases, a larger amount of explosive compound was extracted with the Teflon®
swab. Ten nanograms of HMTD was not detected using a cotton swab. Based on the
low reactivity of Teflon® and the larger response for all five explosive compounds, only
Teflon® swabs were used through the remainder of this research. The use of cotton
swabs was discontinued. A related study, in which a larger mass of TNT was desorbed
from Teflon® versus cotton agrees with these findings.97
4.3 Sample Throughput Rate
The IMS and GC/IMS operational modes of the GC-IONSCAN® were evaluated to
determine the sample throughput rate. The sample throughput rate was defined as the
length of time from the start of swab thermal desorption to restoration of the original
- Cotton swab - Teflon" swab

51
51
reactant ion intensity. This time included instrument analysis, computer processing,
results display, and stabilization for subsequent sample analysis. IMS and GC/IMS were
evaluated by analyzing 10ng extractions of RDX liquid standard on a Teflon® swab
(n=10). In-house adjustments of the desorbing and analyzing parameters were not made
from the factory default settings. The average throughput rate for IMS was one sample
every 21 seconds. The average throughput rate for GC/IMS was one sample every 6
minutes 13 seconds.
Using the factory default settings, analysis times for GC/IMS and even IMS were
longer than desired for high-demand field use applications. The sample throughput rate
for both modes can be reduced through shorter SPD heating and/or analysis duration.
One observation with GC/IMS throughput rate was the lengthy cooling time of the air
circulation oven. The average cooling time of the air circulation oven from 200°C to
100°C was 1 minute 51 seconds (n=10). GC systems that employ an air circulation oven
to heat the column not only limit sample throughput through lengthy cooling rates, but
also tend to have a narrow range of temperature heating rates. Furthermore, air
circulation ovens are neither easily portable nor power efficient. The air circulation oven
in the GC-IONSCAN® has a maximum temperature heating rate of 40°C/min and
contributes to the weight and power requirements of the system. While the most modern
air circulation GC ovens can achieve temperature heating rates of 75°C/min, above
175°C the ramp rate is limited to approximately 30°C/min.66
An alternative to heating a GC column by an air circulation oven is to heat the
column directly. Resistive heating of capillary GC columns was first demonstrated in
1989.98 Since that time, several resistive heating designs have become commercially
52
52
available. Resistively heated column designs can attain temperature programming rates
much faster than the conventional air circulation ovens with temperature program rates of
200°C/min possible.99 The chromatography obtained using resistively heated columns
has also shown to be equivalent to that obtained with standard GC air circulation
laboratory instruments.66 Additional benefits of resistively heated columns, particularly
for field equipment, are the lower power requirements (battery operable), miniature size
(3 inch diameter x ½ inch thick coil), lightweight construction (less than 16 ounces), and
rapid cooling rates, which can provide faster analysis cycles and increased sample
throughput.99 Replacing the GC-IONSCAN® air circulation oven with a resistively
heated column may provide faster analysis cycles and increase sample throughput for
chemical analysis in the GC/IMS mode.
4.4 Explosive Compounds Analysis
4.4.1 Detection Limits
To determine the Limit of Detection (LOD) for each explosive, 1 µL liquid
standards were deposited on Teflon® swabs and analyzed by IMS and GC/IMS (n=5).
The LOD is defined as the mass of target analyte required to produce an alarm at the
given detection algorithm. Using the instrument parameters described in Table 3-1, the
LODs for the five explosive compounds are listed in Table 4-1 and Figure 4-6. The
results show IMS and GC/IMS had the same LOD for RDX and TNT; however, the LOD
for GC/IMS was higher than IMS for PETN, TATP, and HMTD. Several factors may
have attributed to the higher GC/IMS LODs, such as sub-optimal SPD, loop, column or
detection algorithm parameters. A lower GC/IMS LOD for PETN (10ng) and HMTD

53
53
(50ng) was observed after lowering the SPD, oven, and transfer line temperatures;
however, for the purposes of this study and to maintain consistency, parameters for the
research herein were not altered from the factory settings. LODs, similar to those
presented in Table 4-1, have been observed.44
IMS GC/IMS Ion Peaks Observed
RDX 0.1 ng 0.1 ng (M+Cl)- (M)2Cl- (M+N03)-
2,4,6 TNT 1 ng 1 ng (M-H)-
PETN 1 ng 50 ng (M+Cl)- (M+N03)-
TATP 5 ng 50 ng (M+H)+ HMTD 5 ng 100 ng (M+Cl)-
Table 4-1: Limit of Detection for the GC-IONSCAN®.
Minimum Detection Limit by IMS and GC/IMS
0.1 15
0.1 1
50 50
51
100
05
101520253035404550556065707580859095
100
RDX TNT PETN TATP HMTD
Am
ount
(ng)
Figure 4-6: Limit of detection (ng) with GC-IONSCAN®. IMS GC/IMS
- IMS - GC/IMS

54
54
4.4.2 Upper Saturation Limit
A well-documented characteristic of IMS technology is the narrow linear range of
instrument response versus mass of sample analyzed. Linear response of IMS is often
limited to two orders of magnitude of sample mass because IMS instruments are
relatively easy to overload due to the limited number of reactant ions available for analyte
ion reactions. When all reactant ions are depleted, no further increase in analyte ion
concentration is possible. Thus, sample size must be carefully controlled. The addition
of GC to IMS is designed to help minimize the number of constituents present at any one
time in the detector to prevent overload. The IMS and GC/IMS operational modes of the
instrument were evaluated to determine if the addition of GC reduced the upper
saturation limit of IMS.
Response curves are shown for the five explosive compounds in Figure 4-7.
GC/IMS was expected to have increased the upper limit of the saturation concentration
by limiting the amount of sample entering the IMS at any one time, preventing overload,
and potentially increasing the dynamic range. However, the data is inconclusive. Note
that with RDX (Figure 4-7a), IMS and GC/IMS appear to have reached saturation at the
same concentration level. The instrument response between 50ng and 100ng is nearly the
same, which suggests the instruments are saturated. With TNT (Figure 4-7b), IMS
response does not appear to reach saturation, while GC/IMS appears to have reached
saturation. GC/IMS saturation at the same or lower concentration as IMS may be
attributed to inefficient collection of sample vapors in the sample trap. One approach to
improve GC/IMS response may be to replace the sample trap with a new sample
collection medium for a more efficient collection of sample vapors for transfer into the

55
Figure 4-7: Response curves for (a) RDX, (b) TNT, (c) PETN, (d) TATP, and (e) HMTD with IMS and GC/IMS . Data points represent the mean (n=5). Error bars represent one standard deviation. Data points may be too large for error bars to appear on the graphs.
(a) (b)
(c) (d)
(e)
PETN
0200400600800
10001200140016001800200022002400260028003000320034003600
0.1
1.0
5.0
10.0
50.0
100.
0
Mass (ng)
Cou
nts
HMTD
0200400600800
10001200140016001800200022002400260028003000320034003600
0.1
1.0
5.0
10.0
50.0
100.
0
Mass (ng)
Cou
nts
RDX
0200400600800
10001200140016001800200022002400260028003000320034003600
0.1
1.0
5.0
10.0
50.0
100.
0
Mass (ng)
Cou
nts
TNT
0200400600800
10001200140016001800200022002400260028003000320034003600
0.1
1.0
5.0
10.0
50.0
100.
0
Mass (ng)
Cou
nts
TATP
0200400600800
10001200140016001800200022002400260028003000320034003600
0.1
1.0
5.0
10.0
50.0
100.
0Mass (ng)
Cou
nts

56
column. IMS and GC/IMS analysis of PETN (Figure 4-7c), TATP (Figure 4-7d), and
HMTD (Figure 4-7e), are inconclusive with respect to upper limit of the saturation.
The response curves in Figure 4-7 also show that IMS produced higher signal
response (peak amplitude) than GC/IMS at nearly all concentrations for all five explosive
compounds. The increased signal response by IMS over GC/IMS at the same
concentrations may be attributed to inefficient transfer of sample vapors into the column
and/or detector. One approach to improve GC/IMS response may be to replace the
PDMS coated sample loop (i.e. trap) with an alternate coating or a different sample
collection medium for a more efficient transfer of sample vapors into the column. A
second approach to improve GC/IMS response may be to replace the air circulation
heated column with a resistively heated column with improved temperature programming
rates that may allow for improved chromatography and more efficient transfer of sample
vapors into the IMS detector.

57
57
4.4.3 Precision
Relative standard deviations (RSD) were used to assess the precision
(reproducibility) of explosive compound analysis by examining the results of five
replicate samples. The RSDs (average peak amplitude divided by the standard deviation)
for IMS and GC/IMS analysis of the five explosive compounds are shown in Table 4-2
and Figure 4-8. The majority (33 of 40) of the RSDs were below 30%. The RSDs for
TNT by GC/IMS were significantly lower than IMS (p=0.043, Wilcoxon signed ranks
test). The RSDs for RDX by GC/IMS were lower than IMS for four concentrations and
the same for two, but not statistically significant (p=0.068, Wilcoxon signed ranks test).
No comparisons were made for PETN, TATP, or HMTD due to the different LODs and
the range tested.
Few studies are available in the published literature on the reproducibility of IMS
and GC/IMS measurements of explosive compounds. Studies that discuss reproducibility
of IMS under similar conditions report RSDs for PETN, RDX, and TNT between 4 and
77% in the range of 50 pg to 125 ng.97, 100 Dindal, et al.101 reported RSDs for trace levels
of RDX and TNT in soil samples at 54% and 51% and water samples at 20% and 26%
using GC/IMS.
TNT RDX PETN TATP HMTD IMS GC/IMS IMS GC/IMS IMS GC/IMS IMS GC/IMS IMS GC/IMS
100ng 11 4 8 4 4 23 6 27 9 13 50ng 10 2 5 5 6 25 10 26 17 *
10ng 32 14 9 6 25 * 8 * 31 *
5ng 34 11 6 6 18 * 21 * 63 *
1ng 29 27 36 24 48 * * * * *
0.1ng * * 50 22 * * * * * *
Table 4-2: Precision of five replicate samples (mean % RSD for the sum of the product ion(s) maximum peak amplitude) *Less than the LOD.

58
58
Figure 4-8: Precision of five replicate samples (mean % RSD for the sum of the analyte(s) maximum peak amplitude). 0.1ng 1ng 5ng xx10ng 50ng 100ng
Mean Relative Standard D eviation
0
10
20
30
40
50
60
70
IMS
GC
/IMS
IMS
GC
/IMS
IMS
GC
/IMS
IMS
GC
/IMS
IMS
GC
/IMS
RSD
(%)
30%
HMTD PETN RDX TATP TNT
Mean Relative Standard D eviation
0
10
20
30
40
50
60
70
IMS
GC
/IMS
IMS
GC
/IMS
IMS
GC
/IMS
IMS
GC
/IMS
IMS
GC
/IMS
RSD
(%)
30%
HMTD PETN RDX TATP TNT

59
59
4.5 Interferent Analysis
4.5.1 Accuracy The effect of chemical matrix interferents on IMS and GC/IMS detection was
explored using four commercial products. One interferent per Teflon® swab was
prepared and analyzed, as previously described (n=10). The quantity of interferent
deposited on sample swabs was approximately 700µg for Interferent #1, 420µg for
Interferent #2, 500µg for Interferent #3, and 450µg for Interferent #4. Table 4-3
summarizes the results of ‘interferent only’ sample analysis. A false positive is defined
as an alarm for an explosive compound, at the given detection threshold (Table 4-1),
when there actually was no explosive compound in the sample. ‘Interferent only’
samples analyzed by IMS resulted in seven false positives (two with Interferent #2 and
five with Interferent #3). GC/IMS analysis of ‘interferent only’ samples resulted in zero
false positives. The proportion of false positives was significantly higher for IMS (7/40)
than for GC/IMS (0/40) (p=0.012, Fisher’s exact test).
Interferent #1 Interferent #2 Interferent #3 Interferent #4 Interferent only
IMS GC/IMS IMS GC/IMS IMS GC/IMS IMS GC/IMS
Number of samples 10 10 10 10 10 10 10 10
Number of false positives in 10 samples
0 0 2 0 5 0 0 0
Table 4-3: Summary of chemical matrix interferents analyzed by IMS and GC/IMS.
Plasmagrams of the ‘interferent only’ samples collected by IMS analysis were
complex due to the multi-component chemical makeup of the interferents. Figure 4-9
shows IMS analysis of Interferent #3. (H2O)nO2- and (H2O)3Cl- reactant ions rapidly
decreased in intensity as the product ions created from Interferent #3 components
increased in intensity. (H2O)Cl- reactant ions were completely depleted for a brief period

60
60
during the analysis. Depletion of reactant ions by an interferent, such as this, could
potentially suppress or prevent detection of analyte(s) of interest because no reactant ions
would be available to transfer charge to the analyte(s).
Figure 4-9: IMS analysis of Interferent #3.
Figure 4-10 shows GC/IMS analysis of Interferent #3. The pre-separation provided
by the GC segregated the charge tansfer within the IMS ionization region, unlike IMS
only analysis. The pre-separation of Interferent #3 components minimized the number of
components present at any one time and prevented depletion of the reservoir of reactant
ions. The pre-separation of Interferent #3 components can be observed in Figure 4-10 by
the distinct analyte peaks in the individual IMS scans, collected from front to back.

61
61
Figure 4-10: GC/IMS analysis of Interferent #3.
Figure 4-11 shows IMS analysis of Interferent #4. (H2O)nO2- and (H2O)3Cl-
reactant ions decreased in intensity as the product ions created from Interferent #4
components increased in intensity. Interferent #4 components remained in the IMS for
the duration of analysis. Frequently, the interferents remained in the IMS for the duration
of analysis (Figures 4-9 and 4-11). This resulted in carry-over of the interferents into the
first instrument blank collected after IMS analysis of an ‘interferent only’ sample. After
intervals, ranging from 30 seconds to 5 minutes, the drift gas was able to purge the
interferent from the instrument and the original reactant ion intensity was restored.
Subsequent analyses could then be continued. The same phenomenon was observed for
Interferents #1 and #2. IMS plasmagrams of Interferents #1 and #2, respectively, are
provided in Appendix A.

62
62
Figure 4-11: IMS analysis of Interferent #4.
Figure 4-12 shows GC/IMS analysis of Interferent #4. The separation of
Interferent #4 components can be clearly observed by the separated peaks in the
individual IMS scans. Unlike with IMS analysis of Interferent #4 (Figure 4-11), nearly
all Interferent #4 components have been purged from the detector by the end of the
GC/IMS analysis duration. The reactant ion(s) have also re-intensified as Interferent #4
components passed through the drift region and charge transfer reactions completed. The
same phenomenon was observed for Interferents #1 and #2. GC/IMS chromatograms of
Interferents #1 and #2, respectively, are provided in Appendix A.

63
63
Figure 4-12: GC/IMS analysis of Interferent #4.
GC/IMS analysis of ‘interferent only’ samples (Figures 4-10 and 4-12) did not
produce carry over of the interferents into the first instrument blank collected after
GC/IMS analysis of an ‘interferent only’ sample. Near complete restoration of the
baseline and original reactant ion(s) occurs toward the end of the analysis (approximately
3 minutes) and delays in subsequent GC/IMS analysis were not experienced. This is
most likely attributed to the preferential sample loop collection properties and GC
separation of interferent components, which prevented overload and suppression of the
IMS and enabled the drift gas to purge the interferent more rapidly. In addition, the
average sample throughput rate for GC/IMS was one sample every 6 minutes 13 seconds
for GC/IMS compared to one sample every 21 seconds for IMS. The drift gas was able
to purge the interferent during the longer analysis duration of GC/IMS.
An instrument blank was collected before and after each ‘interferent only’ sample
analysis to ensure restoration of the baseline, restoration of the original reactant ion

64
64
intensity, and that carry over was not observed. IMS plasmagrams and GC/IMS
chromatograms of Interferents #1 and #2, respectively, are provided in Appendix A.
4.6 Interferent and Explosive Compound Mixture Analysis
After evaluating the detection capabilities of IMS and GC/IMS with each of the
five explosives and each of the four interferents separately, the effects of detecting the
explosives amidst the interferents were evaluated. Teflon® swabs were prepared with the
interferents and then spiked with a single explosive compound (at least one order of
magnitude higher than the LOD) and subsequently analyzed, as previously described
(n=5).
4.6.1 Accuracy (Interferent and Explosive Compound Mixtures)
A false positive is defined as an instrument response, in which the technology
alarmed for an explosive compound in the mixture that was not present. A false negative
was defined as an instrument response, in which the technology did not alarm for the
explosive compound in the mixture. For IMS and GC/IMS to identify a chemical, an
analyte peak(s) must conform to the detection algorithm parameters in the instrument.
The results are summarized in Table 4-4.

65
65
IMS GC/IMS Interferent
Correct False Positive False Negative Correct False Positive False Negative
#1 4 - 1 5 - -
#2 5 1* - 5 - -
#3 5 3* - 5 - - HM
TD
IMS
(10n
g)
GC
/IMS
(500
ng)
#4 0 3** 2 5 - -
#1 5 - - 4 - 1
#2 4 1** - 4 - 1
#3 2 1** 2 5 - - PETN
IM
S (1
0ng)
G
C/IM
S (1
00ng
)
#4 0 2** 3 5 - -
#1 5 - - 5 - -
#2 5 - - 4 1** -
#3 5 - - 5 - - RD
X
IMS
(10n
g)
GC
/IMS
(10n
g)
#4 5 5* - 5 - -
#1 5 - - 5 - -
#2 5 - - 5 - -
#3 5 - - 5 - - TATP
IM
S (1
0ng)
G
C/IM
S (5
00ng
)
#4 5 - - 1 - 4
#1 5 - - 5 - -
#2 5 - - 0 - 5
#3 0 2** 3 5 - - TNT
IM
S (1
0ng)
G
C/IM
S (1
0ng)
#4 2 3* - 5 - -
TOTAL 77 of 100 21 11 88 of 100 1 11
Table 4-4: Summary of IMS vs. GC/IMS analysis of explosive compounds in the presence of interferents. The dry mass of Interferents #1, #2, #3, and #4 deposited on a sample swab was approximately 700µg, 420µg, 500µg, and 450µg, respectively. *Instrument did alarm for the correct explosive in the sample; however, the instrument also alarmed for an additional explosive compound(s) that was not in the sample. **Instrument alarmed for an explosive compound(s) that was not in the sample.

66
66
4.6.1.1 False Positives
IMS analysis yielded 21 false positive alarms in 100 interferent/explosive
combination samples. Of the 21 false positives, 12 occurred when the instrument
alarmed for the correct explosive in the sample, but also alarmed for an additional
explosive compound(s) that was not in the sample. IMS analysis of the multi-component
interferent/explosive samples sometimes resulted in incomplete separation of the analytes
interferent ion peaks with the same drift time as the explosive compounds programmed in
the IMS, which produced false positive alarms. Of the 21 false positives, nine occurred
when the instrument did not alarm for the explosive compound in the sample, but for an
explosive compound(s) that was not in the sample. The failure to identify the correct
explosive compound in four of the nine false positive responses occurred because the
detection algorithm criterion for detecting multiple analyte peak(s) was not met. The use
of multiple analyte peak(s) detection is a widely used method to improve selectivity and
minimize false positives. The detection algorithm is set to search for more than one
analyte peak, rather than a single analyte peak; alarming only when multiple analyte
peaks are present to reduce false positives. While this can improve accuracy, if the
additional analyte peak(s) is not detected (which occurred in these four instances) the
instrument will not alarm for the analyte of interest. Collectively, these results highlight
the fact that an IMS has limited capabilities when analyzing complex mixtures and tends
toward false positive responses.
Using GC/IMS, the number of false positive responses was substantially reduced to
one false positive in 100 interferent/explosive combination samples. For this single false
positive response, GC/IMS did not alarm for RDX, but for an explosive compound(s) that

67
67
was not in the sample. The false positive occurred because the RDX peak amplitude was
below the minimum threshold set in the detection algorithm. The response curves
previously presented (Figure 4-7) show that GC/IMS produced lower signal response
than IMS at nearly all concentrations for all five explosives. Specifically, the mean
GC/IMS signal response to 10ng RDX by GC/IMS was 57% lower than the mean IMS
signal response. Loss of sample may have occurred at the SPD, in the six-port valve
switching, or through the sample loop (i.e. trap). A more efficient transfer of sample
vapors into the column and the detector with GC/IMS may improve signal response and
further reduce the occurrence of false positives with GC/IMS.
4.6.1.2 False Negatives
IMS analysis resulted in 11 false negative responses in 100 interferent/explosive
combination samples. The false negative responses by IMS were triggered by one of four
conditions:
1) The instrument was programmed to alarm when the detection algorithm criterion was met for two analyte peaks; however one of the analyte peaks was below the minimum threshold set in the detection algorithm criteria.
2) The analyte peak was not resolved from an interferent component. The analyte peak did not meet the detection algorithm criteria for the peak width at half the maximum amplitude because the analyte peak was too broad.
3) The analyte peak amplitude did not meet the minimum threshold in the detection algorithm criteria.
4) The instrument was programmed to alarm when the analyte peak was present on successive IMS scans; however, the analyte peak was present in only a single IMS scan.
GC/IMS analysis also resulted in 11 false negative responses in 100
interferent/explosive combination samples. The false negative responses by GC/IMS
were only triggered by conditions (1) and (2) above.

68
68
The effect of peak broadening with GC/IMS may be corrected by improving the
oven temperature control using a column design with improved temperature control that
may enhance the chromatography (i.e performance). The effect of analyte peaks not
meeting the minimum detection threshold with GC/IMS may be corrected by obtaining a
more efficient transfer of targeted analytes to the detector by replacing the sample loop
with a new sample collection medium (trap) for a more efficient transfer of sample
vapors into the column, and/or by replacing the column design for more efficient transfer
of sample vapors into the detector.

69
69
4.6.2 Instrument Response (Interferents and Explosive Compound Mixtures)
In addition to examining the accuracy (false positive/false negative) of explosive
compound detection amidst the interferents, IMS and GC/IMS signal response for the
pure explosive compounds was compared to signal response for the explosive compounds
with each interferent. The maximum peak amplitude was used for comparison. Figure 4-
13 summarizes the results. The solid line at 100% represents the normalized signal
response of IMS or GC/IMS with the pure explosive compounds. The shaded areas
represent ± one standard deviation from the normalized signal response of IMS and
GC/IMS with the pure explosive compounds. A suppressed response of an explosive
compound amidst an interferent was defined as mean signal response that was more than
one standard deviation from the normalized signal response of the pure explosive
compound. False positive (fp) and false negative (fn) responses are annotated on Figure
4-13.
The interferents used in this study had suppressing effects on IMS signal response
to the explosive compounds in the presence of the interferents in 8 of the 20 tests. The
suppression of the IMS signal response was due to the inability of IMS to separate the
complex multi-component interferent/explosive combination samples. This effect was
practically eliminated with GC/IMS, in which signal response to the explosive
compounds in the presence of the interferents was suppressed in 1 of the 20 tests. A
rigorous analysis of chemical matrix interferents and the ions they produce in IMS was
not within the scope of this research.

70
70
Figure 4-13: Effect of chemical matrix interferents on HMTD, PETN, RDX, TATP, and TNT analysis. IMS ! GC/IMS. The solid line represents the normalized signal response of a pure explosive compound with IMS and GC/IMS. The shaded area represents ± one standard deviation from the normalized signal response of pure explosive compound with IMS and GC/IMS. fn = false negative fp = false positive
Explosive Compounds with Interferents Maximum Peak Amplitude Response
0%
20%
40%
60%
80%
100%
120%
140%
160%
#1 #2 #3 #4 #1 #2 #3 #4 #1 #2 #3 #4 #1 #2 #3 #4 #1 #2 #3 #4
Sign
al In
tens
ity
Interferents
Pure Explosive + 1std
HMTD PETN RDX TATP TNT
1fn
3fp/2fn
1fn
1fn
1fp1fp/2fn
1fp
4fn 5fn 2fp/3fn2fp/3fn
IMS–10ng GC/IMS–500ng IMS–10ng GC/IMS–100ng IMS–10ng GC/IMS–10ng IMS–10ng GC/IMS–500ng IMS–10ng GC/IMS–10ng

71
71
4.6.2.1 Hexamethylene triperoxide diamine (HMTD)
IMS signal response to HMTD with Interferents #1 and #3 was within one standard
deviation of the signal response to pure HMTD. IMS signal response to HMTD with
Interferent #2 was suppressed by 39%. IMS did not correctly identify HMTD in the
presence of Interferent #4 (2 false positives and 3 false negatives).
GC/IMS signal response to HMTD with Interferents #1, #2, and #4 was within one
standard deviation of the signal response to HMTD. Interestingly, GC/IMS signal
response to HMTD with Interferent #3 was enhanced beyond one standard deviation of
the pure HMTD response. It is possible that the interferent ion chemistry proved
favorable for HMTD-chloride cluster (HMTD+Cl)- ion formation, resulting in increased
amplitude of (HMTD+Cl)- peaks. When more nitrates are in a sample, lower intensity
(HMTD+Cl)- peaks can be observed. Delineation of this effect is beyond the scope of
this research; however, it is important to notice that the GC/IMS data yielded better
signal response in all cases for HMTD in the presence of the interferents than IMS alone.
4.6.2.2 Pentaerythritol tetranitrate (PETN)
All four interferents suppressed IMS signal response to PETN. IMS did not
correctly identify PETN in the presence of Interferent #4 (2 false positives and 3 false
negatives). GC/IMS signal response to PETN was not suppressed by Interferents #1, #3
and #4 and GC/IMS signal response to PETN with Interferent #1 was within one standard
deviation of pure PETN. GC/IMS signal response to PETN with Interferents #3 and #4
was enhanced. As with the HMTD samples, it is possible that the interferent ion
chemistry also proved favorable for (PETN +Cl)- formation, resulting in increased
72
72
amplitude of (PETN +Cl)- peaks. When more nitrates are in a sample, lower intensity
(PETN +Cl)- peaks can be observed. Delineation of this effect is beyond the scope of this
research. While GC/IMS signal response to PETN with Interferent #2 was suppressed, it
is important to notice that the GC/IMS data yielded a better signal response in all cases
for PETN than IMS alone.
4.6.2.3 1,3,5-trinitro-1,3,5-triazacyclohexane (RDX)
Neither IMS nor GC/IMS signal response to RDX was suppressed by the four
interferents. IMS signal response to RDX with Interferents #1, #3, and #4 was within one
standard deviation of pure RDX. GC/IMS signal response to RDX with Interferents #1,
#2, and #4 was within one standard deviation of pure RDX. IMS signal response to RDX
with Interferent #2 and GC/IMS signal response to RDX with Interferent #3 were
enhanced beyond one standard deviation of pure RDX. The enhanced signal response
may be due to the phenomena observed with HMTD and PETN in which ion chemistry
proved favorable for RDX chloride adduct formation, resulting in increased amplitude of
(RDX+Cl)- peaks.
4.6.2.4 Triacetone triperoxide (TATP)
IMS signal response to TATP with Interferents #1, #2, and #3 was within one
standard deviation of the signal response to pure TATP. IMS signal response to TATP
with Interferent #4 was suppressed by 61%. GC/IMS signal response to TATP with
Interferents #1, #2, and #3 was within one standard deviation of the signal response to
pure TATP. GC/IMS signal response to TATP with Interferent #4 resulted in four false
negatives because the peak amplitude was below the minimum detection threshold.
73
73
4.6.2.5 2,4,6 Trinitrotoluene (2,4,6 TNT)
IMS signal response to TNT was suppressed by all four interferents. IMS signal
response to TNT with Interferent #3 resulted in two false positive and three false negative
responses. GC/IMS signal response to TNT with Interferents #1, #3, and #4 was within
one standard deviation of pure TNT. GC/IMS did not detect TNT in the presence of
Interferent #2 because the drift time shifted outside of the 45 µs window in the detection
algorithm.
The following IMS plasmagrams and GC/IMS chromatograms from analysis of
pure TNT and TNT with Interferent #1 are included, in Figure 4-14, to illustrate the
reduced signal intensity of an explosive compound caused by an interferent:
(a) IMS analysis of 10ng TNT (b) IMS analysis of 10ng TNT with ~ 700µg Interferent #1 (c) GC/IMS analysis of 10ng TNT (d) GC/IMS analysis of 10ng TNT with ~ 700µg Interferent #1
IMS analysis of 10ng TNT (Figure 4-14a) shows that TNT ((TNT-H)-) was
detected at 12.637ms throughout the analysis duration. The maximum peak amplitude
recorded in this sample was 878 counts at one second after sample introduction. IMS
analysis of 10ng TNT sample with Interferent #1 (Figure 4-14b) shows that TNT was
also detected at a similar drift time (12.711ms). Three distinct analyte peaks from
Interferent #1 components can be observed in Figure 4-14b. The competitive distribution
of charge, due to the presence of Interferent #1 components resulted in a suppression of
signal response to TNT. The maximum peak amplitude recorded in this sample, at one
second into the analysis duration, was 606 counts versus 878 counts with no interferent.
This corresponds to a 31% drop in signal intensity for the TNT in this sample. The mean

74 74
Figure 4-14: IMS plasmagrams and GC/IMS chromatograms of pure TNT and TNT with Interferent #1
(c) (d)
(a) (b)

75
75
drop in signal intensity (n=5) for TNT with Interferent #1 versus pure TNT was
46%, which was beyond one standard deviation of signal response to pure TNT.
The GC/IMS chromatogram of analysis of 10ng TNT (Figure 4-14c) shows the 3-
dimensional analysis of GC retention time and IMS drift time plotted against signal
intensity. The TNT peak is more clearly observed at 104 sec GC retention time and
12.737ms IMS drift time. The maximum peak amplitude recorded for TNT in this
sample was 765 counts. GC/IMS signal response was consistently less than the IMS
signal response for all five explosives, which is likely due to loss of analyte at connection
points with the six-port valve, sample loop, column, and transfer lines. Additional peaks,
of little analytical interest can also be observed in the GC/IMS chromatogram.
GC/IMS analysis of 10ng TNT with Interferent #1 (Figure 4-14d) shows that TNT
was detected at a similar retention time (105s) and drift time (12.698ms) as 10ng TNT
without Interferent #1(Figure 4-14c) by GC/IMS analysis. The introduction of column
effluent into the IMS spread the competitive distribution of charge into the individual
IMS scans. Many separate analyte peaks, resulting from Interferent #1 components, were
measured between 7 and 15 ms during the first 110 seconds of analysis. This is unlike
IMS analysis of TNT with Interferent #1 (Figure 4-14b) in which three distinct analyte
peaks were observed for the duration of analysis. The maximum peak amplitude
recorded for TNT with Interferent #1 by GC/IMS (Figure 4-14d) in this sample was 761
counts while the maximum peak amplitude recorded in the sample for TNT with no
interferent (Figure 4-14c) was 765 counts. This corresponds to less than 1% drop in
signal intensity by GC/IMS for the TNT in the sample, unlike IMS only analysis which
resulted in a 46% drop in signal intensity (Figure 4-14b). The mean drop in signal

76
76
intensity (n=5) with GC/IMS for TNT with Interferent #1 versus pure TNT was 13%,
which was with in one standard deviation of signal response to TNT with no interferent.
IMS plasmagrams and GC/IMS chromatograms of HMTD, PETN, RDX, TATP
and TNT with Interferents #1, #2, #3, and #4 are provided in Appendix B.
4.6.3 Precision (Interferents and Explosive Compound Mixtures)
After collecting and comparing the precision of IMS and GC/IMS with pure
explosive compounds, analysis was conducted to compare the precision (reproducibility)
of IMS and GC/IMS analysis of the explosive compounds amidst the interferents by
examining the results of five replicate samples. RSDs (mean peak amplitudes divided by
the standard deviation) were used to assess the precision of the analysis by IMS and
GC/IMS. The RSDs are shown in Table 4-5 and Figure 4-15. The majority (28 of 39) of
the RSDs were below 30% and very similar to the RSDs observed for the explosive
compounds without interferents (see Table 4-2). No distinguishing differences between
IMS and GC/IMS RSDs were observed. No studies are available in the published
literature on the reproducibility of IMS and GC/IMS measurements of explosive
compounds amidst interferents.
HMTD PETN RDX TATP TNT Interferent IMS GC/IMS IMS GC/IMS IMS GC/IMS IMS GC/IMS IMS GC/IMSNone 32 16 19 37 16 12 31 21 13 14
#1 *(1fn) 21 16 *(1fn) 18 17 15 35 30 12 #2 31 4 *(1fp) *(1fn) 13 *(1fp) 43 35 26 *(5fn)
#3 15 5 *(1fp/2fn) 34 7 4 25 15 *(2fp/3fn) 13
#4 *(3fp/2fn) 15 *(2fp/3fn) 39 6 13 33 *(4fn) 24 12 Table 4-5: Precision of five replicate chemical matrix interferent/explosive samples as percent (%) RSD. *RSDs were not calculated due to false positive and/or false negative instrument response. fp = false positive fn = false negative

77
77
Figure 4-15: Precision of five replicate interferent/explosive combination samples as percent RSD. RSDs were not calculated in cases where false positive/false negative instrument response was observed. – pure explosive Interferent #1 Interferent #2 Interferent #3 Interferent #4.
Mean Relative Standard Deviation with Interferents
0
10
20
30
40
50
60
70
80IM
S
GC
/IMS
IMS
GC
/IMS
IMS
GC
/IMS
IMS
GC
/IMS
IMS
GC
/IMS
Max
imum
Pea
k Am
plitu
de R
SD %
HMTD PETN RDX TATP TNT
30%

78
78
5 Discussion and Conclusions
The primary objective of this research was to determine if GC/IMS would improve
upon a current chemical detection method, IMS, being used in the field for explosive
compound analysis. The performance characteristics of the IMS and GC/IMS operational
modes of the GC-IONSCAN® were evaluated to determine the sample throughput rate,
limit of detection (LOD), upper saturation limit, precision, and accuracy. Five explosive
compounds (HMTD, PETN, RDX, TATP, and TNT) were used. In addition, the
capability to discern (accuracy and precision) the explosive compounds amidst four
chemical matrix interferents was evaluated.
IMS is a proven technology for field portable detection of vapor phase explosive
compounds due to its high sensitivity and rapid analysis. The average throughput for
IMS analysis of pure explosive compounds was one sample every 21 seconds; while as
expected, the GC/IMS average throughput of pure explosive compounds was much
longer with one sample analysis every 6 minutes 13 seconds. However, IMS analysis of
‘interferent only’ and interferent/explosive combination samples resulted in slower
throughput, with times ranging from 30 seconds to 5 minutes due to overload and
suppression of the reactant ion population. Analysis times of ‘interferent only’ and
interferent/explosive combination samples by GC/IMS did not result in a lengthier
throughput. LODs for the five explosive compounds showed IMS was more sensitive
than GC/IMS for HMTD, PETN and TATP most likely due to sample losses throughout
connection points in the GC/IMS system. While GC/IMS was expected to have increased
the upper limit of the saturation concentration, the data was inconclusive. IMS and
GC/IMS appeared to have reached saturation at the same concentration (100ng) with

79
79
RDX; GC/IMS appeared to have reached saturation at 100ng with TNT, while IMS
response appeared to have not reached saturation; the limits of saturation for HMTD,
PETN, and TATP were inconclusive.
The inferior resolution capability of IMS resulted in a statistically significant
(p=0.012) number of false positive responses (7 out of 40) when tested against
‘interferent only’ samples while GC/IMS analysis resulted in zero false positive
responses in 40 interferent samples. When attempting to discern explosive compounds in
the presence of the interferents, IMS analysis yielded 21 false positive responses in 100
interferent/explosive combination samples. GC/IMS analysis yielded 1 false positive
response in 100 interferent/explosive combination samples. Furthermore, IMS
experienced greater suppression of signal response to the explosive compounds amidst
the interferents than GC/IMS. The interferents suppressed the IMS signal response to the
explosive compounds in 8 of 20 tests. This effect was practically eliminated with
GC/IMS, in which signal response to the explosive compounds amidst the interferents
was suppressed in 1 of 20 tests. Incomplete separation and obscure analyte peaks lead to
inaccurate detection and identification by IMS resulting in more false positive responses.
The combination of GC to IMS shows the potential to overcome the difficulties
IMS encounters when attempting to identify individual components in a mixture by
separating the components before detection. While the limit of detection for HMTD,
PETN and TATP was higher with GC/IMS than IMS, the differences were modest.
Assessment of precision (reproducibility) to explosive compound response, using relative
standard deviation (RSD), revealed RSDs for TNT by GC/IMS were significantly lower
than IMS (p=0.043). Differences in RSDs for RDX, HMTD, PETN, and TATP were

80
80
negligible. GC/IMS consistently had less signal intensity to the explosive compounds
than IMS; however, the coupling of GC to IMS showed reduced false positive results for
‘interferent only’ samples and was more accurate at identifying explosive compounds in
the presence of interferents through improved resolution of chemical species. GC/IMS
produced no false positives with ‘interferent only’ samples. Analysis of explosive
compounds in the presence of the interferents showed GC/IMS produced fewer false
positive (1 versus 21) than IMS. The most significant limitation observed with the
GC/IMS throughput rate was the lengthy cooling rate of the air circulation oven. Three
approaches to improve GC/IMS response may be considered: (1) replace the sample loop
with an improved sample collection medium (trap) for a more efficient collection of
sample vapors or (2) characterize and improve the transfer efficiency of sample vapors to
the column or (3) replace the air circulation heated column with a resistively heated
column with improved temperature programming rates that may allow for improved
chromatography and more efficient transfer of sample vapors into the IMS source.
5.1 Applications
The combined technologies of GC and IMS should be seen as a step in improving
the complex problem of reducing false positives where many non-targeted substances,
create complex matrixes and interfere with IMS analysis. GC/IMS technology could
potentially be used in explosive compound search operations of airport passengers and
baggage, forms of transportation, structures, or improvised explosive devices (IED) for
confirmation of ‘IMS only’ positive responses, if the speed of response can be improved.
The average cooling time of the air circulation oven from 200"C to 100"C was 1 minute

81
81
51 seconds (n=10). Alternatively, 5m resistively heated column designs have been
shown to cool from 350"C to 40"C in less than 60 seconds.66 This translates to an
approximate 50 fold decrease in cooling time via a resistively heated column design.99
5.2 Study Limitations
1. IMS instruments are not capable of identifying unknown chemical compounds with
confirmatory confidence: Even with the additional step of differentiating chemical
compounds using a GC column prior to obtaining ion drift time information, a GC/IMS
does not provide unequivocal analyte identification.
2. False alarm rate: The detection probability and false alarm rate of a detector can
only realistically be determined in an operational setting. Only four interferents were
tested in this study. Additional complex matrices and actual field data should be studied.
3. Sample interferent collection technique: The collection of wipe samples can be
prone to human error and is user dependent. For example, in the collection of Interferent
#3 and #4 samples, the area wiped, pressure used, and amount of sampling media actually
contacting the sampling surface factored into the final response.
4. Actual concentrations: The evaluation of false positive and false negative results can
be influenced by the actual concentration of the interferents.
5. Environmental conditions: The precision may not be reflective of field situations
because temperature influences IMS and all samples were collected within carefully
controlled laboratory conditions.
82
82
5.3 Additional Research
Follow-on research in this area should include:
1. Sensitivity of GC/IMS: While the GC/IMS tested in this study had good selectivity
and good dynamic range, the sensitivity was less than ‘IMS only’. Test an improved
sample collection medium (trap) for a more efficient collection and transfer of sample
vapors into the column.
2. Fast GC/IMS: Develop and test a GC/IMS instrument that will employ a low
thermal mass GC column to permit rapid pre-separation of complex sample mixtures to
improve upon the capabilities to distinctly identify analytes of interest and further reduce
the number of false positive results currently experienced in the field with IMS.
3. GC/MS Analysis of Interferents: This study used common consumer products for
interferents. GC/MS analysis may help determine the individual components that
quenched the various explosives tested during IMS analysis.

83
83
Appendix A IMS analysis of Interferent #1
GC/IMS analysis of Interferent #1

84
84
IMS analysis of Interferent #2
GC/IMS analysis of Interferent #2

85
85
Appendix B
The following IMS plasmagrams and GC/IMS chromatograms of the five explosive
compounds with the four interferents are included to further demonstrate the suppression
effects.
HMTD PETN RDX TATP TNT Interferent IMS GC/IMS IMS GC/IMS IMS GC/IMS IMS GC/IMS IMS GC/IMS No Interferent A B K L U V EE FF OO PP
#1 C D M N W X GG HH QQ RR #2 E F O P Y Z II JJ SS TT #3 G H Q R AA BB KK LL UU VV #4 I J S T CC DD MM NN WW XX
Table B-1: Reference for IMS plasmagrams and GC/IMS chromatograms.

86
86
(A) IMS analysis of HMTD
(B) GC/IMS analysis of HMTD

87
87
(C) IMS analysis of HMTD with Interferent #1
(D) GC/IMS analysis of HMTD with Interferent #1
88
88
(E) IMS analysis of HMTD with Interferent #2
(F) GC/IMS analysis of HMTD with Interferent #2
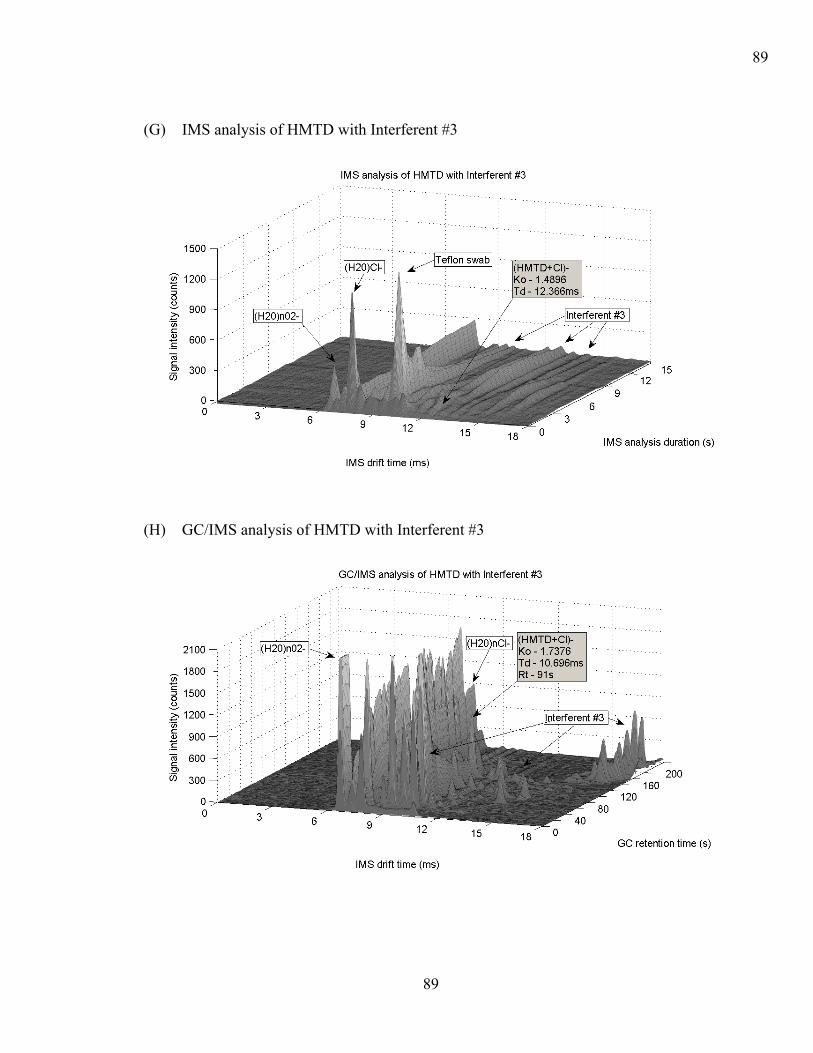
89
89
(G) IMS analysis of HMTD with Interferent #3
(H) GC/IMS analysis of HMTD with Interferent #3
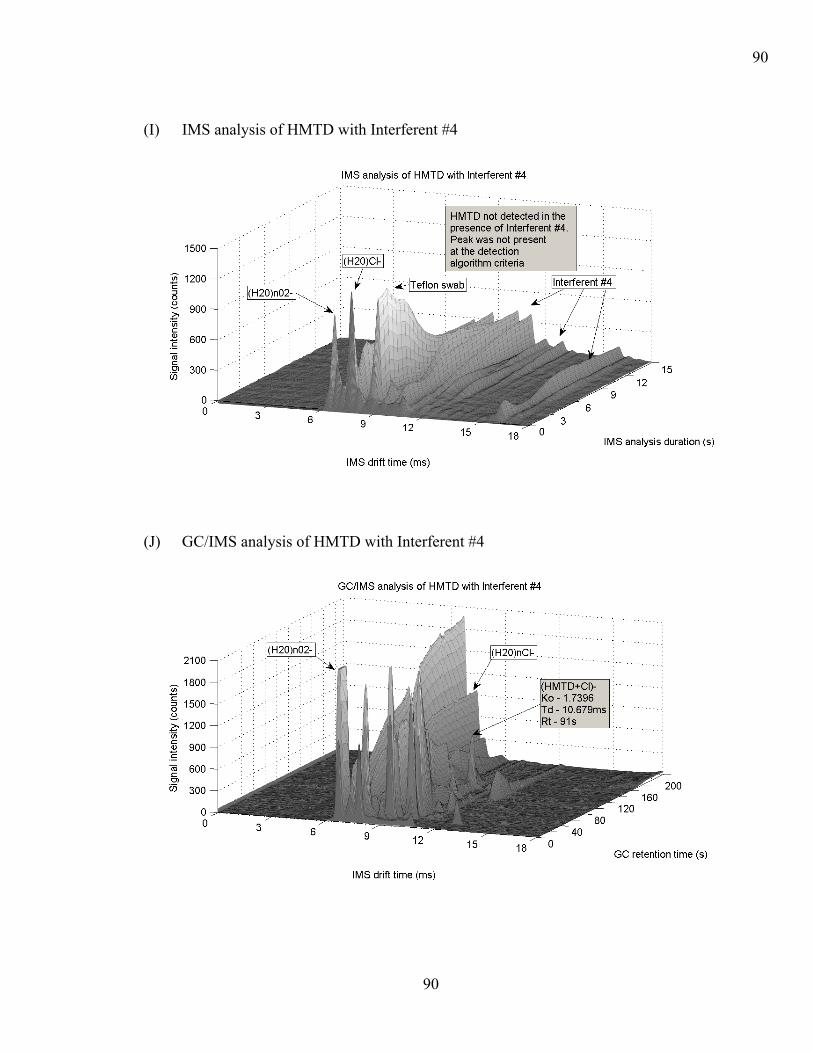
90
90
(I) IMS analysis of HMTD with Interferent #4
(J) GC/IMS analysis of HMTD with Interferent #4

91
91
(K) IMS analysis of PETN
(L) GC/IMS analysis of PETN

92
92
(M) IMS analysis of PETN with Interferent #1
(N) GC/IMS analysis of PETN with Interferent #1

93
93
(O) IMS analysis of PETN with Interferent #2
(P) GC/IMS analysis of PETN with Interferent #2

94
94
(Q) IMS analysis of PETN with Interferent #3
(R) GC/IMS analysis of PETN with Interferent #3
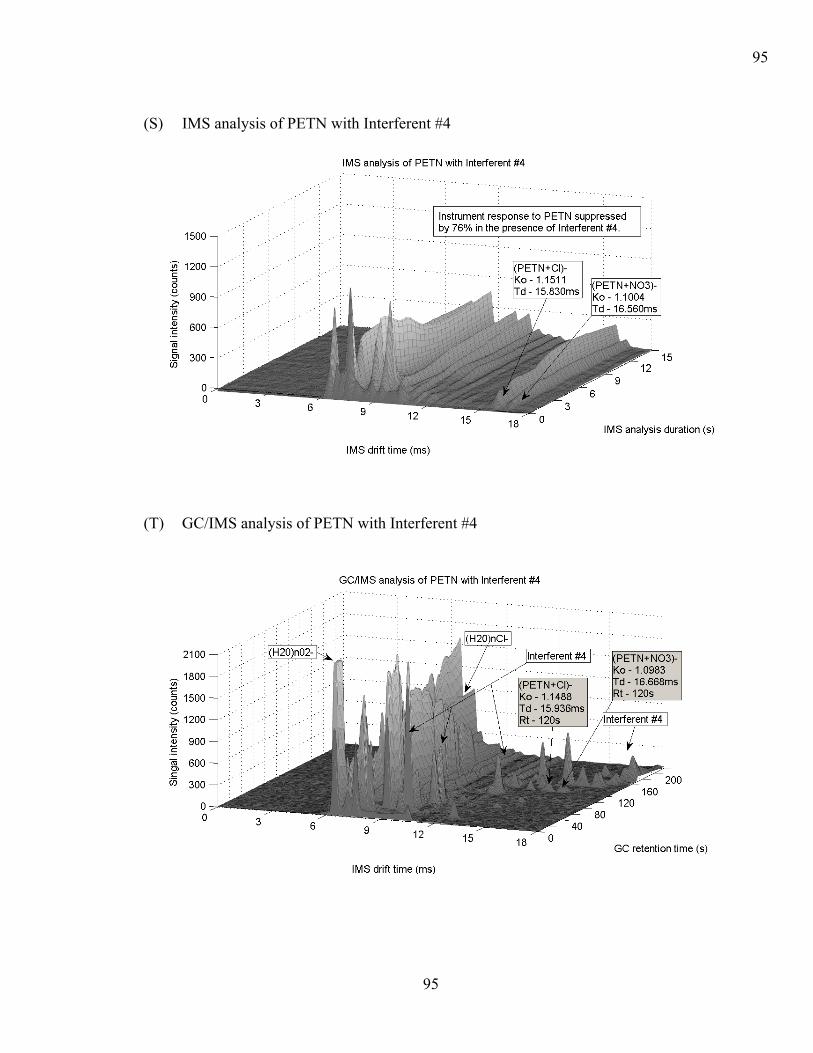
95
95
(S) IMS analysis of PETN with Interferent #4
(T) GC/IMS analysis of PETN with Interferent #4

96
96
(U) IMS analysis of RDX
(V) GC/IMS analysis of RDX

97
97
(W) IMS analysis of RDX with Interferent #1
(X) IMS analysis of RDX with Interferent #1

98
98
(Y) IMS analysis of RDX with Interferent #2
(Z) GC/IMS analysis of RDX with Interferent #2

99
99
(AA) IMS analysis of RDX with Interferent #3
(BB) GC/IMS analysis of RDX with Interferent #3

100
100
(CC) IMS analysis of RDX with Interferent #4
(DD) GC/IMS analysis of RDX with Interferent #4

101
101
(EE) IMS analysis of TATP
(FF) GC/IMS analysis of TATP
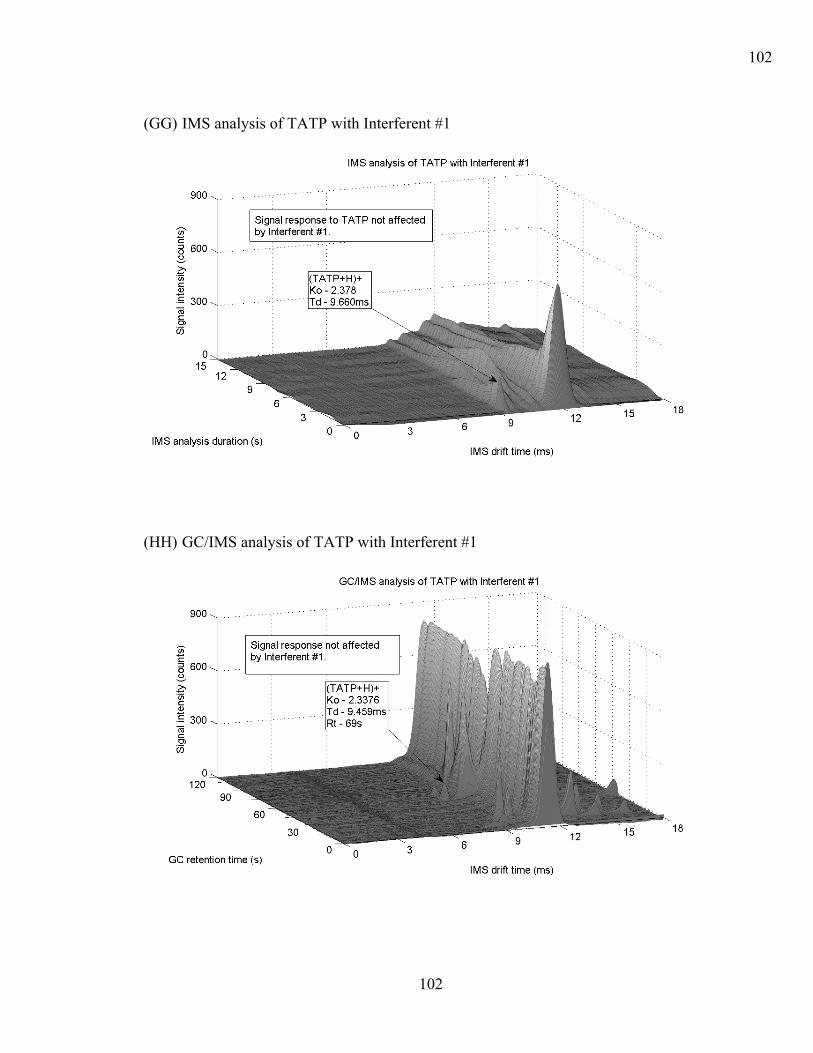
102
102
(GG) IMS analysis of TATP with Interferent #1
(HH) GC/IMS analysis of TATP with Interferent #1

103
103
(II) IMS analysis of TATP with Interferent #2
(JJ) GC/IMS analysis of TATP with Interferent #2

104
104
(KK) IMS analysis of TATP with Interferent #3
(LL) GC/IMS analysis of TATP with Interferent #3

105
105
(MM) IMS analysis of TATP with Interferent #4
(NN) GC/IMS analysis of TATP with Interferent #4

106
106
(OO) IMS analysis of TNT
(PP) GC/IMS analysis of TNT

107
107
(QQ) IMS analysis of TNT with Interferent #1
(RR) GC/IMS analysis of TNT with Interferent #1

108
108
(SS) IMS analysis of TNT with Interferent #2
(TT) GC/IMS analysis of TNT with Interferent #2
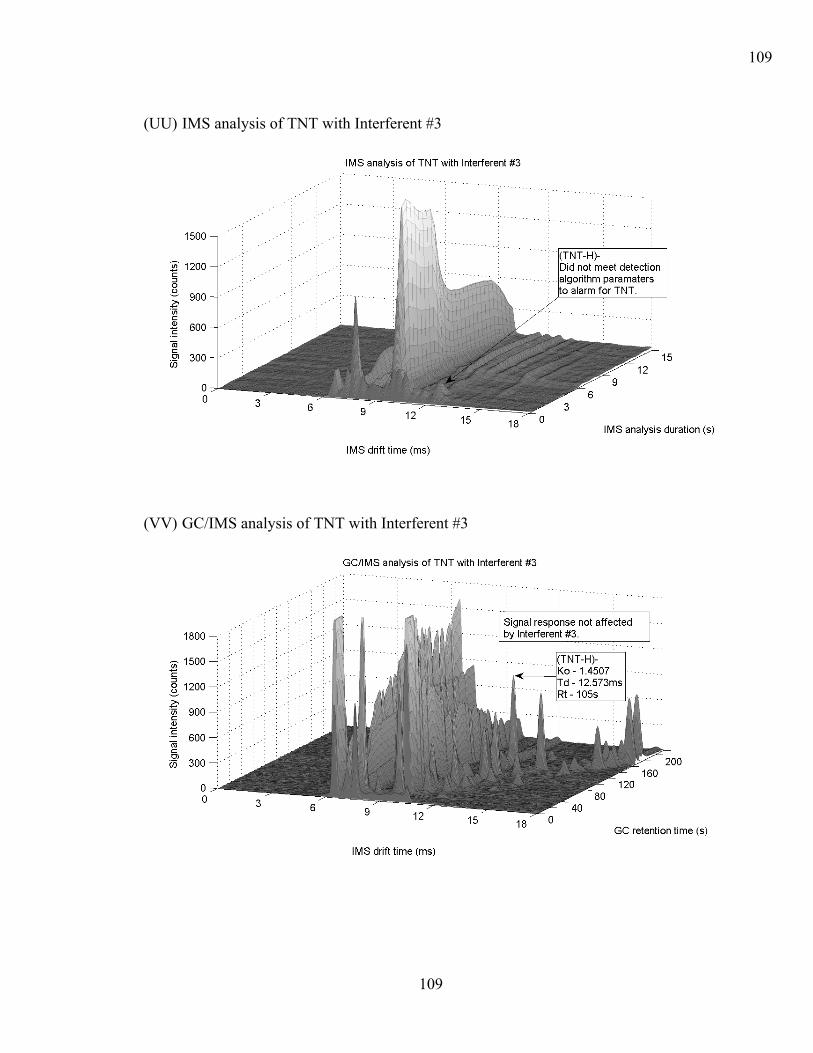
109
109
(UU) IMS analysis of TNT with Interferent #3
(VV) GC/IMS analysis of TNT with Interferent #3

110
110
(WW) IMS analysis of TNT with Interferent #4
(XX) GC/IMS analysis of TNT with Interferent #4

111
Bibliography
(1) Spangler, G. E.; Carrico, J. P.; Campbell, D. N. Recent advances in ion mobility spectrometry for explosives vapor detection, Journal of Testing and Evaluation 1985, 13, 234-240.
(2) Eiceman, G. A.; Blyth, D. A.; Shoff, D. B.; Snyder, A. P. Screening of Solid Commercial Pharmaceuticals Using Ion Mobility Spectrometry, Analytical Chemistry 1990, 62, 1374-1379.
(3) Fytche, L. M.; Hupe, M.; Kovar, J. B.; Pilon, P. Ion Mobility Spectrometry of Drugs of Abuse in Customs Scenarios: Concentration and Temperature Study, Journal of Forensics Sciences 1992, 37, 1550-1566.
(4) Federal Bureau of Investigation FBI History: Famous Cases: Jack Gilbert Graham. http://www.fbi.gov/libref/historic/famcases/graham/graham.htm October 22, 2005.
(5) Reynolds, P. UTA 772: The forgotten flight. http://news.bbc.co.uk/1/hi/uk/3163621.stm October 22, 2005.
(6) Forensic Justice Project Section E: Avianca Bombing. http://www.forensicjustice.org/AVIANCA.htm October 22, 2005.
(7) Reeve, S. Shoe-bomb flight -- a trial run? U.S., British officials fear similar attachs in the works. http://www.sfgate.com/cgi-bin/article.cgi?f=/c/a/2002/01/06/MN222117.DTL October 22, 2005.
(8) WashingtonPost.com Pan Am Flight 103 Bombing. http://www.washingtonpost.com/ac3/ContentServer?node=world/issues/terrordata&pagename=world/terror&appstat=detail&resulttype=attack&entityId=143&cache12=1 October 22, 2005.
(9) Sieff, M. Analysis: Russia's Air Terror Nightmare. http://washingtontimes.com/upi-breaking/20040827-061000-7997r.htm October 22, 2005.
(10) In Subcommittee on Aviation, Committee on Transportation and Infrastructure; United States General Accounting Office: Washington, DC, Feb. 12 2004., pp 1-41.
(11) Transportation Security Administration TSA and Technology: Working Better Together for You. http://www.tsa.gov/public/display?theme=70 October 22, 2005.
(12) Rhykerd, C. L.; Hannum, D. W.; Murray, D. W.; Parmeter, J. E.; National Institute of Justice, 1999, pp 1-116.
(13) Keller, T.; Schneider, A.; Tutsch-Bauer, E.; Jaspers, J.; Aderjan, R.; Skopp, G. Ion Mobility Spectrometry for the Detection of Drugs in Cases of Forensic and Criminalistic Relevance, International Journal for Ion Mobility Spectrometry 1999, 2, 22-34.
(14) Mieczkowski, T. The Utilization of Ion Mobility Spectrometry in a Criminal Justice Field, Drug Testing Technology 1999, 73-89.
(15) Baumbach, J. I.; Eiceman, G. A. Ion Mobility Spectrometry: Arriving On Site and Moving Beyond Low Profile, Applied Spectroscopy 1999, 53, 338A-355A.
(16) Hill, H. H.; Siems, W. F.; St.Louis, R. H. Ion Mobility Spectrometry, Analytical Chemistry 1990, 62, 1201A-1209A.

112
(17) Eiceman, G. A.; Karpas, Z. Ion Mobility Spectrometry, Second ed., 2005. (18) Snyder, A. P.; Harden, C. S. PortableHand-Held Gas Chromatography/Ion
Mobility Spectrometry Device, Analytical Chemistry 1993, 65, 299-306. (19) Matz, L. M.; Tornatore, P. S.; Hill, H. H. Evaluation of Suspected Interferents for
TNT Detection by Ion Mobility Spectrometry, Talanta 2001, 54, 171-179. (20) Eiceman, G. A.; Wang, Y. F.; Harden, C. S.; Shoff, D. B. Enhanced Selectivity in
Ion Mobility Spectrometry Analysis of Complex Mixtures by Alternate Reagent Gas Chemistry Analytical Chemistry 1995, 306, 21-33.
(21) Meuzelaar, H. L. C.; McClennen, W. H.; Dworzanski, J. P.; Sheya, S. A. Hyphenated Techniques; The Next Generation of Field-Portable Analytical Instruments, 1996, 38-47.
(22) Arnold, N. S.; Hall, D. L.; Wilson, R.; Snyder, A. P., Proceedings of the US Army ERDEC Scientific Conference of Chemical Defense Research 1996; 225-231.
(23) Erickson, R. P.; Tripathi, A.; Maswadeh, W. M.; Snyder, A. P.; Smith, P. A. Closed Tube Sample Introduction for Gas Chromatography-Ion Mobility Spectrometry Analysis of Water Contaminated with a Chemical Warfare Agent Surrogate Compound, Analytica Chemica Acta 2005, 1-7.
(24) Harden, C. S.; Shoff, D. B.; Davis, D. M.; Katzoff, L.; Snyder, A. P. Relative Performance Characteristics Of Hand-Held Ion Mobility Spectrometers - The Chemical Agent Monitor And A New Miniature IMS Instrument, 1994, 217-224.
(25) Conrad, F. J.; Kenna, B. T.; Hannum, D. W. Nuclear Materials Management 1990, 19, 902-905.
(26) Eiceman, G.; Stone, J. A. Ion Mobility Spectrometers in National Defense, Analytical Chemistry 2004, 390A-396A.
(27) Hill, H. H., Jr.; Martin, S. J. Pure Applied Chemistry 2002, 74, 2281-2291. (28) Yelverton, B. J. Analysis of RDX vapors in pre- and post-detonations using the
ion mobility spectrometer under field conditions, Journal of Energetic Materials 1988, 6.
(29) Kolla, P. Detecting hidden explosives, Analytical Chemistry 1995, 67, 184A-189A.
(30) St. Louis, R. H.; Hill, H. H. Ion Mobility spectrometry in analytical chemistry, Analytical Chemistry 1990, 21, 321-355.
(31) Eiceman, G. Advances in ion mobility spectrometry: 1980-1990, Critical Reviews Analytical Chemistry 1991, 22, 17-36.
(32) Nanji, A. A.; Lawerence, A. H.; Mikhael, N. Z. Use of skins sampling and ion mobility spectrometry as a preliminary screening method for drug detection in an emergency room, Clinical Toxicology 1987, 25, 501-515.
(33) Lawerence, A. H. Ion mobolity spectrometry/mass spectrometry of some prescription and illicit drugs, Analytical Chemistry 1986, 58, 1269-1272.
(34) Whitchurch, C.; Eckenrode, B. A.; FBI Counterterrorism and Forensic Science Research Unit, 2004.
(35) Byall, E. B. Explosives Report 1998-2001 Detection and Characterization of Explosives and Explosive Residue A Review. http://www.interpol.int/Public/Forensic/IFSS/meeting13/Reviews/Explosives.pdf October 22, 2005.

113
(36) Eckenrode, B. A. The Application of an Integrated Multifunctional Field-Portable GC/MS System, Field Analytical Chemistry and Technology 1998, 2, 3-20.
(37) Smith, P. A.; Sng, M. T.; Eckenrode, B. A.; Leow, S. Y.; Koch, D.; Erickson, R. P.; Jackson-Lepage, C. R.; Hook, G. L. Towards smaller and faster gas chromatography mass spectrometry systems for field chemical detection, Journal of Chromatography A 2005, 1067, 285-294.
(38) Karasek, F. W. The Plasma Chromatograph Research/Development 1970, 21, 34-37.
(39) Cohen, M. J.; Karasek, F. W. Plasma Chromatography - A New Dimension for Gas Chromatography and Mass Spectrometry, Journal of Chromatographic Science 1970, 8, 330-337.
(40) Snyder, P. A.; Maswadeh, W. M.; Parsons, J. A.; Tripathi, A.; Meuzelaar, H. L. C.; Doworzanski, J. P.; Kim, M. G. Field Detection of Bacillus Spore Aerosols with Stand-Alone Pyrolysis-Gas Chromatography-Ion Mobility Spectrometry, Field Analytical Chemistry and Technology 1999, 3, 351-326.
(41) Carr, T.W. Comparison of the Negative Reactant Ions Formed in the Plasma Chromatograph by Nitrogen, Air, and Sulfur Hexafluoride as the Drift Gas with Air as the Carrier Gas, Analytical Chemistry 1979, 51, 705-711.
(42) Carr, T. W.; Needham, C. D. Analysis of Organic Surface Contamination by Plasma Chromatography/Mass Spectroscopy, 819-830.
(43) Baim, M. A.; Herbert, H. H. Tunable Selective Detection for Capillary Gas Chromatography, Analytical Chemistry 1982, 54, 38-43.
(44) Fetterolf, D. D.; Clark, T. D. Detection of Trace Explosives Evidence by Ion Mobility Spectrometry, Journal of Forensics Sciences 1993, 38, 28-39.
(45) Kim, S. H.; Karasek, F. W.; Rokushika, S. Plasma Chromatography with ammonium reactant ions, Analytical Chemistry 1978, 50, 152-157.
(46) Proctor, C. J.; Todd, J. F. Alternative reagent ions for plasma chromatography, Analytical Chemistry 1984, 56, 1794-1798.
(47) Ells, B.; Froese, K. L.; Hrudey, S. E. Analysis of Haloacetic Acids in Drinking Water using Electrospray Ionization-High Field Asymmetric Waveform Ion Mobility Spectrometry-Mass Spectrometry, Organohalogen Compounds 1999, 40, 105-108.
(48) Eiceman, G. Ion Mobility Spectrometry as a Fast Monitor of Chemical Composition, Trends in Analytical Chemistry 2002, 21, 259-275.
(49) Sacristan, E.; Solis, A. A. A Swept-Field Aspiration Condensor as an Ion Mobility Spectrometer, International Electrical Engineering Transactions on Instrumentation and Measurement 1998, 47, 769-775.
(50) Ewing, R. G.; Atkinson, D. A.; Eiceman, G. A.; Ewing, G. J. A Critical Review of Ion Mobility Spectrometry for the Detection of Explosives and Explosive Related Compounds, Talanta 2001, 54, 515-529.
(51) Karasek, F. W.; Denny, D. W. Detection of aliphatic N-nitrosamine compounds compounds by plasma chromatography Analytical Chemistry 1974, 46, 1312-1314.
(52) Spangler, G. E.; Lawless, P. A. Ionization of nitrotoluene compounds in negative ion plasma chromatography, Analytical Chemistry 1978, 50, 884-891.
114
(53) Dionne, B. C.; Rounbehler, D. P.; Achter, E. K.; Hobb, J. R.; Fine, D. H. Vapor Pressure of Explosives, Journal of Energetic Materials 1986, 4, 447-472.
(54) Smiths Detection IONSCAN® 400B: The Most Reliable Explosives and Narcotics Trace Detector. http://trace.smithsdetection.com/products/Default.asp?Product=16§ion=Transportation October 22, 2005.
(55) GE Security Itemiser. http://www.gesecurity.com/portal/site/GESecurity/menuitem.f76d98ccce4cabed5efa421766030730?selectedID=3108&seriesyn=true&seriesID= October 22, 2005.
(56) Karasek, F. W.; Kilpatrick, W. D.; Cohen, M. J. Qualitative Studies of Trace Constituents by Plasma Chromatography, Analytical Chemistry 1971, 43, 1441-1447.
(57) Karasek, F. W. Analytical Chemistry 1971, 43, 1982-1886. (58) Karasek, F. W.; Keller, R. A. Gas Chromatograph/Plasma Chromatograph
Interface and Its Performance in the Detection of Musk Ambrette, Journal of Chromatographic Science 1972, 10, 626-628.
(59) Baim, M. A.; Hill, H. H. Halogenated Compound Response in an Oxygen Doped Ion Mobility Detector for Capillary Gas Chromatography, Journal of High Resolution Chromatography & Chromatography Communications 1983, 6, 4-10.
(60) Bartle, K. D.; Myers, P. History of Gas Chromatography, Trends in Analytical Chemistry 2002, 21, 547-557.
(61) James, A. T.; Martin, A. J. P. Biochemistry Journal 1952, 50, 679. (62) Golay, M. J. E. Gas Chromatography 1958, 36. (63) Desty, D. H.; Haresnape, J. N.; Whyman, B. H. F. Construction of Long Lengths
of Coiled Glass Capillary, Analytical Chemistry 1960, 32, 302-304. (64) MacDonald, S. J.; Wheeler, D. Fast Temperature Programming by Resistive
Heating with conventional GCs, American Laboratory 1988, 27-40. (65) Dandeneau, R. D.; Zerenner, E. H. An Investigation of Glasses for Capillary
Chromatography, Journal of High Resolution Chromatography & Chromatography Communications 1979, 2, 351-356.
(66) Sloan, K. M.; Mustacich, R. V.; Eckenrode, B. A. Development and Evaluation of a Low Thermal Mass Gas Chromatograph for Rapid Forensic GC-MS Analyses, Field Analytical Chemistry and Technology 2001, 5, 288-301.
(67) Karasek, F. W.; Hill, H. H.; Kim, S. H.; Rokushika, S. Gas Chromatographic Detection Modes for the Plasma Chromatograph, Journal of Chromatography 1977, 135, 329-339.
(68) Cram, S. P.; Chesler, S. N. Coupling of High Speed Plasma Chromatography With Gas Chromatography, Journal of Chromatographic Science 1973, 11, 391-401.
(69) Karasek, F. W.; Kim, S. H. The Plasma Chromatograph as a Qualitative Detector for Gas Chromatography, Journal of Chromatography 1974, 99, 257-266.
(70) Wilkins, C. L. Analytical Chemistry 1994, 66, 295A-. (71) DeBono, R.; Grigoriev, A.; Jackson, R.; James, R.; Kuja, F.; Loveless, A.;
Nacson, S.; Rudolph, A.; Sun, Y. Separation of Mixtures Using Gas Chromatography Coupled to Ion Mobility Spectrometry, International Journal for Ion Mobility Spectrometry 2002, 2, 194-201.

115
(72) Varian Inc. Varian CP-4900 micro-GC. http://www.varianinc.com/image/vimage/docs/products/chrom/gc/microgc/shared/microgc_4900_bro.pdf October 24, 2005.
(73) Thermo Electron Corporation EGIS Defender Dual-Technology. http://www.thermo.com/com/cda/resources/resources_detail/1,2166,111712,00.html?fromPage=search&keyword=defender October 22, 2005.
(74) Snyder, A. P.; Harden, C. S.; Brittain, A. H.; Arnold, N. S.; Meuzelaar, H. C. Portable, Hand-Held Gas Chromatography-Ion Mobility Spectrometer, American Laboratory 1992, 32B-32H.
(75) Arnold, N. S.; Dworzanski, J. P.; Sheya, S. A.; McClennen, W. H.; Meuzelaar, H. L. C. Design Considerations in Field-Portable GC-Based Hyphenated Instrumentation, Field Analytical Chemistry and Technology 2000, 4, 219-238.
(76) Buryakov, I. A. Express Analysis of Explosives, Chemical Warfare Agents and Drugs with Multicapillary Column Gas Chromatography and Ion Mobility Increment Spectrometry, Journal of Chromatography B 2004, 800, 75-82.
(77) Koole, A.; Luo, Y.; Franke, J. P.; Zeeuw, R. A. Dramatic Signal Reduction in Ion Mobility Spectrometry by Residues of Solvents, Journal of Analytical Toxicilogy 1998, 22, 191-196.
(78) Furton, K. G.; Meyers, L. J. The scientific foundation and efficacy of the use of canines as chemical detectors for explosives, Talanta 2001, 54, 487-500
(79) Megalomania's Controversial Chem Lab HMTD. http://www.roguesci.org/megalomania/explo/HMTD.html October 22, 2005.
(80) Megalomania's Controversial Chem Lab PETN. http://www.roguesci.org/megalomania/explo/PETN.bak
October 22, 2005. (81) KIROTV Homepage Powerful Bombs Found Near McChord.
http://www.kirotv.com/news/2177316/detail.html October 22, 2005. (82) Justice Department In Federal Register, May 9 ed., 2004; Vol. 69, pp 16958. (83) Buttigieg, G. A.; Knight, A. K.; Denson, S.; Pommier, C.; Bonner Denton, M.
Characterization of the Explosive Triacetone Triperoxide and Detection by Ion Mobility Spectrometry, Forensic Science International 2003, 135, 53-59.
(84) Oxley, J. C.; Smith, J. L.; Chen, H.; Cioffi, E. Decomposition of Multi-peroxide compounds Part II. Hexamethylene triperoxide diamine (HMTD), Thermochimica Acta 2002, 388, 215-225.
(85) Bartick, E. G.; Merrill, R. A.; Mount, K. H. Analysis of a Suspect Explosive Component: Hydrogen Peroxide in Hair Coloring Developer http://www.fbi.gov/hq/lab/fsc/backissu/oct2001/bartick.htm October 22, 2005.
(86) Schulte-Ladbeck, R.; Kolla, P.; Karst, U. Trace Analysis of Peroxide-Based Explosives, Analytical Chemistry 2003, 75, 731-735.
(87) Yinon, J.; Zitrin, S. Modern Methods and Applications in the Analysis of Explosives, 1st ed.; John Wiley & Sons, 1993.
(88) Rice, F. L. Reclamation of RDX from C-4 Explosives by the Jolly Roger. http://www.skepticfiles.org/new/137doc.htm
October 22, 2005.

116
(89) Fainburg, A. Explosives Detection for Aviation Security, Science 1992, 255, 1531-1541.
(90) Tam, M.; Hill, H. H. Secondary Electrospray Ionization-Ion Mobility Spectrometry for Explosive Vapor Detection, Analytical Chemistry 2004, 76, 2741-2747.
(91) Farber, D. Interesting-people Message Subject: IP: Shoe Bomber. http://www.interesting-people.org/archives/interesting-people/200201/msg00192.html
October 22, 2005. (92) Candiotti, S. Investigators: Phone cards link Reid to al Queda.
http://archives.cnn.com/2002/US/02/08/inv.shoe.bomb/ October 22, 2005. (93) Global Security
Military:Systems:Munitions:Introduction:Explosives:Military:Triacetone Triperoxide (TATP) http://www.globalsecurity.org/military/systems/munitions/tatp.htm October 22, 7/9/2005.
(94) Dubnikova, F.; Kosloff, R.; Zeiri, Y.; Karpas, Z. Novel Approach to the Detection of Triacetone Triperoxide (TATP): Its Structure and Its Complexes with Ions, Journal of Physical Chemistry A 2002, 106, 4951-4956.
(95) Global Security Military:Systems:Munitions:Introduction:Explosives:Military:Booster Explosives. http://www.globalsecurity.org/military/systems/munitions/explosives-booster.htm October 22, 2005.
(96) Karasek, F. W.; Denny, D. W. Detection of 2,4,6-Trinitrotoluene Vapors in Air by Plasma Chromatography, Journal of Chromatography 1974, 93, 141-147.
(97) Poziomek, E. J.; Almeer, S. H. Surface Adsorption and Retention of TNT vapors, Proceedings of the Conference on Enforcement and Security Technologies, SPIE The International Society for Optical Engineering International Symposium on Enabling Technologies for Law Enforcement and Security 1998, 3575, 392-402.
(98) Hail, M. E.; Yost, R. A. Compact Gas Chromatograph Probe for Gas Chromatography / Mass Spectrometry Utilizing Resistively Heated Aluminum-Clad Capillary Columns, Analytical Chemistry 1989, 61, 2410-2416.
(99) RVM Scientific Inc. Innovative Thermal Efficiencies: Products. http://www.rvmscientific.com/rvm_products.htm October 22, 2005.
(100) Klassen, S. E.; Rodacy, P.; Silva, R. Reactant Ion Chemistry for Detection of TNT, RDX, and PETN Using an Ion Mobility Spectrometer, Sandia Report, SAND97-2165.
(101) Dindal, A. B.; Bayne, C. K.; Jenkins, R. A.; Koglin, E. N. In Environmental Technology Verification Report Explosives Detection Technology Barringer Instruments GC-IONSCAN EPA, Ed., EPA/600/R-00/046 March 2000.
117
Curriculum Vitae
Lieutenant Commander Greg Cook was commissioned into the Navy’s Medical
Service Corps as an Industrial Hygiene Officer in December 1993. He is a graduate of
Old Dominion University, M.S. in Environmental Health and Murray State University,
B.S. in Occupational Safety & Health.
After completing Officer Indoctrination School, Lieutenant Commander Cook was
assigned to Naval Medical Center Portsmouth, Virginia where he served as a staff
Industrial Hygiene Officer. His subsequent tours include duty as Assistant Safety Officer
onboard the USS ENTERPRISE aircraft carrier; Department Head of Industrial Hygiene
at Naval Hospital Okinawa, Japan; and Safety Officer at Shore Intermediate Maintenance
Activity (SIMA) Mayport, Florida. In July 2003, he reported to the Uniformed Services
University of the Health Sciences and began full-time duty in pursuit of a PhD in
Environmental Health Science.
His decorations include the Navy and Marine Corps Commendation Medal (two
awards), Navy and Marine Corps Achievement Medal (three awards), Meritorious Unit
Commendation (three awards), National Defense Service Medal (two awards), Armed
Forces Expeditionary Medal, Armed Forces Service Medal, Sea Service Deployment
Ribbon, Navy and Marine Corps Overseas Service Ribbon (2 stars), and the NATO
Medal.