


Languages
Pages
Legal


, AD-A243 597
600 McCormick Street Sa Ii eaiidro CA94577
EXPERIMENTAL STUDIES OF ELECTRON BEAM TRANSPORT
' IN STELLARATOR FOCUSSING FIELDSI C
I 6 0 c~ r ikS rel •S nL ad oC gi 7
I JULY 1991
WORK PERFORMED UNDER CONTRACT NO.: NOOO14-89-C-0227
PREPARED FOR:
I OFFICE OF NAVAL RESEARCHI ARLINGTON, VA 22217
CA lnI

EXPERIMENTAL STUDIES OF ELECTRON BEAM TRANSPORTIN STELLARATOR FOCUSSING FIELDS
M.G. Tiefenback, S.D. Putnam, V.L. Bailey, Jr., J.P. Lidestriand J.A. Edighoffer
PSIFR-2543-01
July 1991
Work Performed Under Contract No. N00014-89-C-0227
Prepared for:
Office of Naval Research ,Ao I for
Arlington, VA 22217 IN 1- -q l
i Just :float I
Prepared by: A-*1w.1ty emAU -al sod/or
1) ! t W peial
Pulse Sciences, Inc.600 McCormick Street
San Leandro, CA 94577 - - -

TABLE OF CONTENTS
1.0 Introduction......................................................... 1
2.0 Experimental Apparatus............................................ 3
3.0 Diode Work ........................................................ 7
4.0 Magnet Mapping................................................... 13
5.0 Emittance .......................................................... 14
6.0 Dispersion.......................................................... 15
7.0 Collective Phenomena............................................. 19
8.0 RF Pickup ......................................................... 21
9.0 Beam Loss......................................................... 31
10.0 Summary ........................................................... 38
11.0 Suggestions for Future Investigations .............................. 39
References ......................................................... 39

LIST OF ILLUSTRATIONS
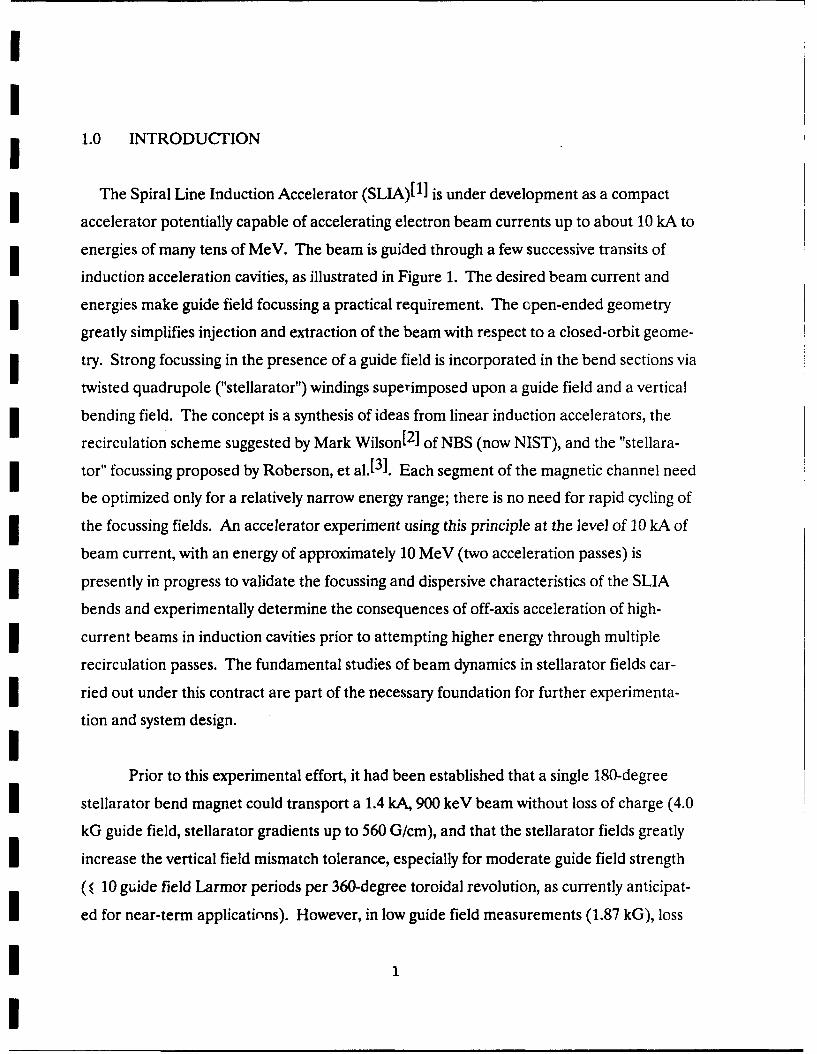
I igure WI Conceptual layout of a 540-degree SLIA accelerator .................... 2
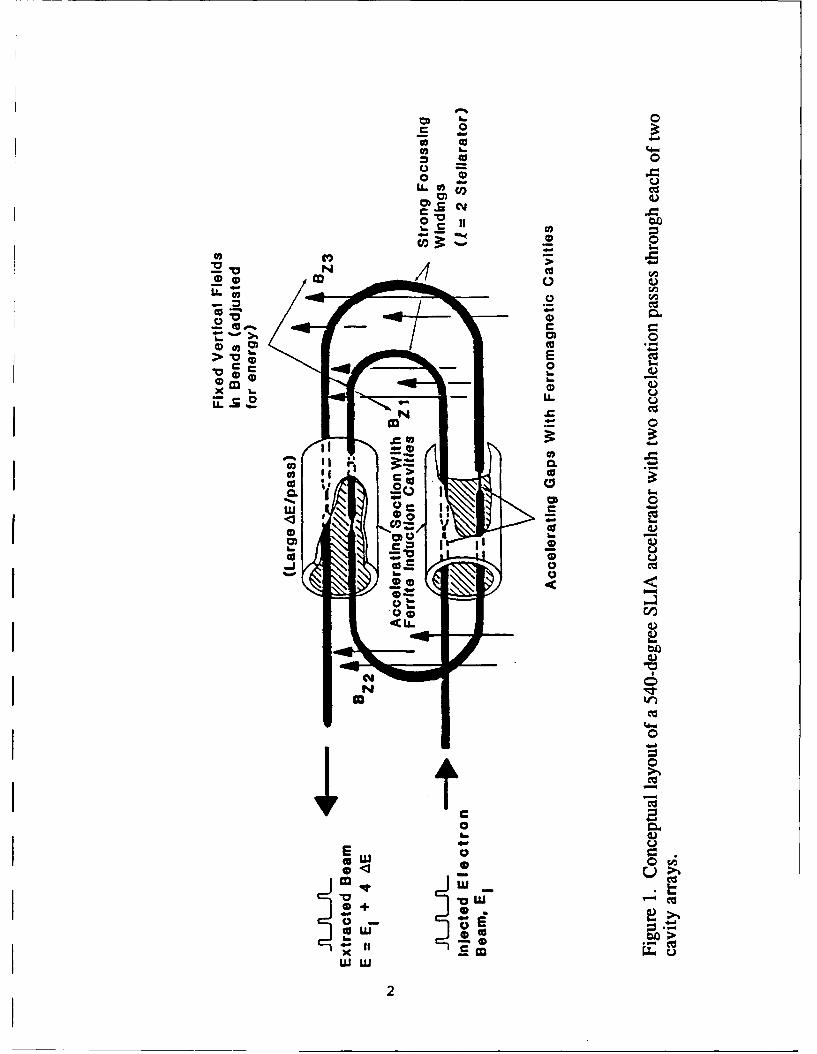
2 Schematic of the experimental setup ............................................. 5
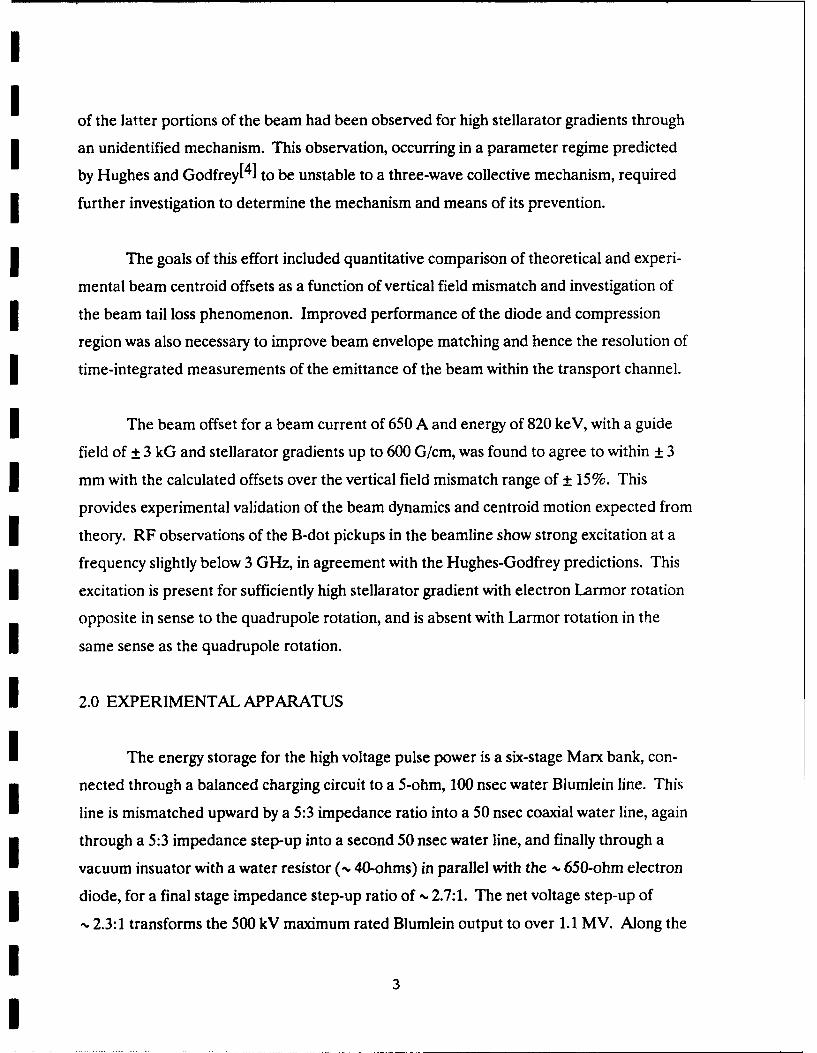
3 Engineering drawing of the cross-section of the bend magnet ....... 6
4 EGUN ray trajectories for existing diode and upgrade design ....... 8
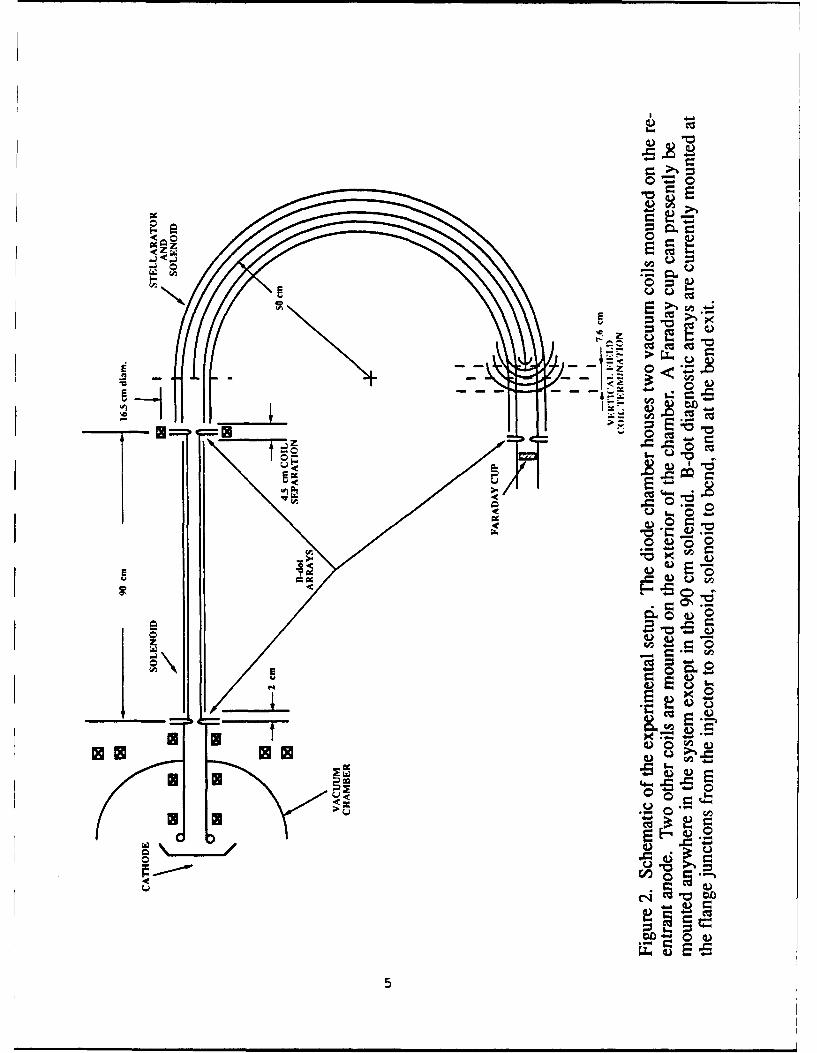
5 Measured envelope radius of the beam within the anode tube ....... 11
6 Measured diode voltage and current .............................................. 12
7 Effect of stellarator fields on beam current transmission ............... 16
8 900 keV, 700 a beam transport through bend (3 kG guide field)... 16
9 Experimental beam centroid ofset (3 kG guide field parallel toelectron beam velocity) ............................................................... 18
10 Experimental beam centroid offset (3 kG guide field anti-parallelto electron beam velocity) ............................................................. 20
11 Network analyzer frequency scan of the B-dot array response ....... 22
12 Bend exit B-dot signal for 325 A at a guide field strength of1.2 kG ......................................................................................... 24
13 Frequency determination of B-dot probe signal using filters ........... 25
14 B-dot probe signals at the entrance and exit of the bend magnet ..... 27
15 Oscilloscope traces of bend exit B-dot RF power vs. time ............ 28
16 Power vs. time from the data of Figures 15 (a-d) .......................... 30
17 Network used for summing and differencing opposing B-dots ........ 32
18 Sum and difference signals from opposing bend exit B-dots ........... 33
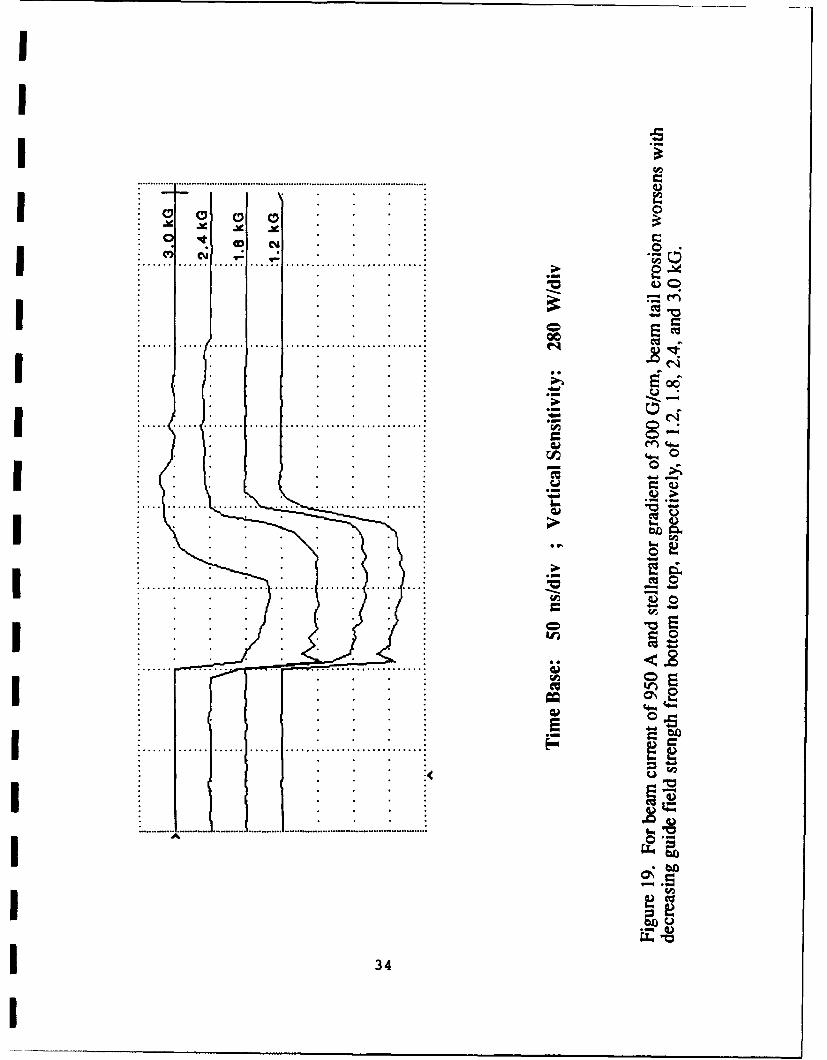
19 Beam tail erosion witG decreasing guide field suength .......... 34
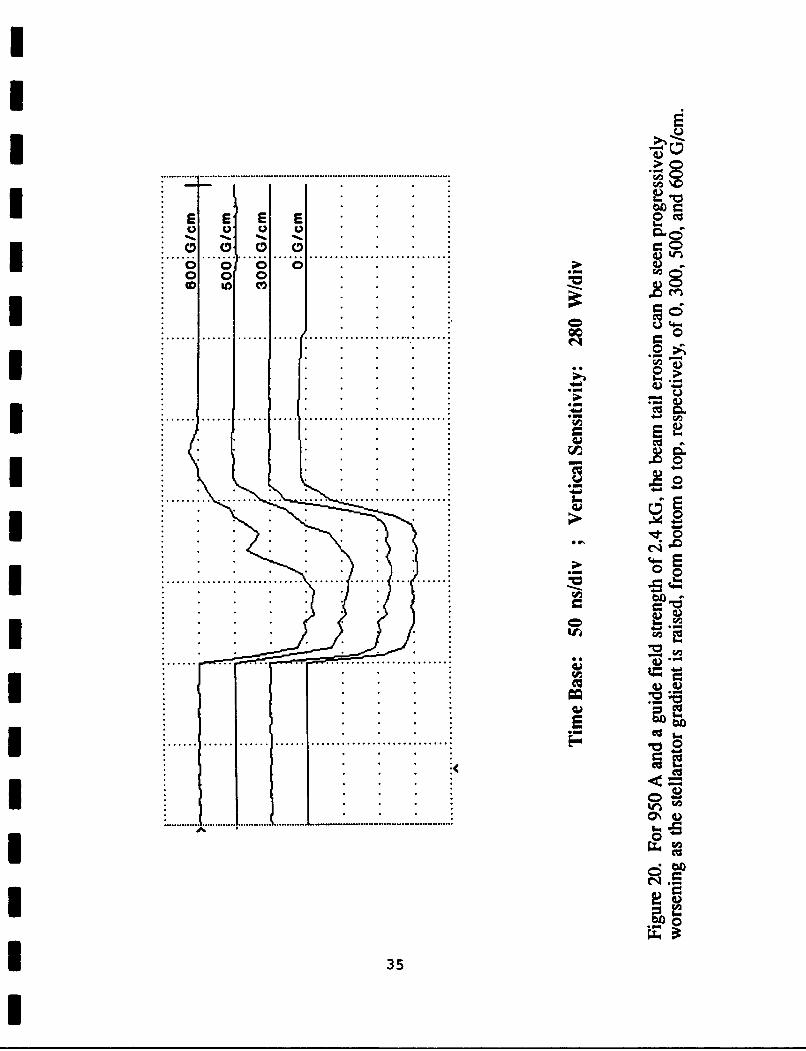
20 Beam tail erosion with increasing stellarator gradient.......... 35
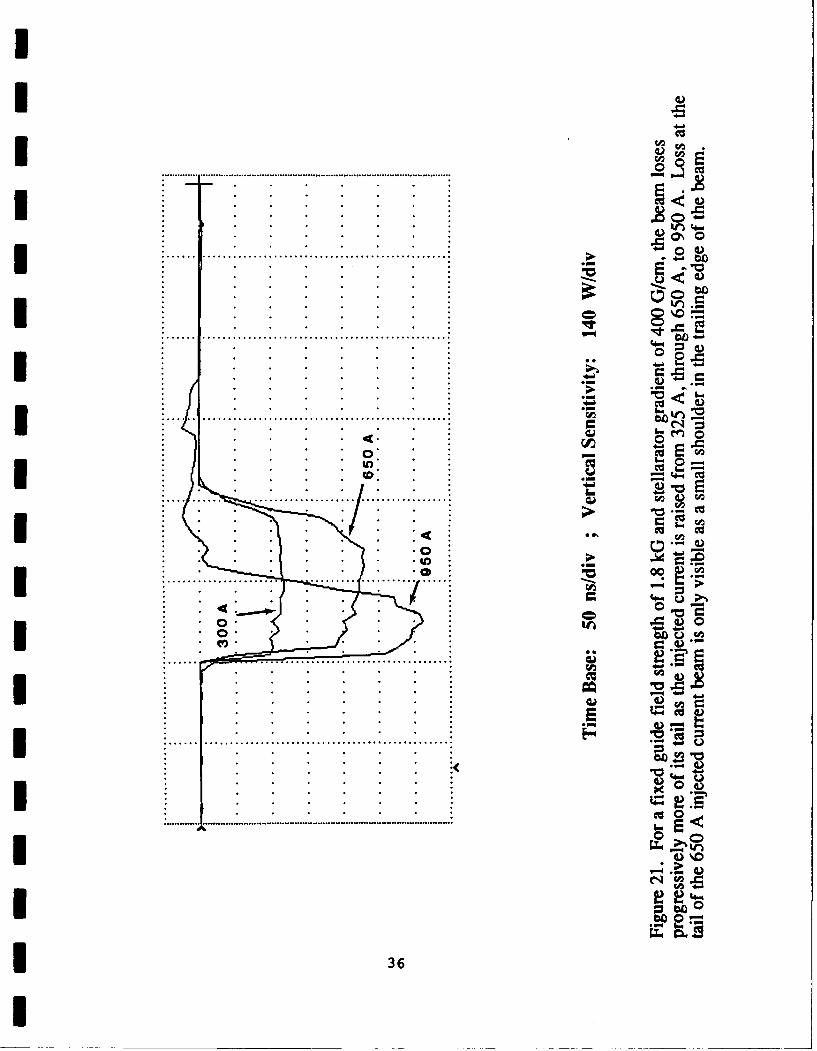
21 Beam tail erosion with increasing current ..................................... 36
I

I LIST OF TABLES
ITale -EM1 Normalized beam emittances (nm cm mrad) ......................... 14
I2 Power growth times................................................... 29
3 Temporal width (ns) of beam pulse passed to Faraday cup ..... 37
1.0 INTRODUCTION
The Spiral Line Induction Accelerator (SLIA)[ 1] is under development as a compact
accelerator potentially capable of accelerating electron beam currents up to about 10 kA to
energies of many tens of MeV. The beam is guided through a few successive transits of
induction acceleration cavities, as illustrated in Figure 1. The desired beam current and
energies make guide field focussing a practical requirement. The open-ended geometry
greatly simplifies injection and extraction of the beam with respect to a closed-orbit geome-
try. Strong focussing in the presence of a guide field is incorporated in the bend sections via
twisted quadrupole ("stellarator") windings superimposed upon a guide field and a vertical
bending field. The concept is a synthesis of ideas from linear induction accelerators, the
recirculation scheme suggested by Mark Wilson[ 2] of NBS (now NIST), and the "stellara-
tor" focussing proposed by Roberson, et al.[3 ]. Each segment of the magnetic channel need
be optimized only for a relatively narrow energy range; there is no need for rapid cycling of
the focussing fields. An accelerator experiment using this principle at the level of 10 kA of
beam current, with an energy of approximately 10 MeV (two acceleration passes) is
I presently in progress to validate the focussing and dispersive characteristics of the SLIA
bends and experimentally determine the consequences of off-axis acceleration of high-
I current beams in induction cavities prior to attempting higher energy through multiple
recirculation passes. The fundamental studies of beam dynamics in stellarator fields car-
ried out under this contract are part of the necessary foundation for further experimenta-
tion and system design.IPrior to this experimental effort, it had been established that a single 180-degree
I stellarator bend magnet could transport a 1.4 kA, 900 keV beam without loss of charge (4.0
kG guide field, stellarator gradients up to 560 G/cm), and that the stellarator fields greatly
I increase the vertical field mismatch tolerance, especially for moderate guide field strength
(,< 10 guide field Larmor periods per 360-degree toroidal revolution, as currently anticipat-
I ed for near-term applicatinns). However, in low guide field measurements (1.87 kG), loss
I!
0
I- 00LL 0 u
0 "D
oo to
CDu(D~
00
o00
-i CD
0 c0
7= IohcmuNI
I-n
I-q
4- 0
000.V
00
_ Cu
-7
uiCu
of the latter portions of the beam had been observed for high stellarator gradients through
an unidentified mechanism. This observation, occurring in a parameter regime predicted
by Hughes and Godfrey[4 ] to be unstable to a three-wave collective mechanism, required
further investigation to determine the mechanism and means of its prevention.
The goals of this effort included quantitative comparison of theoretical and experi-
mental beam centroid offsets as a function of vertical field mismatch and investigation of
the beam tail loss phenomenon. Improved performance of the diode and compression
region was also necessary to improve beam envelope matching and hence the resolution of
time-integrated measurements of the emittance of the beam within the transport channel.
The beam offset for a beam current of 650 A and energy of 820 keV, with a guide
field of + 3 kG and stellarator gradients up to 600 G/cm, was found to agree to within + 3
mm with the calculated offsets over the vertical field mismatch range of ± 15%. This
provides experimental validation of the beam dynamics and centroid motion expected from
I theory. RF observations of the B-dot pickups in the beamline show strong excitation at a
frequency slightly below 3 GHz, in agreement with the Hughes-Godfrey predictions. This
excitation is present for sufficiently high stellarator gradient with electron Larmor rotation
opposite in sense to the quadrupole rotation, and is absent with Larmor rotation in the
I same sense as the quadrupole rotation.
I 2.0 EXPERIMENTAL APPARATUS
I The energy storage for the high voltage pulse power is a six-stage Marx bank, con-
nected through a balanced charging circuit to a 5-ohm, 100 nsec water Blumlein line. This
line is mismatched upward by a 5:3 impedance ratio into a 50 nsec coaxial water line, again
through a 5:3 impedance step-up into a second 50 nsec water line, and finally through a
vacuum insuator with a water resistor (, 40-ohms) in parallel with the , 650-ohm electron
I diode, for a final stage impedance step-up ratio of , 2.7:1. The net voltage step-up of
- 2.3:1 transforms the 500 kV maximum rated Blumlein output to over 1.1 MV. Along the
I3
I

I
water line and Marx tank are several resistive and capacitive monitors to allow characteri-
zation of the pulse power. We have been using up to 400 kV outF:ut from the Blumlein,
obtaining a pulse of up to 900 kV at the diode to enhance the shot lifetime of the velvet
cathode.
IThe main pump for the diode vacuum chamber is a 10-inch cryopump, supplement-
ed by two 501/sec turbopumps for backup and roughing use. The base chamber pressure is
observed to be about lx10 6 Torr. The transport line is directly pumped by the diode
chamber. There is a pressure rise of approximately 2x10 "5 Torr along its 2.8 meter length.
j The transport line consists of a straight tube of length 90 cm and inner diameter 3.48 cm
(1.37 inch), and a 180-degree bend section of radius 0.5 meter (see Figure 2 for the overall
Ilayout). For the RF observations reported here, the Faraday cup was mounted in one of
the older beamline sections, placed downstream from the bend exit. This allowed the
introduction of a B-dot probe array between the bend exit and the Faraday cup. The
straight pipe is surrounded by a two-layer solenoid winding (zero net axial current). The
solenoid coil provides a stand-off between the compression region fields and the bend
section fields. This stand-off also provides a region to check for emittance growth of the
beam due to envelope mismatch and other transients before the beam enters the bend
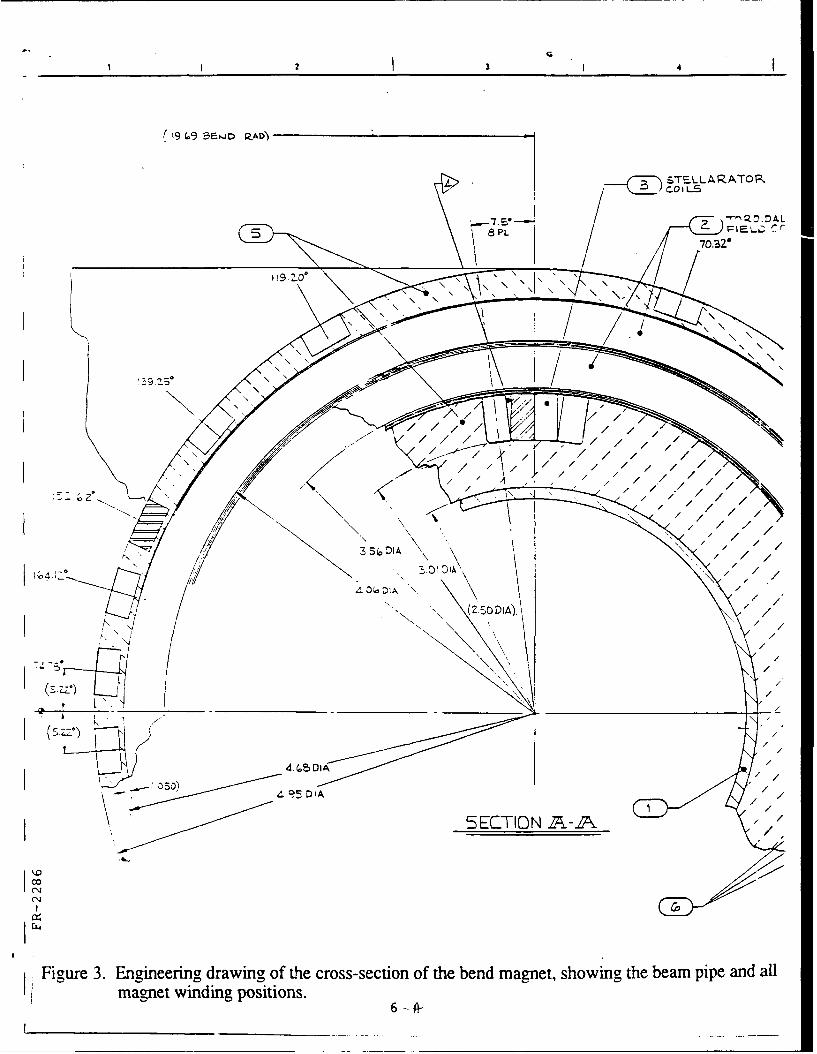
section magnet. The bend section incorporates straight extensions at either end of length
15 cm, and is of nominal inner diameter 6.02 cm (2.37 inch). The bend section magnets
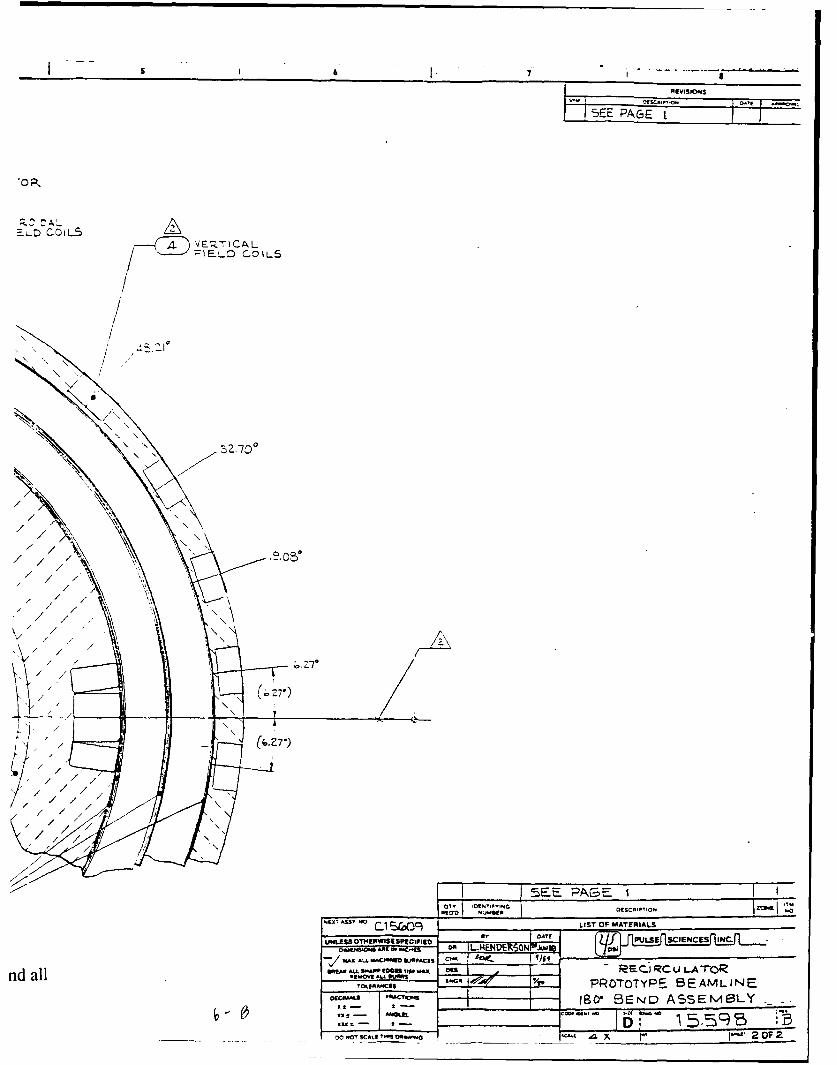
(Figure 3) include a twisted quadrupole winding of pitch length 18 cm and average radius
4.17 cm, surrounded by a two-layer solenoid coil, followed by a vertical field coil designed to
provide a field index of approximately 1/2 over most of the magnet bore. The magnets are
I mounted on a wooden table to avoid magnetic interference from the support structure.
The x-ray shielding in the experimental cell is of lead sheet of thickness 0.8 cm (5/16 inch)
Imounted on a plywood backing. The magnet power supplies are modular electrolyticcapacitor banks[5 ] of 33.6 mF (24 x 1400 pF) capacitance, rated for 450 volts, and may be
Iconnected to charge in parallel and discharge in series.
II4I
0
(IX
Ix
oz ix
2o ~ <
Z -~nlrj
_ _ _ _E.
INcmH
>Ob.
t0
I2 3 I4
1'9 &.9 5F-JD ;ZAD)
=S7ELLARATOR
8PL 7o.32*
i9 2-/
I ,4 /O~o Di/
(2 SD DI/
Z4/
4. &e)DIA
' 1 :)/ A
Figure 3. Engineering, drawingy of the cross-section of the bend magnet, showing the beam pipe and Amagnet winding positions.
REVISIONS
; EL COILS
5Z2.700
'N7
/7-
/G Z
SE PAEDtCUPio\r./o
'rNETAY/ ITO AE IL
nd al(W" L LI.z7/ IP OT T P B A L N
if~ //N> SEML
15,5 / /7,3DO /0 /CAt /- f G ,
Ii
-- At each flange junction for the later experiments there was an assembly of four B-
Idot pickups, equally-spaced azimuthally, to enable monitoring the current and/or x-y posi-
tion of the beam in time. Beam current was also measured by a totally absorbing Faraday
cup, monitored by a stainless steel foil shunt (foil thickness 25.4 micron, overall resistance
72 m). This Faraday cup also served as a beam dump. There were also two capacitive
* monitors in the vacuum chamber for measurement of the diode voltage in the plane of the
cathode field-shaper (Pierce electrode). The overall beam diameter and shape are deter-
mined by imaging the beam on a fused silica Cherenkov convertor. The convertor is also
used to image the beamlets passing through a pinhole array plate in measurements of the
emittance of the beam. The energy of the beam was low enough that the 0.9 mm titanium
of which the pinhole plate is made is range-thick.
The data acquisition system consisted primarily of CAMAC digitizers, supplemented
by oscilloscopes and gated and nongated film cameras. Phenomena occurring on the time
scale of the beam (100 nsec) are recorded on one of four 5 nsec per sample digitizers, while
slower data, such as the magnet bank currents, are recorded by one of 64 channels of digi-
tizer capable of recording as fast as 25 us per sample. Eight channels of intermediate
* speed (as fast as 1 ps per sample) are also used.
i 3.0 DIODE WORK
I The original diode design by PSI, as modeled using EGUN (the Stanford Electron
Trajectory Program) with no external magnetic field, is shown in Figure 4(a). Effecting
i radial compression of a large diameter, divergent beam over a short axial distance by
means of external magnetic fields increases the sensitivity of the optics to chromatic varia-
tions. In order to minimize chromatic variation of the output beam, PSI designed a conver-
gent diode to take advantage of the insensitivity of particle trajectories of nonrelativistic,
space-charge-limited diodes to variation in the applied voltage. By accomplishing a large
transverse compression within the diode, a smaller relative compression remains to be
obtained from external magnetic fields. An EGUN calculation based on this design is
I|

ImI.-4
E0ICI I ~oO
1=
P ... ... ..1 1
I x
IS CI
II
~~4.6
it 0
tC ~0 r4~
I I~III' ~ as
L 6f.4-
_ _ _ _ _ _ _ _ _ _ _ _ _ _ _ _
br r. B

shown in Figure 4(b). This design exploits the fact noted by T. Hughes of Mission Research
Corporation, Albuquerque that matching of a beam into a solenoid channel can be easier if
the scale length of magnetic field variation is considerably shorter than the cyclotron period
of the moving electrons. The small diameter anode tube allows use of smaller diameter
field coils and hence reduces the scale length for changes in magnetic field. An added
benefit is that the stray field variation at the cathode can be smaller than that for a larger
diameter coil the same distance from the cathode. This diode has not yet been tested.
The compression region magnets were originally designed using steady-state mag-
netic fields, ignoring eddy current effects from the pulsed magnets, as a first approximation.
This approximation is reasonable for the thin-walled beamline and connecting flanges, but
fails to account for significant eddy currents in the diode chamber walls. To account prop-
erly for the magnetic field diffusion through the diode chamber, Hall probe measurements
of the field were made at 1 cm intervals along the beamline axis at the time of peak current
for each of the four discrete coils in or adjacent to the chamber. The axial field values were
used in the envelope equation model of the beam compression region by scaling the meas-
ured fields proportionally to the coil currents and summing. When coupled with the flatter
diode voltage pulse (improved under other funding to better than ± 3% over the center 65
nsec of the pulse), the improved beam envelope control enabled time-integrated emittance
measurements with a resolution of approximately ± 10 n cm mrad plus systematic uncer-
tainties from aberrations of approximately ± 20 n cm mrad.
Beam experiments and magnetic field measurements showed that the straight
solenoid magnets fabricated earlier using tubing of the same size as that for the bend
magnet had significant vacuum leaks and magnetic field errors. It was decided to use the
existing diode, converging into a small-bore solenoid, for the remainder of the experiments.
A straight solenoid was wound onto a 3.48 cm inner diameter stainless steel tube of overall
length 90 cm. A second magnet was fabricated after nonuniformities in the first winding
were noted visually and confirmed through magnetic measurements. Visible winding
nonuniformities in the second magnet were avoided through improvements in the fabrica-
9

tion fixtures. Observed beam offsets at the end of the straight solenoid were -. 5-7 mm for
the original, large-diameter solenoid, 3-5 mm for the first small-diameter solenoid, and 1-
2 mm for the second small solenoid, as determined from time-integrated imaging of the
beam on a Cherenkov convertor.
The beam divergence after it enters the anode is typically large enough to require
aperturing the beam to eliminate the outer portion; i.e. the part most subject to aberrations
from the large aperture fields of the first focussing magnets. The aperture is placed at the
mouth of the anode and it affects the beam optics by perturbing the electric fields at the
transition from the diode region into the drift region inside the anode tube. Radius meas-
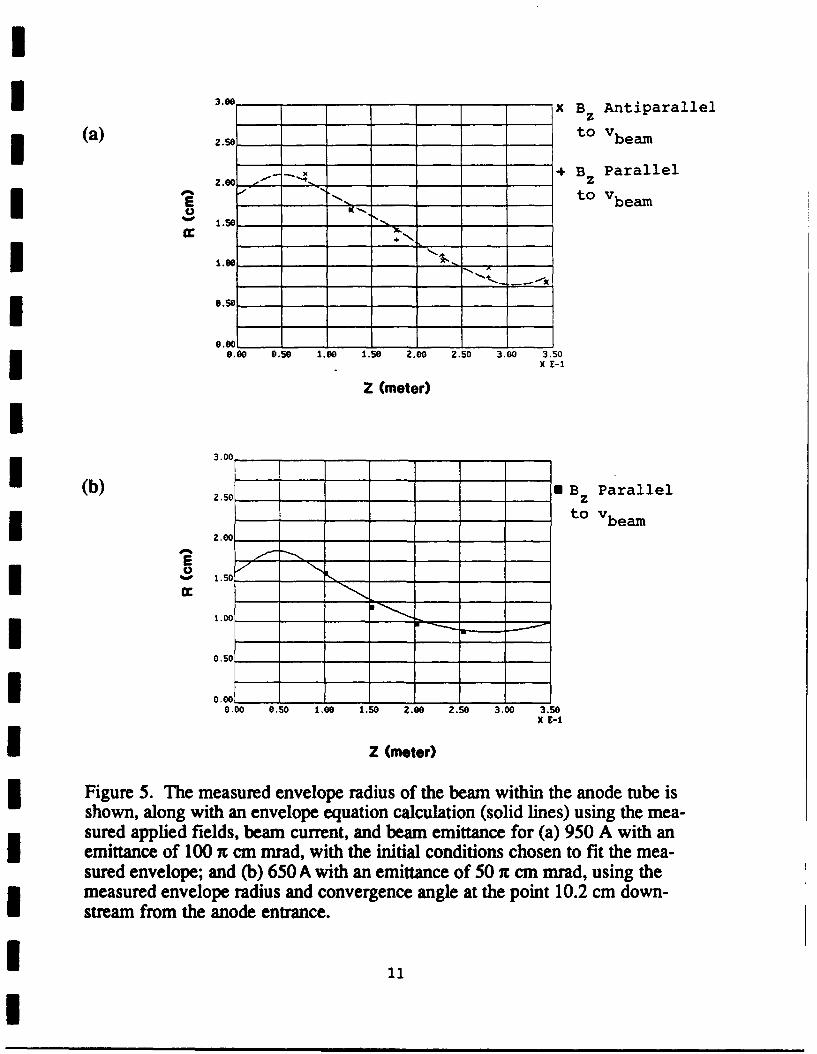
urements of the beam at various locations in the anode tube are shown in Figure 5, for
beam currents of 680 and 950 A. The envelope measurements are in very good agreement
with envelope calculations (also shown in Figure 5) using the measured magnetic fields and
beam emittances. The normalized emittance measured from pinhole array imaging, with-
out correction for spherical aberration (or for non-zero magnetic field off-axis at the cath-
ode) is approximately 23 nr cm mrad for the 650 A beam and 73 n cm mrad for the 950 A
beam. These measurements were made at different times and with different compression
region fields. The corrected normalized emittances are approximately 50 ± 25 nr cm mrad
for the 680 A beam, the uncertainty due largely to spherical aberrations apparent in the
data, and 73 ± 20 n cm mrad for the 950 A beam, thL error being dominated by measure-
ment uncertainty. These values are quoted for approximately twice the RMS half-width in
both angular and spatial distributions.
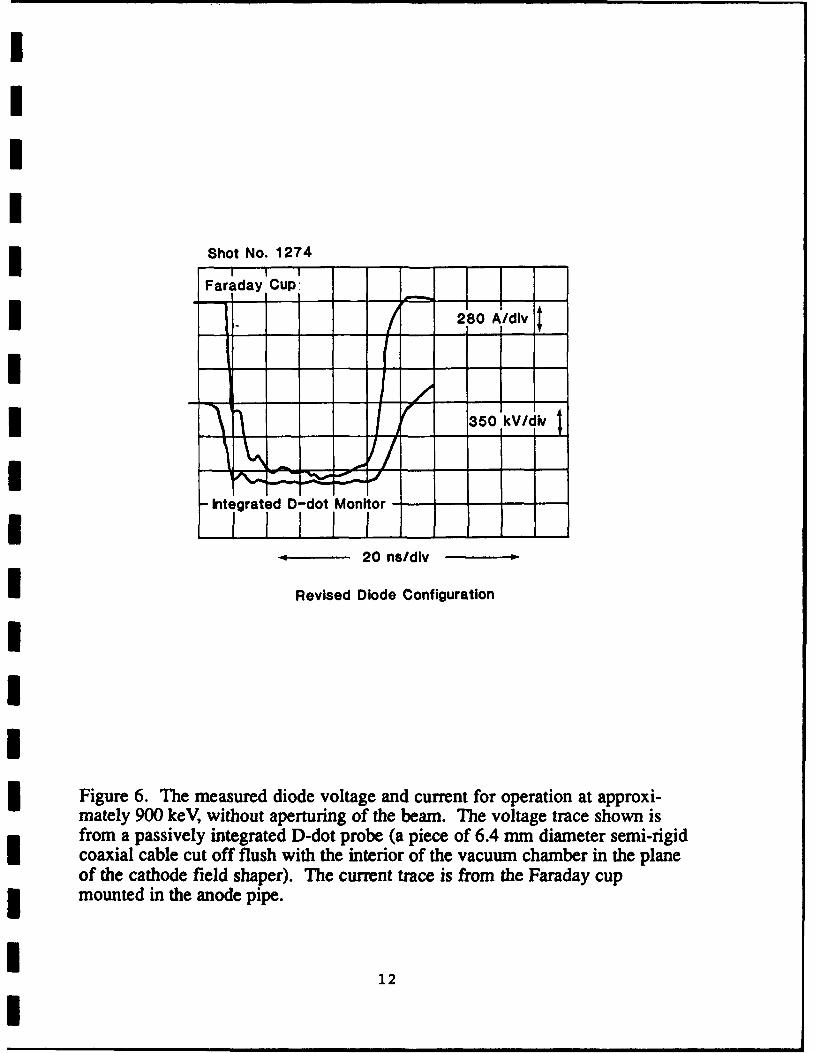
Voltage and current waveforms for the diode are shown in Figure 6. The voltage
trace is measured by an externally integrated D-dot probe. The current waveform is of
slightly shorter duration than the voltage waveforms, indicating a turn-on delay of , 5 nsec
at the present applied field and dV/dt values. The diode has been operated at 1 MV, but
the vacv ,m chamber voltage diagnostics tend to fail as a result of surface emission late in
the main pulse. To reduce field emission from the cathode and minimize post-pulse
damage to the velvet emitter surface, operation has been limited to 900 kV. The injector
10
3.0 X Bz Antiparallel
(a) 2.50 to Vbeam
. ____-4 B z Parallel
E to Vbeam1.50 ".
1.92"0.
*.50
0.00 0.50 1.00 1.50 2.00 2.50 3.00 3.50x E-1
Z (meter)
3.00 ____ ___
(b) _____• B z Parallel
2.00 t-- to Vbea
*%. 1.50 __ k, _
I ~~1.00______
0.50
0.001' 10.00 0.50 1.00 1.50 Z.00 2.50 3.00 3.50
X E-1
Z (meter)
Figure 5. The measured envelope radius of the beam within the anode tube isshown, along with an envelope equation calculation (solid lines) using the mea-sured applied fields, beam current, and beam emittance for (a) 950 A with anemittance of 100 x cm mrad, with the initial conditions chosen to fit the mea-sured envelope; and (b) 650 A with an emittance of 50 x cm mrad, using themeasured envelope radius and convergence angle at the point 10.2 cm down-stream from the anode entrance.
I 11
Shot No. 1274II I I
Faraday Cup-
2'80 A/divIA
* '350 kVIdiv
IIIntegrated D-dot Monitor r
20 ns/div
Revised Diode Configuration
Figure 6. The measured diode voltage and current for operation at approxi-mately 900 keV, without aperturing of the beam. The voltage trace shown isfrom a passively integrated D-dot probe (a piece of 6.4 mm diameter semi-rigidcoaxial cable cut off flush with the interior of the vacuum chamber in the planeof the cathode field shaper). The current trace is from the Faraday cupmounted in the anode pipe.
12
I

IU
now performs well and is capable of supplying up to 1.4 kA (unapertured) for the 80 nsec
central portion of the pulse.
4.0 MAGNET MAPPING
The large-bore straight magnet made under prior funding has been shown under
another contract to have localized transverse perturbations at the level of approximately
I 5% of the axial magnetic field. These perturbations explain earlier observations of beam
offsets at the exit of the straight magnet, and were part of the reason for fabricating a new
I 90 cm solenoid. One major purpose of the straight magnet is to maintain the spatial sepa-
ration of the injector and compression magnets from the bending magnet. The first new
magnet was wound on a stainless steel tube 90 cm long (including flanges), of outer diame-
ter 3.8 cm (1.5-inches) and wall thickness 0.17 cm (0.065 inches), using round magnet wire
I of 0.27 cm diameter (#8 AWG). The windings of the first magnet were not azimuthally
symmetric (the axial component of the current was unevenly distributed around the pipe).
-- The effect of winding asymmetries can be estimated from an ideal solenoid with N turns per
meter, carrying a current of I amperes, superimposed with an equal axial current I distrib-
_ uted uniformly over half of the azimuth of the solenoid, at the winding radius R. Such a
magnet has a net field in the central region of the magnet with a fractional component
I perpendicular to the solenoid axis of
BI/Bz 1 2Nlr2 R
For the 2.05 cm radius of the inner layer of the new solenoid, with no space between the
windings, the fractional error is approximately 1%. This estimate is consistent with meas-
urements made under other funding on this magnet, in which transverse fields on-axis of
1/2% of the guide field were noted.
II 13

I A second magnet was fabricated with the addition of tapered spacers at the ends of
I each winding layer to set the desired pitch from the beginning, and the addition of a layer of
0.25 mm stainless steel shim stock between the layers to prevent the second layer from
I conforming to the (opposite helicity) inner layer, as observed on the first magnet. The
insulation of each layer of magnet wire was protected from the shim stock edges by a layer
of Kapton tape. The uniformity of windings on this magnet was excellent to visual inspec-
tion. The magnet was put into service without additional magnetic measurements, and the
I beam offset at the exit of the solenoid immediately dropped to 1-2 mm from 3-5 mm for the
first small-bore magnet.
5.0 EMITTANCE
Greater stability in the applied voltage and an improved magnetic compression
region have enabled meaningful time-integrated emittance measurements. The values of
emittance at the injector, along with those at the exits of the straight solenoid and bend
sections, both corrected and uncorrected for aberrations, are given in Table 1. The data
indicate that emittance growth may be quite small in stellarator fields, but the cumulative
effect of many focussing transitions is still uncertain. The guide field was -3.0 kG, with a
peak beam current of 680 A and a stellarator gradient of 400 G/cm. (The guide field was
anti-parallel to the direction of propagation of the beam.)
Table 1. Normalized beam emittances (n cm mrad).
Axial Location Uncorrected Corrected
Injector Exit 23 50 +25
Solenoid Exit 32 50 ±25
Bend Exit 30 50 25
14

I6.0 DISPERSION
Dispersive effects in the existing beamline were simulated by mismatching the verti-
cal field to the particle momentum and measuring the resulting beam offset at the exit of
the bend. The diode voltage was measured with a capacitive monitor about 40 cm up-
I stream from the diode. The beam current (680-700 A peak) was measured with a resistive-
ly monitored Faraday cup and monitored for shot-to-shot uniformity with B-dot probes
Imounted between beam pipe segments. A fused silica Cherenkov convertor imaged the
beam for envelope measurements and imaged the beamlets from a pinhole array for emit-
tance measurements. We used a polaroid film camera for time-integrated measurements.
The beam is centered to within approximately 1 mm within the injector and at the
end of the straight solenoid. The beam centroid at the end of the 180-degree curved part of
the bend section is offset toward the major axis by approximately 1.5 mm for a bending field
of 92 G (chosen for vertical centering). Without beam space-charge and self-current cor-
rections, the matched bending field is calculated to be 88 G.
I Mismatching the vertical field results in a vertical drift of the beam as it transits the
bend in the absence of stellarator focussing, resulting in beam spilling off the Faraday cup.I The gross effect of stellarator focussing on the centering of the beam may be seen in Fig-
ures 7 and 8, showing the current at the exit of the bend intercepted on a Faraday cup of
I diameter 5.1 cm in the 6.02 cm diameter pipe, as a function of the vertical field strength for
various stellarator gradients. The data of Figure 7 were taken at an energy of 850 keV, a
guide field of 1.87 kG, and a beam current of 600 A, for stellarator gradients of 0 and 327
G/cm, and a beam current of 300 A for 562 G/cm. As the beam moves off-center and spills
off the Faraday cup, the indicated current on the cup decreases. A gradient of 327 G/cm
significantly broadens the response, showing that the beam is focussed toward the beam
pipe axis by the quadrupole field. When the gradient was raised to 562 G/cm, the last 40 ns
I of the 100 nsec beam pulse was gradually lost. By reducing the size of the aperture at the
anode to decrease the current injected into the channel to 300 A, the full beam pulse width
15
I

1.87 kG GUIDE FIELD
600. -
- [ s~A-oNI Stellarator
- 1+ GradientI i , -- + 0. g/CraW n 327. g/cm
x/ 562. g/cm
I300. - x-., .. AII" .^ - ^" .
* z
1 0. 1 I II
0. 50. 100. 150. 200. 250.
II BENDING FIELD (GAUSS)
Figure 7. Effect of stellarator fields on beam transmission (stellarator focussingprevents beam from scraping the wall).
7 .0 " 1 1 - I , I I
I6.308 X Stellaratoro .68 .3 Gradient:
S4.98 x 0 G/cmI 4.28 .44 "( 4 +L ' 400 G/cm
. 3. SO_ "+ SOO G/cmI2 0. 3._!58I = /.
W2.10- + rM1.48
-1.60 -9.66 -8.20 8.29 8.68 1.0 1.48 1.8 2.28 2.68 3.08
Iv (Gauss x 100)
Figure 8. 900 keV, 700 A beam transport through bend with 3 kG guide field
I for varying bending fields. Stellarator effect becomes noticeable at 500 G/cm'4, when viewing current passband at this guide field level and particle energy.I
16
I
I
Iwas again passed. The beam loss phenomenon is discussed below. The current transmis-
sion through the stellarator bend for the 900 keV, 680 A beam at a guide field strength of 3
kG is shown in Figure 8. The shape of the curves is similar to those of Figure 7, but the
effect of the stellarator field, as expected from calculation, is not as pronounced as it was
for the 1.87 kG example. [The centroid drift with the guide field and vertical field alone is
lsmall for a 900 keV beam at 3 kG guide field.]
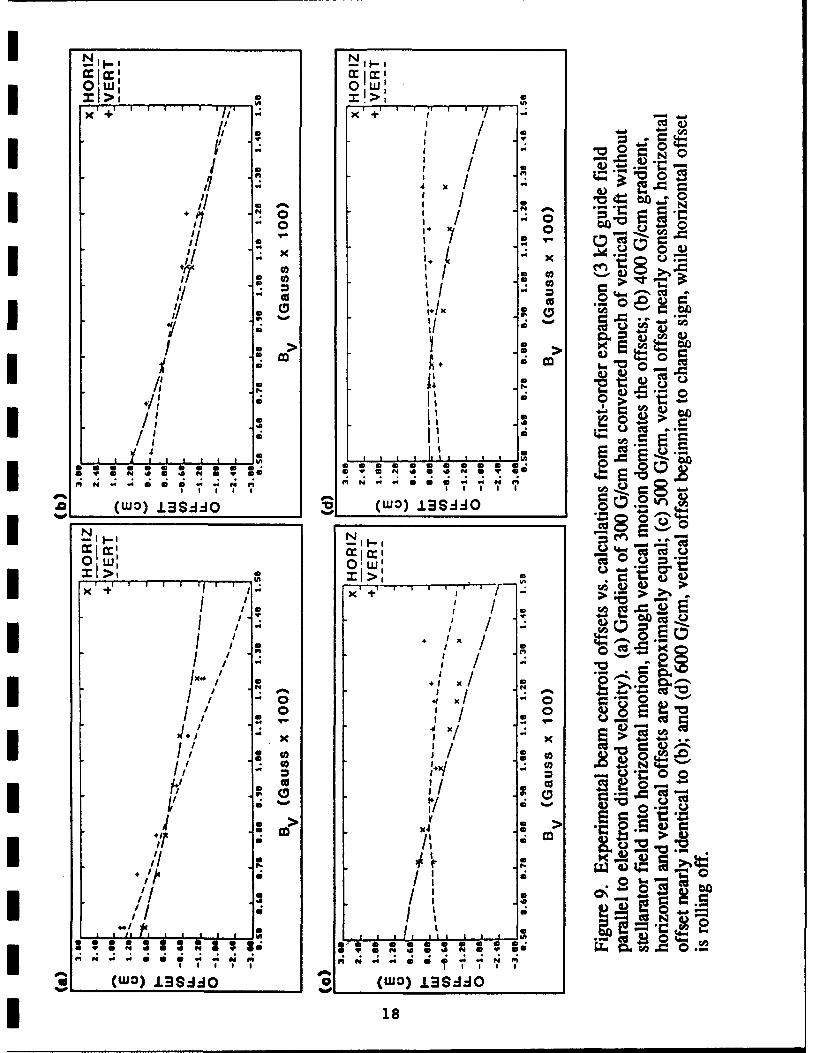
Figures 9(a) through 9(d) show centroid offset measurements and calculated values
for a guide field of 3 kG and stellarator gradients of 300, 400, 500, and 600 G/cm, using
825 keV for the electron kinetic energy. The zero current matched vertical field at this
kinetic energy is 82 G. The offset was measured from open-shutter photographs of a
Cherenkov converter/crosshair assembly inserted into the btamline. The displacements
were calculated using a first-order formalism for the centroid, including wall image forces.
The calculations assume linear focussing forces and are valid for small displacements of the
beam centroid from the axis of the bend and are not accurate very far beyond approximtely
I ± 15% equivalent energy variation (corresponding to vertical field extremes of 72 and
92 G). The reference energy for each value of the vertical field strength is the energy
Imatched to that field. The beam energy is treated as perturbed from the kinetic energy of a
matched beam.IThe beam offset with vertical field mismatch is in the vertical direction for zero
I stellarator gradient. The offset has been rotated into the horizontal plane (the plane of he
bend) by the stellarator field at a gradient of 300 G/cm, as shown in Figure 9(a). The
I horizontal motion increases as the gradient is increased to 400 G/cm (Figure 9(b)), rolling
off through 500 G/cm (Figure 9(c)) and 600 G/cm (Figure 9(d)). The vertical motion is
eliminated near the matched field of 82 G for a gradient of 500 G/cm, reversing sign for 600
G/cm. The agreement of calculation with experiment is very good, especially over the span
of ± 15% about the matched energy.
17
I
N I/ -- -NI: 1/ a:a:I :
i' ::
011 2
*4 E .0II * II 0 2
0 0 0 LJ
*1 1as
* LL
> E
0 (WO) CIMU (WO) LSO____ ____ _______ ____ ___ ~ 0. 18
For the 18 cm winding period of the bend section stellarator coil, a guide field of 3
kG results in a dynamical reduction of the average focussing of the beam centroid because
one of the oscillation frequencies becomes very low. Reversing t¢be guide field shifts this
frequency to higher values, and restores the overall focussing. The comparison is shown in
Figures 10(a) through 10(c). The beam at the bend exit in this reversed configuration is
well centered over an extremely wide range of vertical field mismatch for a gradient of 300
G/cm. [At 300 G/cm, the calculational values are valid only up to -. 130 G.] Within the
bend section the calculated excursion is on the order of 1 cm, however. The agreement
with the first-order calculation is again excellent for the 200 and 300 G/cm gradients over
the ± 15% energy range.
7.0 COLLECTIVE PHENOMENA
In the course of work prior to this program, an unexplained loss of beam was ob-
served in the later portions of the beam pulse when the guide field was oriented parallel to
the direction of electron motion. These experiments were carried out at a guide field of
1.87 kG with a beam current of 600 A and an energy of 850 keV. As the stellarator gradi-
ent was raised above 400 G/cm, an erosion of the tail of the beam began, affecting approx-
imately the final 30-50 nsec of the 100 nsec pulse at a gradient of 560 G/cm. The B-dot
probes near the bend entrance showed evidence of breakdown (discharge) near the end of
the beam pulse, and for a time locally high gas pressure resulting from known small leaks in
the B-dot asssembly was suspected as the cause of beam loss. No beam loss occurred when
the injected beam was apertured to half of its former current. Later work under other
funding established that as much as 1400 A could be transported without loss at a stellara-
tor gradient of 560 G/cm and a guide field strength of 4.0 kG, and that the 1.87 kG loss was
unaffected by lowering the transport line background pressure by an order of magnitude to
.2x10 "5 Torr.
These observations argue for a collective loss mechanism related to the stellarator
gradient. There was a prediction made in 1985 by Hughes and Godfrey[4 ] that a three-
19I

(a) 3. 1 x HORIZ1.86 + VERT.
E 1.z0
-1.20-0 -1.
-. 8 300 G/cm-3.O So I ; iI _ t t
0.50 6.68 0.78 0.80 0.95 T.oo 1.1 1.26 1.30 1.46 I.5B
By (Gauss x 100)
(b) 2.4. ..0- x HORIZ
E 1.20--2.48 B 8 =00c
- b -" .48 " ~- UV.-" 1.68 +VER
E-1.28 -
-1.88 4, ±w --Ix-3.8e B S =2aGc
8.58 8.68 8.78 6.88 8.98 1.88 1.18 1.28 1.38 1.48 1.58BV (Gauss x 100)
() -. 4 xHORIZ
2.48 -B 00 G c
13.88 L+ VERT
B I (Gauss x 100)
3.00us 10
Figure 10. Guide field of 3 kG anti-parallel to electron directed velocity. [Notethat both horizontal and vertical offsets are very small and nearly constant withI a 300 G/cm stellarator gradient (a).] The Larmor rotation of the electrons is inthe same sense as the quadrupole field rotation, with very nearly the same ratefor these parameters.I
20I

wave resonance mechanism might be operative in the focussing regime of the experiment.
Under present funding, radio-frequency power detectors, filters, and attenuators were
obtained to permit measurement and analysis of any high-frequency signals on the B-dot
probes.
The present experiments were carried out at the slightly higher energy of 900 keV
with currents of 325, 680, and 950 A, guide field strengths of 1.2, 1.8, 2.4, and 3.0 kG, and
stellarator gradients ranging up to 600 G/cm. Faraday cup beam current measurements
confirm the tail erosion observed earlier (see below). RF measurements show strong exci-
tation of the beam and of a waveguide mode coupling to the B-dot probes with a frequency
very close to the 2.92 GHz cutoff frequency of the TEll mode in the beamline, in agree-
I ment with the predicted frequency. Diagnostic RF filters used were low-pass filters with
measured -6 dB points of 2.89, 3.14, and 4.23 GHz, and a high-pass filter with a -6 dB point
I of 2.77 GHz. The RF detectors used were HP 8471E planar doped barrier diode detectors
specified for the frequency range 0.01-12 GHz. Characteristics of attenuators and power
tees and were checked for frequencies up to 6 GHz with a Hewlett-Packard 8753C network
analyzer and 85047A S-parameter test set prior to use.I8.0 RF PICKUPI
The B-dot pickups are electrostatically shielded from the beam by mounting them in
an annular housing designed to fit between vacuum flanges of the beamline. There is an
azimuthal slot in the housing to allow penetration of the azimuthal magnetic field they were
I designed to sense, the magnetic field of the beam. The structure around the B-dot probes
affects their pickup characteristics as a function of frequency, in addition to variations due
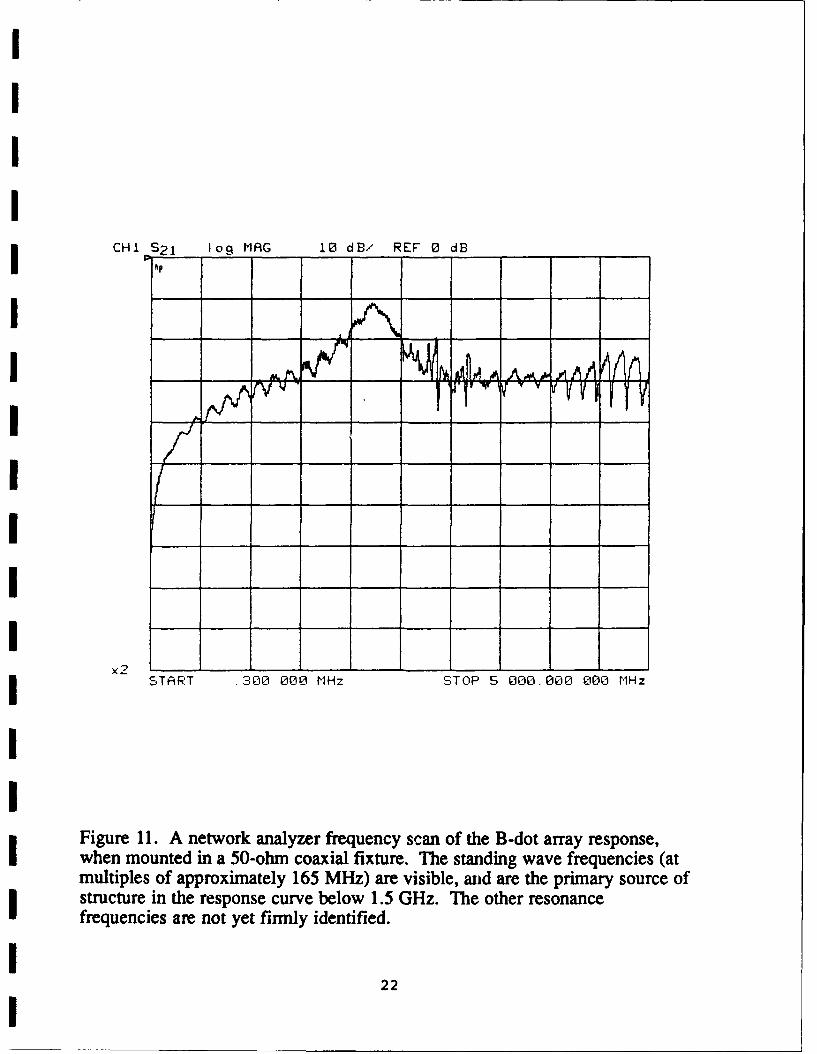
I to stray capacitance and self-inductance. The overall sensitivity is shown in Figure 11, a
frequency sweep of the B-dot response made with a network analyzer with the B-dot array
mounted in a 50-ohm coaxial fixture. The B-dot probe outputs are essentially identical
within a given array. The response is linear in frequency to beyond 1 GHz, except for small
periodic variations (including one at multiples of about 165 MHz, corresponding to the
21I
CHI S2 1 log HAG 10 dB/ REF 0 dB
hpV
x2X
I ,
x2START .300 000 MHz STOP 5 000. 000 000 MHz
II
i Figure 11. A network analyzer frequency scan of the B-dot array response,when mounted in a 50-ohm coaxial fixture. The standing wave frequencies (atmultiples of approximately 165 MHz) are visible, an~d are the primary source of
~structure in the response curve below 1.5 GHz. The other resonancefrequencies are not yet firmly identified.
22
I
TEM standing wave excitations of the measurement fixture). There are significant varia-
tions above 1.5 GHz.
Most of the RF observations were made with a beam current of 950 A, a guide field
strength of 2.4 kG, and a stellarator gradient near 250 G/cm, below the onset of beam loss
at about 400 G/cm for this current and guide field strength. The first set of measurements
was made using a 325 A beam in a 1.2 kG guide field with a stellarator gradient of 400
G/cm, shown in Figure 12. The output from a single exit B-dot was split through a Tee and
fed into two HP-8471E diode detectors. The unfiltered outputs of Figure 12(a) are identi-
cal, and when a 2.77 GHz high-pass filter is put into the signal path for the upper trace and
a 3.14 GHz low-pass filter is put into the signal path for the lower trace of Figure 12(b), the
signals remain closely equal in magnitude. The frequency of the RF is thus between the
2.77 and 3.14 GHz rolloff frequencies of these two filters. In Figure 12(c), the upper trace
has a 4.23 GHz low-pass filter in series, and the lower trace has a 2.89 GHz low-pass filter.
The upper trace amplitude is almost exactly that passed by the two filters of Figure 12(b),
but the trace with the 2.89 GHz low-pass filter passes only about 40% of the power of the
other filter. Thus the frequency should be very close to, and slightly below, 2.89 GHz. The
I only mode able to propagate near this frequency in the 6.02 cm inner diameter (nominal for
the tubing prior to bending) circular beam pipe is the TEll mode, with a 2.92 GHz cutoff
I frequency. In Figure 12(d) the temporal evolution of the RF signal may be seen, synchro-
nized with the integrated signal from the same B-dot. Subsequent time domain measure-
I ments under other funding, using a 6 GHz Tektroniz 7250 single-shot scan conversion digi-
tizer, indicated that the signal is a very pure sine wave of frequency 2.90 GHz (± 2%).
The remainder of the RF data were taken with a beam current of 950 A, a guide
field strength of 2.4 kG, and various stellarator gradients. Figure 13(a) shows the output of
the diode detector (risetime of 2-3 nsec into 50-ohms) for zero stellarator gradient with 36
dB of attenuation and no filtering between the B-dot (at the bend entrance) and the detec-
tor. The large-amplitude transients at the head and tail of the beam are clearly visible, and
the coupled RF power is approximately 10 W. In Figure 13(b), the bend exit beam pickup
23

0.q.
>0
0Q
t4 0
OE 00 0
I 0 0
0 u0
CCA
24

00
"IZ 1, >4o 0C's
4
.8 i* -U.a ll .
E t
S 0 C'
I -~toc.~t U
o - 0
I IL - IL 0
0)
~b
25

is shown with 50 dB of attenuation, without filters, and with a stellarator gradient of 100
G/cm. The steady-state pickup power during the beam pulse is about 30 W. The effect of
adding 2.78 GHz high-pass and 3.14 GHz low-pass RF filters is seen in Figure 13(c), where
the narrow-band signal near 3 GHz for the conditions of Figure 13(b) is seen to be at a
level less than 1 W. Upon raising the stellarator gradient to 200 G/cm in Figure 13(d), the
signal through the 3 GHz filters is clearly visible. With the 50 dB of attenuation in place, the
power level corresponding to the on-screen threshold is approximately 90 W. Unfiltered
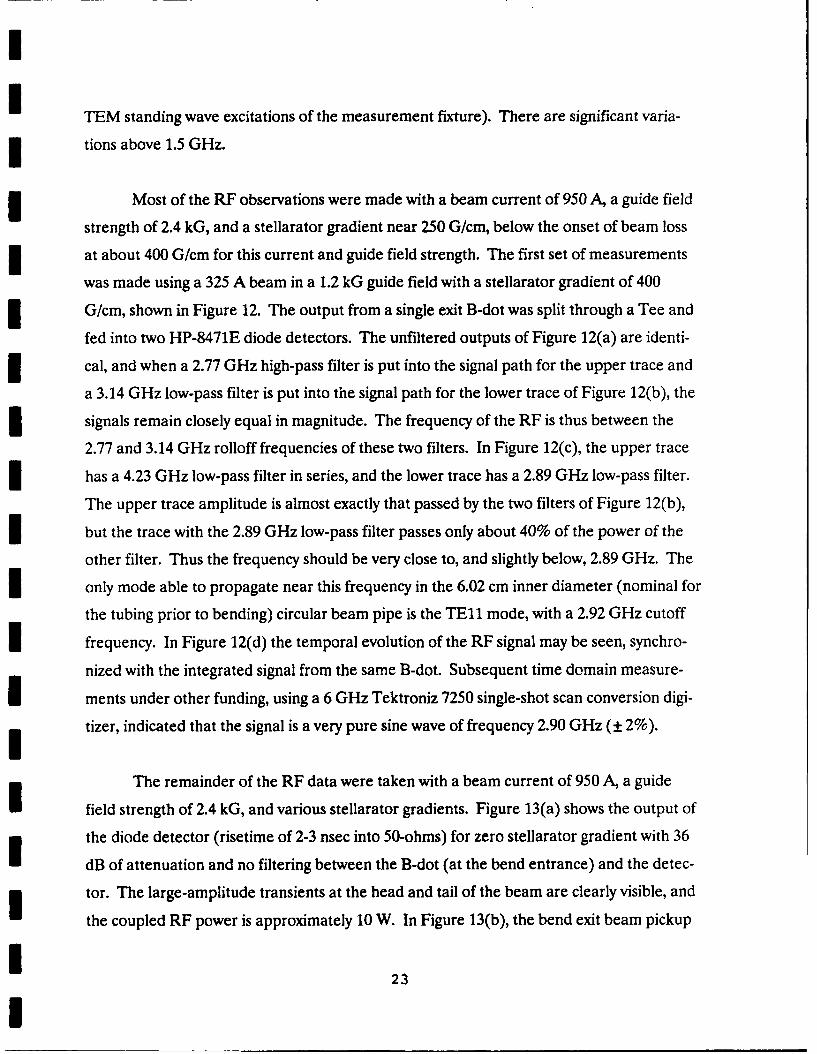
signals from both the entrance and exit B-dots are shown in Figure 14, with 56 dB of atten-
uation on each channel. The beam current is 950 A, with a guide field strength of 2.4 kG
and a stellarator gradient of 250 G/cm. No significant RF power is detected at the entrance
B-dot until after the beam passes by the probe entirely. The peak power at both entrance
and exit B-dot probes is approximately 2000 W. The power detected at the entrance of the
bend is apparently associated with a waveguide mode propagating slowly in the beamline.
If the first pulse seen at the entrance B-dot is a reflection of the power at the exit B-dot (the
major-radius separation of the B-dot assemblies is 188 cm) then the group velocity corre-
I sponding to the , 40 nsec temporal separation in peak power is , 0.16 c. Because the
group velocity vg, cutoff frequency cac, and frequency w of the mode are related through
Vg2I C- i ":
the frequency must then be within about 1.5% of the cutoff frequency of the mode. This is
consistent with the frequency determinations listed above.
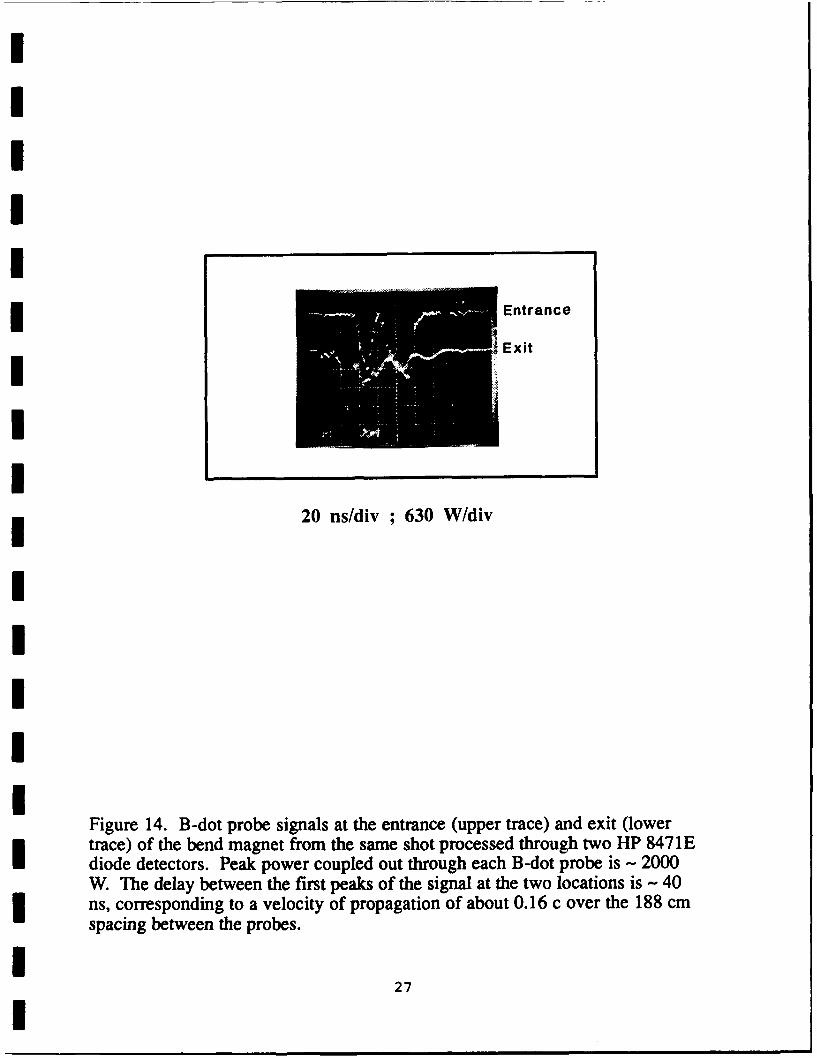
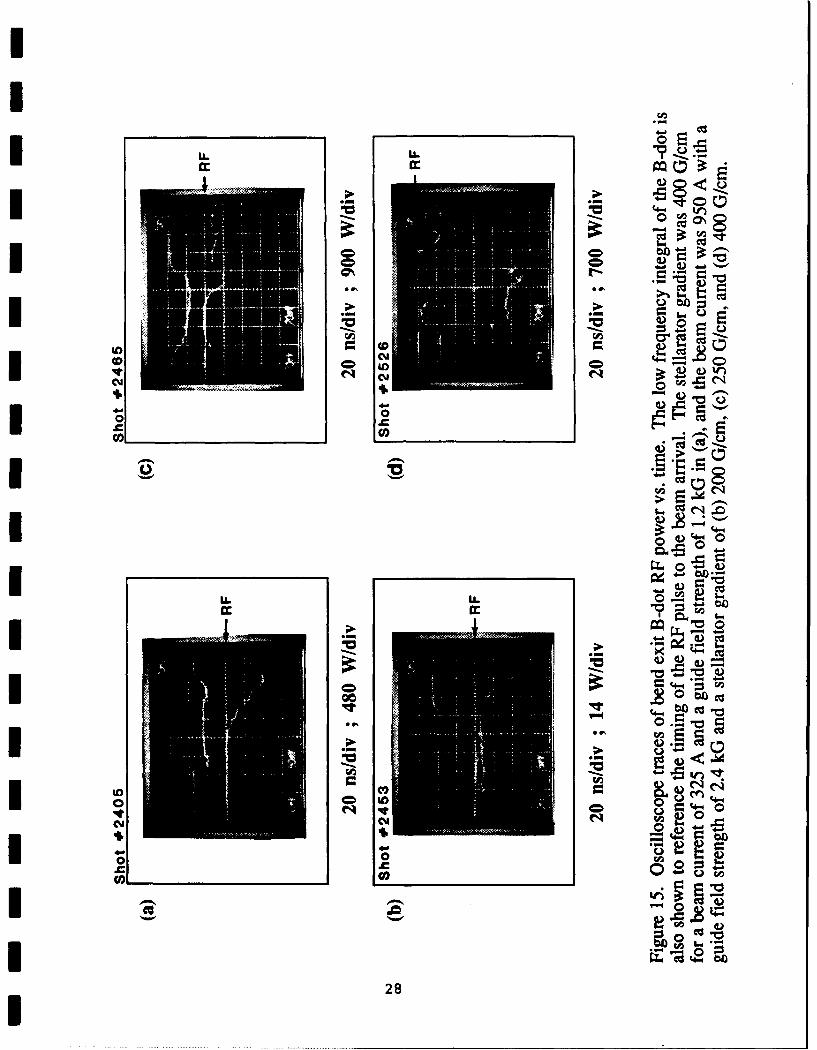
I The temporal growth of signals at the exit B-dot is shown in Figure 15 for various
beam and focussing parameters. In Figure 15(a), the beam current is 325 A, the guide field
strength is 1.2 kG, and the stellarator gradient is 400 G/cm. The growth of the signal is
approximately exponential with a (power) growth time of approximately 18 nsec, half the
growth time of the mode field and beam offset. The rise is uneven, punctuated with a
I plateau in power every 15-20 nsec. This same feature of the RF power versus time is seen in
most of the data, and adds to the uncertainty in the measurement of the growth rate. For a
I
Entrance
20 ns/div ; 630 W/div
Figure 14. B-dot probe signals at the entrance (upper trace) and exit (lowerI trace) of the bend magnet from the same shot processed through two HP 8471Ediode detectors. Peak power coupled out through each B-dot probe is - 2000W. The delay between the first peaks of the signal at the two locations is - 40ns, corresponding to a velocity of propagation of about 0.16 c over the 188 cmspacing between the probes.
27
I CM
U .
00
4-4.
-6-b
In.Ito. co 0c
o~ 0W)I2
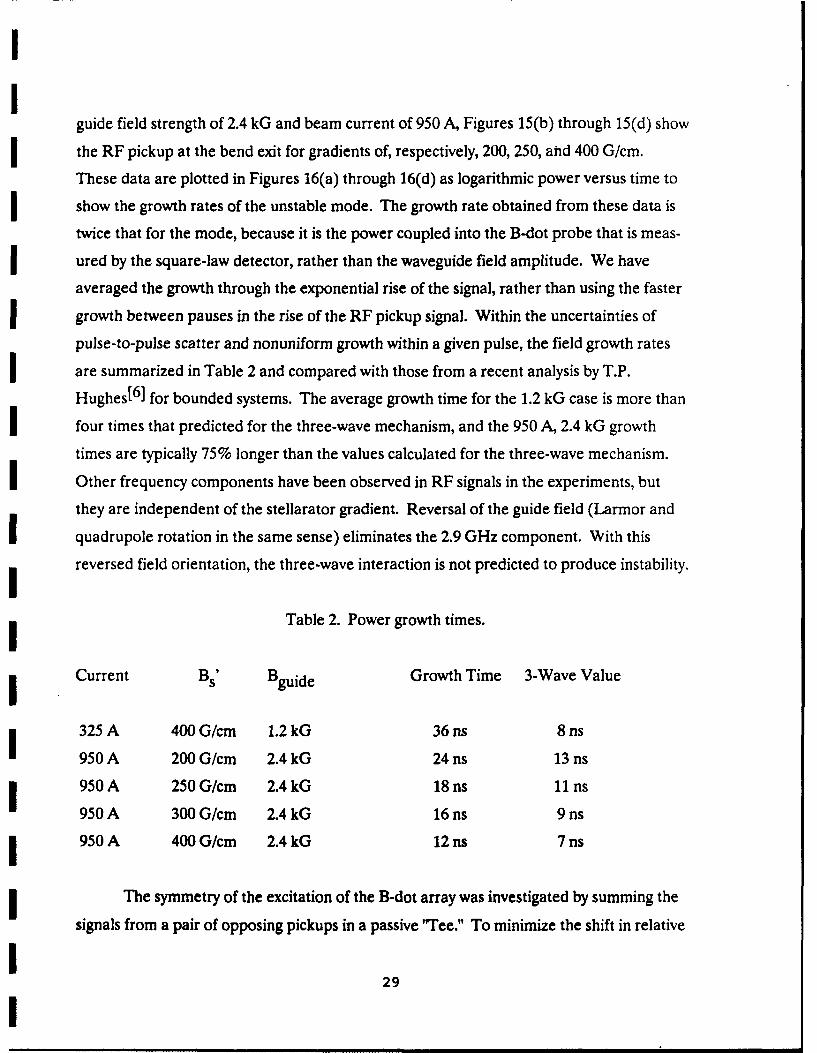
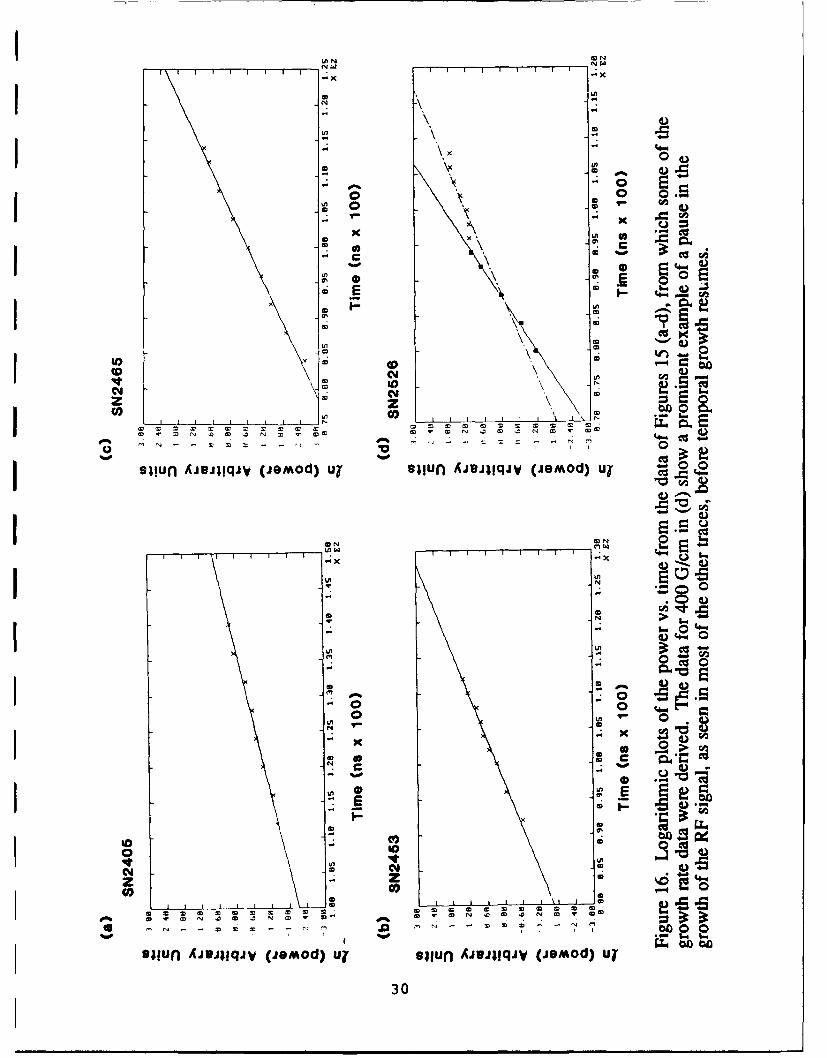
Iguide field strength of 2.4 kG and beam current of 950 A, Figures 15(b) through 15(d) show
I the RF pickup at the bend exit for gradients of, respectively, 200, 250, and 400 G/cm.
These data are plotted in Figures 16(a) through 16(d) as logarithmic power versus time to
show the growth rates of the unstable mode. The growth rate obtained from these data is
twice that for the mode, because it is the power coupled into the B-dot probe that is meas-
ured by the square-law detector, rather than the waveguide field amplitude. We have
averaged the growth through the exponential rise of the signal, rather than using the faster
growth between pauses in the rise of the RF pickup signal. Within the uncertainties of
pulse-to-pulse scatter and nonuniform growth within a given pulse, the field growth rates
are summarized in Table 2 and compared with those from a recent analysis by T.P.
Hughes[6] for bounded systems. The average growth time for the 1.2 kG case is more than
four times that predicted for the three-wave mechanism, and the 950 A, 2.4 kG growth
times are typically 75% longer than the values calculated for the three-wave mechanism.
I Other frequency components have been observed in RF signals in the experiments, but
they are independent of the stellarator gradient. Reversal of the guide field (Larmor and
I quadrupole rotation in the same sense) eliminates the 2.9 GHz component. With this
reversed field orientation, the three-wave interaction is not predicted to produce instability.
I Table 2. Power growth times.
i Current Bs' Bguide Growth Time 3-Wave Value
I 325 A 400 G/cm 1.2 kG 36 ns 8 ns
950 A 200 G/cm 2.4 kG 24 ns 13 ns
I 950 A 250 G/cm 2.4 kG 18 ns 11 ns
950 A 300 G/crn 2.4 kG 16 ns 9 ns
I 950 A 400 G/cm 2.4 kG 12 ns 7 ns
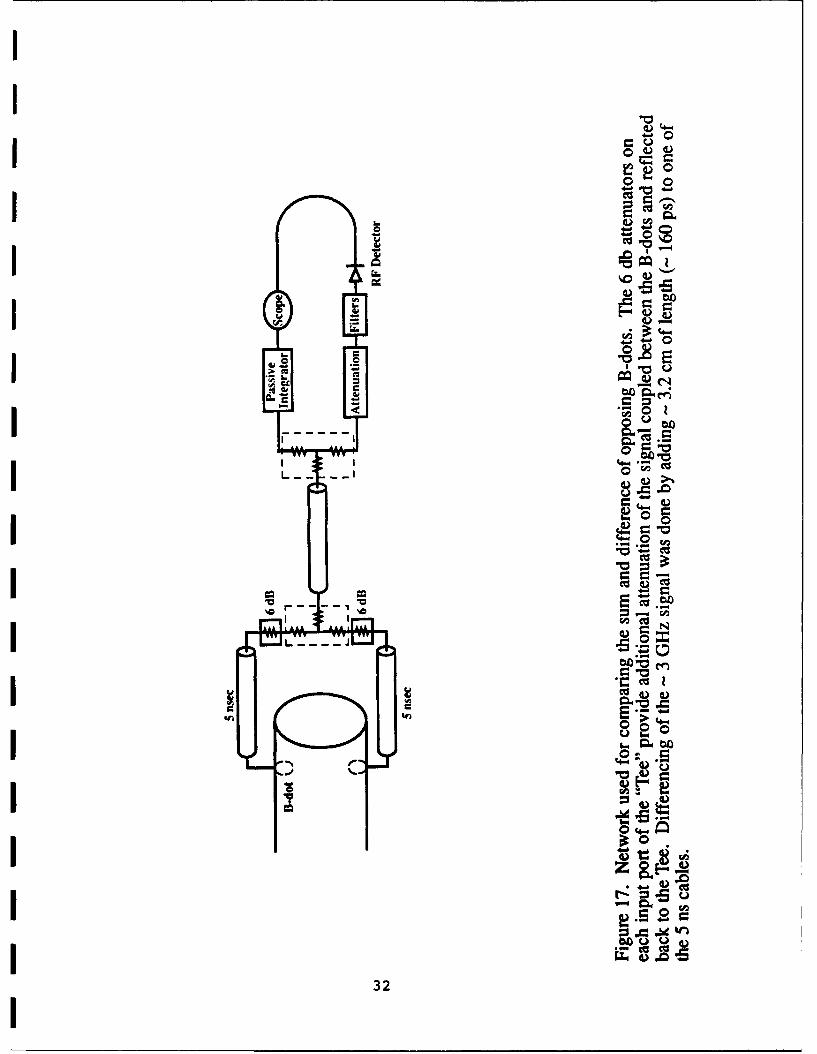
I The symmetry of the excitation of the B-dot array was investigated by summing the
signals from a pair of opposing pickups in a passive 'Tee." To minimize the shift in relative
I29
I
NA N
r -rk oa.)
- ~ ~ACD
* x. 0
CDC
a,
0o
CD) to0
z z = E o N1
I-~t N00--~ 0
I #-%Q 0N
U~(U
-Ea
0 s0
104
300
II
phase of the two signals, short cables (, 5 ns) of equal length to within about 2 mm ( . 10
ps) were used to connect the B-dot probes to a Tee (see Figure 17). One 6 dB attenuator
was incorporated on each input leg of the Tee to reduce by an additional 12 dB the inter-
I ference from signals coupled from one B-dot to the other and subsequently reflected back
to the Tee. The signal from each leg was measured, terminating both the opposing B-dot
and the otherwise open leg of the Tee, and then with both B-dots connected. Finally, a pair
of cables with a length difference of 3.2 cm (160 ps) was used to connect the B-dots to the
Tee, to provide an approximately 180-degree shift in the relative phase of the 3 GHz
components. The results are shown in Figure 18. These traces indicate that the B-dot
I pickup is largely dipole in character, as would be the case for pickup from a coherent beam
oscillation or from the TEll waveguide mode. The out-of-phase power is nearly twice that
of the individual legs, as would be expected for incoherent pickup, but the in-phase sum
power is only 40-50% of the power of either individual leg. These relative powers are con-
sistent with a dominantly dipole excitation with a relative phase shift between the meas-
urements of approximately 100 degrees, rather than the intended 180-degree shift. The
low-frequency integral of the sum signal (proportional to the beam current, approximately)
is independent of the cable-induced phase shift.
9.0 BEAM LOSS
I Examples of beam loss are shown in Figure 19 as a function of guide field strength
for fixed stellarator gradient and current (300 G/cm and 950 A). The guide field was
I oriented parallel to the electron velocity and the beam current was measured using the
Faraday cup. The data of Figure 20 show beam loss for a fixed guide field and current (2.4
kG and 950 A) as the stellarator gradient increases. Figure 21 shows the Faraday cup
response for fixed guide field and stellarator gradient (1.8 kG and 400 G/cm). The beam
loss worsens with increasing current and stellarator gradient, but is stabilized by increasing
guide field strength. Table 3 shows the width of the central plateau of the Faraday cup
I traces for various values of the current, guide field, and stellarator gradient. Without loss,
the plateau is approximately 80 nsec wide. In some high-gradient, low guide field cases, the
I31
I 0
Cc
ooI V -
"L 0 X
CI00
I I .
- U,
32

no >
Eu..
muin0 EU1
rjA
0 0P. .
Im Z
Cu - )
33
II
i .... ................................................o l o : !i.. ............. ............. ...............
.. .... ...
..... ....... . . . . .
34-
. .. .. . . . .. . . . ... . .. . . .. . . . 4.)
.I . .. . . . . . . . . ... .... .. . ........
4)r
34)
IE
* 0)
41 2 EE
:0t 0
o..... .0.0 ... . . ....
.. .. ... ... . . ... . . . . . . . . . .
0 00
I0
I . . 35
as
CIS
*. .. . . . . . . . . . . . . ... . ... .. . . . . .
N-... . .. . . ... . . .. . .. . . . . . . . cuw.
.~r V * c' 0
a) )
................................... .. .. 4
CfC
.a.. .. . 4) a -5q
c 0
co
36
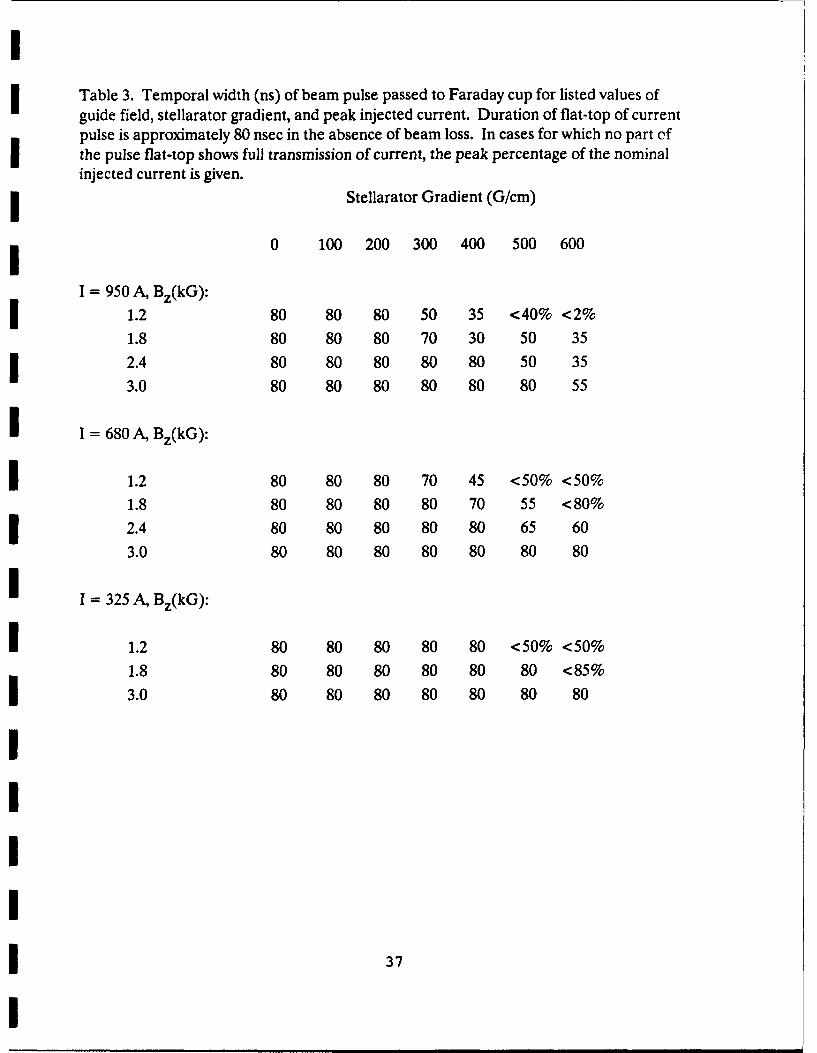
Table 3. Temporal width (ns) of beam pulse passed to Faraday cup for listed values of
guide field, stellarator gradient, and peak injected current. Duration of flat-top of currentpulse is approximately 80 nsec in the absence of beam loss. In cases for which no part ofthe pulse flat-top shows full transmission of current, the peak percentage of the nominalinjected current is given.
Stellarator Gradient (G/cm)
0 100 200 300 400 500 600
I = 950 A, Bz(kG):
1.2 80 80 80 50 35 <40% <2%
1.8 80 80 80 70 30 50 35
2.4 80 80 80 80 80 50 35
3.0 80 80 80 80 80 80 55
I I = 680 A, Bz(kG):
I 1.2 80 80 80 70 45 <50% <50%
1.8 80 80 80 80 70 55 <80%
2.4 80 80 80 80 80 65 60
3.0 80 80 80 80 80 80 80
I I = 325 A, Bz(kG):
I 1.2 80 80 80 80 80 <50% <50%
1.8 80 80 80 80 80 80 <85%
3.0 80 80 80 80 80 80 80
IIIII 37
I
U_ beam transmission is less than unity across the full pulse width of the beam. In these cases,
the peak relative current transmission over the central portion of the beam pulse is given in
U the table. Orbital and mismatch errors may be at fault, because beam is lost irrespective of
the value of the injected current.
10.0 SUMMARY
Under the present effort, the performance of the diode and magnetic compression
regions has been improved, enabling useful comparison of emittance measurements along
the beam channel. These measurements indicate that there is little growth of the emittance
of the beam through the straight solenoid and 180-degree bend magnets, to within . 50%
uncertainty in the measurements. Measurements of the offset of the beam at the end of the
stellarator channel have validated the theoretical formalism used to calculate the beam
dispersion, giving confidence in the methods being used to design future experiments and
project the performance that may be reasonably expected for future applications. Meas-
urements of beam loss at the Faraday cup over a wide range of guide field, beam current,
and stellarator gradient have indicated the presence of a collective beam instability de-
pendent upon the presence of the stellarator focussing field. Measurements of the RF
power coupled out from B-dot probes in the beamline using low- and high-pass filters have
shown that the beam is perturbed at a frequency very nearly that of the cutoff of the TEl 1
mode in the beamline, and that a waveguide mode at this frequency is left propagating in
the beamline after the beam passes. This excitation is absent at low stellarator gradients
and low currents, and is present only for electron Larmor motion opposite to the direction
of rotation of the stellarator winding. Exponential growth times of the RF excitation were
measured as a function of stellarator gradient only for a single value of the beam current
(950 A) and a single guide field strength (2.4 kG), and are consistently 75% longer than
calculated for the instability mechanism of Hughes and Godfrey. The measured growth
time for a 325 A beam in a 1.2 kG guide field with a 400 G/cm stellarator gradient was
approximately four times as long as expected from the three-wave mechanism. No gain
38
I
m measurement was made in the present series of experiments, but it is important that this be
n done in future work.
I 11.0 SUGGESTIONS FOR FUTURE INVESTIGATIONS
3It is of interest to develop means of measuring and tuning the particle oscillation
frequencies in stellarator beamlines. These techniques should have direct application in
the tuning of stellarator fields in accelerator experiments in the near future. Magnetic
measurements must be made to determine to what degree the design fields have been
implemented in the existing beamline magnets, in order to project what level of magnetic
perturbation may be expected in future stellarator beamlines and determine whether fabri-
cation tolerances must be improved to ensure that errors in the particle optics remain
tolerable. It is also desirable, for positive identification of the collective beam loss mecha-
nism observed in the experiments, to measure the gain of the interaction, to make growth
time measurements over a broad range of guide field strengths, and to alter the waveguide
properties of the beamline to determine the frequency dependence of the interaction upon
those properties.
REFERENCES:
[1] Putnam, S.D., Spiral Line Accelerator, U.S. Patent No. 4,870,368; see also S.D.Putnam, 1987 Part. Accel. Conf., IEEE Cat. No. 87CH2387-9.
[2] Wilson, M.A.D., 1981 Part. Accel. Conf., IEEE Trans. on Nuc. Sci. NS-28 (3), 3375.
[3] Roberson, C.W., A. Mondelli, and D. Chernin, Phys. Rev. Lett. 50,507 (1983).
[4] Hughes, T.P., and B.B. Godfrey, Phys. Fluids 29, 1698 (1986).
[5] Curry, R., et al., 6th IEEE Pulsed Power Conference, Arlington, Va., 1987; IEEECat. No. 87CH2522-1, p. 248.
[6] T.P. Hughes, private communication.
39
Top Related