


Languages
Pages
Legal

i
5rd REPORT OF
THE MALAYSIAN REGISTRY
of
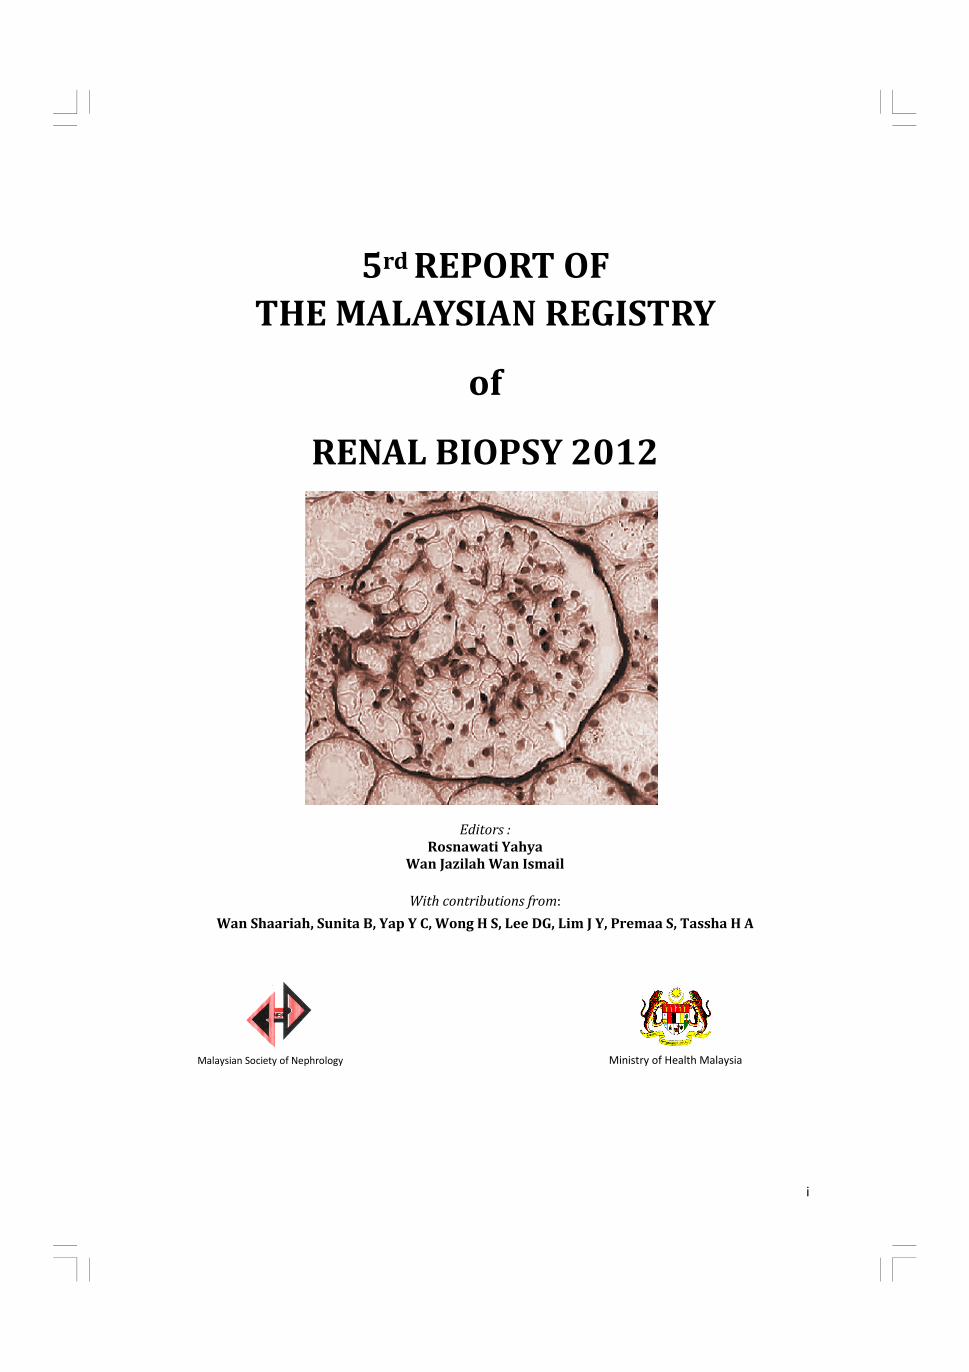
RENAL BIOPSY 2012
Editors :
Rosnawati Yahya
Wan Jazilah Wan Ismail
With contributions from:
Wan Shaariah, Sunita B, Yap Y C, Wong H S, Lee DG, Lim J Y, Premaa S, Tassha H A
Malaysian Society of Nephrology Ministry of Health Malaysia
ii
5rd REPORT OF
THE MALAYSIAN REGISTRY
of
RENAL BIOPSY
2012
Sponsors:
Malaysian Society of Nephrology
The National Renal Registry is funded with grants from:
Roche
Ain Medicare
Baxter Healthcare
Fresenius Medical Care
Lucenxia
The Ministry of Health Malaysia

iii
June 2014
© National Renal Registry, Malaysia
ISSN 1985-6989
Published by:
The National Renal Registry
Malaysian Society of Nephrology
Suite 1604, Plaza Permata
No. 6, Jalan Kampar
50400 Kuala Lumpur
Malaysia
Telephone. : (603) 4045 8636
Direct Fax : (603) 4042 7694
e-mail : [email protected]
Web site : http://www.msn.org.my
Cover illustration by Dr. Nik Hasimah Nik Yahya HKL
Important information:
This report is copyrighted. However it may be freely reproduced without the permission of the
National Renal Registry. Acknowledgment would be appreciated. Suggested citation is:
Rosnawati Yahya, Wan Jazilah W I (Eds) 5th Report of the Malaysian Registry of Renal Biopsy
2012. Kuala Lumpur 2014.
This report is also published electronically on these websites http://www.msn.org.my or https://
www.macr.org.my/emrrb .
iv
The National Renal Registry would like to thank the following:
All the nephrologists and staff of the participating hospitals
For their hard work and contribution,
The Ministry of Health, Malaysia
for support seen and unseen,
For their generous support: -
Roche
Ain Medicare
Baxter Healthcare
Fresenius Medical Care
Lucenxia
The staff of the Clinical Research Centre
&
All who have in one way or another supported the National Renal
Registry.
ACKNOWLEDGEMENTS

v
Clinical Registry Manager Lee Day Guat
Clinical Research Assistant Suhazelini Ali
Choo Cheh Loo
Statistician Adam bin Bujang
Premaa A/P Supramaniam
Tassha Hilda binti. Adnan
Nurakmal Baharum
Members: MSN appointment: Facilities
Datuk Dr. Ghazali Ahmad Chairman Hospital Kuala Lumpur
Dr. Abdul Halim Abd Gafor
University representative
University Kebangsaan
Malaysia Medical Centre
Dr. S. Prasad Menon
Private sector representative
Sime Darby Medical
Centre Subang Jaya
Dr. Ong Loke Meng CRC representative Hospital Penang
Mr. Tam Chong Chiang ADMAN representative Hospital Tg. Ampuan
Afzan
Dr. Lim Yam Ngo MDTR sub-committee Chairperson Hospital Kuala Lumpur
Dr. Wong Hin Seng eMOSS sub-committee Chairperson Hospital Selayang
Dr. Rosnawati Yahya MRRB sub-committee Chairperson Hospital Kuala Lumpur
Dr. Goh Bak Leong MDTR Editor Hospital Serdang
Dr. Rafidah Abdullah Honorary MSN Treasurer Hospital Selayang
NRR ADVISORY COMMITTEE MEMBERS
2012 TO 2014
MRRB WORKING COMMITTEE MEMBERS
Chairperson Dr. Rosnawati Yahya
Members Dr. Lim Soo Kun
Dr. Sunita Bavanandan
Dr. Wan Jazilah Wan Ismail
Dr. Wong Hin Seng
Dr. Yap Yoke Chin
vi
ABOUT MALAYSIAN REGISTRY OF RENAL BIOPSY
Renal biopsy remains the main investigation in the diagnosis of renal diseases. In addition, it plays a
major role in determining the management and prognosis of parenchymal renal disease. The
collection of demographic, clinical and laboratory data at the time of biopsy and the set up of a
database are useful tools for studying renal parenchymal diseases.
The development of a renal biopsy registry in each country promotes many advantages and these
include comparison in incidence of renal diseases, identification of different policies and practices in
renal biopsy in different areas, linkage with other registries such as dialysis or transplant registry and
identification of rare renal diseases. Thus, the registry is a source of epidemiological data and would
provide useful information in the planning of health care and in organizing prospective clinical studies.
The incidence of glomerular disease varies according to population, demographic characteristics,
environmental factors, socio-economic status and the prevalence of infectious diseases. At present,
there is limited information on the prevalence and incidence of glomerular disease, its potential
disease burden and the temporal trend in Malaysia. Hence, the Malaysian Registry of Renal Biopsy
(MRRB) was set up in 2005 to address this deficiency.
The MRRB collects information about patients who undergo renal biopsy in Malaysia. The MRRB is a
new component of National Renal Registry (NRR), which has been operating the Malaysian Dialysis
and Transplant Registry (MDTR) since 1993.
Objectives
The objectives of the MRRB registry are to:
1. Determine the disease burden attributable to glomerular disease (GD) by quantifying its incidence
and prevalence, and its geographic and temporal trends in Malaysia.
2. Identify subgroups in the population at high risk of GD to whom preventive efforts should be
targeted.
3. Identify potential causal and risk factors involved in GD.
4. Describe the clinical presentation and spectrum of GD.
5. Stimulate and facilitate basic, clinical and epidemiological research on GD.
6. Identify causes of allograft failure in our renal transplant population.
7. To audit the renal biopsy procedure, monitor both complications and quality of specimens in
addition to identifying risk factors associated with complications.

vii
Organization
The NRR organization is as follows:
Owner (MSN)
NRR Advisory Committee
NRR co-coordinating office
MRRB Steering
Committee
Sponsors (MSN & MOH)
Source Data Providers Target groups or Users
Owner
The Malaysian Society of Nephrology (MSN) is the owner of this registry.
Sponsors
The MRRB is sponsored by the Malaysian Society of Nephrology (MSN) and the Ministry of Health,
Malaysia.
NRR Advisory Committee
This is the committee established by the sponsors. The NRR Advisory Committee’s role is to ensure
that the MRRB stay focused on its objectives and to assure its continuing relevance and justification.
MRRB Steering Committee
The MRRB Working Committee supervises its operations.
National Renal Registry office
The NRR coordinating office is the designated coordinating center. It coordinates the data collection
among the Source Data Providers (SDPs). It collaborates with Clinical Research Centre of Hospital
Kuala Lumpur that provides epidemiological and statistical support for MRRB.
Source Data Providers (SDP)
These are centres that contribute the required data for MRRB. The SDP collects and enters data
directly through the on-line web-base system. The pilot phase of the registry consists of SDPs from
Ministry of Health.
Throughout this initial phase, we have refined and improved the database. In 2008, the registry is
expanding to a national level to include participation from all nephrologists and renal physicians in
Malaysia who perform renal biopsies. We hope the nephrology community will support us by
submitting information, which is crucial to eventually improve the management of patients with
Chronic Kidney Disease (CKD).

viii
To participate in MRRB
Centres interested to participate in this registry please write in to NRR officially via post or email
The following documents need to be completed and returned to facilitate participation.
• Centre Participation Self Reply Form
• Authorization Form
• Information Security Policy/User Agreement . One form per nominee as listed in the Authorization
form. Users must have a personal mobile phone to received SMS authentication.
Upon receiving these documents, the centre shall be registered and each of the users of the MRRB
shall be notified via their e-mail address.
Methodology
All patients from participating centres who undergo any kidney biopsy (native or graft) are to be
enrolled into the registry.
On-line data submission is through MRRB web application or paper CRF. The data variables collected
include demography, clinical presentation, and indication of biopsy, renal function, and laboratory
data at presentation and at the time of biopsy, serological markers, virology status and
histopathological result. In addition, an update on outcomes in terms of significant end-points such as
end stage renal disease or death will be recorded annually.

ix
List of Source Data Providers Adult Centre Name Sector 1st
Report
2nd
Report
3rd
Report
4th
Report
5th
Report
96 Hospital Angkatan Tentera Lumut Armed forces √ √ √ √
Hospital Pakar Sultanah Fatimah Muar MOH √ √
Kuala Lumpur Hospital MOH √ √ √ √ √
Melaka Hospital MOH √ √ √ √ √
Pulau Pinang Hospital MOH √ √ √ √ √
Queen Elizabeth Hospital MOH √ √ √ √ √
Raja Perempuan Zainab II Hospital MOH √ √ √ √ √
Raja Permaisuri Bainun Hospital MOH √ √ √ √
Sarawak General Hospital MOH √ √ √ √ √
Selayang Hospital MOH √ √ √ √ √
Serdang Hospital MOH √ √ √ √
Sultanah Aminah Hospital MOH √ √ √ √ √
Sultanah Bahiyah Hospital MOH √ √ √ √ √
Sultanah Nur Zahirah Hospital MOH √ √ √ √ √
Tengku Ampuan Afzan Hospital MOH √ √ √ √ √
Tengku Ampuan Rahimah Hospital MOH √ √ √ √ √
Tuanku Ja'afar Hospital MOH √ √ √ √ √
Fan Medical Renal Clinic Private √ √ √ √
Ipoh Specialist Hospital Private √ √ √ √
KPJ Ampang Puteri Specialist Hospital Private √ √ √ √
KPJ Selangor Specialist Hospital Private √
Lam Wah Ee Hospital Private √ √ √ √
Loh Guan Lye Specialist Centre Private √
Metro Specialist Hospital Private √ √ √ √
Normah Medical Specialist Centre Private √ √ √ √
Prince Court Medical Centre Private √ √ √
Sunway Medical Centre Private √ √ √ √
Teo Kidney Specialist Clinic Private √ √ √
Timberland Medical Centre Private √ √ √
Tung Shin Hospital Private √ √ √
Pusat Perubatan Universiti Kebangsaan
Malaysia
University √
University Malaya Medical Centre University √ √ √ √
Universiti Sains Malaysia Hospital University √ √ √
All 13 26 28 30 31

x
CONTRIBUTING EDITORS
Chapter Title Authors Institutions
1 Overview of Renal Biopsy in Malaysia
Wan Sha’ariah Md Yusuf Tuanku Ja’afar Hospital
Lee Ming Lee Tuanku Ja’afar Hospital
Lee Day Guat National Renal Registry
2 Primary Glomerulonephritis Sunita Bavanandan Kuala Lumpur Hospital
Lim Soo Kun University Malaya Medical Centre
3 Secondary Glomerulonephritis Rosnawati Yahya Kuala Lumpur Hospital
Kok Lai Sun Pulau Pinang Hospital
4 Paediatric Renal Biopsy Lee Ming Lee Tuanku Ja’afar Hospital
Lim Yam Ngo Kuala Lumpur Hospital
Lynster Liaw Pulau Pinang Hospital
Susan Pee Sultan Ismail Hospital
Wan Jazilah Wan Ismail Selayang Hospital
Yap Yoke Chin Kuala Lumpur Hospital
Mirunalini A/P Appadurai Likas Hospital
Selvakumar Sivapunniam Tengku Ampuan Afzan Hospital
5 Renal Allograft Biopsy Wong Hin Seng Selayang Hospital
Leong Chong Meng Sultanah Bahiyah Hospital
Report Editors
Rosnawati Yahya
Wan Jazilah Wan Ismail
Paediatric Centre Name Sector 1st
Report 2nd
Report 3rd
Report 4th
Report 5th
Report
Kuala Lumpur Hospital MOH √ √ √ √ √
Likas Hospital MOH √ √ √ √ √
Pulau Pinang Hospital MOH √ √ √ √ √
Selayang Hospital MOH √ √ √ √ √
Sultan Ismail Hospital MOH √ √ √ √ √
Tengku Ampuan Afzan Hospital MOH √ √
Tuanku Ja'afar Hospital (Paed) MOH √ √ √ √ √
7 7 6 6 6

xi
CONTENTS
1
1.1 Introduction 2
1.2 Renal biopsies from the participating centres 2
1.2.1 Ascertainment rate of total biopsy performed 2
1.2.2 Type of renal biopsy performed 2
1.2.3 Number of renal biopsy done on each individual patient 2
1.2.4 Demographic distribution of renal biopsy (Native and Graft) 5
1.2.4.1 Age distribution 5
1.2.4.2 Gender distribution 6
1.2.4.3 Racial distribution 7
1.2.5 Renal biopsy report analysis 7
1.2.6 Histopathology specimen distribution to histopathology laboratories 8
1.3 Native kidney biopsy 11
1.3.1 Clinical Indications of renal biopsy 11
1.3.2 Histopathological diagnosis 12
1.3.3 Histopathology findings in common clinical presentation 14
1.3.3.1 Histopathological diagnosis in patients with nephrotic syndrome 14
1.3.3.2 Histopathological diagnosis in patients with urinary abnormalities 15
1.3.3.3 Histopathological diagnosis in patients with nephritic-nephrotic
syndrome 16
1.3.3.4 Histopathological diagnosis in patients with nephritic syndrome 17
1.3.3.5 Primary GN according to various age group 18
CHAPTER 1 OVERVIEW OF RENAL BIOPSY IN MALAYSIA
CHAPTER 2 PRIMARY GLOMERULONEPHRITIS 19
2.1 Introduction 20
2.2 Minimal Change Disease (MCD) 20
2.2.1 Introduction 20
2.2.2 Patient population and characteristics 20
2.2.3 Clinical presentation 22
2.2.3.1 Clinical presentation by age 23
2.2.3.2 Clinical presentation by gender 26
2.2.4 Outcome of Minimal Change Disease 27
2.3 Focal Segmental Glomerulosclerosis (FSGS) 28
2.3.1 Introduction 28
2.3.2 Patient population and characteristics 28
2.3.3 Clinical Presentation 29
2.3.3.1 Clinical presentation by age 32
2.3.3.2 Clinical presentation by gender 34
2.3.4 Outcome of Focal Segmental Glomerulosclerosis 35
2.4 IgA Nephropathy (IgAN) 36
2.4.1 Introduction 36
2.4.2 Patient population and characteristics 36
2.4.3 Clinical presentation 37
2.4.3.1 Clinical Presentation by age 39
2.4.3.2 Clinical presentation by gender 42
2.4.4 44 Outcome of IgA Nephropathy

xii
2.5 Idiopathic Membranous Nephropathy 45
2.5.1 Introduction 45
2.5.2 Patient population and characteristics 45
2.5.3 Clinical presentation 46
2.5.3.1 Clinical presentation by age 48
2.5.3.2 Clinical presentation by gender 50
2.5.4 Outcome of Idiopathic Membranous Nephropathy 51
CHAPTER 3 SECONDARY GLOMERULONEPHRITIS 53
3.1 Introduction 54
3.2 Lupus Nephritis 54
3.2.1 Introduction 54
3.2.2 Patient population and characteristics 54
3.2.2.1 Age at time of biopsy 55
3.2.2.2 Gender distribution 56
3.2.2.3 Ethnic prevalence 56
3.2.3 Clinical presentation 57
3.2.3.1 Clinical Presentation by age 58
3.2.3.2 Clinical presentation by gender 60
3.2.3.3 Clinical Presentations by histopathology 61 3.2.4 Renal function at presentation 63
3.2.4.1 Renal function at presentation by age group 63
3.2.4.2 Renal function at presentation by gender 64
3.2.4.3 Renal function at presentation by histopathology 65
3.2.5 Histopathological diagnosis 67
3.2.5.1 Histopathological diagnosis by age 67
3.2.5.2 Histopathological diagnosis by gender 68
3.2.5.3 Histopathological diagnosis by clinical presentation 68
3.2.6 Extra-renal involvement 69
3.2.6.1 American Rheumatological Association (ARA) criteria in lupus
nephritis 69
3.2.6.2 ARA criteria in lupus nephritis by age 70
3.2.6.3 ARA criteria in lupus nephritis by gender 70
3.2.6.4 ARA criteria in lupus nephritis by histopathological findings 71
3.2.6.5 Extra-renal involvement 71
3.2.7 Survival in lupus nephritis 73
3.2.7.1 Death in patient with lupus nephritis 73
3.2.7.2 Patient survival in lupus nephritis 74
3.2.7.3 Renal survival in lupus nephritis 74
CHAPTER 4 PAEDIATRIC RENAL BIOBSY 77
4.1 Introduction 78
4.2 Number of patients and renal biopsies 78
4.2.1 Total number of patients and native renal biopsies 78
4.2.2 Number of patients from various hospitals 78
4.2.3 Number of native renal biopsies 78
4.2.4 Number of renal biopsy done on each individual patient 79
4.3 79
4.3.1 Adequacy of renal biopsy for diagnosis 79
4.3.2 Number of glomeruli obtained at each biopsy 79
Outcome of renal biopsies
CONTENT (con’t)

xiii
CONTENT (con’t)
4.4 Patient characteristics 80
4.5 Clinical presentation 80
4.5.1 Clinical presentation at biopsy 80
4.5.2 Renal function at biopsy 81
4.5.3 Hypertension at biopsy 81
4.6 Diagnosis of paediatric renal biopsies 82
4.7 Nephrotic syndrome 83
4.7.1 Renal histopathology diagnosis of children presenting with nephrotic
syndrome 83
4.7.2 The histopathological profile in different steroid response categories 83
4.8 Renal histopathology diagnosis of children presenting with nephritic syndrome 84
4.9 Causes of severe renal failure (needed dialysis therapy) 84
4.10 Paediatric focal segmental glomerulosclerosis and minimal change disease 85
4.10.1 Characteristics of paediatric focal segmental glomerulosclerosis and minimal
change disease among children with steroid resistant nephrotic syndrome 85
4.10.2 Patient survival in focal segmental glomerulosclerosis and minimal change
disease 86
4.10.3 Renal survival of patient with focal segmental glomerulosclerosis and minimal
change disease 87
4.11 Paediatric lupus nephritis 88
4.11 Biopsy failure and complications 88
4.11.1 Total number of patients and renal biopsies 88
4.11.2 Number of renal biopsy done on each individual patient with lupus 88
4.11.3 Patient characteristics of paediatric lupus nephritis 89
4.11.4 Extra renal manifestations of paediatric SLE 90
4.11.5 Classification of paediatric lupus nephritis 90
4.11.6 Patient survival in lupus nephritis 91
4.11.7 Renal survival of patients with lupus nephritis 91
4.12 Renal outcome 91
4.13 Biopsy failure and complication 92
4.13.1 Risk factors for biopsy failure 92
4.13.2 Risk factors for complications 93
References 94
CHAPTER 5 RENAL ALLOGRAFT BIOPSY 95
5.1 Introduction 96
5.2 Number of renal allograft biopsy 96
5.2.1 Number of renal allograft biopsy by year 96
5.2.2 Number of renal allograft biopsy by year and site 97
5.2.3 Number of renal allograft biopsy by year and age group 97
5.3 Clinical presentation at biopsy 97
5.4 Timing of renal allograft biopsy 97
5.5 Renal allograft biopsy Procedure 102
5.5.1 Renal allograft biopsy method 102
5.5.2 Number of passes 102
5.5.3 Number of glomeruli obtained on biopsy 102
5.5.4 Type of complications 102
5.6 Histological diagnosis 106
Appendix I xxiv
Appendix II xxvi
Appendix III xxix
Appendix IV xxiv

xiv
LIST OF TABLES
Page
Table 1.2.1 Total number of renal biopsies performed by centres, 2005-2012 3
Table 1.2.2 Distribution of reported native and graft renal biopsies by centres, 2005-
2012
4
Table 1.2.3 (a) Distribution of native renal biopsy in patients by number of episodes,
2005-2012
5
Table 1.2.3 (b) Distribution of renal allograft biopsy in patients by number of episodes,
2005-2012
5
Table 1.2.4.1 (a) Age distribution of native renal biopsy, 2005-2012 5
Table 1.2.4.1 (b) Age distribution of renal allograft biopsy, 2005-2012 6
Table 1.2.4.1 (c) Age group distribution of reported renal biopsies by state, 2005-2012 6
Table 1.2.4.2 (a) Gender distribution of native renal biopsy, 2005-2012 7
Table 1.2.4.2 (b) Gender distribution of renal allograft biopsy, 2005-2012 7
Table 1.2.4.3 (a) Racial distribution of native renal biopsy, 2005-2012 7
Table 1.2.4.3 (b) Racial distribution of renal allograft biopsy, 2005-2012 7
Table 1.2.5 Number of glomeruli obtained at each biopsy by centres, 2005-2012 8
Table 1.2.6 (a) Distribution of biopsy specimens to histopathology laboratories by
participating centres, 2005-2012
9
Table 1.2.6 (c) Summary of biopsies received by in house and external laboratories,
2007-2012
10
Table 1.2.6 (d) Histopathology laboratories receiving renal biopsy specimens, 2005-
2012
11
Table 1.3.1 (a) Indications for native renal biopsies, 2005-2012 12
Table 1.3.1 (b) Renal function at time of biopsy, 2005-2012 12
Table 1.3.2 Histopathology of all native renal biopsies, 2005-2012 13
Table 1.3.3.1 HPE diagnosis in patients presenting with nephrotic syndrome, 2005-
2012
14
Table 1.3.3.2 HPE diagnosis in patients presenting with asymptomatic urine
abnormalities, 2005-2012
15
Table 1.3.3.3 HPE diagnosis in patients presenting with nephritic-nephrotic syndrome,
2005-2012
16
Table 1.3.3.4 HPE diagnosis in patients presenting with nephritic syndrome, 2005-
2012
17
Table 1.3.3.5 Primary GN according to the various age group, 2005-2012 18
Table 2.1 Primary Glomerulonephritis, 2005-2012 20
Table 2.2.2 (a) Demographic characteristics for MCD, 2005-2012 21
Table 2.2.2 (b) Age group at time of biopsy (years) for MCD, 2005-2012 21
Table 2.2.3 (a) Clinical presentation for MCD, 2005-2012 22
Table 2.2.3 (b) Presence of hypertension in MCD, 2005-2012 22
Table 2.2.3 (c) Renal function in MCD by year, 2005-2012 23
Table 2.2.3.1 (a) Clinical presentation by age group for MCD, 2005-2012 24
Table 2.2.3.1 (b) Hypertension by age group for MCD, 2005-2012 24
Table 2.2.3.1 (c) Renal function at presentation by age group for MCD, 2005-2012 25
Table 2.2.3.2(a) Clinical presentation by gender for MCD, 2005-2012 26
Table 2.2.3.2(b) Hypertension by gender for MCD, 2005-2012 26
Table 2.2.3.2 (c) Renal function by gender for MCD, 2005-2012 27
Table 2.2.4 (a) Patients survival estimates for death in MCD, 2005 2012 27
Table 2.2.4 (b) Renal survival estimates for death in MCD, 2005 2012 28
Table 2.3.2 (a) Demographic characteristics for FSGS, 2005-2012 28
Table 2.3.2 (b) Age group at time of biopsy (years) for FSGS, 2005-2012 29
Table 2.3.3 (a) Clinical presentation for FSGS, 2005-2012 30

xv
LIST OF TABLES (con’t)
Table 2.3.3 (b) Presence of hypertension for FSGS, 2005-2012 30
Table 2.3.3 (c) Renal function in FSGS by year, 2005-2012 31
Table 2.3.3.1 (a) Clinical presentation by age group for FSGS, 2005-2012 32
Table 2.3.3.1 (b) Hypertension by age group for FSGS, 2005-2012 32
Table 2.3.3.1 (c) Renal function at presentation by age group for FSGS, 2005-2012 33
Table 2.3.3.2 (a) Clinical presentation by gender for FSGS, 2005-2012 34
Table 2.3.3.2 (b) Hypertension by gender in FSGS, 2005-2012 34
Table 2.3.3.2 (c) Renal function by gender for FSGS, 2005-2012 35
Table 2.3.4 (a) Patients survival estimates for death for FSGS, 2005 2012 35
Table 2.3.4 (b) Renal survival estimates for death for FSGS, 2005 2012 36
Table 2.4.2 (a) Demographic characteristics for IgAN, 2005-2012 36
Table 2.4.2 (b) Age group at time of biopsy (years) for IgAN, 2005-2012 37
Table 2.4.3 (a) Clinical presentation for IgAN, 2005-2012 38
Table 2.4.3 (b) Presence of hypertension in IgAN, 2005-2012 38
Table 2.4.3 (c) Renal function in IgAN by year, 2005-2012 39
Table 2.4.3.1 (a) Clinical presentation by age group for IgAN, 2005-2012 40
Table 2.4.3.1 (b) Hypertension by age group for IgAN, 2005-2012 40
Table 2.4.3.1 (c) Renal function at presentation by age group for IgAN, 2005-2012 41
Table 2.4.3.2 (a) Clinical presentation by gender for IgAN, 2005-2012 42
Table 2.4.3.2 (b) Hypertension by gender for IgAN, 2005-2012 42
Table 2.4.3.1 (c) Renal function by gender for IgAN, 2005-2012 43
Table 2.4.4 (a) Patients survival estimates for death in IgAN, 2005 2012 44
Table 2.4.4 (b) Renal survival estimates for death in IgAN, 2005 2012 44
Table 2.5.2 (a) Demographic characteristics for IMN, 2005-2012 45
Table 2.5.2 (b) Age group at time of biopsy (years) for IMN, 2005-2012 45
Table 2.5.3 (a) Clinical presentation for IMN, 2005-2012 46
Table 2.5.3 (b) Presence of hypertension in IMN, 2005-2012 47
Table 2.5.3 (c) Renal function in IMN, 2005-2012 47
Table 2.5.3.1 (a) Clinical presentation by age group for IMN, 2005-2012 48
Table 2.5.3.1 (b) Hypertension by age group for IMN, 2005-2012 48
Table 2.5.3.1 (c) Renal function at presentation by age group for IMN, 2005-2012 49
Table 2.5.3.2 (a) Clinical presentation by gender for IMN, 2005-2012 50
Table 2.5.3.2 (b) Hypertension by gender for IMN, 2005-2012 50
Table 2.5.3.2 (c) Renal function by gender for IMN, 2005-2012 51
Table 2.5.4 (a) Patients survival estimates for death in IMN, 2005 2012 51
Table 2.5.4 (b) Renal survival estimates for death in IMN, 2005 2012 51
Table 3.1 Causes of secondary glomerulonephritis in adult, 2005-2012 54
Table 3.2.2.1(a) Age group at time of biopsy (years), 2005-2012 55
Table 3.2.2.1(b) Age group at time of biopsy (years), 2005-2012 55
Table 3.2.2.2 Gender distribution, 2005-2012 56
Table 3.2.2.3 Ethnic distribution, 2005-2012 56
Table 3.2.3 Clinical presentation by year, 2005-2012 57
Table 3.2.3(a) Hypertension by year, 2005-2012 57
Table 3.2.3(b) Renal function by year, 2005-2012 58
Table 3.2.3.1(a) Clinical presentation by age group, 2005-2012 59
Table 3.2.3.1(b) Hypertension by age group, 2005-2012 59
Table 3.2.3.1(c) Renal function by age group, 2005-2012 60
Table 3.2.3.2(a) Clinical presentation by gender, 2005-2012 60
Table 3.2.3.2(b) Hypertension by gender, 2005-2012 61
Table 3.2.3.2(c) Renal function by gender, 2005-2012 61

xvi
LIST OF TABLES (con’t)
Table 3.2.3.3 (a) Clinical presentations by histopathology in lupus nephritis, 2005-2012 62
Table 3.2.3.3 (b) Hypertension by histopathology in lupus nephritis, 2005-2012 62
Table 3.2.3.3(c) Renal function by histopathology, 2005-2012 63
Table 3.2.4.1 Renal function by age group in lupus nephritis, 2005-2012 64
Table 3.2.4.2 Renal function at presentation by gender, 2005-2012 65
Table 3.2.4.3 Renal function at presentation by histopathology, 2005-2012 66
Table 3.2.5 Histopathological diagnosis in lupus nephritis by year, 2005-2012 67
Table 3.2.5.1 Histopathological diagnosis by age group in lupus nephritis, 2005-2012 67
Table 3.2.5.2 Histopathological diagnosis by gender in lupus nephritis, 2005-2012 68
Table 3.2.5.3 Histopathological diagnosis by clinical presentation, 2005-2012 69
Table 3.2.6.1 ARA criteria in lupus nephritis, 2005-2012 69
Table 3.2.6.2 ARA criteria by age group, 2005-2012 70
Table 3.2.6.3 ARA criteria by gender, 2005-2012 70
Table 3.2.6.4 ARA criteria by histopathology, 2005-2012 71
Table 3.2.6.5 (a) Extra-renal involvement by gender, 2005-2012 71
Table 3.2.6.5 (b) Mucocutaneous involvement by gender in lupus nephritis, 2005-2012 72
Table 3.2.7.1 Death in patients with biopsy proven lupus nephritis, 2005-2012 73
Table 3.2.7.2 Patients survival estimates for death in lupus nephritis, 2005-2012 74
Table 3.2.7.3 Death censored renal survival estimates for lupus nephritis, 2005-2012 74
Table 4.2.2 Number of patients from various hospitals 78
Table 4.2.3 Number of renal biopsies 78
Table 4.2.4 Distribution of native renal biopsy in patients by number of attempts 79
Table 4.3.1 Conclusive report 79
Table 4.3.2 Number of glomeruli obtained at each biopsy 79
Table 4.4.1 Gender and racial distribution 80
Table 4.4.2 Age distribution 80
Table 4.5.1 Clinical presentation at biopsy 80
Table 4.5.2 Renal function at biopsy 81
Table 4.5.3(a) Hypertension at biopsy 81
Table 4.5.3(b) Type of antihypertensive drugs 81
Table 4.6 Diagnosis of paediatric renal biopsies 82
Table 4.7.1 Renal histopathology diagnosis of children presenting with nephrotic
syndrome 83
Table 4.7.2 The histopathological profile in different steroid response categories 83
Table 4.8 Renal histopathology diagnosis of children presenting with nephritic
syndrome 84
Table 4.9 Histology finding of children who had severe renal failure (needed
dialysis therapy) who underwent renal biopsy 84
Table 4.10.1 Clinical characteristics of children with steroid resistant nephrotic
syndrome, 2005-2012 85
Table 4.10.2 Patient survival for focal segmental glomerulosclerosis and minimal
change disease, 2005-2012 86
Table 4.10.3 Death-censored renal survival of patient with focal segmental
glomerulosclerosis and minimal change disease, 2005-2012 87
Table 4.11.1 Total number of patient and biopsies (SLE) 88
Table 4.11.2 Distribution of renal biopsy in patients with lupus by numbers of
episodes, 2005-2012 88
Table 4.11.3.1 Gender distribution for paediatric lupus nephritis 88
Table 4.11.3.2 Ethnic distribution for paediatric lupus nephritis 88
Table 4.11.3.3 Age distribution for paediatric lupus nephritis 88

xvii
LIST OF TABLES (con’t)
Table 4.11.3.4 Dialysis therapy for paediatric lupus nephritis at the time of biopsy 89
Table 4.11.3.5 Patient with hypertension (SLE) 89
Table 4.11.3.6 Clinical presentation at biopsy (SLE) 89
Table 4.11.4(a) Clinical presentation of paediatric lupus 89
Table 4.11.4(b) ARA criteria at presentation 89
Table 4.11.5 Classification of paediatric lupus nephritis 90
Table 4.11.6 Patients survival in lupus nephritis 90
Table 4.11.7 Death-censored renal survival of patients with lupus nephritis, 2005-
2012 91
Table 4.12 Causes of end stage renal disease in children who underwent renal
biopsy 92
Table 4.13.1 Frequency of complications 92
Table 4.13.2 Risk factors for complication 93
Table 5.2.1 Number of renal allograft biopsy, 2005-2012 96
Table 5.2.2 Number of renal allograft biopsy by centre, 2005-2012 98
Table 5.2.3 Renal allograft biopsy by year and age group, rate (per million
population), 2005-2012 99
Table 5.3 Indications for renal allograft biopsy, 2005-2012 100
Table 5.4 Timing of renal allograft biopsy, 2005-2012 101
Table 5.5.1 Biopsy method, 2005-2012 103
Table 5.5.2 Number of passes, 2005-2012 103
Table 5.5.3 Number of glomeruli obtained on biopsy, 2005-2012 104
Table 5.5.4 Type of complications, 2005-2012 105
Table 5.6 Histological diagnosis, 2005-2012 105
LIST OF FIGURES
Page
Figure 1.2.6(a) Distribution of biopsy specimens to in house histopathology laboratories
by participating centres, 2005-2012 10
Figure 1.2.6(b) Distribution of biopsy specimens to external histopathology laboratories
by participating centres, 2005-2012 10
Figure 1.3.3.5 Primary GN according to the various age group, 2005-2012 18
Figure 2.2.2 (a) Demographic characteristics for MCD, 2005-2012 21
Figure 2.2.2 (b) Age at time of biopsy (years) for MCD, 2005-2012 21
Figure 2.2.3 (a) Clinical presentation for MCD, 2005-2012 22
Figure 2.2.3 (c) Impaired renal function in MCD by year, 2005-2012 23
Figure 2.2.3.1 (a) Clinical presentation by age group for MCD, 2005-2012 24
Figure 2.2.3.1 (b) Hypertension by age group for MCD, 2005-2012 25
Figure 2.2.3.1 (c) Renal function at presentation by age group for MCD, 2005-2012 25
Figure 2.2.3.2 (a) Clinical presentation by gender for MCD, 2005-2012 26
Figure 2.2.3.2 (b) Hypertension by gender for MCD, 2005-2012 26
Figure 2.2.3.2 (c) Renal function by gender for MCD, 2005-2012 27
Figure 2.2.4 (a) Patients survival estimates for death in MCD, 2005 2012 27
Figure 2.2.4 (b) Renal survival estimates for death in MCD, 2005 2012 28

xviii
LIST OF FIGURES (con’t)
Page
Figure 2.3.2(a) Demographic characteristics for FSGS, 2005-2012 29
Figure 2.3.2 (b) Age at time of biopsy (years) for FSGS, 2005-2012 29
Figure 2.3.3 (a) Clinical presentation for FSGS, 2005-2012 30
Figure 2.3.3 (b) Presence of hypertension in FSGS, 2005-2012 30
Figure 2.3.3 (c) Impaired renal function in FSGS by year, 2005-2012 31
Figure 2.3.3.1 (a) Clinical presentation by age group for FSGS, 2005-2012 32
Figure 2.3.3.1 (b) Hypertension by age group for FSGS, 2005-2012 33
Figure 2.3.3.1 (c) Renal function at presentation by age group for FSGS, 2005-2012 33
Figure 2.3.3.2 (a) Clinical presentation by gender for FSGS, 2005-2012 34
Figure 2.3.3.2 (b) Hypertension by gender for FSGS, 2005-2012 34
Figure 2.3.3.2 (c) Renal function at presentation by gender in FSGS, 2005-2012 35
Figure 2.3.4 (a) Patients survival estimates for death in FSGS, 2005 2012 35
Figure 2.3.4 (b) Renal survival estimates for death in FSGS, 2005 2012 36
Figure 2.4.2 (a) Demographic characteristics for IgAN, 2005-2012 37
Figure 2.4.2 (b) Age at time of biopsy (years) for IgAN, 2005-2012 37
Figure 2.4.3 (a) Clinical presentation for IgAN, 2005-2012 38
Figure 2.4.3 (b) Presence of hypertension in IgAN, 2005-2012 38
Figure 2.4.3 (c) Renal function in IgAN by year, 2005-2012 39
Figure 2.4.3.1 (a) Clinical presentation by age group for IgAN, 2005-2012 40
Figure 2.4.3.1 (b) Hypertension by age group for IgAN, 2005-2012 41
Figure 2.4.3.1 (c) Renal function by age group for IgAN, 2005-2012 41
Figure 2.4.3.2 (a) Clinical presentation by gender for IgAN, 2005-2012 42
Figure 2.4.3.2 (b) Hypertension by gender for IgAN, 2005-2012 43
Figure 2.4.3.2 (c) Renal function by gender for IgAN, 2005-2012 43
Figure 2.4.4 (a) Patients survival estimates for death in IgAN, 2005 2012 44
Figure 2.4.4 (b) Renal survival estimates for death in IgAN, 2005 2012 44
Figure 2.5.2 (a) Demographic characteristics for IMN, 2005-2012 46
Figure 2.5.2 (b) Age at time of biopsy (years) for IMN, 2005-2012 46
Figure 2.5.3 (a) Clinical presentation for IMN, 2005-2012 47
Figure 2.5.3 (b) Presence of hypertension in IMN, 2005-2012 47
Figure 2.5.3.1 (a) Clinical presentation by age group for IMN, 2005-2012 48
Figure 2.5.3.1 (b) Hypertension by age group for IMN, 2005-2012 49
Figure 2.5.3.1 (c) Renal function at presentation by age group for IMN, 2005-2012 49
Figure 2.5.3.2 (a) Clinical presentation by gender for IMN, 2005-2012 50
Figure 2.5.3.2 (b) Hypertension by gender for IMN, 2005-2012 50
Figure 2.5.3.2 (c) Renal function by gender, 2005-2012 51
Figure 2.5.4 (a) Patients survival estimates for death in IMN, 2005 2012 51
Figure 2.5.4 (b) Renal survival estimates for death in IMN, 2005 2012 51
Figure 3.2.2.1 Age group at time of biopsy (years), 2005-2012 55
Figure 3.2.2.2 Gender distribution in lupus nephritis, 2005-2012 56
Figure 3.2.2.3 Ethic distribution in lupus nephritis, 2005-2012 56
Figure 3.2.3 Clinical presentation by year, 2005-2012 57
Figure 3.2.3 (a) Hypertension by year in lupus nephritis, 2005-2012 58
Figure 3.2.3 (b) Impaired renal function by year in lupus nephritis, 2005-2012 58

xix
Figure 3.2.3.1 (a) Clinical presentation by age group in lupus nephritis, 2005-2012 58
Figure 3.2.3.3 (a) Clinical presentations by histopathology in lupus nephritis, 2005-2012 62
Figure 3.2.3.3 (b) Hypertension by histopathology in lupus nephritis, 2005-2012 62
Figure 3.2.4.1 Renal function by age group in lupus nephritis, 2005-2012 64
Figure 3.2.4.2 Renal function at presentation by gender, 2005-2012 65
Figure 3.2.4.3 Renal function at presentation by histopathology, 2005-2012 66
Figure 3.2.5.3 Histopathological diagnosis by clinical presentation, 2005-2012 68
Figure 3.2.6.1 ARA criteria in lupus nephritis, 2005-2012 69
Figure 3.2.6.2 ARA criteria in lupus nephritis by age group, 2005-2012 69
Figure 3.2.6.3 ARA criteria in lupus nephritis by gender, 2005-2012 70
Figure 5.4 Timing of renal allograft biopsy, 2005-2012 101
Figure 5.5.1 Biopsy method (censored for missing data), 2005-2012 102
Figure 5.5.2 Number of passes, 2005-2012 104
Figure 5.5.3 Number of glomeruli obtained on biopsy, 2005-2012 104
Figure 5.5.6 Histological diagnosis, 2005-2012 106
Figure 3.2.3.1 (b) Hypertension by age group in lupus nephritis, 2005-2012 59
Figure 3.2.3.1 (c) Impaired renal function by age group in lupus nephritis, 2005-2012 59
Figure 3.2.3.2 (a) Clinical presentation by gender in lupus nephritis, 2005-2012 60
Figure 3.2.3.2 (b) Hypertension by gender in lupus nephritis, 2005-2012 61
Figure 3.2.3.2 (c) Impaired renal function by gender in lupus nephritis, 2005-2012 61
Figure 3.2.6.4 ARA criteria in lupus nephritis by histopathology, 2005-2012 70
Figure 3.2.6.5 (a) Extra-renal involvement by gender in lupus nephritis, 2005-2012 72
Figure 3.2.6.5 (b) Mucocutaneous involvement by gender in lupus nephritis, 2005-2012 72
Figure 3.2.7.1 Death from lupus nephritis 73
Figure 3.2.7.2 Patients survival estimates for death in lupus nephritis 74
Figure 3.2.7.3 Death censored renal survival estimates in lupus nephritis 75
Figure 4.10.2 Patient survival by focal segmental glomerulosclerosis and minimal
change disease, 2005-2012 86
Figure 4.10.3 Renal survival by focal segmental glomerulosclerosis and minimal change
disease, 2005-2012 87
Figure 4.11.6 Patients survival in lupus nephritis 90
Figure 4.11.7 Death-censored renal survival of patients with lupus nephritis 91
Figure 5.2.1 Number of renal allograft biopsy, 2005-2012 96
Figure 5.2.3 Renal allograft biopsy by year and age group, rate per million population
2005-2012 99
Figure 5.3 Indications for renal allograft biopsy, 2005-2012 100
LIST OF FIGURES (con’t)

xx
REPORT SUMMARY
CHAPTER 1: OVERVIEW OF RENAL BIOPSY IN MALAYSIA
This 5th
report of Malaysian Registry of Renal Biopsy 2012 reports on renal biopsies performed from
1st
January 2005 to 31st
December 2012 .
• There were 45 participating centres from the years 2005-2012.
• In 2012, there were 15 adult and 8 paediatric Ministry of Health centres, 3 universities, 1 army
hospital and 18 private centres.
• There were no new participating centres since 2010.
• There ascertainment rate has improved from 84.5% in 2010 to 95% in 2012.
• 9952 of 11219 renal biopsies that were performed from 2005-2012, were available for analysis.
• 8657(87%) of renal biopsies were done on native kidneys and 1295(13 %) were on renal allograft.
• There appeared to be more repeat graft biopsies in 2011-2012(52%) compared to the 2005-2010
period (42%).
• 66% of native kidney biopsies and 86 % of graft biopsies were done in the 15-45 years age group.
• 14 % of native kidney biopsies were done in paediatric age group less than 15 years.
• As in previous reports, native kidney biopsies were performed in more females (59.5%) compared
to males (40.5%). This ratio remains unchanged since 2005.This was attributed to the higher
number of females amongst patients diagnosed with SLE.
• The opposite was true for renal allograft biopsies where there were 63.5% males compared to
36.5% females.
• There were more Malays (58.1%) followed by Chinese (24.8%) in the native biopsy group. Chinese
(55%) predominates in the renal allograft group.
• Seventy-five percent of biopsies received were conclusive. 24% had less than 10 glomeruli. 1.2
percent was classified as missing because the full HPE reports were not submitted to the registry.
• Fifty one percent of HPE slides were read locally and 48.4 % were sent to another centre. There is
a gradual increase for biopsies to be read in the hospitals where biopsies were performed.
• Nephrotic syndrome was the leading indication for renal biopsy (40.9%) followed by
asymptomatic urinary abnormalities (28.6%) and nephrotic-nephritic syndrome (9.6%).
• The commonest primary glomerulonephritis in adults were minimal change disease (32%) FSGS
(29%) and IgA nephropathy (22%).
• Membranous glomerulonephritis constituted 9% of total primary glomerulonephritis.
• Lupus nephritis was the commonest secondary glomerulonephritis accounting for 80% followed
by diabetic nephropathy at 11%.
• FSGS was the commonest primary glomerulonephritis in children less than 15 years age group
(39.4%) followed by minimal change disease (34.7%)
CHAPTER 2: PRIMARY GLOMERULONEPHRITIS
The commonest primary glomerulonephritis found on adult kidney biopsies 2005-2012 were as
follows: minimal change disease (32%), focal segmental glomerulosclerosis (29%) Ig A nephropathy
(22%) and idiopathic membranous nephropathy (9%).
Caution had to be exercised when interpreting data on BP and eGFR as there were significant trends
of missing data. Five year patient and renal survival rates are presented for the first time in this 5th
report.

xxi
Minimal Change Disease
• Accounted for 32% of total primary glomerulonephritis.
• 70% of patients present in the 15 to < 25 and 25 to < 35 age groups.
• There was a higher incidence of minimal change disease in males (65%) compared to females but
there were no racial predilection.
• Nephrotic syndrome was the commonest clinical presentation at 78%.
• Most patients have normal BP (74%) and preserved renal function ( 73%) at presentation.
• The 5 year patient and renal survival was 94% and 98% respectively.
Focal Segmental Glomerulosclerosis
• Accounted for 29% of total primary glomerulonephritis.
• The mean age at presentation was 34.4 + 14.6 years.
• Fifty- nine percent presented with nephrotic syndrome.
• The prevalence of hypertension and impaired renal function increased with age.
• The 5 year patient and renal survival was 86% and 87 % respectively.
IgA nephropathy
• This constituted 22% of primary glomerulonephritis
• 31.3% are between the ages of 15 to 45 years
• There is slight female preponderance (54% vs. 43%) which is contrary to what is reported in
literature
• Asymptomatic urine abnormality remains the most common presentation. (51%)
• Hypertension is seen in 44 .4% and eGFR < 60ml/min/1.73m2 is observed in 47.1% at
presentation.
• 5 year patient and renal survival were 93% and 78% respectively.
Idiopathic membranous nephropathy
• This constituted 9% of primary glomerulonephritis.
• The mean age at presentation is 45.30 + 14.97.
• There were no gender differences but there is a predilection for Chinese race.
• Sixty-seven percent presented with nephrotic syndrome.
• Hypertension was observed in 24.8% and renal impairment was seen increasingly as age
advances.
• 5 year patient and renal survival were 85% and 92% respectively.
CHAPTER 3: SECONDARY GLOMERULONEPHRITIS
The commonest secondary GN reported was lupus nephritis. Diabetic nephropathy was the second
commonest glomerular disease reported.
Lupus nephritis
• Accounted for 81% of total secondary GN.
• Mean age at the time of biopsy in adult lupus nephritis was 30.3 ± 10.7 years.
• Male to female ratio was 1 to 6.6
• Urine abnormality (35%) was the commonest clinical presentation followed by nephrotic
syndrome (27.5%).
• The commonest histopathological finding was WHO or ISN/RPS class IV or IV+V (61.3 %).
• There was no clear correlation between histopathological findings and clinical presentation.
However, class IV or class IV+V were more likely to present with symptomatic renal disease.
REPORT SUMMARY (con’t)
xxii
• The prevalence of hypertension was higher in class IV or class IV +V.
• The prevalence of impaired kidney function correlated with histopathological findings. Class IV
was more likely to have impaired renal function.
• About 60% of cases with lupus nephritis fulfilled 4 or more American Rheumatological Association
(ARA) criteria at presentation.
• Fulfilling the ARA criteria does not predict the severity of renal lesion
CHAPTER 4: PAEDIATRIC RENAL BIOPSY
• 1224 renal biopsies were performed in 1113 children over a span of 13 years from 1999 until
2012.
• 95.6% of paediatric kidney biopsies were assessed to be adequate. This success is comparable to
reports from Thailand, United Kingdom and Japan.
• There were slightly more girls (50.8 %) and this was attributed to the higher number of girls
biopsied in the SLE group.
• The mean age at biopsy was 9.8+ 4 years.
• The racial distribution was as follows: Malays (64%) Chinese (19 %) and Indians (7.1%)
• 37.2% were hypertensive at presentation. Calcium channel blockers and ACE inhibitors were the
commonest anti-hypertensives prescribed.
• Nephrotic syndrome (50%) was the most frequent clinical diagnosis at presentation. Lupus
nephritis contributed the largest group at 25 % followed by FSGS (21.4%) and minimal change
disease (20.5%).
• When comparing FSGS and minimal change disease, FSGS had lower renal survival at 5 years. The
renal survival for this group was 88% and 80% at 3 and 5 years respectively, whereas in the
minimal change group the 3 and 5 years survival was 95% and 92% respectively.
• Patient survival was 91% and 87% at 3 and 5 years for FSGS group and was 96% and 91% at 3 and
5 years for minimal change group.
• In the paediatric lupus group that were dialysed at the time of biopsy the commonest HPE on
biopsy was class IV or class V+IV.
• Renal survival for patients with lupus nephritis was 95.5% and 93.3% at 3 and 5 years respectively.
• 116 children were reported to the Malaysian Dialysis and Transplant Registry. The commonest
causes of ESRD were FSGS (31.9%) advanced glomerulosclerosis (18.1%) lupus nephritis (11.2%)
and IgA nephropathy. (9.5%)
CHAPTER 5: RENAL ALLOGRAFT BIOPSY
• The number of renal allograft biopsy reported has increased despite a decreasing number of new
and existing renal transplant recipients for the past 8 years.
• Seventy-three percents of all renal allograft biopsies were performeds in the four main transplant
centres which are Hospital Kuala Lumpur, Hospital Selayang, Universitity Malaya Medical cente
and Prince court Medical Centre.
• Seventy-one percent of renal allograft biopsies were performed in the age group 25 to < 55 years.
• Gradual graft dysfunction as an indication for biopsy has increased 34.7 % in 2005 to 66.1% in
2012 (2 fold increase)
• About 40% of renal allograft biopsies were performed one year post renal transplantation.
• Rejection (acute and borderline) has remained the most common histological diagnosis and
accounted for more than half of all allograft biopsies that were reported in 2012.
• The increasing trend of allograft biopsies with histological diagnosis of acute rejection appeared to
have plateaued off in the last 2 years and in 2012 accounted for 38.3%.
REPORT SUMMARY (con’t)
Top Related