![The Complete Book on Spices & Condiments (with …NIIR] The Complete Book on...The Complete Book on Spices & Condiments (with Cultivation, Processing & Uses) ... Essential (Volatile)](https://static.fdocuments.in/doc/165x107/5aec2c777f8b9a90318de8eb/the-complete-book-on-spices-condiments-with-niir-the-complete-book-onthe.jpg)
![project report FINA SHABIJA14[1]INOVERin · Primary competitive it ensures clean and hygiene price quality and ... Product range quality products, spices, spices mix, mineral water,](https://static.fdocuments.in/doc/165x107/6085a97195199d00465aab23/project-report-fina-shabija141inoverin-primary-competitive-it-ensures-clean-and.jpg)


Languages
Pages
Legal


1
Chapter-1
Research Methodology

2
RESEARCH METHODOLOGY
1.1 Problem Statement
The project Study aims to conduct drive retail initiatives in Ahmedabad city, and to
measure its impact on sales for Ramdev foods products Pvt. Ltd. The research is
exploratory in nature and quantitative research tools to be used for data collection &
analysis the data will be collected from the survey of the grocery retailers who sell
Ramdev products.
How the Channel Sales management is working in Ramdev foods private ltd.
How does Proper Channel Sales management affect the sales?
How does channel design make any difference?
How availability and distribution network spices affects on its sales and
satisfaction of retailers?
Effect of waiting time after ordering on the retailers as well as on sales?
How layers of distribution network affects on the availability and sales of the
product?

3
1.2 RESEARCH OBJECTIVES
Primary Research Objectives
To identify service GAP areas To measure availability of the Ramdev product portfolio & identify reasons for non-
availability and suggest ways to improve.
Secondary Research Objectives:
To find out the Retailer’s preference and behavior in terms of selling and promotion of
Ramdev products with reference to its distribution networks strength.
To identify the influence of dealer’s or big retailers in selling of Ramdev products over
the end consumers.
To find out the reasons for not attaining in some products. (Like Ramdev Hing etc.) in
accordance with the availability of other products instead of Ramdev spices and instant
mix.

4
1.3 Method of Data collection
We opted for a descriptive research type to achieve the above stated research objectives.
Sampling:
Sample Design: The sample design for this project was a non probability Sampling
Design. Under the non probability Sampling Techniques, judgmental Sampling method is
to be implemented.
Sample Size: 400 Grocery Retailers
Qualified Sample: 335
Sample Unit: Owner of the retail grocery shop
Sampling Method: Non-Probabilistic Convenience sampling for
Respondents Sampling Unit
Sample Geography: Grocery retailers of Ahmedabad city
Data Collection Source:
Primary data: Primary Data was collected with the help of survey & questionnaires.
Secondary data: The secondary data was collected through journal, magazines and web
portals.

5
1.4 Questionnaire Design
The questionnaire has been design as per the concept of the questionnaire design.
Following are the objective and sub objectives of the questionnaire:
Objective:
To study the availability of Ramdev products at different retail stores with reference to
particular products.
Selecting product categories
Customer demographic segmentation
Sorting the questions in logical sequence
Selecting & Coding the responses
Sub-objectives:
To study the impact of promotional activities on purchase behavior of buyers.
To study the preference given to different brands of spices as per their age and income.
To study the brand loyalty of buyers.
Ranking questions and preferential questions used in the questionnaire.
A copy of questionnaire is included in annexure at the end of the report.
1.5 Data Analysis Methods
Hypothesis testing by Z test
Perceptual mapping
Charts

6
1.6 SCOPE OF THE RESEARCH
The scope of the research is limited in the following directions.
The geographic scope is limited to Ahmedabad city only.
The industry scope is limited to grocery retail sector & Private Labels only, the
unorganized sector which is a major chunk is kept out of the scope.
The product category scope is limited to the selected categories selected on the basis of
availability.
The time scope is limited to 6 months which is the duration for the project

7
Chapter-2
Industry Overview

8
9
2.1 Introduction to the Industry
The Story of Indian spices is more than 7000 years old. The fame of Indian spices is older than
the recorded history. Centuries before Greece and Rome had been discovered, sailing ships were
carrying Indian spices, perfumes and textile to Mesopotamia, Arabia and Egypt. It was the lure of
these that brought many seafarers to the shores of India.
Long before Christian era, the Greek merchants thronged the markets of South India, buying
many expensive items amongst which spices were one. Epicurean Rome was spending a fortune
on Indian spices, silks, brocades, Dhaka Muslin and cloth of gold, etc. It is believed that the
Parthian wars were being fought by Rome largely to keep open the trade route to India. It is also
said that Indian spices and her famed products were the main lure for crusades and expeditions to
the East.
Today when spices cost so little, it seems unbelievable that they were once a royal luxury and
those men were willing to risk their lives in quest of them. Though there were the Dark Ages, but
there were rich people who had gold to exchange for pepper and cinnamon. It was in the year
1492 A.D., that Christopher Columbus discovered the New World. Five years later, four tiny
ships sailed southward from the port of Lisbon, Portugal, under the guidance of Captain Vasco
Da Gama. Like Columbus, Vasco Da Gama too was searching for a new route to the spice lands
of Asia. While Columbus failed to achieve the goal, Da Gama succeeded. In a two year, 24,000
miles round trip, he took his ships around the continent of Africa to India and back to Lisbon.
Only two of the four ships survived to reach their homeport. These two ships brought back a
cargo of spices and other products worth 60 times the cost of the said voyage.
The spices of the East were valuable in those times, during these Middle Ages; a pound of ginger
was worth a sheep, a pound of mace worth three sheep’s or half a cow. Pepper, the most valuable
spice of all, was counted out in individual peppercorns, and a sack of pepper was said to be worth
a man`s life. Da Gama`s successful voyage intensified an international power
struggle for control over the spice trade. For three centuries afterwards the nations of Western
Europe - Portugal, Spain, France, Holland, and Great Britain - fought bloody sea-wars over the
spice-producing colonies.

10
By the year 1000 Arabians had conquered the Indus valley,
what is now India. They brought the cumin and coriander
that mixed with Indian pepper; ginger and turmeric make up
the base of so many South Asian dishes. It was this
combination of spices that century’s later British sailors
spread throughout the world as curry powder. In India,
Arabian traders got the rare and exotic spices of the Far East from local spice merchants. Arabian
traders were able to make good money supplying these spices, even with the high prices paid to
the Indian middle men, not only to their countrymen back home, but to Europe as well. These
traders of spices paid for the Art and Education for which Arabia became famous in the present
day. In many ways the culture of Arabia loved studying and learning different things. Many great
Greek and Roman plays were translated in Arabic, so too were the geographic writings of Pliny
and Ptolemy telling of the general location of the tabled Spice Islands. In nutshell, the fascinating
history of spices is a story of adventure, exploration, conquest and fierce naval rivalry.
The people of those times used spices, as we do today, to enhance or vary the flavors of their
foods. Spices were also flavor disguisers, masking the taste of the otherwise tasteless food that
was nutritious, but if un spices, had to be thrown away. Some spices were also used for
preserving food like meat for a year or more without refrigeration. In the sixteenth century,
cloves were used to preserve food without refrigeration. Cloves contain a chemical called
eugenol that inhibits the growth of bacteria. It is still used to preserve some modern foods like
Virginia ham. Later, mustard and ground mustard were also found to have preservative qualities.
When spices were not available people went hungry because they could not preserve their foods
to carry them over to the winter. Such was the importance of spices those days.

11
Broadly, there are two main subdivisions of spices one being the major
spices and the other is minor spices. For example the spices like pepper,
cardamom, ginger, turmeric, chilies etc., comes under major category.
The important minor spices grown in India are ajowan, aniseed,
caraway, celery, coriander, cumin, dill seed, fennel, fenugreek, garlic,
onion, saffron, vanilla etc.

12
2.2 Exports of Indian Spices
In last few decades India faced enormous growth in the exports of Indian spices in the world
those exports includes branded and non-branded. Indian spices are exported to more than
140 countries. The aroma, flavor and exquisite characteristics of Indian spices are well
acclaimed the world over. The wide range of 52 spices and its products in our export basket
have impressed the discerning consumers. These buyers have identified India as the
destination for quality spices.
North America is the major buyer of Indian spices followed by EU, Japan and West Asian
countries.
India’s export Market F.Y. 2001 (U.S. $ 44 bn)
Asia -38.7%
Africa-4.1%
North America-22.4%
CIS and Baltics-2.3%
LAC-2.2%
Europe-25.9%
Other-4.3%
India’s export Market F.Y. 2008 (U.S. $163 bn)
Asia -51.7%
Africa-7.1%
North America-13.5%
CIS and Baltics-1.1%
LAC-3.5%
Europe-22.9%
Other-0.3%

13
2.3 Basics of Spices
Spices are seasonings for food that come from the bark, buds, fruit or flower parts, roots, seeds
or stems of various aromatic plants and trees.
According to the American Spice Trade Association (ASTA), spices are 'any dried plant product
used primarily for seasoning purposes.' This definition covers a wide range of plant and plant
parts: tropical aromatics, leafy herbs, spice seeds, roots, dehydrated vegetables, and spice blends.
The earliest written record in India on Spices is the venerable Vedas - such as the Rig Veda
(around 6000 BC), and the others - Yajurveda, Sama and Atharva. During the Vedic period,
information was primarily was handed down orally from generation to generations through the
medium of hymns. The Rig Veda contains references to various spices such as horseradish - a
close relation of Mustard and Turnip. There are also references to Black Pepper in the Yajur
Veda. These are but few of the spices in the natural expanse of the subcontinent - in the
mountain, swamps, riverines, tropical rain forests, wetlands, marshy woodlands, rich valleys,
green fields in a pollution-free, & eco-friendly environment. The history of Indian spices lies in
the abundance & goodness that Mother Nature has blessed it with and made it so popular world
wide.
At the time only tropical aromatics like pepper, cinnamon, and cloves were considered a spice.
The leaves and seeds of temperate-zone plants like basil and oregano were known as herbs.
Today this classification has shifted somewhat, even though still used in some circles. The term
spice now generally includes a whole range of elements: spices, herbs, blends and dehydrated
vegetables.
Legally the Food and Drug Administration (FDA) still considers dehydrated vegetables as
separate and distinct from spices; they require such seasonings to be labeled differently than
spices. Spices used for coloring like paprika and saffron are also labeled separately or as a 'spice
coloring.' The U.S. Department of Agriculture (USDA) follows similar rules as the FDA. Spice
colorings and mustard must be labeled separate from spices, onion and garlic are listed as
flavors, and all other dehydrated vegetables are labeled separately by name.
14
2.4 Brief background of Spices Board:
Spices Board was constituted on 26th February 1986 under the Spices Board Act 1986 (No. 10
of 1986) with the merger of the erstwhile Cardamom Board (1968) and Spices Export Promotion
Council (1960). The Board has 35 regional offices, 38 field offices and 4 research institutions
functioning all over India.
The mandate of the Board includes research and development of cardamom, regulation of
cardamom trade, quality evaluation/improvement, export promotion of spices and support for
post harvest improvement of spices, production and research of vanilla, production of organic
spices, and development of spices in North East Region. The regulatory functions of the Board
include registration of spices exporters and licensing of dealers and auctioneers of cardamom.
2.5 Current scenario of export
Indian spices are exported to more than 140 countries. The aroma, flavor and exquisite
characteristics of Indian spices are well acclaimed the world over. The wide range of 52 spices
and its products in our export basket have impressed the discerning consumers. These buyers
have identified India as the destination for quality spices.
North America is the major buyer of Indian spices followed by EU, Japan and West Asian
countries.

15
2.6 Current size of the Indian spice exporters
Indian spice industry sector consists of 2100 registered exporters, of which 100 exporters
contributes to the extent of 80% of exports. Out of the 380 manufacturer exporters, 98 units have
been established in-house laboratories and 35 units with ISO 9000, 18 units accredited with
HACCP certification. 32 spice brands have been registered with the Board. More than 20
processing units have upgraded their technology to meet the international quality
standards/buyers' requirements.
2.7 Different varieties of spices
Products of spices like spice powders/curry mixtures, spice oils and oleoresins including mint oil
and menthol crystal contribute nearly 50% of the total export earning. Major value added
products viz., spice oils & oleoresins, spice powders, mixtures, blends, curry powders/pastes,
spices in brine, freeze dried spices, dehydrated spices, frozen spices, color extracts have got good
demand in developed countries. Recent additions to the list are vanilla, herbal spices and organic
spices which have become the focus products in the international market. Value addition is the
key.

16
2.8 Cultivation of spices
Spice cultivation and production practices take in to account diverse aspects of Implementation
of cutting-edge agro-techniques and cultivation methods, nutrient management, have all ensured
that there has been a sustained increase in the productivity & quality of the spices crops that are
grown and harvested by us.
Site selection
Adaptability
Seedbed preparation
Seeding
Fertilization
Weed control
Harvesting
Storage
Processing
2.8.1 What is organic cultivation?
Organic Cultivation is a type of farming that does not involve usage of chemicals like chemical
fertilizers and pesticides. In recent years, organic agriculture has gained considerable importance.
Major shift has been observed in the farming culture, due to which several farmers have begun
practicing this traditional method of cultivation. The reason being, organic cultivation is proven
as the means to produce safe foodstuffs and preserve the environment. But even today, numerous
small farmers have been practicing organic farming, but are unable to reap its benefits. The
spices and other food stuffs produced from this type of farming are certainly without any harmful
ingredients.
17
2.8.2 Organic Cultivation:
With a rising demand in the world market for hygienic foods, there has been a trend towards the
adoption of organic methods of cultivation. The use of organic cultivation and the use of natural
fertilizers have become popular among cultivators around the world. Organic farming is crop
production method that promotes environmental sustainability. While optimizing resource use, it
ensures that the crops produced are nutritive, healthy and pollution free. The various advantages
of adopting organic cultivation are:
Producing healthy, nutritious and high quality food
Encouraging and enhancing biological cycles
Enhancing the long-term fertility of soils
Aids soil and water conservation
Maintains the diversity of the gene pool
Minimizes pollution from outdated agricultural practices
Preserves and nurtures traditional knowledge in farming methods & seeds varieties
Minimizes the negative impact of social and ecological impact of farming systems

18
2.8.3 How is organic cultivation different from general Cultivation?
Multitudes of benefits are associated with the organic cultivation. Besides being one of the
traditional methods of farming, this type of cultivation is also considered to be better than the
general cultivation. Many facts are associated with this conclusion, one being the organic
fertilizers are carbon based compounds that increase the productivity of plants.
The organic cultivation has various benefits over general cultivation, some of which are
underlined below:
Non-toxic spices:
By using organic fertilizers in our farming unit, the spices produced are free of harmful
chemicals. As a result, end-consumers who use these spices in their food items will be less prone
to diseases such as cancer, heart stroke and skin disorders, as compared to those who consume
the spices produced using chemical fertilizers.
Fertility of soil:
Organic cultivation ensures that the farms remain fertile for years. On the contrary, the practice
of general or inorganic farming has resulted in infertility of the land, forcing many farmers to
increase the chemical fertilizer inputs or leave farming.
Safe environment:
Organic fertilizers are easily bio-degradable and do not cause environmental pollution, but
chemical fertilizers contaminate land and water. Moreover, the usage of chemical fertilizers can
cause varying diseases in human beings and extinction of a number of plant, animal and insect
species.

19
2.8.4 Trends of organic cultivation
Organic Cultivation has become one of the popular methods of farming, in the recent times. This
trend is exhibited from the world wide demand of the organic spices.
World demand for organic foods
The global demand for organically produced spices and other food products is growing rapidly in
developed countries like Europe, USA, Japan and Australia. Worldwide, food trends are
changing with the increasing health concern.
As organic foods & spices are free from chemical contaminants, the demand for these products is
steadily increasing to a great extent. According to the ITC, UNCTAD/GAT, more than 130
countries are engrossed in certified organic foods cultivation, out of which 100 are from Asia and
Africa. Internationally, a shift towards traditional / ethnic medicines is an essential factor
contributing to the growth of organic cultivation. Since spices form part of many medicines, the
demand for organically produced spices is also increasing.
Initiatives taken by Spice Board of India for promoting the production and export of organic
spices have widely affected the overall cultivation of the spices in India.

20
2.8.5 The Indian Initiative
Spices Board India has prepared a comprehensive document on production of organic spices. It
includes the organic concepts, principles, basic standards, production guidelines, documentation,
inspection and certification related to production methods.
Research programs on organic cultivation form the important part in spice production. The
research work is carried out at the Spices Board's Indian Cardamon Research Institute at ldukki
district in Kerala.

21
Chapter-3
Company Profile

22
Vision: The focus is to become number 1 in pure powder spices and asafetida (Hing) in India
Mission: To set and maintain our own standard of quality spices and food products for consumers who
value purity taste and health.
History of Ramdev food products pvt ltd.
• The History of globalization started when our forefathers started business 40 years back and
gradually the business expanded by members of “Ramdev Family" by incorporating a Company
"Ramdev Foods Products Pvt. Ltd." In 1989. Up to 1998 the Company achieved the marvelous
success under the chairman ship of Shri Arvind R. Patel.
• Ramdev food products ltd is a family owned business started by Mr. Rambhai patel in 1963 as a
flour mill in saraspur with other flours, chilly, turmeric and such other spices were grinded.
• In 1989 the existing business was transferred into an incorporated company RAMDEV FOOD
PRODUCTS PVT LTD
• In the year 1992 " Ramdev Family" again expanded creating two new companies "Ramdev
Masala" for Retail outlets & "Ramdev Exports" for international market under the solemnly
guidance & supervision of Directors Shri Arvind R. Patel, Rakesh A Patel & Chirag A Patel.

23
• In 1992, first export consignment of Spices & Groceries was initialized, under the name & style
of "Ramdev Exports". Ever since then, there was no looking back & our global presence is
marked in all the major developed countries as one of the Leading Indian Exporter of Spices,
Pulses, Groceries , Instant Mixes & an array of Indian Food stuffs.
• The company introduced a concept of polypack instead of loose masalas successfully launched
instant mixes, asafetida, blended spices, pickles masala thereafter instant mixes etc.
• 1991 expanded product range and diversified into related business of instant mix and convenient
consumer packs that set a new trend in Indian spice market.
• Actively involved in production planning, product formulation, business development, project
management, and quality control, distribution and export management.
• A visionary who initiated the tough task to set a distribution net work on foreign soils instead of
exporting containers conventionally
• The main reason behind their success can be attributed to the strong infrastructure. Their
manufacturing unit is well equipped with the latest machinery and an excellent technology for
manufacturing and processing of the products.
• They are proud to boast of possessing hygienic machines for cleaning, grinding, and packing to
maintain quality standards. They strives their best to meet the expectations of their international
clients.
• The entire unit has been set up under the guidelines of trained CFTRI Food Technologists.
Ramdev are also been awarded with HACCP certificate, which enables us to follow complete
hygienic procedure while processing our products. For more betterment we are under process to
pursue ISO 22000 & BRC certification.

24
Chapter-4
Literature Review

25
LITERATURE SURVEY
NEW DELHI (Commodity Online):
The global market for chilies is estimated at 400,000 metric tones and production in major
countries are growing at a compound annual growth rate (CAGR) of 5.2 percent, according to K
Devender Reddy of ITC Guntur. In a report presented at the recent World Spice Congress, he
pointed out that productivity of Indian chilly has shown positive signs in recent years.
In chillies the major producing countries are India, China, Peru, Bangladesh, Hungary and few
others. Production of major countries is growing at CAGR 5.2 percent. World trade in chilies is
put at 400,000 metric tones. Indian share in global production range from 50 to 60 percent, China
and Peru are growing fast and Hungary shows a decline. Peru and China are dominating world
paprika trade. However India is the only one source for hot chilies.
The Indian productivity in Chilies has been showing positive signs showing rise from 1544 kg
per hectare in 2005 to 1550 kg per hectare in 2009.During 2007 and 2008, the productivity
recorded was 1685 and 1611 kg per hectare respectively. The steady increase in productivity was
on account of hybrids.
KOCHI (Commodity Online): Sreekumar Raghavan
India’s value added spices may get more acceptances in USA if trends from supermarkets and
restaurants are any indication. Trend experts Mintel reported that ethnic flavors are becoming the
popular trend for ready-to-eat foods in USA and other leading countries. “Since culinary herbs
and spices show potential health benefits in scientific studies, the functional qualities will likely
appeal to consumers. Products featuring turmeric, cinnamon, and ginger may be reaching the
store shelves next year,” Mintel said in their 2010 Global Packaged Food predictions.

26
In the coming years, India’s spices exports mainly pepper would be more dependent on changing
food consumption patterns in USA and other leading markets rather than just the production in
Brazil or Vietnam.
According to Spices Board, spice oils and oleoresins including mint products like mint oils,
menthol crystals, and menthol powder contributed 40% of the total export earnings for India in
2008-09. Chili contributed 20% followed by cumin 10%, pepper 8% and turmeric 5%. During
the year 2008-09, Indian spices and spice products reached more than135 countries in world. The
leading among them are USA (21%), Malaysia (7%), UAE (6%), China (6%) and UK (5%).
Exports are increasing over a period of time. As well as Indian spices are being recognized for its
quality and trust that has been changed over a period of time.

27

28
India to be world spices hub by 2017 India will be the world’s largest spices processing hub by 2017, according to V J Kurien,
chairman, Spices Board. Addressing a press conference here he said the board was making all
efforts to achieve the goal within 10 years.
A vision document for the purpose in being prepared by a team of experts in the Spices Board
and will be finalized in 3-4 months.
Currently, the country is handling 44 per cent of world’s total spices business quantity wise, and
35 per cent in value terms. More than 70 per cent of the world’s business in value-added spices
products is also handled by India.
Kurien said the emergence of Vietnam as a processing centre would not be a serious threat to
India as the country’s major firms were more quality conscious. According to the estimates of
the board, India had exported value-added spices-based products worth Rs 2,100 crore in 2006-
07 which is a remarkable in history.
The board will launch e-auction of cardamom by next July. Although the commerce ministry had
announced the project almost a year back, this will be set in motion in the beginning of the next
harvesting season. The testing of the new system is in full-swing, and will be introduced at
Bodinaykanoor in Tamil Nadu and later will be extended to other major cardamom auction
centers.
Kurien said during the on-going Five Year Plan, 9 more spices parks would be set up in various
states apart from the first one being set up in Idukki district of Kerala. Though the exact locations
of the parks are yet to be finalized, one each will come up at Andhra Pradesh and Madhya
Pradesh.
Meanwhile, the Spices Board chairman ruled out the possibility of extension of the export
subsidy scheme for black pepper. Domestic prices of the commodity have appreciated more than
100 per cent during the last 6-7 months, thus severely affecting exports.

29
Chapter-5
Product Classification

30
No country in the world produces as many kinds of spices as India. At present, India produces
around 2.5 million tones of different spices valued at approximately 3 billion US $, and holds the
premier position in the world. Because of the varying climates - from tropical to sub-tropical to
temperate-almost all spices are grown in this country. In almost all of the 25 states and seven
union territories of India, at least one spice is grown in abundance.
There are lots of spices which India exports to all over the world they are namely Chili,
Turmeric, coriander, Methi, Saffron, Piper, and Fennel etc.
Botanical name: Capsicum arutescens Capsicum annum
Family: Solanaceae
Part used: Fruit
Grades: The highly pungent "Sannam" & the mildly pungent 'mundu' chilies are internationally
popular varieties. India also offers 'gospurea chili'. Chilies come as whole, with or without stalks
& with clipped stalks and fresh and dried capsicum and as powder, oils and oleoresins. Byadgi
chili grown in Dharwad district of Karnataka and Tomato chilies in Warangal, Andhra Pradesh
has high colour value.
Description & distribution
Chili is considered the most important contribution from America to the world of spices.
However, today India is the foremost producer and exporter of chili.

31
Chili is the dried fruit of an annual sub-herb. It is also called as capsicum, paprika, sweet pepper,
red pepper, pimento, cayenne pepper etc depending upon the manner in which it is prepared and
used.
Chili comes in a wide range of shapes, sizes, color and degrees of pungency. Some varieties of
chili are highly pungent, medium pungent, others flavorsome but not pungent.
Chili is propagates by Seeds. Chili is grown in several parts of the world as a 'round - the- year
crop'. In India the major producer States are Andhra Pradesh 49% of the total production,
Karnataka 13%, Orissa 8%, Maharashtra 6%, Rajasthan 8%, Tamilnadu 6%, West Bengal 5% &
Gujarat 2%.
Harvesting Season: January – August
Marketing Season: October – June
Uses
Chili forms an indispensable culinary spice in several parts of the world. It is also used in
beverages and in the preparation of medicines.
Export: Indian chili is mainly exported to USA, Srilanka, Bangladesh, the Middle East and the
Far East.
Botanical name: Curcuma longa
Family: Zingiberaceae
Part used: Rhizome
Grades: The well accepted grades of Indian turmeric are 'Alleppey finger', from (Kerala),
'Madras finger' and 'Erode finger' from Tamil Nadu, Rajapore and Sangli turmeric from
Maharashtra and Nizamabad bulb from Andhra Pradesh. Turmeric is also exported in powder
form and asoleoresins.

32
Description & distribution
Turmeric, the dried rhizome of a herbaceous perennial, is indigenous to Southeast Asia.
The primary rhizomes, round in shape are called 'bulbs', while the thin, long secondary rhizomes
are 'fingers'. After harvest, the rhizomes are cleaned, boiled, dried and polished. Turmeric is
closely related to ginger and is sometimes called Indian saffron due to its brilliant yellow color.
The propagation of turmeric is by rhizomes.
Turmeric is characterized with a fragrant, peppery aroma. It is slightly bitter in taste with a
musky flavor.
Turmeric is basically a tropical plant. India is the world's largest producer of turmeric and
accounts for nearly 90% of the world production. With its inherent qualities, Indian turmeric is
considered the best in the world. Andhra Pradesh ranks high with 57 % of the total Indian
produce. Tamil Nadu contributes an 18%, Orissa 7%, west Bengal 4%, Karnataka 4%, 2% each
by Gujarat, Maharashtra and Kerala.
Harvesting season: December to March
Marketing season: February to May
Botanical name: Coriandrum sativum
Family: Apiaceae
Part used: Leaf & Seed
Grades: India exports coriander in the form of seeds, powder and essential oils.

33
Description & distribution
Coriander is of the Mediterranean. It is a herb mentioned in the bible. It was used as a cure for
facial spots during the middle age. Coriander is now a major crop throughout the world.
Coriander is the dried fruit of an annual herb, with several branches and serrated leaves. The
small flowers yield green globular fruits, which turn yellowish brown when ripe. The seeds are
picked when the ripening is in progress and sun-dried.
Coriander is pleasantly aromatic and flavorful. Coriander requires full exposure to sunlight.
Medium to heavy loamy soil, good drainage and well-distributed moisture are the other pre
requisites for coriander. The Indian tropical climate is suitable for favors the cultivation of this
crop. Coriander is a thriving crop in India with its quality enhanced by the organic cultivation
followed by the Indian farmers.
63% of total Indian production comes from Rajasthan, 18% from Madhya Pradesh, 10% from
Andhra Pradesh, 4% from Orissa and 2% from Uttar Pradesh. India contributes about 80% of the
global supply.
Harvesting Season: November to April
Marketing Season: January to June

34
Uses
It is used as a condiment in curries; as fresh leaves for garnishing of curries, and in chutney as an
appetiser. It is also used in several beverages, liquors and perfumes. It is highly valued for its
medicinal properties and for its use as a condiment.
Export
Indian coriander is mainly exported to the USA, UK, Malaysia, Singapore, Sri Lanka and the
Middle East.
Botanical name: Piper nigrum
Family: Piperaceae
Part used: Fruit Seed
Grades: Two of the most celebrated varieties of Indian black pepper are "Malabar Garbled" &
"Tellicherry Extra Bold". India also offers green pepper in several processed forms - frozen,
dehydrated, freeze dried and pepper in brine.

35
Description & distribution
Pepper is one of the oldest and best-known spices in the world. Indigenous to India pepper is
popularly known as the king of spices: From time immemorial India has always reigned supreme
in the production & export of this most exotic and renowned spice in the world.
Pepper plant is a perennial climber with dark green leaves and spikes of white flowers. The
peppercorn is a berry like drupe, about ½ cm in diameter, green when unripe and then red. Black
pepper comes from whole fruit, picked just before they are completely ripe and dried. White
pepper comes from ripe fruits with the endocarp separated after fomentation.
Pepper is grown in the monsoon forests along the Malabar Coast in South India. A national
environment combined with organic cultivation techniques make it some of the finest quality
pepper found in the world.
India contributes about 25-30 per cent of the world production, of this Kerala accounts for over
96 percent. The remaining is contributed by Karnataka and Tamil Nadu. The Union Territory of
Pondicherry, Andhra Pradesh, Orissa, Assam, West Bengal, Andaman & Nicobar Island,
Meghalaya and Tripura have taken up Pepper cultivation.
Harvesting Season: October – February

36
Uses
Pepper is used widely in the preparations of various dishes ranging from the south Indian cuisine
to the Western soups. It is used for pickles, seafood salads etc., beverages and in the preparation
of preservatives.
It has high medicinal value. An ingredient for skin and body care, it acts as an astringent,
lightener and toner, activates blood circulation and stimulates follicles.
Export
Major importers of Indian Pepper are USA, Canada, Russia and European Countries.

37
Major market for spices/spices products in India:
Spices/Spice Products Markets
Spices
Black Pepper Cochin, Alleppey, Calicut, Nedumangad, Konni, Adoor, Pala, Alwaye,
Thodupuzha, Chalakudy, Badagara, Cannanore, Tellicherry, Kanjangad,
Kasaragod-(Kerala); Bombay-(Maharashtra)
Cardamom Cochin, Thodupuzha-(Kerala); Saklashpur, Mercara, Medikeri, Mangalore-
(Karnataka); Bombay-(Maharashtra); Virudhunagar, Cumbum,
Bodinayakkanur, Thevaram, Pattiveerampatti-(Tamil Nadu)
Chillies Virudhnagar, Tuticorin, Sankarankoil, Kovilpatti, Theni, Ariyalur,
Ramnad-(Tamil Nadu); Guntur-(Andhra redesh)
Ginger Cochin, Alleppey, Punalur, Adoor, Pala, Alwaye, Moovattupuzha,
Thodupuzha, Calicut, Tellicherry-(Kerala)
Turmeric Alleppey-(Kerala); Erode-(Tamil Nadu); Cudappah, Nizamabad, Guntur-
(Andhra Pradesh); Sangi-(Maharashtra)
Celery seed Amritsar-(Punjab), Nadiad-(Gujarat); Saharanpur-(Uttar Predesh)
Coriander seed Guntur, Varavakonda, Nandyal-(Andhra Pradesh); Ramganj (Mandi)
Baran,Kotta-(Rajasthan) ; Thiruchirappilly, Virudhunagar-(Thamil Nadu)
Davangore-(Karnataka); Varanasi, Jaunpur-(Uttar Pradesh)
Cumin seed Unjha, Palan, Mohsana, Visnagar-(Gujarat); Jaipur, Kisangarh Kokri-
(Rajasthan)
Fennel seed Unjha, Visnagar, Nadiad, Vijapur-(Gujarat); Patna-(Bihar);
Jodhpur-(Rjasthan); Varanasi, Hathras, Gorakhpur-(Uttar Predesh)

38
Fenugreek seed Unjha, Idar, Visnagar-(Gujarat) Jaora,Indore, Khjner (Madhya Predesh)
Molerkotla-(Punjab), Varanasi,Jampur, Hapur-(Uttar Pradesh) Jodhpur,
Jaipur, Ramganj-Mandi, Bhawani-Mandi, Baran -(Rajasthan)
Garlic Hassan, Hubli, Gulbarga-(Karnataka); Nizamabad, Hyderabad-(Andhra
Pradesh); Poona, Nasik-(Maharashtra); Bundi, Ramganj-Mandi Bhawani-
Mandi (Rajasthan); Patna-(Bihar); Surat, Jamnagar, Ahmedabad, Visnagar-
(Gujarath); Nimach, Pipaliya, Mandhasaud-(Madhya Pradesh); Varanasi,
Jaunpur-(Uttar pradesh)
Spice Products
Curry powder Madras-(Tamil Nadu); Bombay-(Maharashtra); Cochin-(Kerala); Calcutta-
(West Bengal); Banglore-(Karnataka)
Oils and Oleoresins Cochin, Calcutta,Alleppey-(Kerala) Bombay-(Maharashtra); Madras
Madurai-(Tamil Nadu); Banglore-(Karnataka)

39
Chapter-6
Analysis of the Questionnaire

40
Q-1 Taking into consideration brands of spices available in various grocery retail stores of
Ahmedabad.

41
• From the graph above we can interpret product availability of chilli powder, haldi powder
and dhanajeera powder under various packaging from 15 Gms to 1 kg with reference to
various brands like Ramdev, Everest, Spyran, Kitchen Express, Badshah, Majethiya and
Wonder Masala in grocery retail stores.
• 335 qualified samples which are being surveyed in the project study shows that Ramdev
Masala is clearly leading in the spices industry in Ahmedabad in organized retail.
• Out of 335 retailers 150 of them were having 15 gms packing of Ramdev chilli, haldi and
dhanajeera, 149 had 35 gms packing of all three products, 235 retailers had 50 gms
packing, 320 had 100 gms packing, 319 retailers had 200 gms packing of Ramdev
products, 303 had 500 gms packing and 153 retailers had 1 kg packing of the products of
Ramdev Masala,
• In case of Everest for various weights 15 gms, 35 gms, 50 gms, 100 gms, 200 gms, 500
gms and 1 kg retailers had 42, 63, 60, 52, 36, 33 and 27. For Spayran Masala it was 52,
51, 57, 48, 34, 39 and 15. For Kitchen Express it was 116, 110, 228, 279, 287, 270 and
127. For Badshah it was 49, 49, 60, 61, 57, 50 and 16. For Majethiya it was 47, 49, 37,
51, 39, 39 and 11. For Wonder Masala it was 107, 114, 108, 110, 105, 83 and 44.
• From the data we can analysis that 90% of the retailers had the Ramdev as their brands in
their stores for the weights of 100 gms, 200 gms and 500 gms.
• Kitchen Express is second most leading brand in all spices though Ramdev is leading but
in some time Kitchen Express is able to get some more market with their strong Channel
system and margin policy.
• Wonder Masala, Spayran Masala and Majethiya are having very low market share but
their presence and availability was more found in small packing sizes, into that Wonder
Masala is having a good market share with their small packing sizes in all chilli, Haldi
and Dhanajeera.

42
• From the research we may find that there is a huge potential in small sizes of blended
spices, there is a huge market of Unorganized and non-Branded spices particularly in
Gujarat market.
• In most of the stores it was found that Ramdev was available product it was equally
preferred by customers and retailers and product availed by retailers in sizes of 100 gms,
200 gms and 500 gms.
• In most of the stores 1 kg of packing sizes is not ordered as frequently by all retailers as
compared to other packing as customers prefer to buy either of 100 gms, 200 gms and
500 gms.
• It is clearly showing that other brands are striving for their presence in the market
Ramdev is having a very good brand name as compare to all and it also shows their
strong channel distribution.

43
Q-2 Brands of spices do preferred by consumers
46%
14%
24%
8%6% 2%
RamdevEverestKitchenBadshahWonderSpyran

44
• From the data above we can see that Ramdev is being preferred by 46% of consumers,
Everest was preferred by 14% where as Kitchen Express was preferred by 24%where
others Badshah, Wonder Masala and Spayran Masala were 8%, 6% and 2%
• From the pilot study we derive that out of seven six brands were highly preferred by
consumers.
• Out of all six Ramdev is highly preferred by consumers, in case of popularity for spices
like chili, Haldi and Dhanajeera powder, as well as Ramdev is far ahead of others.
• Second leading brand again is Kitchen Express, though it has not been favored by
consumers as high as Ramdev but their market is increasing and it can be a big threat for
the market of share of Ramdev.
• Nationwide famous brands like Everest and Badshah are not able to survive in blended
spices market, though their share is quiet good in Garam Masalas.
• Everest is third most brand preferred by consumers, and it has a good impact over the
consumers minds.

45
Q-3 Consumers ratings towards various brands.
Ramdev
Preference of the people as far as Ramdev is concern it can be inffered clearly from the above
graph that Ramdev is most preferred by almost majority of Retailers to sell in almost all areas of
ahmedabad and the people who does not have perference towards Ramdev are almost in
negligible count, weighted average mean also supports the graph it is 4.59 out of 5.

46
Everest
Preference of the people as far as Everest is concern it can be inffered clearly from the above
graph that Everest is second and third most preferred after Ramdev and Kitchen Express, by
almost majority of Retailers to sell in almost all areas of ahmedabad and the people who have
strong perference towards Everest are almost in negligible count, weighted average mean is
3.34 for everest which is infered from the above graph.

47
Spayaran
Analyzing the preference of people as far as Spayran Masala is concern it can be inffered clearly
from the above graph that spayaran is having mixed preference in the minds of the Retailers as
well as in the minds of the consumers as its graph is scattered into all the option from Most
preferred till Not preferred.In the above study it came in notice that Spayran Masala is not much
known by the consumers so not stored by the retailers compared to the stock of Ramdev stored
by them, weighted average mean is 2.75 which is not very favourable by consumers.

48
Kitchen
As mentioned above Kitchen Express is having preference in some parts of the Ahmedabad
which is equivalent to Ramdev or even more then Ramdev in some parts of the Ahmedabad it
can be clearly inferred from the graph that Kitchen Express is having Strong preference in East 2
part of the Ahmedabad and also it is having second leading reference group after Ramdev,
weighted average mean is 4.08 which is 2nd best after Ramdev.

49
Badshah
Taking into consideration Badshah’s preference in the minds of the target audience of the scope
of research it is the brand which is holding third position after Ramdev and Kitchen Express. It is
clearly visible in the graph that it is third most preferred brand and it also have group of audience
who does not prefer this brand or some what have less preference towards the brand, weighted
average mean is 2.94 which shows that it is not very preferable by consumers.

50
Majethiya
Majethiya is the brand which is only preferred by the consumers in the small packing size and as
far as its preference towards the regular packing is concern it is not known to most of the
consumers. It is due to its small packing only the above graph is more skewed towards third most
preferred brand but in actual as mentioned above Badshah is third most preferred brand in
Regular packing sizes, weighted average mean is 2.44 which indicate that majethiya is least
preferred brand.

51
Wonder
Now analyzing Wonder Masala it holds around 43% of the audience who rate Wonder Masala in
least preferred and less preferred so it can be clearly inferred from the above graph that it has less
preference of consumer. But like Kitchen Express it also has strong reference group of people in
some parts of Ahmedabad that is the reason that around 32% of people have rated it as third most
preferred brand as shown in above graph, weighted average mean is 2.70 which indicates that
brand is not much preferred.

52
Q-4 Frequency of ordering.
While analyzing the purchase cycle of the retailers for the above mentioned brands it is observed
that the channel of sales in the field of spices is quite uniform in all the cases of the above
mentioned brands. It can be clearly interpreted that most of the retailers has weekly purchase
cycle followed by fortnightly, Monthly and Quarterly respectively.

53
Q-5 Rating of retailers on the availability.
Chili Powder
Taking into consideration the satisfaction level of Ramdev chili powder is considerably very
high compared to other products of Ramdev the above graph clearly signifies that more that half
of the total target group has greater amount of satisfaction level towards Ramdev chili powder
and also the people not satisfied with Ramdev chili powder are in considerably negligible
amount as per the above graph, weighted average mean is 4.44 which shows that chili powder
gives the highest satisfaction in all products of Ramdev.

54
Turmeric Powder
Considering the satisfaction level of turmeric powder of Ramdev in the target group of the scope
of research, it is no doubt about that the people are highly satisfied by the same and also the
graph is more favorable towards the high amount of satisfaction in minds of people towards
Ramdev turmeric powder, weighted average mean is 4.06 it shows that consumers are also very
highly satisfied of turmeric powder.

55
Dhanajeera
Ramdev dhanajeera has its graph in quite typical format it is scatter in such a way that most of
the responses of the consumers are equally distributed in highly satisfied, satisfied and neutral
and the group which is not in favorable satisfaction towards the same are in small number. It can
be inferred from the graph that the above product is in stuck in the middle position, weighted
average mean is 4.03 which indicates high satisfaction level.

56
Hing
Considering the satisfaction level Ramdev hing it is clear from the above graph that most of the
interviewed audience is highly satisfied from the product and the people dissatisfied from the
product is negligible in number, weighted average mean is 4.12 which means that consumers
are very happy with the product.

57
6. Rating of Ramdev spices on various parameters.
Price
Analyzing Ramdev on the parameter of its price it does not hold such a strong position in minds
of people as it is preferred by the people, from the graph it can be interpreted that price of
Ramdev is not as pleasing to people as compared to its quality is, weighted average mean is
2.95 which means that somehow people are not very happy with price in comparison to other
parameters of Ramdev.

58
Quality
As mentioned above it is clearly seen in the graph that the Quality of Ramdev holds the pleasing
image in the minds of people as around 90% of the people are satisfied with the quality that
Ramdev offers in its product range from chili powder to turmeric powder, weighted average
mean is 4.47 which indicates that people give maximum emphasis on quality.

59
Product Variants
Ramdev product variants has its graph in quite typical format it is scatter in such a way that most
of the responses of the consumers are equally distributed in highly satisfied, satisfied and neutral
and the group which is not in favorable satisfaction towards the same are in small number. It can
be inferred from the graph that Ramdev has to work on its variants offered to Consumers;
weighted average mean is 3.07 which means there is scope to add some product variants like
Salt, Besan etc.

60
Promotion scheme
Ramdev promotional schemes has its graph in typical format as it is scatter in such a way that
most of the responses of the consumers are equally distributed in highly satisfied, satisfied and
neutral and the group which is not in favorable satisfaction towards the same are in small
number. It can be inferred from the graph that Ramdev has to work on its promotional schemes
to shift the above graph into most preferred by the consumers, weighted average mean is 2.89
which indicates that promotion schemes doesn’t affect buying behavior of consumers to the
extent company anticipates.

61
Brand Name
Considering the brand name of Ramdev it is clear from the graph as well as the above responses
on different parameters that Ramdev is holding good brand name in minds of consumers due to
its quality and availability offered to the consumers as well as to the retailers. Ramdev has its
brand recall in top of minds of consumers as noticed by the researchers while undergoing the
study, weighted average mean is 4.11 which indicates association of consumers with brand
name is very strong.

62
7. No. of Distributors in their area
It can be clearly noticed from the above graph that Ramdev has sufficient amount of distributors
as required by the retailers that is around 0-2 distributors per area.

63
8. Satisfaction level towards their distributors policies.
Payment
Distributors policy is not at all pleasing to the retailers as credit time given by distributors to
retailers purely depend upon there relation as well as on the sales done by the retailers in
particular time. Ramdev can to gain strong correlation between retailers and distributors by
liberalizing its credit policy up to an extent; weighted average mean is 2.91 which supports the
data in above graph.

64
Replacement
Replacement policy is also not at all pleasing to the retailers, as replacement policy is not
designed as per the requirements and expectations of the retailers as well as distributors. Ramdev
can to gain strong correlation between retailers and distributors by modifying its replacement
policy up to an extent to satisfy its distributors and also the retailers, weighted average mean is
1.95 which supports the analysis done from the graph.

65
Exchange
Same applies to its exchange policy as it is also not at all pleasing to the retailers, as exchange
policy is not designed as per the requirements and expectations of the retailers as well as
distributors; its exchange policy clearly reflects its monopolistic attitude towards its distributors
and retailers, current weighted average mean is 2.14 out of 5 which clearly shows that
exchange policy needs to be reconsidered by Ramdev.

66
Promotion
Ramdev promotional schemes includes limited steps as only in a year for one or two times
promotional steps are undertaken with reference to its distributors, its graph scattered in such a
way that most of the responses of the consumers are equally distributed in highly satisfied,
satisfied and neutral and the group which is not in favorable satisfaction towards the same are in
small number. It can be inferred from the graph that Ramdev has to work on its promotional
schemes to shift the above graph into most preferred by the consumers, weighted average mean
is 2.75 as Ramdev needs to compromise with their pricing policy.

67
Credit Policy
Credit policy is not at all pleasing to the retailers as credit time given by distributors to retailers
purely depend upon there relation as well as on the sales done by the retailers in particular time,
weighted average mean is 2.07 which indicates that Ramdev does not give a longer credit
period compared to its competitors.

68
9. Assistance of Sales person of Ramdev
Assistance of sales persons of Ramdev reflects its monopolistic attitude towards its distributors
as most of the responses of the retailers falls in not satisfied criteria. So Ramdev can improve its
sales person assistance and gain retailers satisfaction, weighted average mean is 2.95 which
shows that sales person do not support a great deal as Ramdev has a well established brand
name.

69
10. Factor which plays an important role in achieving sales.
When asked about the brand name as a important factor affecting the sales of the product it was
noticed that most of the respondents answer tends to “yes”.

70
Price
When asked about the price of the product playing as an important factor affecting the sales of
the product it was noticed that most of the respondents answer tends to “no” and stressed on the
quality instead of price.

71
Availability
When asked about the availability of the product playing as an important factor affecting the
sales of the product it was noticed that most of the respondents answer tends to “yes”, Ramdev in
terms of availability was noticed to be having strong distribution network and a good brand
recall.

72
Loyalty
When asked about the loyalty of the product playing as an important factor affecting the sales of
the product it was noticed that most of the respondents answer tends to “yes” and it was noticed
by the researchers while undergoing the study that “loyalty” plays very important role in building
up such market share as Ramdev has.
73
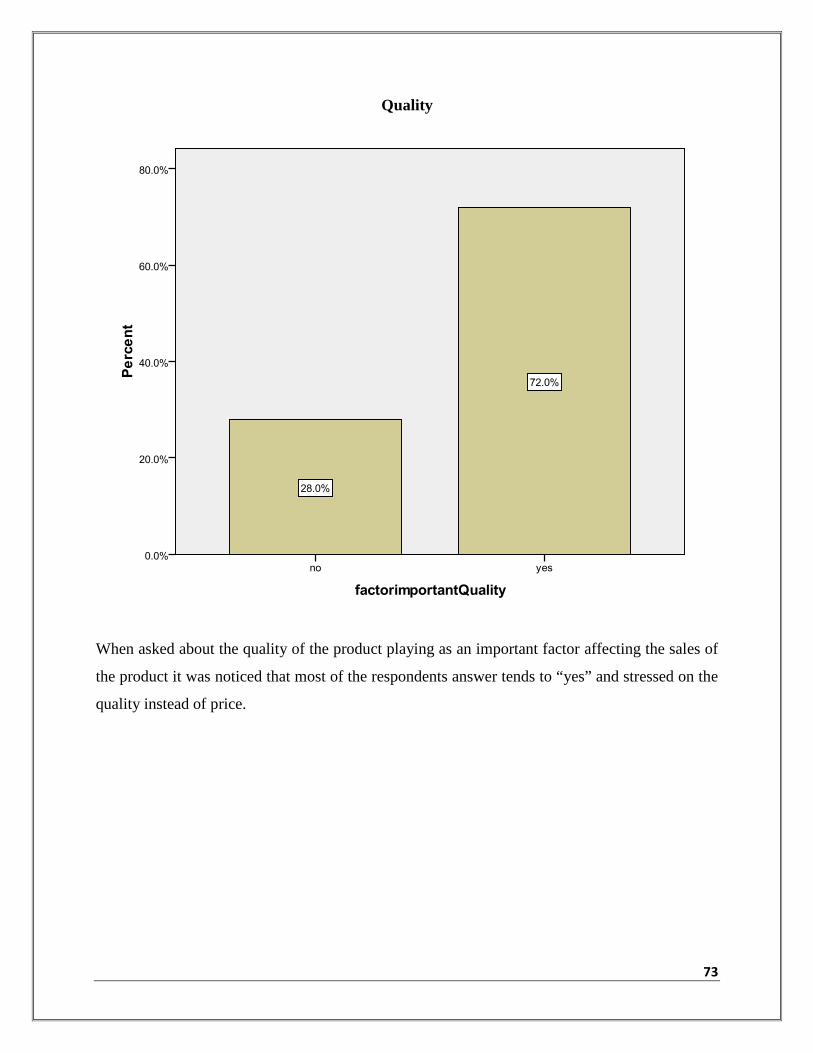
Quality
When asked about the quality of the product playing as an important factor affecting the sales of
the product it was noticed that most of the respondents answer tends to “yes” and stressed on the
quality instead of price.

74
Packaging
When asked about the packaging of the product playing as an important factor affecting the sales
of the product it was noticed that most of the respondents answer tends to “no” and stressed on
the quality and brand name instead of packaging.

75
11. Which other products consumers buy along with the Spices.
Though it depends on the skills of retailers but consumers are buying various products
along with shopping at once
Along with the Blended spices consumers mostly preferred item is Instant mixes of their
own brand in which consumers more buys Gulabjamun, Handvo, Dhokla etc.
Apart from Instant mixes consumers also buys Hing, Pickles, Methi Masalo, Chai Masala
and Various Range of Garam Masalas by Ramdev.

76
12. Frequency and in which quantity consumers prefer.
35 gms 50 gms
100
gms
200
gms
250
gms
400
gms 1 kg
Weekly 19 37 30 3 0 0 0
Monthly 0 0 22 49 27 33 10
Quarterly 0 0 0 7 2 35 23
Annually 0 0 0 0 0 18 20

77

78
From the data above we can infer that demand for particular packaging varies from the time
duration of their purchasing.
• In case of weekly which consumers prefer 50 gms and 100 gms packaging size more as
compare to other sizes.
• For monthly purchases consumers prefer 200 gms to 400 gms of packing sizes as per
their requirements in their family sizes.
• In case of Quarterly purchase consumer give more emphasis on 400 gms pack, though
there are certain number of consumers who buys in 1 kg packing sizes as well.
• There are consumer who buys Ramdev spices for annually storage and they prefer
packing size of 1 kg.

79
Chapter-7
Hypothesis Testing
80
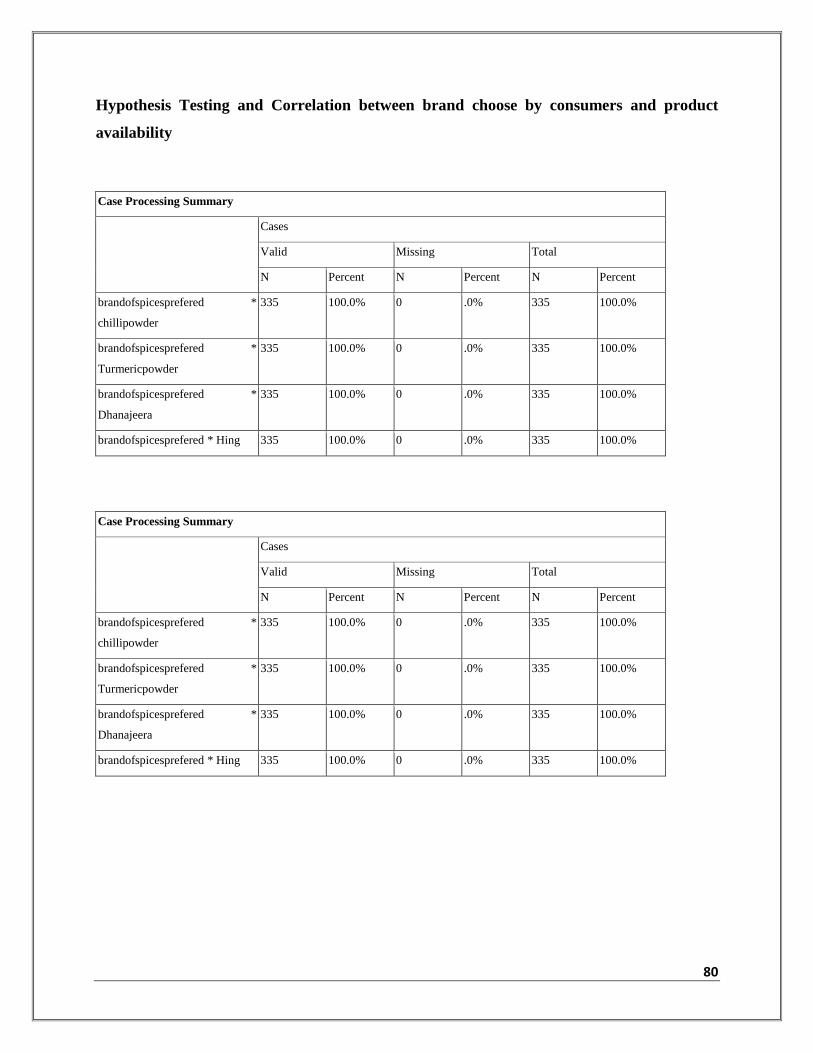
Hypothesis Testing and Correlation between brand choose by consumers and product
availability
Case Processing Summary
Cases
Valid Missing Total
N Percent N Percent N Percent
brandofspicesprefered *
chillipowder
335 100.0% 0 .0% 335 100.0%
brandofspicesprefered *
Turmericpowder
335 100.0% 0 .0% 335 100.0%
brandofspicesprefered *
Dhanajeera
335 100.0% 0 .0% 335 100.0%
brandofspicesprefered * Hing 335 100.0% 0 .0% 335 100.0%

81

82
brandofspicesprefered * Turmericpowder Crosstabulation
Turmericpowder
Total highly satisfied satisfied neutral highly dissatisfied
Brand of spices preferred Ramdev 45 76 33 0 154
Everest 13 24 10 1 48
Kitchen Express 24 42 12 3 81
Badshah 6 14 6 0 26
Wonder Masala 6 10 2 0 18
spayran Masala 3 4 1 0 8
Total 97 170 64 4 335

83
Brand of spices preferred * Dhanajeera Cross tabulation
Dhanajeera
Total highly satisfied satisfied neutral dissatisfied highly dissatisfied
Brand of spices preferred Ramdev 53 65 35 0 1 154
Everest 15 17 12 3 1 48
Kitchen Express 26 27 27 0 1 81
Badshah 9 12 5 0 0 26
Wonder Masala 9 3 6 0 0 18
spayran Masala 3 3 2 0 0 8
Total 115 127 87 3 3 335

84
Brand of spices preferred * Hing Crosstabulation
Hing
Total highly satisfied satisfied neutral dissatisfied highly dissatisfied
Brand of spices preferred Ramdev 77 46 28 2 1 154
Everest 17 14 12 3 2 48
Kitchen Express 33 28 15 2 3 81
Badshah 9 9 6 1 1 26
Wonder Masala 9 3 6 0 0 18
spayran Masala 6 1 1 0 0 8
Total 151 101 68 8 7 335

85
From the above correlation matrix it has been constantly observed that the preference towards
Ramdev and its availability in the area covered in scope of our project is definitely very much
high followed by Kitchen Express and Everest and the satisfaction level of Badshah, Wonder
Masala, Spayran Masala is comparatively very low in accordance with the responses of the
retailers covered in areas of east and west Ahmedabad.
Ramdev’s availability and popularity among the people/consumers as well as the retailers is
high can be inferred from the correlation matrix between Brands of spices preferred and
availability of the spices available in the stores of east and west Ahmedabad which is scope of
researchers project.

86
Case Processing Summary
Cases
Valid Missing Total
N Percent N Percent N Percent
Brand of spices preferred * Area 335 100.0% 0 .0% 335 100.0%
Brand of spices preferred * Area Crosstabulation
Area
Total East 1 East 2 West 1 West 2
Brand of spices preferred Ramdev 60 21 64 9 154
Everest 7 20 5 16 48
Kitchen Express 8 42 10 21 81
Badshah 4 10 5 7 26
Wonder Masala 1 5 6 6 18
spayran Masala 1 4 1 2 8
Total 81 102 91 61 335
Chi-Square Tests
Value df
Asymp. Sig. (2-
sided)
Pearson Chi-Square 106.420a 15 .000
Likelihood Ratio 113.470 15 .000
Linear-by-Linear Association 12.983 1 .000
N of Valid Cases 335
a. 8 cells (33.3%) have expected count less than 5. The minimum expected count
is 1.46.

87
As per the hypothesis assumed between Brands of spices preferred and the area covered by
researchers.
Hypothesis:
H0: No relations between availability and brands preferred in areas
H1: There is strong relation between availability and brand preferred in areas

88
Answer:
As per the chi square test undertaken by the researchers the 2 sided slope ends to .000 it is very
clear that H0 is rejected and H1 is accepted so it shows that there is strong relation between
brands of spices preferred and the area in which the brands are preferred.
As per the cross tabulation analysis between the brands of the spices preferred and the area of
Ahmedabad it can be inferred that the Ramdev is most preferred in East 1 and west 1 areas of
Ahmedabad (refer Annexure 2 for Area classification) and Kitchen Express is more preferred in
East 2 area of Ahmedabad.
Though Ramdev holds high amount of preference of consumers as well as retailers in all the
areas of Ahmedabad then also Kitchen Express is holding a strong reference group in some parts
of Ahmedabad like East 2. As far as the question of Wonder Masala and Badshah is concern they
are preferred by minority of consumers as well as retailers in many parts of Ahmedabad as per
the graph shown above.

89
Chapter-8
Findings

90
Summary of Findings:
1. Product availability of Ramdev products is highest compared to other brands in
the organized retail spices.
2. Ramdev is most preferred brand amongst the consumers who buys packaged
blended spices.
3. Retailers mostly orders weekly or fortnightly which shows that their products are
moving at very faster rate.
4. Product availability of Ramdev Hing is very low to other products as the
awareness & preference towards it is very low.
5. Quality and brand name are major criteria for the consumers for buying Ramdev
products, although the price is very high consumers prefer to buy the products.
6. Credit policy and replacement assistance is not up to the mark as compared to
other brands.
7. Retailers found that sales person from Ramdev are not as helpful as compared to
others.
8. Loyalty and quality are the factors which play important role in achieving sales
for Ramdev.

91
GAP Analysis
Bulk Breaking Spatial Convince Waiting & Delivery
time
Assortment &
Varity
Level Provided High: Customer can
switch small sizes Ok
High: Delivery on
time
High: Capable of
providing in various
Packing sizes
Efficiency High: Production &
Distribution is good High
High: Almost never
gets OOS
High: OOS doesn't
happen so easily
Sources of Problem
Scattered facilities,
variation in services
provided by
Distributors
Poor Communication Poor
Communication
Poor
Communication
Environmental &
Managerial Bound
Lack of information in-
house, and willingness
to improve
Lack of information
in-house, and
willingness to
improve
Continuity in
providing Quality &
healthy Product
Not all products are
successful
Outcome Desired Reduce inventories in
channel system
Continuous to deliver
customer
It can be even
reduced No OOS and Give
Quality Products
Tactics to Close the
GAP
Proper Communication is required to meet the expectation of Retailers as well as
Consumers/End users
Predict Change in
Channel
Performance
Sales: It is increasing year by year and able to meet all targets
Costs: Cost is increasing because of high cost bear by company on channel improvement
Profit: In terms of margin it has reduced due to competition but overall its increasing
Delivery: There unique system of ready stock delivery system hardly makes them OOS

92
From the above GAP analysis researchers can infer that Ramdev is having a very good
Channel network which never makes them OOS (Out of Stock) and they are enjoying
position of market leader. They should use various IMC tools so that they may cater more
customers and grab more market share.
From the above GAP analysis we can also infer that they are leading into the market of
Blended spices not all product variant of Ramdev are successful, to promote there other
product variants like Hing, Achar masala they should promote more and more their
products.
Geographically their territories have broaden up and overall business have increased over a
period of time, and to meet the targets their cost on Channel is also increased.
93
Chapter-9
Recommendation and
Suggestion

94
There are various suggestions that Ramdev should do to improve product availability and
awareness of brand.
1. According to the feedback given by the Retailers focus should be given on increasing
awareness and leverage the brand name.
2. There is a huge potential in to this industry though Ramdev is leading in market but there
are lots of providers of local blended spices so there is need to reduce some price.
3. Credit policy is variable depends on the retailer; customized credit policy should be
framed to inspire small retailers.
4. Assistance in the replacement of the goods should be done promptly by Ramdev.
5. Exchange is the major issue for any retailer as they are lots of problems like poor quality
of goods, out of date of product etc.
6. Ramdev should also increase their product range, like they can launch new products like
Salt or Besan etc. with these they can increase their Stock Keeping Unit and by this they
will be having their broad consumer base.
7. Ramdev should also focus on PULL strategy along with PUSH strategy such as contests,
discounts and free introductory products.

95
Chapter-10
Conclusion

96
From the research undertaken it is observed by the researchers that mostly 100gms, 200gms and
500gms are preferred by the consumers so companies should focus on these packing to gain
consumers preference.
1. Most preferred brand out of all brand is Ramdev, it is constantly observed in all the
responses of the sample audience.
2. Comparing mean of all the brands is also in favorable to Ramdev.
3. Frequency of retailers to order all brands of spices varies from weekly to forth nightly in
most of the cases
4. In all brands and products of spices, Ramdev’s chili powder is most preferred.
5. As per retailers consumer give maximum importance to quality and brand name while
purchasing the products.
6. Most of the retailers responded that Ramdev should loosen its policy of exchange and
somewhat increase its credit time.
7. Factors affecting most to the consumers while purchasing spices is brand name, loyalty
and Quality respectively.
Top Related