


Languages
Pages
Legal

This article was downloaded by: [University of Sussex Library]On: 15 December 2014, At: 07:38Publisher: RoutledgeInforma Ltd Registered in England and Wales Registered Number: 1072954 Registeredoffice: Mortimer House, 37-41 Mortimer Street, London W1T 3JH, UK
Click for updates
Defence and Peace EconomicsPublication details, including instructions for authors andsubscription information:http://www.tandfonline.com/loi/gdpe20
Military Expenditures, IncomeInequality, Welfare and PoliticalRegimes: A Dynamic Panel DataAnalysisÜnal Töngüra & Adem Y. Elverenb
a Department of Economics, Middle East Technical University,Turkeyb Department of Economics, Kahramanmaras S.I. University,TurkeyPublished online: 30 Oct 2013.
To cite this article: Ünal Töngür & Adem Y. Elveren (2015) Military Expenditures, Income Inequality,Welfare and Political Regimes: A Dynamic Panel Data Analysis, Defence and Peace Economics, 26:1,49-74, DOI: 10.1080/10242694.2013.848577
To link to this article: http://dx.doi.org/10.1080/10242694.2013.848577
PLEASE SCROLL DOWN FOR ARTICLE
Taylor & Francis makes every effort to ensure the accuracy of all the information (the“Content”) contained in the publications on our platform. However, Taylor & Francis,our agents, and our licensors make no representations or warranties whatsoever as tothe accuracy, completeness, or suitability for any purpose of the Content. Any opinionsand views expressed in this publication are the opinions and views of the authors,and are not the views of or endorsed by Taylor & Francis. The accuracy of the Contentshould not be relied upon and should be independently verified with primary sourcesof information. Taylor and Francis shall not be liable for any losses, actions, claims,proceedings, demands, costs, expenses, damages, and other liabilities whatsoever orhowsoever caused arising directly or indirectly in connection with, in relation to or arisingout of the use of the Content.
This article may be used for research, teaching, and private study purposes. Anysubstantial or systematic reproduction, redistribution, reselling, loan, sub-licensing,systematic supply, or distribution in any form to anyone is expressly forbidden. Terms &
Conditions of access and use can be found at http://www.tandfonline.com/page/terms-and-conditions
Dow
nloa
ded
by [
Uni
vers
ity o
f Su
ssex
Lib
rary
] at
07:
38 1
5 D
ecem
ber
2014

MILITARY EXPENDITURES, INCOME INEQUALITY,WELFARE AND POLITICAL REGIMES: A DYNAMIC
PANEL DATA ANALYSIS
ÜNAL TÖNGÜRa AND ADEM Y. ELVERENb*
aDepartment of Economics, Middle East Technical University, Turkey; bDepartment of Economics,Kahramanmaras S.I. University, Turkey
(Received 3 July 2012; in final form 5 March 2013)
The goal of this paper is to investigate the relationship between type of welfare regimes and militaryexpenditures. There is a sizeable empirical literature on the development of the welfare state and on the typol-ogy of the welfare regimes. There appear to be, however, no empirical studies that examine welfare regimeswith special attention to military spending. This study aims at providing a comprehensive analysis on the topicby considering several different welfare regime typologies. To do so, we use dynamic panel data analysis for37 countries for the period of 1988–2003 by considering a wide range of control variables such as inequalitymeasures, number of terrorist events, and size of the armed forces. We also replicate the same analyses for thepolitical regimes. Our findings, in line with the literature, show that there is a positive relationship betweenincome inequality and share of military expenditures in the central government budget, and that the number ofterrorist events is a significant factor that affects both the level of military expenditure and inequality. Also, thepaper reveals a significant negative relationship between social democratic welfare regimes and militaryexpenditures.
Keywords: Military spending; Welfare regimes; Political regimes; Income inequality
JEL Codes: C33, D30, H56, I30
1. INTRODUCTION
There is a sizeable empirical literature on the development of the welfare state and on thetypology of the welfare regimes, starting from seminal work of Esping-Andersen (1990),which identifies three types of welfare regimes. There appear to be, however, no empiricalstudies that examine welfare regimes with special attention to military spending. Therefore,the goal of this paper is to investigate the possible relationship between military expendi-tures, income inequality, and types of welfare and political regimes. To do so, we examine37 major countries across the world for the period of 1988–2003 in panel data analysis by
*Corresponding author. Department of Economics, Kahramanmaras S.I. University, Turkey. E-mail: [email protected]
© 2013 Taylor & Francis
Defence and Peace Economics, 2015Vol. 26, No. 1, 49–74, http://dx.doi.org/10.1080/10242694.2013.848577
Dow
nloa
ded
by [
Uni
vers
ity o
f Su
ssex
Lib
rary
] at
07:
38 1
5 D
ecem
ber
2014

considering some control variables such as number of terrorist incidents, share of armsimports in total imports, size of the armed forces, real GDP per capita, and GDP growth.We also repeat the same analyses for the political regimes.
This study is relevant because by utilizing dynamic panel data models, it providesdetailed findings to shed light on the complicated nature of relationship between defensespending, income inequality, and the type of welfare regimes and political regimes. It is anearly attempt to reveal the complicated nature of military expenditures and income inequal-ity for a pseudo-category of welfare regimes (i.e. social democratic, corporatist, liberal,post-communist, and productivist) and political regimes.1 We thus consider the major cate-gories of welfare regimes as well as a recent political regime category in the literature. Tothe best of our knowledge, this study is also the first attempt to compare such a wide rangeof welfare regimes.
Following this section, we provide a brief literature survey on the main typologies ofwelfare regimes and political regimes, and on the income inequality–military expenditurerelationship. Section 3 introduces data and methodology. Section 4 presents results anddiscussion. Finally, the last section is reserved to summarize our findings.
2. LITERATURE SURVEY
Among many definitions based on different approaches, the welfare state in general can bedefined as an interventionist state to protect minimum standards of income, nutrition, health,housing, and education for every citizen. The welfare state began to develop in the latenineteenth century in northwestern Europe. Here in this brief literature survey, we aim atshedding light on three main issues. First, major typologies of the welfare state arepresented. Second, the impacts of defense spending on income inequality are discussed;and, finally, we review the general literature on the political regimes, military expenditures,and income inequality.
2.1. Main Typologies of Welfare Regimes
Huber and Stephens (2001) and Amenta and Hicks (2010) review a vast literature thatattempts to explain the development of the welfare state based on different theories. Bothworks state that this literature includes but is not limited to modernization (Wilkensky,1975), class struggle (Stephens, 1979; Korpi, 1983, 1989; Hicks and Swank, 1984;Esping-Andersen, 1985;1990), political partisanship (Castles, 1989), political institutionslike states and party systems (Heclo, 1974; eir et al., 1988; Skocpol, 1988, 1992; Orloff,1993a; Pierson, 1994), interest groups (Pampel and Williamson, 1989), social movements(Amenta et al., 2005), cultural, world-societal influence (Strang and Chang, 1993), andgender (Orloff, 1993b). Another part of the literature aims to configure welfare regimes,following up the seminal work of Esping-Andersen (1990).
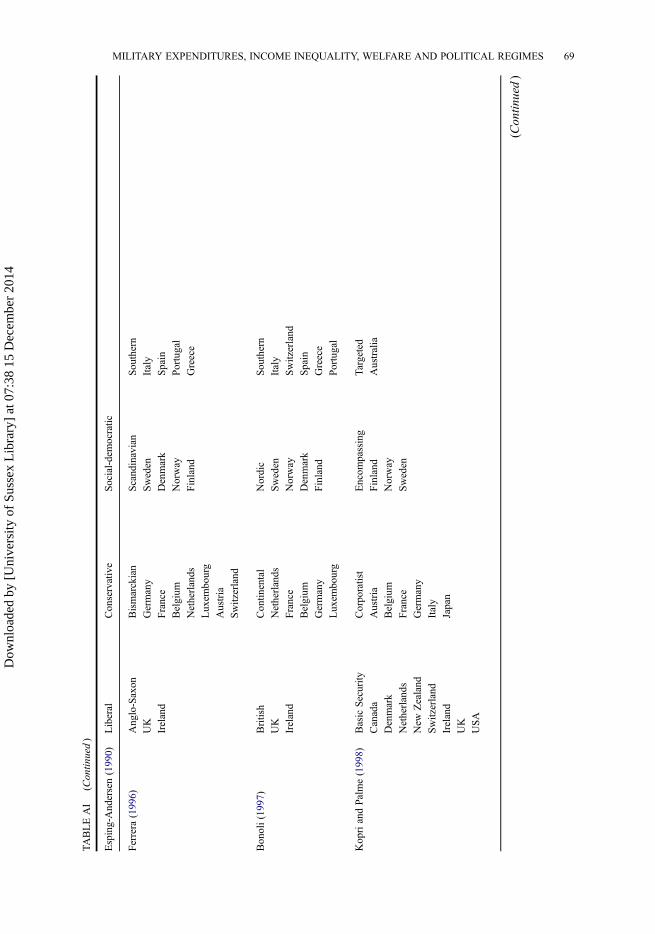
The main typologies of welfare regimes are presented in Table AI in the Appendix.Based on this literature, we constructed our general groups in order to see if there is anybasic distinction between these regime types in terms of military expenditures and income
1In this context, only three studies that are worth mentioning are Moon and Dixon (1985), Dixon and Moon(1986) that analyzes different welfare spending with respect to Blondel’s (1969) political regime categorization(cited in Gough, 2000), and Huber and Stephens (2001) that considers military spending as a percentage of GDPas an explanatory variable for social security benefit expenditure in analysis of the development of the welfarestate.
50 Ü. TÖNGÜR AND A. Y. ELVEREN
Dow
nloa
ded
by [
Uni
vers
ity o
f Su
ssex
Lib
rary
] at
07:
38 1
5 D
ecem
ber
2014

inequality. How a government distributes its scarce resources – for example, between socialand military spending – is determined by the evolution of its political institutions. In thiscontext, it is relevant to expect different trajectories of military expenditures and incomeinequality between different welfare regimes, where the degree of decommodification andthe kind of stratification are the main determinants of the regimes (Esping-Andersen, 1990).That is, one can expect that the guns-and-butter trade-off exists for welfare regimes,whereas more developed (i.e. more generous) regimes are more likely to spend less onmilitary expenditures and are therefore likely to have better income distribution. In thissense, we expect that social democratic welfare regimes, who allocate more resources to‘butter,’ should spend less on armament and therefore have lower income inequality.
2.2. Military Expenditures and Income Inequality Relationship
The causality between military expenditures and income inequality can be explained fromfour different approaches (Dixon and Moon, 1986; Lin and Ali, 2009, p. 673). First, thetraditional Keynesian theory contends that higher military expenditure leads to higheraggregate demand and employment in the economy. Since this expansion in the economybenefits the poor relatively more it improves income distribution. Second, according tomicroeconomic theory, since labor in military-related industries is better paid than othersectors, as military expenditures increases, the pay gaps between sectors will rise (Ali,2007, p. 520). Third, since military spending includes both payments for less-skilled laborand for skilled R&D personnel, their relative shares may have different impacts on the wagediscrepancy (Lin and Ali, 2009, p. 674). Finally, the welfare states have a constraint inredistributing wealth in the economy. The size of the budget causes governments to decidebetween different expenditure types. Simply, it can be argued that those that have highermilitary spending have fewer funds for social expenditures such as education, health, andsocial transfers. However, there are no consistent results in the literature on the welfare–defense trade-off (Dunne, 2000; Yildirim and Sezgin, 2002).
Compared with studies on the relationships with other macroeconomic variables such aseconomic growth, unemployment, and poverty, the literature on the relationship betweenmilitary spending and income inequality is very limited (Abell, 1994; Seiglie, 1997; Ali,2007, 2012; Vadlamannati, 2008; Hirnissa et al., 2009; Lin and Ali, 2009; Elveren, 2012;Kentor et al., 2012). Except for Lin and Ali (2009), where authors argue for no causalitybetween military spending and income inequality, other studies in general find that highermilitary spending cause higher income inequality in the countries in question.
2.3. Political Regimes-military Expenditures-income Inequality
In terms of the relationship between political regimes and military expenditures, theempirical literature shows that a guns-and-butter trade-off exists (Hewitt, 1992; Sandler andHartley, 1995; Goldsmith, 2003; cited by Carter and Palmer, 2010; Ali, 2011). Thistrade-off is much steeper for non-democratic countries than for democratic countries.Additionally, democratic countries alter their allocations between social and military spend-ing less than autocracies during times of war (see Carter and Palmer 2010 for a theoreticaldiscussion behind the trade-off).
The relationship between political regimes and income inequality has also received atten-tion from scholars (see Kemp-Benedict, 2011 for a survey). The literature yields thatdemocracy reduces economic inequality (Dixon and Moon, 1986; Bourguignon and Verdier,2000; Acemoglu and Robinson, 2001; Reuveny and Li, 2003; Chong, 2004; Hsu, 2009 for
MILITARY EXPENDITURES, INCOME INEQUALITY, WELFARE AND POLITICAL REGIMES 51
Dow
nloa
ded
by [
Uni
vers
ity o
f Su
ssex
Lib
rary
] at
07:
38 1
5 D
ecem
ber
2014

further discussion). Reviewing the extensive literature on the relationship between democ-racy and inequality, Gradstein and Milanovic (2000) argues that ‘while the earlier researchfailed to detect any significant correlation between democracy and inequality, more recentstudies based on improved data sets and bigger data samples typically cautiously suggestexistence of a negative relationship between the two’ (cited in Hsu, 2009 p. 21). Hsu(2009) argues that the major problem in investigating this causal relationship between twois the reliability of measures for inequality. She argues that Deininger and Squire (1996)data-set is plagued by sparse data coverage and heterogeneous methods and definitions,which cause unreliable outcomes. Therefore, Hsu (2009) investigates the relationshipbetween political regimes and income inequality by utilizing the UTIP-UNIDO data-set,which measures the pay inequality in the manufacturing sector using Theil T Statistics, as aproxy for economic inequality. She establishes an original, categorical data-set on regimesfor the 1963–2002 period. Hsu shows that the type of political regimes influences economicinequality, but not exactly as the conventional argument suggests. That is, she finds that‘communist countries and Islamic republics are more equal than their economic characteris-tics would predict, while conservative (as distinct from social) democracies are somewhatless equal than otherwise expected’ (Hsu, 2009, p. 1).
3. DATA AND METHODOLOGY
3.1. Data
This study utilizes nine variables in five main categories for 37 countries (see Table AI inthe Appendix2) including level of military activities, inequality indicator, economicmeasures, types of welfare regimes, and political regimes (see Table I).
3.1.1. Military variables
In order to measure the size of military expenditures, we prefer using the share of militaryexpenditures in central government expenditures, MECGE. These data are taken from theUnited States Department of State’s Bureau of Verification and Compliance (BVC).Alternatives to this measure are share of the military expenditures in GDP or GNP.However, since we construct our model based on the fact that there is a trade-off betweendifferent expenditures in the budget, we do not use the share of GDP or GNP.3
Other variables to measure the military activities are the armed forces per 1000 people(AF) and share of arms imports in total imports (ARMIMP), both of which are provided byBVC. We also consider the number of terror events (TERROR), a possible factor that influ-ences the size of military expenditures. We derive this variable from the Global TerrorismDatabase (2012).
3.1.2. Inequality indicators
The inequality indicator, THEIL, is the industrial pay inequality index (UTIP-UNIDO) pro-vided by the University of Texas Inequality Project (UTIP). Utilizing Theil T Statistic(Theil, 1972) UTIP computes the pay inequality index for 156 countries for the 1963–2002
2Initial number of countries was 44 based on our welfare regime categorizations. Nevertheless, as showed in theTable AI in the Appendix due to missing values of some variables the number drops to 37.
3However, it is worth noting that the results do not change remarkably when the regressions are iterated withthe share of military expenditures in GDP or GNP.
52 Ü. TÖNGÜR AND A. Y. ELVEREN
Dow
nloa
ded
by [
Uni
vers
ity o
f Su
ssex
Lib
rary
] at
07:
38 1
5 D
ecem
ber
2014
period. The same group also calculated the Estimated Household Income Inequality (EHII)by combining UTIP-UNIDO and Deininger and Squire (1996) data-sets in the Gini format(please see UTIP (2012) and Galbraith and Kum (2005) for further information about calcu-lation). Although we acknowledge that the manufacturing is a part of overall economicactivity, we consider manufacturing pay inequality to be an appropriate indicator of theoverall income inequality in line with the detailed discussions in Galbraith and Conceição(2001) and Galbraith and Kum (2005). We replicate4 our analysis for both data-sets sincethe correlation coefficient between them is 0.753 (Lin and Ali, 2009, p. 677).
3.1.3. Economic indicators
We use real GDP per capita in 2000 prices, RGDP, and GDP growth, GROWTH providedby BVC.
3.1.4. The type of welfare regimes
There are different welfare regime categorizations based on different methods, assumptions,and theoretical approaches. However, constructing an original category is far beyond thescope of this article. Rather, our pseudo-welfare regime categorization is simply a combina-tion of major welfare regime categorizations that we review in Table AI in the Appendix.Although we acknowledge that there are some shortcomings of these categorizations ingeneral and of our own simplification in particular, we still argue that this simplificationdoes not prevent us from making some general remarks about the relationship betweeninequality, military expenditures, and welfare regimes. This is primarily because weconsider a variety of major welfare regime types in the literature that display remarkably
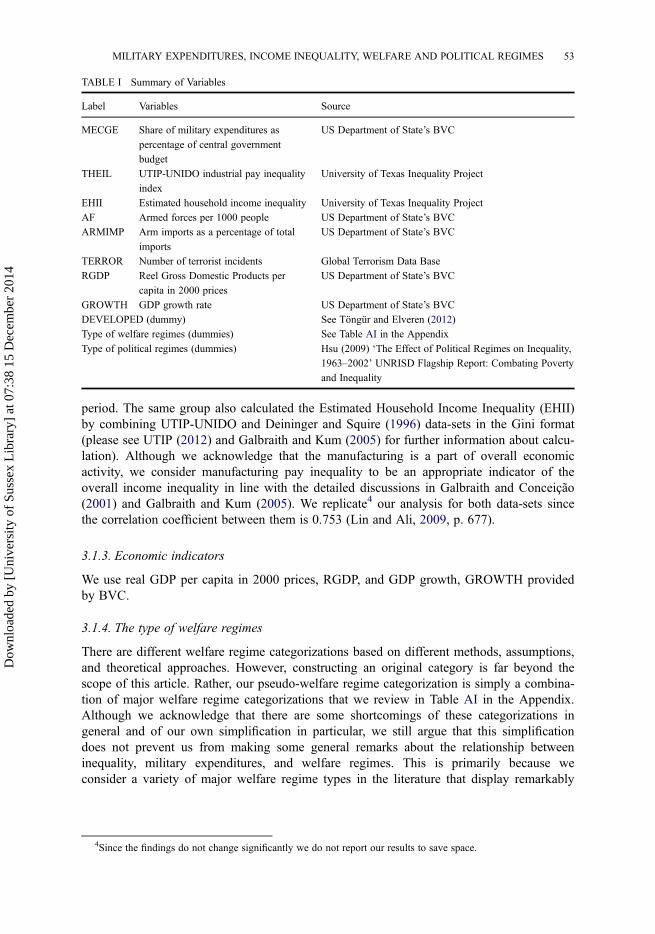
TABLE I Summary of Variables
Label Variables Source
MECGE Share of military expenditures as
percentage of central government
budget
US Department of State’s BVC
THEIL UTIP-UNIDO industrial pay inequality
index
University of Texas Inequality Project
EHII Estimated household income inequality University of Texas Inequality Project
AF Armed forces per 1000 people US Department of State’s BVC
ARMIMP Arm imports as a percentage of total
imports
US Department of State’s BVC
TERROR Number of terrorist incidents Global Terrorism Data Base
RGDP Reel Gross Domestic Products per
capita in 2000 prices
US Department of State’s BVC
GROWTH GDP growth rate US Department of State’s BVC
DEVELOPED (dummy) See Töngür and Elveren (2012)
Type of welfare regimes (dummies) See Table AI in the Appendix
Type of political regimes (dummies) Hsu (2009) ‘The Effect of Political Regimes on Inequality,
1963–2002’ UNRISD Flagship Report: Combating Poverty
and Inequality
4Since the findings do not change significantly we do not report our results to save space.
MILITARY EXPENDITURES, INCOME INEQUALITY, WELFARE AND POLITICAL REGIMES 53
Dow
nloa
ded
by [
Uni
vers
ity o
f Su
ssex
Lib
rary
] at
07:
38 1
5 D
ecem
ber
2014

different characteristics.5 Our liberal (LIBERAL) and social-democratic (SOCDEM) welfareregime categories represent the general outcome of all major classifications. For thecorporatist (CORPORATIST) regime, on the other hand, we combine all common countrieslabeled as corporatist and Southern or Latin Rim countries. We also incorporate Turkey intothis group (Gough, 1996; Buğra and Keyder, 2003). We construct a productivist(PRODUCTIVIST) welfare regime based on Holliday (2000), Aspalter (2006), Lee and Ku(2007), and Rudra (2007). Finally, we labeled the last category POST-COMM and includeall post-communist European and post-USSR countries based on categorizations of andcountries under Fenger (2007) and Whelan and Maitre (2008).
3.1.5. Type of political regimes
We use Hsu (2009)’s political regimes classification,6 namely, social democracy (SDEM),conservative democracy (CDEM), communist (COMM), and civil war (CWAR). We preferusing this set of categorization because it is the most recent data-set that excludes methodo-logical problems. The data-set is also important in our case as we examine the effect ofinequality accounting for political regimes. Because, as the author states ‘[s]uch a typologyneed not and should not presume anything about the direction of effect of any particularregime type on inequality: that much can be determined from data’ (Hsu, 2009, p. 4).
3.1.6. Developed-developing countries
We categorize our countries as developed and developing, based on GDP per capita (seeTöngür and Elveren, 2012).
Table II provides descriptive statistics of variables categorized by welfare regimes (pleasesee Table AIII in the Appendix for political regimes). The table shows that the social demo-cratic welfare regime, which we take as a base category in our analysis, has the lowestinequality, number of terrorist incidents, and military expenditures, and the highest realGDP per capita. Productivist welfare regimes have the highest military expenditure as ashare of government budget, greatest inequality, largest armed forces, and the most growth.
3.2. Empirical Strategy
We use a dynamic panel method in order to analyze the relationship between militaryexpenditures, income inequality, and welfare and political regimes.
In the context of our empirical approach, we employ a dynamic specification in order toaccount for the occurrence of significant lagged effects of the dependent variable whichdetermine serial correlation in the dependent variable. Regression specification for dynamicpanel structure is as follows:
MECGEit ¼ aþ b1MECGEit�1 þ b2MECGEit�2 þ cXit þ ei þ gt þ uit (1)
where the subscripts i and t denote countries and years, respectively.
5For instance, although we acknowledge that Spain, Italy, Portugal, Greece, and Turkey can be categorized as adistinct group of so-called Southern/Latin Rim countries (see Table AI in the Appendix), we prefer to categorizethem under general corporatist regime since we believe their differences with these regimes (i.e. higher role of fam-ily in provision of welfare) are not relevant in our context. As a matter of fact, our regressions yield very similarresults when we take the Southern welfare regime as a separate category.
6The original classification of Hsu (2009) includes more classifications, namely, European Colony, One-partyDemocracy, Islamic Republic, Military Dictatorship and Dictatorship.
54 Ü. TÖNGÜR AND A. Y. ELVEREN
Dow
nloa
ded
by [
Uni
vers
ity o
f Su
ssex
Lib
rary
] at
07:
38 1
5 D
ecem
ber
2014
Dependent variable is the share of military expenditures as a percentage of centralgovernment budget (MECGEit). The right-hand side also includes first and second lagvalues of MECGEit. Since our dependent variable is military expenditures as a share ofcentral government budget, we wanted to consider the effect of the second lag as wellbecause due to the nature of the budgeting process the effect of independent variables mightbe more likely to be seen with a two-year lag. Based on the same reasoning, we presumethat using further lags would not be appropriate not just due to the problem of the degreesof freedom but also because of the logic of the budgeting process.
Xit is the set of explanatory variables including UTIP-UNIDO industrial pay inequalityindex (THEIL), armed forces per 1000 people (AF), arm imports as a percentage of totalimports (ARMIMP), number of terrorist incidents (TERROR), real gross domestic productsper capita (RGDP), and GDP growth (GROWTH). Xit also includes several dummies forwelfare regimes (social-democratic, liberal, corporatist, productivist, and POST-COMM),political regimes (SDEM, CDEM, COMM, and CWAR), and developed countries in someregressions. εi are the unobserved country specific fixed-effects, ηt are year dummies, andfinally uit are the identically and independently distributed error terms.
Estimating Equation (1) with Ordinary Least Square (OLS) method in a lack of a panelsetting can be problematic. First of all, OLS ignores the individual fixed effects forcountries. Some serial correlation problems may arise in dynamic OLS regressions. Also,some regressors may be endogenous.
In order to control for individual fixed effects (εi), we can write Equation (1) indifferences. The first differencing specification is thus as follows:
DMECGEit ¼ aþ b1DMECGEit�1 þ b2DMECGEit�2 þ cDXit þ gt þ Duit (2)
where Δ is the first difference operator.First differencing removes any potential bias that could be sourced from fixed country-
specific effect (unobserved heterogeneity). To control the endogeneity problem, Arellanoand Bond (1991) proposed using a generalized method of moment (GMM) estimation, inwhich the use of lagged levels of the regressors as instruments for the first-differencedregressors (difference GMM). That is, difference GMM uses historical (lagged) values ofregressors for current changes in these variables.
However, the difference GMM estimator is weak or the regressors may be poorinstruments if cross-section variability dominates time variability and if there is a strongpersistence in the examined time series (Bond et al., 2001). To solve this problem, Arellanoand Bover (1995), and Blundell and Bond (1998) recommend an augmented version ofdifference GMM. The system GMM estimator takes into account both equations; a set offirst-differenced equations with equations in levels as a system. System GMM employsdifferent instruments for each estimated equation simultaneously. Particularly, this methodcomprises the use of lagged levels of the regressors as instruments for the difference equa-tion and the use of lagged first-differences of the regressors as instruments for the levelsequation. Moreover, system GMM allows to control for the dynamics of adjustment byincluding a lagged endogenous variable among the exogenous variables. Therefore, systemGMM implies an efficiency gain by using additional instruments.
System GMM is widely used for the empirical models in the literature, which allows fewtime periods and many individuals, i.e. small T, large N; some endogenous variables; andfixed effects. Also GMM considers heteroskedasticity and autocorrelation (Roodman,2009).
MILITARY EXPENDITURES, INCOME INEQUALITY, WELFARE AND POLITICAL REGIMES 55
Dow
nloa
ded
by [
Uni
vers
ity o
f Su
ssex
Lib
rary
] at
07:
38 1
5 D
ecem
ber
2014

Based on the related literature covered above our main hypotheses in this paper are asfollows:
Hypothesis 1: Countries with more deteriorated income distribution spend more on military, and vice versa.In other words, higher income inequality within a country is associated with higher level of militaryexpenditures in that country.
Hypothesis 2: Social democratic welfare regimes have a tendency to spend less on military expenditures.
Hypothesis 3: Higher democracy is associated with less military expenditures.
4. RESULTS AND DISCUSSION
We employ System GMM analysis based on an unbalanced data-set, in order to investigatethe relationship between military expenditures and inequality in the context of differentpolitical and welfare regimes.7 Our dynamic panel approach uses System-GMM based onRoodman.8 and Roodman (2009). We used an AR(1) and an AR(2) model to capture thepersistence in our data. In addition, AR(1) and AR(2) models are desirable based on theArellano–Bond test for AR(2). To consider any cross-sectional dependence, we includedtime dummies as instruments in some regressions. Since there may be an endogeneity prob-lem for most of our explanatory variables, we set THEIL, AF, ARMIMP, RGDP,GROWTH, and first and second lags of the dependent variable (MECGE) as endogenous.In order to avoid over-identification we used the collapse option, hence the GMM instru-ment is constructed by creating one instrument for each variable and lag distance (ratherthan one for each time period, variable, and lag distance). The other independent variablesare instrumented as suggested by Roodman (2009). In other words, the other explanatoryvariables are treated as typical instrumental variables instead of GMM because they areassumed to be exogenous. All estimations were conducted with two-step efficient GMM tofix any non-spherical errors, and small sample corrections (Windmeijer-corrected standarderrors) to the covariance matrix estimate (Windmeijer, 2005).
The estimated models pass the specification tests. According to Arellano-Bond teststatistics for AR(1) and AR(2), the consistency of the GMM estimators is verified, as thereis no evidence of a second-order serial correlation in the differenced residuals of themodels. The Hansen test statistics approve the validity of the GMM instruments. Finally,the Difference-Hansen test statistics provide no evidence to reject the null hypothesis of thevalidity of the additional moment conditions used in the system GMM estimations.
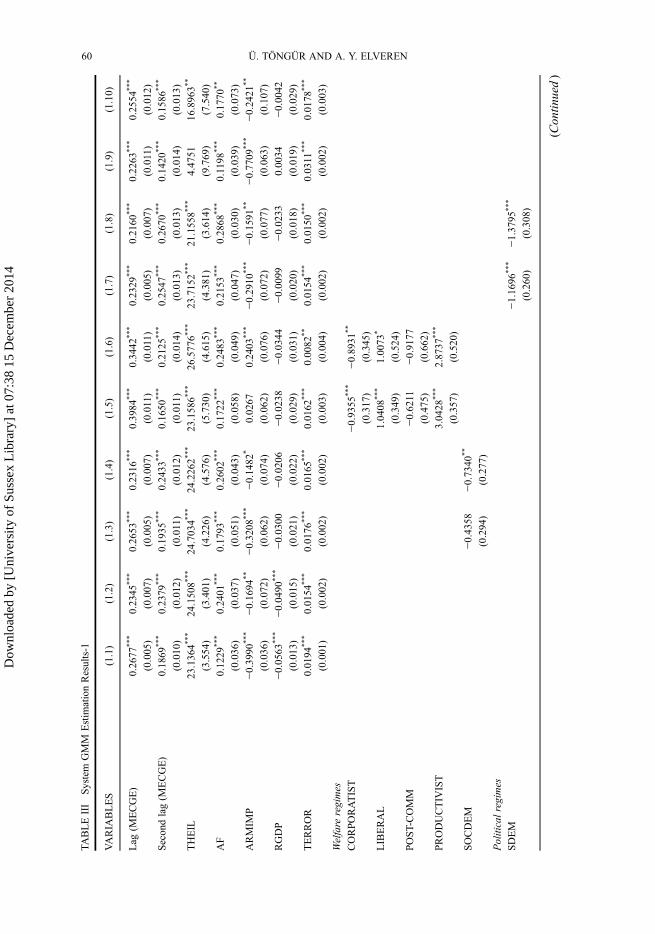
Table III provides system GMM estimation results. All variables, except for RGDP, aresignificant, most at the 1% level. Dynamic panel analyses’ findings in the table show thatlagged values of military expenditures have a positive effect on their present value. Theresults show that as inequality (THEIL), the size of armed forces (AF), and number of terroroccurrences (TERROR) increase military expenditures as a percentage of governmentexpenditures (MECGE) increase as well (Model 1.1). On the other hand, arm imports as apercentage of total imports (ARMIMP) and real GDP per capita (RGDP) have negativerelationships with military expenditure. These relationships are also valid when yeardummies are added (Model 1.2).
While the explanation for the positive relationship between income inequality, armedforces, terror, and share of military expenditure in the central government budget is more
7All regressions are repeated for the case where income inequality is dependent variable. To save space thoseresults are not reported.
8Roodman (2006) develops ‘the xtabond2’ command for use with STATA.
56 Ü. TÖNGÜR AND A. Y. ELVEREN
Dow
nloa
ded
by [
Uni
vers
ity o
f Su
ssex
Lib
rary
] at
07:
38 1
5 D
ecem
ber
2014

straightforward, the impact of the share of arms imports in total imports and real GDP percapita deserves more attention. Before discussing the latter two variables, we note that thenegative sign of income inequality in each different model we define in our paper can beused as clear evidence, in line with the previous literature, that our Hypothesis1 thatcountries with more deteriorated income distribution spend more on military, and viceversa holds. Regarding arms imports to total imports, the ratio can increase either if armsimports increase (more than the increase in total imports) or total imports decrease (morethan the decrease in arms imports). Considering its comparative advantage in trade, it couldbe the case that the country can obtain armaments at relatively lower cost by importingrather than producing them domestically. Therefore, the country spends less on armamentsas a share of budget. In our estimation results, ‘arms imports to total imports’ have anegative sign. This is true not just in the baseline regressions but also when the model iscontrolled for the welfare regimes by using dummy variable for being a ‘social democraticwelfare regime’ (Model 2.6). In addition, the coefficient remains negative when the modelis controlled for all welfare regime types by taking ‘social democratic welfare regime’ asthe base category, and also controlled for all political regimes. Hence, our data support thecomparative advantage argument for these countries since they spend less on armaments asa share of budget.9
Regarding real GDP per capita, it can be argued that as the country becomes affluent,greater democracy causes lower military expenditures as the theoretical and empirical stud-ies suggest (Carter and Palmer, 2010). Or, as the economy develops, the share of militaryexpenditures shrinks as the total government budget expands. However, it is of importanceto note that except for the first two base models, RGDP is not a statistically significantvariable in the context of welfare and political regimes.
As another exercise, we attempt to examine the effect of being in a social democraticwelfare regime, our base regime type, since it is the most developed (i.e. generous/advanced) welfare system. Similarly, inequality, armed forces, and terror are also statisti-cally significant variables in explaining the share of military expenditures. Being in asocial democratic welfare state decreases the share of the military expenditures when theyear dummy is added (Model 1.4). When we compare other welfare regime types withthe social democratic one (Model 1.5 and 1.6), we find that while liberal or productivistwelfare regime are likely to have higher military expenditures, corporatist or POST-COMM tend to spend less on armament. It is also worth noting that correlation between‘total world military spending’ and ‘real military expenditure per capita’ is the lowestfor social democratic welfare regime (as well as SDEM political regime), which imply-ing that neighborhood effects (i.e. arms races) is lower compared with other groups ofcountries (see Table AII in the Appendix). This finding also indirectly supports thegeneral findings of the paper that social democratic welfare regimes are likely to spendless on military expenditures compared to other welfare regimes. All of these findings
9On the other hand, when the model is controlled for the welfare regimes the coefficient of ‘arms importsto total imports’ becomes positive only in two models (i.e. 1.6 and 2.5). It can be argued that depending uponthe variables included in these two regressions, the mechanism of comparative advantage may not work forsome countries. In fact, out of a total of 20 models in Tables III and IV, the variable has a positive sign (andsignificant) only in models 1.6 and 2.5. This result suggests that the relationship between military expendituresas a share of central government budget and arm imports in the context of welfare regimes is complicated, andit requires a more detailed analysis. However, such analysis is out of the scope of this study and might be atopic for future studies.
MILITARY EXPENDITURES, INCOME INEQUALITY, WELFARE AND POLITICAL REGIMES 57
Dow
nloa
ded
by [
Uni
vers
ity o
f Su
ssex
Lib
rary
] at
07:
38 1
5 D
ecem
ber
2014

TABLE II Summary Statistics of the Variables According to the Welfare Regimes
Variables Welfare regimes Mean SD Min Max
MECGE Corporatist 5.69 3.584 1.5 20.3
Liberal 8 5.301 1.8 25.5
Postcomm 7.457 6.07 1.3 35.4
Productivist 16.92 9.146 4.2 36.6
Social democrat 4.935 0.833 3.6 7
Overall 8.054 6.669 1 36.6
THEIL Corporatist 0.028 0.0186 0.0085 0.09
Liberal 0.0286 0.0233 0.0114 0.134
Postcomm 0.0303 0.0213 0.0038 0.093
Productivist 0.0327 0.018 0.0064 0.08
Social democrat 0.0074 0.0026 0.0028 0.01
Overall 0.0275 0.0204 0.0028 0.134
AF Corporatist 6.908 4.315 2.3 20.5
Liberal 3.743 1.489 1.9 9.1
Postcomm 5.977 3.404 1 21.9
Productivist 10.15 6.62 1.9 21.2
Social democrat 6.312 1.724 3.7 12
Overall 6.532 4.349 1 21.9
ARMIMP Corporatist 1.182 1.813 0 8.6
Liberal 0.906 0.953 0 4.5
Postcomm 0.711 1.502 0 14.3
Productivist 1.164 1.09 0.1 8.1
Social democrat 0.938 0.73 0.2 3.4
Overall 0.966 1.434 0 14.3
RGDP Corporatist 19.62 9.887 3.211 51.98
Liberal 21.53 6.643 10.93 37.7
Postcomm 2.839 1.769 0.346 6.775
Productivist 15.75 12.5 0.373 38.97
Social democrat 26.99 5.614 17.65 40.62
Overall 14.59 11.63 0.346 51.98
GROWTH Corporatist 2.766 2.333 −5.7 9.8
Liberal 3.549 2.36 −2.09 11.46
Postcomm 0.408 8.465 −44.9 12.1
Productivist 5.986 4.184 −7.36 14.2
Social democrat 2.387 2.158 −6 6.21
Overall 2.555 5.624 −44.9 14.2
TERROR Corporatist 23.64 54.6 0 515
Liberal 10.36 16.12 0 76
Postcomm 5.762 16.93 0 117
Productivist 4.256 11.44 0 92
Social democrat 0.985 2.041 0 12
Overall 10.873 32.834 0 515
58 Ü. TÖNGÜR AND A. Y. ELVEREN
Dow
nloa
ded
by [
Uni
vers
ity o
f Su
ssex
Lib
rary
] at
07:
38 1
5 D
ecem
ber
2014
support the Hypothesis 2 that social democratic welfare regimes have tendency to spendless on military expenditures.
In the same manner, we repeat the analyses for political regimes.10 The results show that,being a SDEM political regime reduces military expenditures significantly regardless ofyear dummies (Model 1.7 and 1.8). Compared to SDEM, being a COMM, CWAR, orCDEM tend to spend more on the military as a share of central government expenditures.These results are unchanged when we consider year dummies (Model 1.9 and 1.10).Altogether, these findings are consistent with our Hypothesis 3 that higher democracy isassociated with less military expenditures.
Table IV present the results of a similar analysis, where GDP growth (GROWTH)replaces real GDP per capita (RGDP). This is of importance because real GDP per capitadoes not necessarily yield the same results as GDP growth. As a matter of fact, Table IVshows that, opposite to real GDP, which is not significant except in the first two models,growth has a positive (i.e. increasing) and statistically significant impact on military expen-diture as a share of central budget government in each model. Another change in results isobserved in Models 2.5 and 2.6, which suggest that compared to social democratic welfareregimes, POST-COMM welfare regime countries are likely to spend more on militaryexpenditures. This result is also in line with the general findings of the paper in that socialdemocratic welfare regimes are likely to have less military expenditures. In fact, in a gen-eral sense the results of Table IV are consistent with the Table III, which increases the cred-ibility of the general findings of the paper.
Our final set of estimations aims at analyzing being a developed country (determined interms of GDP per capita), regardless of welfare regime or political regime category.11
The general findings of the study can be summarized as follows. First, the positive rela-tionship between income inequality, represented by Theil inequality index, and the share ofmilitary expenditures observed, in both cases where both variables are dependent, supportsthe early findings of Ali (2007) – that as military expenditure increases inequality increases.
Second, there is a statistically significant negative relationship between military expendi-tures and both social democratic welfare regime and SDEM political regime for each modeland method we employed in the study. This is a new finding in the immense literature onthe welfare regimes. Considering the finding in the literature that higher military spendingis associated with higher income inequality, our finding that, compared to other regimes theshare of military expenditures in social democratic welfare regimes is lower, is alsoconsistent with the other core findings of the literature that higher democracy improvesincome distribution.
Third, our findings also confirm and support Ali’s (2007) findings that terror is asignificant factor that affects both the level of military expenditure and inequality.12
10We acknowledge that it is possible to analyze the relationship between political regimes and military expendi-tures for more countries, rather than 37 as in our case. However, the main goal of this paper is to analyze the rela-tionship between military expenditures and the welfare regime types defined in the existing empirical literature.Therefore, we consider political regimes just to compare and check our findings for the countries in question. Aspecial focus on political regimes and military expenditures for a wide range of countries might be the interest offuture studies.
11Here we would like to see if there is a significant differences between developed and developing countries interms of military expenditure. In order to save space, we do not provide the results here; however, one may referTöngür and Elveren (2012), where our findings show that developed countries have a lower share of militaryexpenditures in budgetary spending compared to developing ones.
12We acknowledge that inequality is only one of several other determinants of terrorism, and our results are nota evidence for a direct causality between the variables but rather a supportive evidence to the literature that con-tends that inequality is one root causes of terrorism (see inter alia Krieger and Meierrieks, 2009 and Derin-Güreand Elveren, 2013 for further discussion).
MILITARY EXPENDITURES, INCOME INEQUALITY, WELFARE AND POLITICAL REGIMES 59
Dow
nloa
ded
by [
Uni
vers
ity o
f Su
ssex
Lib
rary
] at
07:
38 1
5 D
ecem
ber
2014
TABLEIII
System
GMM
Estim
ationResults-1
VARIA
BLES
(1.1)
(1.2)
(1.3)
(1.4)
(1.5)
(1.6)
(1.7)
(1.8)
(1.9)
(1.10)
Lag
(MECGE)
0.2677
***
(0.005
)
0.2345
***
(0.007
)
0.26
53***
(0.005
)
0.2316
***
(0.007
)
0.3984
***
(0.011)
0.3442
***
(0.011)
0.2329
***
(0.005
)
0.2160
***
(0.007
)
0.22
63***
(0.011)
0.25
54***
(0.012
)
Secondlag(M
ECGE)
0.1869
***
(0.010
)
0.2379
***
(0.012
)
0.19
35***
(0.011)
0.2433
***
(0.012
)
0.1650
***
(0.011)
0.2125
***
(0.014
)
0.2547
***
(0.013
)
0.2670
***
(0.013
)
0.14
20***
(0.014
)
0.15
86***
(0.013
)
THEIL
23.136
4***
(3.554
)
24.150
8***
(3.401
)
24.703
4***
(4.226
)
24.226
2***
(4.576
)
23.158
6***
(5.730
)
26.577
6***
(4.615
)
23.715
2***
(4.381
)
21.155
8***
(3.614
)
4.47
51
(9.769
)
16.896
3**
(7.540
)
AF
0.1229
***
(0.036
)
0.2401
***
(0.037
)
0.17
93***
(0.051
)
0.2602
***
(0.043
)
0.1722
***
(0.058
)
0.2483
***
(0.049
)
0.2153
***
(0.047
)
0.2868
***
(0.030
)
0.1198
***
(0.039
)
0.1770
**
(0.073
)
ARMIM
P−0.3990
***
(0.036
)
−0.1694
**
(0.072
)
−0.3208
***
(0.062
)
−0.1482
*
(0.074
)
0.0267
(0.062
)
0.2403
***
(0.076
)
−0.2910
***
(0.072
)
−0.1591
**
(0.077
)
−0.7709
***
(0.063
)
−0.24
21**
(0.107
)
RGDP
−0.0563
***
(0.013
)
−0.04
90***
(0.015
)
−0.0300
(0.021
)
−0.0206
(0.022
)
−0.02
38
(0.029
)
−0.03
44
(0.031
)
−0.00
99
(0.020
)
−0.0233
(0.018
)
0.00
34
(0.019
)
−0.0042
(0.029
)
TERROR
0.0194
***
(0.001
)
0.0154
***
(0.002
)
0.01
76***
(0.002
)
0.0165
***
(0.002
)
0.0162
***
(0.003
)
0.00
82**
(0.004
)
0.0154
***
(0.002
)
0.0150
***
(0.002
)
0.03
11***
(0.002
)
0.01
78***
(0.003
)
Welfare
regimes
CORPORATIST
−0.93
55***
(0.317
)
−0.8931
**
(0.345
)
LIBERAL
1.0408
***
(0.349
)
1.0073
*
(0.524
)
POST-COMM
−0.62
11
(0.475
)
−0.91
77
(0.662
)
PRODUCTIV
IST
3.0428
***
(0.357
)
2.8737
***
(0.520
)
SOCDEM
−0.4358
(0.294
)
−0.73
40**
(0.277
)
Politicalregimes
SDEM
−1.1696
***
(0.260
)
−1.37
95***
(0.308
)
(Contin
ued)
60 Ü. TÖNGÜR AND A. Y. ELVEREN
Dow
nloa
ded
by [
Uni
vers
ity o
f Su
ssex
Lib
rary
] at
07:
38 1
5 D
ecem
ber
2014

TABLEIII
(Con
tinued)
VARIA
BLES
(1.1)
(1.2)
(1.3)
(1.4)
(1.5)
(1.6)
(1.7)
(1.8)
(1.9)
(1.10)
CDEM
1.7575
**
(0.729
)
1.70
05***
(0.482
)
COMM
12.672
6***
(2.468
)
13.107
1***
(1.552
)
CWAR
11.8363*
**
(0.788
)
8.92
16***
(0.992
)
Con
stant
3.60
11***
(0.597
)
2.5172
***
(0.554
)
2.71
42***
(0.856
)
1.9467
**
(0.728
)
1.3899
(1.051
)
1.0267
(1.086
)
2.1157
**
(0.848
)
2.1306
***
(0.549
)
2.42
44***
(0.649
)
1.12
03
(0.966
)
Observatio
ns30
330
330
330
330
330
330
230
230
230
2
Num
berof
countries
3737
3737
3737
3737
3737
Yeardummiesas
instruments
No
Yes
No
Yes
No
Yes
No
Yes
No
Yes
F-statistic
20250.37
5028.48
5335
.52
2453
.85
1870.76
1962.46
18943.60
2052.53
4747
2.72
2946
.09
pvalue
0.000
0.000
0.00
00.000
0.000
0.000
0.000
0.000
0.00
00.00
0
Arellano–B
ondtestforAR(1)
−1.15
−1.08
−1.09
−1.06
−1.20
−1.07
−1.02
−1.05
−1.32
−1.12
pvalue
0.250
0.280
0.27
70.289
0.230
0.283
0.306
0292
0.18
70.26
3
Arellano–B
ondtestforAR(2)
−0.95
−1.00
−1.01
−1.00
−0.98
−1.09
−1.05
−1.02
−0.90
−1.02
pvalue
0.340
0.316
0.31
20.319
0.329
0.277
0.295
0307
0.36
90.30
6
Hansentestforov
eridentifi
catio
n
(p-value)
0.441
0.899
0.54
60.924
0.777
0.999
0.618
0.934
0.50
10.94
1
Diff-in-H
ansenTestsforExogeneity
ofGMM
Instruments(p
value)
0.551
0.673
0.56
40.743
0.640
0.957
0.563
0786
0.56
70.81
0
Notes:Allestim
ations
wereconductedwith
two-step
efficientGMM
andsm
allsamplecorrectio
nsto
thecovariance
matrixestim
ate.Standarderrors
inparentheses.
***p<0.01.
**p<0.05.
*p<0.10.
MILITARY EXPENDITURES, INCOME INEQUALITY, WELFARE AND POLITICAL REGIMES 61
Dow
nloa
ded
by [
Uni
vers
ity o
f Su
ssex
Lib
rary
] at
07:
38 1
5 D
ecem
ber
2014

TABLEIV
System
GMM
Estim
ationResults-2
VARIA
BLES
(2.1)
(2.2)
(2.3)
(2.4)
(2.5)
(2.6)
(2.7)
(2.8)
(2.9)
(2.10)
Lag
(MECGE)
0.3449
***
(0.003
)
0.32
30***
(0.012
)
0.3480
***
(0.006
)
0.3224
***
(0.010
)
0.45
32***
(0.011)
0.38
13***
(0.010
)
0.31
00***
(0.002
)
0.2973
***
(0.009
)
0.2518
***
(0.010
)
0.2961
***
(0.015
)
Secon
dlag(M
ECGE)
0.1403
***
(0.005
)
0.17
78***
(0.007
)
0.1324
***
(0.005
)
0.1732
***
(0.007
)
0.08
99***
(0.010
)
0.14
45***
(0.010
)
0.19
04***
(0.006
)
0.2006
***
(0.009
)
0.1179
***
(0.016
)
0.1263
***
(0.012
)
THEIL
16.986
8***
(5.079
)
21.687
3***
(4.803
)
26.209
9***
(7.411)
9.8916
**
(3.779
)
23.507
0**
(9.309
)
−0.5038
(5.539
)
10.827
3*
(5.862
)
10.376
5**
(4.885
)
−3.9153
(8.137
)
11.8463
(7.219
)
AF
0.1604
***
(0.030
)
0.22
28***
(0.049
)
0.1871
***
(0.034
)
0.1533
***
(0.036
)
0.17
55***
(0.032
)
0.19
52***
(0.043
)
0.16
24***
(0.021
)
0.2063
***
(0.038
)
0.1112
**
(0.042
)
0.1635
***
(0.043
)
ARMIM
P−0.30
35***
(0.041
)
−0.2921
***
(0.036
)
−0.2351
***
(0.048
)
−0.33
99***
(0.031
)
0.24
23***
(0.061
)
−0.1119
**
(0.051
)
−0.3416
***
(0.041
)
−0.34
75***
(0.045
)
−0.6527
***
(0.053
)
−0.2919
***
(0.088
)
GROWTH
0.1155
***
(0.004
)
0.07
37***
(0.004
)
0.1107
***
(0.004
)
0.0702
***
(0.005
)
0.15
64***
(0.006
)
0.1101
***
(0.005
)
0.08
85***
(0.004
)
0.0573
***
(0.005
)
0.0901
***
(0.006
)
0.0958
***
(0.005
)
TERROR
0.0201
***
(0.001
)
0.01
82***
(0.001
)
0.0185
***
(0.001
)
0.0190
***
(0.001
)
0.01
48***
(0.003
)
0.02
44***
(0.003
)
0.01
88***
(0.001
)
0.0182
***
(0.001
)
0.0302
***
(0.001
)
0.0218
***
(0.002
)
Welfare
regimes
CORPORATIST
−0.7096
***
(0.246
)
−0.8602
(1.346
)
LIBERAL
1.1942
**
(0.470
)
1.7518
**
(0.692
)
POST-COMM
0.61
53
(0.365
)
0.96
18
(1.010
)
PRODUCTIV
IST
3.94
47***
(0.581
)
4.09
85***
(1.162
)
SOCDEM
−0.6855
***
(0.240
)
−1.3150
(2.095
)
Politicalregimes
SDEM
−1.7027
***
(0.320
)
−1.96
09***
(0.171
)
(Contin
ued)
62 Ü. TÖNGÜR AND A. Y. ELVEREN
Dow
nloa
ded
by [
Uni
vers
ity o
f Su
ssex
Lib
rary
] at
07:
38 1
5 D
ecem
ber
2014

TABLEIV
(Con
tinued)
VARIA
BLES
(2.1)
(2.2)
(2.3)
(2.4)
(2.5)
(2.6)
(2.7)
(2.8)
(2.9)
(2.10)
CDEM
2.1520
***
(0.460
)
1.7565
***
(0.447
)
COMM
12.861
3***
(1.331
)
12.128
5***
(1.813
)
CWAR
12.581
2***
(0.746
)
10.581
7***
(0.813
)
Constant
2.0266
***
(0.291
)
1.40
84***
(0.353
)
1.6022
***
(0.462
)
2.4067
***
(0.333
)
0.03
83
(0.381
)
0.96
94
(0.878
)
2.54
28***
(0.343
)
2.4308
***
(0.335
)
2.1024
***
(0.302
)
0.89
86**
(0.402
)
Observatio
ns30
330
330
330
330
330
330
230
230
230
2
Num
berof
coun
tries
3737
3737
3737
3737
3737
Yeardummiesas
instruments
No
Yes
No
Yes
No
Yes
No
Yes
No
Yes
F-statistic
19568.80
2301
4.81
15868.29
13202.41
3396
5.21
21492.60
31336.95
6984.68
1374
2.21
5321.17
pvalue
0.000
0.00
00.000
0.000
0.00
00.00
00.00
00.000
0.00
00.000
Arellano–B
ondtestforAR(1)
−1.20
−1.17
−1.26
−1.18
−1.31
−1.27
−1.14
−1.14
−1.33
−1.30
pvalue
0.231
0.24
40.209
0.238
0.19
00.20
60.25
40.254
0.18
30.195
Arellano–B
ondtestforAR(2)
−0.96
−0.96
−0.90
−0.97
−0.86
−0.93
−0.98
−0.98
−0.88
−0.88
pvalue
0.338
0.33
90.370
0.334
0.38
80.35
20.32
50.328
0.38
10.377
Hansentestforov
eridentifi
catio
n
(p-value)
0.623
0.98
40.881
0.935
0.97
90.98
00.64
60.979
0.67
60.988
Diff-in-H
ansenTestsforExogeneity
ofGMM
Instruments(p
value)
0.263
0.73
70.434
0.803
0.69
10.96
90.42
50.790
0.46
70.866
Notes:Allestim
ations
wereconductedwith
two-step
efficientGMM
andsm
allsamplecorrectio
nsto
thecovariance
matrixestim
ate.
Standarderrors
inparentheses.
***p<0.01.
**p<0.05.
*p<0.10.
MILITARY EXPENDITURES, INCOME INEQUALITY, WELFARE AND POLITICAL REGIMES 63
Dow
nloa
ded
by [
Uni
vers
ity o
f Su
ssex
Lib
rary
] at
07:
38 1
5 D
ecem
ber
2014

Fourth, our findings, which we prefer to report in the working paper edition to savespace, raise a major issue/question about why governments of developing countries havehigher shares of military expenditures than developed economies. Although the answer tothis question is beyond the scope of this study, the correlation coefficients between militaryexpenditures of each group of welfare regimes and total world military expenditures stillprovides a modest indication that one possible factor is due to arms races, in whichdeveloping countries are more likely to follow the world armament trend than developedcountries. Another possible explanation is that since overall budgets of developing countriesare small, the share of military expenditures is high. That means there is a ‘subsistencelevel’ of military spending that each country has to bear, which is not insignificantcompared to total spending.
5. CONCLUSION
The aim of this paper was to investigate the possible relationship between militaryexpenditures, income inequality, and type of welfare regimes and political regimes.Although the literature on the development of welfare regimes is immense, there is lesswork on the relationship between military expenditures and income inequality, and, to thebest of our knowledge there is no work that directly addresses the relationship betweenmilitary spending and inequality in the context of different welfare regimes. We also incor-porated recent data on types of political regimes to capture possible changes in this linkage.To investigate this relationship, we examined 37 major countries across the world for theperiod of 1988–2003 in a panel data analysis by considering some important variables suchas number of terrorist incidents and the size of the armed forces.
This study is relevant because by utilizing the methods for dynamic panel data models, itprovides detailed findings to shed light on the complicated nature of the relationshipbetween defense spending, income inequality, and type of welfare regimes and politicalregimes. Our results confirm and support the earlier findings in the literature. The findingsthat there is a positive relationship between income inequality and share of militaryexpenditures, and that terror is a statistically significant factor that affects both the level ofmilitary expenditure and inequality, are in line with the literature (Ali, 2007). Our findingsalso contribute to the literature by presenting a statistically significant relationship betweensocial democratic welfare and social democratic political regimes and military expenditures.
The study shows that other welfare regimes, except for corporatist, compared social dem-ocratic welfare regime in developing countries with developed ones are more likely to havehigher shares of military expenditures in the central government budget, which supports thefinding that higher democracy is associated with less inequality and military expenditures.
Lack of a more comprehensive data-set that prevents us from examining a longer timeperiod was the main constraint of the study. For further studies in future, availability of datafor more countries and/or for longer time periods would allow one to investigate therelationship in question for various and perhaps larger number of welfare regime types.However, even though we acknowledge this shortcoming due to unavailability of data-sets,we still believe that our early findings present some important findings for the complicatednexus of military–inequality–welfare/political regimes.
64 Ü. TÖNGÜR AND A. Y. ELVEREN
Dow
nloa
ded
by [
Uni
vers
ity o
f Su
ssex
Lib
rary
] at
07:
38 1
5 D
ecem
ber
2014
ACKNOWLEDGMENTS
The authors thank Hasan Dudu, Nadir Öcal, Hamid Ali and participants of the 16th AnnualInternational Conference on Economics and Security (June 21–22, 2012, The AmericanUniversity in Cairo, Egypt) and two anonymous referees for their valuable comments.
References
Abell, J.D. (1994) Military spending and income inequality. Journal of Peace Research 31(1) 35–43.Acemoglu, D. and Robinson, J. (2001) A theory of political regimes. The American Economic Review 91
(4) 938–963.Ali, H.E. (2007) Military expenditures and inequality: Empirical evidence from global data. Defense and Peace
Economics 18(6) 519–535.Ali, H.E. (2011) Military expenditures and human development: Guns and butter arguments revisited: A case study
from Egypt. Peace Economics, Peace Science and Public Policy 17(1) 1–19.Ali, H.E. (2012) Military expenditure and inequality in the middle east and North Africa: Panel analysis. Defence
and Peace Economics 23(6) 575–589.Amenta, E., Caren, N. and Olasky, S.J. (2005) Age for leisure? Political mediation and the impact of the pension
movement on U.S. old-age policy. American Sociological Review 70(3) 516–538.Amenta, E. and Hicks, A. (2010) Research methods. In The Oxford Method of the Welfare State, edited by F.G.
Castles, S. Leibfried, J. Lewis, H. Obinger and C. Pierson. Oxford: Oxford University Press, 105–120.Arellano, M. and Bond, S. (1991) Some tests of specification for panel data: Monte Carlo evidence and an
application to employment equations. Review of Economic Studies 58 277–297.Arellano, M. and Bover, O. (1995) Another look at the instrumental variable estimation of errorcomponent models.
Journal of Econometrics 68 29–51.Arts, W. and Gelissen, J. (2002) Three worlds of welfare capitalism or more? A-state-of-art report. Journal of
European Social Policy 12(2) 137–158.Aspalter, C. (2006) The East Asian welfare model. International Journal of Social Welfare 15 290–301.Blondel, J. (1969) An Introduction to Comparative Government. New York: Praeger.Blundell, R. and Bond, S. (1998) Initial conditions and moment restrictions in dynamic panel data models. Journal
of Econometrics 87 115–143.Bond, S., Hoeffler, A. and Temple, J. (2001) GMM Estimation of Empirical Growth Models. CEPR Working Paper
No. 3048. London: Centre for Economic Policy Research (CEPR).Bonoli, G. (1997) Classifying welfare states: A two-dimension approach. Journal of Social Policy 26(3) 351–372.Bourguignon, F. and Verdier, T. (2000) Oligarchy, democracy, inequality, and growth. Journal of Development
Economics 62 285–313.Buğra, A. and Keyder, Ç. (2003) New Poverty and Changing Welfare Regime of Turkey. Ankara: Report Prepared
for United Nations Development Programme, UNDP.Carter, J. and Palmer, G. (2010) Keeping the Schools Open While the Troops are Away: Regime Type, Interstate
War and Government Spending, http://jeffcarter.weebly.com/uploads/4/1/7/7/4177170/regime.war.spending.pdf.Castles, F.G. (1989) The Comparative History of Public Policy. Oxford: Oxford University Press.Castles, F.G. and Mitchell, D. (1993) Worlds of welfare and families of nations. In Families of Nations: Patterns of
Public Policy in Western Democracies, edited by F.G. Castles. Aldershot: Dartmouth Publishing Company.Chong, A. (2004) Inequality, democracy, and persistence: Is there a political Kuznets curve? Economics & Politics
16(2) 189–212.Deininger, K. and Squire, L. (1996) A new data set measuring income inequality. World Bank Economic Review 10
565–591.Derin-Güre, P. and Elveren, A.Y. (2013) Does income inequality derive the separatist terrorism in Turkey? Defence
and Peace Economics. DOI:10.1080/10242694.2013.763627.Dixon, W.J. and Moon, B.E. (1986) The military burden and basic human needs. The Journal of Conflict
Resolution 30(4) 660–684.Dunne, J.P. (2000) The Economic Effects of Military Expenditure in Developing Countries, http://carecon.org.uk/
Chula/MILLDCSnew.pdf (accessed 1 April 2012).Elveren, A.Y. (2012) Military spending and income inequality: Evidence on cointegration and causality for Turkey,
1963-2007. Defence and Peace Economics 23(3) 289–301.Esping-Andersen, G. (1985) Politics Against Markets. Princeton: Princeton University Press.Esping-Andersen, G. (1990) The Three Worlds of Welfare Capitalism. Oxford: Polity Press.Fenger, H.J.M. (2007) Welfare Regimes in Central and Eastern Europe: Incorporating Post-communist Countries
in a Welfare Regime Typology, Contemporary Issues and Ideas in Social Sciences, http://repub.eur.nl/res/pub/7918/BSK-CPG-2005-006.pdf (accessed 11 May 2012).
Ferrera, M. (1996) The ‘Southern’ model of welfare in social Europe. Journal of European Social Policy6(1) 17–37.
MILITARY EXPENDITURES, INCOME INEQUALITY, WELFARE AND POLITICAL REGIMES 65
Dow
nloa
ded
by [
Uni
vers
ity o
f Su
ssex
Lib
rary
] at
07:
38 1
5 D
ecem
ber
2014
Galbraith, J. and Conceição, P. (2001) Towards a new Kuznets hypothesis: Theory and evidence on growth andinequality. In Inequality and Industrial Change: A Global View, edited by J. Galbraith and M. BernerCambridge: Cambridge University Press.
Galbraith, J.K. and Kum, H. (2005) Estimating the inequality of households incomes: Toward a dense andconsistent global data set. Review of Income and Wealth 51(1) 115–143.
Global Terrorism Database (2012), http://www.start.umd.edu/gtd/Goldsmith, B.E. (2003) Bearing the defense burden, 1886–1989: Why spend more? Journal of Conflict Resolution
47(5) 551–573.Gough, I. (1996) Social assistance in Southern Europe. Southern European Society & Politics 1(1) 1–23.Gough, I. (2000) Global Capital, Human Needs and Social Policies. Basingstoke: Palgrave Macmillan.Gradstein, M. and Milanovic, B. (2000) Does Liberte’ = Egalite’? A Survey of the Empirical Evidence on the Link
between Political Democracy and Income Inequality. Manuscript of the World Bank.Heclo, H. (1974) Modern Social Politics in Britain and Sweden. New Haven: Yale University Press.Hewitt, D. (1992) Military expenditures worldwide: Determinants and trends, 1972–1988. Journal of Public Policy
12(1) 105–152.Hicks, A. and Swank, D. (1984) On the political economy of welfare expansion: A comparative analysis of 18
advanced capitalist democracies, 1960–1971. Comparative Political Studies 17 81–118.Hirnissa, M.T., Habibullah, M.Z. and Baharom, A.H. (2009) Defense spending and income inequality: Evidence
from selected Asian countries. Modern Applied Science 3(5) 96–111.Holliday, I. (2000) Productivist welfare capitalism: Social policy in East Asia. Political Studies 48 706–723.Hsu, S. (2009) The Effect of Political Regimes on Inequality, 1963–2002. UNRISD Flagship Report. Combating
Poverty and Inequality. Geneva: UNRISD.Huber, E. and Stephens, J.D. (2001) Development and Crisis of the Welfare State. Chicago, IL: The University of
Chicago Press.Kemp-Benedict, E. (2011) Political regimes and income inequality. Economics Letters 113 266–268.Kentor, J., Jorgenson, A. and Kick, E. (2012) The “new” military and income inequality: A cross national analysis.
Social Science Research 41 514–526.Korpi, W. (1983) The Democratic Class Struggle: Swedish Politics in a Comparative Perspective. London:
Routledge and Kegan Paul.Korpi, W. (1989) Power, politics and state autonomy in the development of social citizenship: Social rights during
sickness in eighteen OECD countries since 1930. American Sociological Review 54(3) 309–328.Korpi, W. and Palme, J. (1998) The paradox of redistribution and strategies of equality: Welfare state institutions,
inequality and poverty in the western countries. American Sociological Review 63(5) 661–687.Krieger, T. and Meierrieks, D. (2009) What Causes Terrorism? SSRN http://ssrn.com/abstract=1148682 or http://
dx.doi.org/10.2139/ssrn.1148682Lee, Y.-J. and Ku, Y.-W. (2007) East Asian welfare regimes: Testing the hypothesis of the developmental welfare
state. Social Policy & Administration 41(2) 197–212.Leibfried, S. (1992) Towards a European welfare state? On integrating poverty regimes into the European
community. In Social Policy in a Changing Europe, edited by Z. Ferge and J.E. Kolberg Frankfurt am Main:Campus Verlag.
Lin, E.S. and Ali, H.E. (2009) Military spending and inequality: Panel granger causality test. Journal of PeaceResearch 46(5) 671–685.
Moon, B.E. and Dixon, W.J. (1985) Politics, the state, and basic human needs: A cross-national study. AmericanJournal of Political Science 29(4) 661–694.
Orloff, A. (1993a) The politics of pensions: A comparative analysis of Britain, Canada, and the United States,1880–1940. Madison, WI: University of Wisconsin Press.
Orloff, A. (1993b) Gender and the social rights of citizenship: The comparative analysis of the state policies andgender relations. American Sociological Review 58(3) 303–328.
Pampel, F.C. and Williamson, J.B. (1989) Age, Class, Politics and the Welfare State. Cambridge: CambridgeUniversity Press.
Pierson, P. (1994) Dismantling the welfare state? Reagan and Thatcher, and the politics of retrenchment.Cambridge: Cambridge University Press.
Powell, M. and Barrientos, A. (2004) Welfare regimes and welfare mix. European Journal of Political Research 4383–105.
Reuveny, R. and Li, Q. (2003) Economic openness, democracy, and income inequality: An empirical analysis.Comparative Political Studies 36(5) 575–601.
Roodman, D. (2006) How to do xtabond2: An Introduction to ‘Difference’ and ‘System’ GMM in Stata. CGDWorking Paper n. 103. Washington, DC: Center for Global Development (CGD).
Roodman, D. (2009) How to do xtabond2: An introduction to difference and system GMM in Stata. The StataJournal 9(1) 86–136.
Rudra, N. (2007) Welfare states in developing countries: Unique or universal? The Journal of Politics 69(2) 378–396.
Sandler, T. and Hartley, K. (1995) The Economics of Defense. New York: Cambridge University Press.Seiglie, C. (1997) Deficits, defence, and income distribution. CATO Journal 17(1) 11–18.
66 Ü. TÖNGÜR AND A. Y. ELVEREN
Dow
nloa
ded
by [
Uni
vers
ity o
f Su
ssex
Lib
rary
] at
07:
38 1
5 D
ecem
ber
2014

Siaroff, A. (1994) Work, welfare and gender equality: A new typology. In Gendering Welfare States, edited byD. Sainsbury. London: Sage, 82–100.
Skocpol, T. (1988) The limits of the new deal system and the roots of contemporary welfare dilemmas. In ThePolitics of Social Policy in the United States, edited by M. Weir, A.S. Orloff and T. Skocpol Princeton:Princeton University Press, 293–312.
Skocpol, T. (1992) Protecting Soldiers and Mothers: The Political Origins of Social Policy in the United States.Cambridge, MA: The Belknap Press of Harvard University Press.
Stephens, J.D. (1979) The Transition from Capitalism to Socialism. London: Macmillan.Strang, D. and Chang, P. (1993) The International labour organisation and the welfare state: Institutional effect on
national welfare spending, 1960-1980. International Organization 47(2) 235–262.Theil, H. (1972) Statistical Decomposition Analysis: With Applications in the Social and Administrative Sciences.
Amsterdam-London: North Holland Publishing Company.Töngür, Ü. and Elveren, A.Y. (2012) Military Expenditures, Inequality, and Welfare and Political Regimes: A
Dynamic Panel Data Analysis. The University of Texas Inequality Project Working Paper No: 61, http://utip.gov.utexas.edu/abstract.html#UTIP61
US Department of State’s Bureau of Verification and Compliance, http://www.state.gov/t/avc/index.htmUTIP (University of Texas Inequality Project) (2012), http://utip.gov.utexas.edu/Vadlamannati, K.C. (2008) Exploring the Relationship between Military Spending & Income Inequality in South
Asia. William Davidson Institute Working Paper No. 918. The University of Michigan.Weir, M., Orloff, A.S. and Skocpol, T. (1988) Introduction: Understanding American social politics. In The Politics
of Social Policy in the United States, edited by M. Weir, A.S. Orloff and T. Skocpol Princeton, NJ: PrincetonUniversity Press, 1–37.
Whelan, C.T. and Maitre, B. (2008) Comparing Poverty Indicators in an Enlarged EU. Dublin: Economic andSocial Research Institute.
Wilkensky, H.L. (1975) The Welfare State and Equality: Structural and Ideological Roots of public Expenditures.Berkeley: University of California Press.
Windmeijer, F. (2005) A finite sample correction for the variance of linear efficient two-step GMM estimators.Journal of Econometrics 126(1) 25–51.
Yildirim, J. and Sezgin, S. (2002) Defense, education and health expenditures in Turkey, 1924–1996. Journal ofPeace Research 39(5) 569–580.
MILITARY EXPENDITURES, INCOME INEQUALITY, WELFARE AND POLITICAL REGIMES 67
Dow
nloa
ded
by [
Uni
vers
ity o
f Su
ssex
Lib
rary
] at
07:
38 1
5 D
ecem
ber
2014

APPENDIX
TABLEAI
Major
Welfare
Regim
eCategories
Esping-Andersen(199
0)Liberal
Conservative
Social-democratic
Australia
Italy
Austria
Canada
Japan
Belgium
USA
France
Netherlands
New
Zealand
Germany
Denmark
Ireland
Finland
Norway
UK
Switzerland
Sweden
Leibfried
( 199
2)Anglo-Saxon
Bismarck
Scandinavian
Latin
Rim
USA
Germany
Sweden
Spain
Australia
Austria
Norway
Portugal
New
Zealand
Denmark
Greece
UK
Finland
Italy
France
CastlesandMitchell
( 199
3)
Liberal
Conservative
Non-right
hegemony
Radical
Ireland
West-Germany
Belgium
Australia
Japan
Italy
Denmark
New
Zealand
Switzerland
Netherlands
Norway
UK
UnitedStates
Sweden
Siaroff(199
4)ProtestantLiberal
AdvancedChristian
Dem
ocratic
ProtestantSocial
Dem
ocratic
LateFem
ale
Mobilizatio
n
Australia
Austria
Denmark
Greece
Canada
Belgium
Finland
Ireland
New
Zealand
France
Norway
Italy
UK
West-Germany
Sweden
Spain
USA
Lux
embo
urg
Japan
Netherlands
Portugal
Switzerland
(Contin
ued)
68 Ü. TÖNGÜR AND A. Y. ELVEREN
Dow
nloa
ded
by [
Uni
vers
ity o
f Su
ssex
Lib
rary
] at
07:
38 1
5 D
ecem
ber
2014
TABLEAI
(Contin
ued)
Esping-Andersen( 199
0)Liberal
Conservative
Social-democratic
Ferrera
(199
6)Anglo-Saxon
Bismarckian
Scandinavian
Southern
UK
Germany
Sweden
Italy
Ireland
France
Denmark
Spain
Belgium
Norway
Portugal
Netherlands
Finland
Greece
Lux
embo
urg
Austria
Switzerland
Bon
oli( 199
7)British
Con
tinental
Nordic
Southern
UK
Netherlands
Sweden
Italy
Ireland
France
Norway
Switzerland
Belgium
Denmark
Spain
Germany
Finland
Greece
Lux
embo
urg
Portugal
Kop
riandPalme( 199
8)Basic
Security
Corpo
ratist
Encom
passing
Targeted
Canada
Austria
Finland
Australia
Denmark
Belgium
Norway
Netherlands
France
Sweden
New
Zealand
Germany
Switzerland
Italy
Ireland
Japan
UK
USA
(Contin
ued)
MILITARY EXPENDITURES, INCOME INEQUALITY, WELFARE AND POLITICAL REGIMES 69
Dow
nloa
ded
by [
Uni
vers
ity o
f Su
ssex
Lib
rary
] at
07:
38 1
5 D
ecem
ber
2014

TABLEAI
(Contin
ued)
Esping-And
ersen( 199
0)Liberal
Conservative
Social-democratic
Hub
erandSteph
ens
(200
1)
SocialDem
ocratic
Christiandemocratic
Liberal
WageEarner
Sweden
Austria
Canada
Australia
Norway
Belgium
Ireland
New
Zealand
Denmark
Netherlands
UK
Japan
Finland
Germany
USA
France
Italy
Switzerland
Pow
ellandBarrientos
( 200
4)
Socialdemocratic
Conservative
Liberal
Finland
Italy
Australia
Denmark
Portugal
Ireland
Sweden
Greece
USA
Norway
Spain
UK
France
Germany
Switzerland
Netherlands
New
Zealand
Canada
Belgium
Japan
Austria
Aspalter( 200
6)SocialDem
ocratic
Corporatist/
ChristianDem
ocratic
Liberal
Con
servative
Sweden
Germany
USA
Japan
Norway
Austria
Canada
Sou
thKorea
Finland
France
Australia
China
Denmark
Belgium
New
Zealand
Hon
gKon
g
Italy
UK
Taiwan
Spain
Malaysia
Singapore
(Contin
ued)
70 Ü. TÖNGÜR AND A. Y. ELVEREN
Dow
nloa
ded
by [
Uni
vers
ity o
f Su
ssex
Lib
rary
] at
07:
38 1
5 D
ecem
ber
2014
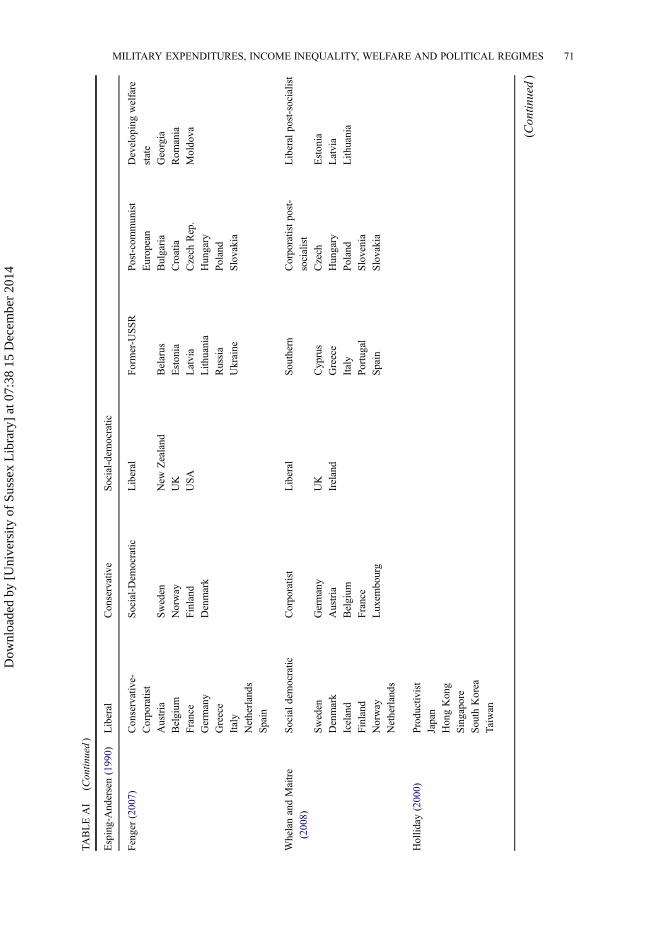
TABLEAI
(Contin
ued)
Esping-And
ersen( 199
0)Liberal
Conservative
Social-democratic
Fenger(200
7)Con
servative-
Corpo
ratist
Social-Dem
ocratic
Liberal
Former-U
SSR
Post-communist
European
Developingwelfare
state
Austria
Sweden
New
Zealand
Belarus
Bulgaria
Georgia
Belgium
Norway
UK
Estonia
Croatia
Rom
ania
France
Finland
USA
Latvia
Czech
Rep.
Moldo
va
Germany
Denmark
Lith
uania
Hungary
Greece
Russia
Poland
Italy
Ukraine
Slovakia
Netherlands
Spain
WhelanandMaitre
( 200
8)
Socialdemocratic
Corporatist
Liberal
Southern
Corporatistpost-
socialist
Liberal
post-socialist
Sweden
Germany
UK
Cyprus
Czech
Estonia
Denmark
Austria
Ireland
Greece
Hun
gary
Latvia
Iceland
Belgium
Italy
Poland
Lith
uania
Finland
France
Portugal
Slovenia
Norway
Lux
embo
urg
Spain
Slovakia
Netherlands
Hollid
ay( 200
0)Produ
ctivist
Japan
Hon
gKon
g
Singapore
Sou
thKorea
Taiwan
(Contin
ued)
MILITARY EXPENDITURES, INCOME INEQUALITY, WELFARE AND POLITICAL REGIMES 71
Dow
nloa
ded
by [
Uni
vers
ity o
f Su
ssex
Lib
rary
] at
07:
38 1
5 D
ecem
ber
2014

TABLEAI
(Contin
ued)
Esping-And
ersen( 199
0)Liberal
Conservative
Social-democratic
Lee
andKu(200
7)Produ
ctivist
(developmental)
Sou
thKorea
Taiwan
Japan
Rudra
( 200
7)Sam
ecluster
Sou
thKorea
Malaysia
Singapore
Thailand
Our
pseudo
-
classificatio
n
Liberal
Corporatist
Social-democratic
Productivist
POST-COMM
Australia
Austria
Denmark
Japan
Belarus
*
Canada
Belgium
Finland
Sou
thKorea
Eston
ia*
Ireland
France
Norway
HongKong*
Latvia
New
Zealand
Germany
Sweden
Taiwan
*Lith
uania*
UK
Greece
Malaysia
Russia
USA
Italy
Singapore
Ukraine
Lux
embo
urg
China
Bulgaria
Netherlands
Croatia
Portugal
Czech
Rep.
Spain
Hun
gary
Switzerland
*Poland
Turkey
Slovakia
Rom
ania
Moldova
Georgia*
Source:ArtsandGelissen(2002)
andauthors’
review
(*)Not
included
intheanalysisdueto
missing
data
ofsomevariables.
72 Ü. TÖNGÜR AND A. Y. ELVEREN
Dow
nloa
ded
by [
Uni
vers
ity o
f Su
ssex
Lib
rary
] at
07:
38 1
5 D
ecem
ber
2014
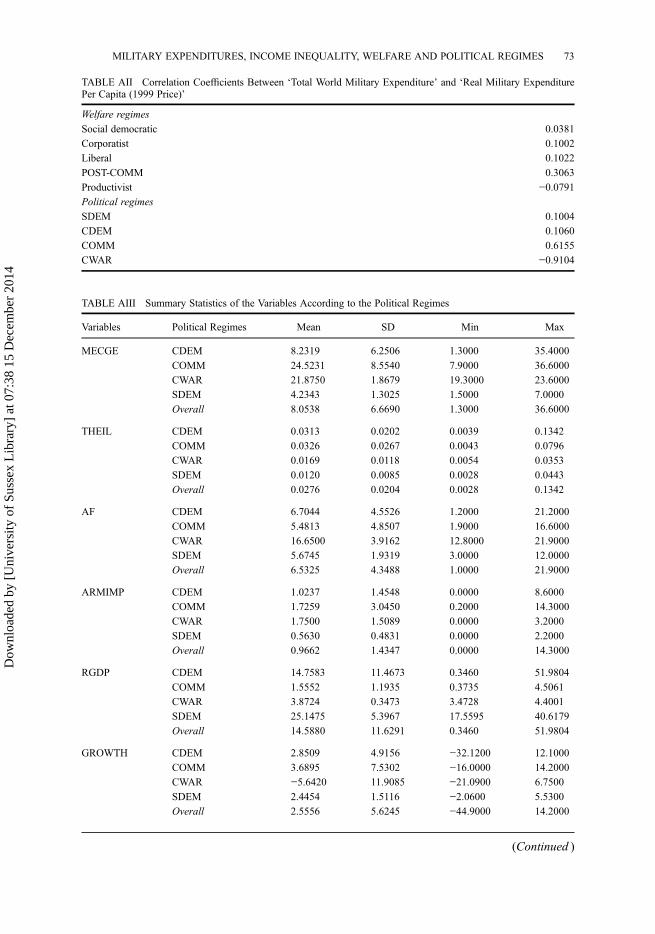
TABLE AII Correlation Coefficients Between ‘Total World Military Expenditure’ and ‘Real Military ExpenditurePer Capita (1999 Price)’
Welfare regimes
Social democratic 0.0381
Corporatist 0.1002
Liberal 0.1022
POST-COMM 0.3063
Productivist −0.0791
Political regimes
SDEM 0.1004
CDEM 0.1060
COMM 0.6155
CWAR −0.9104
TABLE AIII Summary Statistics of the Variables According to the Political Regimes
Variables Political Regimes Mean SD Min Max
MECGE CDEM 8.2319 6.2506 1.3000 35.4000
COMM 24.5231 8.5540 7.9000 36.6000
CWAR 21.8750 1.8679 19.3000 23.6000
SDEM 4.2343 1.3025 1.5000 7.0000
Overall 8.0538 6.6690 1.3000 36.6000
THEIL CDEM 0.0313 0.0202 0.0039 0.1342
COMM 0.0326 0.0267 0.0043 0.0796
CWAR 0.0169 0.0118 0.0054 0.0353
SDEM 0.0120 0.0085 0.0028 0.0443
Overall 0.0276 0.0204 0.0028 0.1342
AF CDEM 6.7044 4.5526 1.2000 21.2000
COMM 5.4813 4.8507 1.9000 16.6000
CWAR 16.6500 3.9162 12.8000 21.9000
SDEM 5.6745 1.9319 3.0000 12.0000
Overall 6.5325 4.3488 1.0000 21.9000
ARMIMP CDEM 1.0237 1.4548 0.0000 8.6000
COMM 1.7259 3.0450 0.2000 14.3000
CWAR 1.7500 1.5089 0.0000 3.2000
SDEM 0.5630 0.4831 0.0000 2.2000
Overall 0.9662 1.4347 0.0000 14.3000
RGDP CDEM 14.7583 11.4673 0.3460 51.9804
COMM 1.5552 1.1935 0.3735 4.5061
CWAR 3.8724 0.3473 3.4728 4.4001
SDEM 25.1475 5.3967 17.5595 40.6179
Overall 14.5880 11.6291 0.3460 51.9804
GROWTH CDEM 2.8509 4.9156 −32.1200 12.1000
COMM 3.6895 7.5302 −16.0000 14.2000
CWAR −5.6420 11.9085 −21.0900 6.7500
SDEM 2.4454 1.5116 −2.0600 5.5300
Overall 2.5556 5.6245 −44.9000 14.2000
(Continued )
MILITARY EXPENDITURES, INCOME INEQUALITY, WELFARE AND POLITICAL REGIMES 73
Dow
nloa
ded
by [
Uni
vers
ity o
f Su
ssex
Lib
rary
] at
07:
38 1
5 D
ecem
ber
2014
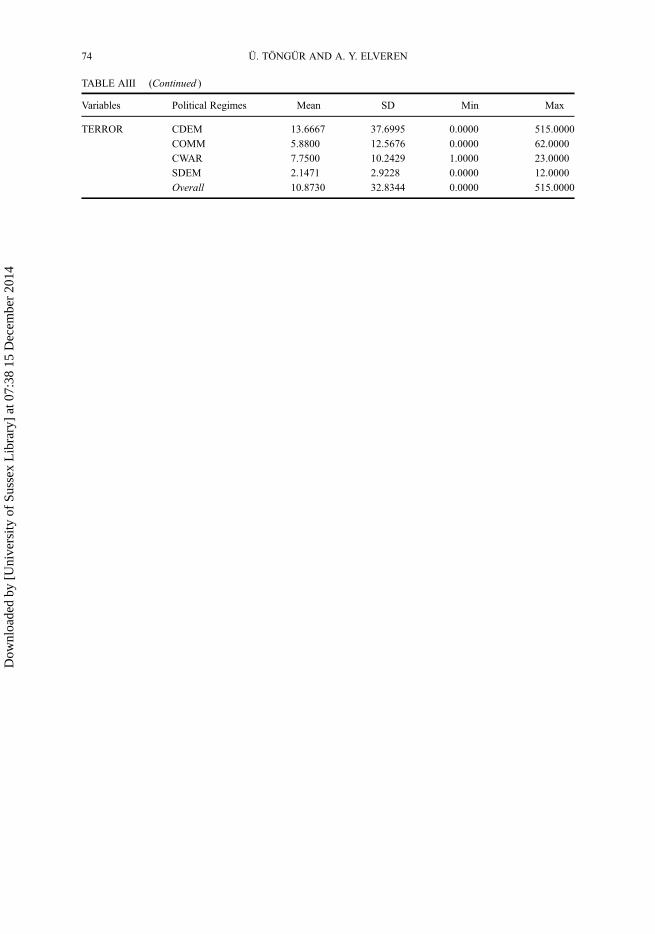
TABLE AIII (Continued )
Variables Political Regimes Mean SD Min Max
TERROR CDEM 13.6667 37.6995 0.0000 515.0000
COMM 5.8800 12.5676 0.0000 62.0000
CWAR 7.7500 10.2429 1.0000 23.0000
SDEM 2.1471 2.9228 0.0000 12.0000
Overall 10.8730 32.8344 0.0000 515.0000
74 Ü. TÖNGÜR AND A. Y. ELVEREN
Dow
nloa
ded
by [
Uni
vers
ity o
f Su
ssex
Lib
rary
] at
07:
38 1
5 D
ecem
ber
2014
Top Related