


Languages
Pages
Legal


3TT
CLIENT/SERVER SYSTEMS PERFORMANCE EVALUATION MEASURES USE
AND IMPORTANCE: A MULTI-SITE CASE STUDY OF TRADITIONAL
PERFORMANCE MEASURES APPLIED TO THE
CLIENT/SERVER ENVIRONMENT
DISSERTATION
Presented to the Graduate Council of the
University of North Texas in Partial
Fulfillment of the requirements
For the Degree of
DOCTOR OF PHILOSOPHY
By
Orlando Guy Posey, B.A, M.B.A.
Denton, Texas
May, 1999

Posey, Orlando Guy., Client/Server Systems Performance Evaluation
Measures Use and Importance: A Multi-Site Case Study of Traditional
Performance Measures Applied to the Client/Server Environment. Doctor of
Philosophy (Business Computer Information Systems), May 1999, 219 pp., 71
tables, 8 illustrations, 18 appendices, bibliography 99 titles.
This study examines the role of traditional computing performance
measures when used in a client/server system (C/SS) environment. It also
evaluates the effectiveness of traditional computing measures of mainframe
systems for use in C/SS. The underlying problem was the lack of knowledge
about how performance measures are aligned with key business goals and
strategies. This research study has identified and evaluated client/server
performance measurements' importance in establishing an effective performance
evaluation system.
More specifically, this research enables an organization to do the
following: (1) compare the relative states of development or importance of
performance measures, (2) identify performance measures with the highest
priority for future development, (3) contrast the views of different organizations
regarding the current or desired states of development or relative importance of
these performance measures.
In recent years, client/server computing technologies have proliferated in

organizations, and are being used in ail aspects of business for a variety of
purposes. While there has been considerable literature generated on
client/server computing issues such as system flexibility and scalability, there
has been significantly less research on identifying performance measures used
to evaluate system goals.
The objectives of the research were threefold: (1) To identify and clearly
articulate the client/server performance measures that, taken together, enable
client/server to be effectively applied in support of a firm's strategies and
operations. (2) To demonstrate that these performance measures do, in fact,
make a difference by linking a firm's capabilities regarding these measures with
its ability to effectively apply client/server in support of its strategies and
operations, and (3) To determine how leading-edge firms both focus and
reinforce management attention toward these performance measures.
Analysis of the seven client/server systems in this study reveals that
these six firms perceive traditional information systems performance measures
are much more detailed and costly in time and manpower than what is perceived
to be required for their client/server systems. While mainframe systems are
used in each of the six firms to support mission critical business and/or research
applications, client/server systems were most often used by them for less critical
support areas. Therefore, information systems staff and managers typically view
client/server performance measures as much less critical and even almost
optional.

3TT
CLIENT/SERVER SYSTEMS PERFORMANCE EVALUATION MEASURES USE
AND IMPORTANCE: A MULTI-SITE CASE STUDY OF TRADITIONAL
PERFORMANCE MEASURES APPLIED TO THE
CLIENT/SERVER ENVIRONMENT
DISSERTATION
Presented to the Graduate Council of the
University of North Texas in Partial
Fulfillment of the requirements
For the Degree of
DOCTOR OF PHILOSOPHY
By
Orlando Guy Posey, B.A, M.B.A.
Denton, Texas
May, 1999
ACKNOWLEDGMENTS
I would like to thank God. I would also like to thank my mother, Ms.
Angeline Posey-Sullivan for her unwavering love, support and mentioning. A
very special thanks goes to my children Leander, Takeem, and Jamol for their
love and understanding during the many months of this research project. I would
also like to express my appreciation to the members of my committee, Drs. John
C. Windsor, R. Martin Richards, Howard Clayton, and Paul Schlieve for their
guidance and support. Special thanks are due to my chair, Dr. John C. Windsor,
for his assistance and encouragement.
in

TABLE OF CONTENTS
Page
LIST OF TABLES viii
LIST OF ILLUSTRATIONS x
Chapter
I. INTRODUCTION 1
Purpose of the Study 3 Problem Addressed by the Research 5 Significance of the Study 11
II. LITERATURE REVIEW 14
Client/Server Computing 14 Client 16 Network 19 Server 19 Advantages 22 Disadvantages 23
Performance Evaluation 26 Advantages 32 Disadvantages 34
Benchmarking 35 Total Quality Management 37 Chapter Summary 39
III. RESEARCH FRAMEWORK 41
System Model of Performance Evaluation 42 Initial Purpose 42 Performance Variables 44 Performance Measures 44 Performance Needs 45 Performance Improvement Proposal 45
Research Variables 45 Case Study Propositions 47
iv

Chapter Page
Chapter Summary 49
IV. RESEARCH METHODOLOGY 50
Research Design Procedures 50 Sample Selection 51 Development of the Survey Instruments 52 Methodology 54 Assumptions and Limitation 57
Assumptions 57 Limitations 58
Expected Outcomes 59
V. METHODOLOGY AND FINDINGS 61
Performance Measures Data 67 Findings 70
Petrochemical Firm System (1) 71 Petrochemical Firm System (2) 80 Transportation Firm (1) 89 Transportation Firm (2) 98 Transportation Firm (3) 108 Medical Firm 117 Service Firm 127 Across-Firm Analyses 136
VI. CONCLUSIONS AND DISCUSSION 147
Analysis of the Research Question 147 Research Question (A) 147 Research Question (B) 149 Research Question (C) 150 Research Question (D) 152 Research Question (E) 152 Research Question (F) 153 Research Question (G) 154 Research Question (H) 156 Research Question (I) 156
Implications for Future Research 158 Positive Business Effects 158 Negative Business Effects 158
Chapter Summary 162

Page
APPENDICES
A. Network Manager's Questionnaire Cover Letter 163 B. Use of Human Subjects Informed Consent 165 C. The Client/Server Assessment Instrument 167 D. Management Performance Measurement Questionnaire 170 E. Management Performance Measures Questionnaire 172 F. Management Critical Success Factors Questionnaire 175 G. System Capabilities: Importance Versus Performance 177 H. Firm Performance in Applying Client/Server in Pursuit of Business
Strategies and in Support of Business Activities 180 I. Innovativeness in Applying Specific IT 182 J. Diffusion of Specific CS Throughout a Firm's Client/Sever
Infrastructure 184 K. Performance Measures (CSF List) 186 L. Information Systems Staff Questionnaire 188 M. Staff Performance Measurement Questionnaire 190 N. Information System Staff Performance Measures 193 0. End-User Questionnaire 197 P. User Performance Measurement Questionnaire Demographics 199 Q. User Evaluation-System 201 R. Definitions 205
REFERENCES 212
VI

LIST OF TABLES
Table Page
3.1 Variable Analysis Table 46 5.1 Firm's Respondents Grouped by Staff and User 67 5.2 Interpretation of the Current State of Development 68 5.3 Interpretation of the Desired State of Development 68 5.4 Ranked Means for the IS Staff in the Petrochemical Firm (1)
Performance Areas 72 5.5 Ranked Means for the IS Staff in the Petrochemical Firm (1)
Operational Measures 73 5.6 Ranked Means for the IS Staff in the Petrochemical Firm (1)
Financial Measures 74 5.7 Ranked Means for the IS Staff in the Petrochemical Firm (1)
Defect Measures 75 5.8 Ranked Means for the IS Staff in the Petrochemical Firm (1)
Staff Experience Measures 76 5.9 Ranked Means for the End-Users in the Petrochemical Firm (1) 77 5.10 Ranked CSFs and Gap Scores for IS Staff and Management
in the Petrochemical Firm (1) 79 5.11 Summary Analysis for the Petrochemical Firm (1) 80 5.12 Ranked Means for the IS Staff in the Petrochemical Firm (2)
Performance Areas 81 5.13 Ranked Means for the IS Staff in the Petrochemical Firm (2)
Operational Measures 82 5.14 Ranked Means for the IS Staff in the Petrochemical Firm (2)
Financial Measures 84 5.15 Ranked Means for the IS Staff in the Petrochemical Firm (2)
Defect Measures 84 5.16 Ranked Means for the IS Staff in the Petrochemical Firm (2)
Staff Experience Measures 85 5.17 Ranked Means for the End-Users in the Petrochemical Firm (2) 86 5.18 Ranked CSFs and Gap Scores for IS Staff and Management
in the Petrochemical Firm (2) 88 5.19 Summary Analysis for the Petrochemical Firm (2) ' 89 5.20 Ranked Means for the IS Staff in the Transportation Firm (1)
Performance Areas 90 5.21 Ranked Means for the IS Staff in the Transportation Firm (1)
Operational Measures 9«l 5.22 Ranked Means for the IS Staff in the Transportation Firm (1)
vii
Page
Financial Measures 92 5.23 Ranked Means for the IS Staff in the Transportation Firm (1)
Defect Measures 93 5.24 Ranked Means for the IS Staff in the Transportation Firm (1)
Staff Experience Measures 94 5.25 Ranked Means for the End-Users in the Transportation Firm (1) 95 5.26 Ranked CSFs and Gap Scores for IS Staff and Management
in the Transportation Firm (1) 97 5.27 Summary Analysis for the Transportation Firm (1) 98 5.28 Ranked Means for the IS Staff in the Transportation Firm (2)
Performance Areas 99 5.29 Ranked Means for the IS Staff in the Transportation Firm (2)
Operational Measures 100 5.30 Ranked Means for the IS Staff in the Transportation Firm (2)
Financial Measures 102 5.31 Ranked Means for the IS Staff in the Transportation Firm (2)
Defect Measures 103 5.32 Ranked Means for the IS Staff in the Transportation Firm (2)
Staff Experience Measures 104 5.33 Ranked Means for the End-Users in the Transportation Firm (2) . . . . 105 5.34 Ranked CSFs and Gap Scores for IS Staff and Management
in the Transportation Firm (2) 107 5.35 Summary Analysis for the Transportation Firm (2) 107 5.36 Ranked Means for the IS Staff in the Transportation Firm (3)
Performance Areas 109 5.37 Ranked Means for the IS Staff in the Transportation Firm (3)
Operational Measures 110 5.38 Ranked Means for the IS Staff in the Transportation Firm (3)
Financial Measures 111 5.39 Ranked Means for the IS Staff in the Transportation Firm (3)
Defect Measures 112 5.40 Ranked Means for the IS Staff in the Transportation Firm (3)
Staff Experience Measures 113 5.41 Ranked Means for the End-Users in the Transportation Firm (3) 114 5.42 Ranked CSFs and Gap Scores for IS Staff and Management
in the Transportation Firm (3) 116 5.43 Summary Analysis for the Transportation Firm (3) 117 5.44 Ranked Means for the IS Staff in the Medical Firm
Performance Areas 118 5.45 Ranked Means for the IS Staff in the Medical Firm Operational
Measures 120 5.46 Ranked Means for the IS Staff in the Medical Firm Financial
Measures 121 5.47 Ranked Means for the IS Staff in the Medical Firm Defect Measures . 122
VIII
Page
5.48 Ranked Means for the IS Staff in the Medical Firm Staff Experience Measures 123
5.49 Ranked Means for the End-Users in the Medical Firm 124 5.50 Ranked CSFs and Gap Scores for IS Staff and Management
in the Medical Firm 126 5.51 Summary Analysis for the Medical Firm 127 5.52 Ranked Means for the IS Staff in the Service Firm Performance
Areas 128 5.53 Ranked Means for the IS Staff in the Service Firm Operational
Measures 130 5.54 Ranked Means for the IS Staff in the Service Firm Financial
Measures 131 5.55 Ranked Means for the IS Staff in the Service Firm Defect
Measures 132 5.56 Ranked Means for the IS Staff in the Service Firm Staff
Experience Measures 133 5.57 Ranked Means for the End-Users in the Service Firm 134 5.58 Ranked CSFs and Gap Scores for IS Staff and Management
in the Service Firm 135 5.59 Summary Analysis for the Service Firm 136 5.60 Across-Firm Comparison of IS Staff Performance Areas 138 5.61 Across-Firm Comparison of IS Staff Operational Measures 139 5.62 Across-Firm Comparison of IS Staff Financial Measures 140 5.63 Across-Firm Comparison of IS Staff Defect Measures 141 5.64 Across-Firm Comparison of IS Staff Experience Measures 142 5.65 Across-Firm Comparison of End Users Ranked Means 143 5.66 Across-Firm Comparison of IS Staff and Management Ranked Critical
Success Factors and Gap Scores 145 5.67 Across-Firm Comparison of IS Staff Ranked Summary
Analysis 145 6.1 The Multiple Dimensions of Performance Measurement
Systems 149 6.2 Across-Firm Ranking of IS Staff, End-Users, and Management
CSFs and KPI 157
IX

LIST OF ILLUSTRATIONS
Figure Page
2.1 The Balanced Scorecard 30 2.2 The Nine-Step Benchmarking Process 36 3.1 Systems Model of Performance Evaluation 41 3.2 Performance Evaluation Framework 43 4.1 Client/Server Critical Success Factors Categories 53 4.2 How C/S Management Competencies Enable Business Value 60 5.1 Across-Firm Comparison of IS Staff Performance 146 6.1 Highly Desired and High Performance State of Development 148

CHAPTER I
INTRODUCTION
The client/server (C/S) revolution is sweeping through every industry that
uses information. Client/server applications are valuable because they couple
the freedom and flexibility of personal computer applications with the ability to
get at business data from mainframe data bases (Jones 1994). However, no
immature technology is fully perfected when it first appears, and client/server is
no exception. Many authors, (Jones 1994, Gaskin 1994, LeBleu and Sobkowiak
1995) list client/server quality and adequacy as two problem areas that can be
addressed by client/server performance evaluation tools and techniques.
A good business performance measurement system is a very effective
tool to motivate employees while monitoring quality and adequacy of a company.
Although interest in creating performance measurement models is widespread, a
well-designed system is rare (Lee 1993). To be successful in today's
competitive environment, a good performance measurement system should
incorporate strategic success factors, clear and timely analysis, and a system of
correcting deviations from standards with business objectives and processes,
technology shifts, organizational change, rapid development techniques, and
ongoing reviews (Gaskin 1994). Furthermore, an analytic hierarchical model for
client/server systems (C/SS) must combine financial and nonfinancial
4 i

performance measures and emphasize external as well as internal business
performance measures (LeBleu and Sobkowiak 1995).
While building client/server systems is seen by many researchers (Martin
1992, Jones 1994, Keyes 1992, Bell 1995) as more craft than science, many
dimensions can be reduced to numeric data. Martin (1994, p.10) states, "And
while success is often hard to quantify, failure always comes with numbers
attached. Shops which emphasized measurement and quantification during
analysis, design, and testing show a lower rate of production systems failure."
Martin, (1994) Baines, (1995) and Howard, (1995) argue that emphasis
on quantification and empiricism leads to goals and objectives which can be
tested, measured, quantified, and used repeatedly throughout the C/SS in a
wide range of applications. Martin (1995) lists four conclusions that can be
drawn from his research; (a) business requirements are constantly changing, (b)
available technology is constantly changing, (c) users really want only
transparent solutions, and (d) if system developers learn more about the user's
operational needs, they are better able to design system which provide solutions
for those needs.
With all the new technologies, techniques, methods and working
relationships, there is an incredible amount of learning necessary to identify
optimum performance levels in a client/server environment. Network managers
must develop metrics to benchmark and to measure system performance over
time. However, the choice of metrics depends upon the nature of the job. Keyes

(1992, p. 42) argues that quality is different things for different companies, and
he states, "What you think are key quality issues should drive what you're trying
to measure."
Jones (1994) goes on to argue that in order to track these measures,
performance evaluations tools should, at a minimum, include as their main
components complexity analysis tools, code restructuring tools, configuration
control tools, cost estimating tools optimized for maintenance and
enhancements, defect tracking tools, and reliability modeling tools.
Purpose of the Study
The focus of this research is to identify client/server performance
measurements used by businesses and to propose an analytical model for
evaluating and benchmarking these measures. Hardware and software
companies and systems integrators have touted C/SS as the low-cost alternative
to mainframe data processing (Martin 1994). However, many authors (Martin
1994, Sinha 1992, King 1994) believe C/SS to be the most complex type of
computing environment. Jones (1994, p. 10) argues, "Modern computing
networks are some of the most complex items the human race has yet created."
Information technology managers at all levels must seek to understand what
their employer and users want and expect them to accomplish. Defining,
establishing and maintaining clear performance standards of each client/server
critical success factor and core competency will aid network managers in

designing, developing, and maintaining client/server systems that best meet
these organizational objectives.
This study addresses the following questions; (a) Do traditional IS
performance measures provide the information necessary to manage
client/server systems? If no, can these traditional measures be adjusted for
C/S? (b) Is there a need for new or additional performance measures to
adequately evaluate client/server systems? If so, what are these new measures,
are they cost effective/efficient and how can they be identified? (c) Is there a
lack of C/S user requirements? If so, what impact does it have on system
performance? What are the performance needs of C/S users? (d) What
performance measures are used to evaluate client/server systems? (e) What
criteria do companies use to determine which performance measurements to
collect? (f) How fully do client/server systems meet organizational needs? (g)
How are organizations performing in terms of collecting and meeting these
performance measures? (h) Which performance measures are most important
for a successful client/server system? and (k) Who is responsible for
establishing performance measures?
The objectives of the research were threefold:
1. to identify and clearly articulate the C/S management performance
measures that, taken together, enable C/S to be effectively applied
in support of a firm's strategies and operations.

2. to demonstrate that these performance measures do, in fact, make
a difference by linking a firm's C/S capabilities regarding these
performance measures and competencies with its ability to
effectively apply C/S in support of its strategies and operations.
3. to determine how leading-edge firms both focus and reinforce
management attention toward these performance measures and
competencies.
Problem Addressed by the Research
One of the chief problems motivating this study was the lack of knowledge
concerning performance measure standards within client/server environments.
One of the chief objectives motivating this study was to determine actual
performance measures being used by companies to evaluate their C/SS.
Currently, many authors write there are no industry guidelines that give C/SS
managers a clear reference point to help separate client/server winners from
losers (Lee, Kwak, and Han 1995, Martin 1994, Keyes 1992, Drucker 1993).
They argue that it is up to individual companies to establish performance
benchmarks of their client/server systems. They conclude that many companies
limit system performance evaluation to financial considerations. While there has
been considerable research on C/SS, the literature on performance evaluation of
C/S is relatively sparse. Often, reports King (1996), evaluations are conducted
under consultancy arrangements for a particular company. Therefore, the

evaluation is specific to that company and not considered to be of general
interest to the client/server industry overall or of a competitive advantage nature
and therefore, access is greatly restricted.
Measuring performance can help companies test what applications should
be candidates for conversion to client/server. It can also help select the
client/server configuration best suited to the needs of the company. But
developing a comprehensive performance measurement system has frustrated
many managers (Drucker 1993). The traditional performance measures
enterprises have used do not fit well with C/SS environments. Cummings (1992)
reports metrics for evaluating LAN performance are usually informal and, in
some cases, do not exist at all. New qualitative measurements may be needed
to perform this business evaluation. Drucker put the ever-increasing
measurement dilemma this way:
Quantification has been the rage in business and economics these past 50 years. Accountants have proliferated as fast as lawyers. Yet we do not have the measurements we need. Neither our concepts nor our tools are adequate for the control of operations, or for managerial control. And so far, there are neither the concepts nor the tools for business control; i.e., for economic decision making. In the past few years, however, we have become increasingly aware of the need for such measurements. (Drucker 1993, p. B3)
When applied to C/SS, Drucker's message is clear: traditional measures
are not adequate for performance evaluation. A primary reason why traditional
measures fail to meet C/SS needs is that most measures are lagging indicators
(Muralidhar, Santhanam, and Wilson 1990). The emphasis of accounting

measures has been on historical statements of financial performance. As a
result, they easily conflict with new strategies and current competitive business
realities. Drucker (1993, p. B3) reports that, managers keep asking: "What are
the most important measures of performance?" and "What associations exist
among those measures?" Unfortunately, for any practical business, we know
little about how measures are integrated into a comprehensive performance
measurement system for C/SS (King 1994).
The current wave of dissatisfaction with traditional accounting systems
has been intensified partly because most measures have internal and financial
focus. Interestingly, this kind of symptom has also been noted in a capital
budgeting context because of the uncertainty in measuring nonfinancial benefits
of a new business environment (Campi 1992). Any new measures should
broaden the basis of nonfinancial performance measurement. Campi argues it
must truly predict long-term strategic success. System performance relative to
users, such as satisfaction, is as important as financial and productivity
measures. In addition, the recent rise of global competitiveness reemphasizes
the primacy of operational, that is, nonfinancial over financially oriented
performance. Nonfinancial measures reflect the actionable steps needed for
C/SC success. However, these nonfinancial measures are typically qualitative.
Campi points out nonfinancial measures can reduce the communication
gap between workers and managers, because workers have a better
understanding of what truly is important to the success of the company, and

8
managers get timely feedback and can link it to strategic decision making. A
good performance measurement system is more likely to tie in goals so that
managers obtain basic information on how well strategies are being
implemented. Strategies can be better managed through the use of nonfinancial
measures. Although several approaches to designing and implementing a
system to provide nonfinancial control (Kettinger, Graver, and Guha 1994,
Goodhue and Thompson 1995, Lee 1993) have been proposed in the literature,
the problem of integrating nonfinancial measures with financial measures
effectively still remains an open question.
This study addresses these issues via a hierarchical schema. On the
basis of the schema, this study demonstrates how measurements that have been
extensively applied in modeling the performance evaluation process may be
used by decomposing a complex decision operation into a multi-level
hierarchical structure. Performance measures also have a relationship with
management levels. They need to be filtered at each superior/subordinate level
in an organization, that is, measures do not need to be the same across
management levels. Performance measures at each level, however, should be
linked to performance measures at the next highest level. Finally, performance
measurement information is tailored to match the responsibility of each
management level (Kettinger et al. 1994).
Martin (1994) notes that in many manufacturing companies, managers do
not have adequate measures forjudging client/server performance or for

comparing overall performance from one facility to the next. When traditional
cost-accounting figures are used, these figures do not tell network managers
what they really need to know. Even worse, even the best numbers do not
sufficiently reflect the important contributions that managers can make by
reducing confusion in the system and promoting organizational change.
Why is it important that performance measurement and organization be
matching? Performance measurement allows network managers to monitor and
to control. The monitoring part investigates what is going on: the organization
has to be efficient and effective; there has to be a fit between structure and
environment; and there has to be a fit between strategy and structure (Halachmi
and Bouckaert 1994). Performance measurement should indicate (potential)
organizational problems. Deviations should result in adjustments which make
performance measurement indispensable for control. There is a systematic and
structural problem when an organizational performance measurement (system)
does not detect inefficiency, ineffectiveness, mismatch of structure and
environment, and misfit between strategy and structure (Ameen 1989). If a
performance measurement system is not capable of doing this any more due to
fundamental changes in organizational technology, this divergence will become
a systematic and structural problem too. Designing performance measures
around the flow and processing of an organization's information facilitates the
emergence of the obtainable goals (Halachmi and Bouckaert 1994).

10
Halachmi and Bouckaert argue that, few researchers are trying to address
the need to redesign organizations around the constant flow of demands from
the environment. Those demands represent informational outcomes of various
activities by the organization and the extent to which output meets existing
informational demands or generates new ones. And even fewer researchers
make an effort to develop the necessary specifications for standardized
measurements that could help managers to gauge the appropriateness of
existing organizational designs for accommodating the technological core, in
Goodhue's and Thompson's (1995) terminology. Being able to gauge the
performance of organizations in a meaningful way is a necessary condition for
network managers who want to assume a proactive posture and plan possible
changes. The rapid changes in the characteristics and utilization of information
technology since the early 1980's require researchers and organizations to
redefine terms such as span of control, chain of command, hierarchy, boundary
spanning, work group, communication, co-ordination, functional dependence and
many others (Halachmi and Bouckaert 1994). As this need is addressed,
Halachmi and Bouckaert 1994, King 1994, Jones 1994, Kettinger et al. 1994,
etc., advise that researchers should make an effort to develop instrumental
concepts to measure them and models that reveal the functional relationships
between them and organizational performance.

11
Significance of the Study
"Client/server computing is about improving the organization's
performance by increasing the effectiveness of its managers and professionals,
using information technology to support them" (Grantham 1995, p. 10).
Grantham believes it is important to define what is meant by Information
Technology in terms of performance goals. This definition sees technology
merely as a tool to assist organizations in becoming more effective. If this is the
case, emphasis must be placed on measuring the efficiency and quantitative
benefits of C/SS, as well as their impact on effectiveness and their contribution
to the attainment of qualitative benefits.
Traditional justification of information technology investments is based on
accounting frameworks and are likely to focus on the short-term, financial
benefits of the investment. Many authors (Martin 1994, Grantham 1995, Jones
1994) point out that such strong reliance on accounting-based methods in
decision-making processes, which are not well suited to evaluate the new types
of information technology (IT) investments, is one of the reasons for the high
failure rate of information technology.
In the early days of computer technology (1960's and 70's) benefits
attributed to automation used to be well-defined and quantifiable as routine
tasks; for example, payroll and batch processing were automated. Grantham
(1995) argues today's methods of justification largely reflect those methods
12
applied in justifying data processing systems, which relied on staff savings
measured against the costs of the computer system. These methods do not
necessarily justify expenditure on computer networks. They see how managers
spend their time as more important than what they achieve. According to
Grantham, traditional return on investment overlooks the things most companies
are trying to bring about with IT investment. Furthermore, Martin (1994) claims
that the traditional methods neglect to focus on the fundamental aim, which is to
achieve organizational goals rather than merely to save time. In parallel,
Caldwell (1995) writes that the cost-benefit procedures appropriate to data
processing are not suitable for C/SS, because client/server is concerned with
supporting manager's functions, not merely executing them.
For many years computer performance evaluation products have helped
improve efficiency of mainframe computers. When new products or programs
were introduced on the mainframe, computer performance evaluation helped
information systems personnel make judgments on how to improve efficiency.
Computer performance evaluations were often used to assist accounting and
chargeback systems on the mainframe. Likewise, measuring client/server
performance can help companies test what applications should be candidates
for conversion. Furthermore, it can also help select the client/server
configuration best suited to the needs of the application.
One of the major benefits of the client/server approach is that hardware
and systems can be added incrementally, as needed. Performance management

13
makes it possible to track and tune the behavior of CSS. More specifically,
these applications gauge the operating efficiency of servers and workstations,
giving network managers a granular view of operating system performance, I/O
activity, CPU cycles, and application-processing overhead (Jander, 1994).
Finally, businesses that worry about their systems' competitiveness are
increasingly turning to benchmarking, a methodology that defines a baseline or
standard of performance and then identifies deviations from that baseline.
Client/server benchmarking can ferret out the cost of distributed systems'
downtime and compare the cost of down systems to that borne by others in the
same industry. It can determine comparative costs to support users.
Benchmarking can point out how a firm can cut support costs and downtime by
presenting findings on best available practices.

CHAPTER II
LITERATURE REVIEW
This research addresses the use of performance measurement evaluation
programs used within a client/server environment and their effect on
organizational goals, objectives, productivity, effectiveness and efficiency. Thus,
the study draws upon several bodies of research, most notably from the
literature concerned with client/server computing, performance evaluations,
critical success factors, core competencies, benchmarking, competitive
advantage and total quality management. This chapter summarizes key findings
from these research areas, and it discusses their implications for the present
study.
Client/Server Computing
Client/server computing is a means for separating the functions of an application into two or more distinct parts, each of which operates on a different computing platform. The 'front-end' client component presents and manipulates data on the desktop computer. The 'back-end' server component acts as a mainframe to store, retrieve, and protect data. Some applications also deploy a 'middleware' component, which acts as a translator between the front end and the back end. Together, these components share a true division of labor, with each machine and each part of the application optimized for best performance. This division of labor takes full advantage of the intelligence and ease of use of desktop
14

15
computers, as well as the power arid security of the central back-end computer. (Musthaler 1995, p. 20)
A client/server architecture divides an application into separate processes operating on separate machines connected over a network, thus forming a "loosely coupled" system. In the client-server computing paradigm, one or more clients and one or more servers, along with the underlying operating system and interprocess communication systems, form a composite system allowing distributed computation, analysis, and presentation. (Sinha 1992, p. 77, 80)
It is widely acknowledged the client/server computing model is provided
through the interaction of 3 components: the client, the network, and the server.
While there are many possible client/server configurations, all perform three
basic functions which are spread between the client and the server, van den
Hoven and John (1995) and Eckerson (1995) identify the three basic functions
as:
1. Presentation: This is the interface which will appear to the end-user on the personal computer or workstation. Most interfaces are now graphical (such as Windows for the personal computer) but a few are still character-based.
2. Application Logic: This is where the application logic or business rules reside. Most client/server computing applications use some form of fourth-generation language (4GL).
3. Data Management: This is where the data resides. Most client/server installations use Structured Query Language (SQL) to interact with the database.
Sinha (1992) and Rymer (1994) identify the following features as being
the most important of a C/SS:

16
1. Desktop intelligence since the client is responsible for user
interface. It transforms the user queries or commands to a
predefined language understood by the server and presents
the results returned from the server to the user.
2. Sharing the server resources (e.g., CPU cycles, data
storage) most optimally. A client may request the server to
do intensive computation (e.g., image processing) or run
large applications on the server (e.g., database servers) and
simply return the results to the client.
3. Optimal network utilization as the clients communicate with
the server through a predefined language (e.g., SQL) and
the server simply returns the results of the command as
opposed to returning the data files.
4. Providing an abstraction layer on the underlying operating
systems and communication systems such as LAN, allowing
easy maintenance and portability of the applications for
years to come.
Client
The client, the first component of the client/sever computing model, is
usually managed by the end user who, theoretically, can choose the appropriate
software for his work. It is generally an IBM-compatible PC, a Macintosh

17
computer, or a Unix workstation. The essential defining feature of the client is
that it has "intelligence;" that is, it has processing capabilities of its own. As
stand-alone computers, clients provide personal productivity tools to the user,
but when functioning as part of a client/server environment, they enable greater
corporate productivity. Musthaler (1995) argues that a traditional mainframe
terminal is not suitable as a desktop client because it is completely dependent
upon the central host computer for its ability to display and manipulate data.
The role of the client is to satisfy the user's needs using local tools such as a
spreadsheet or word processor. The client also can make requests to the
appropriate servers to gain access to corporate data or other computing
resources and then display the results on the personal computer. The client
must be able to initiate requests for data from the server and to manipulate that
data once it receives it. In such a system, a client is a process which interacts
with the user and has the following characteristics (Sinha 1992, van den Hoven
and John 1995):
1. The most important characteristic of the client is ease-of-use
in order to meet the firm's increased needs. Graphical user
interfaces in conjunction with powerful hardware are
important technological components that support this goal. A
common Graphical User Interface (GUI) for the Personal
computer is Windows.

18
2. It presents the user interface. This interface is the sole
means of garnering user queries or directions for purposes
of data retrieval and analysis, as well as the means of
presenting the results of one or more queries or commands.
Typically, the client presents a Graphical User Interface
(GUI) to the user (e.g., Microsoft Windows-based
interfaces).
3. It forms one or more queries or commands in a predefined
language for presentation to the Server. The client and the
server may use a standard-based language such as SQL or
a proprietary language known within the C/SS. Each user
query or command need not necessarily map a query to the
Server from the Client.
4. It communicates to the server via a given Interprocess
communication methodology and transmits the queries or
commands to the server. An ideal client completely hides
the underlying communication methodology from the user.
5. It performs data analysis on the query or command results
sent from the Server and subsequently presents them to the
user. The nature and extent of processing on the client may
vary from one C/SS to another.

19
Sinha identifies characteristics (2) and (4) as those which set a client
computer apart from dumb terminals connected to a host, because it possesses
intelligence and processing capability.
Network
The network is the second of the three components of the C/SS model
and is the physical link between the other components. It provides the
connection and manages the communication between the client and the
appropriate servers. Well-designed networks have both transparency and
sufficient bandwidth to support data traffic. The interoperability required by C/SS
computing starts with the network (van den Hoven and John 1995). According to
van den Hoven and John (p.51), "The bottom line is that client/server computing
requires a well-designed network that can grow with the company and deliver
the expected returns on the associated capital investment that will bring this type
of computing environment to fruition."
Server
The server is the final component of the C/SS model. Both it and the
network are generally managed by the IS shop to ensure the reliability and
security of corporate information and computing resources. In a C/SS, a server
is a process, or a set of processes all of which must exist on one machine which
provides a service to one or more clients (Rymer 1994). The server component

20
is defined largely by its roles and responsibilities, rather than the type of
computer it is. Servers can be personal computers, workstations, minicomputers,
mainframes, or super computers. Anything from a PC all the way to the most
powerful mainframe can act as a server for client/server applications. The role of
the server is primarily to store and protect data and to process other requests
that are initiated by the clients (Musthaler 1995). A typical server provides one or
more of the following services to the client: (a) database management, (b) file
management, (c) wide-area networking, (d) security, (e) image-processing, (f)
electronic mail, (g) complex computing, (h) printing, (i) application functionality,
(j)external news, (k) electronic data interchange and, (I) any other specialized
service appropriate for the company (van den Hoven and John).
Sinha argues that the most important characteristics of the server are
efficiency and scalability. It is generally accepted that the server must provide
the required resources efficiently, both in terms of cost and performance.
Furthermore, the server also must be scalable so that it can grow to meet the
varied and increasing demands of the company. It has the following
characteristics (Sinha 1992):
1. A Server provides a service to the Client. The nature and
extent of the service is defined by the business goal of the
C/SS itself.
2. A Server merely responds to the queries or commands from
the Clients. Thus, a Server does not initiate a conversation

21
with any Client. It merely acts either as a repository of data
(e.g., file Server) or knowledge (e.g., database Server) or as
a service provider (e.g., print Server).
3. An ideal Server hides the entire composite Client/Server
system from the Client and the user. A Client communicating
with a Server should be completely unaware of the Server
platform (hardware and software), as well as the
communication technology (hardware and software). For
example, a DOS-based Client should be able to
communicate with a Unix or OS/2-based
Until recently, with the introduction of three-tiered client/server
architecture in which a different computer handles each of the basic functions,
most of the "mission critical applications" in corporations have remained on the
mainframe (Martin 1994). Sinha (1992) defines "mission critical applications" as
the few key information processing and analysis applications for any company
which, if done well, will help ensure competitive success. Conversely, lack of
attention to them can mean failure. For example, Sinha identifies finance and
sales management systems as usually being considered "mission critical
applications". Mission critical applications are similar to Rockart's (1979) Critical
Success Factors. Rockart believes that an approach for determining critical
success factors, developed by a research team at MIT's Sloan School of
Management, can bring significant benefits to the organization. Specifically, the

22
critical success factor approach can help managers satisfy their individual
information needs, help the organization determine its IS priorities, and help the
management team develop its agenda.
Advantages
Three key benefits which are discussed in the literature of client/server
computing are greater flexibility, improved productivity, and lower costs. In
order for the clients and servers to interact easily and effectively, there must be
adherence to standards, portability, scalability, and flexibility (Rymer 1994).
Client/server architectures give IS departments the opportunity to split up the
processing to achieve greater flexibility and higher performance than centralized
designs provide.
First, Rymer argues C/S computing increases flexibility by allowing a
company to make better use of existing investments in personal computers and
networks, to accommodate new technology, and to adapt quickly to changing
business conditions. C/S computing complements the business process
reengineering activities that are taking place in many companies today. It
enables the restructuring of companies by putting the data and computing
services of the company closer to the employee and the customers they serve.
Rymer goes on to write, "C/S computing allows greater flexibility in tool
selection, improved performance through scalable and/or specialized
processors, and increased flexibility through a modular layered architecture."

23
Second, Rymer believes C/S computing improves the productivity of
individuals through better access to corporate data and software and
applications which are easier to use, work groups by providing shared
information and better communication with others, and the company through
"rightsizing" and moving to a more participative management style. Employees
are empowered to make more decisions and take on greater responsibility for
day-to-day operations. As companies are "rightsizing", they are reducing the
layers of middle management that were the traditional decision makers and
conduits of information. Client/server computing can help fill the void by sharing
resources and information throughout the company in an efficient, reliable,
flexible, and rapid manner.
Finally, C/S computing provides cost savings through lower replacement
costs for hardware and software, and reduced annual maintenance and support
costs. Companies can also reduce costs by extending the life of their existing
investments in personal computers and networks. In many cases existing
equipment can be used, but where additional hardware is required, it can be
added in modular incremental steps resulting in lower implementation costs.
Disadvantages
While there are many benefits of a successful client/server
implementation, understanding all the risks and bottom-line impacts is difficult.
Management is just now beginning to realize the full cost (not just hardware) of
24
CSC. Xenakis (1995) points to a study by Stamford, Connecticut-based Gartner
Group that estimates that each desktop system, including hardware, software,
and personnel, costs about $40,000 to $50,000 over a five-year period.
In a separate study Schultheis and Bock (1994) also identified cost of
implementation as the greatest single barrier in adopting C/SS. These costs
usually surface in budget overruns due to development and implementation
taking significantly longer than planned. The risks from a control perspective are
also important (Harrison and Lonborg 1995).
Additionally, client/server computing requires that IS professionals be
conversant in mainframe, minicomputer, and microcomputer platforms, and both
wide and local area networking. Huff (1995), Harrision and Lonborg(1995), and
Musthaler (1995) argue that C/SC personnel must be capable of working with a
variety of workstation and server operating systems, database management
systems, application development software, third and fourth generation
programming languages, object-oriented development, and commercial
application software. Since personnel with this diversity of experience are
difficult to find, retraining existing personnel represents a potentially high cost to
the organization. Furthermore, IS personnel staff often have a difficult time
learning these new technology and application development techniques. In fact,
IS shops frequently experience significant personnel turnover during a transition
to client/server computing because of this increased demand. Musthaler (1995)
notes that Forrester Research estimates the costs of retraining one information

25
systems employee could increase $12,000 to $15,000 in firms that do not have
reliable, familiar front-ends in place.
As C/SS become more common, most of the technical hurdles are being
conquered as hardware platforms improve in stability and reliability (Musthaler
1995). However, lagging behind the improvements in hardware, are the
capabilities of the software (Musthaler 1995, Harrison and Lonborg 1995, Huff
1995). It is widely accepted, for example, that server and desktop operating
systems, often lack the stability and reliability that mission critical applications
require. Software problems are not limited to the server and client. Often
compounding this software problem are poorly performing "middleware" tools.
Musthaler defines "Middleware" as the software that translates commands from
one application or network protocol to another. She argues that middleware is
especially critical in a heterogeneous C/SS environment, where there is a variety
of clients, networks and database servers. Without a smooth translation of data
and commands among disparate systems, the applications will bog down, if they
work at all (Musthaler 1995).
Musthaler further argues that perhaps one of the biggest hurdles to
overcome when deploying client/server computing is the resistance to change
that people exhibit. IS managers may balk at the thought of giving up control of
a centralized computing environment while end users may oppose any additional
responsibilities. Moreover, the introduction of C/SS may eliminate or transform
entire jobs.

26
In summary, there are many layers of complexity and much incompatibility
among clients, middleware and servers. Client/server systems can take many
forms, and there are no clear-cut guidelines to installation and development
success. Companies that are making the transition to client/server architectures
successfully have at least four traits in common, including (Xenakis 1995):
1. They keep the new technology under control.
2. They have a strong focus in designing, controlling, and managing their
corporate technology architecture.
3. They have strong programs to handle the multiple vendors that come with
client/server systems.
4. They are making rational decisions about still keeping centralized
processing as the core of their new environment.
Performance Evaluation
The goal of a performance measurement program is to continuously
improve organizational performance (Ricciardi 1996). Performance evaluation
plays a key role in today's information technology. Ricciardi (1996) defines
performance as "productivity multiplied by quality." He goes on to write that it is
made up of both the amount and value of the work completed or performed.
Therefore, an overall performance measurement system, should measure the
ability to deliver the correct output both efficiently and effectively. Performance
measurement is the process of quantifying action, where measurement is the

27
process of quantification and action which leads to performance (Neely 1995). It
is the process whereby managers and subordinates work together on setting
goals, giving feedback, reviewing, and rewarding (Rheem 1995). Organizations
achieve their goals, that is, they perform by satisfying their customers with
greater efficiency and effectiveness than their competitors (Kotler 1984).
Effectiveness refers to the extent to which requirements are met, while efficiency
is a measure of how economically the firm's resources are utilized when
providing a given level of performance. Hence, the level of performance a
business attains is a function of the efficiency and effectiveness of the actions it
undertakes, and thus (Neely, Gregory, and Platts 1995):
1. Performance measurement can be defined as the
process, of quantifying the efficiency and
effectiveness of action.
2. A performance measure can be defined as a metric
used to quantify the efficiency and/or effectiveness of
an action.
3. A performance measurement system can be defined
as the set of metrics used to quantify both the
efficiency and effectiveness of actions.
Rheem (1995), in parallel, to Neely found companies that used
performance management programs almost universally have greater profits,
better cash flow, stronger stock market performance, and greater stock value

28
than companies that did not. The study concluded that organizations need to
understand how well they are making progress toward all of their strategic and
operational goals. And to manage the complexity of today's business, executives
and managers must be able to measure operational results and market
opportunities. To accomplish this many researchers, such as Miskin and Rheem,
argue that performance must be monitored over all financial, operational and
environmental aspects which are critical to the business's success. Specifically,
operational measurements should include assessments of critical success
factors, key performance indicators, service quality, cost-and time-efficiency,
and many other gauges of system performance (Rymer 1994). Furthermore,
Miskin (1995), Rymer (1994), and Ricciardi (1996) stress the importance that
measurements be directed to help influence and forecast future performance
rather than merely to understand and record past results.
One of the top issues in any information systems architecture is how to
achieve peak performance (Ricciardi 1996, Smolenyak 1996). Ricciardi argues
a performance measurement program that doesn't encourage improvements in
the speed, volume or quality of output will not improve productivity, reduce
operating cost, enhance profits, or provide information to manage operations.
Moreover, it may even be detrimental to employee morale. Client/server
computing architectures are no exception. In a 1992 Communications of the
ACM article, Alok Sinha identifies "performance and system management" as a

29
major concern of MIS shops as they migrate to C/SS. Therefore, the purpose of
a performance measurement program should be (Baines 1995, p. 10):
to achieve full coverage of the work to be measured at a level of detail commensurate with the aims of the measurement program, and to achieve it cost-effectively. To achieve this, a performance measurement evaluation will often involve the use of a number of techniques, each selected to cover an appropriate part of the system or function. Techniques include time study, sampling techniques, estimating techniques, synthesis, and benchmarking.
King (1996) and Ricciardi (1996) go on to argue that defining relevant
attributes is only useful if there is a way to measure the system's value with
respect to those attributes. Furthermore, King states that measures must be both
valid and reliable. That is, they must measure what they are really supposed to
measure and they must measure it consistently.
In terms of performance measurement system design, however, the work
of Oge and Dickinson (1992) is perhaps more relevant. They suggest that firms
adopt a closed loop performance management system which combines periodic
benchmarking with ongoing monitoring/measurement.
Perhaps the best known performance measurement framework is Kaplan
and Norton's (1992) "balanced scorecard" which is based on the principle that a
performance measurement system should provide managers with sufficient
information to address the following questions:
1. How do we look to our shareholders (financial perspective)?
2. What must we excel at (internal business perspective)?
3. How do our customers see us (customer perspective)?

30
4. How can we continue to improve and create value (innovation and
learning perspective)?
Figure 2.1. The Balanced Scorecard
Financial perspective
How do we look to our shareholders?
Customer perspective
How do our customers see us?
Innovation and learning perspective
Can we continue to Improve and create value?
Internal business perspective
What must we excel at?
Keegan, Eiler and Jones (1989) proposed a similar, performance
measurement framework -- the performance measurement matrix. Its strength
lies in the way it seeks to integrate different dimensions of performance; and the
fact that it employs the generic terms "internal", "external", "cost" and "non-cost"
enhances its flexibility.
Further work was done by Drucker (1995), where he describes the impact
of the changes from cost-based accounting measures to activity-based
accounting measures. In Drucker's diagnostic, he recommends monitoring four

31
kinds of information: foundation information, productivity information,
competence information and resource-allocation information.
Rather than proposing frameworks, other authors prefer to provide criteria
for performance measurement system design. Globerson (1985), for example,
suggests that the following guidelines can be used to select a preferred set of
performance criteria:
1. Performance criteria must be chosen from the company's
objectives.
2. Performance criteria must make possible the comparison of
organizations which are in the same business.
3. The purpose of each performance criterion must be clear.
4. Data collection and methods of calculating the performance
criterion must be clearly defined.
5. Ratio-based performance criteria are preferred to absolute number.
6. Performance criteria should be under control of the evaluated
organizational unit.
7. Performance criteria should be selected through discussions with
the people involved (customers, employees, managers).
8. Objective performance criteria are preferable to subjective ones.
Maskell (1989), comparable to Globerson (1985), offers seven principles
of performance measurement system design:

32
1. The measures should be directly related to the firm's
manufacturing strategy.
2. Non-financial measures should be adopted.
3. It should be recognized that measures vary between locations -
one measure is not suitable for all departments or sites.
4. It should be acknowledged that measures change as
circumstances do.
5. The measures should be simple and easy to use.
6. The measures should provide fast feedback.
7. The measures should be designed so that they stimulate
continuous improvement rather than simply monitor.
The unpredictable and often haphazard nature of IT systems fuels the
management control problem. Carrie (1995) found that IT project managers
respond by imposing a series of stringent quantitative performance targets on
technical staff based on the estimated time completion of software development
work. He concluded that it is much easier to measure the cost of systems than
their effects.
Advantages
Performance measurement allows for the full utilization of information
technology's service improvement and cost reduction potentials. This was the
conclusion drawn by (Dawe 1994) in an extensive study for the Council of
33
Logistics Management (CLM). Researchers in that study found that performance
measurement is the third most important contributor to logistics management.
Subsequent research found that performance measurement is highly correlated
with the use of information technology. Operations with a high degree of
performance measurements in place use significantly more information
technologies in all categories of information processing than do operations with
lesser degrees of performance measurement. This is crucial because previous
CLM research concluded that the degree of management sophistication is
directly related to the level of performance.
Ricciardi argues that key performance indicators should be identified to
serve as measures of an organization's progress and performance. He believes
that by identifying key goals, management can isolate and monitor the activities
that are required and valued to assure operational success.
Performance measures can also be used as a planning tool and for
setting objectives. If aligned closely with strategic, operational or tactical goals,
and developed and used properly, performance measures aid communications
within a group and can act as an incentive for higher levels of performance.
Finally, performance measures can be combined with other
measurements to give a full picture of an organization's current status.
Frequently, these measures are numerical and can be easily placed in a
spreadsheet or database for graphing and charting and "what-if' analysis.
34
Disadvantages
Information technology by itself will do very little to lower the cost of
receiving, inventory control, shipping, or transportation. According to Lewis
(1996), establishing the wrong measures will lead to far worse results than
establishing no measures at all. Reducing costs requires process and
management improvements to take advantage of what technology can do. Most
information technology experts agree that service improvement potential is much
greater than cost reduction potential.
Forethought and intelligence are needed to make certain that
performance measures do not produce unintended behavior. Ricciardi (1996)
argue that having too many measures or performance indicators may also be
worse than having none at all, serving to confuse and send out mixed
messages. At the very least, the indicators must focus attention on critical
performance issues. Furthermore, measures should be reviewed periodically to
insure their usefulness.
Finally, Miskin (1995) maintains that companies typically measure only
about one-third of their critical success factors and key performance indicators.
The reasons include:
1. Placing too much emphasis on historical financial measurement systems
may cause a company to look at direct costs rather than other soft
benefits. It is also important that measurement be directed to help to

35
influence and to forecast future performance rather than merely to
understand and record past results.
2. The pace of change involved in information technology is much greater
than that of traditional measurement systems. Furthermore, many
measures may involve analysis over a number of years.
3. Informal understanding of 'soft' issues (such as customer satisfaction or
problem resolution) is relied upon. Measurements need to be both
financial and non-financial in nature and must be balanced to ensure that
one objective is not pursued to the detriment of others.
Miskin concludes that a company's philosophy should be to simplify information
and focus management's attention on those strategic, operational and tactical
goals that provide a business with competitive advantages. Nelson (1995),
therefore, recommends selecting four to six indicators, a number that should be
sufficient to ensure completeness but small enough to prevent the loss of focus.
Benchmarking
Benchmarking is a quality tool used by industry today that should provide
information that may lead to the increased success of a company. The main
themes of benchmarking are improving operations, purchasing, services, quality,
and marketing systems and reducing the time to market cycles by looking at the
method used by the best companies. Benchmarking provides a valuable link
between companies that can result in each company becoming stronger. The

36
five main reasons for benchmarking are to: 1. change or strengthen company
culture, 2. increase competitive advantage, 3. create awareness, 4. enhance
operational performance, and 5. manage the company strategically (Neely et al.
1995).
Some authors see benchmarking as a means of identifying improvement
opportunities as well as monitoring the performance of competitors. Young
(1993), for example, argues that benchmarking is being used in this way by
many large companies. He proposes that as most of the "low hanging fruit has
been picked", the identification of improvement opportunities is becoming
increasingly difficult. Hence, managers are adopting benchmarking as a means
Figure 2.2. The Nine-Step Benchmarking Process
Identify what is to be benchmarked
Identify comparative compnies
Determine data collection method and collect data
Determine current performance "gap"
Project future performance levels
Communicate findings and gain acceptance
Establish functional goals
Implement specific actions and monitor progress
Recalibrate benchmarks
37
of searching for best practice and new ideas. He identifies four steps in the
benchmarking process:(1) planning; (2) analysis; (3) integration; (4) action.
Of course one danger with this approach is that the company searching for best
practice will always be following rather than leading.
Perhaps the most comprehensive description of benchmarking, to date,
has been provided by Camp (1989). He defines benchmarking as the search for
industry's best practices that lead to superior performance.
Finally, Brown (1995) reports on a four-phase method of the APQC, which
he suggests is a simple and easy approach to use. The steps in this method
are: 1. plan and design, 2. collect, 3. analyze, and 4. adapt and improve.
Benchmarking invariably involves companies continuously comparing
themselves to industry leaders by gathering information and taking action to
improve performance.
Total Quality Management
Shepherd and Helms (1995) define total quality management (TQM) as
an organizational improvement program that matches output to customer needs.
It requires teamwork and continuous improvement involving strategic planning.
A key to assessing the progress of a TQM process is measurement. They argue
that companies need performance measures that will allow them to effectively
manage their operations and meet business and financial goals. Defining current
performance in the elements of quality, cost, flexibility, reliability, and innovation

38
allows organizations to evaluate performance and to prioritize areas for initiating
improvement processes. Data analysis is the critical factor in determining how
well a company is accomplishing its goals. Capon and Wood (1995) point out
that the most traditional measure of TQM success as a whole is cost of quality.
While cost is still the leading measure used to access TQM programs,
qualitative measures are growing and becoming increasingly important to quality
processes. TQM relies on such qualitative measures as customer satisfaction,
employee commitment, team performance, supplier cooperation, and an
organization's reputation.
The Baldrige framework by Reimann (1989), one of the best known, set
the following objectives for an effective measure of TQM success: (a) customer
perceptions of service provided; (b) encouragement of continuous improvement;
(c) consistency of processes, both administrative and mechanical; (d) cost
effectiveness of quality program; (e) ease in understanding and updating.
Baldrige's criteria were summarized into six key areas to be measured: (1)
management involvement; (2) strategic quality planning; (3) employee
involvement; (4) training; (5) process capability; (6) customer perceptions
(Reimann 1989).
Regardless of the measure used, inappropriate performance
measurement is potentially a major cause of failure in TQM implementation.
Sinclair and Zairi report on a survey conducted at the European Centre for TQM
which found that even in companies assumed to be leaders in both performance

39
measurement and TQM, a significant gap exists between the aspects of
performance which managers perceive as being important to measure, and the
actual performance measures used.
Another problem historically facing TQM projects is data. Furthermore,
quality is often measured by the percentage of failures (Capon and Wood 1995).
Finally, the authors argue that many techniques are available at a detailed level,
but few measure the success of a total quality management (TQM) program as a
whole. The weakness in many of the currently used techniques is that a
company-wide picture of progress is not achieved.
Chapter Summary
Pollalis (1996) identifies four major components of IS planning that
overlap with the objectives of TQM: (a) alignment of corporate and IS goals, (b)
customer/user focus, (c) IT-based process change, and (d) organizational
learning.
As C/SS are introduced, companies are seeing the increasing need to
develop performance measures programs and TQM programs where
contributions to corporate goals are measured and rewarded. A performance
measure program: (a) has defined clear, realistic corporate goals;(b) has set
local unit and individual goals which are congruent with the corporate goals; (c)
has communicated these goals, and they have been understood; (d) has
40
positively reinforced the performance of individuals and teams in achieving their
goals; and (e) is able to differentiate between levels of achievement.
To achieve performance goals requires coherent direction setting and
performance measurement with aligned reward and recognition support systems.
To develop a performance measure it is vital to understand what constitutes a
good performance. Merely doing what the boss says is not good enough. Of
course, there will always need to be an element of managerial judgment in
assessing the contribution of an individual, but a coherent and equitable set of
measurable objectives forms a vital element in exercising this judgment.
Poorly designed performance measurement systems can seriously inhibit
the ability of organizations to adapt successfully to changes in the competitive
environment. Sinclair and Zairi (1995) suggest that inappropriate performance
measurement can block attempts to implement TQM, since measurement
provides the link between strategies and actions. The authors sum up their point
with the phrase "what gets measured gets done", (p. 43)
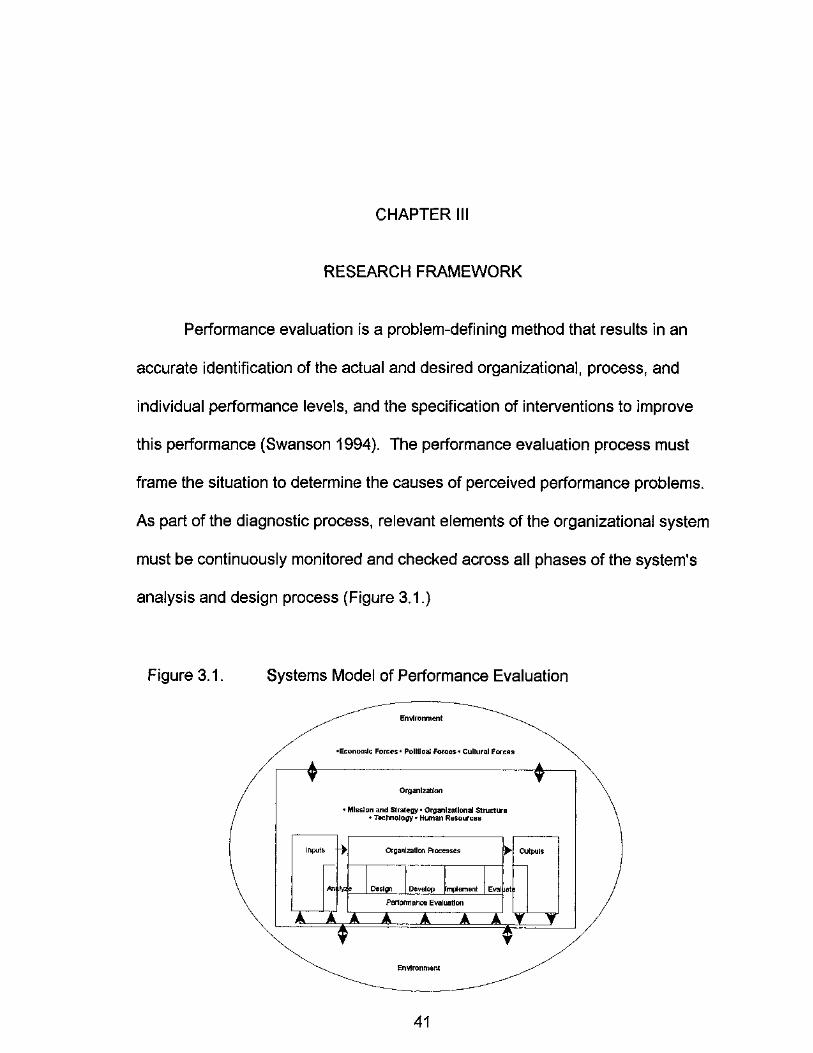
CHAPTER III
RESEARCH FRAMEWORK
Performance evaluation is a problem-defining method that results in an
accurate identification of the actual and desired organizational, process, and
individual performance levels, and the specification of interventions to improve
this performance (Swanson 1994). The performance evaluation process must
frame the situation to determine the causes of perceived performance problems.
As part of the diagnostic process, relevant elements of the organizational system
must be continuously monitored and checked across all phases of the system's
analysis and design process (Figure 3.1.)
Figure 3.1. Systems Model of Performance Evaluation
Environment
Economic Forces • Political Forces • Cultural Forces
Organization
Mission and Strategy • Organizational Structure Technology • Human Resources
Inputs —y • Outputs Organization Processes
Design Develop Implement Evaliat
Performance Evaluation
Environment
41

42
Systems Model of Performance Evaluation
The theoretical framework for this study is adapted from Swanson's
(1994) performance diagnosis process. Swanson contends this method is a
problem-defining method that results in (1) an accurate identification of the
actual and desired performances at the organizational, process, and/or
individual levels, along with (2) the specification of interventions to improve
performance. The process of performance diagnosis contains five phases
(Figure 3.2).
The process starts with articulating the initial purpose of the diagnosis. It
then moves into three realms: performance variables, performance measures,
and performance needs. These three phases are pursued concurrently and at
rates dictated by the situation. The performance evaluation process concludes
in a performance improvement proposal. This proposal acts as a synthesis of
the findings and provides the springboard for organizational approval and action.
The following sections detail the five phases of the performance diagnosis
process.
Initial Purpose
It is important to start the performance diagnosis process by articulating
the original purpose of the diagnosis. The diagnostician does this by identifying
four factors related to performance: determine initial indicators of performance
problem, determine type of performance issue, determine targeted level(s) of
performance, and articulate purpose of performance diagnosis. Swanson (1994)

Figure 3.2. Performance Evaluation Framework.
43
if Sfl
,13 3 FOO
a !

44
believes that articulating the initial purpose of the performance diagnosis in this
way guides the analyst through often vague and contradictory information.
Performance Variables
Swanson (1994) argues, to assess performance variables, an
investigation of five performance variables at three performance levels should
take place. This phase is broken down into a three-step process model by
Swanson. The first step is to scan the available data on the performance
variables and see how they are presently operating. From this list the
diagnostician can determine if additional data on performance variables are
needed. Finally, a profile of missing or flawed variables is made which is
required for desired performance.
Performance Measures
To specify the performance measures, the relevant output units of
performance at the organization, process, and/or individual levels need to be
identified. In this stage Swanson (1994) details a three phase process model. In
specifying performance measures, Swanson believes it may be helpful to
consider the levels and units of performance perspective. He supplies a scheme
which includes time, quantity and quality as its features.

45
Performance Needs
Swanson (1994) includes three steps in this process model. He contends
to best determine performance needs, an investigation of the performance issue
in terms of both performance level and performance taxonomy must take place.
By combining performance levels (organizational process, and/or individual) with
the taxonomy of performance, a deeper understanding of the performance
issues can be addressed. The taxonomy of performance lays out five tiers of
performance: understand, operate, troubleshoot, improve, and invent. Swanson
divides this taxonomy into two general categories: maintaining the system and
changing the system.
Performance Improvement Proposal
The process of constructing a performance improvement proposal
contains three steps. According to Swanson (1994), these steps help the
analyst organize the information for the purpose of putting together an effective
and brief proposal. At a minimum, a performance improvement proposal should
address four major elements: performance gap, performance diagnosis,
recommended interventions, and forecasted benefits.
Research Variables
The selection of research variables for this study will be guided by the
framework. The specific variables of interest are grouped by category under

46
each step of the framework (see Figure 3.2). Table 3.1 details the list of
constructs, variables, and measures for the research framework. The first row of
Table 1 contains the primary variable which is performance units. This variable
is identified by the surrogates information quantity, reliability, information quality,
response time, ease of use, cost benefit analysis and project evaluation. This
Table 3.1. Variable Analysis Table
Constructs Independent Variable
Surrogates Measures
Performance Measures
Performance Units information quantity reliability information quality response time ease of use cost benefit analysis project evaluation
questionnaire I Likert scale actual measures
User Satisfaction overall satisfaction decision-making satisfaction enjoyment information satisfaction
questionnaire II Likert scale
Individual Impact overall benefit of use efficiency decisions impact decision time decision confidence
questionnaire IV Likert scale
Work Group Impact
participation communication solution effectiveness solution quality meeting thoroughness
questionnaire IV Likert scale
Organizational Impact
cost customer service productivity return on investment (ROI) data availability
questionnaire III Likert scale actual measures
list was used to identify suitable research sites. The moderating variable,
client/server systems use, is represented by the surrogate termed system scope,

47
which in turn is measured using user satisfaction, individual impact, work group
impact and organizational impact.
Total level of activity can be measured in various ways, depending on the
case being investigated. In a programming environment, the total level of
activity can be the number of lines of code that must be manually generated by
individuals, or the total number of reports that individuals need to generate, or
the total number of decisions that individuals need to make. It is assumed that if
information processing requirement has increased, this increase can be
measured by observing the change in the level of activity. If the implementation
of a client/server system has taken up some of the need to generate a certain
level of activity, the total level of activity generated, or which needs to be
generated, will be reduced.
Case Study Propositions
Yin (1989) and Eisenhardt (1989) propose several steps for building
theories from case studies. Yin argues that individual case studies in multiple
case study research should be considered as multiple experiments. Yin
proposes the use of analytical generalization rather than statistical
generalization, which is commonly found in surveys using a sample of data from
a population. In statistical generalization, an inference is made about the
population by testing a hypothesis or series of hypotheses on empirical data

48
collected. In analytical generalization, a previously developed theory is used as
a template with which to compare empirical data collected from a case study.
If two or more cases are shown to support the same theory, Yin argues
that replication may be claimed. The evidence for the theory is made stronger if
two or more cases support that theory, but do not support an equally plausible
rival theory (Yin 1989). The evidence of the theory should be accepted only if
the research can demonstrate construct validity, internal validity, external
validity, and reliability (Kidder and Judd 1986).
The following propositions were developed using the framework in Figure
3.2 and, the variables and measures in Table 3.1:
1. Implementation of C/SS facilitates the use or adjustment of traditional IS
performance measures for adequate system evaluation.
2. Implementation of C/SS facilitates the use of new or additional
performance measures for adequate system evaluation.
3. Implementation of C/SS facilitates the meeting of organizational goals.
4. Implementation of C/SS facilitates a lack of CIS user requirements
thereby impacting system performance.
5. Implementation of C/SS facilitates the collection of special criteria for
determining which performance measures to evaluation.
6. Implementation of C/SS facilitates the need to identify and clearly
articulate the C/S management performance measures that, taken

49
together, enable C/S to be effectively applied in support of a firm's
strategies and operations.
7. Implementation of C/SS facilitates the need to demonstrate how
performance measures make a difference in linking a firm's C/S critical
success factors regarding these performance measures with its ability to
effectively apply C/S in support of its strategies and operations.
8. Implementation of C/SS facilitates a firms focus and reinforcement of
management's toward these performance measures.
Chapter Summary
This chapter reviews the research framework underlying this study, and it
identifies and discusses the variables that will be investigated. As noted, a list of
core competencies of client/server computing and performance measures for
each competency will be identified.
CHAPTER IV
RESEARCH METHODOLOGY
This study obtained data from selected upper lever network managers,
middle level department managers, IS staffers, and general end-users, in order
to establish a set of client/server performance measures used by companies to
evaluate each competency. A literature review was conducted to determine the
set of client/server performance measures and core competencies used in this
study. Using this set, data was collected from respondents regrading techniques
used in organizations to determine: what performance measures are collected,
how performance measures are determined, who is responsible for selecting
critical success factors, setting system goals and determining acceptable
deviations, and when and how performance measures are taken.
Research Design Procedures
Because client/server technology is in its formative stages (Kappelman
and Guynes 1995), varying systems, different contexts of implementation, and
problems can confound its study. Therefore, exploratory case study research
appears to be a suitable methodology for researching the role performance
measures play is evaluating client/server (Benbasat, Goldstein, and Mead
1987). This is because case studies are able to capture the rich knowledge and
50

51
different practices of the users, and enable researchers to develop theories and
prescribe management guidelines (Yin 1989).
By employing a multiple case study design, the research was able to
examine client/server systems in its natural settings and make comparisons.
Additionally, multiple cases increase the external validity of the research (Yin
1989, Eisenhardt 1989).
The following procedural steps were used in researching the problem,
planning the study, conducting the survey of respondents, and presenting
findings, conclusions, and recommendation:
1. Sample selection
2. Development of the survey instruments
3. Research framework
4. Collection of data
5. Presentation of findings, conclusions, and recommendations.
Sample Selection
Sites for the case studies were chosen from leading firms in the information
system field. Consideration was given to information based firms because of
their leading edge influence on client/server technology. Because client/server
technology is relatively new, this would seem to be a logical approach.

52
Development of the Survey Instruments
Sambamurthy and Zmud (1994) (see Figure 4.1) found that even though
firm and situation specific factors are likely to result in varying company focuses,
a set of critical success factors for IT management could be identified that are
generally represented and common to a measurable degree within all firms.
Using this strategy, critical success factors for C/S management can identify a
firm's company-specific C/S management roles and processes, thereby enabling
the firm to better measure those activities that it deems most important. A four
year research study by Sambamurthy and Zmud identified 29 factors organized
within seven categories. When adapted to C/SS these factors comprise a
discrete and distinct spectrum of C/S success factors that provide a key set of
factors which can be tracked and measured for evaluation.
Furthermore, Sambamurthy and Zmud believe that analysis of such
measures will allow network managers to.
1. measure and compare two states of development, current and importance, for each of the performance measures for C/S management;
2. identify and rank-order performance measures that are considered critical success factors, or deemed most vital to a firm's C/S management strategy;
3. measure a competency's gap, or relative difference between current and desired states of being, to focus resources first on developing CSF performance measures with the greatest need;
4. gain insight with respect to objectives and perception of C/S performance measures of top executives compared with employees, as well as between C/S staff and users.

53
igure 4.1. Client/Server Critical Success Factors Categories Business Deployment: the capabilities involved in bringing together groups of organizational members cognizant of technology and business issues and channeling their subsequent interactions such that C/S is appropriately and effectively deployed in support of business strategies and activities. • Examination of the potential business value of new, emerging CS • Utilization of multidisciplinary terms throughout the organization • Effective working relationships among line managers and information services (IS) staff • Technology transfer, where appropriate, of successful C/S applications, platforms, and
services • Adequacy of CS-related knowledge of line managers throughout the organization • Visualizing the value of C/S investments throughout the organization • Appropriateness of C/S policies • Appropriateness of C/S sourcing decisions • Effectiveness of C/S measurement systems External Networks: the capabilities involved in bringing together an organization's members with their counterparts in other firms so that ongoing, cooperative relationships aimed at more fully exploiting the potential of C/S are developed and maintained. • Existence of electronic linkages with the organization's customers • Existence of electronic linkages with the organization's suppliers • Collaborative alliances with external partners (vendors, systems integrators, competitors, etc.) to develop CS-based products and processes Line Technology Leadership: the capabilities involved in nurturing the willingness and ability of all organizational members to become actively involved in the appropriate and effective application of CS. • Line managers' ownership of C/S projects within their domains of business responsibility • Propensity of employees throughout the organization to serve as "project champions" Process Adaptiveness: the capabilities involved in carrying out, on an ongoing basis, the incremental and radical restructuring of business processes. • Propensity of employees throughout the organization to learn and subsequently explore the
functionality of installed C/S tools and applications • Restructuring of business processes, where appropriate, throughout the organization • Visualizing organizational activities throughout the organization CS Planning: the capabilities involved in devising and implementing planning processes that appropriately balance the needs for flexibility and innovation with the needs for prioritzing alternative uses of scarce resources and for focusing managerial attention on critical objectives. • Integration of business strategic planning and C/S strategic planning • Clarity of visions regrading how C/S contributes to business value • Effectiveness of C/S planning throughout the organization • Effectiveness of project management practices CS Infrastructure: the capabilities involved in devising and implementing a technological resource base that enables current C/S applications and provides direction for, but does not inordinately constrain, future C/S application. • Restructuring of C/S work processes where appropriate • Appropriateness of data architecture • Appropriateness of network architecture • Consistency of object (data, processes, rules, etc.) definitions • Effectiveness of software development practices Data Center Utility: the capabilities involved in providing efficient and reliable commodity C/S products an services. • Appropriateness of processor architecture • Adequacy of quality assurance and security controls

54
Sambamurthy and Zmud (1994) designed the assessment instrument to
be useful in identifying an organization's strengths and weaknesses with regard
to its IT management competencies. This instrument ill be adapted for use in this
study of C/SS. The data generated by the instrument will consist of aggregated
responses across the IS staff members regarding the perceived current and
desired status and their relative importance; for example, those factors indicated
as being critical success factors of a firm's C/SS.
Methodology
The evidence for this study comes form three sources: (1) interviews, (2) direct
observation, and (3) physical artifacts. The interviews were conducted as a
combination of structured and focused interviews performed on site. A pilot test
for the research instruments were conducted using eight client/server
professionals with an average of 8 years of IT and C/S experience. Changes and
improvements were included as a result of this pilot test. Four instruments were
developed for the structured interviews. The first instrument collected
demographics, identify organizations, and subjects.
As suggested by Sambamurthy and Zmud (1994), a number of analyses
on the data was performed to interpret the aggregated responses. First, using
the raw response data, averages of the current responses for the competencies
across organizations were examined to identify performance levels currently
perceived as more (higher scores) and less (lower scores) developed. The

55
averages were calculated by summing, across all seven states of development
the products, of the number of responses for each state of development and the
value of the state of development. Here, the value of the first state of
development is 1, the value of the second state of development is 2, and so on.
Sambamurthy and Zmud (1994) have further suggested the following rule to
interpret the current scores: (a) greater than 3 , the most developed competency,
(b) 2-3, moderately developed competency, and (c) less than 2, the least
developed competency.
Second, averages of desired responses for the competencies across
organizations were examined to identify those competencies perceived to benefit
the most (or least) from full development. Again Sambamurthy and Zmud (1994)
suggest the following rule to interpret the scores: (a) close to 5, competency
needing the most development, (b) 3-4, competency needing moderate
development, and (c) less than 2, competency needing the least development.
Third, the number of times each competency is indicated as being a CSF
showed which competencies are perceived as most and least important.
Sambamurthy and Zmud have identified at lest three ways that such information
can be used. First, it may provide a means to compare the relative states of
development or relative importance of two (or two sets of) competencies.
Second, it may enable an individual (such as a senior IS executive) to contrast
his or her personal objective or perceptions with the overall perceptions of IS
staff members and of partners and clients. Third, if the assessment tool is
56
administered at multiple points in time, these scores provide a vehicle for
tracking the extent to which competencies targeted for improvement are actually
perceived to be improving.
Fourth, a joint examination of the relative importance of a competency
along with the gap between its current and desired states of development may
result in a prioritized list of competencies to be scrutinized first in the effort to
enhance a firm's C/S management practices. The gap score is the simple
arithmetic difference between a competency's current and desired scores.
Sambamurthy and Zmud offer two rules determining which competencies are
priority candidates for improvement: (a) If a competency is identified as highly
important (a CSF) and has a large gap score, it is a prime candidate for
improvement actions, and (b) If a competency is identified as relatively
unimportant but as having a large gap score, it is also a prime candidate for
improvement actions.
The reasoning behind the second rule is that these conflicting signals
suggest that the respondents might be genuinely perplexed about the
competency and, hence, might benefit form discussions of underlying
assumptions or values regarding the competency. Sambamurthy and Zmud
(1994) speculate as to other explanations for such an observations: (a) it is
desirable, but not necessary, to further develop the competency, (b) while it is
desirable to develop the competency, respondents just do not wish to tackle the
issue right now, (c) while it is believed that more development of the competency

57
would be beneficial, respondents are generally quite satisfied with the
competency's current state of development.
Finally, the differences between responses of IS staff members and users
for current state of development, desired state of development, and relative
importance was examined to identify issues where misunderstanding might exist.
Once identified, management efforts can be directed to understanding and
resolving any communication problems.
Assumptions and Limitation
Assumptions
One assumption of this study is that the subjects have sufficient
knowledge for their firms client/server system and environment. Since network
and LAN managers are being targeted as subjects, this assumption appears
reasonable. The C/S competency assessment used in this study requires a
specific knowledge and in-depth familiarity of each firm's C/SS. Consequently, it
is considered appropriate to use a very specific subject pool.
Second, it is assumed that subjects will be sufficiently motivated
throughout the study to make a "good faith effort" at providing full information.
Since the study will require a significant time commitment (approximately four,
one hours periods), disinterest and fatigue could potentially play a factor.
However, several tactics will be employed to prevent this. First, subjects were
informed of the study's time requirements both orally and in the participant

58
consent form before committing to participate. This provides realistic
expectations, and it helps to ensure that only people who are interested in doing
the study participate.
Limitations
Limitations are an inherent part of any research study. For instance, one
of the chief weaknesses of case studies, the lack of control, also applies to this
study. While the use of a sample of network managers increases the internal
control of the study compared to many studies that use all employees within an
organization, still, control remains an issue. Subjects were selected for this study
based upon their availability - it is not possible to draw a random sample of
subjects from the universe of network professionals. Thus, there can be no
assurance that the responses returned by subjects in this study will necessarily
match those of all network professionals in the workplace.
Second, this study, like most field studies, involves the use of one-shot
surveys of people who typically must perform within different C/S environments
and organization cultures. While firm- and situation-specific factors are likely to
affect the relative importance of competencies across firms. Sambamurthy and
Zmud (1992,1994) indicate that each competency is important and needs to be
accounted for within an organization's overall C/S management strategy. These
C/S management competencies, rather than C/S management roles and
processes, are stable across all organizations. Thus, they were used to serve
59
as the primary vehicle for evaluating the quality and appropriateness of an
organization's C/S management strategies and practices.
The findings of this study may also be limited to the nature of the
assessment tools. While this study utilizes validated assessment tools
developed by Sambamurthy and Zmud (1994), there is no guarantee that the
same results would be obtained if different assessment instruments were used.
Similarly, this study requires highly judgmental evaluations that involve specific
operations knowledge. Thus, subjects skill levels and system familiarity are
important.
Expected Outcomes
Knowing where an organization is and where it desires to be regarding its
client/server performance measures as well as determining their relative
importance should enable a meaningful diagnosis of C/S management's
strengths and weaknesses, Further, such knowledge should give direction to an
organizations' efforts to either fine-tune or reengineer its C/S management roles
and processes (Figure 4.2). The ultimate objective of this research is to align the
organization's C/S strategies and practices more closely with its business
strategies and practices.
More specifically, this research enables an organization to do the
following:

60
1. compare the relative states of development of importance of client/server
performance measures;
2. identify performance measures with the highest priority for future
development;
3. track, over time, improvements occurring (or not occurring) in a
performance measure or performance area; and
4. contrast the views of different organization regarding the current or
desired states of development or relative importance of these measures.
Figure 4.2 How CS Management Competencies Enable Business Value
Raw Materials
CS Impacts
CS Management Roles and Processes
• Products
• Services
CS Management Competencies
• New/improved Products and Services
* Enriched Organizational Intelligence
~ lamlc Organizational Structures
• Dvni Org
• Client-Server Technologies
• Knowledge of How to Apply CS
• Knowledge of Business Activities
• Business Threata and Opportunities
• Data
Further, if data are obtained on the states of development and relative
importance of these measures in other firms, an opportunity arises to benchmark
the firm's C/S management practices against those of other firms.
CHAPTER V
METHODOLOGY AND FINDINGS
The business value obtained from client server systems is ultimately
derived from its effect on the nature of a firm's products and services. At times,
this effect is clear and direct, such as when C/SS (1) serves as an instrumental
feature of a new product or service or as the basis of an enhancement to an
existing product or service, (2) improves a customer's or client's access to a
product or service, or (3) improves the efficiency of the work processes involved
in providing a product or services is often far less direct. Consider the following:
1. An organization creates new products or improves existing products
because its members are able to integrate diverse sets of information
and, hence, gain fresh insights about markets, competitors, customers,
and their firm's capabilities.
2. An organization improves its client relationships because its members are
provided new communication channels through which they interact with
clients.
3. An organization improves the quality of its work outcomes because its
members are able to quickly form and re-form work groups irrespective of
temporal or geographic boundaries. (Jones 94)
61

62
Numerous pathways do exist through which an organization can obtain
business value from its C/SS investments.
As indicated by other research (Martin 92, Jones 94, Neely 94) a key
factor distinguishes a firm's ability to profit continuously from their information
technology investments is their ability to assess the many and varied activities
involved with its successful application. However, there is a reluctance to use
traditional IS performance measures to apply to C/SS in support of business
strategies and activities. Consequently, in an effort to create value through their
C/SS investments, organizations create distinct C/SS performance measures,
management roles and processes in order to fuse together data; IS resources;
knowledge of how to effectively apply these data and IS resources; and
knowledge of business activities, opportunities, and threats.
The distinctive nature of a firm's C/SS performance measures leads many
to question how fully traditional IS performance measures provide the
information necessary to manage in the client/server environment.
The fact that similar organizations may demonstrate disparate C/SS
management roles and processes raises the following dilemma:
If C/SS performance measures, are inherently firm- and situation-specific,
how can an organization assess the appropriateness of its current C/SS
performance measures? What criteria do companies use to determine
which performance measures to collect? and Who is responsible for
establishing performance measures?

63
It is possible, though often quite difficult, to evaluate the effectiveness and
efficiency of a given measure. However, such evaluations are themselves firm-
and situation-specific. How, then, can an organization evaluate (1) the quality of
its existing C/SS evaluation and performance practices; (2) how they meet the
company's needs; and (3) how these practices compare with those of other
firms?
Earlier literature reviews found a set of enterprise-wide traditional IS
performance measures, client/server critical success factors and management
competencies that do hold across organizations. These traditional performance
measures, CSFs and management competencies refer to the capabilities and
skills that an organization develops over time and that enable it to effectively
acquire, deploy, and leverage its information technology investments in pursuit
of business strategies and in support of business activities.
The literature has identified over 200 traditional performance measures
and 29 CSFs and management competencies that organizations use actively to
attend to these performance evaluations. Those organizations that monitor them
well are more successful in applying C/SS than firms that do not. It is important
to state that this research has not found that all organizations need to fully
develop each of these performance measures and CSFs in the client/server
environment. Firm- and situation-specific factors are likely to affect the relative
importance of these performance measures and CSFs across firms. Still, this
research does indicate that each performance category and CSF is important

64
and needs to be accounted for within an organization's overall C/SS
management strategy.
These performance measure categories, CSFs and management
competencies, rather than C/SS management roles and processes, are stable
across all organizations. Thus, they serve as the primary vehicle for evaluating
the quality and appropriateness of an organization's C/SS management
strategies and practices. Knowing where an organization is and where it desires
to be regarding these categories, factors and competencies as well as
determining their relative importance should enable a meaningful diagnosis of
C/SS management's strengths and weaknesses. Further, such knowledge
should give direction to an organization's efforts to either fine-tune or reengineer
its C/SS. The ultimate objective of such efforts is, of course, to align the
organization's C/SS strategies and practices more closely with its business
strategies and practices.
More specifically, such an analysis can enable an organization to do the
following:
1. Compare the relative states of development or importance of two or more
performance measurements;
2. Identify performance measures with the highest priority for future
development;
3. Track, over time, improvements occurring (or not occurring) in a
performance measure; and

65
4. Contrast the views of different segments of the organization (e.g., the
information services staff and managers verses end-users) regarding the
current or desired states of development or relative importance of these
performance measures, CSFs and competencies.
The test firms for this study can be characterized as follows:
1. A large multinational petrochemical firm comprising heterogenous
divisions, espousing centralized and decentralized corporate
management philosophy. Its C/SS needs were being handled
predominately by a corporate IS group. The firm was just commencing an
organization-wide business process reengineering effort.
2. A large multinational transportation firm (1) comprised of heterogenous
divisions, espousing both centralized and decentralized corporate
management philosophy. Its C/SS needs were being handled
predominately by divisional IS groups. The firm was in the process of
spinning-off one of its major divisions.
3. A large multinational transportation firm (2) comprising of heterogenous
divisions, espousing both centralized and decentralized corporate
management philosophy. Its C/SS needs were being handled at both the
corporate and divisional levels. The firm was in the midst of reorganizing
into a separate firm.
4. A large multinational transportation firm (3) comprising of heterogenous
divisions, known as one of the leaders in computer technology in it's

66
industry. Its C/SS needs were being handled at both the corporate and
divisional levels. The firm was in the midst of labor negotiations.
5. A medium-sized medical firm comprising of heterogenous divisions, in the
midst of being acquired by another medical firm. Its C/SS needs were
being handled at the division levels
6. A small-sized information systems firm comprising of one homogeneous
group. Its C/SS needs were being handled centrally. The firm was
growing at over twenty percent a year
The data generated by the responses consist of the aggregated response
from IS staff members, IS department managers, other corporate and division
department managers, and C/SS end-users regarding (1) current status, (2)
desired status, and (3) relative importance (e.g., critical success factors [CSFs])
of a firm's C/SS management. Appendix A displays the data for each of the six
firms.
IS managers respondents included senior IS executives, managers, and
professionals from both the corporate and divisional IS groups. The IS staff
respondents included general IS professionals with a wide range of titles but all
working with C/SS and networks as a key part of there job responsibilities. The
end-uses respondents included employees from all parts and levels of the firms.
Notice that the number of respondents varied among the firms:

67
Table 5.1 Firm's Respondents Grouped by Staff and User
Firm IS Staff Users
Petrochemical (System 1) 4 8
Petrochemical (System 2) 3 8
Transportation (1) 3 11
Transportation (2) 4 10
Transportation (3) 4 10
Medical 4 10
Service 6 13
Generally, confidence in a study increases as the number of respondents
increases because it becomes less likely that extreme views will distort the
findings. The number of respondents for each of the cases sites is relatively
small, so the interpretation of the data emphasizes large differences across the
responses rather than small differences.
Performance Measures Data
The performance measures data were analyzed in several ways. The first
three procedures are relatively straightforward.
Step 1. Using the raw response data, averages of the current responses
for the performance measures across an organization were employed to identify
those that are currently perceived as more (higher scores) and less (lower
scores) developed. The averages were calculated as follows; (1) The seven

68
states of development of the performance measures were assigned numerical
values from 1 to 7; (2) the number of responses for each state of development
were multiplied by its numerical value; (3) the product scores obtained in (2)
were added; and (4) this total was divided by the total number of responses.
Given the range of scores observed at the six sites, the following rule to
interpret the current scores were developed:
Table 5.2 Interpretation of the Current State of Development
Value Interpretation
Higher than 5 The most developed competencies
Between 4-5 Moderately developed competencies
Lower than 4 The least developed competencies
Step 2. Using a similar methodology, averages of desired response for
the performance measures were examined across an organization to identify
those performance measures to benefit the most (or least) from full development.
Again, given the range of observed scores, the following rule to interpret these
desired scores were developed:
Table 5.3 Interpretation of the Desired State of Development
Value Interpretation
High than 5 Performance needing the least development
Between 4-5 Performance needing moderate development
Lower than 4 Performance needing the most development

69
Step 3. The number of times each performance measure was indicated as
being a CSF to point to which performance measures are perceived as most and
least important.
Analyses of the values was used in three ways:(1) to compare the relative
states of development or relative importance of two (or two sets of) performance
measures; (2) to contrast the personal objectives of an individual (such as a
senior IS executive) with the overall perceptions of the IS staff as well as the
perceptions of end-users; (3) to track the extent to which one or more of the
performance measures targeted for improvement are actually perceived to be
improving.
Step 4. A joint examination of the relative importance of a performance
measure along with the gap between its current and desired states of
development suggest which measures need to be scrutinized first in order to
enhance a firm's C/SS management practices. Gap scores are the difference
between a performance measure's current and desired scores. The following
two rules for suggesting which measures are top candidates for improvement
were developed:
1. If a performance measure is identified both as being highly important and
having a large gap score, it is a prime candidate for improvement.
2. If a performance measure is identified both as being relatively
unimportant and having a large gap score, it also becomes a candidate
for management attention.

70
The reasoning behind the second rule is that these conflicting signals
suggest that respondents might be genuinely perplexed about a performance
measure and, hence, might benefit from discussions of underlying assumptions
or values regarding it. Of course, the apparent conflict could have alternative
explanations: (1) it is desirable, but not necessary, to further develop the
measure; (2) while it is desirable to develop the measure, people do not wish to
tackle the issue right now; or (3) while more development of a measure might be
beneficial, people are generally satisfied with the performance measure's current
state of development.
Step 5. The differences between responses of IS managers, IS staff and
end-users-for current state of development, desired state of development, and
relative importance-to identify issues that might be misunderstood were
examined. Once these issues were identified, efforts were made to understand
and resolve these problems.
Findings
The next seven sections of the chapter discuss the results of applying
these five analytic procedures to the responses obtained from the six case
organizations.

71
The Petrochemical Firm (System 1)
Steps 1 and 2: IS Staff and Management
Table 5.4 shows that C/SS performance areas; maintaining data integrity,
maintaining data accuracy, systems support, data compatibility with mainframe,
load analysis, and control over computer maintenance are perceived as the
factors currently at the highest states of development. Providing training to users,
establishing priorities, training, education and documentation, data
communications and networking controls, and training of end users are
perceived to be at much lower current states of development.
The performance areas that IS staff believe should exist at the highest
states of development include applications support, maintaining data integrity,
maintaining data accuracy, data communications and networking controls,
control over access to data, and input controls. On the other hand, it appears
that IS staff would be quite comfortable if the determination of information
requirements, elapsed time, and end user controls never moved beyond a
modest state of development.
Table 5.5 shows that C/SS performance operational measure; data
security is perceived as the factor currently at the highest state of development.
Percent of employees with terminals, personal computers, employees-per
workstation, and business value-added are perceived to be at much lower
current states of development.
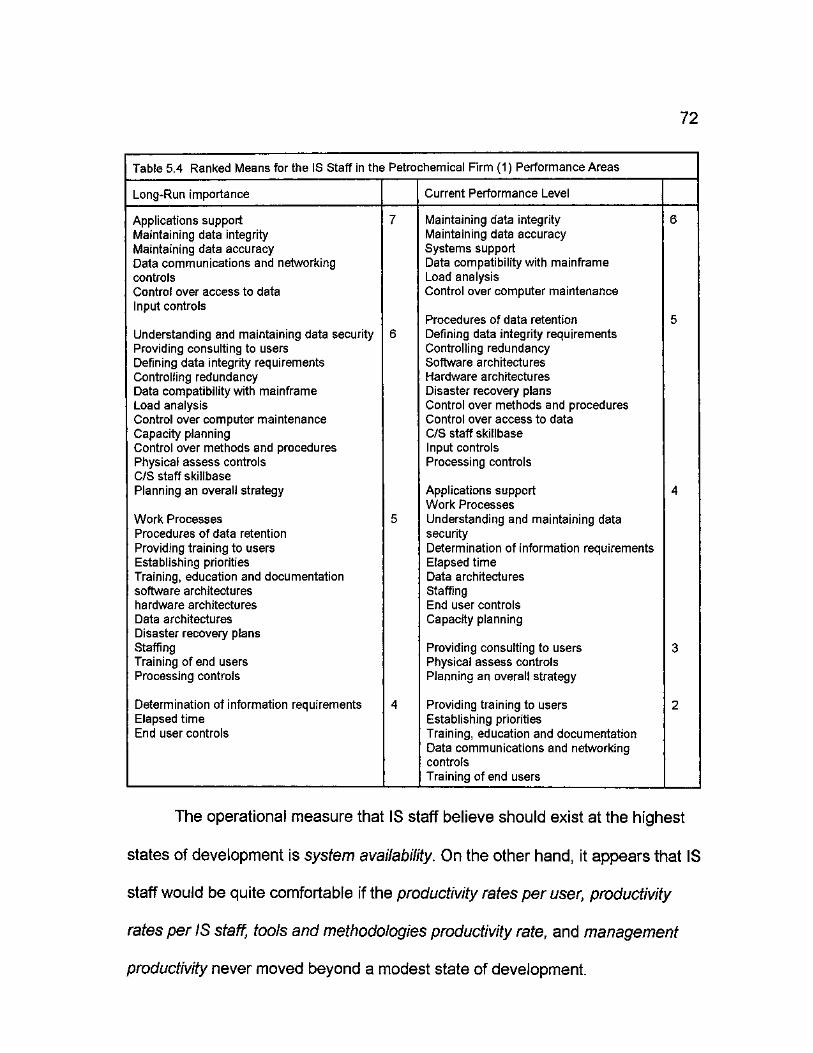
72
Table 5.4 Ranked Means for the IS Staff in the Petrochemical Firm (1) Performance Areas
Long-Run importance Current Performance Level
Applications support 7 Maintaining data integrity 6 Maintaining data integrity Maintaining data accuracy Maintaining data accuracy Systems support Data communications and networking Data compatibility with mainframe controls Load analysis Control over access to data Control over computer maintenance Input controls
Procedures of data retention 5 Understanding and maintaining data security 6 Defining data integrity requirements Providing consulting to users Controlling redundancy Defining data integrity requirements Software architectures Controlling redundancy Hardware architectures Data compatibility with mainframe Disaster recovery plans Load analysis Control over methods and procedures Control over computer maintenance Control over access to data Capacity planning C/S staff skillbase Control over methods and procedures Input controls Physical assess controls Processing controls C/S staff skillbase Planning an overall strategy Applications support 4
Work Processes Work Processes 5 Understanding and maintaining data Procedures of data retention security Providing training to users Determination of information requirements Establishing priorities Elapsed time Training, education and documentation Data architectures software architectures Staffing hardware architectures End user controls Data architectures Capacity planning Disaster recovery plans Staffing Providing consulting to users 3 Training of end users Physical assess controls Processing controls Planning an overall strategy
Determination of information requirements 4 Providing training to users 2 Elapsed time Establishing priorities End user controls Training, education and documentation
Data communications and networking controls Training of end users
The operational measure that IS staff believe should exist at the highest
states of development is system availability. On the other hand, it appears that IS
staff would be quite comfortable if the productivity rates per user, productivity
rates per IS staff, tools and methodologies productivity rate, and management
productivity never moved beyond a modest state of development.

73
Table 5.5 Ranked Means for the IS Staff in the Petrochemical Firm (1) Operational Measures
Long-Run importance Current Performance Level
System availability 7 Data security 6
Utilization 6 Utilization 5 Downtime Downtime Functions availability on system Estimated average costs per activity Estimated average costs per activity Disaster recovery time Information technology-per-employee Physical security Business value-added System response time Disaster recovery time Physical security Functions availability on system 4 Data security Information technology-per-employee System response time Job and report turnaround and delivery Job and report turnaround and delivery time time System availability Percent of employees with terminals, PCs Productivity rates per user Employees-per workstation Productivity rates per software application
5 Tools and methodologies production rate Productivity rates per user Management productivity Productivity rates per software application System Cost Tools and methodologies production rate 3 Management productivity Percent of employees with terminals, PCs System Cost Employees-per workstation
Business value-added
Table 5.6 shows that C/SS performance financial measures; revenue-per-
employee, information technology-to-revenue ratio, retum-on-equity, earnings-
per-share, management cost, operations costs, labor cost, cost of supplies, and
data entry costs are perceived as the factors currently at the highest state of
development. Information technology expense-per-employee is perceived to be
at much lower current states of development.
The financial measure that IS staff believe should exist at the highest
states of development include revenue-per-employee, costs-to revenue,
profitability during the past five years, percent of total budget spent on training,
return-on assets, return-on equity, profitability, and personal productivity. On the

74
other hand, it appears that IS staff would be quite comfortable if the expense-
per-employee measure never moved beyond a modest state of development.
Table 5.6 Ranked Means for the IS Staff in the Petrochemical Firm (1) Financial Measures
Long-Run importance Score Current Performance Level Score
Costs-to-revenue 7 Information technology-to-revenue ratio 6 Profitability during the past five years Return-on-equity Percent of total budget spent on training Earnings-per-share Return-on-assets Management cost Return-on-investment Operations costs Return-on-equity Management productivity Profitability Labor cost Personal productivity Cost of Supplies
Data entry cost Revenue-per employee 6
Data entry cost
Information technology-to-revenue ratio Revenue-per-employee 5 Profit-per-employee Expense-per-employee Information technology expense-per-emp. Profit-per-employee Information technology spending Costs-to-revenue Return-on-sales Profitability during the past five years Earnings-per-share Return-on-assets Management cost Return-on-investments Operations costs Return-on-sales Management productivity Information technology spending Net value-added Profitability Labor cost Personal productivity Cost of supplies Net value-added (Outputs) Data entry costs
Net value-added (Outputs)
Expense-per-employee Percent of total budget spent on training 4
Expense-per-employee 5 Runaways
Information technology expense-per emp
Runaways Runaways
Information technology expense-per emp
3
Table 5.7 shows that C/SS performance defect measure; defect levels or
reported is perceived as the measure currently at the highest state of
development. Defect severity and scope and system disruptions are perceived to
be at much lower current state of development.
The defect measure that IS staff believe should exist at the highest states
of development include overall defect total, Defect severity and scope, defect
removal efficiency and system disruptions. On the other hand, it appears that IS

75
staff would be quite comfortable if the Defect origins measure never moved
beyond a modest state of development. Other factors perceived by IS staff to
require only moderate development include the number of operating system
restarts.
Table 5.7 Ranked Means for the IS Staff in the Petrochemical Firm (1) Defect Measures
Long-Run importance Score Current Performance Level Score
Overall defect total 7 Defect levels or reported 6 Defect severity and scope Defect removal efficiency Overall defect total 5 System disruptions Defect origins
Defect removal efficiency Defect levels or reported 6 Number of operating system restarts
Number of operating system restarts 5 Defect severity and scope 4 system disruptions
Defect origins 4
Table 5.8 shows that C/SS performance staff experience measures;
analysis and design and participation in client/server projects are perceived as
the measures currently at the highest state of development. Testing techniques
reviews and inspections is perceived to be at much lower current state of
development.
The staff experience measures that IS staff believe should exist at the
highest states of development for long term success include supports tools,
training or education, testing techniques reviews and inspections, automation in
specific job area, participation in client/server projects, staff turnover,
staff/application ratio, and staff/user ratio. On the other hand, it appears that IS
staff would be quite comfortable if the staff years measure never moved beyond
a modest state of development.

76
Table 5.8 Ranked Means for the IS Staff in the Petrochemical Firm (1) Staff Experience Measures
Long-Run Importance Score Current Performance Level Score
Support tools 7 Analysis and design 6 Training or education Participation in client/server projects Testing techniques reviews and inspections Staff years 5 Automation in specific job area Applications areas Participation in client/server projects Programming languages Staff turnover Support tools Staff/application ratio Computer hardware development Staff/user ratio Training or education
Software in general Applications areas 6 Automation in specific job area Programming languages Staff turnover Computer hardware development Staff/application ratio Analysis and design Staff/user ratio Software in general
Testing techniques reviews and inspections 4 Staff years 5
Steps 1 and 2: End-Users
The data reported in Table 5.9 reveal that the views of the end-users
regarding the current states of development of the C/SS are quite similar to
those of IS staff and management. The performance perceived to be at the
highest current states of development are system availability, customization
ease, and training and tutorial materials. These rankings positively reflect the
attention given by IS staff to the development of uniform standards and
applications.
The factors perceived to be at lower current states of development are
system reliability and failure intervals, system speed or performance, system
defect levels and system memory utilization. A picture emerges of a firm that
has devoted considerable efforts to fabricating overall standards and policies for

77
directing CIS related activities, but a firm that has not communicated or
addressed system defects and fatal errors.
Table 5.9 Ranked Means for the End-Users in the Petrochemical Firm (1)
Long-range Current Performance Level
Usage of the system Count of defect Transaction response time Accuracy of production Service calls Downtime Response time User-friendliness Support
Learning to use system initially Installing system initially Customizing system Accessing system Training and tutorial material quality
System use for normal tasks System use for unusual and infrequent task System compatibility with other products Quality of IS staff support
7
5.5
System handling of user errors On-screen help Output quality Functionality of system System value Vendor support
4
Status of system versus other systems System quality and defect levels System memory utilization
2.5
System speed or performance System reliability and failure intervals
1
Step 3
The first columns of Tables 5.1.1, 5.5 and 5.9 rank-order the system
performance and system measures in terms of their perceived importance by IS
staff, management, and users. The top measures in the users' table (5.9)
indicate strong consensus among IS staff, management and users that C/S
management attention should be directed at system defects, system usage and
user training. Respondents agreed that it is critically important for the firm to

78
develop effective monitoring and reporting processes that address defects in the
C/S applications as well as in follow-up.
Step 4
Table 5.10 analyzes ranked CSF counts and gap scores for management.
Management identified C/S vision [22], strategic planning [6] and data
architecture [9] as competencies that are both very important and require
substantial improvement. Thus, these three competencies should be given
priority in any initiatives undertaken to enhance this firm's C/S management
competencies.
Further analysis of Table 5.10 also indicates those competencies for
which inconsistencies or ambiguities might exist in the minds of management.
Management responded that considerable improvement is needed with object
definitions [24] and C/S measurement systems [26], but that neither of these two
competencies is critical to the firm's success. Do IS staff believe that their firm's
senior executives would fail to recognize the value of developing consistent
object definitions across the firm and would fail to develop more effective C/S
measurement systems? Do users believe they hold inadequate conceptions of
how C/S might enhance organizational activities, and at the same time do they
fail to appreciate the potential benefits of enriched conceptualizations? Are
users unhappy with current C/S sourcing policies or with the lack of adequate
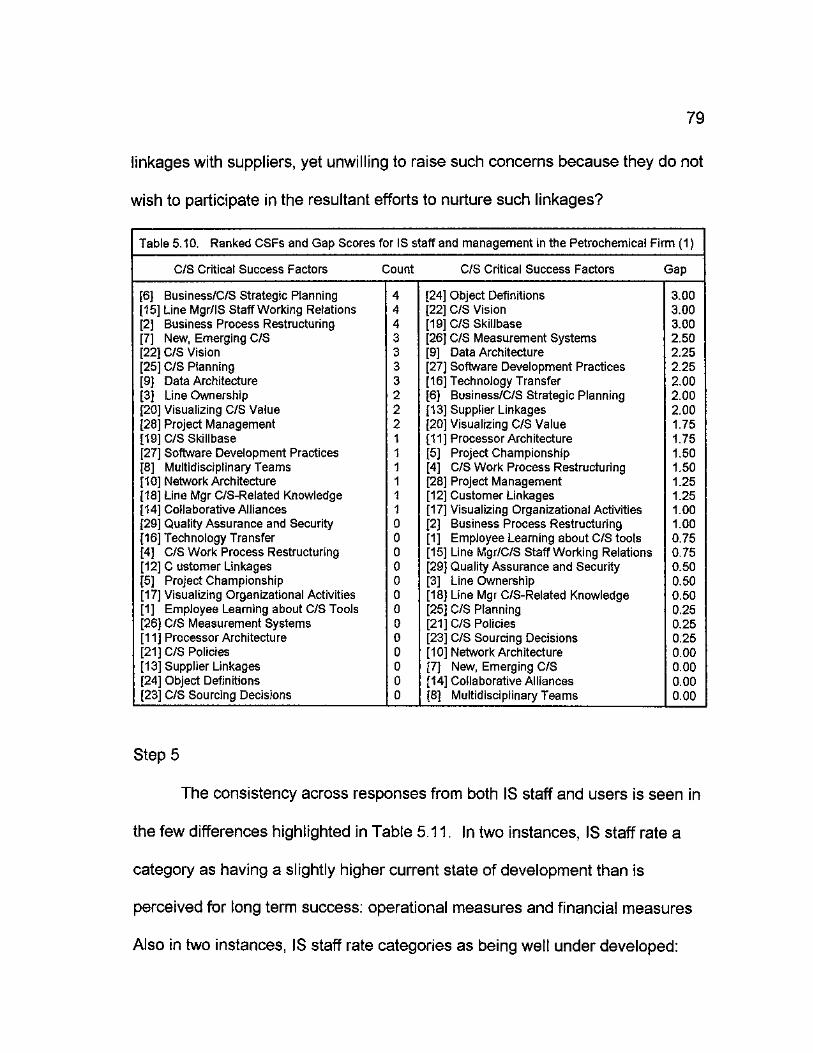
79
linkages with suppliers, yet unwilling to raise such concerns because they do not
wish to participate in the resultant efforts to nurture such linkages?
Table 5.10. Ranked CSFs and Gap Scores for IS staff and management in the Petrochemical Firm (1)
C/S Critical Success Factors Count C/S Critical Success Factors 1 Gap
[6] Business/C/S Strategic Planning 4 [24] Object Definitions 3.00 [15] Line Mgr/IS Staff Working Relations 4 [22] C/S Vision 3.00 [2] Business Process Restructuring 4 [19] C/S Skillbase 3.00 [7] New, Emerging C/S 3 [26] C/S Measurement Systems 2.50 [22] C/S Vision 3 [9] Data Architecture 2.25 [25] C/S Planning 3 [27] Software Development Practices 2.25 [9] Data Architecture 3 [16] Technology Transfer 2.00 [3] Line Ownership 2 [6] Business/C/S Strategic Planning 2.00 [20] Visualizing C/S Value 2 [13] Supplier Linkages 2.00 [28] Project Management 2 [20] Visualizing C/S Value 1.75 [19] C/S Skillbase 1 [11] Processor Architecture 1.75 [27] Software Development Practices 1 [5] Project Championship 1.50 [8] Multidisciplinary Teams 1 [4] C/S Work Process Restructuring 1.50 [10] Network Architecture 1 [28] Project Management 1.25 [18] Line Mgr C/S-Related Knowledge 1 [12] Customer Linkages 1.25 [14] Collaborative Alliances 1 [17] Visualizing Organizational Activities 1.00 [29] Quality Assurance and Security 0 [2] Business Process Restructuring 1.00 [16] Technology Transfer 0 [1] Employee Learning about C/S tools 0.75 [4] C/S Work Process Restructuring 0 [15] Line Mgr/C/S Staff Working Relations 0.75 [12] C ustomer Linkages 0 [29] Quality Assurance and Security 0.50 [5] Project Championship 0 [3] Line Ownership 0.50 [17] Visualizing Organizational Activities 0 [18] Line Mgr C/S-Related Knowledge 0.50 [1] Employee Learning about C/S Tools 0 [25] C/S Planning 0.25 [26] C/S Measurement Systems 0 [21] C/S Policies 0.25 [11] Processor Architecture 0 [23] C/S Sourcing Decisions 0.25 [21] C/S Policies 0 [10] Network Architecture 0.00 [13] Supplier Linkages 0 [7] New, Emerging C/S 0.00 [24] Object Definitions 0 [14] Collaborative Alliances 0.00 [23] C/S Sourcing Decisions 0 [8] Multidisciplinary Teams 0.00
Step 5
The consistency across responses from both IS staff and users is seen in
the few differences highlighted in Table 5.11. In two instances, IS staff rate a
category as having a slightly higher current state of development than is
perceived for long term success: operational measures and financial measures
Also in two instances, IS staff rate categories as being well under developed:

80
performance areas and staff experience. This ranking may suggest staff
experience or inexperience is leading directly to lower performance in other
areas.
TABLE 5.11 Summary Analysis for the Petrochemical Firm (1)
IS Staff
Category Mean Current Mean Desired Difference
Performance Areas 4.31 5.72 -1.41 Operational Measures 5.33 5.17 0.16 Staff experience 4.50 5.67 -1.17 Financial Measures 5.48 5.30 0.18 Defect Measures 5.71 5.81 -0.10
The Petrochemical Firm (System 2)
Steps 1 and 2: IS Staff and Management
Table 5.12 shows that C/SS performance areas; applications support,
maintaining data integrity, maintaining data accuracy, systems support, data
compatibility with mainframe, control over computer maintenance, procedures of
data retention, controlling redundancy, software architectures, hardware
architectures, control over methods and procedures, control over access to data,
C/S staff skillbase, work processes, and physical assess controls are perceived
as the factors currently at the highest states of development.
Providing training to users, determination of information requirements,
training, education and documentation, and training of end users are perceived
to be at the lowest current states of development. The IS staff believe that most
performance areas should exist at the highest states of development with only

81
data compatibility with mainframe, controlling redundancy and elapsed time
never moving beyond a modest state of development.
Table 5.12 Ranked Means for the IS Staff in the Petrochemical Firm (2) Performance Areas
Long-Run importance Score Current Performance Level Score
Applications support 7 Applications support 6 Work Processes Maintaining data integrity Procedures of data retention Maintaining data accuracy Maintaining data integrity Systems support Maintaining data accuracy Data compatibility with mainframe Systems support Control over computer maintenance Understanding and maintaining data Procedures of data retention security Controlling redundancy Providing training to users Software architectures Defining data integrity requirements Hardware architectures Establishing priorities Control over methods and procedures Determination of information requirements Control over access to data Training of end users C/S staff skillbase Training, education and documentation Work Processes Software architectures Physical assess controls Hardware architectures
Physical assess controls
Data architectures End user controls 5 Load analysis Processing controls Capacity planning Input controls Data com. and networking controls Staffing Control over access to data Planning an overall strategy Input controls Data communications and networking Physical assess controls controls C/S staff skillbase Understanding and maint. data security Planning an overall strategy Disaster recovery plans Processing controls Providing consulting to users End user controls Defining data integrity requirements Disaster recovery plans Establishing priorities Staffing Load analysis C/S project management effectiveness Capacity planning Control over changes Elapsed time Adequacy of C/S quality assurance C/S project management effectiveness Effectiveness of C/S planning Control over changes
Adequacy of C/S quality assurance Control over methods and procedures 6
Adequacy of C/S quality assurance
Providing consulting to users Providing training to users 4 Control over computer maintenance Determination of information
requirements Data compatibility with mainframe 5 Training, education and documentation Controlling redundancy Training of end users Elapsed time
Training of end users
Table 5.13 shows that C/SS performance operational measures; system
availability, system response time, data security, utilization and downtime are
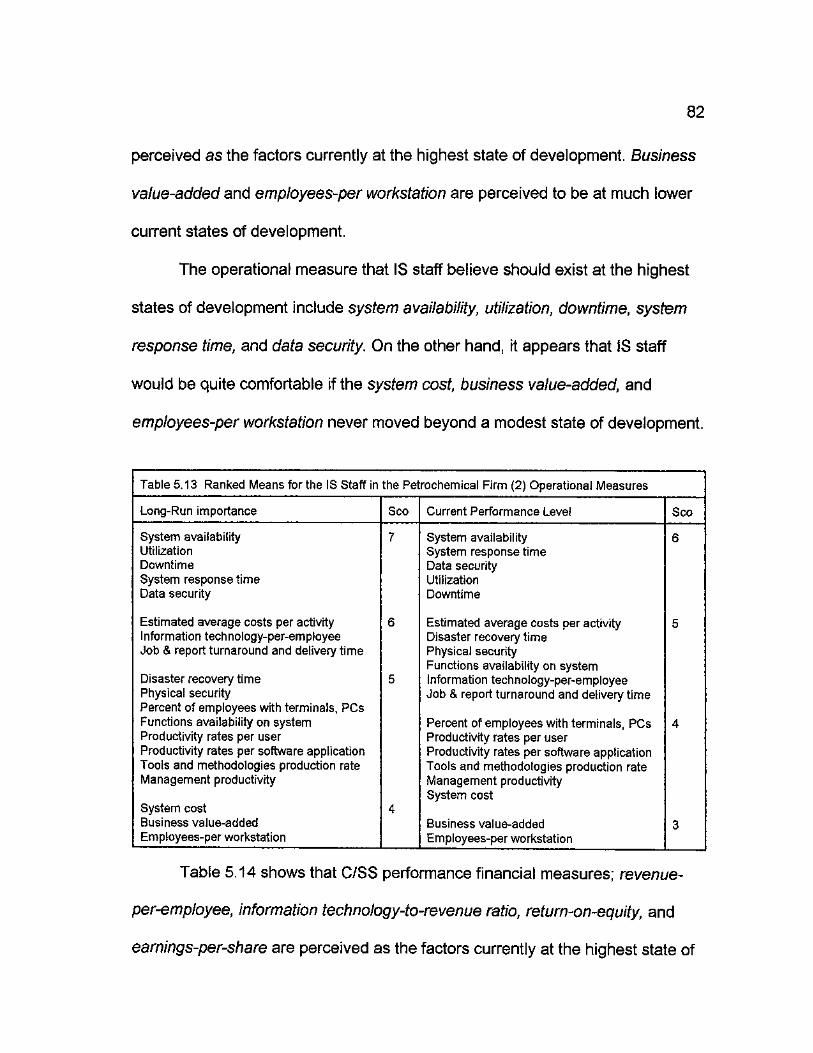
82
perceived as the factors currently at the highest state of development. Business
value-added and employees-per workstation are perceived to be at much lower
current states of development.
The operational measure that IS staff believe should exist at the highest
states of development include system availability, utilization, downtime, system
response time, and data security. On the other hand, it appears that IS staff
would be quite comfortable if the system cost, business value-added, and
employees-per workstation never moved beyond a modest state of development.
Table 5.13 Ranked Means for the IS Staff in the Petrochemical Firm (2) Operational Measures
Long-Run importance Sco Current Performance Level Sco
System availability 7 System availability 6 Utilization System response time Downtime Data security System response time Utilization Data security Downtime
Estimated average costs per activity 6 Estimated average costs per activity 5 Information technology-per-employee Disaster recovery time Job & report turnaround and delivery time Physical security
Functions availability on system Disaster recovery time 5 Information technology-per-employee Physical security Job & report turnaround and delivery time Percent of employees with terminals, PCs
Job & report turnaround and delivery time
Functions availability on system Percent of employees with terminals, PCs 4 Productivity rates per user Productivity rates per user Productivity rates per software application Productivity rates per software application Tools and methodologies production rate Tools and methodologies production rate Management productivity Management productivity
System cost System cost 4 Business value-added Business value-added 3 Employees-per workstation Employees-per workstation
Table 5.14 shows that C/SS performance financial measures; revenue-
per-employee, information technology-to-revenue ratio, return-on-equity, and
earnings-per-share are perceived as the factors currently at the highest state of

83
development. Information technology expense-per employee and information
technology spending are perceived to be at much lower current states of
development.
The financial measure that IS staff believe should exist at the highest
states of development include; revenue-per employee, costs-to-revenue,
profitability during the past five years, percent of total budget spent on training,
return-on-assets, return-on-investment, earnings-per-share, return-on-equity,
profitability, and personal productivity. On the other hand, it appears that IS staff
would be quite comfortable if the expense-per-employee, and information
technology spending measures never moved beyond a modest state of
development.
Based on the data, Table 5.15 shows that C/SS performance defect
measures defect levels or reported and overall defect totals are perceived as the
measures currently at the highest state of development. Defect severity and
scope, defect removal efficiency and system disruptions are perceived to be at
much lower current state of development.
The defect measures that IS staff believe should exist at the highest
states of development include overall defect total, defect severity and scope,
defect removal efficiency and system disruptions. On the other hand, it appears
that IS staff would be quite comfortable if the defect origins and number of
operating system restarts measures never moved beyond a modest state of
development.

84
Table 5.14 Ranked Means for the IS Staff in the Petrochemical Firm (2) Financial Measures
Long-Run importance Score Current Performance Level Score
Revenue-per employee 7 Revenue-per-employee 6 Costs-to-revenue Information technology-to-revenue ratio Profitability during the past five years Return-on-equity Percent of total budget spent on training Earnings-per-share Return-on-assets Data entry cost Return-on-investment Operations costs Earnings-per-share Labor cost Return-on-equity Cost of Supplies Profitability Personal productivity Expense-per-employee 5
Profit-per-employee Data entry costs 6 Costs-to-revenue Labor cost Profitability during the past five years Information technology-to-revenue ratio Return-on-assets Profit-per-employee Return-on-investments Information technology expense-per- Return-on-sales employee Profitability Return-on-sales Personal productivity Cost of supplies Net value-added (Outputs)
Management cost 5 Management productivity 4 Operations costs Management cost Management productivity Percent of total budget spent on training Net value-added
Percent of total budget spent on training
Information technology expense-per 3 Expense-per-employee 4 emp Information technology spending Information technology spending Runaways Runaways
Table 5.15 Ranked Means for the IS Staff in the Petrochemical Firm (2) Defect Measures
Long-Run importance Score Current Performance Level Score
Overall defect total 7 Defect levels or reported 6 Defect severity and scope Overall defect total Defect removal efficiency System disruptions Defect origins 5
Number of operating system restarts Defect levels or reported 6
Number of operating system restarts
Defect severity and scope 4 Number of operating system restarts 5 System disruptions Defect origins Defect removal efficiency
Table 5.16 shows that no current C/SS performance staff experience
measures are perceived as being at a high development. Staff/application ratio,
testing techniques reviews and inspections, analysis and design and participation

85
in client/server projects are perceived to be at the lowest current state of
development.
The staff experience measure that IS staff believe should exist at the
highest states of development for long term success includes automation in
specific job area. On the other hand, it appears that IS staff would be quite
comfortable if the staff years measure never moved beyond a modest state of
development.
Table 5.16 Ranked Means for the IS Staff in the Petrochemical Firm (2) Staff Experience Measures
Long-Run Importance Score Current Performance Level Score
Automation in specific job area 7 Staff years 5 Automation in specific job area
Support tools 6 Staff turnover Training or education Staff/user ratio Staff turnover Staff/user ratio Training or education 4
Applications areas Testing techniques reviews and 5 Programming languages inspections Support tools
Computer hardware development Participation in client/server projects 4 Software in general Staff/application ratio Applications areas Staff/application ratio 3 Programming languages Testing techniques reviews and Computer hardware development inspections Analysis and design Analysis and design Software in general Participation in client/server projects
Staff years 3
Steps 1 and 2: End-Users
The data reported in Table 5.17 reveal that the views of the end-users
regarding the current states of development of the actual C/SS are very different
from those of IS staff and management. The actual performance perceived to be
at the highest current states of development is system access. These rankings
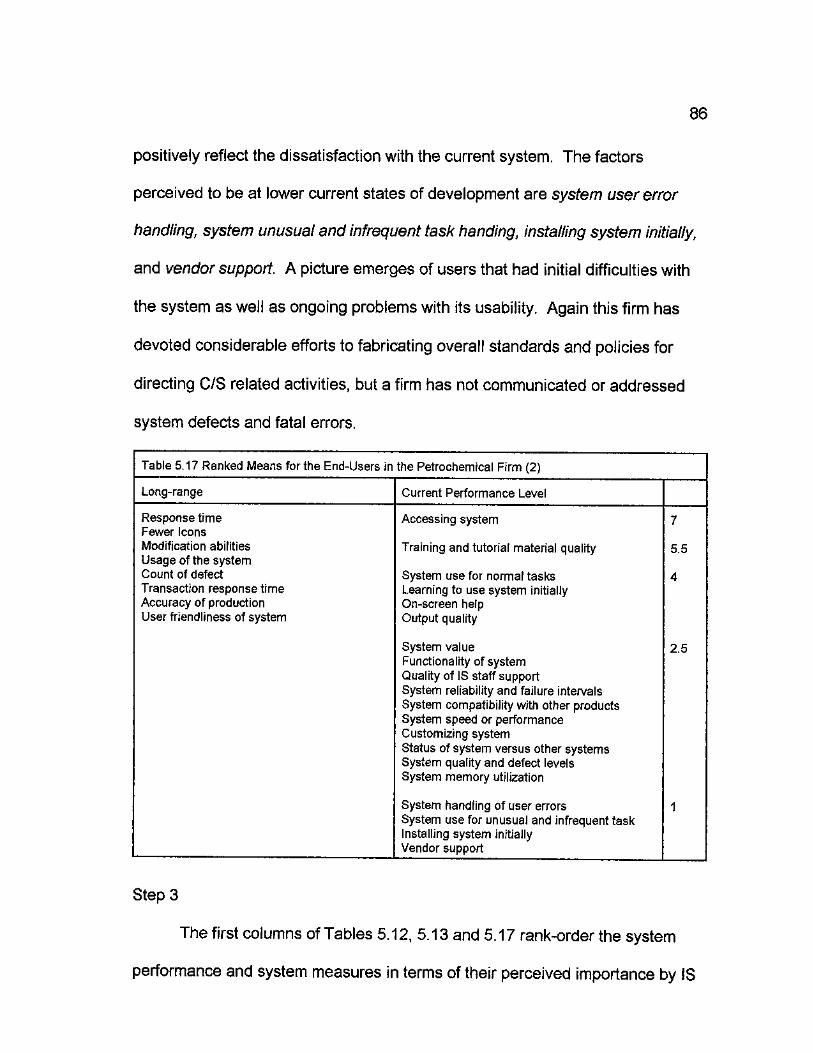
86
positively reflect the dissatisfaction with the current system. The factors
perceived to be at lower current states of development are system user error
handling, system unusual and infrequent task handing, installing system initially,
and vendor support. A picture emerges of users that had initial difficulties with
the system as well as ongoing problems with its usability. Again this firm has
devoted considerable efforts to fabricating overall standards and policies for
directing C/S related activities, but a firm has not communicated or addressed
system defects and fatal errors.
Table 5.17 Ranked Means for the End-Users in the Petrochemical Firm (2)
Long-range Current Performance Level
Response time Accessing system 7 Fewer Icons Modification abilities Training and tutorial material quality 5.5 Usage of the system
Training and tutorial material quality
Count of defect System use for normal tasks 4 Transaction response time Learning to use system initially Accuracy of production On-screen help User friendliness of system Output quality
System value 2.5 Functionality of system Quality of IS staff support System reliability and failure intervals System compatibility with other products System speed or performance Customizing system Status of system versus other systems System quality and defect levels System memory utilization
System handling of user errors 1 System use for unusual and infrequent task Installing system initially Vendor support
Step 3
The first columns of Tables 5.12, 5.13 and 5.17 rank-order the system
performance and system measures in terms of their perceived importance by IS
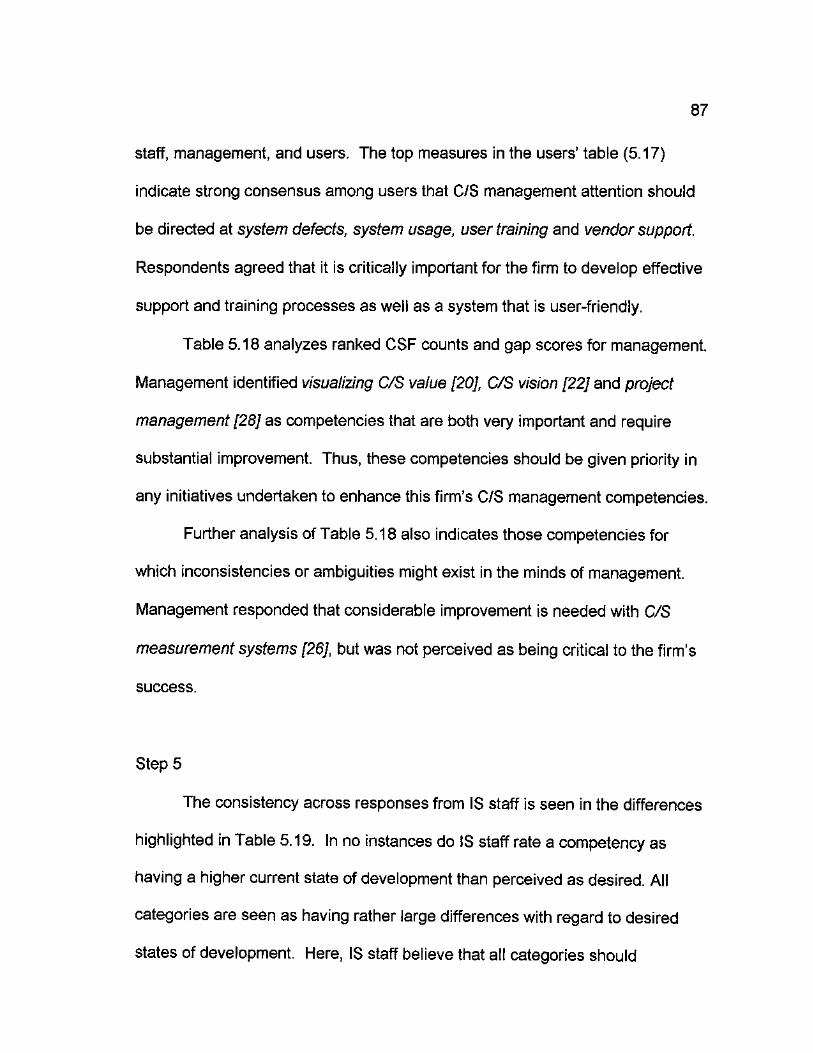
87
staff, management, and users. The top measures in the users' table (5.17)
indicate strong consensus among users that C/S management attention should
be directed at system defects, system usage, user training and vendor support.
Respondents agreed that it is critically important for the firm to develop effective
support and training processes as well as a system that is user-friendly.
Table 5.18 analyzes ranked CSF counts and gap scores for management.
Management identified visualizing C/S value [20], C/S vision [22] and project
management [28] as competencies that are both very important and require
substantial improvement. Thus, these competencies should be given priority in
any initiatives undertaken to enhance this firm's C/S management competencies.
Further analysis of Table 5.18 also indicates those competencies for
which inconsistencies or ambiguities might exist in the minds of management.
Management responded that considerable improvement is needed with C/S
measurement systems [26], but was not perceived as being critical to the firm's
success.
Step 5
The consistency across responses from IS staff is seen in the differences
highlighted in Table 5.19. In no instances do IS staff rate a competency as
having a higher current state of development than perceived as desired. All
categories are seen as having rather large differences with regard to desired
states of development. Here, IS staff believe that all categories should

88
Table 5.18 Ranked CSFs and Gap Scores for IS staff and management in the Petrochemical Firm (2)
C/S Critical Success Factors Count C/S Critical Success Factors Gap
[28] Project Management 3 [26] C/S Measurement Systems 3.00 [19] C/S Skillbase 3 [20] Visualizing C/S Value 2.67 [6] Business/C/S Strategic Planning 3 [24] Object Definitions 2.33 [15] Line Mgr/IS Staff Working Relations 2 [22] C/S Vision 1.67 [2] Business Process Restructuring 2 [28] Project Management 1.67 [7] New, Emerging C/S 2 [15] Line Mgr/C/S Staff Working Relations 1.33 [25] C/S Planning 1 [18] Line Mgr C/S-Related Knowledge 1.00 [9] Data Architecture 1 [9] Data Architecture 1.00 [21] C/S Policies 1 [27] Software Development Practices 1.00 [3] Line Ownership 1 [16] Technology Transfer 0.67 [20] Visualizing C/S Value 1 [6] Business/C/S Strategic Planning 0.67 [4] C/S Work Process Restructuring 1 [5] Project championship 0.67 [22] C/S Vision 1 [4] C/S Work Process Restructuring 0.50 [27] Software Development Practices 1 [12] Customer Linkages 0.50 [8] Multidisciplinary Teams 1 [17] Visualizing Organizational Activities 0.33 [10] Network Architecture 1 [2] Business Process Restructuring 0.33 [18] Line Mgr C/S-Related Knowledge 0 [1 ] Employee Learning about C/S tools 0.33 [14] Collaborative Alliances 0 [29] Quality Assurance and Security 0.33 [29] Quality Assurance and Security 0 [3] Line Ownership 0.25 [16] Technology Transfer 0 [19] C/S Skillbase 0.25 [12] Customer Linkages 0 [11] Processor Architecture 0.00 [5] Project Championship 0 [25] C/S Planning 0.00 [17] Visualizing Organizational Activities 0 [21] C/S Policies 0.00 [1] Employee Learning about C/S Tools 0 [23] C/S Sourcing Decisions 0.00 [26] C/S Measurement Systems 0 [10] Network Architecture 0.00 [11] Processor Architecture 0 [7] New, Emerging C/S 0.00 [13] Supplier Linkages 0 [14] Collaborative Alliances 0.00 [24] Object Definitions 0 [13] Supplier Linkages 0.00 [23] C/S Sourcing Decisions 0 [8] Multidisciplinary Teams 0.00
exist at a higher state of development. This difference might suggest that IS
staff are generally not advanced in conceptualizing the nature of organizational
activities. Such observations suggest the following; (1) that IS staff the skills
and experience necessary to develop rich mental models that reflect the ways
C/S can be applied to support a firm's activities; and (2) that IS staff lack an
adequate understanding of the appropriate levels of skills needed to adequately
meet the firms C/S visions.

89
TABLE 5.19 Summary Analysis for the Petrochemical Firm (2)
IS Staff
Mean Current Mean Desired Difference
Performance Areas 5.38 6.84 -1.46 Operational Measures 5.93 6.94 -1.01 Staff Experience 5.07 6.50 -1.43 Financial Measures 5.30 6.33 -1.03 Defect Measures 5.68 6.51 -0.83
The Transportation Firm(1)
Steps 1 and 2: IS Staff and Management
Table 5.20 shows that C/SS performance areas; staffing, training,
education and documentation, training of end users, and maintaining data
accuracy are perceived as the factors currently at the highest states of
development. Establishing priorities, load analysis, capacity planning, elapsed
time, control over changes, and data compatibility with mainframe are perceived
to be at the lowest current states of development.
The IS staff believe that training of end users, training, education and
documentation, planning an overall strategy, staffing, and understanding, and
maintaining data security should exist at the highest states of development with
only physical assess controls never moving beyond a modest state of
development.
Table 5.21 show that C/SS performance operational measures; data
security, job and report turnaround and delivery time, system response time,
functions availability on system, downtime, and percent of employees with

90
terminals, PCs are perceived as the factors currently at the highest state of
development. Management productivity is perceived to be at much lower current
state of development.
Table 5.20 Ranked Means for the IS Staff in the Transportation Firm (1) Performance Areas
Long-Run Importance Score Current Performance Level Score
Training of end users 7 Staffing 7 Training, education and documentation Training, education and documentation Planning an overall strategy Training of end users Staffing Maintaining data accuracy Understanding and maintaining data security Providing training to users 6
Understanding and maintaining data End user controls 6 security Providing training to users Providing consulting to users Control over methods and procedures Systems support Providing consulting to users Procedures of data retention Applications support Control over methods and procedures Work Processes Data comm. and networking controls Procedures of data retention Defining data integrity requirements Maintaining data integrity C/S staff skillbase Maintaining data accuracy C/S project management effectiveness Systems support Adequacy of C/S quality assurance Disaster recovery plans Defining data integrity requirements Planning an overall strategy 5 Establishing priorities Applications support Determination of information Work Processes requirements Maintaining data integrity C/S staff skillbase Software architectures Physical assess controls 4 Hardware architectures Control over access to data Data architectures End user controls Load analysis Processing controls Capacity planning Input controls
Control over computer maintenance Data communications and networking 5 Controlling redundancy controls Software architectures Control over access to data Hardware architectures Input controls Determination of information Processing controls requirements Control over computer maintenance Disaster recovery plans Control over changes Adequacy of C/S quality assurance Establishing priorities 3 Controlling redundancy Load analysis Effectiveness of C/S planning Capacity planning Data compatibility with mainframe Elapsed time Elapsed time Data compatibility with mainframe C/S project management effectiveness Control over changes
Physical assess controls 4

91
The operational measures that IS staff believe should exist at the highest
states of development include data security, downtime, disaster recovery time,
system availability, and employees-per workstation. On the other hand, it
appears that IS staff would be quite comfortable if tools and methodologies
production rate never moved beyond a modest state of development.
Table 5.21 Ranked Means for the IS Staff in the Transportation Firm (1) Operational Measures
Long-Run importance Score Current Performance Level Score
Data security 7 Data security 7 Downtime Job and report turnaround and delivery Disaster recovery time time System availability System response time Employees-per workstation Functions availability on system
Downtime Percent of employees with terminals, 6 Percent of employees with terminals, PCs PCs Functions availability on system Utilization System availability 6 System cost Physical security
Information technology-per-employee Information technology-per-employee 5 Utilization Physical security Business value-added Productivity rates per user 5 Management productivity Estimated average costs per activity Job and report turnaround and delivery Employees-per workstation time Productivity rates per software
application System response time 4 Productivity rates per user System cost 4 Estimated average costs per activity Tools and methodologies production rate Productivity rates per software Disaster recovery time application Business value-added
Tools and methodologies production rate 3 Management productivity 3
Table 5.22 shows that C/SS performance financial measures costs-to-
revenue, profitability during the past five years, profitability, management
productivity, retum-on-equity, and return-on-investments are perceived as the
factors currently at the highest state of development. Personal productivity and
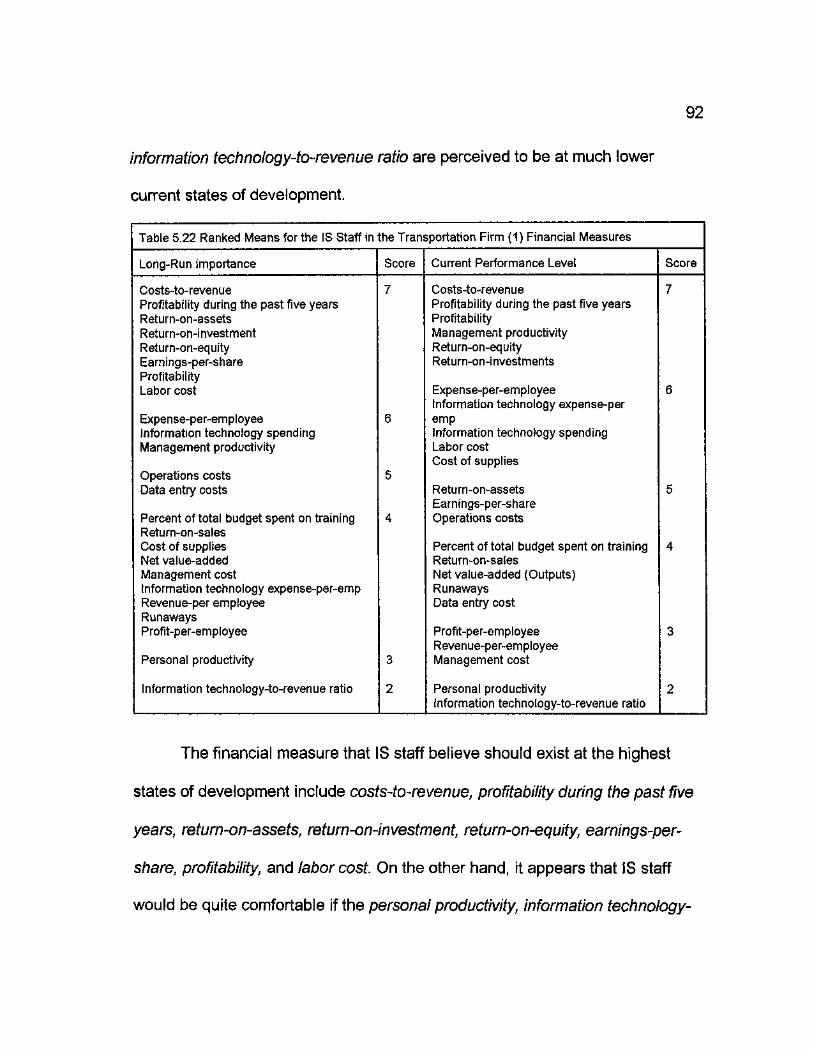
92
information technology-to-revenue ratio are perceived to be at much lower
current states of development.
Table 5.22 Ranked Means for the IS Staff in the Transportation Firm (1) Financial Measures
Long-Run importance Score Current Performance Level Score
Costs-to-revenue 7 Costs-to-revenue 7 Profitability during the past five years Profitability during the past five years Return-on-assets Profitability Return-on-investment Management productivity Return-on-equity Return-on-equity Earnings-per-share Return-on-investments Profitability Labor cost Expense-per-employee 6
Information technology expense-per Expense-per-employee 6 emp Information technology spending Information technology spending Management productivity Labor cost
Cost of supplies Operations costs 5 Data entry costs Return-on-assets 5 Data entry costs
Earnings-per-share Percent of total budget spent on training 4 Operations costs Return-on-sales Cost of supplies Percent of total budget spent on training 4 Net value-added Return-on-sales Management cost Net value-added (Outputs) Information technology expense-per-emp Runaways Revenue-per employee Data entry cost Runaways Profit-per-employee Profit-per-employee 3
Revenue-per-employee Personal productivity 3 Management cost
Information technology-to-revenue ratio 2 Personal productivity 2 Information technology-to-revenue ratio
The financial measure that IS staff believe should exist at the highest
states of development include costs-to-revenue, profitability during the past five
years, return-on-assets, retum-on-investment, return-on-equity, earnings-per-
share, profitability, and labor cost. On the other hand, it appears that IS staff
would be quite comfortable if the personal productivity, information technology-

93
to-revenue ratio, and revenue-per employee measures never moved beyond a
modest state of development.
Table 5.23 shows that C/SS performance defect measures defect levels
or reported, defect severity and scope, system disruptions, number of operating
system restarts, and defect removal efficiency are perceived as the measures
currently at the highest state of development. Defect origins is perceived to be at
a somewhat lower current state of development.
The defect measure that IS staff believe should exist at the highest states
of development include defect origins, defect ohgins and defect severity and
scope. On the other hand, it appears that IS staff would be quite comfortable if
the defect origins and number of operating system restarts measures never
moved beyond a modest state of development.
Table 5.23 Ranked Means for the IS Staff in the Transportation Firm (1) Defect Measures
Long-Run importance Score Current Performance Level Score
System disruptions 7 Defect levels or reported 6 Defect severity and scope
Defect origins 6 System disruptions Defect severity and scope Number of operating system restarts
Defect removal efficiency Overall defect total 5
Defect removal efficiency
Defect levels or reported Overall defect total 5 Defect removal efficiency
Defect origins 4 Number of operating system restarts 4
Table 5.24 shows that staff turnover, training or education,
staff/application ratio, staff years, staff/user ratio, and automation in specific job
area are perceived as the staff experience measures currently at the highest

94
state of development. Computer hardware development is perceived to be at the
lowest current state of development.
The staff experience measures that IS staff believe should exist at the
highest states of development for long term success include staff turnover,
staff/user ratio, applications areas, support tools, training or education, and
software in general. On the other hand, it appears that IS staff would be quite
comfortable if the computer hardware development measure never moved
beyond a modest state of development.
Table 5.24 Ranked Means for the IS Staff in the Transportation Firm (1) Staff Experience Measures
Long-Run Importance Score Current Performance Level Score
Staff turnover 7 Staff turnover 6 Staff/user ratio Training or education Applications areas Staff/application ratio Support tools Staff years Training or education Staff/user ratio Software in general Automation in specific job area
Testing techniques reviews and 6 Support tools 5 inspections Applications areas Automation in specific job area Software in general Participation in client/server projects
Software in general
Staff/application ratio Testing techniques reviews and 4 Staff years inspections
Analysis and design Analysis and design 5 Participation in client/server projects Programming languages Programming languages
Computer hardware development 4 Computer hardware development 3
Steps 1 and 2: End-Users
Table 5.25 (page 97) reveals that the views of the end-users regarding
the current states of development of the actual C/SS are very different from

95
those of IS staff and management. The actual performance perceived to be at
the highest current states of development is system access.
The factors perceived to be at moderate current states of development
are installing system initially, system memory utilization, system value, training
and tutorial material quality, output quality, functionality of system, quality of IS
staff support, system handling of user errors, status of system versus other
systems, system reliability and failure intervals, and customizing system. A
picture emerges of users that are generally satisfied with the current system
performance but perceive room for improvement. This firm has devoted
considerable efforts to fabricating overall standards and policies for directing
C/S related activities, which include response time, system availability, and
defect calls.
Step 3
The first columns of Tables 5.20, 5.21 and 5.25 rank-order the system
performance and system measures in terms of their perceived importance by IS
staff, management, and users. The top measures in the users' table (5.10)
indicate strong consensus among users that C/S management attention should
be directed at system access, system use for normal tasks, system speed or
performance, and quality of IS staff support. Respondents agreed that it is
critically important for the firm to develop effective support and training
processes for both users and IS staff in order to maintain a high output.

96
Table 5.25 Ranked Means for the End-Users in the Transportation Firm (1)
Long-range Current Performance Level
Response time Accessing system 5 Fewer Icons Modification abilities Learning to use system initially 4 System usability System use for normal tasks Number of defects System use for unusual and infrequent task Accuracy of production System speed or performance User friendliness of system System compatibility with other products Defect calls System quality and defect levels
On-screen help Vendor support
Installing system initially System memory utilization 3 System value Training and tutorial material quality Output quality Functionality of system Quality of IS staff support System handling of user errors Status of system versus other systems System reliability and failure intervals Customizing system
Step 4
Table 5.26 analyzes ranked CSF counts and gap scores for management.
Management identified project championship [5] and new, emerging C/S [7] as
competencies that are both very important and require substantial improvement.
Management also identified C/S skillbase [19] as very important and requiring
moderate improvement. Thus, these competencies should be given priority in
any initiatives undertaken to enhance this firm's C/S management competencies.
Further analysis of Table 5.11 also indicates those competencies for
which inconsistencies or ambiguities might exist in the minds of management.
Management responded that considerable improvement is needed with project

97
management [28], supplier linkages [13], and C/S measurement system [26], but
both were perceived as not critical to the firm's success.
Table 5.26 Ranked CSFs and Gap Scores for IS Staff and Management in the Transportation Firm (1)
C/S Critical Success Factors Count C/S Critical Success Factors Gap [9] Data Architecture [4] C/S Work Process Restructuring [5] Project Championship [19] C/S Skillbase [20] Visualizing C/S Value [25] C/S Planning [22] C/S Vision [21] C/S Policies [15] Line Mgr/IS Staff Working Relations [10] Network Architecture [29] Quality Assurance and Security [6] Business/C/S Strategic Planning [2] Business Process Restructuring [7] New, Emerging C/S [3] Line Ownership [1] Employee Learning about C/S Tools [27] Software Development Practices [8] Multidisciplinary Teams [28] Project Management [18] Line Mgr C/S-Related Knowledge [14] Collaborative Alliances [16] Technology Transfer [12] Customer Linkages [17] Visualizing Organizational Activities [26] C/S Measurement Systems [11] Processor Architecture [13] Supplier Linkages 24] Object Definitions .23] C/S Sourcing Decisions
[28] Project Management [13] Supplier Linkages [26] C/S Measurement Systems [5] Project Championship [7] New, Emerging C/S [8] Multidisciplinary Teams [14] Collaborative Alliances [19] C/S Skillbase [16] Technology Transfer [29] Quality Assurance and Security [2] Business Process Restructuring [15] Line Mgr/C/S Staff Working Relations [10] Network Architecture [6] Business/C/S Strategic Planning [20] Visualizing C/S Value [4] C/S Work Process Restructuring [12] Customer Linkages [17] Visualizing Organizational Activities [1 ] Employee Learning about C/S tools [3] Line Ownership [25] C/S Planning [27] Software Development Practices [21] C/S Policies [23] C/S Sourcing Decisions [9] Data Architecture [11] Processor Architecture [24] Object Definitions [22] C/S Vision [18] Line Mgr C/S-Related Knowledge
3.00 2.50 2.25 2.25 2.00 1.25 1.25 1.00 0.50 0.50 0.50 0.50 0.50 0.50 0.25 0.25 0.25 0.25 0.25 0.25 0.00 0.00 0.00 0.00 0.00 0.00 0.00 0.00 0.00
Step 5
The consistency across responses from IS staff is seen in the differences
highlighted in Table 5.27. IS staff rate all areas as having a similar current state
of development as perceived as desired. No categories are seen as having
rather large differences with regard to desired states of development over
current performance. Here, IS staff believe that all categories are closely
meeting or exceeding what is perceived as its optimum level of performance.

98
These similarities might suggest that IS staff are generally pleased with the
current states of performance.
TABLE 5.27 Summary Analysis for the Transportation Firm (1)
IS Staff
Mean Current Mean Desired Difference
Performance Areas 5.56 5.67 -0.11 Operational Measures 5.33 5.24 -0.09 Staff experience 5.36 5.27 -0.11 Financial Measures 5.16 5.16 0.00 Defect Measures 5.57 5.43 0.14
The Transportation Firm (2)
Steps 1 and 2: IS Staff and Management
Table 5.28 shows that C/SS performance areas; understanding and
maintaining data security, defining data integrity requirements, maintaining data
integrity, and control over access to data are perceived as the factors currently
at the highest states of development.
Control over changes and adequacy of C/S quality assurance are
perceived to be at the lowest current states of development. The IS staff believe
that training of end users, training, education and documentation, planning an
overall strategy, staffing, end user controls, disaster recovery plans,
effectiveness of C/S planning, providing training to users, control over methods
and procedures, and providing consulting to users should exist at the highest
states of development with only data compatibility with mainframe, elapsed time,

99
physical assess controls, and C/S project management effectiveness never
moving beyond a low to modest state of development.
Table 5.28 Ranked Means for the IS Staff in the Transportation Firm (2) Performance Areas
Long-Run Importance Score Current Performance Level Score
Training of end users 7 Understanding and maintaining data 7 Training, education and documentation security Planning an overall strategy Defining data integrity requirements Staffing Maintaining data integrity End user controls Control over access to data Disaster recovery plans Effectiveness of C/S planning Applications support 6 Providing training to users Maintaining data accuracy Control over methods and procedures Systems support Providing consulting to users Control over computer maintenance
Procedures of data retention Applications support 6 Controlling redundancy Work Processes Software architectures Procedures of data retention Hardware architectures Maintaining data integrity Control over methods and procedures Maintaining data accuracy Data communications and networking Systems support controls Understanding and maintaining data C/S staff skillbase security Work Processes
Providing consulting to users Defining data integrity requirements 5 C/S project management effectiveness Establishing priorities Planning an overall strategy Determination of information requirements
Planning an overall strategy
C/S staff skillbase Providing training to users 5 Software architectures Training, education and Hardware architectures documentation Data architectures Training of end users Load analysis
Training of end users 4
Capacity planning End user controls Data communications and networking Processing controls controls Input controls Control over access to data Staffing Input controls Determination of information Processing controls requirements Control over computer maintenance 3 Control over changes Disaster recovery plans Adequacy of C/S quality assurance Physical assess controls Controlling redundancy Establishing priorities
Data compatibility with mainframe Load analysis
Data compatibility with mainframe 4 Capacity planning Elapsed time Data architectures
Physical assess controls Elapsed time
Physical assess controls 3 Data compatibility with mainframe Control over changes
C/S project management effectiveness 2 Adequacy of C/S quality assurance

100
Table 5.29 show that C/SS performance operational measures; data
security, utilization, employees-per workstation, system response time, percent of
employees with terminals, PCs, system availability and system cost are
perceived as the factors currently at the highest state of development.
Estimated average costs per activity and downtime are perceived to be at much
lower current states of development.
Table 5.29 Ranked Means for the IS Staff in the Transportation Firm (2) Operational Measures
Long-Run importance Score Current Performance Level Score
System availability 7 Data security 7 Downtime Business value-added Utilization 6 System response time Employees-per workstation Data security System response time Disaster recovery time Percent of employees with terminals,
PCs Percent of employees with terminals, 6 System availability PCs System cost Functions availability on system Utilization Functions availability on system 5
Disaster recovery time Tools and methodologies production 5 Productivity rates per user rate Job and report turnaround and delivery Productivity rates per user time Employees-per workstation Information technology-per-employee Productivity rates per software 4 Job and report turnaround and delivery application time Tools and methodologies production
Estimated average costs per activity 4 1 cue
Information technology-per-employee Productivity rates per software Management productivity application Physical security
Business value-added Physical security 3 3
Estimated average costs per activity Management productivity 2 Downtime System cost
The operational measures that IS staff believe should exist at the highest
states of development include system availability, downtime, business value-
added, system response time, data security, and disaster recovery time. On the

101
other hand, it appears that IS staff would be quite comfortable if physical
security, management productivity, and system cost never moved beyond a
modest state of development.
Table 5.30 shows that C/SS performance financial measures; percent of
total budget spent on training and labor cost are perceived as the factors
currently at the highest state of development. Management productivity,
operations costs, earnings-per-share, profitability, information technology
spending, profit-per-employee, information technology-to-revenue ratio, revenue-
per-employee, and information technology expense-per employee are perceived
to be at much lower current states of development.
The financial measure that IS staff believe should exist at the highest
states of development include; revenue-per employee, costs-to-revenue,
profitability during the past five years, percent of total budget spent on training,
return-on-assets, return-on-investment, earnings-per-share, return-on-equity,
profitability, and personal productivity. On the other hand, it appears that IS staff
would be quite comfortable if the expense-per-employee, and information
technology spending measures never moved beyond a modest state of
development.
Table 5.31 shows that C/SS performance defect measures defect levels
or reported and overall defect totals are perceived as the measures currently at
the highest state of development. Defect severity and scope, defect removal

102
efficiency and system disruptions are perceived to be at much lower current state
of development.
Table 5.30 Ranked Means for the IS Staff in the Transportation Firm (2) Financial Measures
Long-Run importance Score Current Performance Level Score
Profitability 7 Percent of total budget spent on training 7 Operations costs Labor cost Return-on-sales Information technology-to-revenue ratio Profitability during the past five years
Return-on-equity 6
Expense-per-employee 6 Expense-per-employee Costs-to-revenue Return-on-investments Percent of total budget spent on training Return-on-sales
Costs-to-revenue Return-on-assets 4 Return-on-investment Data entry cost 5 Earnings-per-share Cost of Supplies Return-on-equity Runaways Personal productivity Management cost Information technology spending Cost of supplies Return-on-assets 4 Management productivity Personal productivity Net value-added Net value-added (Outputs) Management cost
Net value-added (Outputs)
Information technology expense-per-emp Management productivity 3 Revenue-per employee Operations costs
Earnings-per-share Profit-per-employee 3 Profitability Data entry costs Information technology spending Labor cost Profit-per-employee Runaways Information technology-to-revenue ratio
Revenue-per-employee Profitability during the past five years 2 Information tech. expense-per emp
The defect measures that IS staff believe should exist at the highest
states of development include overall defect total, defect severity and scope,
defect removal efficiency and system disruptions. On the other hand, it appears
that IS staff would be quite comfortable if the defect origins and number of
operating system restarts measures never moved beyond a modest state of
development.

103
Table 5.31 Ranked Means for the IS Staff in the Transportation Firm (2) Defect Measures
Long-Run importance Score Current Performance Level Score
Defect severity and scope 6 Defect origins 6 Defect removal efficiency
Defect removal efficiency 5 System disruptions Defect origins Number of operating system restarts Overall defect total 5
Defect severity and scope Defect levels or reported 4 Overall defect total Number of operating system restarts 4
System disruptions 3 Defect levels or reported 3
Table 5.32 shows that staff turnover and training or education are
perceived as the staff experience measures currently at the highest state of
development. Staff/application ratio, testing techniques reviews and inspections,
analysis and design, participation in client/server projects, programming
languages, and computer hardware development are perceived to be at the
lowest current state of development.
The staff experience measure that IS staff believe should exist at the
highest states of development for long term success includes testing techniques
reviews and inspections. On the other hand, it appears that IS staff would be
quite comfortable if the computer hardware development measure never moved
beyond a modest state of development.
Steps 1 and 2: End-Users
The data reported in Table 5.33 reveal that the views of the end-users
regarding the current states of development of the actual C/SS are very different
from those of IS staff and management. The actual performance perceived

104
Table 5.32 Ranked Means for the IS Staff in the Transportation Firm (2) Staff Experience Measures
Long-Run Importance Score Current Performance Level Score
Testing techniques reviews and 7 Staff turnover 6 inspections Training or education
Support tools 6 Staff/user ratio 5 Training or education Automation in specific job area Staff turnover Software in general Staff/user ratio Applications areas Software in general
Support tools 4 Automation in specific job area 5 Staff years Participation in client/server projects Staff/application ratio Staff/application ratio 3 Applications areas Testing techniques reviews and
inspections Analysis and design 4 Analysis and design Staff years Participation in client/server projects Programming languages Programming languages
Computer hardware development 3 Computer hardware development 2
to be at the highest current states of development is system access. These
rankings positively reflect the dissatisfaction with the current system. The
factors perceived to be at lower current states of development are system user
error handling, system unusual and infrequent task handing, installing system
initially, and vendor support. A picture emerges of users that had initial
difficulties with the system as well as ongoing problems with its usability. Again
this firm has devoted considerable efforts to fabricating overall standards and
policies for directing C/S related activities, but has not communicated or
addressed system defects and fatal errors.

105
Table 5.33 Ranked Means for the End-Users in the Transportation Firm (2)
Long-range Current Performance Level
Response time Accessing system 7 Fewer Icons System use for normal tasks Modification abilities System speed or performance System usability Quality of IS staff support Number of defects Accuracy of production Installing system initially 5.5 User friendliness of system System memory utilization
System quality and defect levels Training and tutorial material quality On-screen help Output quality Functionality of system Vendor support System value
System compatibility with other products 5 Learning to use system initially System handling of user errors Status of system versus other systems System reliability and failure intervals System use for unusual and infrequent task
Customizing system 3.5
Step 3
The first columns of Tables 5.28, 5.29 and 5.33 rank-order the system
performance and system measures in terms of their perceived importance by IS
staff, management, and users. The top measures in the users' table (5.33)
indicate strong consensus among users that CIS management attention should
be directed at system access, system use for normal tasks, system speed or
performance, and quality of IS staff support. Respondents agreed that it is
critically important for the firm to develop effective support and training
processes for both users and IS staff in order to maintain a high output.

106
Step 4
Table 5.34 analyzes ranked CSF counts and gap scores for management.
Management identified multidisciplinary teams [8], business/C/S strategic
planning [6] C/S planning [25], and project championship [5] as competencies
that are both very important and require substantial improvement. Thus, these
competencies should be given priority in any initiatives undertaken to enhance
this firm's C/S management competencies.
Further analysis of Table 5.34 also indicates those competencies for
which inconsistencies or ambiguities might exist in the minds of management.
Management responded that considerable improvement is needed with
multidisciplinary teams [8] and project management [26], but both were
perceived as not critical to the firm's success.
Step 5
The consistency across responses from IS staff is seen in the differences
highlighted in Table 5.35. IS staff rate the areas of staff experience, financial
measures, and defect measures competency as having a higher current state of
development than perceived as desired. No categories are seen as having
rather large differences with regard to desired states of development over
current performance. Here, IS staff believe that all categories are closely
meeting or exceeding what is perceived as its optimum level of performance.

107
These similarities might suggest that IS staff are generally pleased with the
current states of performance.
Table 5.34 Ranked CSFs and Gap Scores for IS staff and management in the Transportation Firm (2)
C/S Critical Success Factors Count C/S Critical Success Factors Gap
[9] Data Architecture 4 [8] Multidisciplinary Teams 4.00 [10] Network Architecture 4 [25] C/S Planning 3.50 [29] Quality Assurance and Security 3 [6] Business/C/S Strategic Planning 3.25 [4] C/S Work Process Restructuring 3 [28] Project Management 2.25 [5] Project Championship 3 [13] Supplier Linkages 2.00 [19] C/S Skillbase 2 [26] C/S Measurement Systems 1.75 [20] Visualizing C/S Value 2 [5] Project Championship 1.50 [6] Business/C/S Strategic Planning 2 [7] New, Emerging C/S 1.50 [15] Line Mgr/IS Staff Working Relations 2 [19] C/S Skillbase 1.00 [2] Business Process Restructuring 1 [16] Technology Transfer 1.00 [7] New, Emerging C/S 1 [29] Quality Assurance and Security 1.00 [25] C/S Planning 1 [2] Business Process Restructuring 1.00 [22] C/S Vision 1 [15] Line Mgr/C/S Staff Working Relations 0.50 [21] C/S Policies 1 [10] Network Architecture 0.50 [3] Line Ownership 1 [20] Visualizing C/S Value 0.25 [1] Employee Learning about C/S Tools 1 [4] C/S Work Process Restructuring 0.25 [27] Software Development Practices 1 [12] Customer Linkages 0.25 [8] Multidisciplinary Teams 1 [17] Visualizing Organizational Activities 0.25 [28] Project Management 0 [1] Employee Learning about C/S tools 0.25 [18] Line Mgr C/S-Related Knowledge 0 [3] Line Ownership 0.25 [14] Collaborative Alliances 0 [27] Software Development Practices 0.00 [16] Technology Transfer 0 [21] C/S Policies 0.00 [12] Customer Linkages 0 [23] C/S Sourcing Decisions 0.00 [17] Visualizing Organizational Activities 0 [9] Data Architecture 0.00 [26] C/S Measurement Systems 0 [11] Processor Architecture 0.00 [11] Processor Architecture 0 [14] Collaborative Alliances 0.00 [13] Supplier Linkages 0 [24] Object Definitions 0.00 [24] Object Definitions 0 [22] C/S Vision 0.00 [23] C/S Sourcing Decisions 0 [18] Line Mgr C/S-Related Knowledge 0.00
TABLE 5.35 Summary Analysis for the Transportation Firm (2)
IS Staff
Mean Current Mean Desired Difference
Performance Areas 5.52 6.05 -0.53 Operational Measures 4.90 5.24 -0.34 Staff experience 5.27 3.91 1.36 Financial Measures 4.44 4.16 0.28 Defect Measures 5.14 4.57 0.57

108
The Transportation Firm (3)
Steps 1 and 2: IS Staff and Management
Table 5.36 shows that C/SS performance areas; providing training to
users, staffing, understanding and maintaining data security, defining data
integrity requirements, maintaining data integrity, disaster recovery plans, and
physical assess controls are perceived as the factors currently at the highest
states of development. C/S project management effectiveness, control over
changes, and providing consulting to users are perceived to be at the lowest
current states of development.
The IS staff believe that training of end users, training, education and
documentation, and providing consulting to users should exist at the highest
states of development with only planning an overall strategy, control over
changes, adequacy of C/S quality assurance, and C/S project management
effectiveness never moving beyond a low to modest state of development.
Table 5.37 shows that C/SS performance operational measures data
security, physical security, disaster recovery time, downtime, job and report
turnaround and delivery time, and system availability are perceived as the factors
currently at the highest state of development. Tools and methodologies
production rate, system cost, and percent of employees with terminals, PCs are
perceived to be at much lower current states of development.

109
Table 5.36 Ranked Means for the IS Staff in the Transportation Firm (3) Performance Areas
Long-Run Importance Score Current Performance Level Score
Training of end users 7 Providing training to users 7 Training, education and documentation Staffing Providing consulting to users Understanding and maintaining data Providing training to users security
Defining data integrity requirements Disaster recovery plans 6 Maintaining data integrity Control over methods and procedures Disaster recovery plans Staffing Physical assess controls Applications support Work Processes Training, education and documentation 6 Procedures of data retention Training of end users Maintaining data integrity Control over access to data Maintaining data accuracy Applications support Systems support Maintaining data accuracy Understanding and maintaining data Systems support security Control over computer maintenance
Procedures of data retention End user controls 5 Controlling redundancy Defining data integrity requirements Software architectures Establishing priorities Hardware architectures Determination of information Control over methods and procedures requirements Data communications and networking C/S staff skillbase controls Effectiveness of C/S planning Effectiveness of C/S planning Software architectures Data architectures Hardware architectures Data architectures Work Processes 5 Load analysis Adequacy of C/S quality assurance Capacity planning Establishing priorities Data communications and networking Load analysis controls Capacity planning Control over access to data Elapsed time Input controls Processing controls Data compatibility with mainframe 4 Control over computer maintenance Processing controls Physical assess controls Input controls Controlling redundancy End user controls Data compatibility with mainframe Determination of information Elapsed time requirements
Planning an overall strategy Planning an overall strategy 4 C/S staff skillbase Control over changes Adequacy of C/S quality assurance C/S project management effectiveness 3 C/S project management effectiveness Control over changes
Providing consulting to users
The operational measure that IS staff believe should exist at the highest
states of development is employees-per workstation. On the other hand, it

110
appears that IS staff would be quite comfortable if percent of employees with
terminals, PCs cost never moved beyond a modest state of development.
Table 5.37 Ranked Means for the IS Staff in the Transportation Firm (3) Operational Measures
Long-Run importance Score Current Performance Level Score
Employees-per workstation 7 Data security 7 Physical security
System availability 6 Disaster recovery time Downtime Downtime Disaster recovery time Job and report turnaround and delivery Data security time Physical security System availability System response time System cost Utilization 6
Employees-per workstation Utilization 5 System response time Functions availability on system Business value-added Information technology-per-employee Management productivity Productivity rates per user
Functions availability on system 5 Business value-added 4 Estimated average costs per activity Tools and methodologies production Productivity rates per software rate application Job and report turnaround and delivery time Information technology-per-employee 4 Management productivity Productivity rates per user Estimated average costs per activity Productivity rates per software Tools and methodologies production 3 application rate
3 System cost Percent of employees with terminals, Percent of employees with terminals, PCs PCs
Table 5.38 shows that C/SS performance financial measures information
technology spending and labor cost are perceived as the factors currently at the
highest state of development. Information technology expense-per employee,
return-on-sales, profitability during the past five years, return-on-equity, percent
of total budget spent on training, earnings-per-share, profitability, return-on-
assets, and personal productivity are perceived to be at much lower current
states of development.

111
The financial measure that IS staff believe should exist at the highest
states of development include information technology-to-revenue ratio. On the
other hand, it appears that IS staff would be quite comfortable if the profitability,
operations costs, costs-to-revenue, percent of total budget spent on training,
earnings-per-share, return-on-equity, personal productivity, information
technology spending, cost of supplies, net value-added, information technology
expense-per-employee, revenue-per employee, profit-per-employee, and
profitability during the past five years measures never moved beyond a modest
state of development.
Table 5.38 Ranked Means for the IS Staff In the Transportation Firm (3) Financial Measures
Long-Run importance Score Current Performance Level Score
Information technology-to-revenue ratio 6 Information technology spending 6 Labor cost
Labor cost 5 Management cost Operations costs 5 Data entry costs Management productivity
Expense-per-employee 4 Management cost 4 Return-on-assets Net value-added (Outputs) Return-on-investment
Net value-added (Outputs)
Revenue-per employee Return-on-sales Data entry cost 3 Management productivity Cost of Supplies Runaways Information technology-to-revenue ratio
Revenue-per-employee Profitability 3 Expense-per-employee Operations costs Profit-per-employee Costs-to-revenue Costs-to-revenue Percent of total budget spent on training Return-on-investments Earnings-per-share Runaways Return-on-equity Personal productivity Information technology expense-per 2 Information technology spending emp Cost of supplies Return-on-sales Net value-added Profitability during the past five years Information technology expense-per-emp Return-on-equity Revenue-per employee Percent of total budget spent on training Profit-per-employee Earnings-per-share Profitability during the past five years Profitability
Return-on-assets Personal productivity

112
Table 5.39 shows that C/SS performance defect measures number of
operating system restarts is perceived as the measure currently at the highest
state of development. Defect origins and overall defect total are perceived to be
at much lower current state of development.
The defect measures that IS staff believe should exist at the highest
states of development include number of operating system restarts and
system disruptions. On the other hand, it appears that IS staff would be quite
comfortable if the defect levels or reported measures never moved beyond a
modest state of development.
Table 5.39 Ranked Means for the IS Staff in the Transportation Firm (3) Defect Measures
Long-Run importance Score Current Performance Level Score
Number of operating system restarts 7 Number of operating system restarts 7 System disruptions
System disruptions 6 Defect removal efficiency 6
Defect severity and scope 5 Defect severity and scope 5
Defect levels or reported 4 Defect origins 4 Defect removal efficiency Overall defect total
Defect removal efficiency
Defect origins 3 Defect levels or reported 3 Overall defect total
Table 5.40 shows that training or education, staff/user ratio, support tools,
staff/application ratio are perceived as the staff experience measures currently at
the highest state of development. Testing techniques reviews and inspections,
analysis and design, participation in client/server projects, programming
languages, and computer hardware development are perceived to be at the
lowest current state of development.

113
The staff experience measure that IS staff believe should exist at the
highest states of development for long term success includes support tools,
training or education, staff turnover, staff/user ratio, software in general, and
testing techniques reviews and inspections. On the other hand, it appears that IS
staff would be quite comfortable if the computer hardware development measure
never moved beyond a modest state of development.
Table 5.40 Ranked Means for the IS Staff in the Transportation Firm (3) Staff Experience Measures
Long-Run Importance Score Current Performance Level Score
Support tools 7 Training or education 6 Training or education Staff/user ratio Staff turnover Support tools Staff/user ratio Staff/application ratio Software in general Testing techniques reviews and Automation in specific job area 5 inspections Software in general
Applications areas Automation in specific job area 6 Staff turnover Participation in client/server projects Staff years Staff/application ratio Applications areas Testing techniques reviews and
inspections 4
Analysis and design 5 Analysis and design Staff years Participation in client/server projects Programming languages Programming languages
Computer hardware development Computer hardware development 4
Steps 1 and 2: End-Users
The data reported in Table 5.41 reveal that the views of the end-users
regarding the current states of development of the actual C/SS are very different
from those of IS staff and management. The actual performance perceived to be
at the highest current states of development are learning to use system initially,
customizing system, system use for normal tasks. These rankings positively

114
reflect the initial satisfaction with the current system. The factors perceived to
be at lower current states of development system compatibility with other
products. A picture emerges of users that had initial comfort or satisfaction with
the system but find it incompatible with other systems. Again this firm has
devoted considerable efforts to fabricating overall standards and policies for
directing C/S related activities, but has not communicated or addressed system
defects and fatal errors.
Table 5.41 Ranked Means for the End-Users in the Transportation Firm (3)
Long-range Current Performance Level
Response time Fewer Icons Modification abilities System usability Number of defects Accuracy of production User friendliness of system
Learning to use system initially Customizing system System use for normal tasks
Installing system initially System speed or performance Quality of IS staff support Vendor support Accessing system
7
5.5
On-screen help Output quality Functionality of system System value Status of system versus other systems
4
Training and tutorial material quality System reliability and failure intervals System quality and defect levels System memory utilization System handling of user errors System use for unusual and infrequent task
2.5
System compatibility with other products 1
Step 3
The first columns of Tables 5.36, 5.37 and 5.41 rank-order the system
performance and system measures in terms of their perceived importance by IS
115
staff, management, and users. The top measures in the users' table (5.41)
indicate strong consensus among users that C/S management attention should
be directed at system access, system use for normal tasks, system speed or
performance, and quality of IS staff support. Respondents agreed that it is
critically important for the firm to develop effective support and training
processes for both users and IS staff in order to maintain a high output.
Step 4
Table 5.42 analyzes ranked CSF counts and gap scores for management.
Management identified C/S skillbase [19], visualizing C/S value [20], and C/S
policies [21] as competencies that are both very important and require
substantial improvement. Thus, these competencies should be given priority in
any initiatives undertaken to enhance this firm's C/S management competencies.
Further analysis of Table 5.42 also indicates those competencies for
which inconsistencies or ambiguities might exist in the minds of management.
Management responded that considerable improvement is needed with quality
assurance and security [29] and visualizing organizational activities [17], but both
were perceived as not critical to the firm's success.
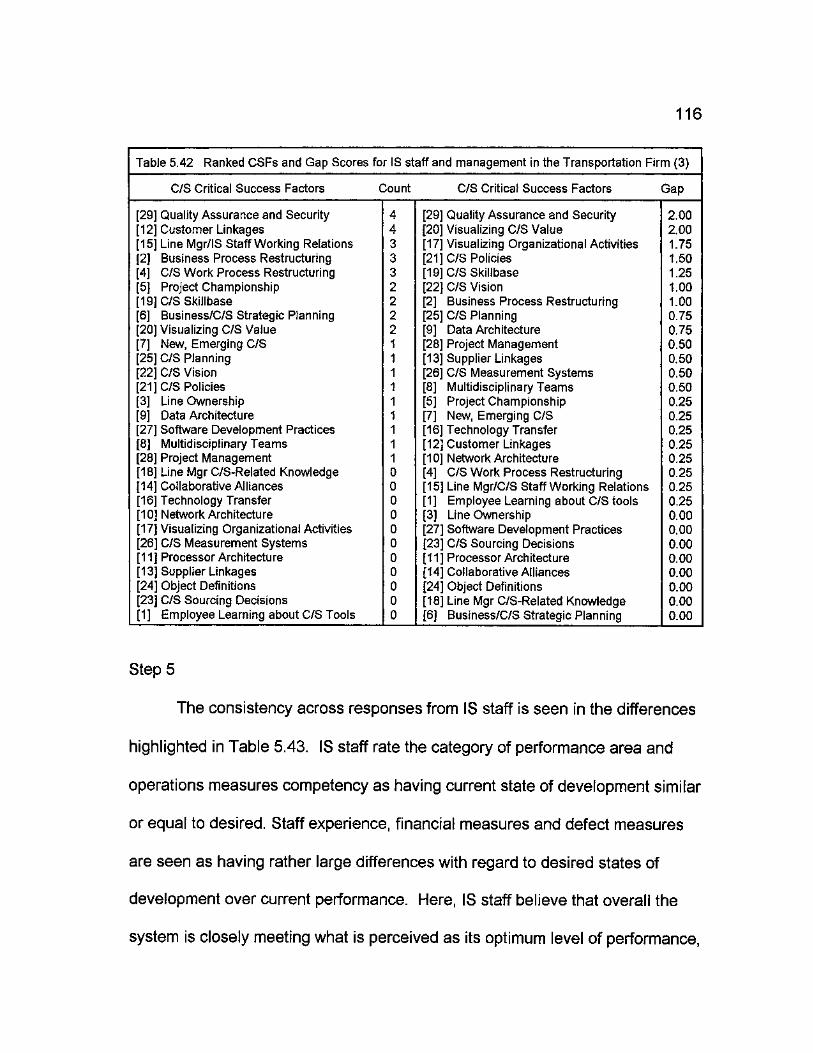
116
Table 5.42 Ranked CSFs and Gap Scores for IS staff and management in the Transportation Firm (3)
C/S Critical Success Factors Count C/S Critical Success Factors Gap
[29] Quality Assurance and Security 4 [29] Quality Assurance and Security 2.00 [12] Customer Linkages 4 [20] Visualizing C/S Value 2.00 [15] Line Mgr/IS Staff Working Relations 3 [17] Visualizing Organizational Activities 1.75 [2] Business Process Restructuring 3 [21] C/S Policies 1.50 [4] C/S Work Process Restructuring 3 [19] C/S Skillbase 1.25 [5] Project Championship 2 [22] C/S Vision 1.00 [19] C/S Skillbase 2 [2] Business Process Restructuring 1.00 [6] Business/C/S Strategic Planning 2 [25] C/S Planning 0.75 [20] Visualizing C/S Value 2 [9] Data Architecture 0.75 [7] New, Emerging C/S 1 [28] Project Management 0.50 [25] C/S Planning 1 [13] Supplier Linkages 0.50 [22] C/S Vision 1 [26] C/S Measurement Systems 0.50 [21] C/S Policies 1 [8] Multidisciplinary Teams 0.50 [3] Line Ownership 1 [5] Project Championship 0.25 [9] Data Architecture 1 [7] New, Emerging C/S 0.25 [27] Software Development Practices 1 [16] Technology Transfer 0.25 [8] Multidisciplinary Teams 1 [12] Customer Linkages 0.25 [28] Project Management 1 [10] Network Architecture 0.25 [18] Line Mgr C/S-Related Knowledge 0 [4] C/S Work Process Restructuring 0.25 [14] Collaborative Alliances 0 [15] Line Mgr/C/S Staff Working Relations 0.25 [16] Technology Transfer 0 [1] Employee Learning about C/S tools 0.25 [10] Network Architecture 0 [3] Line Ownership 0.00 [17] Visualizing Organizational Activities 0 [27] Software Development Practices 0.00 [26] C/S Measurement Systems 0 [23] C/S Sourcing Decisions 0.00 [11] Processor Architecture 0 [11] Processor Architecture 0.00 [13] Supplier Linkages 0 [14] Collaborative Alliances 0.00 [24] Object Definitions 0 [24] Object Definitions 0.00 [23] C/S Sourcing Decisions 0 [18] Line Mgr C/S-Related Knowledge 0.00 [1] Employee Learning about C/S Tools 0 [6] Business/C/S Strategic Planning 0.00
Step 5
The consistency across responses from IS staff is seen in the differences
highlighted in Table 5.43. IS staff rate the category of performance area and
operations measures competency as having current state of development similar
or equal to desired. Staff experience, financial measures and defect measures
are seen as having rather large differences with regard to desired states of
development over current performance. Here, IS staff believe that overall the
system is closely meeting what is perceived as its optimum level of performance,

117
but believe there to be room for improvement in staff experience, financial
measures, and defect measures.
TABLE 5.43 Summary Analysis for the Transportation Firm (3)
IS Staff
Mean Current Mean Desired Difference
Performance Areas 5.15 5.11 0.04 Operational Measures 5.38 5.42 -0.04 Staff experience 4.00 4.82 -0.82 Financial Measures 2.80 3.80 -1.00 Defect Measures 4.43 5.14 -0.71
The Medical Firm
Steps 1 and 2: IS Staff and Management
Table 5.44 shows that C/SS performance areas planning an overall
strategy is perceived as the factor currently at the highest states of development.
C/S staff skillbase, physical assess controls, adequacy of C/S quality assurance,
providing training to users, training, education and documentation, training of end
users, and staffing are perceived to be at the lowest current states of
development.
The IS staff believe that training of end users, training, education and
documentation, planning an overall strategy, staffing, end user controls, disaster
recovery plans, effectiveness of C/S planning, providing training to users, control
over methods and procedures, providing consulting to users, control over
changes, and determination of information requirements should exist at the
highest states of development with data C/S staff skillbase and C/S project

118
management effectiveness never moving beyond a low to modest state of
development.
Table 5.44 Ranked Means for the IS Staff in the Medical Firm Performance Areas
Long-Run Importance Score Current Performance Level Score
Training of end users 7 Planning an overall strategy 5 Training, education and documentation Planning an overall strategy Understanding and maintaining data 4 Staffing security End user controls End user controls Disaster recovery plans Processing controls Effectiveness of C/S planning Input controls Providing training to users Procedures of data retention Control over methods and procedures Defining data integrity requirements Providing consulting to users Maintaining data integrity Control over changes Control over access to data Determination of information Control over computer maintenance requirements Controlling redundancy
Applications support Applications support 6 Maintaining data accuracy Work Processes Determination of information Procedures of data retention requirements Maintaining data integrity Effectiveness of C/S planning Maintaining data accuracy Data architectures Systems support Establishing priorities Work Processes 3 Defining data integrity requirements Providing consulting to users
C/S project management effectiveness Physical assess controls 5 Control over changes Understanding and maintaining data Systems support security Data compatibility with mainframe Software architectures Disaster recovery plans Hardware architectures Software architectures Data architectures Hardware architectures Load analysis Control over methods and procedures Capacity planning Data comm. and networking controls Data communications and networking Establishing priorities controls Load analysis Control over access to data Capacity planning Input controls Elapsed time Processing controls Control over computer maintenance C/S staff skillbase 2
Physical assess controls Adequacy of C/S quality assurance 4 Adequacy of C/S quality assurance Controlling redundancy Providing training to users
Training, education and documentation Data compatibility with mainframe 3 Training of end users Elapsed time Staffing
C/S staff skillbase 2 C/S project management effectiveness

119
Table 5.45 shows that C/SS performance operational measures
employees-per workstation, job and report turnaround and delivery time, system
availability, and percent of employees with terminals, PCs are perceived as the
factors currently at the highest state of development. Physical security,
productivity rates per software application, tools and methodologies production
rate, information technology-per-employee, management productivity,
productivity rates per user, and estimated average costs per activity are
perceived to be at much lower current states of development.
The operational measures that IS staff believe should exist at the highest
states of development include system availability, downtime, utilization, functions
availability on system, employees-per workstation, business value-added,
disaster recovery time, data security, system response time, productivity rates
per user, job and report turnaround and delivery time, management productivity,
and percent of employees with terminals, PCs. On the other hand, it appears
that IS staff would be quite comfortable if tools and methodologies production
rate, estimated average costs per activity, productivity rates per software
application, and system cost never moved beyond a modest state of
development.
Table 5.46 shows that C/SS performance financial measures personal
productivity is perceived as the factor currently at the highest state of
development. Profit-per-employee, information technology-to-revenue
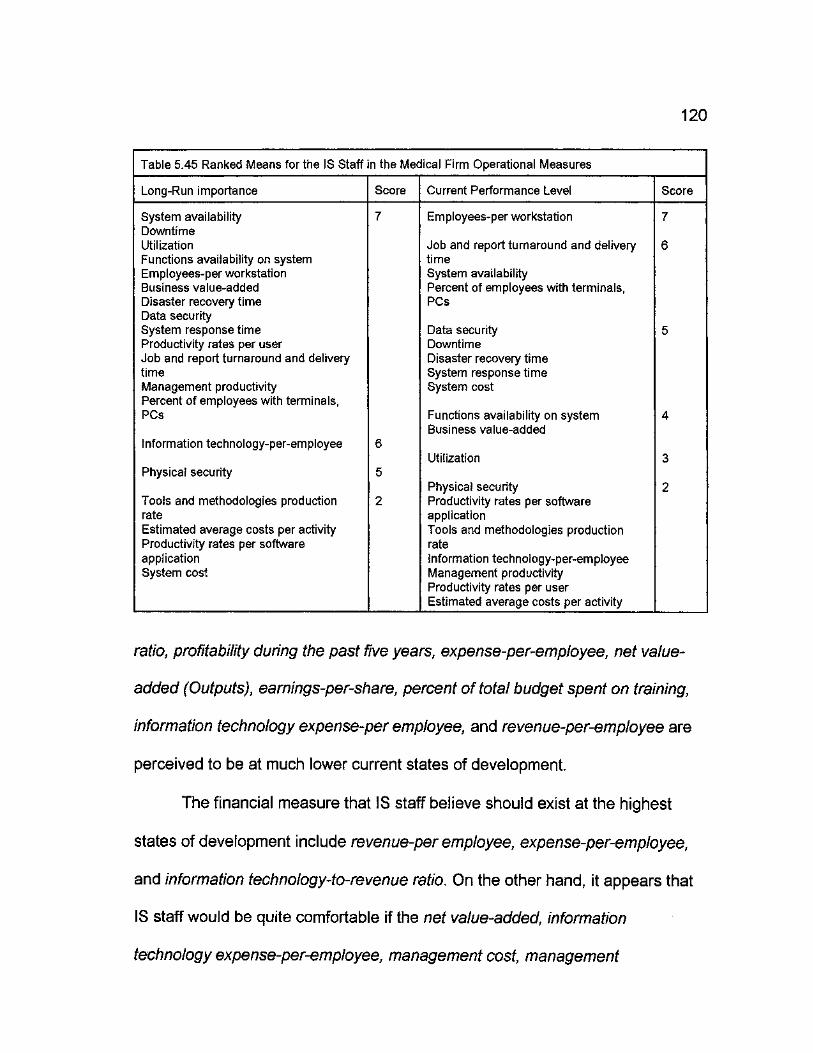
120
Table 5.45 Ranked Means for the IS Staff in the Medical Firm Operational Measures
Long-Run importance Score Current Performance Level Score
System availability 7 Employees-per workstation 7 Downtime Utilization Job and report turnaround and delivery 6 Functions availability on system time Employees-per workstation System availability Business value-added Percent of employees with terminals, Disaster recovery time PCs Data security System response time Data security 5 Productivity rates per user Downtime Job and report turnaround and delivery Disaster recovery time time System response time Management productivity System cost Percent of employees with terminals, PCs Functions availability on system
Business value-added 4
Information technology-per-employee 6 Utilization 3
Physical security 5 Physical security 2
Tools and methodologies production 2 Productivity rates per software rate application Estimated average costs per activity Tools and methodologies production Productivity rates per software rate application Information technology-per-employee System cost Management productivity
Productivity rates per user Estimated average costs per activity
ratio, profitability during the past five years, expense-per-employee, net value-
added (Outputs), earnings-per-share, percent of total budget spent on training,
information technology expense-per employee, and revenue-per-employee are
perceived to be at much lower current states of development.
The financial measure that IS staff believe should exist at the highest
states of development include revenue-per employee, expense-per-employee,
and information technology-to-revenue ratio. On the other hand, it appears that
IS staff would be quite comfortable if the net value-added, information
technology expense-per-employee, management cost, management
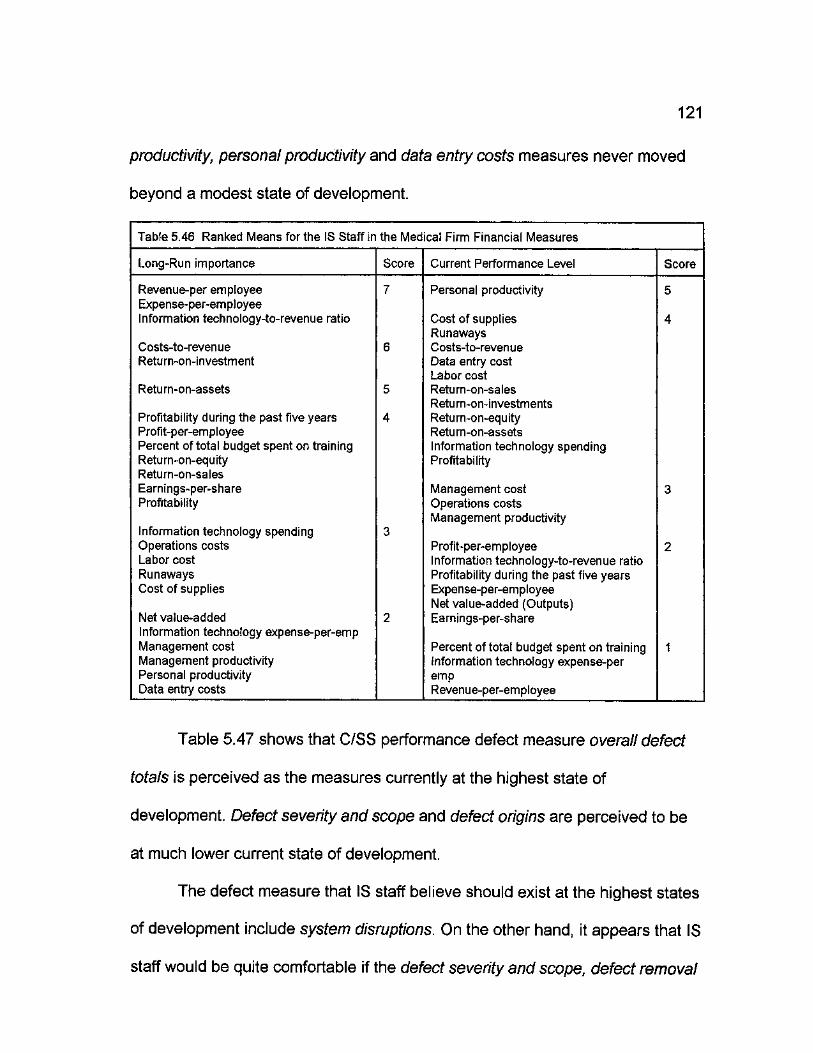
121
productivity, personal productivity and data entry costs measures never moved
beyond a modest state of development.
Table 5.46 Ranked Means for the IS Staff in the Medical Firm Financial Measures
Long-Run importance Score Current Performance Level Score
Revenue-per employee 7 Personal productivity 5 Expense-per-employee Information technology-to-revenue ratio Cost of supplies
Runaways 4
Costs-to-revenue 6 Costs-to-revenue Return-on-investment Data entry cost
Labor cost Return-on-assets 5 Return-on-sales
Return-on-investments Profitability during the past five years 4 Return-on-equity Profit-per-employee Return-on-assets Percent of total budget spent on training Information technology spending Return-on-equity Profitability Return-on-sales Earnings-per-share Management cost 3 Profitability Operations costs
Management productivity Information technology spending 3 Operations costs Profit-per-employee 2 Labor cost Information technology-to-revenue ratio Runaways Profitability during the past five years Cost of supplies Expense-per-employee
Net value-added (Outputs) Net value-added 2 Earnings-per-share Information technology expense-per-emp Management cost Percent of total budget spent on training 1 Management productivity Information technology expense-per Personal productivity emp Data entry costs Revenue-per-employee
Table 5.47 shows that C/SS performance defect measure overall defect
totals is perceived as the measures currently at the highest state of
development. Defect severity and scope and defect origins are perceived to be
at much lower current state of development.
The defect measure that IS staff believe should exist at the highest states
of development include system disruptions. On the other hand, it appears that IS
staff would be quite comfortable if the defect severity and scope, defect removal

122
efficiency, defect origins, defect levels or reported, and overall defect total
measures never moved beyond a modest state of development.
Table 5.47 Ranked Means for the IS Staff In the Medical Firm Defect Measures
Long-Run Importance Score Current Performance Level Score
System disruptions 7 Overall defect total 4
Number of operating system restarts 5 Number of operating system restarts 3
Defect severity and scope 3 Defect removal efficiency 2 Defect removal efficiency System disruptions Defect origins Defect levels or reported Defect levels or reported Overall defect total Defect severity and scope 1
Defect origins
Table 5.48 shows that staff turnover, training or education, staff/user ratio,
automation in specific job area, and testing techniques reviews and inspections
are perceived as the staff experience measures currently at the highest state of
development. Applications areas, staff/application ratio, and computer hardware
development are perceived to be at the lowest current state of development.
The staff experience measures that IS staff believe should exist at the
highest states of development for long term success include support tools,
training or education, staff turnover, staff/user ratio, software in general, and
testing techniques reviews and inspections. On the other hand, it appears that IS
staff would be quite comfortable if the computer hardware development measure
never moved beyond a modest state of development.

123
Table 5.48 Ranked Means for the IS Staff In the Medical Firm Staff Experience Measures
Long-Run Importance Score Current Performance Level Score
Support tools 7 Staff turnover 6 Training or education Training or education Staff turnover Staff/user ratio Staff/user ratio Automation in specific job area Software in general Testing techniques reviews and Testing techniques reviews and inspections inspections
Software in general 5 Automation in specific job area 6 Support tools Staff/application ratio Staff years Applications areas
Participation in client/server projects 4 Participation in client/server projects 5
Analysis and design 3 Analysis and design 4 Programming languages Staff years Programming languages Applications areas
Staff/application ratio 2
Computer hardware development 3 Computer hardware development
Steps 1 and 2: End-Users
The data reported in Table 5.49 reveal that the views of the end-users
regarding the current states of development of the actual C/SS are very different
from those of IS staff and management. The actual performance perceived to be
at the highest current states of development are accessing system, learning to
use system initially, installing system initially, and system use for normal tasks.
These rankings positively reflect a system that is fairly friendly to set-up and
learn. The factors perceived to be at lower current states of development are
system handling of user errors, training and tutorial material quality, and
customizing system. A picture emerges of users that rate the current system
high for normal tasks but perceive the current system to be rather difficult or
unfriendly to customize or with handling unusual task or errors. Again this firm

124
has devoted considerable efforts to fabricating overall standards and policies for
directing C/S related activities, but has fallen short on some aspects of user
training.
Table 5.49 Ranked Means for the End-Users in the Medical Firm
Long-range Current Performance Level
Response time Accessing system 7 System speed Modification abilities Learning to use system initially 5.5 System usability Installing system initially Number of defects System use for normal tasks Accuracy of production User friendliness of system System speed or performance 4 System failures System use for unusual and infrequent task System failures
System quality and defect levels System reliability and failure intervals Quality of IS staff support On-screen help Functionality of system Vendor support System value
System memory utilization 2.5 System compatibility with other products Output quality Status of system versus other systems
System handling of user errors 1 Training and tutorial material quality Customizing system
Step 3
The first columns of Tables 5.44, 5.45 and 5.49 rank-order the system
performance and system measures in terms of their perceived importance by IS
staff, management, and users. The top measures in the users' table (5.49)
indicate strong consensus among users that C/S management attention should
be directed at response time, system speed, and modification abilities.
Respondents agreed that it is critically important for the firm to develop effective

125
support and training processes for both users and IS staff in order to maintain a
high output.
Step 4
Table 5.50 analyzes ranked CSF counts and gap scores for management.
Management identified C/S vision [22] and business/C/S strategic planning [6] as
competencies that are both very important and require substantial improvement.
Thus, these competencies should be given priority in any initiatives undertaken
to enhance this firm's C/S management competencies.
Further analysis of Table 5.50 also indicates those competencies for
which inconsistencies or ambiguities might exist in the minds of management.
Management responded that considerable improvement is needed with project
championship project championship [5], object definitions [24], C/S planning [25],
quality assurance and security [29], visualizing C/S value [29], software
development practices [27], technology transfer [16], business/C/S strategic
planning [6], and supplier linkages [13], but were perceived as not critical to the
firm's success.
Step 5
The consistency across responses from IS staff is seen in the differences
highlighted in Table 5.51. IS staff rate the areas of staff experience
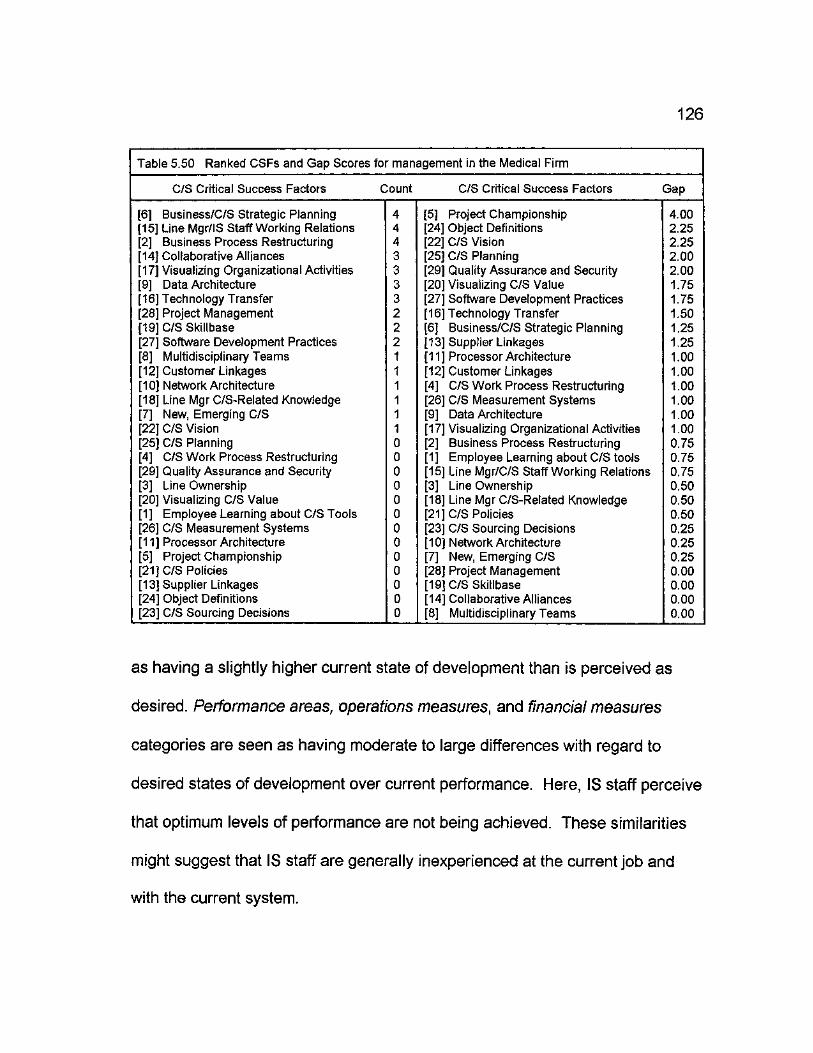
126
Table 5.50 Ranked CSFs and Gap Scores for management in the Medical Firm
C/S Critical Success Factors Count C/S Critical Success Factors Gap
[6] Business/C/S Strategic Planning 4 [5] Project Championship 4.00 [15] Line Mgr/IS Staff Working Relations 4 [24] Object Definitions 2.25 [2] Business Process Restructuring 4 [22] C/S Vision 2.25 [14] Collaborative Alliances 3 [25] C/S Planning 2.00 [17] Visualizing Organizational Activities 3 [29] Quality Assurance and Security 2.00 [9] Data Architecture 3 [20] Visualizing C/S Value 1.75 [16] Technology Transfer 3 [27] Software Development Practices 1.75 [28] Project Management 2 [16] Technology Transfer 1.50 [19] C/S Skillbase 2 [6] Business/C/S Strategic Planning 1.25 [27] Software Development Practices 2 [13] Supplier Linkages 1.25 [8] Multidisciplinary Teams 1 [11] Processor Architecture 1.00 [12] Customer Linkages 1 [12] Customer Linkages 1.00 [10] Network Architecture 1 [4] C/S Work Process Restructuring 1.00 [18] Line Mgr C/S-Related Knowledge 1 [26] C/S Measurement Systems 1.00 [7] New, Emerging C/S 1 [9] Data Architecture 1.00 [22] C/S Vision 1 [17] Visualizing Organizational Activities 1.00 [25] C/S Planning 0 [2] Business Process Restructuring 0.75 [4] C/S Work Process Restructuring 0 [1] Employee Learning about C/S tools 0.75 [29] Quality Assurance and Security 0 [15] Line Mgr/C/S Staff Working Relations 0.75 [3] Line Ownership 0 [3] Line Ownership 0.50 [20] Visualizing C/S Value 0 [18] Line Mgr C/S-Related Knowledge 0.50 [1] Employee Learning about C/S Tools 0 [21] C/S Policies 0.50 [26] C/S Measurement Systems 0 [23] C/S Sourcing Decisions 0.25 [11] Processor Architecture 0 [10] Network Architecture 0.25 [5] Project Championship 0 [7] New, Emerging C/S 0.25 [21] C/S Policies 0 [28] Project Management 0.00 [13] Supplier Linkages 0 [19] C/S Skillbase 0.00 [24] Object Definitions 0 [14] Collaborative Alliances 0.00 [23] C/S Sourcing Decisions 0 [8] Multidisciplinary Teams 0.00
as having a slightly higher current state of development than is perceived as
desired. Performance areas, operations measures, and financial measures
categories are seen as having moderate to large differences with regard to
desired states of development over current performance. Here, IS staff perceive
that optimum levels of performance are not being achieved. These similarities
might suggest that IS staff are generally inexperienced at the current job and
with the current system.

127
TABLE 5.51 Summary Analysis for the Medical Firm
IS Staff
Mean Current Mean Desired Difference
Performance Areas 3.07 5.42 -2.35 Operational Measures 2.94 5.71 -2.77 Staff experience 2.84 2.64 0.20 Financial Measures 2.92 3.80 -0.88 Defect Measures 2.14 2.71 -0.31
The Service Firm
Steps 1 and 2: IS Staff and Management
Table 5.52 shows that C/SS performance areas; understanding and
maintaining data security, defining data integrity requirements, maintaining data
integrity, and control over access to data are perceived as the factors currently
at the highest states of development. Control over changes and adequacy of C/S
quality assurance are perceived to be at the lowest current states of
development.
The IS staff believe that training of end users, training, education and
documentation, planning an overall strategy, staffing, end user controls, disaster
recovery plans, effectiveness of C/S planning, providing training to users, control
over methods and procedures, and providing consulting to users should exist at
the highest states of development with only data compatibility with mainframe,
elapsed time, physical assess controls, and C/S project management
effectiveness never moving beyond a low to modest state of development.
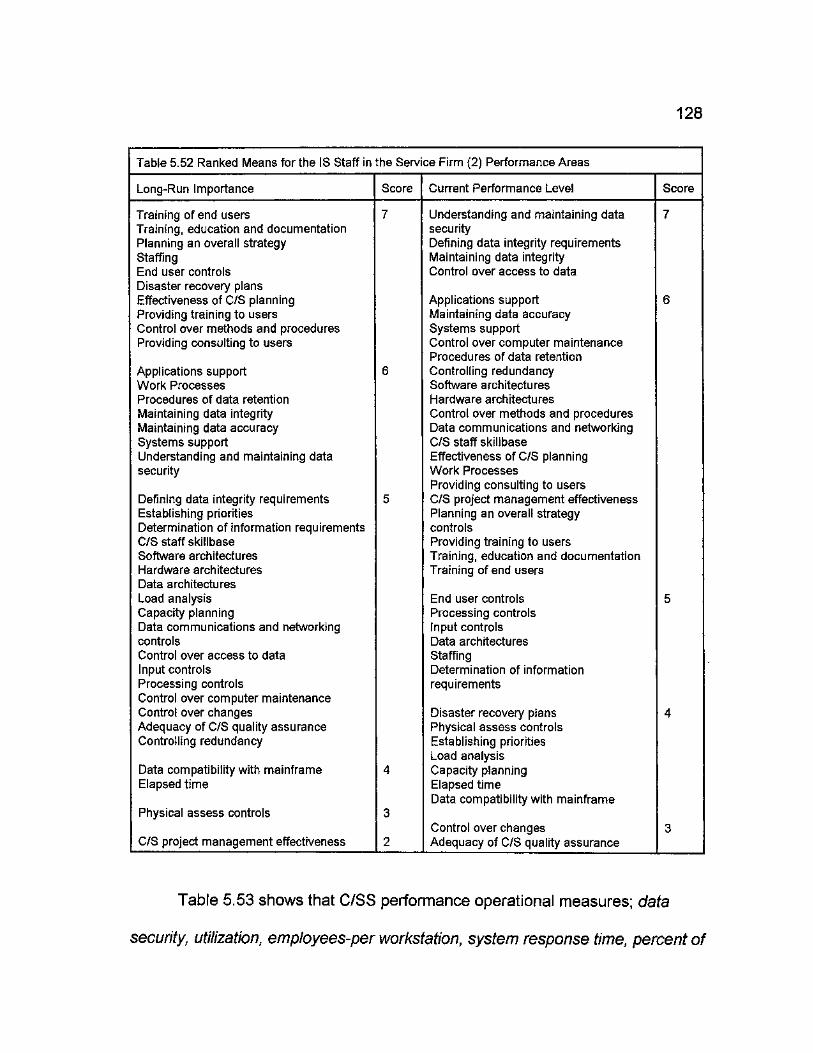
128
Table 5.52 Ranked Means for the IS Staff in the Service Firm (2) Performance Areas
Long-Run Importance Score Current Performance Level Score
Training of end users 7 Understanding and maintaining data 7 Training, education and documentation security Planning an overall strategy Defining data integrity requirements Staffing Maintaining data integrity End user controls Control over access to data Disaster recovery plans Effectiveness of C/S planning Applications support 6 Providing training to users Maintaining data accuracy Control over methods and procedures Systems support Providing consulting to users Control over computer maintenance
Procedures of data retention Applications support 6 Controlling redundancy Work Processes Software architectures Procedures of data retention Hardware architectures Maintaining data integrity Control over methods and procedures Maintaining data accuracy Data communications and networking Systems support C/S staff skillbase Understanding and maintaining data Effectiveness of C/S planning security Work Processes
Providing consulting to users Defining data integrity requirements 5 C/S project management effectiveness Establishing priorities Planning an overall strategy Determination of information requirements controls C/S staff skillbase Providing training to users Software architectures Training, education and documentation Hardware architectures Training of end users Data architectures Load analysis End user controls 5 Capacity planning Processing controls Data communications and networking Input controls controls Data architectures Control over access to data Staffing Input controls Determination of information Processing controls requirements Control over computer maintenance Control over changes Disaster recovery plans 4 Adequacy of C/S quality assurance Physical assess controls Controlling redundancy Establishing priorities
Load analysis Data compatibility with mainframe 4 Capacity planning Elapsed time Elapsed time
Data compatibility with mainframe Physical assess controls 3
Control over changes 3 C/S project management effectiveness 2 Adequacy of C/S quality assurance
Table 5.53 shows that C/SS performance operational measures; data
security, utilization, employees-per workstation, system response time, percent of

129
employees with terminals, PCs, system availability and system cost are
perceived as the factors currently at the highest state of development. Estimated
average costs per activity and downtime are perceived to be at much lower
current states of development.
The operational measures that IS staff believe should exist at the highest
states of development include system availability, downtime, business value-
added, system response time, data security, and disaster recovery time. On the
other hand, it appears that IS staff would be quite comfortable if physical
security, management productivity, and system cost never moved beyond a
modest state of development.
Table 5.54 shows that C/SS performance financial measures; percent of
total budget spent on training and labor cost are perceived as the factors
currently at the highest state of development. Management productivity,
operations costs, earnings-per-share, profitability, information technology
spending, profit-per-employee, information technology-to-revenue ratio, revenue-
per-employee, and information technology expense-per employee are perceived
to be at much lower current states of development.
The financial measure that IS staff believe should exist at the highest
states of development include; revenue-per employee, costs-to-revenue,
profitability during the past five years, percent of total budget spent on training,
retum-on-assets, return-on-investment, earnings-per-share, return-on-equity,
profitability, and personal productivity. On the other hand, it appears that IS staff
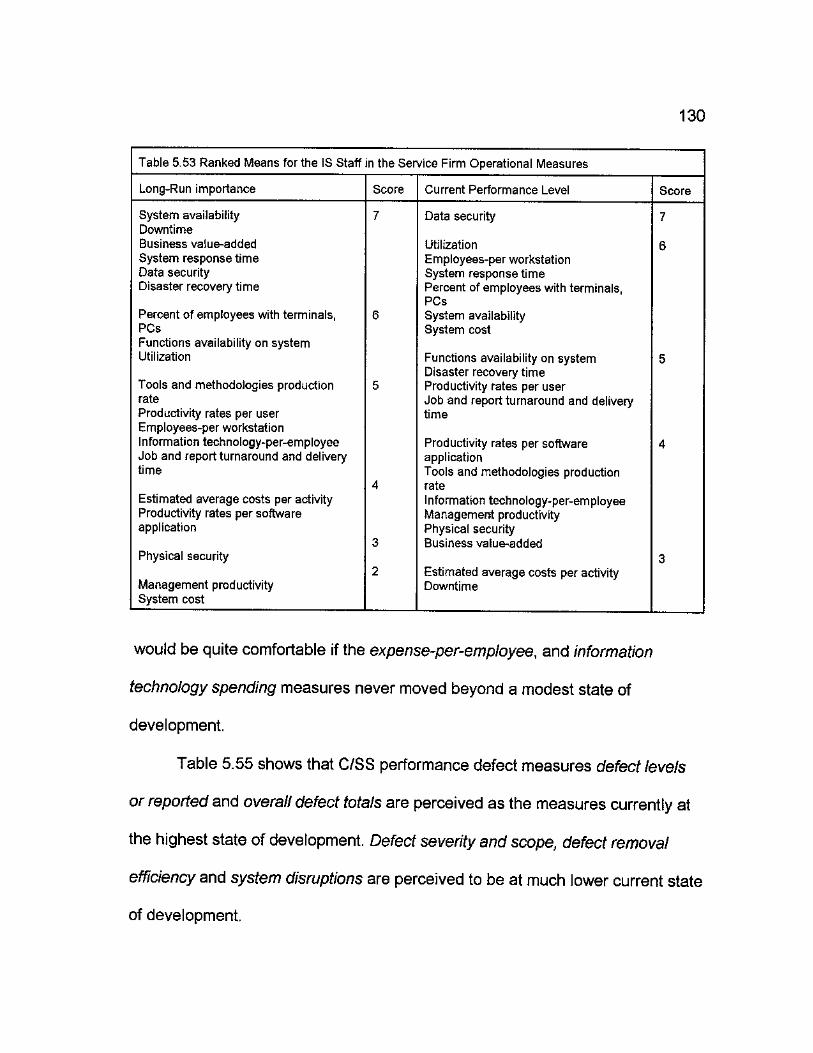
130
Table 5.53 Ranked Means for the IS Staff In the Service Firm Operational Measures
Long-Run importance Score Current Performance Level Score
System availability 7 Data security 7 Downtime
Data security
Business value-added Utilization 6 System response time Employees-per workstation Data security System response time Disaster recovery time Percent of employees with terminals,
PCs Percent of employees with terminals, 6 System availability PCs System cost Functions availability on system Utilization Functions availability on system
Disaster recovery time 5
Tools and methodologies production 5 Productivity rates per user rate Job and report turnaround and delivery Productivity rates per user time Employees-per workstation Information technology-per-employee Productivity rates per software 4 Job and report turnaround and delivery application time
4 Tools and methodologies production rate
Estimated average costs per activity Information technology-per-employee Productivity rates per software Management productivity application
3 Physical security Business value-added
Physical security 3
Management productivity 2 Estimated average costs per activity
Management productivity Downtime System cost
would be quite comfortable if the expense-per-employee, and information
technology spending measures never moved beyond a modest state of
development.
Table 5.55 shows that C/SS performance defect measures defect levels
or reported and overall defect totals are perceived as the measures currently at
the highest state of development. Defect severity and scope, defect removal
efficiency and system disruptions are perceived to be at much lower current state
of development.

131
Table 5.54 Ranked Means for the IS Staff in the Service Firm Financial Measures
Long-Run importance Score Current Performance Level Score
Profitability 7 Percent of total budget spent on training 7 Operations costs Labor cost Return-on-sales Information technology-to-revenue ratio Profitability during the past five years
Return-on-equity 6
Expense-per-employee 6 Expense-per-employee Costs-to-revenue Return-on-investments Percent of total budget spent on training Return-on-sales
Costs-to-revenue Return-on-assets 4 Return-on-investment Data entry cost 5 Earnings-per-share Cost of Supplies Return-on-equity Runaways Personal productivity Management cost Information technology spending Cost of supplies Return-on-assets 4 Management productivity Personal productivity Net value-added Net value-added (Outputs) Management cost
Net value-added (Outputs)
Information technology expense-per-emp Management productivity 3 Revenue-per employee Operations costs
Earnings-per-share Profit-per-employee 3 Profitability Data entry costs Information technology spending Labor cost Profit-per-employee Runaways Information technology-to-revenue ratio
Profitability during the past five years Revenue-per-employee
Profitability during the past five years 2 Information technology expense-per emp
The defect measures that IS staff believe should exist at the highest
states of development include overall defect total, defect severity and scope,
defect removal efficiency and system disruptions. On the other hand, it appears
that IS staff would be quite comfortable if the defect origins and number of
operating system restarts measures never moved beyond a modest state of
development.
Table 5.56 shows that staff turnover and training or education are
perceived as the staff experience measures currently at the highest state of
development. Staff/application ratio, testing techniques reviews

132
Table 5,55 Ranked Means for the IS Staff in the Service Firm Defect Measures
Long-Run importance Score Current Performance Level Score
Defect severity and scope 6 Defect origins 6 Defect removal efficiency
Defect removal efficiency 5 System disruptions Defect origins Number of operating system restarts Overall defect total 5
Defect severity and scope Defect levels or reported 4 Overall defect total Number of operating system restarts 4
System disruptions 3 Defect levels or reported 3
and inspections, analysis and design, participation in client/server projects,
programming languages, and computer hardware development are perceived to
be at the lowest current state of development.
The staff experience measure that IS staff believe should exist at the
highest states of development for long term success includes testing techniques
reviews and inspections. On the other hand, it appears that IS staff would be
quite comfortable if the computer hardware development measure never moved
beyond a modest state of development.
Steps 1 and 2: End-Users
Table 5.57 reveals that the views of the end-users regarding the current
states of development of the actual C/SS are very different from those of IS staff
and management. The actual performance perceived to be at the highest current
states of development is system access. These rankings positively reflect the
dissatisfaction with the current system.

133
Table 5.56 Ranked Means for the IS Staff in the Service Firm Staff Experience Measures
Long-Run Importance Score Current Performance Level Score
Testing techniques reviews and 7 Staff turnover 6 inspections
fi Training or education
Support tools u
Staff/user ratio 5 Training or education Automation in specific job area Staff turnover Software in general Staff/user ratio Applications areas Software in general
5 Support tools 4 Automation in specific job area Staff years Participation in client/server projects Staff/application ratio Staff/application ratio 3 Applications areas Testing techniques reviews and
4 inspections Analysis and design Analysis and design Staff years Participation in client/server projects Programming languages
Q Programming languages
o Computer hardware development
w Computer hardware development
The factors perceived to be at lower current states of development are
system user error handling, system unusual and infrequent task handing,
installing system initially, and vendor support. A picture emerges of users that
had initial difficulties with the system as well as ongoing problems with its
usability. Again this firm has devoted considerable efforts to fabricating overall
standards and policies for directing C/S related activities, but has not
communicated or addressed system defects and fatal errors.
Step 3
The first columns of Tables 5.52, 5.53 and 5.57 rank-order the system
performance and system measures in terms of their perceived importance by IS
staff, management, and users. The top measures in the users' table (5.57)
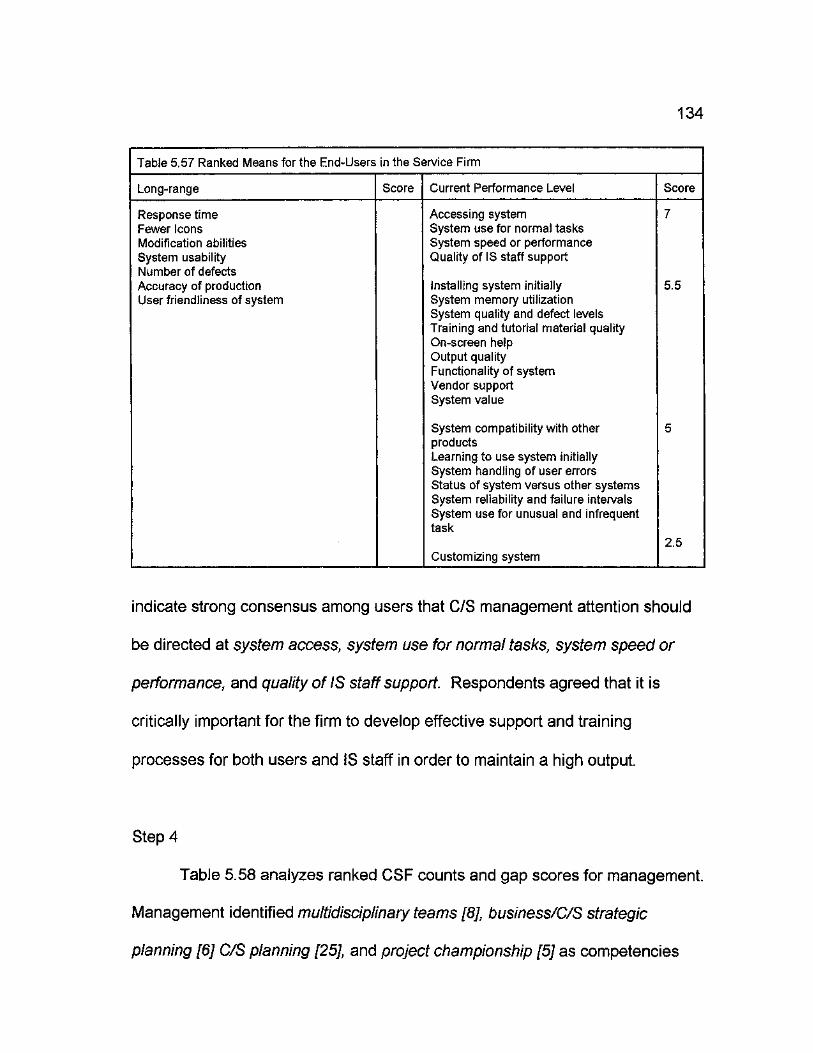
134
Table 5.57 Ranked Means for the End-Users in the Service Firm
Long-range Score Current Performance Level Score
Response time Accessing system 7 Fewer Icons System use for normal tasks Modification abilities System speed or performance System usability Quality of IS staff support Number of defects Accuracy of production Installing system initially 5.5 User friendliness of system System memory utilization
System quality and defect levels Training and tutorial material quality On-screen help Output quality Functionality of system Vendor support System value
System compatibility with other 5 products Learning to use system initially System handling of user errors Status of system versus other systems System reliability and failure intervals System use for unusual and infrequent task
2.5 Customizing system
indicate strong consensus among users that C/S management attention should
be directed at system access, system use for normal tasks, system speed or
performance, and quality of IS staff support. Respondents agreed that it is
critically important for the firm to develop effective support and training
processes for both users and IS staff in order to maintain a high output.
Step 4
Table 5.58 analyzes ranked CSF counts and gap scores for management.
Management identified multidisciplinary teams [8], business/C/S strategic
planning [6] C/S planning [25], and project championship [5] as competencies

135
that are both very important and require substantial improvement. Thus, these
competencies should be given priority in any initiatives undertaken to enhance
this firm's C/S management competencies.
Further analysis of Table 5.58 also indicates those competencies for
which inconsistencies or ambiguities might exist in the minds of management.
Management responded that considerable improvement is needed with
multidisciplinary teams [8] and project management [26], but both were
perceived as not critical to the firm's success.
Table 5.58 Ranked CSFs and Gap Scores for IS staff and management in the Service Firm
C/S Critical Success Factors Count C/S Critical Success Factors Gap
[9] Data Architecture 4 [8] Multidisciplinary Teams 4.00 [10] Network Architecture 4 [25] C/S Planning 3.50 [29] Quality Assurance and Security 3 [6] Business/C/S Strategic Planning 3.25 [4] C/S Work Process Restructuring 3 [28] Project Management 2.25 [5] Project Championship 3 [13] Supplier Linkages 2.00 [19] C/S Skillbase 2 [26] C/S Measurement Systems 1.75 [20] Visualizing C/S Value 2 [5] Project Championship 1.50 [6] Business/C/S Strategic Planning 2 [7] New, Emerging C/S 1.50 [15] Line Mgr/IS Staff Working Relations 2 [19] C/S Skillbase 1.00 [2] Business Process Restructuring 1 [16] Technology Transfer 1.00 [7] New, Emerging C/S 1 [29] Quality Assurance and Security 1.00 [25] C/S Planning 1 [2] Business Process Restructuring 1.00 [22] C/S Vision 1 [15] Line Mgr/C/S Staff Working Relations 0.50 [21] C/S Policies 1 [10] Network Architecture 0.50 [3] Line Ownership 1 [20] Visualizing C/S Value 0.25 [1] Employee Learning about C/S Tools 1 [4] C/S Work Process Restructuring 0.25 [27] Software Development Practices 1 [12] Customer Linkages 0.25 [8] Multidisciplinary Teams 1 [17] Visualizing Organizational Activities 0.25 [28] Project Management 0 [1] Employee Learning about C/S tools 0.25 [18] Line Mgr C/S-Related Knowledge 0 [3] Line Ownership 0.25 [14] Collaborative Alliances 0 [27] Software Development Practices 0.00 [16] Technology Transfer 0 [21] C/S Policies 0.00 [12] Customer Linkages 0 [23] C/S Sourcing Decisions 0.00 [17] Visualizing Organizational Activities 0 [9] Data Architecture 0.00 [26] C/S Measurement Systems 0 [11] Processor Architecture 0.00 [11] Processor Architecture 0 [14] Collaborative Alliances 0.00 [13] Supplier Linkages 0 [24] Object Definitions 0.00 [24] Object Definitions 0 [22] C/S Vision 0.00 [23] C/S Sourcing Decisions 0 [18] Line Mgr C/S-Related Knowledge 0.00

136
Step 5
The consistency across responses from IS staff is seen in the differences
highlighted in Table 5.59. IS staff rate the areas of staff experience, financial
measures, and defect measures competency as having a higher current state of
development than perceived as desired. No categories are seen as having
rather large differences with regard to desired states of development over
current performance. Here, IS staff believe that all categories are closely
meeting or exceeding what is perceived as its optimum level of performance.
These similarities might suggest that IS staff are generally pleased with the
current states of performance.
TABLE 5.59 Summary Analysis for the Service Firm (2)
IS Staff
Mean Current Mean Desired Difference
Performance Areas 5.52 6.05 -0.53 Operational Measures 4.90 5.24 -0.34 Staff experience 5.27 3.91 1.36 Financial Measures 4.44 4.16 0.28 Defect Measures 5.14 4.57 0.57
Across-Firm Analyses
In addition to analyzing responses within firms, "across-firm" analyses can
also be informative as a form of benchmarking that compares the responses of
one firm against those of others in similar industries, of similar size, with similar
corporate structures, with similar client/server investment strategies, etc. To

137
demonstrate the value of such analyses, the responses from the firms were
examined.
Tables 5.60, 5.61, 5.62, 5.63, 5.64 display each firm's average scores for
each of the performance measure categories and management competency
category. The shaded columns contain the desired (labeled "D") state of
performance measure development for each firm, while the white columns
(labeled "C") report each firm's current performance level.
Table 5.60 shows that maintaining data integrity, and maintaining data
accuracy are perceived as the factors currently at the highest states of
development. Control over changes and establishing priorities are perceived to
be at the lowest current states of development.
The IS staffs believe that training of end users, training, education and
documentation, staffing, providing consulting to users, planning an overall
strategy, disaster recovery plans, control over methods and procedures,
applications support, maintaining data accuracy, maintaining data integrity, end
user controls, and systems support should exist at the highest states of
development while all other measures existing at a modest state of development.
In the far right column of Table 5.60 (labeled "Dv"), deviations in the
desired and current levels of performance are shown. The IS staffs believe the
greatest differences exist in providing training to users, training, education, and
documentation, training of end users, and control over changes. Control over
access to data, control over computer maintenance, controlling redundancy, C/S

138
staff skillbase, data compatibility with mainframe, defining data integrity
requirements, elapsed time, hardware architectures, maintaining data integrity,
physical assess controls, and software architectures are perceived as having no
or very low gaps.
TABLE 5.60 Across-Firm Comparison of IS Staff Performance Areas
Petrol 1 Petrol 2 Trans 1 Trans 2 Trans 3 Medical Service Grand Total
Performance Areas P C D ; C P; C | :P' C to C w C D C w C Dv
Adequacy of C/S quality assurance • :'5 4 7 5 : 5 6 5 3 4 5 ' 4 2 s: 3 5'b 4.0 -1.0 Applications support •-•7. 4 7 6 6 5 6 6 6 6 : 6 4 :-;C6 6 M ' 5.3 -1.0 Capacity planning 6 4 7 5 6 3 5 4 5 5 3 4 4.0 -1.6 Control over access to data 7 5 6 '•'.5 4 i :.5 7 5 6 4 :7s: 7 5.6 0.0 Control over changes 6 5 7 5 5 3 5 3 4 3 7 3 ' : B 3 3.6 -2.0 Control over computer maintenance 6 6 : 6 6 .''3- 4 5 6 :-.:5 6 4 .5 6 &3: 5.4 0.1 Control over methods and procedures 6 5 6 6 6 6 7 6 6 6 7 3 7. 6 6.4 5.4 -1.0 Controlling redundancy 5 s 6 S 4 5 6 6 ' • : '4 3 6 s;o 5.1 0.1 C/S project management effectiveness •:;5 5 7 5 :-5' 6 6 : -.4 3 2 3 : ?2 6 4.d 4.9 0.9 C/S staff skillbase 6 5 •r'7 6 • : '6 6 7 5 6 4 . ;i::2 2 • 6 5.0 -0.1 Data security 6 4 7 5 7 6 6 7 6 7 4 7 M> 5.7 -0.4 Data architectures '••"5. 5 -•'7 5 6 3 5 4 : -.5' 5 4 5 BA 4.2 -1.2 Data comm. & networking controls ." 7 2 7 5 5 6 5 6 5 6 3 •-..si 6 5,6 4.9 -0.7 Data compatibility with mainframe 6 6 ,-":5 6 5 3 • 4 4 " 5 4 " :'3i 3 4 4 4 J 4.3 -0.3 Determination of info, requirement 4 4 7 5 6 4 5 5 5 4 4 :':s: 5 s i 4.4 -1.2 Defining data integrity requirement 6: 5 7 5 .\8T 6 v'5' 7 : - 5 7 e 4 7 £7 5.9 0.2 Disaster recovery plans : -s' 5 7 5 '• 6 4 7 4 7 . :7 3 7 4 6:4 4.6 -1.8 Effectiveness of C/S planning '..5 5 7 5 '.-5 3 7 6 '•,5" 5 7 4 7 6 4.9 -1.2 Elapsed time 4 4 5 5 5 3 4 5 5 5 3 4 4.1 -0.2 End user controls 4 4 7 5 6 4 : 7 5 5 4 7 3 : 7 5 6.1 4.3 -1.8 Establishing priorities 5 2 7 5 6 3 5 4 5 5 4 4 3.9 -1.5 Hardware architectures 5 5 7 6 6 4 5 6 5 6 5 3 : :-5 : 6 5.1 -0.3 Input controls 7 5 7 5 5 4 -•'6 5 '•S 4 4 5 5.6 4.6 -1.0 Load analysis 6 6 7 5 6 3 5 4 5 5 '*: * 5 i 3 .7:5 4 S.6 4.3 -1.3 Maintaining data accuracy 7 6 -7' 6 : : 0 7 6 6 6 6 xvSi 4 :>.e: 6 •6:3: 5.9 -0.4 Maintaining data integrity 7 6 7 6 :'.6- 5 6 7 6 7 6 4 7 6.0 -0.3 Planning an overall strategy 6 3 7 5 ;.:7 5 7 6 >•4 4 ' 7: 5 :7 6 6 4 4.9 -1.5 Physical assess controls 6 3 7 6 4: 4 3 5 5 7 5 2 ':3' 4 4i7 4.4 -0.3 Procedures of data retention :..-s 5 7j 6 6 6 6 6 6 6 6 4 6 6.0 5.6 -0.4 Processing controls 5 5 ' : 7 5 5 4 5 5 :''5- 4 :5 4 ' ..5 5 5.3 4.6 -0.7 Providing training to users 5 2 7 4 a 6 7 6 . 3 v-; 7- 2 7 6 4.1 -2.5 Providing consulting to users 6 3 6 5 6 6 7 6 7 7 ••r 3 :7 6 6.6 5.1 -1.5 Staffing 5 4 7 5 •7: 7 7 5 6 7 ••7, 2 7 5 ^ .6 5.0 -1.6 Software architectures 5 5 7 6 ; ' 6 : 4 5 6 • 5' 6 'S. 3 6 5.1 -0.3 Systems support 6 6 7 6 6 6 6 6 6 6 3 6 6 6;1 5.6 -0.5 Training of end users 5 2 7 4 7 7 7 6 7 6 • r: 7 2 ".;,7- 6 i 7 4.7 -2.0 Training, education and documentation 5 2 7 4 7 7 7 6 7 6 7 2 • 7 6 6;7 4.7 -2.0 Work Processes ••5" 4 7 6 6 5 6 6 6 5 6 3 • i 6 6 6.0 5.0 -1.0
Table 5.61 shows that data security is perceived as the factor currently at
the highest state of development. Tools and methodologies production rate and

139
management productivity are perceived to be at much lower current states of
development.
The operational measures that IS staffs believe should exist at the highest
states of development include system availability, downtime, data security,
disaster recovery time and utilization. On the other hand, it appears that IS staffs
would be quite comfortable if system cost never moved beyond a modest state of
development.
In the far right column of Table 5.61 gaps between the desired level for
development and current level of performance are shown. The IS staffs believe
the greatest differences exist in business value-added and downtime. Physical
security, productivity rates per software application, job and report turnaround
and delivery time, and estimated average costs per activity are perceived as
having no or very low gaps.
TABLE 5.61 Across-Firm Comparison of IS Staff Operational Measures
Operation Measures Petrol 1 Petrol 2 Trans 1 Trans 2 Trans 3 Medical Service Grand Total
D C 0 C b C D C D C C C • • t R c Dv
Business value-added "•'? 3 : 4 3 • 5 4 7 4 4 6 7 4 : 7 4 ••5 $ 4.0 -1.7
Data security 6 6 7 6 7 7 7 7 6 7 7 5 f 7 ;e:7 6.2 -0.5 Disaster recovery time : 6 5 5 5 7 4 7 5 6 7 7 5 7 5 6»4 5.1 -1.3 Downtime 6 5 7 6 7 7 7 3 6 7 7! 5 ::-7 3 6.7 5.1 -1.6 Employees-per workstation 6 3 4 3 7 5 : 5 6 7 6 •7 7 • ;:s; 6 5.1 -0.8 Estimated average costs per activity 5 6 5 4 5 4 3 4 5 •:-a 2 ;:;4 3 4.0 -0.3 Functions availability on system 4 •:5i 5 •'B: 7 6 5 •-••5 5 7 4 : 6 5 5.0 -0.9 Information technology-per-employee : 6 4 6 5 , 5 6 4 5 4 6 2 '•."S 4 '.;&2' 4.1 -1.1 Job & report turnround & delivery time 6 4 :6 5 5 7 5 5 v.4 7 . 7 6 • ,s 5 5.6 0.2 Management productivity 4 4 ; :6 3 : 2 4 '-.;4 6 •:! '.7: 2 S-2 4 m \ 3.9 -0.4 Percent of emp. with terminals, PCs r . e 3 ' 'IS 4 e 7 6 6 •'3 3 7 6 6 516 5.0 -0.6 Physical security 6 5 •5 5 5 6 3 4 6 7 5 2 3 4 47 4.7 0.0 Productivity rates per software app. 5 4 5 4 4 5 4 4 4 5 2 2 4 4 4;0 4.0 0.0 Productivity rates per user : 5 4 •:-s 4 4 5 • '6 5 5 4 7 2 ••••• 5 5 s . i 4.1 -1.0 System availability 7 4 7 6 7 6 7 6 : 6 7 7 6 7 6 8,9 5.9 -1.0 System cost 4 4 4 6 4 2 6 6 3 ','-2 5 2 6 ' :3J9 4.6 0.7 System response time 6 5 7 6 4 7 7 6 6 6 ; 7 5 '.V.7: 6 5.9 0.6 Tools and method production rate !•: 5 4 5 4 3 4 4 4 3 2 2 4 41 3.6 -0.5 Utilization i 6 5 7 6 6 6 6 6 5 6 7 3 6 6 6:1 5.4 -0.7

140
Table 5.62 shows that C/SS performance financial measure labor cost is
perceived as the factor currently at the highest state of development. Information
technology expense-per-employee, return-on-equity, revenue-per employee,
profit-per-employee, personal productivity, and earnings-per-share are perceived
to be at much lower current states of development.
The financial measures that IS staffs believe should exist at the highest
states of development include costs-to-revenue and profitability. On the other
hand, it appears that IS staff would be quite comfortable if the profit-per-
employee and runaways measures never moved beyond a modest state of
development.
TABLE 5.62 Across-Firm Comparison of IS Staff Financial Measures
Financial Measures Petrol 1 Petrol 2 Trans 1 Trans 2 Trans 3 Medical Service Grand Total
ID. C D C D C P C D C P C b c C Dv
Costs-to-revenue 5 7 5 •V7 7 6 6 " 3' 3 6 4 6 6:0 5.1 -0.9 Cost of supplies 6 6 6 4 6 4 5 : 3: 3 -3 4 - ' \4 5 : :.4i 4.7 0.4 Data entry costs a 6 a 6 5 4 3 5 3 2 4 .>'3 5 i4&: 4.7 0.4 Earnings-per-share V-,6 6 - : •? 6 ':'7 5 4 3 4 2 2 :-::4 3 3.9 -1.2 Expense-per-employee •:'5 5 '•':4 5 6 6 6 3 >• 7 2 • ;:-6 6 •Sj ' 4.7 -0.6 Info. tech. expense-per-employee 6 3 6 3 4 6 4 3 •••'3 2 ""'••-2: 1 3 •A i l 3.0 -1.1 Information technology spending 6 5 4 3 6 6 4 3 -,:3.' 6 :'>3 4 •; : 4 3 43 4.3 0.0 Information tech.-to-revenue ratio : 6 6 6 6 2 2 7 3 6 3 7 2 ••7. 3 •5.7. 3.8 -1.9 Labor cost v'6 6 :-.-6 6 7 6 7 : S 6 >.;3- 4 7 47 6.0 1.3 Management productivity ••is- 6 • 5 4 :6 7 4 3 4 5 "••2. 3 4 3 4 4 4.4 0.0 Management cost 6 6 4 4 3 4 5 5 4 2 3 4 5 4.3 0.0 Net value-added 5 5 5 4 4 4 4 a 4 i 2 4 4:1 4.0 -0.1 Operations costs 6 6 5. 6 ••'5: 5 7 3 "3 5 . : 3 3 7 3 S.1 4.4 -0.7 Percent of total bud. spent training 7 4 • 7" 4 '• 4 4 7 i :-3 2 4. 1 ":".6 7 M 4.1 -1.2 Personal productivity • : 7 5 7 5 .-3. 2 •4 4 3 2 :.a 5 ••4' 4 43 3.4 -0.9 Profit-per-employee • ,::6 5 6 5 4 3 ,.3 3 •••.3- 3 4 2 ; VS. 3 3.Q 3.4 -0.5 Profitability 7 5 ? 5 7 7 7 3 3 2 . \ 4 4 • 7 3 M 4.1 -1.9 Profitability during the past five yrs 5 : 7 5 7 7 •:;2 6 ,v3- 2 4 2 "• 2 6 4.6 4.7 0.1 Return-on-assets :"..7 5 7 5 7 5 4 4 •>4 2 5 4 •V.'4: 4 3.9 -1.2 Return-on-equity :/• 7 6 : 7 6 7 7 4 6 • :-3 2 4 4 6 SJ; 3.3 -1.2 Return-on-investment : 7 5 7 5 •: 7 7 4 6 4 3 6 4 4 6 SJ: 5.1 -0.5 Return-on-sales 6 5 6 5 4 4 7 6 4 2 :--4 4 " v-7' 6 5,4 4.6 -0.8 Revenue-per employee 0 5 7 6 4. 3 4 3 4 3 7 1 •-.4 3 5:1 3.4 -1.7 Runaways ; ' -5 4 4 4 4 4 3 5 4 3 3 4 ;:>3 5 3.7 4.1 0.4

141
Table 5.63 shows that no C/SS performance defect measures are
perceived as needing to be at the highest state of development. Also none are at
a current state of development lower than what is considered to by low.
System disruptions is the defect measure that IS staffs believe should
exist at the highest state of development. Furthermore, it appears that IS staffs
would like all defect measures to exist at a fairly moderate state of development.
TABLE 5.63 Across-Firm Comparison of IS Staff Defect Measures
Defect Measures Petrol 1 Petrol 2 Trans 1 Trans 2 Trans 3 Medical Service Grand Total
:D C D C D C D C 0 C • P . ; c C •0: c Dv
Defect levels or reported ' •• 6 6 6 : -5' 6 4 3 3 4 -\3: 2 3 49 4.3 -0.6 Defect origins 4 5 5
••• Q 4 5 6 4 3 .'••3 1 '-5 6 46 4.3 -0.3 Defect removal efficiency 5 7 4 • ; :5 6 6 6 4 ' :3: 2 6 4.7 -.06 Defect severity and scope 7 4 r:-7 4 ; $ 6 >:6 5 5 5 1 • -.0- 5 •im 4.3 -1.4 No. of operating system restarts • •r'S 5 5 5 4 6 '5 4 •:..;-7 7 5 3 4 5.1 0.0 Overall defect total 5 '••;-7 6 ' s 5 ; 4 5 4 3 :'"3 4 - ; A 5 4.7 -0.2 System disruptions •<7 4 :.:7 4 '.\7:. 6 •:: ,3 6 7 6 .••••7 2 6 4.9 -1.0
Table 5.64 shows that no staff experience measures are perceived as
currently existing at the highest state of development. Computer hardware
development analysis and design, programming languages, participation in
client/server projects, and testing technology, reviews and inspections are
perceived to be at the lowest current state of development.
The staff experience measures that IS staff believe should exist at the
highest desired states of development include testing techniques reviews and
inspections, training or education, staff turnover, support tools, staff/user ratio,
software in general, and automation in specific job area. It appears that IS staffs
would like all other staff experience measures to exist at a moderate or higher
level.

142
TABLE 5.64 Across-Firm Comparison of IS Staff Experience Measures
Experience Measures Petrol 1 Petrol 2 Trans 1 Trans 2 Trans 3 Medical Service Grand Total
• i - P v : c a C C -P';' C 'O'' C C C ••M C Dv
Analysis and design 6 n :4 3 5 4 • 4 3 : 4 •X4 3 • :.4 3 4 i 3.7 -0.9 Applications areas y 6 5 4 4 5 •'•5 5 5 ,i:6 2 5 •£M. 4.4 -1.2 Automation in specific job area .•'•7 5 7 5 •:-:6 6 5 5 i 5 6 6 5 e i 5.3 -0.7 Computer hardware development :0 5 4 4 4 3 3 2 • ' < 4 4 :<-3' 2 2 3.1 -2.8 Participation in client/server projects 6 4 3 6 4 5 3 • 6 4 • •'5' 4 '.S 3 s i 3.9 -1.5 Programming languages :6 5 4 4 4 4 3 4 • 4 3 : 'i i4' 3 ;A 3 3.7 -0.9 Software in general 5 4 4 7 5 6 5 :--7 5 '• ;• 7 5 - :6 5 4.9 -1.2 Staff/application ratio :5\.7 5 4 3 6 6 5 3 6 6 2 "V - . -5 3 5:6 4.0 -1.6 Staff/user ratio :-:7 5 6 5 7 6 6 5 = .•.7. 6 7 6 6 5 6LS 5.4 -1.2 Support tools .. 5 :6 4 7 5 3 4 \-'/7: 6 7 5 6 4 :6.6 4.7 -1.9 Staff turnover -•y. 5 6 5 .7 6 6 6 •'7 5 : 7 6 6 e.e 5.6 -1.0 Staff years ;v-"s: 5 ' :3 5 6 6 4 4 : s 5 5 4 4.e: 4.9 0.3 Testing tech. reviews & inspections :>.7 4 ,-.s 3 :6 4 7 3 : -7 4 '; -'.7 6 7 3 6.6 3.9 -2.7 Training or education •• 7 5 6 4 7 6 6 6 - 7 6 7 6 6 6 5.6 -1.0
Summary End-Users
The summary data reported in Table 5.65 report the views of the end-
users regarding the current states of development. The actual performance
measures perceived to be at the highest current states of development are
system access and system use for normal tasks. The factors perceived to be at
lower current states of development are system user error handling, system
unusual and infrequent task handing, installing system initially, status of system
versus other systems, system memory utilization, and system compatibility with
other products. When asked to list those measures they perceived as being the
most important for long term success, end users most frequently named system
response time, training and tutorial quality, system reliability and failure intervals
and system speed and performance.

143
TABLE 5.65 Across-Firm Comparison of End Users Ranked Means
Performance Measures Petrol 1 Petrol 2 Trans 1 Trans 2 Trans 3 Medical Service Grand Total
Accessing system 7 7 7 7 5.5 7 7 6.79 Customizing system 7 4 4 2.5 7 1 2.5 4.00 Functionality of system 4 4 4 5.5 4 4 5.5 4.43 Installing system initially 7 1 4 5.5 5.5 5.5 4 3.86 Learning to use system initially 7 5.5 5.5 4 7 5.5 5.5 5.71 On-screen help 4 5.5 5.5 5.5 4 4 5.5 4.86 Quality of IS staff support 5.5 4 4 7 2.5 4 7 4.86 Output quality 5.5 5.5 4 5.5 4 2.5 5.5 4.64 Status of system versus other systems 2.5 4 4 4 4 4 4 3.76 Sys. use for unusual and infrequent task 5.5 1 5.5 4 2.5 2.5 4 3.57 System compatibility with other products 5.5 4 5.5 4 1 2.5 4 3.76 System handling of user errors 4 1 4 2.5 1 4 2.93 System memory utilization 2.5 4 4 5.5 2.5 2.5 5.5 3.70 System quality and defect levels 2.5 4 5.5 5.5 2.5 4 5.5 4.21 System reliability and failure intervals 1 4 4 4 2.5 4 4 4.86 System speed or performance 1 4 5.5 7 5.5 4 7 4.86 System use for normal tasks 5.5 5.5 5.5 7 7 5.5 7 6.14 System value 4 4 4 5.5 4 4 5.5 5.31 Training and tutorial material quality 7 5.5 4 5.5 2.5 1 5.5 4.43 Vendor support 4 1 5.5 5.5 5.5 4 5.5 4.43
Summary Management
Table 5.66 analyzes critical success factor counts and gap scores for
management. The columns labeled "C" identify the frequency at which the
critical success factor s were listed by that firm's management. The columns
labeled "G" report the gaps scores or deviations in the desired verses current
level for each management competency. Overall, management identified data
architecture [9], business client/server strategic planning [6], line management
client/server related knowledge [18], business process restructuring [2],
client/server skillbase [19], new and emerging client/server [7], and client/server
vision [22] as competencies that are both very important and listed in all seven
C/SS. The far right column (labeled "S") reports the total number of firms listing
each management competency as a critical success factor. Thus, these
competencies should be given priority in any initiatives undertaken to enhance a

144
firm's C/S management competencies. Management competencies processor
architecture [11], supplier linkages [13], client/server sourcing decision [23],
object definitions [24], and client/server measurement systems [26] were not
listed by any managers as being a CSF.
Further analysis of Table 5.66 also indicates those competencies for
which inconsistencies or ambiguities might exist in the minds of management.
Management responded that considerable improvement is needed with
client/server measurement systems [26], project management [28], project
championship [5], business client/server strategic planning [6], multidisciplinary
teams [8], and supplier linkages [13], All but business client/server strategic
planning were perceived as not critical to the firm's success.
Across Firm Summary
The consistency across responses from IS staffs is seen in the
differences highlighted by bold type in Table 5.67 and Figure 5.1. As might be
expected, IS staffs rate all categories as having a higher desired overall state of
development than currently is. The performance area and operation measure
categories have rather large deviations in desired and current performance.
Here, IS staff believe that the overall system performance and day-to-day
operations fall furthest from the desired state of development. These differences
might suggest that IS staff are generally not pleased with the current states of
C/SS performance.
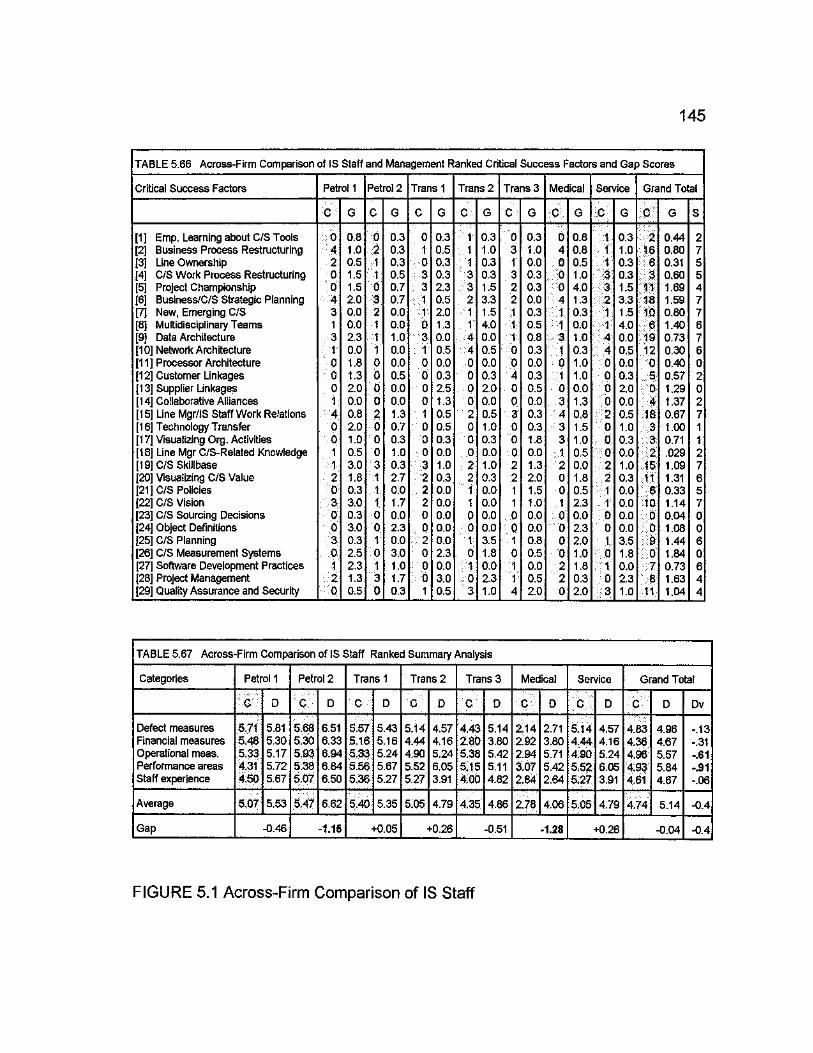
145
TABLE 5.66 Across-Firm Comparison of IS Staff and Management Ranked Critical Success Factors and Gap Scores
Critical Success Factors Petrol 1 Petrol 2 Trans 1 Trans 2 Trans 3 Medical Service Grand Total
:C" G 0 G ,:c': G • C G '0.' G •;;Cl G •C-" G 0: G S
[1] Emp. Learning about C/S Tools ••vb 0.8 0 0.3 0 0.3 • • 1 • 0.3 0 0.3 d 0.8 0.3 0.44 2 [2] Business Process Restructuring 4 1.0 2 0.3 1 0.5 1 1.0 • 3 1.0 0.8 i:": 1.0 16 0.80 7 [3] Line Ownership •>••2 0.5 ,1- 0.3 D: 0.3 ••••1 0.3 1 0.0 0 0.5 0.3 m 0.31 5 [4] C/S Work Process Restructuring '.1:0 1.5 0.5 ;; 3 0.3 0.3 .'•3' 0.3 1.0 0.3 0.60 5 [5] Project Championship :o 1.5 d 0.7 k 3' 2.3 ,<:3 1.5 • -2 0.3 •:-';0 4.0 1.5 . i t 1.69 4 [6] Business/C/S Strategic Planning •<•4 2.0 ;;3 0.7 : 1 0.5 -•2 3.3 ::2 0.0 :14-1.3 ;i:;2 3.3 1.59 7 [7] New, Emerging C/S • 3 0.0 i 0.0 2.0 i 1.5 0.3 0.3 ' ' i 1.5 m 0.80 7 [8] Multidisciplinary Teams 1 0.0 1 0.0 0 1.3 .. 1 4.0 •'& 0.5 )'H 0.0 4.0 •m 1.40 6 [9] Data Architecture •V.3- 2.3 1.0 - a 0.0 4 0.0 1 0.8 -3. 1.0 :;>4- 0.0 •M 0.73 7 [10] Network Architecture 1 0.0 i 0.0 1 0.5 :.-4 0.5 0 0.3 0.3 i f : 4 - 0.5 'M 0.30 6 [11] Processor Architecture 0 1.8 0 0.0 0 0.0 0 0.0 0 0.0 0 1.0 0 0.0 0.40 0 [12] Customer Linkages 0 1.3 b 0.5 0 0.3 0 0.3 4 0.3 1.0 0 0.3 m 0.57 2 [13] Supplier Linkages 0 2.0 d 0.0 0 2.5 0 2.0 • 0 0.5 0 0.0 0 2.0 1.29 0 [14] Collaborative Alliances i 0.0 0 0.0 0 1.3 0 0.0 0 0.0 3 1.3 • 0 0.0 1.37 2 [15] Line Mgr/IS Staff Work Relations • '• 4 0.8 2 1.3 1 0.5 ' 2 0.5 3: 0.3 4 0.8 0.5 0.67 7 [16] Technology Transfer 0 2.0 d 0.7 0 0.5 : 0 1.0 0 0.3 .>.3" 1.5 : 0 1.0 1.00 1 [17] Visualizing Org. Activities 0 1.0 0 0.3 0 0.3 0 0.3 0 1.8 ' : ' 3 1.0 vO.d. 0.3 . -3: 0.71 1 [18] Line Mgr C/S-Related Knowledge 1 0.5 0 1.0 o 0.0 : o 0.0 0 0.0 J 0.5 0.0 .029 2 [19] C/S Skillbase •••'•X 3.0 3 0.3 ••'•3 1.0 :'''2 1.0 2 1.3 "••'2' 0.0 :\-2. 1.0 M: 1.09 7 [20] Visualizing C/S Value 2 1.8 i 2.7 :: 2 0.3 2 0.3 2 2.0 0 1.8 : :-i 0.3 ::11" 1.31 6 [21] C/S Policies 0 0.3 1: 0.0 -,2 0.0 i;; 0.0 :1 1.5 0 0.5
;>vt 0.0 \.:©' 0.33 5 [22] C/S Vision ••',3: 3.0 1 1.7 2 0.0 ::'1 ! 0.0 i 1.0 r 2.3 '• 1: 0.0 M 1.14 7 [23] C/S Sourcing Decisions 0 0.3 0 0.0 0 0.0 0 0.0 0 0.0 : 0 0.0 0.0 ;•<& 0.04 0 [24] Object Definitions 0 3.0 0 2.3 : 0 0.0 0 0.0 ! 0 0.0 0 2.3 0 0.0 •0 1.08 0 [25] C/S Planning 3 0.3 1 0.0 2 0.0 -•-I: 3.5 •-M, 0.8 0 2.0 3.5 1.44 6 [26] C/S Measurement Systems 0 2.5 0 3.0 0 2.3 ; 0; 1.8 0 0.5 0 1.0 1.8 1.84 0 [27] Software Development Practices 2.3 1 1.0 0 0.0 0.0 i 0.0 ' ;-2 1.8 0.0 . ';•> 7 0.73 6 [28] Project Management 2 1.3 "3' 1.7 0 3.0 0 2.3 i 0.5 2 0.3 0 2.3 "'v-8' 1.63 4 [29] Quality Assurance and Security 0 0.5 0 0.3 1 0.5 3 1.0 :4 2.0 0 2.0 '•••3 1.0 11 1.04 4
TABLE 5.67 Across-Firm Comparison of IS Staff Ranked Summary Analysis
Categories Petrol 1 Petrol 2 Trans 1 Trans 2 Trans 3 Medical Service Grand Total
m D :i .Co D ' • 0 D •o'; D ;C" ; D :-Q •'•••' D 7CA D D Dv
Defect measures 6,71 5.81 5.6S 6.51 6:.57 5.43 5,14 4.57 4,43 5.14 2:14 2.71 514 4.57 JM' 4.96 -.13 Financial measures 5 M 5.30 5.30 6.33 S.16 5.16 4 M 4.16 2:80 3.80 2 m 3.80 4.44 4.16 4,36 4.67 -.31 Operational meas. 5,33 5.17 5.93 6.94 5.33 5.24 490 5.24 5.38 5.42 2M 5.71 4:90 5.24 4M 5.57 -.61 Performance areas 4 i r 5.72 5-38 6.84 5.56 5.67 5,52 6.05 s;i5 5.11 %07 5.42 5-52 6.05 4-^3 5.84 -.91 Staff experience 4.60 5.67 5r0t 6.50 5,36 5.27 5:27 3.91 4.82 2M 2.64 5,27 3.91 p i 4.67 -.06
Average 5,07 5.53 5.47 6.62 5;40 5.35 5,06 4.79 4,35 4.86 2.78 4.06 5-05 4.79 4J4 5.14 -0.4
Gap -0.46 -1.15 +0.05 +0.26 -0.51 -1.28 +0.26 -0.04 -0.4
FIGURE 5.1 Across-Firm Comparison of IS Staff
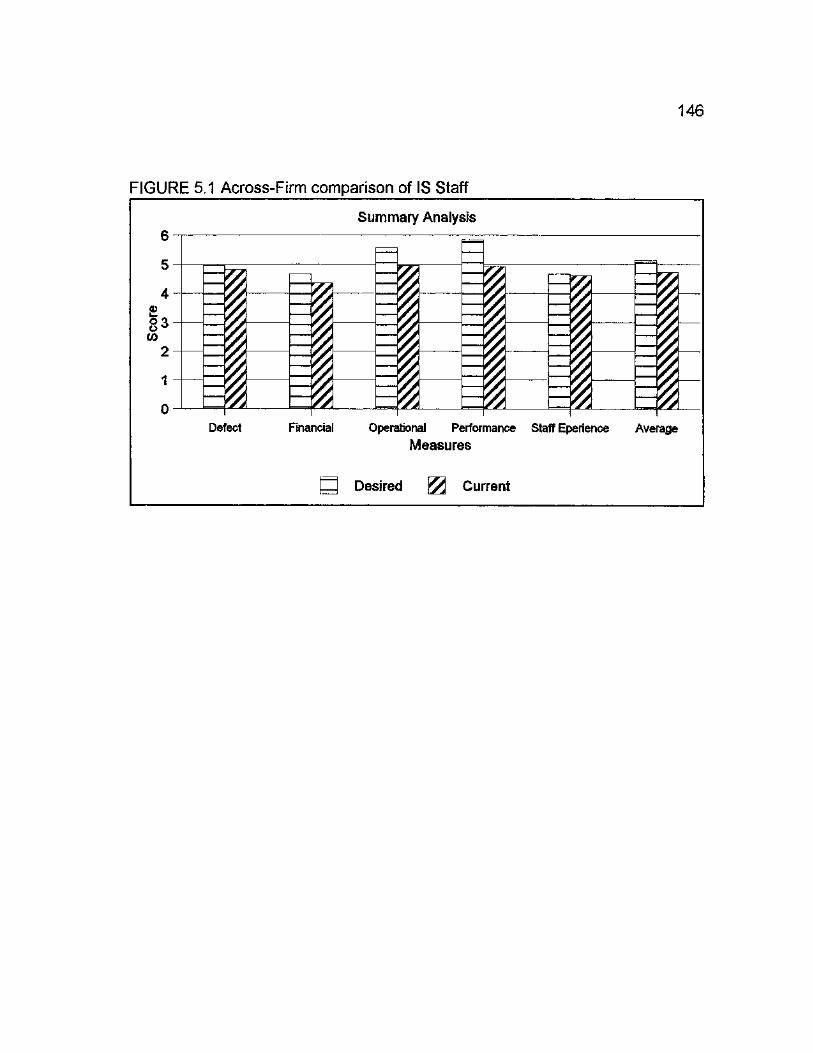
146
FIGURE 5.1 Across-Firm comparison of IS Staff
Summary Analysis
5
4 £ o i o *
to
2
1
0 Defect Financial Operational Performance Staff Eperience
Measures
Desired ^ Current
Average
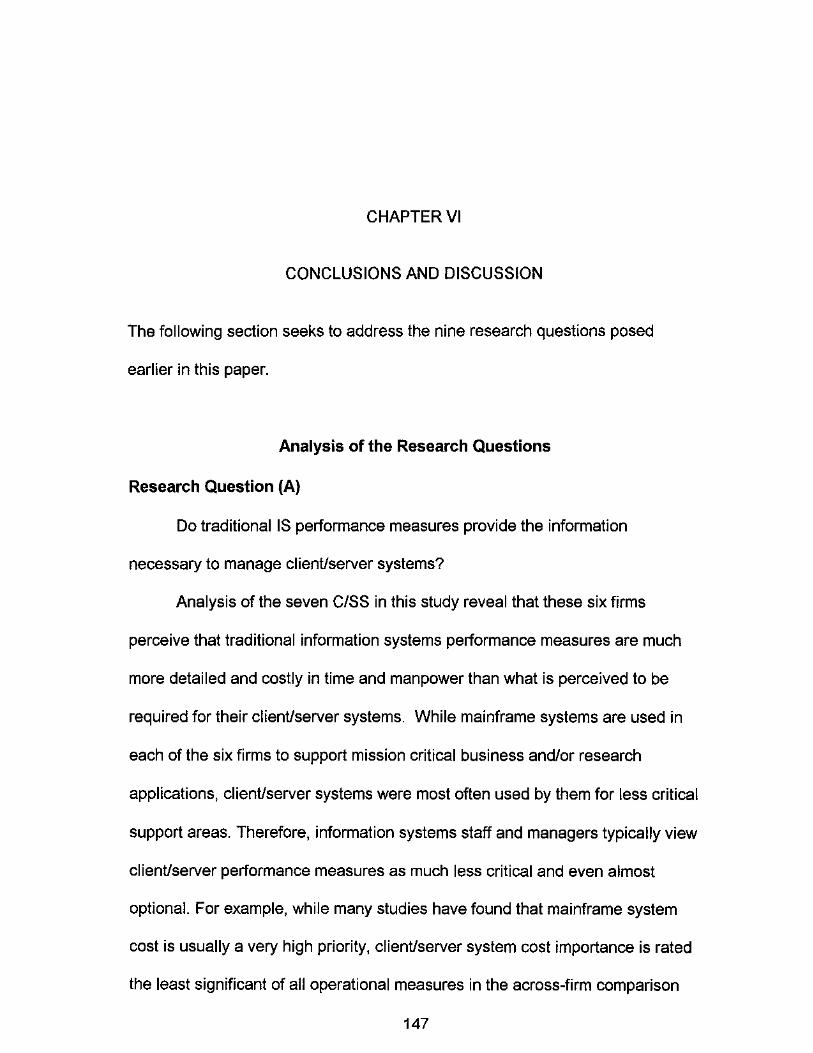
CHAPTER VI
CONCLUSIONS AND DISCUSSION
The following section seeks to address the nine research questions posed
earlier in this paper.
Analysis of the Research Questions
Research Question (A)
Do traditional IS performance measures provide the information
necessary to manage client/server systems?
Analysis of the seven C/SS in this study reveal that these six firms
perceive that traditional information systems performance measures are much
more detailed and costly in time and manpower than what is perceived to be
required for their client/server systems. While mainframe systems are used in
each of the six firms to support mission critical business and/or research
applications, client/server systems were most often used by them for less critical
support areas. Therefore, information systems staff and managers typically view
client/server performance measures as much less critical and even almost
optional. For example, while many studies have found that mainframe system
cost is usually a very high priority, client/server system cost importance is rated
the least significant of all operational measures in the across-firm comparison
147

148
Figure 6.1 Highly Desired and High Performance State of Development
Performance Meaures Total vs. Highly Desired
I I Moderate and Low Desired
I S Highly Desired
B Highly Desired and High Performance
with a perceived score of only 3.9. This suggests that client/server systems cost
is not an important factor despite a Gartner Group estimate (cited in Confrey
1996) that client/server systems can cost three to six times that of mainframe
systems.
Further, results of this study support this lack of critical monitoring
enthusiasm (see Figure 6.1). For example, of the 102 traditional performance
measures evaluated in this study only 32 of them or 31.4% were perceived as
needing to be highly developed. Furthermore, of the 31 measures perceived as
needing to be highly developed only 4 or 12.9% were actually highly developed.
Therefore, managers and IS staff feel they have more than adequate
performance measures to effectively manage in the client/server environment.

149
Research Question (B)
Is there a need for new or additional performance measures to adequately
evaluate client/server systems?
The across-firm averages indicate that system availability, system
response time, data security, and system downtime are listed as performance
measures most frequently used to evaluate, measure, or monitor system
performance. Analysis of the 102 traditional information system performance
measures used in client/server systems found that 16 or 15.7% were considered
to be in the lowest range (below 4). This would indicate that 84.3% of the current
performance measures need little or only moderate improvement. Data from this
study suggest that firms are generally comfortable with a handful of measures.
These are summarized in Table 6.1 and supported by Feigenbaum (1961),
Campanella and Corcoran (1983), Stalk (1988), Drucker (1990) Galloway and
Waldron (1988, 1989), and Johnson (1972, 1975, 1978).
Table 6.1. The multiple dimensions of performance measurement systems.
Quality Time Cost Flexibility
Performance Features Reliability Conformance Technical durability Serviceability Aesthetics Perceived quality Humanity Value
Lead time Rate of production introduction Deliver lead time Due-date performance Frequency of delivery
Manufacturing cost Value added Selling price Running cost Service cost
Material quality Output quality New product Modify product Deliverability Volume Mix Resource mix
Some evidence was found that suggests more detailed measures may be
needed in the systems defect category. For example, follow-up interviews within

150
each firm identified, minimizing system disruptions, as a key factor in the
perceived success of a system. However, most firms report systems disruptions
as a service call, which does not report the severity of the system disruption.
Therefore, system disruptions may need to be measured according to the
severity of disruption. For example, system downtime could be measured as
single station disruptions, single area disruptions (e.g., one office or
department), single server disruptions, and network disruptions. Although this
may indeed be the general practice, no formal measure are usually kept. This
type of monitoring may aid IS managers in better understanding the types of
problems being experienced across the network.
Research Question (C)
How fully do client/server systems meet organizational needs?
Analysis of Table 5.67, reveals that operation measures and performance
measures were perceived as being well below the overall average mean of -0.4
with means deviations of -0.61 and -0.91, respectively. Data from Table 5.66
shows that management of the twenty-nine critical success factors ranked
client/server measurement systems [26] and four others, last. No managers
listed it as a CSF. Furthermore, its gap score, which is the deviation between
desired state of development and current state of development, was the largest
of all twenty-nine CSFs at -1.84. This is a strong indicator that client/server
systems are a very low priority in the overall organization.

151
This finding indicates that companies do not highly depend on C/SS for
mission critical roles. For example, only one of the six firms described their C/SS
as being mission critical. This corresponds with similar results from other
studies. For example, a study conducted by InformationWeek (March 1996) of
225 top IS managers concluded that C/S has failed to live up to expectations,
with only two-fifths of respondents calling the architecture a worthwhile
investment.
This perception is supported by the difference in key performance
measures gap scores. Of the 31 performance measures perceived as requiring
the highest state of development, the average desired level of performance is
perceived to be 6.37. However the current mean gap score 5.22 gives a
difference of -1.15. This difference is 2.875 time higher than the actual overall
current mean gap scores of 0.4.
Therefore, while the overall majority of the performance measures are
within a manageable range, those factors most important to the success of the
company are disproportionately under achieving. This may be a key factor in the
failure of such a large number of C/SS. Therefore, it is not surprising that like
similar research conducted previously, this study finds evidence of mixed
client/server system success. Of the six firms surveyed for this study one, the
medical firm, reported significant dissatisfaction with their C/SS.

152
Research Question (D)
Is there a lack of C/S user requirements?
According to the data collected from the end-users, system access,
normal task system use, learning the system and system value were the top four
"best" factors about their systems. While response time, system speed,
modification abilities, system usability, number of defects, accuracy of
production, and system friendliness were listed as the factors most important to
the success of the system. Client/server systems are seen as an aid to users in
accomplishing their jobs. Therefore, it is critical for IS staff to set realistic
standards for all new C/S architecture. If true end user requirements only exist in
relation to the organization goals and not the user parse, then a more accurate
term "business requirements" should be used. For example, while end users
listed system response time as a top factor in the success of a C/SS, IS staffs
perceived it to be somewhat less important. IS staffs listed ten other
performance measures as being more important than it.
Research Question (E)
What performance measures are used to evaluate client/server system?
The across-firm averages indicated system availability, system response
time, data security, and system downtime as performance measures most
frequently used to evaluate or monitor system performance. All were listed by

153
management, IS staffs and end-users as key system performance measures.
Each is defined below:
Availability: Ratio of the time that a hardware device is known or believed to be operating correctly to the total hours of scheduled operation.
Data Security: Protection of data from accidental or malicious destruction, disclosure, or modification.
Downtime: Length of time a computer system is inoperative due to a malfunction. Contrast with availability and uptime.
Response time: Time it takes the computer system to react to a given input. Interval between an event and the system's response to the event.
For a detailed list of all computer terms please refer to Appendix R pages 206 -210.
Research Question (F)
What criteria do companies use to determine which performance
measurements to collect?
Analysis of the data shows that four broad criteria are used by firms when
determining measurement collection. Firms use time, quality, cost and strategic
goals (see Table 6.1) as the primary criteria for determining which performance
measures to collect. Among end-users and IS staff time measures, downtime,
system availability, disaster recovery time, and utilization, are seen as the most
important performance measures of our studied firms. This conclusion is
supported by another recent study reporting in the October 6,1997
Computerworld. in this study researches found that downtime costs more than

154
$50,000 per hour for 40% of the 1,850 officials surveyed. Of those organizations
similar in size with this study's five largest, costs as much as $1,000,000 per
hour were reported.
Quality measures such as end-user training, consulting, and controls, IS
staffing levels and skills, data accuracy and integrity, system disruptions, and
support issues dominate the second broad criteria. Client/server has risen
rapidly and use new products that often need frequent upgrading. That means
companies have a hard time finding the staff they need and often must retrain
current staff. Therefore, application, hardware, documentation, training, and
staffing remain key concerns of IS management.
While cost only appears directly in Table 6.2 as profitability and overall
cost, almost all of the performance measures have efficiency and effectiveness
at their roots. As firms seek to improve on their performance measures
productivity is increased thereby lowering cost and adding to profitability.
Finally, firms outline, plan, analyze, design, build, test, train, implement,
support, control, maintain, monitor, and upgrade their client/server systems in an
effect to meet strategic goals and objectives.
Research Question (G)
How are organizations performing in terms of collecting and meeting
these performance measures?

155
Previous research has found that client/server systems present problems
because they are often built without standards, without systems management
support, without a central technology organization, without communication links
between departments, and without sufficient user support. None of the firms in
this study reported client/server performance on a par with that of their
mainframe systems. For example, of the firms with both a mainframe and
client/server system, the mainframe was always given priority in security, budget,
and other resources. Furthermore, performance problems with client/server
systems were seen as less important and are often blamed on the user. For
example, Confrey (96) found that performance problems often arise from the
amount of data users try to send across the network, thereby slowing system
response time and speed. This approach is an example of how users get blamed
for the short comings of the network itself. While junk mail and other non-
business related activities are conducted on many organizations networks, the
great majority of network traffic are legitimate business activities.
All the firms in this study reported being satisfied with the amount of
performance measures collected. They felt that they had enough to adequately
monitor their systems. However, the proficiency level varies among measures.
Of the 31 performance measures perceived as requiring the highest state of
development, the average desired level of performance is perceived to be 6.37.
However the current mean gap score is 5.22 representing a difference of -1.15.

156
This difference is 2.88 time higher than the actual overall current mean gap
scores of 0.4.
Therefore, while the overall majority of the performance measures are
within a manageable range, those factors most important to the success of the
company are disproportionately under achieving.
Research Question (H)
Which performance measures are most important for a successful
client/server system?
Table 6.2 ranks those factors identified as most critical to the long term
success by all firms in the study. For a complete listing of the IS staff,
management and end-user ratings, please refer to Tables 5.60, 5.61, 5.62, 5.63,
5.64, 5.65, 5.66, and 5.67.
Research Question (I)
Who is responsible for establishing performance measures?
Analysis of the data found that 100% of the responses of both IS staff and
end-users perceived the responsibility for establishing performance measures
rested with corporate management or other high level staff. Furthermore, none
of the IS staff and end-user respondents felt they had any significant role in
determining which performance measures were collected.
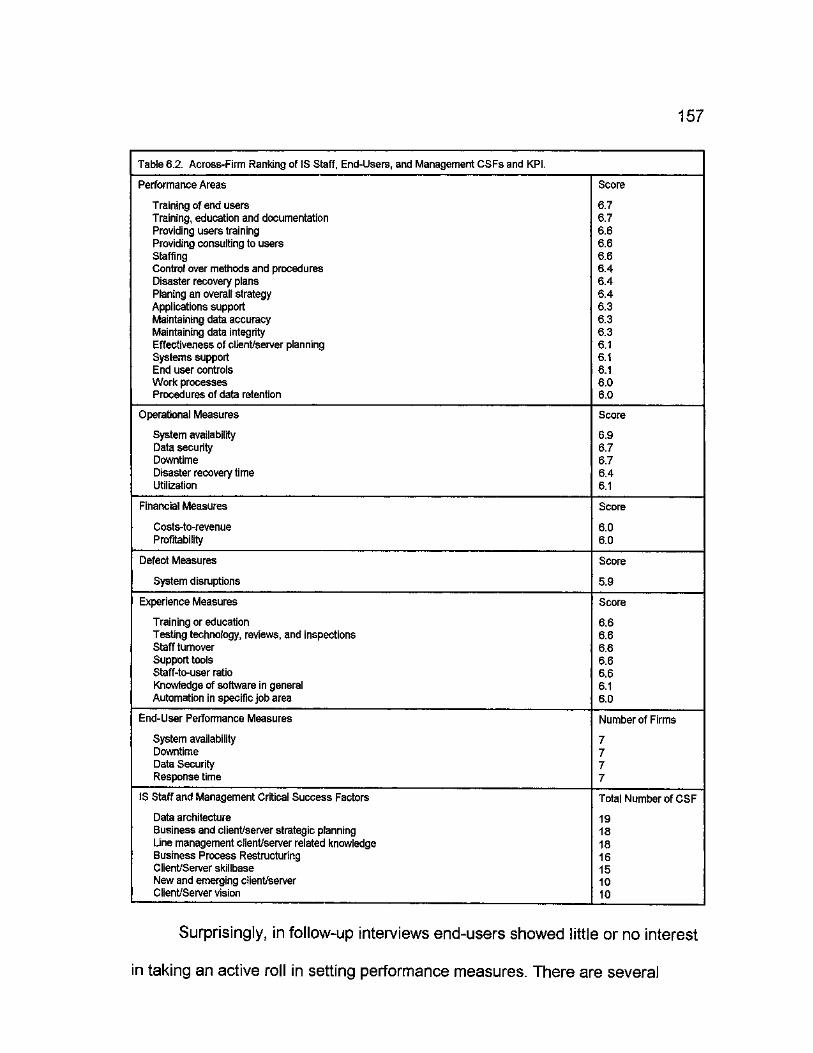
157
Table 6.2. Across-Firm Ranking of IS Staff, End-Users, and Management CSFs and KPI.
Performance Areas Score
Training of end users 6.7 Training, education and documentation 6.7 Providing users training 6.6 Providing consulting to users 6.6 Staffing 6.6 Control over methods and procedures 6.4 Disaster recovery plans 6.4 Planing an overall strategy 6.4 Applications support 6.3 Maintaining data accuracy 6.3 Maintaining data integrity 6.3 Effectiveness of client/server planning 6.1 Systems support 6.1 End user controls 6.1 Work processes 6.0 Procedures of data retention 6.0
Operational Measures Score
System availability 6.9 Data security 6.7 Downtime 6.7 Disaster recovery time 6.4 Utilization 6.1
Financial Measures Score
Costs-to-revenue 6.0 Profitability 6.0
Defect Measures Score
System disruptions 5.9
Experience Measures Score
Training or education 6.6 Testing technology, reviews, and inspections 6.6 Staff turnover 6.6 Support tools 6.6 Staff-to-user ratio 6.6 Knowledge of software in general 6.1 Automation in specific job area 6.0
End-User Performance Measures Number of Firms
System availability 7 Downtime 7 Data Security 7 Response time 7
IS Staff and Management Critical Success Factors Total Number of CSF
Data architecture 19 Business and client/server strategic planning 18 Line management client/server related knowledge 18 Business Process Restructuring 16 Client/Server skilibase 15 New and emerging client/server 10 Client/Server vision 10
Surprisingly, in follow-up interviews end-users showed little or no interest
in taking an active roll in setting performance measures. There are several

158
explanations. First, many of the end-users felt they did not possess enough
knowledge to make a worthwhile contribution. Second, others felt this was not
their responsibility, and had no interest in "doing someone else's job." Third,
some end-users believed their comments would fall on deaf ears. And fourth,
end-users did not like the idea of being monitored or having formal goals set.
Implications for Further Research
While this study has made important progress toward advancing the
understanding the effects of performance evaluation use in client/server system,
researchers are encouraged to investigate these issues further. This research
shows that those measures of performance companies have traditionally used
for traditional computing systems have both positive and negative effects.
Positive Business Effects
1. They are well established with easy to set standards.
2. They focus on a few key performance indicators.
3. They help a firm establish and meet business goals.
4. They monitor each step of the process.
5. They force on periodical evaluation of the system goals
Negative Business Effects
1. They may not be a true predictor of a firm's success
159
2. They encourage short-termism, for example, they seek to justify all capital
investment.
3. They lack strategic focus and do not provide data on strategic goals.
4. They monitor the process instead of the product, for example, they are
seen as not increasing productivity.
5. They encourage managers to minimize the variances from standard rather
than seek to improve continually.
6. They fail to provide information on what is truly important to the long term
success of the firm.
A number of fruitful possibilities exist for extending research in these
areas. In terms of issues that need researching this research has identified the
following as key.
1. The across-firm averages show training as being rated highly desired for
perceived long term success by the IS staff. However, C/S end-users
never list it as being important as a factor for improving the system.
Therefore, do end-users consider themselves part of the computer
system? Are they interested in the time and cognitive investment needed
to become and/or remain both efficient and effective in the rapidly
changing environment of client/server?
2. Are end-users truly interested in developing performance measures which
accurately measures their performance against benchmarks or do they

160
see performance measures as a way "the firm" seeks to control rather
than aid their productivity.
3. Given that most client/server systems are not seen as critical to the firms
success, are increased system disruptions and downtime a reasonable
tradeoff for increased system flexibility and reduced disaster recovery
backup?
4. Is there a myth regarding flexibility in client/server systems? Do today's
firms allow each end-users to use his or her own preferred software and
continue to provide support, as well as insure no negative side-affects?
Once performance standards are established, how are variances for
standard set and appropriate action taken? How can a firm ensure that
corrective action follow measurement?
5. How are the differences in a performance measure's stated importance
and surveyed importance reconciled? For example, during initial and
follow-up interviews, downtime and system response time were stated as
two of the most important client/server performance measures. However,
analysis of the survey data shows downtime was indeed very high (tied
for second with data security), but system response time ranked in the
bottom half at number eleven.
6. Do the costs of some measures outweigh their benefit?
7. Should measures focus on processes, the outputs of processes (product),
or both?

161
8. Is time the fundamental measure of client/server performance?
9. How can strategic goals be measured?
10. How can performance measures be designed so that they encourage
ingenuity?
11. How can conflicts between performance measures be eliminated?
12. What techniques can network managers use to reduce their list of
possible measures to a meaningful set? Would a "generic" performance
measurement system facilitate process? Would a performance
measurement framework facilitate this process?
13. How can the cost-benefit of a performance measurement system be
analyzed?
Performance measures help ensure that client/server systems provide
timely support to end users and that managers have the information they need to
make major, as well and incremental decisions concerning hardware and
software support. But the complexity of the client/server model can be daunting,
and identifying and gathering performance measures must be closely aligned
with a firms strategic goals and objectives. Although reliance on performance
measures must be established across the entire network, monitoring the critical
success factors will help insure a successful system.

162
Chapter Summary
This study has extended what is known about performance evaluation
measures in a client/server system environment through the use of traditional
mainframe performance measures. As noted, firms' client/server performance
evaluations are a low priority among management, which in turn contributes to
the high deviation in desired verses current states of development. This lack of
commitment further suggests a lack of support for IS staffs, leading to high gap
scores in performance, especially in the most critical areas. This further
suggests that with no project champion, the client/server system staff may not be
getting the resources that need to increase performance in operations and other
important areas. Finally, this research suggests that end-users do not consider
themselves to be a integral part of the client/server system, thereby, completing
the organization wide apathy.
These findings may help in understanding the high rate of client/server
system failures. As previously mentioned, many IS mangers perceive
client/server as being overpriced, undervalued, and in general, not a good
investment, thereby leading to the lack of continued investment and commitment.

APPENDIX A
NETWORK MANAGER'S QUESTIONNAIRE COVER LETTER
163

164
NETWORK MANAGER'S QUESTIONNAIRE
May 8,1999
Dear Network Manager:
The Business Computer Information Systems (BCIS) Department at the University of North Texas is conducting a scientific industry assessment of client/server computing evaluation measurements. The BCIS department has as a part of its mission promoted excellence in information technology practice and teaching, and fostered synergistic links between industry and the university.
Please take a few minutes to fill out this questionnaire. If this questionnaire was handed to you, please hand it back to that person after completing all sections. Otherwise return it to us PREFERABLY via FAX or via mail using the enclosed envelope.
On completion of this study, participating companies will have answers to the following issues.
0. Do traditional IS performance measures provide the information necessary to manage in the client-server computing environment? If no, can these traditional measures be adjusted for CS?
1. Is there a need for new or additional performance measures to adequately evaluate client-server systems? If so, what are these new measures, are they cost effective/efficient and how can they be identified?
2. How fully do client-server systems meet organizational needs? 3. Is there a lack of CS user requirements? If so, what impact does it have on system
performance? What are the performance needs of CS users? 4. What performance measures are used to evaluate client-server systems? 5. What criteria do companies use to determine which performance measurements to
collect? 6. How are organizations performing in terms of collecting and meeting these performance
measures? 7. Which performance measures are most important for a successful client-server system?
and 8. Who is responsible for establishing performance measures?
This questionnaire is designed to obtain information important for network managers of client-server systems. The purpose of this study is to better understand the state of client-server computing within industry. The results will yield valuable information that with help managers and executives alike plan and better manage this new IT resource.
You are under no obligation to participate in the study and may withdraw consent at any time. A decision to withdraw from the study will not affect the your employment in any way.
Sincerely,
Dr. John C. Windsor, Chairperson BCIS Dept. Phone: (817)565-3110 Fax: (817) 565-4935 E-mail: [email protected]

APPENDIX B
USE OF HUMAN SUBJECTS INFORMED CONSENT
165

166
Use of Human Subjects Informed Consent
agree to participate in a study of client/server performance measurements conducted by O. Guy Posey and/or John C. Windsor. I have received a clear explanation and understand the nature and survey. I understand that the survey to be performed is investigational and that I may withdraw my consent at any time without prejudice or penalty. I understand no individual or personal information will be released without my express written consent and that only the two researches identified previously in this document will have access to identifying information.
I understand that there are no physical, mental, or social risks anticipated with involvement in this study and that the average time expected to complete the survey is 45 minutes. With my understanding of this, having received this information and satisfactory answers to the questions I have asked, I voluntarily consent to answer the survey questions.
Signature Date
Follow-up Interview
I understand there may be an additional follow-up personal interview conducted which is separate and in addition to the survey. The average time expected per follow-up interview is one hour but could be as long as two hours. I understand that participating in the survey in no way obligates me to participate in the follow-up interview
I agree to participate in any follow-up personal interviews.
I will not be able to participate in any follow-up interviews.
Confidentiality Measures
I wish that my individual responses be shared with my employer and other academic researchers.
I do not want any of my individual responses shared with my employer but may be shared with other academic researchers.
Signature Date
This project has been reviewed and approved by the UNT Committee for the Protection of Human Subjects (817) 565-3940.

APPENDIX C
THE CLIENT/SERVER ASSESSMENT INSTRUMENT
167

168
The CS Assessment Instrument
Please provide the following demographical information. All responses will be kept confidential and will only be used in a summarized form. Before you turn the page in order to identify these critically important competencies, it would be appreciated if you would provide your name and affiliation
Name:
Organization:
Department:
Position:
Demographics: Please Circle the Best Answer to All Questions
1. What is the size of your company in terms of 2. What is the size of your annual annual sales? a. Don't know b. Less than $ 10 million c. $10 to 24.9 million d. 25 to 99.9 million e. $100 to 499.9 million f. $500 to 1 billion g. More than 1 billion
(Specific amount if known
3. How many employees are on your Information Technology Staff (AT YOUR SITE ONLY) a. Don't know b. Less than 5 c. 5 to 9 d. 10 to 24 e. 25 to 49 f. 50 to 99 g. More than 100
(Specific number if known )
5. What is the total number of computers located at your company site (all types)? a. Don't know b. Less than 10 c. 10 to 24 d. 25 to 49 e. 50 to 99 f. 100 to 249 g. 250 to 499 h. More than 500
Information Technology budget? a. Dont know
Less than $49,999 $50,000 to 99,999 $100,000 to 999,999 $1 to 2.99 million $ 3 to 9.99 million
g. More than 10 million (Specific amount if known
b. c. d. e. f.
What is the total number of employees (end-users) located at your site? a. Don't know b. Less than 10 c. 10 to 24 d. 25 to 49 e. 50 to 99 f. 100 to 499 g. 500 to 1000 h. More than 1000
(Specific number if known
(Specific number if known
6. How many networks are located at your site only? a. Don't know b. 1 c. 2 to 4 d. 5 to 9 e. 10 to 24 f. 25 to 50 g. More than 50
(Specific number if known )

169
7. Within your client-server environment, how many "servers" are attached to your network? a. Don't know b. 1 c. 2 to 5 d. 6 to 10 e. 11 to 25 f. More than 25
(Specific number if known
Which of these best describes your job function: a. I/S Management b. Network Management c. Software Development Management d. Corporate/End-user Management e. Technical Services Management f. End-user g. Other
(Specific function_ J
8. Within your client-server environment, how many "clients" are linked to your servers? a. Don't know b. Less than 5 c. 5 to 24 d. 25 to 49 e. 50 to 99 f. 100 to 249 g. More than 250
(Specific number if known )
10. Who is responsibility for establishing client-server performance measures at your location. a. Don't know b. to a large extent myself c. committee of managers &
executives d. decree from corporate
headquarters e. Other
(Specific person J 11. What type of industry describes your 12. How many year of experience do you
company? have in the following areas? a. Agricultural/Mining/Construction a. Client-server computing b. Manufacturing of Computers and b. Network management
Communications c. With current organization c. Other manufacturing d. Current position d. T ransportation/Utilities e. Total years as IS professional e. VARs/Distributors - Computers and
communications f. Wholesale/Retail trade g- Finance/Banking Trade/Insurance/Real
Estate h. Business/Professional
Services/Consulting i. Health care j- Education k. Government I. Other
(Specific industry.
Appendix D
MANAGEMENT PERFORMANCE MEASUREMENT QUESTIONNAIRE
170

171
Management Performance Measurement Questionnaire
Left hand Scale
The following list presents areas in which many companies are trying to improve client/server effectiveness. For each of these areas, circle the number on the left hand scale that indicates your opinion of the relative degree of importance that improvement in this area has for the long-run health of your company. If you feel that improvement in the area is of little or no importance to your company, you should circle the "1" on the left hand scale for that item. If you believe, on the other hand, that improvement in the named area is of very great importance to your company's long-term health, you should circle the "7". When your opinion is that the item is somewhere between the two extremes, you should circle the number that reflects its relative position.
Right Hand Scale
On the right hand scale, circle the number that corresponds to the extent to which you feel current company performance measures support or inhibit improvement in each of these areas.
Performance Areas
Long-Run Importance of Performance Area
Current Performance Level
None > > > > > > Great None > > > > > > Gre
1 2 3 4 5 6 7 Project champions 1 2 3 4 5 6 7 1 2 3 4 5 6 7 Strategic planning 1 2 3 4 5 6 7 1 2 3 4 5 6 7 Administrative support 1 2 3 4 5 6 7 1 2 3 4 5 6 7 Understanding and maintaining data security 1 2 3 4 5 6 7 1 2 3 4 5 6 7 Providing consulting to users 1 2 3 4 5 6 7 1 2 3 4 5 6 7 Providing training to users 1 2 3 4 5 6 7 1 2 3 4 5 6 7 Effectiveness of client/server measurement systems 1 2 3 4 5 6 7 1 2 3 4 5 6 7 Communication costs 1 2 3 4 5 6 7 1 2 3 4 5 6 7 Client/server staff skillbase 1 2 3 4 5 6 7 1 2 3 4 5 6 7 Client/server project management effectiveness 1 2 3 4 5 6 7 1 2 3 4 5 6 7 Adequacy of client/server quality assurance 1 2 3 4 5 6 7 1 2 3 4 5 6 7 Effectiveness of client/server planning 1 2 3 4 5 6 7 1 2 3 4 5 6 7 Strategic MIS plans 1 2 3 4 5 6 7 1 2 3 4 5 6 7 Personnel standards 1 2 3 4 5 6 7 1 2 3 4 5 6 7 Performance appraisal 1 2 3 4 5 6 7 1 2 3 4 5 6 7 Control over methods and procedures 1 2 3 4 5 6 7 1 2 3 4 5 6 7 Control over changes 1 2 3 4 5 6 7 1 2 3 4 5 6 7 Planning an overall strategy 1 2 3 4 5 6 7 1 2 3 4 5 6 7 Staffing 1 2 3 4 5 6 7 1 2 3 4 5 6 7 Training of end users 1 2 3 4 5 6 7 1 2 3 4 5 6 7 End user controls 1 2 3 4 5 6 7

Appendix E
MANAGEMENT PERFORMANCE MEASURES QUESTIONNAIRE
172

173
Performance Measures
Left Hand Scale The following list presents factors by which many companies attempt to evaluate their performance. For each of these client/server "performance measures," circle the number on the left hand scale that indicates your assessment of how important achieving excellence in this factor is for the long-run health of the company.
Right Hand Scale On the right hand scale, circle the number that corresponds to the extent to which you feel the company presently emphasizes measurement of each performance measure.
Importance of Performance Measure
None > > > > > > Great
Operational Measures
1 2 3 4 5 6 7
1 2 3 4 5 6 7
1 2 3 4 5 6 7
1 2 3 4 5 6 7
1 2 3 4 5 6 7
1 2 3 4 5 6 7
Current Performance Level
Weak > > > > > > Strong
Availability
Utilization
Downtime
Functions availability on system
Estimated average costs per activity
Information technology-per-employee
1 2 3 4 5 6 7 Percent of employees with terminals, personal computers 1
1 2 3 4 5 6 7
1 2 3 4 5 6 7
1 2 3 4 5 6 7
1 2 3 4 5 6 7
1 2 3 4 5 6 7
1 2 3 4 5 6 7
1 2 3 4 5 6 7
1 2 3 4 5 6 7
1 2 3 4 5 6 7
1 2 3 4 5 6 7
1 2 3 4 5 6 7
1 2 3 4 5 6 7
Employees-per workstation
Business value-added
Disaster recovery time
Physical security
Data security
Productivity rates per IS staff
Productivity rates per user (user hours/output)
Productivity rates per software application
Tools and methodologies productivity rate
System response time
Job and report turnaround and delivery time
System availability
1 2 3 4 5 6 7 Management productivity (physical output per capita)
1 2 3 4 5 6 7 Increase (decrease) in system cost
2 3 4
2 3 4
2 3 4
2 3 4
2 3 4
2 3 4
2 3 4
2 3 4
2 3 4
2 3 4
2 3 4
2 3 4
2 3 4
2 3 4
2 3 4
2 3 4
2 3 4
2 3 4
2 3 4
2 3 4
2 3 4
5 6 7
5 6 7
5 6 7
5 6 7
5 6 7
5 6 7
5 6 7
5 6 7
5 6 7
5 6 7
5 6 7
5 6 7
5 6 7
5 6 7
5 6 7
5 6 7
5 6 7
5 6 7
5 6 7
5 6 7
5 6 7

174
Financial
1 2 3 4 5 6 7 Revenue-per-employee 1 2 3 4 5 6 7
1 2 3 4 5 6 7 Information technology-to-revenue ratio 1 2 3 4 5 6 7
1 2 3 4 5 6 7 Revenue-per-employee 1 2 3 4 5 6 7
1 2 3 4 5 6 7 Expense-per-employee 1 2 3 4 5 6 7
1 2 3 4 5 6 7 Profit-per-employee 1 2 3 4 5 6 7
1 2 3 4 5 6 7 Information technology expense-per-employee 1 2 3 4 5 6 7
1 2 3 4 5 6 7 Costs-to-revenue 1 2 3 4 5 6 7
1 2 3 4 5 6 7 Profitability during the past five years 1 2 3 4 5 6 7
1 2 3 4 5 6 7 Percent of total budget spent on training 1 2 3 4 5 6 7
1 2 3 4 5 6 7 Return-on-assets 1 2 3 4 5 6 7
1 2 3 4 5 6 7 Return-on-investment (ROI) 1 2 3 4 5 6 7
1 2 3 4 5 6 7 Retum-on-equity (ROE) 1 2 3 4 5 6 7
1 2 3 4 5 6 7 Return-on-sales (ROS) 1 2 3 4 5 6 7
1 2 3 4 5 6 7 Earnings-per-share 1 2 3 4 5 6 7
1 2 3 4 5 6 7 Information technology spending 1 2 3 4 5 6 7
1 2 3 4 5 6 7 Profitability 1 2 3 4 5 6 7
1 2 3 4 5 6 7 Management cost (everything not operations) 1 2 3 4 5 6 7
1 2 3 4 5 6 7 Operations costs (resources essential for serving users) 1 2 3 4 5 6 7
1 2 3 4 5 6 7 Management productivity 1 2 3 4 5 6 7
1 2 3 4 5 6 7 Personal productivity 1 2 3 4 5 6 7
1 2 3 4 5 6 7 Net value-added (Outputs) 1 2 3 4 5 6 7
1 2 3 4 5 6 7 Labor cost 1 2 3 4 5 6 7
1 2 3 4 5 6 7 Runaways 1 2 3 4 5 6 7
1 2 3 4 5 6 7 Cost of supplies 1 2 3 4 5 6 7
1 2 3 4 5 6 7 Data entry costs 1 2 3 4 5 6 7
Defect I Measures
1 2 3 4 5 6 7 Overall defect total 1 2 3 4 5 6 7
1 2 3 4 5 6 7 Defect levels or reported 1 2 3 4 5 6 7
1 2 3 4 5 6 7 Defect origins 1 2 3 4 5 6 7
1 2 3 4 5 6 7 Defect severity & scope 1 2 3 4 5 6 7 1 2 3 4 5 6 7 Defect removal efficiency 1 2 3 4 5 6 7 1 2 3 4 5 6 7 System disruptions 1 2 3 4 5 6 7 1 2 3 4 5 6 7 Number of operating system restarts 1 2 3 4 5 6 7

APPENDIX F
MANAGEMENT CRITICAL SUCCESS FACTORS QUESTIONNAIRE
175

176
I. Critical Success Factors
Your Organization's Most Critical Client-Server Management Success Factors Please identify those competencies which you feel are most critical in enabling your organization to
effectively apply information technology in support of its business strategies and operation. We recognize that you may believe that many, if not most, of the preceding competencies are important. However, for any activity, there are a limited number of actions that must be performed well if success with the activity is necessarily to occur.
Each of the 29 competencies is listed below. Carefully read over all 29. Then, if you believe a competency is a critical success factor for your organization, circle the "CSF" which precedes the competency. Limit yourself to identifying at most 10 competencies as being CSFs for your organization.
Critical Success Factors (CSF)
CSF 1. Propensity of Employees throughout the Organization to Learn and Subsequently Explore the
Functionality of Installed C/S Tools and Applications
CSF 2. Restructuring of Business Processes, Where Appropriate, throughout the Organization
CSF 3. Line Managers' Ownership of C/S Projects within Their Domains of Business Responsibility
CSF 4. Restructuring of C/S Work Processes, Where Appropriate
CSF 5. Propensity of Employees throughout the Organization to Serve as "Project Champions"
CSF 6. Integration of Business Strategic Planning and C/S Strategic Planning
CSF 7. Examination of the Potential Business Value of New, Emerging C/S
CSF 8. Utilization of Multidisciplinary Teams throughout the Organization
CSF 9. Appropriateness of C/S Data Architectures
CSF 10. Appropriateness of C/S Network Architectures
CSF 11. Appropriateness of C/S Processor Architectures
CSF 12. Existence of Electronic Linkages with the Organization's Customers
CSF 13. Existence of Electronic Linkages with the Organization's Suppliers
CSF 14. Collaborative Alliances with External Partners (vendors, systems integrators, competitors,
etc.) to Develop C/S-based Products and Processes
CSF 15. Effective Working Relationships among Line Management and IS Staff
CSF 16. Technology Transfer, Where Appropriate, of Successful CS Applications, Platforms and
Services
CSF 17. Visualizing Organizational Activities throughout the Organization
CSF 18. Adequacy of the C/S-Related Knowledge of Line Managers throughout the Organization
CSF 19. Knowledge of and Adequacy of the Organization's C/S Skillbase
CSF 20. Visualizing the Value of C/S Investments throughout the Organization
CSF 21. Appropriateness of C/S Policies
CSF 22. Clarity of Visions Regarding How C/S Contributes to Business Value
CSF 23. Appropriateness of C/S Sourcing Decisions
CSF 24. Consistency of Object (Data, Processes, Rules, etc.) Definitions
CSF 25. Effectiveness of C/S Planning throughout the Organization
CSF 26. Effectiveness of C/S Measurement Systems
CSF 27. Effectiveness of C/S Software Development Practices
CSF 28. Effectiveness of C/S Project Management Practices
CSF 29. Adequacy of C/S Quality Assurance and Security Controls

APPENDIX G
SYSTEM CAPABILITIES: IMPORTANCE VERSUS PERFORMANCE
177

178
IV. System Capabilities: Importance versus Performance
Left Hand Scale: The following list presents factors by which many companies attempt to evaluate their performance. For each of these client/server "management capabilities," circle the number on the left hand scale that indicates your assessment of how important achieving excellence in this factor is for the long-run health of the company.
Right Hand Scale: On the right hand scale, circle the number that corresponds to the extent to which you feel the company presently emphasizes measurement of each performance measure.
None > > > > > > Great Weak > > > > > > Strong
Importance Management Capabilities Current Performance
1 2 3 4 5 6 7 A climate nurturing project championship 1 2 3 4 5 6 7
1 2 3 4 5 6 7 Technology-based links with customers 1 2 3 4 5 6 7
1 2 3 4 5 6 7 Adequacy of the client/server skillbase 1 2 3 4 5 6 7
1 2 3 4 5 6 7 Appropriateness of the data architecture 1 2 3 4 5 6 7
1 2 3 4 5 6 7 A climate encouraging risk-taking and experimentation 1 2 3 4 5 6 7
1 2 3 4 5 6 7 Effectiveness of client/server planning 1 2 3 4 5 6 7
1 2 3 4 5 6 7 Adequacy of client/server project management practices 1 2 3 4 5 6 7
1 2 3 4 5 6 7 Line management sponsorship of client/server initiatives 1 2 3 4 5 6 7
1 2 3 4 5 6 7 Consistency of client/server application portfolios with business processes 1 2 3 4 5 6 7
1 2 3 4 5 6 7 Client/server based entrepreneurial collaborations with external partners 1 2 3 4 5 6 7
1 2 3 4 5 6 7 Clarity and consistency of vision regarding how client/server contributes to business value 1 2 3 4 5 6 7
1 2 3 4 5 6 7 Technology-based links with suppliers 1 2 3 4 5 6 7
1 2 3 4 5 6 7 Integration of business strategic planning with client/server strategic planning 1 2 3 4 5 6 7
1 2 3 4 5 6 7 Adequacy of client/server related educational initiatives for management 1 2 3 4 5 6 7
1 2 3 4 5 6 7 Restructuring of business work processes to leverage opportunities 1 2 3 4 5 6 7
1 2 3 4 5 6 7 Efficiency and reliability of client/server operations 1 2 3 4 5 6 7
1 2 3 4 5 6 7 Management ability to understand the value of client/server investment 1 2 3 4 5 6 7
1 2 3 4 5 6 7 Adequacy of planning for security controls, standards compliance, and disaster recovery 1 2 3 4 5 6 7
1 2 3 4 5 6 7 Utilization of multidisciplinary teams to blend business and technology expertise 1 2 3 4 5 6 7
1 2 3 4 5 6 7 Appropriateness of network architectures 1 2 3 4 5 6 7
1 2 3 4 5 6 7 Effectiveness of working relationships among line management, and their CS service providers
1 2 3 4 5 6 7
1 2 3 4 5 6 7 Adequacy of processing capabilities 1 2 3 4 5 6 7
1 2 3 4 5 6 7 Adequacy of architectural flexibility (openness to changes in standards and technologies) 1 2 3 4 5 6 7
1 2 3 4 5 6 7 Restructuring of CS work processes to meet new technologies and new business opportunities
1 2 3 4 5 6 7
1 2 3 4 5 6 7 Adequacy of systems development practices 1 2 3 4 5 6 7

179
1 2 3 4 5 6 7 Clarity and consistency of client/server policies throughout the enterprise 1 2 3 4 5 6 7
1 2 3 45 6 7 Adequacy of funding for scanning, experimenting with, and pilot-testing "next generation" CS 1 23 45 6 7
1 2 3 45 6 7 Adequacy of technology-transfer mechanisms 1 23 4 56 7
1 2 3 45 6 7 Effectiveness of client/server evaluation and control systems 1 23 45 6 7
1 2 3 45 6 7 Leveraging of external resources (vendors, consultants, and third-party service providers) 1 2 3 45 6 7

APPENDIX H
FIRM PERFORMANCE IN APPLYING CLIENT-SERVER IN PURSUIT OF BUSINESS STRATEGIES AND IN SUPPORT OF BUSINESS ACTIVITIES
180
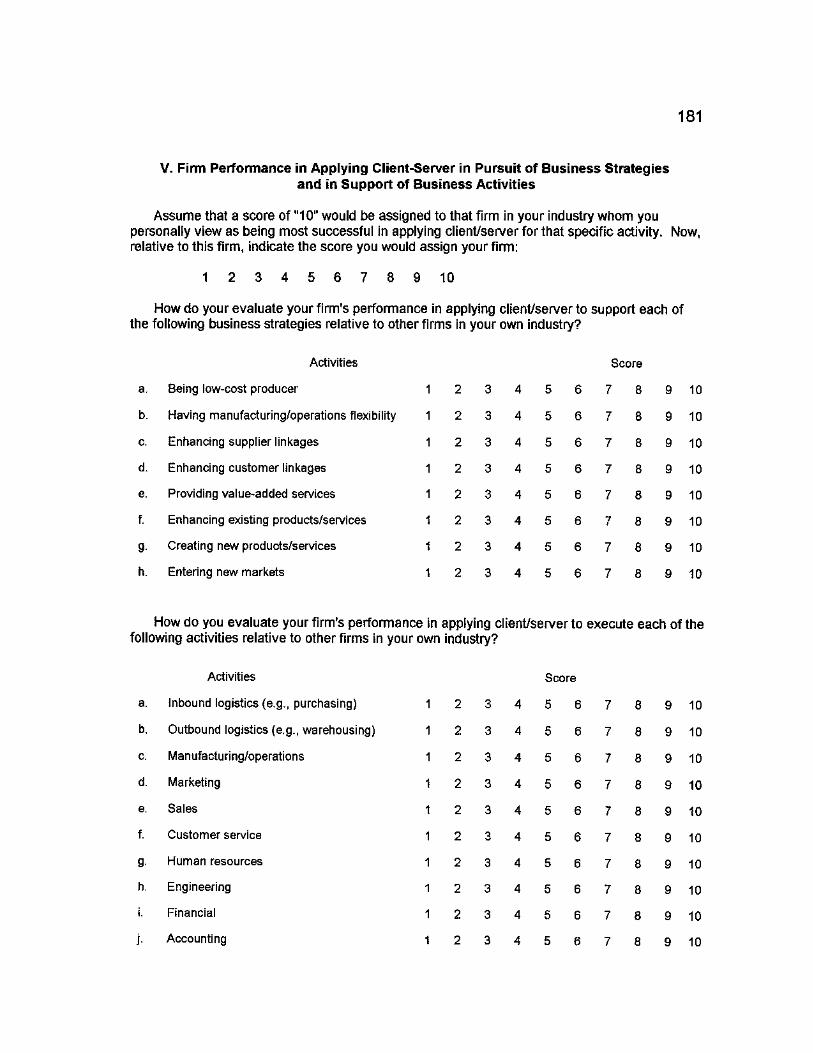
181
V. Firm Performance in Applying Client-Server in Pursuit of Business Strategies and in Support of Business Activities
Assume that a score of "10" would be assigned to that firm in your industry whom you personally view as being most successful in applying client/server for that specific activity. Now, relative to this firm, indicate the score you would assign your firm:
1 2 3 4 5 6 7 8 9 10
How do your evaluate your firm's performance in applying client/server to support each of the following business strategies relative to other firms in your own industry?
Activities Score
a. Being low-cost producer 1 2 3 4 5 6 7 8 9 10
b. Having manufacturing/operations flexibility 1 2 3 4 5 6 7 8 9 10
c. Enhancing supplier linkages 1 2 3 4 5 6 7 8 9 10
d. Enhancing customer linkages 1 2 3 4 5 6 7 8 9 10
e. Providing value-added services 1 2 3 4 5 6 7 8 9 10
f. Enhancing existing products/services 1 2 3 4 5 6 7 8 9 10
g- Creating new products/services 1 2 3 4 5 6 7 8 9 10
h. Entering new markets 1 2 3 4 5 6 7 8 9 10
How do you evaluate your firm's performance in applying client/server to execute each of the following activities relative to other firms in your own industry?
Activities Score
a. Inbound logistics (e.g., purchasing) 1 2 3 4 5 6 7 8 9 10
b. Outbound logistics (e.g., warehousing) 1 2 3 4 5 6 7 8 9 10
c. Manufacturing/operations 1 2 3 4 5 6 7 8 9 10
d. Marketing 1 2 3 4 5 6 7 8 9 10
e. Sales 1 2 3 4 5 6 7 8 9 10
f. Customer service 1 2 3 4 5 6 7 8 9 10
g- Human resources 1 2 3 4 5 6 7 8 9 10
h. Engineering 1 2 3 4 5 6 7 8 9 10
i. Financial 1 2 3 4 5 6 7 8 9 10
j- Accounting 1 2 3 4 5 6 7 8 9 10

APPENDIX I
INNOVATIVENESS IN APPLYING SPECIFIC IT
182

183
VI. Innovativeness in Applying Specific IT
Firms typically follow one of the four strategies listed below for adopting or investing in new information technologies:
Innovator Among the first to recognize the potential of leading edge information technologies, aggressively invest in such technologies, and experiment with these technologies for strategic advantage; willing to incur considerable technological risk in return for possible competitive gains due to early introduction of new technology applications.
Early imitator Track the efforts of innovators and invest in information technologies that exhibit strategic potential; willing to incur moderate amounts of technological risk.
Mid-cycle Wait for an information technology to be proven before investing in that imitator technology; willing to tolerate minor technological risks.
Late entrant Invest in new information technology only when that technology becomes a strategic necessity in its business; prefer to bear little or no technological risks.
For each of the information technologies listed below, please circle that term which best describes your firm's strategy relative to other firms in your industry: I - innovator, E - early imitator, M - mid-cycle imitator, L - late entrant
Information Technology Strategies
a. Client/server computing I E M
b. Imaging I E M
c. CASE I E M
d. EDI I E M
e Graphical use interface I E M
f. Neural networks I E M
g- Hypertext/hypermedia I E M
h. Relational databases I E M
i. LANS I E M
j- Object-oriented databases I E M

APPENDIX J
DIFFUSION OF SPECIFIC CS THROUGHOUT A FIRM'S CLIENT-SEVER INFRASTRUCTURE
184

185
VII. Diffusion of Specific CS throughout a Firm's Client-Sever Infrastructure
The number below indicate percentages. Please circle the appropriate percentage for each of the following: 0 10 20 30 40 50 60 70 80 90 100%
a. Enterprise data maintained within client/server database management systems
0 10 20 30 40 50 60 70 80 90 100%
b. Applications developed by IS staff for client/server systems:
0 10 20 30 40 50 60 70 80 90 100%
c. Microcomputers linked by LANs
0 10 20 30 40 50 60 70 80 90 100%
d. Documents maintained using servers
0 10 20 30 40 50 60 70 80 90 100%
e. Business transactions conducted using LAN/client-server systems
0 10 20 30 40 50 60 70 80 90 100%

APPENDIX K
PERFORMANCE MEASURES (CSF LIST)
186

187
VIII. Performance Measures (CSF) Instructions
Experts have suggested that for each Critical Success Factor (CSF) an organizations should have a set of performance measurements that help facilitate successful management.
For each area below, please list those performance measures you feel are most critical in enabling your organization to effectively manage client/server technology in support of its business strategies and operation. In order of importance (most important first), identify at most 5 performance measures (actual or desired) for each area below.
Performance Measures
1. Operation Measures 2. Software Measures
a. a.
b. b.
c. c.
d. d.
e. e.
3. Staff Experience Measures 4. Security Measures
a. a.
b. b.
c. c.
d. d.
e. e.
5.Productivity Measures 6. Financial Measures
a. a.
b. b.
c. c.
d. d.
e. e.
7. Defect Measures 8. Other and Miscellaneous Measures
a. a.
b. b.
c. c.
d. d.
e. e

APPENDIX L
INFORMATION SYSTEMS STAFF QUESTIONNAIRE
188
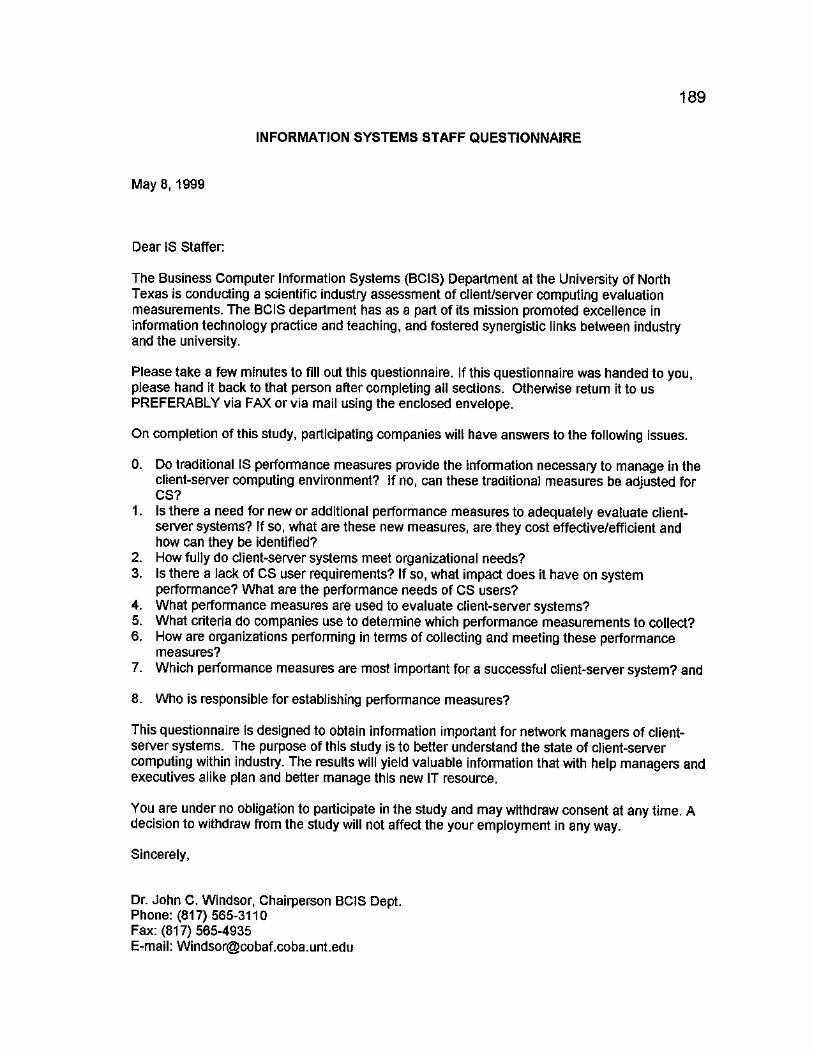
189
INFORMATION SYSTEMS STAFF QUESTIONNAIRE
May 8,1999
Dear IS Staffer:
The Business Computer Information Systems (BCIS) Department at the University of North Texas is conducting a scientific industry assessment of client/server computing evaluation measurements. The BCIS department has as a part of its mission promoted excellence in information technology practice and teaching, and fostered synergistic links between industry and the university.
Please take a few minutes to fill out this questionnaire. If this questionnaire was handed to you, please hand it back to that person after completing all sections. Otherwise return it to us PREFERABLY via FAX or via mail using the enclosed envelope.
On completion of this study, participating companies will have answers to the following issues.
0. Do traditional IS performance measures provide the information necessary to manage in the client-server computing environment? If no, can these traditional measures be adjusted for CS?
1. Is there a need for new or additional performance measures to adequately evaluate client-server systems? If so, what are these new measures, are they cost effective/efficient and how can they be identified?
2. How fully do client-server systems meet organizational needs? 3. Is there a lack of CS user requirements? If so, what impact does it have on system
performance? What are the performance needs of CS users? 4. What performance measures are used to evaluate client-server systems? 5. What criteria do companies use to determine which performance measurements to collect? 6. How are organizations performing in terms of collecting and meeting these performance
measures? 7. Which performance measures are most important for a successful client-server system? and
8. Who is responsible for establishing performance measures?
This questionnaire is designed to obtain information important for network managers of client-server systems. The purpose of this study is to better understand the state of client-server computing within industry. The results will yield valuable information that with help managers and executives alike plan and better manage this new IT resource.
You are under no obligation to participate in the study and may withdraw consent at any time. A decision to withdraw from the study will not affect the your employment in any way.
Sincerely,
Dr. John C. Windsor, Chairperson BCIS Dept. Phone: (817) 565-3110 Fax: (817) 565-4935 E-mail: [email protected]

APPENDIX M
STAFF PERFORMANCE MEASUREMENT QUESTIONNAIRE
190
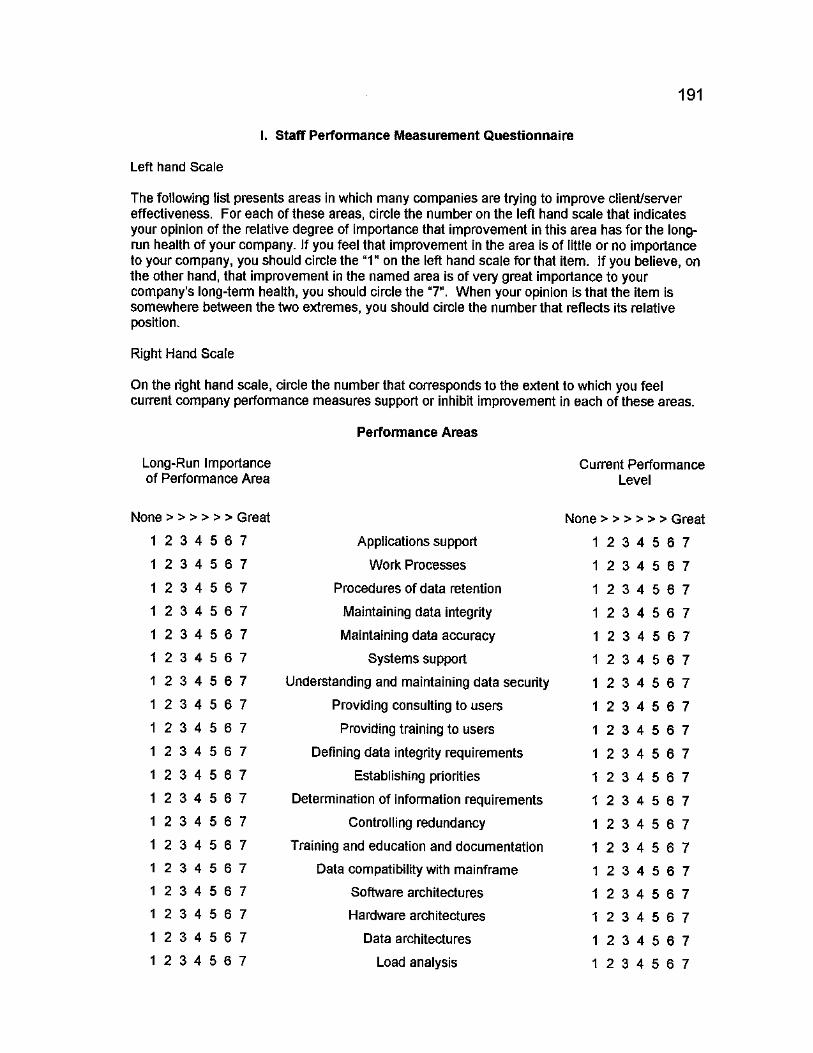
191
I. Staff Performance Measurement Questionnaire
Left hand Scale
The following list presents areas in which many companies are trying to improve client/server effectiveness. For each of these areas, circle the number on the left hand scale that indicates your opinion of the relative degree of importance that improvement in this area has for the long-run health of your company. If you feel that improvement in the area is of little or no importance to your company, you should circle the "1" on the left hand scale for that item. If you believe, on the other hand, that improvement in the named area is of very great importance to your company's long-term health, you should circle the "7". When your opinion is that the item is somewhere between the two extremes, you should circle the number that reflects its relative position.
Right Hand Scale
On the right hand scale, circle the number that corresponds to the extent to which you feel current company performance measures support or inhibit improvement in each of these areas.
Long-Run Importance of Performance Area
Performance Areas
Current Performance Level
None > > > > > > Great
1 2 3 4 5 6 7
1 2 3 4 5 6 7
1 2 3 4 5 6 7
1 2 3 4 5 6 7
1 2 3 4 5 6 7
1 2 3 4 5 6 7
1 2 3 4 5 6 7
1 2 3 4 5 6 7
1 2 3 4 5 6 7
1 2 3 4 5 6 7
1 2 3 4 5 6 7
1 2 3 4 5 6 7
1 2 3 4 5 6 7
1 2 3 4 5 6 7
1 2 3 4 5 6 7
1 2 3 4 5 6 7
1 2 3 4 5 6 7
1 2 3 4 5 6 7
1 2 3 4 5 6 7
None > > > > > > Great
Applications support 1 2 3 4 5 6 7
Work Processes 1 2 3 4 5 6 7
Procedures of data retention 1 2 3 4 5 6 7
Maintaining data integrity 1 2 3 4 5 6 7
Maintaining data accuracy 1 2 3 4 5 6 7
Systems support 1 2 3 4 5 6 7
Understanding and maintaining data security 1 2 3 4 5 6 7
Providing consulting to users 1 2 3 4 5 6 7
Providing training to users 1 2 3 4 5 6 7
Defining data integrity requirements 1 2 3 4 5 6 7
Establishing priorities 1 2 3 4 5 6 7
Determination of information requirements 1 2 3 4 5 6 7
Controlling redundancy 1 2 3 4 5 6 7
Training and education and documentation 1 2 3 4 5 6 7
Data compatibility with mainframe 1 2 3 4 5 6 7
Software architectures 1 2 3 4 5 6 7
Hardware architectures 1 2 3 4 5 6 7
Data architectures 1 2 3 4 5 6 7
Load analysis 1 2 3 4 5 6 7

192
1 2 3 4 5 6 7 Capacity planning 1 2 3 4 5 6 7
1 2 3 4 5 6 7 Elapsed time 1 2 3 4 5 6 7
1 2 3 4 5 6 7 Client/server project management effectiveness 1 2 3 4 5 6 7
1 2 3 4 5 6 7 Client/server staff skillbase 1 2 3 4 5 6 7
1 2 3 4 5 6 7 Control over changes 1 2 3 4 5 6 7
1 2 3 4 5 6 7 Adequacy of client/server quality assurance 1 2 3 4 5 6 7 1 2 3 4 5 6 7 Effectiveness of client/server planning 1 2 3 4 5 6 7 1 2 3 4 5 6 7 Performance appraisal 1 2 3 4 5 6 7
1 2 3 4 5 6 7 Data communications and networking controls 1 2 3 4 5 6 7
1 2 3 4 5 6 7 Disaster recovery plans 1 2 3 4 5 6 7
1 2 3 4 5 6 7 Control over methods and procedures 1 2 3 4 5 6 7
1 2 3 4 5 6 7 Control over access to data 1 2 3 4 5 6 7 1 2 3 4 5 6 7 Control over computer maintenance 1 2 3 4 5 6 7 1 2 3 4 5 6 7 Control over access to data 1 2 3 4 5 6 7 1 2 3 4 5 6 7 Security controls 1 2 3 4 5 6 7 1 2 3 4 5 6 7 Physical assess controls 1 2 3 4 5 6 7 1 2 3 4 5 6 7 Client/server staff skillbase 1 2 3 4 5 6 7 1 2 3 4 5 6 7 Fire protection 1 2 3 4 5 6 7 1 2 3 4 5 6 7 Media protection 1 2 3 4 5 6 7 1 2 3 4 5 6 7 Physical assess controls 1 2 3 4 5 6 7 1 2 3 4 5 6 7 Planning an overall strategy 1 2 3 4 5 6 7 1 2 3 4 5 6 7 Staffing 1 2 3 4 5 6 7 1 2 3 4 5 6 7 Training of end users 1 2 3 4 5 6 7 1 2 3 4 5 6 7 Input controls 1 2 3 4 5 6 7 1 2 3 4 5 6 7 Processing controls 1 2 3 4 5 6 7 1 2 3 4 5 6 7 End user controls 1 2 3 4 5 6 7
APPENDIX N
INFORMATION SYSTEM STAFF PERFORMANCE MEASURES
193

194
IS Staff Performance Measures
Left Hand Scale The following list presents factors by which many companies attempt to evaluate their performance. For each of these client/server "performance measures," circle the number on the left hand scale that indicates your assessment of how important achieving excellence in this factor is for the long-run health of the company.
Right Hand Scale On the right hand scale, circle the number that corresponds to the extent to which you feel the company presently emphasizes measurement of each performance measure.
Importance of Performance Measure
Current Performance Level
None > > > > >
1 2 3 4 5
1 2 3 4 5
1 2 3 4 5
1 2 3 4 5
1 2 3 4 5
1 2 3 4 5
1 2 3 4 5
1 2 3 4 5
1 2 3 4 5
1 2 3 4 5
1 2 3 4 5
1 2 3 4 5
1 2 3 4 5
1 2 3 4 5
1 2 3 4 5
1 2 3 4 5
1 2 3 4 5
1 2 3 4 5
> Great
6 7 System availability
6 7 Average time allocated to activity
6 7 Rate of workload increase
6 7 Maintenance hours
6 7 Maintenance cost
6 7 Maintenance ratio
6 7 Computer processing cost
6 7 Unit labor cost
6 7 Unit processing cost
6 7 Total unit cost
6 7 Runaways
6 7 Overall defect total
6 7 Defect levels or reported
6 7 Defect origins
6 7 Defect severity & scope
6 7 Defect removal efficiency
6 7 System disruptions
6 7 Number of operating system restarts
Weak > > > > > > Strong
1 2 3 4 5 6 7
1 2 3 4 5 6 7
1 2 3 4 5 6 7
1 2 3 4 5 6 7
1 2 3 4 5 6 7
1 2 3 4 5 6 7
1 2 3 4 5 6 7
1 2 3 4 5 6 7
1 2 3 4 5 6 7
1 2 3 4 5 6 7
1 2 3 4 5 6 7
1 2 3 4 5 6 7
1 2 3 4 5 6 7
1 2 3 4 5 6 7
1 2 3 4 5 6 7
1 2 3 4 5 6 7
1 2 3 4 5 6 7
1 2 3 4 5 6 7
Staff Experience Measures
1 2 3 4 5 6 7 Staff years 1 2 3 4 5 6 7 1 2 3 4 5 6 7 Applications areas 1 2 3 4 5 6 7 1 2 3 4 5 6 7 Programming languages 1 2 3 4 5 6 7 1 2 3 4 5 6 7 Support tools 1 2 3 4 5 6 7 1 2 3 4 5 6 7 Computer hardware development 1 2 3 4 5 6 7 1 2 3 4 5 6 7 Training or education 1 2 3 4 5 6 7 1 2 3 4 5 6 7 Testing techniques reviews and inspections 1 2 3 4 5 6 7

195
1 2 3 4 5 6 7 Analysis and design 1 2 3 4 5 6 7
1 2 3 4 5 6 7 Software in general 1 2 3 4 5 6 7
1 2 3 4 5 6 7 Automation in his specific job area 1 2 3 4 5 6 7
1 2 3 4 5 6 7 Participation in client/server projects 1 2 3 4 5 6 7
1 2 3 4 5 6 7 Staff turnover 1 2 3 4 5 6 7
1 2 3 4 5 6 7 Staff/application ratio 1 2 3 4 5 6 7
1 2 3 4 5 6 7 Staff/user ratio 1 2 3 4 5 6 7
Staff Performance Areas
1 2 3 4 5 6 7 Availability 1 2 3 4 5 6 7
1 2 3 4 5 6 7 Utilization 1 2 3 4 5 6 7
1 2 3 4 5 6 7 Downtime 1 2 3 4 5 6 7
1 2 3 4 5 6 7 Response times for development staff 1 2 3 4 5 6 7
1 2 3 4 5 6 7 Network capacity 1 2 3 4 5 6 7
1 2 3 4 5 6 7 Data storage volumes 1 2 3 4 5 6 7
1 2 3 4 5 6 7 Data storage access 1 2 3 4 5 6 7
1 2 3 4 5 6 7 Telecommunications traffic 1 2 3 4 5 6 7
1 2 3 4 5 6 7 Availability of workstations or terminals 1 2 3 4 5 6 7
1 2 3 4 5 6 7 Availability of support tools 1 2 3 4 5 6 7
1 2 3 4 5 6 7 Throughput 1 2 3 4 5 6 7
1 2 3 4 5 6 7 Functions availability on system 1 2 3 4 5 6 7
1 2 3 4 5 6 7 Data center operating hours 1 2 3 4 5 6 7
1 2 3 4 5 6 7 Estimated average costs per activity 1 2 3 4 5 6 7
1 2 3 4 5 6 7 Disaster recovery time 1 2 3 4 5 6 7
1 2 3 4 5 6 7 Physical security 1 2 3 4 5 6 7
1 2 3 4 5 6 7 Data security 1 2 3 4 5 6 7 1 2 3 4 5 6 7 Productivity rates per IS staff 1 2 3 4 5 6 7
1 2 3 4 5 6 7 Productivity rates per user (user hours/output) 1 2 3 4 5 6 7
1 2 3 4 5 6 7 Productivity rates per software application 1 2 3 4 5 6 7
1 2 3 4 5 6 7 Tools and methodologies productivity rate 1 2 3 4 5 6 7
1 2 3 4 5 6 7 CPU use 1 2 3 4 5 6 7 1 2 3 4 5 6 7 CPU capacity 1 2 3 4 5 6 7
1 2 3 4 5 6 7 Disk use 1 2 3 4 5 6 7 1 2 3 4 5 6 7 Disk capacity 1 2 3 4 5 6 7 1 2 3 4 5 6 7 Transaction volume 1 2 3 4 5 6 7 1 2 3 4 5 6 7 Transaction capacity 1 2 3 4 5 6 7 1 2 3 4 5 6 7 System response time 1 2 3 4 5 6 7 1 2 3 4 5 6 7 Job and report turnaround and delivery time 1 2 3 4 5 6 7 1 2 3 4 5 6 7 System availability 1 2 3 4 5 6 7

196
1 2 3 4 5 6 7 Average time allocated to activity 1 2 3 4 5 6 7
1 2 3 4 5 6 7 Rate of workload increase 1 2 3 4 5 6 7
1 2 3 4 5 6 7 Management productivity (physical output per capita) 1 2 3 4 5 6 7

APPENDIX 0
END-USER QUESTIONNAIRE
197

198
END-USER QUESTIONNAIRE
May 8,1999
Dear Computer User:
The Business Computer Information Systems (BCIS) Department at the University of North Texas is conducting a scientific industry assessment of client/server computing evaluation measurements. The BCIS department has as a part of its mission promoted excellence in information technology practice and teaching, and fostered synergistic links between industry and the university.
Please take a few minutes to fill out this questionnaire. If this questionnaire was handed to you, please hand it back to that person after completing all sections. Otherwise return it to us PREFERABLY via FAX or via mail using the enclosed envelope.
On completion of this study, participating companies will have answers to the following issues.
0. Do traditional IS performance measures provide the information necessary to manage in the client-server computing environment? If no, can these traditional measures be adjusted for CS?
1. Is there a need for new or additional performance measures to adequately evaluate client-server systems? If so, what are these new measures, are they cost effective/efficient and how can they be identified?
2. How fully do client-server systems meet organizational needs? 3. Is there a lack of CS user requirements? If so, what impact does it have on system
performance? What are the performance needs of CS users? 4. What performance measures are used to evaluate client-server systems? 5. What criteria do companies use to determine which performance measurements to collect? 6. How are organizations performing in terms of collecting and meeting these performance
measures? 7. Which performance measures are most important for a successful client-server system? and
8. Who is responsible for establishing performance measures?
This questionnaire is designed to obtain information important for network managers of client-server systems. The purpose of this study is to better understand the state of client-server computing within industry. The results will yield valuable information that with help managers and executives alike plan and better manage this new IT resource.
You are under no obligation to participate in the study and may withdraw consent at any time. A decision to withdraw from the study will not affect the your employment in any way.
Sincerely,
Dr. John C. Windsor, Chairperson BCIS Dept. Phone: (817) 565-3110 Fax: (817) 565-4935 E-mail: [email protected]

APPENDIX P
USER PERFORMANCE MEASUREMENT QUESTIONNAIRE DEMOGRAPHICS
1QQ

200
II. User Performance Measurement Questionnaire
Demographics
Nature of product usaae. Freauencv of product usaae.
1. Job-related or business usage only 2. Mixture of job-related and personal usage 3. Personal usage only
9. System is used continuously around the clock
2. System is used continuously during business hours
3. System is used as needed on a daily basis
4. System is used weekly on a regular basis 5. System is used intermittently as needed
Importance of product to your job functions.
1. System is mandatory for your job functions
2. System is of major importance to your job 3. System is of some importance to your job 4. System is of minor importance to your job 5. System is of no importance to your job
How product functions were performed previously.
1. Functions could not be performed previously
2. Functions were performed manually 3. Functions were performed mechanically 4. Functions were performed electronically 5. Functions were performed by another
system
Primary benefits from use of current system. _
1. System performs tasks beyond normal human abilities
2. System simplifies complex decisions 3. System simplifies tedious calculations 4. System shortens critical timing situations 5. System reduces manual effort 6. Other 7. Hybrid: system has multiple benefits
Primarv benefit Secondary benefit

APPENDIX Q
USER EVALUATION-SYSTEM
201

User Evaluation-System
202
Ease of learnina to use svstem initially.
1. Very easy to learn 2. Fairly easy to learn 3. Moderately easy to learn, with some
difficult topics 4. Difficult to learn 5. Very difficult to learn
Ease of installing svstem initially.
1. Little or no effort to install 2. Fairly easy to install 3. Moderately easy to install, with some
difficult spots 4. Difficult to install 5. Very difficult to install
Ease of customizing to local requirements.
1. Little or no customization needed 2. Fairly easy to customize 3. Moderately easy to customize, with some
difficult spots 4. Difficult to customize 5. Very difficult to customize
Ease of logging on and starting system.
1. Very easy to start 2. Fairly easy to start 3. Moderately easy to start, with some
difficult spots 4. Difficult to start 5. Very difficult to start
Ease of svstem use for normal tasks.
1. Very easy to use 2. Fairly easy to use 3. Moderately easy to use, with some
difficult spots 4. Difficult to use 5. Very difficult to use
Ease of product use for unusual or infrequent tasks.
1. Very easy to use 2. Fairly easy to use 3. Moderately easy to use, with some
difficult spots. 4. Difficult to use 5. Very difficult to use
Ease of logging off and exiting svstem.
1. Very easy to use 2. Fairly easy to use 3. Moderately easy to use, with some
difficult spots 4. Difficult to use 5. Very difficult to use
System handling of user errors.
1. Very natural and safe error handling 2. Fairly good error handling 3. Moderately good error handling, but
some caution needed 4. User errors can sometimes hang up
system 5. User errors often hang up system or stop
application
System speed or performance in use.
1. Very good performance 2. Fairly good performance 3. Moderately good normal performance but
some delays 4. Performance is sometimes deficient 5. Performance is unacceptable slow or
poor
System memory utilization when is use.
1. No memory utilization problems with this system
2. Minimal memory utilization problems with this system
3. Moderate use of memory by this system 4. Significant memory required to use this
system 5. System memory use is excessive and
unwarranted

203
System compatibility with software products. _
1. Very good compatibility between products 2. Fairly good compatibility between
products 3. Moderately good compatibility between
products 4. Significant compatibility problems 5. Products are highly incompatible
Svstem aualitv and defect levels.
1. Excellent quality with few defects 2. Good quality, with some defects 3. Average quality, with normal defect
levels 4. Worse than average quality, with high
defect levels 5. Poor quality with excessive defect levels
Svstem reliability and failure intervals.
1. System has never failed or almost never fails
2. System fails less than once a year 3. System fails or crashes a few times a
year 4. System fails fairly often and lacks
reliability 5. System fails often and is highly unreliable
Quality of IS staff suDDort.
1. Excellent IS staff support 2. Good IS staff support 3. Average IS staff support 4. Worse than average IS staff support 5. Poor or unacceptable IS staff support
Quality of training and tutorial materials.
1. Excellent training and tutorial materials 2. Good user reference manuals 3. Average user reference manuals 4. Worse than average user reference
manuals 5. Poor or unacceptable user reference
manuals
Quality of on-screen prompts and help messaaes.
1. Excellent and lucid prompts and help messages
2. Good prompts and help messages 3. Average prompts and help messages 4. Worse than average prompts and help
messages 5. Poor or unacceptable prompts and help
messages
Quality of output created by svstem.
1. Excellent and easy to use system outputs 2. Good product outputs, fairly easy to use 3. Average product outputs, normal ease of
use 4. Worse than average system outputs 5. Poor or unacceptable system outputs
Functionality of svstem.
1. Excellent-system meets all functional needs
2. Good-system meets most functional needs
3. Average-system meets many functional needs
4. Deficient-system meets few functional needs
5. Unacceptable-product meets no functional needs
Vendor support of svstem.
1. Excellent-system support is outstanding 2. Good-system support is better than many 3. Average-system support is acceptable 4. Deficient-system has limited support 5. Unacceptable-little or no product support
Status of system versus others.
1. Clearly superior to others in all respects 2. Superior to others in many respects 3. Equal to others, with some superior
features 4. Behind others in some respects 5. Clearly inferior to other systems in all
respects

204
Value of svstem to vou personally.
1. Excellent-system is highly valuable 2. Good-product is quite valuable 3. Average-product has acceptable value 4. Deficient-product is not valuable 5. Unacceptable-product is a loss
List the five best features of the system: 1
List the five worst features of the system: 1.
2. 2. 6. 3. 4. 4 7. 5.
List five improvements you would like to see in the system: 1.
List the five most useful performance measures of the system: 1.
2. 2. 3 3 4. 4. 5. 5.

APPENDIX R
DEFINITIONS
90S
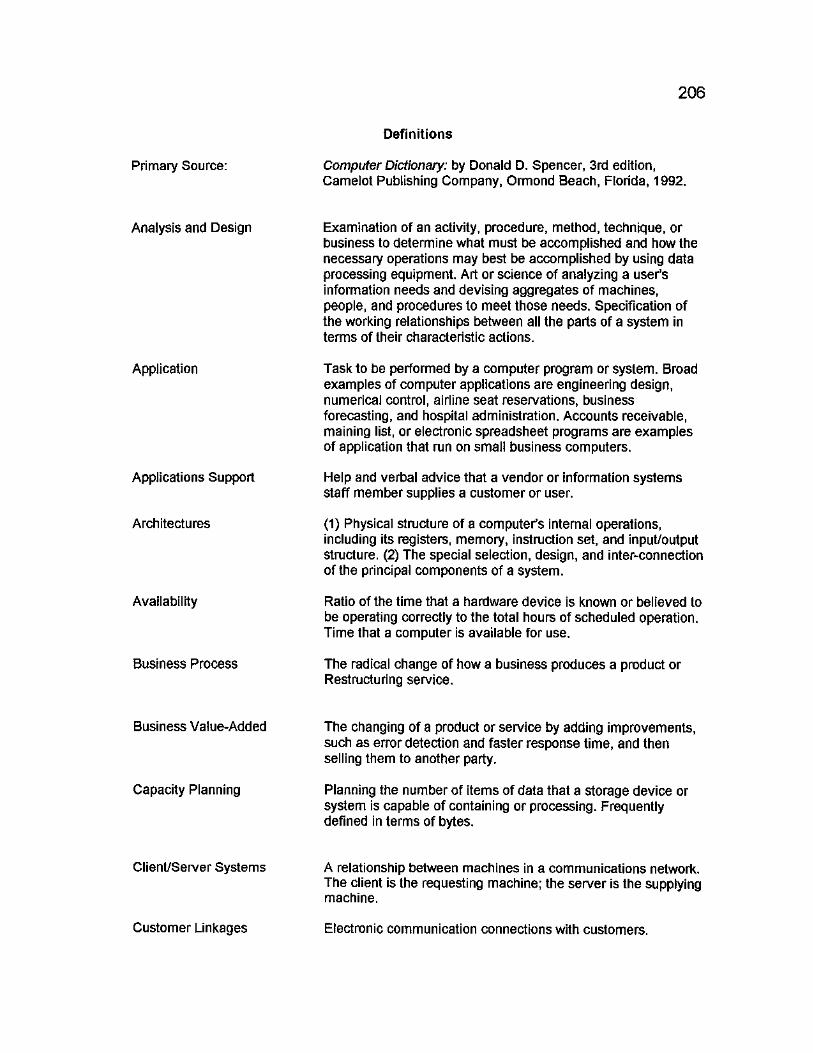
206
Primary Source:
Definitions
Computer Dictionary: by Donald D. Spencer, 3rd edition, Cameiot Publishing Company, Ormond Beach, Florida, 1992.
Analysis and Design
Application
Applications Support
Architectures
Availability
Business Process
Examination of an activity, procedure, method, technique, or business to determine what must be accomplished and how the necessary operations may best be accomplished by using data processing equipment. Art or science of analyzing a user's information needs and devising aggregates of machines, people, and procedures to meet those needs. Specification of the working relationships between all the parts of a system in terms of their characteristic actions.
Task to be performed by a computer program or system. Broad examples of computer applications are engineering design, numerical control, airline seat reservations, business forecasting, and hospital administration. Accounts receivable, maining list, or electronic spreadsheet programs are examples of application that run on small business computers.
Help and verbal advice that a vendor or information systems staff member supplies a customer or user.
(1) Physical structure of a computer's internal operations, including its registers, memory, instruction set, and input/output structure. (2) The special selection, design, and inter-connection of the principal components of a system.
Ratio of the time that a hardware device is known or believed to be operating correctly to the total hours of scheduled operation. Time that a computer is available for use.
The radical change of how a business produces a product or Restructuring service.
Business Value-Added
Capacity Planning
The changing of a product or service by adding improvements, such as error detection and faster response time, and then selling them to another party.
Planning the number of items of data that a storage device or system is capable of containing or processing. Frequently defined in terms of bytes.
Client/Server Systems
Customer Linkages
A relationship between machines in a communications network. The client is the requesting machine; the server is the supplying machine.
Electronic communication connections with customers.

207
Collaborative Alliances
Communication
Compatibility
Computer Maintenance
Consulting
Data Access
Data Accuracy
Data Integrity
Data Retention
Data Security
Defect
Defect Origins
Defect Severity & Scope
Delivery Time
Business partnership that usually involves exchange of expertise. Usually occurs on a joint project.
(1) Flow of information from one point (the source) to another (the receiver). (2) Act of transmitting or making know. (3) Process by which information is exchanged between individuals through the use of a commonly accepted set of symbols.
(1) Property of some computers that allows programs written for on computer to run on another (compatible) computer, even though it is a different model. (2) Ability of different devices, such as a computer and a printer, to work together. (3) Refers to the ability of specific software to work with a specific brand and mode. Of computer. All Software is not "compatible" with all computers.
Any activity intended to eliminate faults or to keep hardware or programs in satisfactory working condition, including tests, measurement, replacements, adjustments, and repairs.
Expert advice given in the use of computers in specific applications environments, such as business data processing, education, military systems, or health car. Often use to help analyze and solve a specific problem.
Access given to specific type of information
Degree of exactness of an approximation or measurement. Accuracy normally denotes absolute quality of computed results; precision usually refers to the amount of detail used in representing those results. Four-place results are less precise than six-place results; yet a four-place table could be more accurate than an erroneously computed six-place table.
Performance measure based on the rate of undetected errors.
Refers to the amount of data retained or stored, usually for future use.
Protection of data from accidental or malicious destruction, disclosure, or modification.
Bug: Mistake in a computer program or system or a malfunction in a computer hardware component. To debug means to remove mistakes and correct malfunctions. An error that is coded in to a system that will produce unwanted results.
Hardware or software where error first occurred.
Level of error.
Amount of time need to product and give a completed or operational system to the users .

208
Disaster Recovery Plan
Documentation
Downtime
Elapsed Time
End-User
Functionality
Hardware
Information Requirement
Information Systems
Information Technology
Input Controls
Installing
Line Manager
Load Analysis
Mainframe
Memory
Methodologies
A method of restoring data processing operations if those operations are halted by major damage or destruction.
(1) During systems analysis and subsequent programming, the preparation of documents that describe such things as the system, the programs prepared, and the changes made at later dates. Internal documentation in the form of comments or remarks.
Length of time a compute system is inoperative due to a malfunction. Contrast with available time and uptime.
The amount of calender time it takes to complete a computer related task.
Person who buys and uses computer software or who has contact with computers.
Specification of the working relationships between the parts of a system in terms of their characteristic actions.
Physical equipment, such as electronic, magnetic, and mechanical devices. Contrast with software.
Formal written statements that specify what the software must do or how it must be structured.
Collection of people, procedures, and equipment designed, built, operated, and maintained to collect, record, process, store, retrieve, and display information.
Merging of computing and high-speed communications links carrying data, sound, and video.
Restriction of the introduction of data from an external source into a computer's internal storage unit. Contrast with output.
Time spent installing, testing, and accepting equipment.
Refers to those managers which supervise workers in direct contact
Technique used to determine the effects of various amounts of data on a system.
Large, expensive computer generally used for information processing in large businesses, colleges, and organizations.
Storage facilities of the computer, capable of storing vast amounts of data.
Procedure or collection of techniques used to analyze information in an orderly manner. Set of standardized procedures, including technical methods, management

209
Methods and Procedures
Multi-disciplinary Teams
Networking Controls
On-screen Help
Output
PC
Performance
Physical Access
Physical Security
Process Controls
Productivity
Programming Languages
Project Championship
techniques and documentation that provide the framework to accomplish a particular function.
Procedure or collection of techniques used to analyze information in an orderly manner. Set of standardized procedures, including technical methods, management techniques and documentation that provide the frame work to accomplish a particular function.
A group make up of members for various educational backgrounds or skills
Function of performing required operations when certain specific conditions occur or when interpreting and acting upon instructions. Network station that supervises control procedures, such as addressing, poling, selecting, and recovery. Also responsible for establishing order on the line in the event of contention or any other abnormal situation.
Operating assistance for applications that appear directly on the monitor, saving you the bother of looking them up in a manual.
(1) Data transferred from a computer's internal storage unit to some storage or output device. (2) Final result of data that have been processed by the computer. Contrast with input.
Personnel, micro, desktop or laptop computer.
Major factor in determining the total productivity of a system. Largely determined by a combination of availability, throughput, and response time.
The process whereby physical contact is controlled.
Guards, badges, locks, alarm systems, and other measures to control access to the equipment in a computer center.
(1) Systematic sequence of operations to produce a specified result. (2) To transform data into useful information. (3) An element in a data flow diagram that represents actions taken on data: comparing, checking, authorizing, filing, and so forth.
Measures of the work performed by a software/hardware system or user. Largely depends on a combination of the system's facility and performance.
A set of statements that control the operations of a computer. A means for computer users to provide a series of instructions for a computer to follow. There are four types of programming languages: machine language, assembly language, high-level language, and forth-generation language.
Person responsible for generating support for a project. Helps ensure the projects success.

210
Project Management
Quality Assurance
Recovery Time
Redundancy
Reliability
Response Time
Runaways
Skillbase
Software
Speed
IS Staff
Staffing
Staff Turnover
Staff Years
Status
Strategic Planning
Supplier Linkages
System
Person responsible for the enforcement of a project's goals such as schedule and planning.
Technique for evaluating the quality of product being processed by checking it against a predetermined standard and taking the proper corrective action if the quality falls below the standard.
Amount of time needed to continue program execution after a failure or to overcome a problem.
(1) Duplication of a feature to prevent system failure in the event of the feature's malfunction. (2) Repetition of information among various files, sometimes necessary but often undesirable.
Measure of the ability of a program, system, or individual hardware device to function without failure.
Time it takes the computer system to react to a given input. Interval between an event and the system's response to the event.
Team used to describe a project that is substantially over budget or time.
Set of skills needed to effectively function within a specific computer environment.
The generic term for any computer program or programs; instructions that cause the hardware to do work. Contrast with the "iron" hardware of a computer system.
Usually refers to processing power.
Refers to the Information System employees.
Hiring and training workers.
Employee leaving the organization
Total number of years of employees
Present condition of a system component.
Involves long range goal setting with detail outlines.
Electronic communication connections with vendors
Composite of equipment, skills, techniques, and information capable of performing and/or supporting an operational role in attaining specified management objectives. Includes related facilities, equipment, material, services personnel, and information required for its operation to the degree that it can be considered a self-sufficient unit in its intended operational and/or support environment.

211
System Cost
System Disruption
System Error
System Restart
Systems Support
Task
Terminals
Testing & Inspections
Throughput
Tools
Training
Tutorial
Turnaround
Utilization
Vendor Support
Workstation
Method of assigning cost to a project, job, or function.
A failure or malfunction of the hardware or systems software within a computer system. Refers to a unplanned stoppage of processing.
A malfunction of the hardware or systems software within a computer system.
Bring a system on-line, ready to do work, after it has be shut down.
Help and verbal advice that a vendor or information system staff supplies a customer or end-user.
Element of work that is part of getting the job done, such a loading of programs into computer storage.
Keyboard/display or keyboard/printer device used to input programs and data to the computer and to receive output from the computer.
Examination of a program's behavior by executing the program on sample data sets, including both valid and invalid data, in an effort to explore all possible causes of misbehavior
Measure of the total amount of useful processing carried out by a computer system in a given time period.
(1) An object or icon used to perform operations in a computer program. Tools are often named either by what they do or by the type of object on which they work. (2) In some computer systems, an applications program.
Learning to use a computer system or program.
Hardware or software training manual. Can be a printed document or recorded in magnetic form on a disk or tape.
(1) Time it takes for a job to travel from the user to the computing center, to be run on the computer, and for the program results to be returned to the user.
Measure of a computer's performance.
(1) Help provided by a company or business entity that sells computers, peripheral devices, or computer related services.
Configuration of computer equipment designed for use by one person at a time. This may have a terminal connected to a computer, or it may be a stand-aline system with local processing capability. Examples of workstations are a stand-alone graphics system, and a word processor.
REFERENCES
Ameen, David A. "Systems Performance Evaluation." Journal of Systems Management 40 (1989): 33-36.
Baines, Anna. "Work Measurement - The Basic Principles Revisited." Work Study 44 (1995): 10-14.
Barney, Jay B. "Looking Inside for Competitive Advantage." Academy of Management Executive 9 (April 1995): 49-61.
Beasley, Gary and Joseph Cook. "The "What," "Why" and "How" of Benchmarking." Agency Sales Magazine 25 (1995): 52-56.
Bell, Tom. "A Systems Assurance Checklist for Client/server." Capacity Management Review 23 (1995): 24.
Benbasat, Izak, David K. Goldstein, and Melissa Mead, "The Case Research Strategy in Studies of Information Systems," MIS Quarterly 11 (September 1987): 369-386.
Brown, Stanley. "Quality Benchmarking." Executive Excellence 12 (1995): 15.
Caldwell, Bruce. "Putting Technology to the Test." Informationweek 5 (1995): 80-92.
Camp, R.C. Benchmarking — The Search for Industry Best Practices that Lead to Superior Performance, ASQS Quality Press, Milwaukee, Wl, 1989.
Campanella, J. and F. J. Corcoran. "Principles of Quality Costs", Quality Progress (April 1983): 16-22.
Campbell, Donald T. Degrees of Freedom and the Case Study. (1975):178-193.
Campbell, Donald T., and Julian C. Stanley. Experimental and quasi-experimental Designs for Research, Boston: Houghton Mifflin, 1979.
Campi, J. P., "It's Not as Easy as ABC," Journal of Cost Management Summer (1992): 511.
212

213
Capon, N. Kaye and M M. Wood. "Measuring the Success of a TQM Program." International Journal of Quality & Reliability Management. 12 (1995): 8-22.
Carrie, Wendy. "The it Strategy Audit: Formulation and Performance Measurement at a UK Bank." Managerial Auditing Journal. 10 (1995): 7-16.
Chan, Y, L., and B. E. Lynn, "Performance Evaluation and the Analytic Hierarchy Process." Journal of Management Accounting Research 3 (Fall 1991): 57-87.
Confrey, Tom, "Client/server Performance: it Can't Be Faked", Capacity Management Review 24 (Nov 1996): 1-16.
Cook, Thomas D., and Donald T. Campbell, Quasi-experimentation: Design and Analysis for Field Settings Boston: Houghton Mifflin, 1979.
Cross, K., and R. Lynch, "Accounting for Competitive Performance," Journal of Cost Management (Spring 1989): 20-28.
Cummings, Joanne. "Users Rate Net Mgmt. Most Important Technical Issue." Network World 9 (Sept 1992): 93.
Dawe, Richard L. "We Can't Afford to Pit Cost Against Service." Transportation & Distribution 35 (July 1994): 70.
Drucker, Peter F. "The Emerging Theory of Manufacturing", Harvard Business Review 68 (May-June 1990): 94-102.
Drucker, Peter F. "We Need to Measure, Not Count." Wall Street Journal. April 21, 1993.
Drucker, Peter F. "The Age of Social Transformation," Atlantic Monthly, 274 (November 1994): 53-80.
Drucker, Peter F. "The Information Executives Truly Need," Harvard Business Review 73 (January-February 1995): 54-59.
Eckerson, Wayne. "Client Server Architectures." Network World. 12 (Jan 1995): SS18-SS21+.
Eisenhardt, Kathleen. "Building theories from case study research." Academy of Management Review 14 (1989): 532-550.

214
Galloway, D. and D. Waldron. "Throughput Accounting Part 1 — the Need for a New Language for Manfacturing", Management Accounting (Nov 1988): 34-35.
Galloway, D. and D. Waldron. "Throughput Accounting Part 2 — Ranking Products Profitability", Management Accounting (Dec 1988): 34-35.
Galloway, D. and D. Waldron. "Throughput Accounting Part 3 — A Batter Way to Control Labour Costs", Management Accounting, (January 1989): 32-33.
Galloway, D. and D. Waldron. "Throughput Accounting Part 4 — Moving on to Complex Products", Management Accounting (February 1989): 40-41.
Gaskin, Barbara and Paul Sharman. "It Strategies for Performance Measurement." Cost & Management. 68 (April 1994): 16-18.
Geigenbaum, A.V., Total Quality Control, McGraw-Hill, New York, NY, 1961.
Globerson, S., "Issues in Developing a Performance Criteria System for an Organization", International Journal of Production Research 23 (1985): 639-646.
Goodhue, Dale L. and Ronald L. Thompson. "Task-technology Fit and Individual Performance." MIS Quarterly. 19 (June 1995): 213-236.
Graham, Stephen. "Client-Server Sites Can Reap Benefits of Performance Evaluation Methods." Computing Canada (Client-Server Computing Supplement) (March 1994): 8.
Grantham, Lisa. "Justifying Office Automation: Benefits and Problems." Industrial Management & Data Systems 95 (1995): 10-13.
Halachmi, Arie. and Geert Bouckaert. "Performance Measurement, Organizational Technology and Organizational Design." Work Study. 43 (May/June 1994): 19-25.
Harrison, John S. Lonborg, Kris. "Client/server Data Processing: Everything You Need to Know." Texas Banking 84 (Feb 1995): 32.
Howard, Phil. "Service Level Management in Enterprise Systems." Capacity Management Review 23 (Sept 1995): 1,14+.

215
Huff, Richard A. "Client/server Technology: Is it a Bill of Goods?" Information Strategy: the Executive's Journal 12 (Fall 1995): 21-28.
Jander, Mary. "Performance Management Keeps Check on Client-server Systems." Data Communications. 23 (May 21 1994): 63-71.
Johnson, H.T., "Early Cost Accounting for Internal Management Control: Lyman Mills in the 1850s." Business History Review (Winter 1972): 466-474.
Johnson, H.T., "Management Accounting in Early Integrated Industry — E.I. Dupont De Nemours Powder Company 1903-1912." Business History Review (Summer 1975): 184-204.
Johnson, H.T., "The Role of History in the Study of Modern Business Enterprise", The Accounting Review (July 1975): 444-450.
Jones, Capers. "Major Issues Are Facing Software Development." Cash Flow. 98 (August 1994): 27.
Jones, Capers. Applied Software Measurement: Assuring Productivity and Quality. McGraw-Hill. 2nd Ed. 1997 .
Kappelman, Leon, and Steve Guynes, "End-user Training and Empowerment: Lessons from a Client/server Environment." Journal of Systems Management (September/October 1995.)
Keegan, D.P., Eiler, RAG. and Jones, C.R., "Are Your Performance Measures Obsolete?", Management Accounting (June 1989): 45-50.
Kerlinger, Fred N., "Foundations of Behavioral Research" Third Edition, Harcourt Brace Jovanovich College Publishers, 1986.
Kettinger, William J., Varun Graver, Subashish Guha, and Albert H Segars. "Strategic Information Systems Revisited: A Study in Sustainability and Performance." MIS Quarterly. 18 (March 1994): 31-58.
Keyes, Jessica. "New Metrics Needed for New Generation." Software Magazine. 12 (May 1992): 42-56.
Kidder, Louise H. and Charles M. Judd, Research Methods in Social Relations. New York: Holt, Rinehart, and Winston, 1986.

216
King, Margaret. "Evaluating Natural Language Processing Systems." Communications of the ACM 39 (Jan 1996): 73-79.
King, William. "Creating a Client/Server Strategy." information Systems Management. 11 (Summer 1994): 71-74.
Kotler, P., Marketing Management Analysis, Planning and Control, Prentice-Hall, Englewood Cliffs, NJ, 1984.
LeBleu, Ronald. Sobkowiak, Roger. "New Workforce Competency Models: Getting the IS Staff up to Warp Speed." Information Systems Management 12 (Summer 1995): 7-12.
Lee, Heeseok., "A Structured Methodology for Software Development Effort Prediction Using the Analytic Hierarchy Process," Journal of Systems and Software, 21 (1993): 179-186.
Lee, Heeseok, Wikil Kwak and Ingoo Han. "Developing a Business Performance Evaluation System: an Analytic Hierarchical Model." Engineering Economist. 40 (Summer 1995): 343-357.
Lewis, Bob. "To Measure Your Staff's Productivity Is Not the Same as to Improve It." Infoworld. 18 (Feb 1996): 64.
Low, Graham C., Henderson-Sellers, Brian., Han, David. "Comparison of Object-oriented and Traditional Systems Development Issues in Distributed Environments." Information Management 28 (May 1995): 327-340.
Marsh, Vivien. "Test Client/Server Apps Before They Bug You to Death." Datamation 41 (August 1,1995): 32-35.
Martin, James. "Reskilling the IT Professional." Software Magazine. 12 (Oct 1992): 140, 139.
Martin, Richard J. "Two Tiers or Three?" Journal of Systems Management 45 (August 1994): 32-33.
Martin, Richard J. "The Seven Habits of Successful Client/Server Projects." Journal of Systems Management. 45 (Oct 1994): 20-21.
Maskell. B. "Performance Measures of World Class Manufacturing." Management Accounting (May 1989):32-33.

217
McMann, Paul and Alfred J. Nanni Jr. "Is Your Company Really Measuring Performance?" Management Accounting 76 (Nov 1994): 55-58.
Miskin, Andrew. "Performance Management." Management Accounting-London 73 (Nov 1995): 22.
Muralidhar, K., R. Santhanam, and R. L. Wilson. "Using the Analytic Hierarchy Process for Information System Project Selection." Information and Management 18 (1990): 87-95.
Musthaler, Linda. "Client/Server Computing" Data Base Advisor (June 6,1993)
Musthaler, Linda. "Client/Server: What Does That Really Mean?" Managing Office Technology. 40 (June 1995): 20-23.
Neely, Andy. Gregory, Mike. Platts, Ken. "Performance Measurement System Design." International Journal of Operations & Production Management 15 (1995): 80-116.
Nelson, Irvin T. "The Measures of Success: Creating a High Performing Organization."7/ie Internal Auditor 52 (Oct 1995): 18-19.
Oge, C. and H. Dickinson. "Product Development in the 1990s - New Assets for Improved Capability", Economist Intelligence Unit, Japan Motor Business (December 1992): 132-44.
- "Performance and Tuning in the Client/server World," Capacity Management Review. 23 (May 1995): 1,12+.
Pollalis, Yannis A. "A Systemic Approach to Change Management: Integrating IS Planning, BPR, and TQM." Information Systems Management 13 (Spring 1996): 19-25.
Porter, M.E., and Victor E. Millar, "How Information Gives You Competitive Advantage." Harvard Business Review 63 (July-Aug 1985): 149-160.
Prahalad, C.K. and Gary Hamel. "The Core Competence of the Corporation." Harvard Business Review 68 (May-June 1990): 79-91.
Raghavan, S V., D. Vasukiammaiyar, and Gunter Haring. "Hierarchical Approach to Building Generative Networkload Models." Computer Networks & ISDN Systems 27 (May 1995): 1193-1206.
218
Reimanri, C. "The Baldrige Award." Quality Progress 22 (July 1989): 35-9.
Rheem, Helen. "Performance Management: A Progress Report." Harvard Business Review 73 (May/June 1995): 11-12. 1995.
Ricciardi, Philip. "Simplify Your Approach to Performance Measurement." HRMagazine 41 (March 1996): 98-106.
Robert E. Umbaugh, Editor, Handbook of IS Management, Auerbach Publications 4th Ed. 1995.
Rockart, J.F. "Chief Executives Define Their Own Data Needs" Harvard Business Review 57 (1979): 81-93.
Rymer, John R "Business Intelligence: the Third Tier; Managed Client/server Data Access and Analysis Architectures." Journal of Systems Management 45 (Feb 1994): 16-25.
Sambamurthy. V. and Robert W. Zmud. IT Management Competency Assessment: a Tool for Creating Business Value Through It. Financial Executives Research Foundation. 1994.
Schultheis, Robert A. and Douglas B Bock. "Benefits and Barriers to Client/server Computing." Journal of Systems Management 45 (Feb 1994): 12-15+.
Shepherd, C David and Marilyn M Helms. "TQM Measures: Reliability and Validity Issues." Industrial Management 37 (Jul/Aug 1995): 16-21.
Sinclair, David and Mohamed Zairi. "Performance Measurement as an Obstacle to TQM." TQM Magazine 7 (1995): 42-45.
Sinha, Alok. "Client-Server Computing." Communications of the ACM 35 (July 1992): 77-98.
Slack, N., "Flexibility as a Manufacturing Objective", International Journal of Operations & Production Management 3 (1983): 4-13.
Smolenyak, Megan. "What Could We Have Done? There must Be a Better Way." Journal for Quality & Participation 19 (Jan/Feb 1996): 24-28.
Stalk, G., "Time — The Next Source of Competitive Advantage", Harvard Business Review (Nov - Dec 1987): 101 -109.

219
Swanson, Richard A., Analysis for Improving Performance: Tools for Diagnosing Organizations & Documenting Workplace Expertise, 1st ed., Berrett-Koehler Publishers. 1994
Thierauf, Robert J. Effective Management and Evaluation of Information Technology, Quorum Books. 1994.
van den Hoven and G. John. "Client/Server Computing: Bringing the Company's Resources Together." Journal of Systems Management 46 (March/April 1995): 50-55.
Xenakis, John J. "Moving to Mission Critical." Cfo: the Magazine for Chief Financial Officers 10 (Sept 1994): 61 -71.
Yin, Robert K. Case Study Research: Design and Methods, Newbury Park, CA: Sage Publications. 1989.
Young, S. "Checking Performance with Competitive Benchmarking." Professional Engineering (February 1993): 14-15.
Top Related