


Languages
Pages
Legal


Result: 3.9%
2.5% 3.5%Operational Sales Growth
Result: 9.4%
5.3% 7.7%Adjusted Operational EPS Growth
Result: $15.5
$15.0 $16.7Free Cash Flow ($ Billions)
Goal:Goal: 2.5%2.5% 3-3.5.5%%
Goal:Goal: 5.3%5 3% 7-7.77%%
Goal:Goal: $15.7$15 7-$$16.716 7
$15.7
-0.2%
6.3%
13.0%
15.3%
11.0%
15.3%
1-Year 3-Year 5-Year
Total Shareholder Return
Competitor Composite J&J
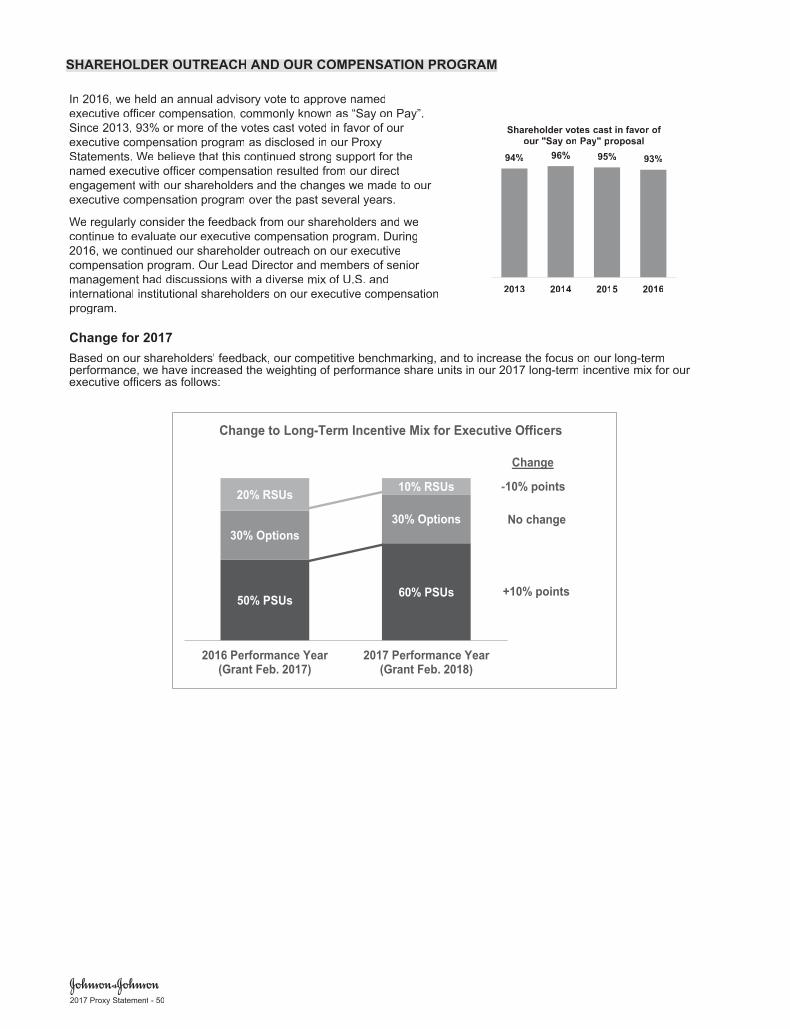
50% PSUs 60% PSUs
30% Options30% Options
20% RSUs 10% RSUs
2016 Performance Year(Grant Feb. 2017)
2017 Performance Year(Grant Feb. 2018)
Change in Long-Term Incentive Mix for Executives
Change
-10% points
No change
+10% points
Change to Long-Term Incentive Mix for Executive Officers


-0.2%
6.3%
13.0%
15.3%
11.0%
15.3%
1-Year 3-Year 5-Year
Total Shareholder Return
Competitor Composite J&J

Result: 3.9%
2.5% 3.5%Operational Sales Growth
Result: 9.4%
5.3% 7.7%Adjusted Operational EPS Growth
Result: $15.5
$15.0 $16.7Free Cash Flow ($ Billions)
Goal:Goal: 2.5%2.5% 3-3.5.5%%
Goal:Goal: 5.3%5 3% 7-7.77%%
Goal:Goal: $15.7$15 7-$$16.716 7
$15.7


7%
17%
76%
ACTUAL 2016 CEO PAY MIX
Long-TermIncentives
Base Salary
AnnualPerformanceBonus


94% 96% 95% 93%
2013 2014 2015 2016
Shareholder votes cast in favor ofour "Say on Pay" proposal
50% PSUs 60% PSUs
30% Options30% Options
20% RSUs 10% RSUs
2016 Performance Year(Grant Feb. 2017)
2017 Performance Year(Grant Feb. 2018)
Change in Long-Term Incentive Mix for Executives
Change
-10% points
No change
+10% points
Change to Long-Term Incentive Mix for Executive Officers

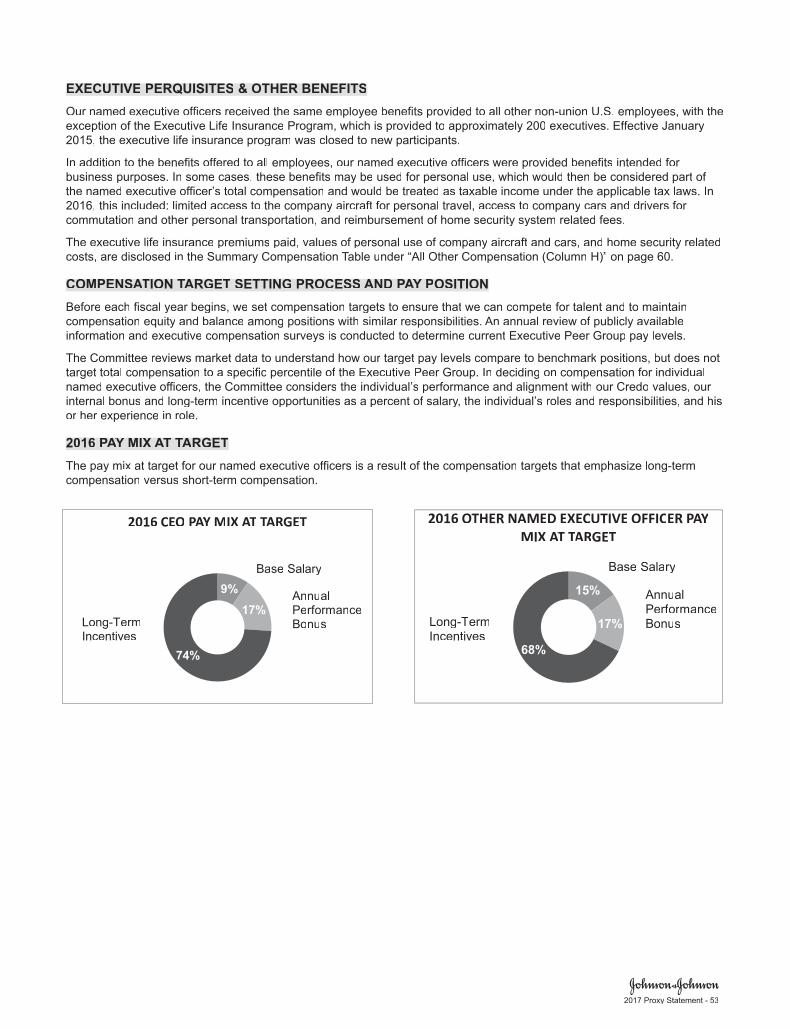
9%17%
74%
2016 CEO PAY MAA IX AT TARGET
Long-TermIncentives
Base Salary
AnnualPerformanceBonus
15%
17%
68%
2016 OTHER NAMED EXECUTIVE OFFICER PAYAAMIX AT TAA ARTT GET
Long-TermIncentives
Base Salary
AnnualPerformanceBonus


Top Related