


Languages
Pages
Legal

1
2016 Investor ConferenceEmerson Strategic ReviewDavid N. FarrChairman and Chief Executive OfficerFebruary 11, 2016
Non-GAAP Measures
In this presentation we will discuss some non-GAAP measures (denoted with an *) in talking about our company’s performance, and the reconciliation of those measures to the most comparable GAAP measures is contained within this presentation or is available at our website www.emerson.com under the investor relations tab.
Safe Harbor Statement
Our commentary and responses to your questions may contain forward-looking statements, including our outlook for the remainder of the year, and Emerson undertakes no obligation to update any such statement to reflect later developments. Factors that could cause actual results to vary materially from those discussed today include our ability to successfully complete on the terms and conditions contemplated, and the financial impact of, our strategic repositioning actions, as well as those provided in our most recent Annual Report on Form 10-K and subsequent reports as filed with the SEC.
Pro Forma Results
The financial measures contained in this presentation for the rebased Emerson and the Automation Solutions and Commercial & Residential Solutions businesses represent the businesses that are expected to remain a part of Emerson and to comprise these business groups after completion of Emerson’s portfolio repositioning actions.
22
21%
20%
19%
16%
14%
10%
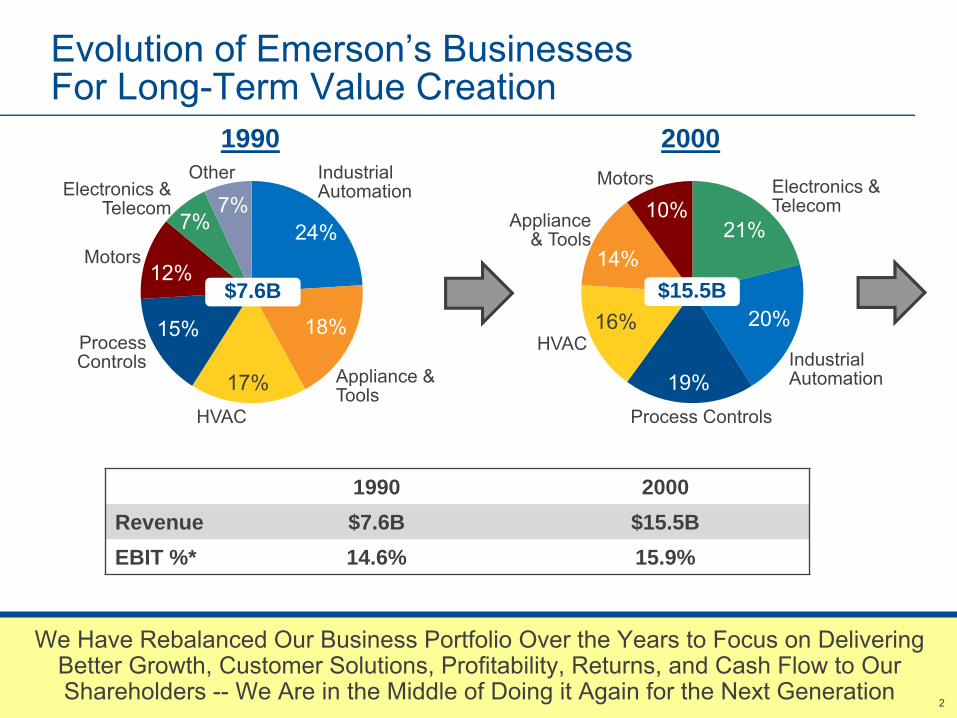
Evolution of Emerson’s Businesses For Long-Term Value Creation
We Have Rebalanced Our Business Portfolio Over the Years to Focus on Delivering Better Growth, Customer Solutions, Profitability, Returns, and Cash Flow to Our Shareholders -- We Are in the Middle of Doing it Again for the Next Generation
Process Controls
IndustrialAutomation
Electronics & Telecom
HVAC
2000
24%
18%
17%
15%
12%
7%7%
IndustrialAutomation
1990
HVAC
ProcessControls
Motors
Other Motors
Appliance & Tools
Appliance & Tools
Electronics & Telecom
1990 2000Revenue $7.6B $15.5BEBIT %* 14.6% 15.9%
$7.6B $15.5B
33
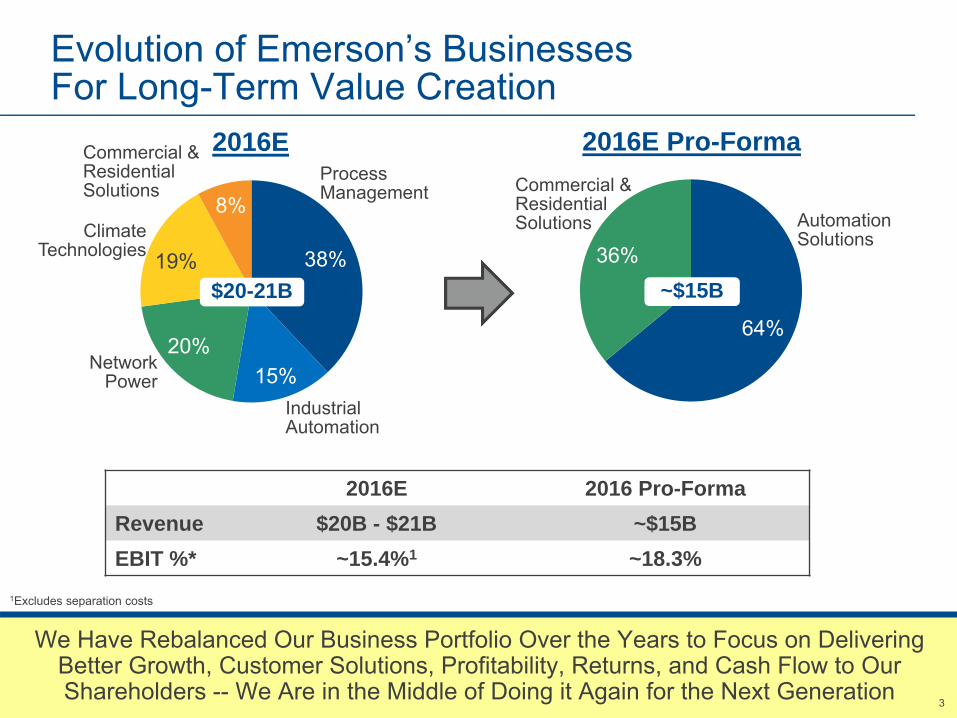
Evolution of Emerson’s Businesses For Long-Term Value Creation
We Have Rebalanced Our Business Portfolio Over the Years to Focus on Delivering Better Growth, Customer Solutions, Profitability, Returns, and Cash Flow to Our Shareholders -- We Are in the Middle of Doing it Again for the Next Generation
38%
15%20%
19%
8%
2016EProcessManagement
IndustrialAutomation
NetworkPower
ClimateTechnologies
Commercial & Residential Solutions
64%
36%
2016E Pro-Forma
Automation Solutions
Commercial &ResidentialSolutions
2016E 2016 Pro-FormaRevenue $20B - $21B ~$15BEBIT %* ~15.4%1 ~18.3%
1Excludes separation costs
$20-21B ~$15B
44
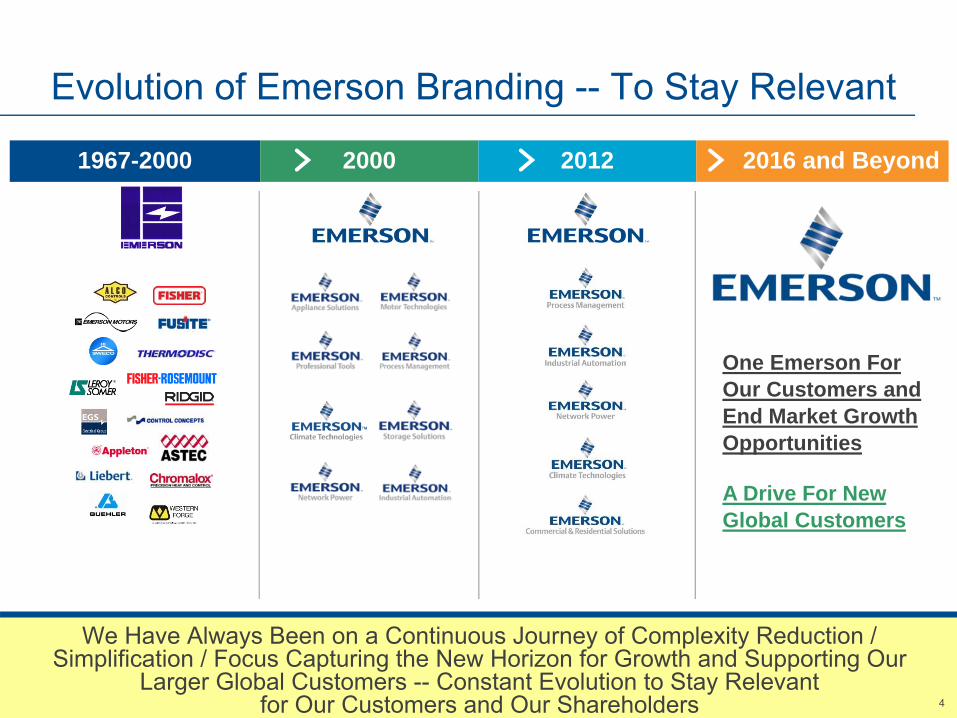
Evolution of Emerson Branding -- To Stay Relevant
1967-2000 2000 2012 2016 and Beyond
We Have Always Been on a Continuous Journey of Complexity Reduction / Simplification / Focus Capturing the New Horizon for Growth and Supporting Our
Larger Global Customers -- Constant Evolution to Stay Relevantfor Our Customers and Our Shareholders
One Emerson For Our Customers and End Market Growth Opportunities
A Drive For New Global Customers

55
Emerson Transitions Communication from“Diverse Conglomerate” to “Focused Enterprise”
AdvertisingDemonstrate broad portfolio
Emerson.comMultiple, individual product sites
Business CardsMultiple platforms & divisions shown
Talent AcquisitionFragmented, business unit and job
focused
Social MediaBusiness unit / Product centric
Showcase deep expertise
Single global enterprise site
Single Emerson logo
Global Emerson career centric
Unified industry expertise and humanizing the brand
FROM TO

6
Redefine and Focus the Emerson Portfolio for Higher Growth / Higher Value Built on Foundation of Proven Businesses
Markets and
Customers
Brand
Business Platforms
Product Lines
AutomationSolutions
Includes:
• Systems and Solutions• Final Control• Measurement and Analytical• Flow• Discrete and Industrial
Includes:
• Air Conditioning • Refrigeration• Electronics and Solutions• Sensors and Controls• Tools and Home Products
Industries Served:Oil and GasRefiningChemicalPowerLife Sciences
Commercial & Residential Solutions
Customer Categories:ConstructionCommercial BuildingsFood RetailFood ServiceRetail Service
Food and BevMetals and MiningWater Discrete Manuf.Fluid Automation
TransportationContractorsHomeowners
$10+B $5+B

7
Emerson New Business Focus and Market Growth Opportunities
Near-Term Growth DriversAutomation Solutions
• Lifecycle Services• Hybrid and Discrete
Automation • Wireless Solutions • Pipeline Management• Integrated Coordination
and Control• Bolt-on Acquisitions
Commercial & Residential Solutions• Retail Solutions• Environmentally Friendly
Refrigerants• Sensors, Controls
and Connectivity• Global Disposer
Adoption• E-commerce• Bolt-on Acquisitions
Transformational OpportunitiesAutomation Solutions
• Pervasive Sensing• Digitalization of Installed
Base• Enriched Business Models
to improve Energy Management, Reliability and Safety
• Strategic Acquisitions
Commercial & Residential Solutions• Residential Solutions• Commercial Solutions• Transportation Solutions • Food Waste
to Energy• Strategic Acquisitions
Automation Solutions
$100B Potential
$10.1B $5.3B
Commercial & Residential Solutions$30BPotential
$15.4B

88
Automation Solutions BusinessThe Value Proposition and Strategic Growth Rationale
Yes -- Near-Term Growth Will Be Challenging -- But, Shift to Other Process Market Segments Will Yield Incremental Growth; Room for Penetration Gains; and, Increased
Bolt-on Acquisition Opportunities in This Tougher Market Environment
• Increased focus on industries driving near-term growth -- Midstream Oil & Gas, Chemicals & Refining, Power, and Life Sciences
• Well positioned to capture that growth by positioning the platform as a solutions provider and a trusted advisor -- seamless customer interface, broader products & services offerings
• Large global footprint and installed base provide an opportunity for maintenance, repair & optimization, and turnaround services
• Strong historical growth and profitability performance, and significant market penetration still available
• Segment presents robust area of acquisition opportunities -- both bolt-ons and larger strategic acquisitions
99
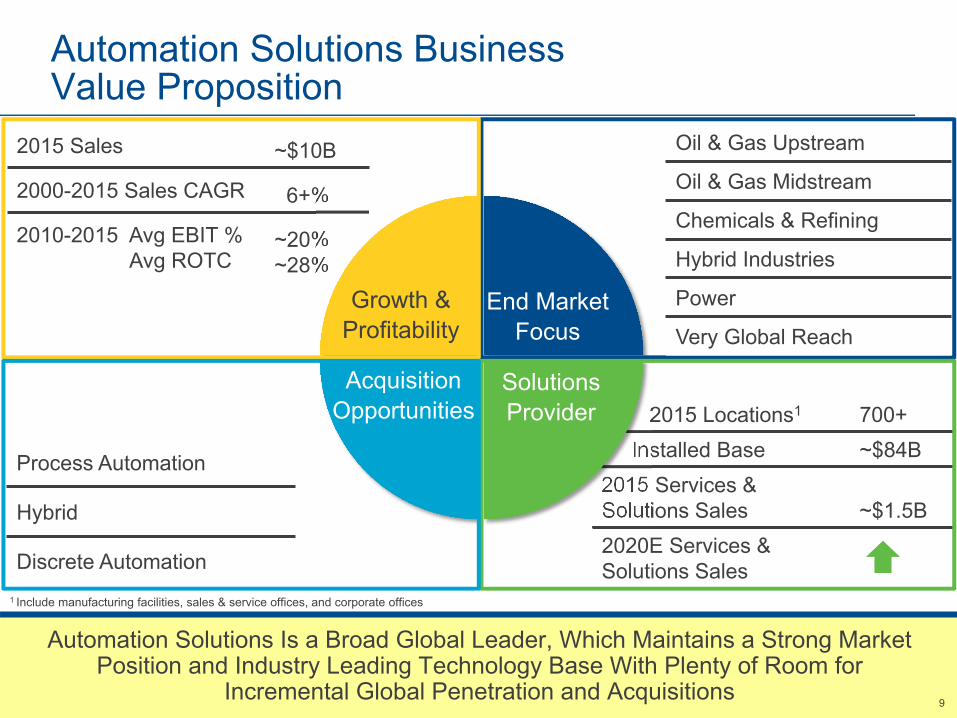
2015 Locations1 700+Installed Base ~$84B
2015 Services & Solutions Sales ~$1.5B2020E Services & Solutions Sales
2015 Sales ~$10B
2000-2015 Sales CAGR 6+%
2010-2015 Avg EBIT %Avg ROTC
~20%~28%
Automation Solutions BusinessValue Proposition
Automation Solutions Is a Broad Global Leader, Which Maintains a Strong Market Position and Industry Leading Technology Base With Plenty of Room for
Incremental Global Penetration and Acquisitions
Growth & Profitability
Acquisition Opportunities
Solutions Provider
End Market Focus
1 Include manufacturing facilities, sales & service offices, and corporate offices
Process Automation
Hybrid
Discrete Automation
Oil & Gas Upstream
Oil & Gas Midstream
Chemicals & Refining
Hybrid Industries
Power
Very Global Reach
10
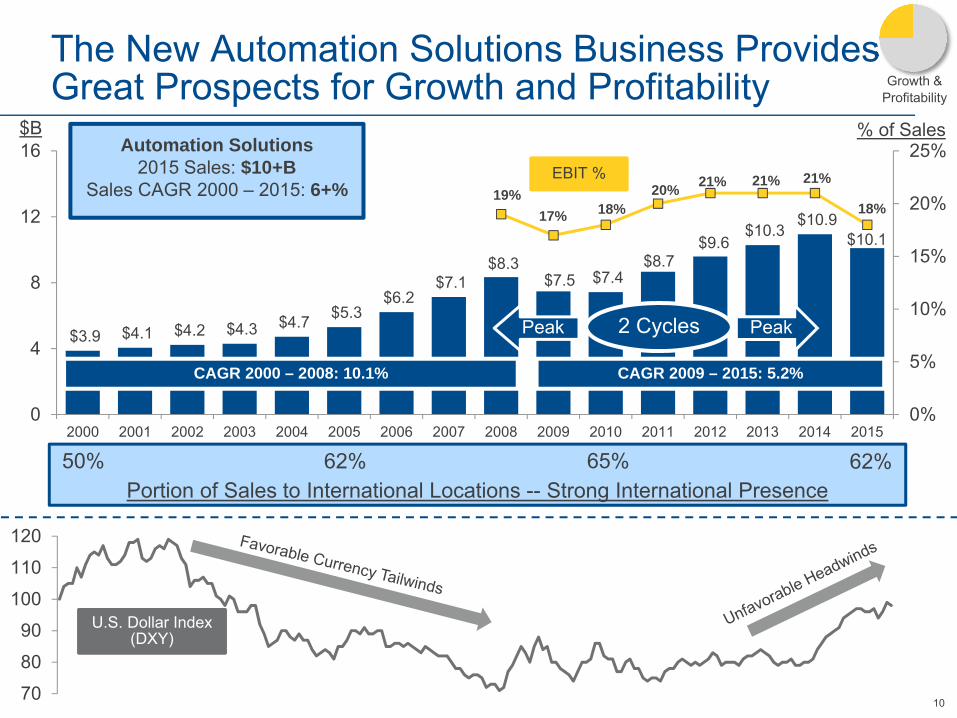
$3.9 $4.1 $4.2 $4.3 $4.7 $5.3 $6.2
$7.1 $8.3
$7.5 $7.4 $8.7
$9.6 $10.3
$10.9 $10.1
19%17% 18%
20% 21% 21% 21%
18%
0%
5%
10%
15%
20%
25%
0
4
8
12
16
2000 2001 2002 2003 2004 2005 2006 2007 2008 2009 2010 2011 2012 2013 2014 2015
70
80
90
100
110
120
The New Automation Solutions Business Provides Great Prospects for Growth and Profitability
CAGR 2000 – 2008: 10.1% CAGR 2009 – 2015: 5.2%
Growth & Profitability
Automation Solutions2015 Sales: $10+B
Sales CAGR 2000 – 2015: 6+%
50% 62% 65% 62%
$B % of Sales
2 Cycles
U.S. Dollar Index(DXY)
EBIT %
PeakPeak
Portion of Sales to International Locations -- Strong International Presence
1111
(15)%
(10)%
(5)%
0%
5%
10%
15%
20%
2003 2004 2005 2006 2007 2008 2009 2010 2011 2012 2013 2014 2015 2016E 2017T 2018T 2019T 2020T
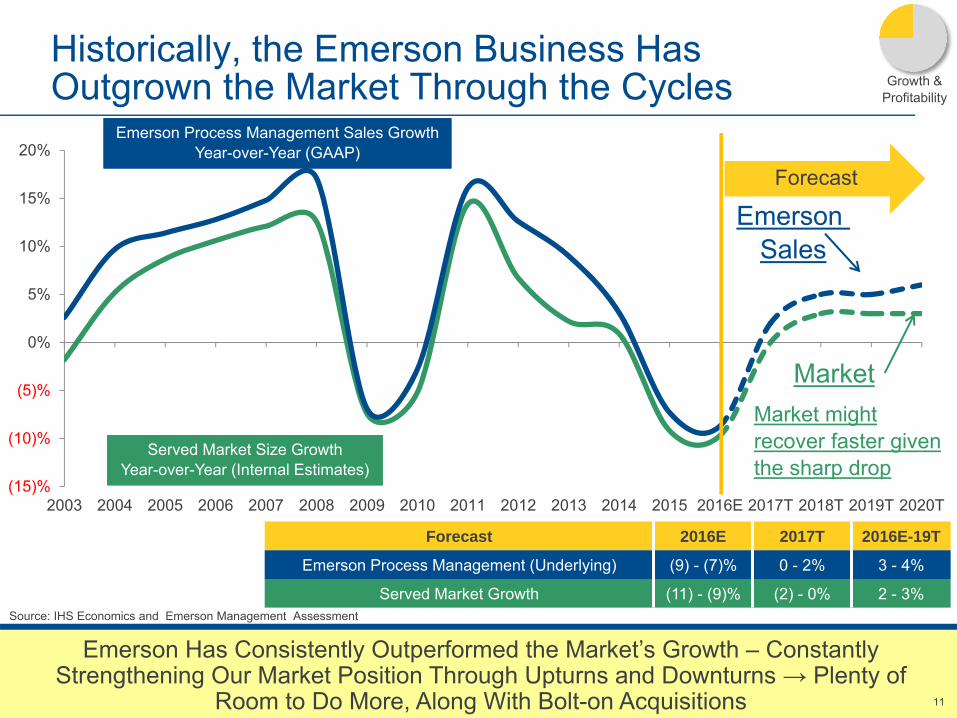
Historically, the Emerson Business HasOutgrown the Market Through the Cycles
Emerson Has Consistently Outperformed the Market’s Growth – Constantly Strengthening Our Market Position Through Upturns and Downturns → Plenty of
Room to Do More, Along With Bolt-on Acquisitions
Emerson Process Management Sales GrowthYear-over-Year (GAAP)
Emerson Process Management Sales GrowthYear-over-Year (GAAP)
Served Market Size GrowthYear-over-Year (Internal Estimates)
Served Market Size GrowthYear-over-Year (Internal Estimates)
Forecast
Growth & Profitability
Market might recover faster given the sharp drop
Forecast 2016E 2017T 2016E-19T
Emerson Process Management (Underlying) (9) - (7)% 0 - 2% 3 - 4%
Served Market Growth (11) - (9)% (2) - 0% 2 - 3%Source: IHS Economics and Emerson Management Assessment
Emerson Sales
Market

12
This Slide Intentionally Omitted

13
Realigning the Portfolio Will Allow Us toFocus Our Management and Investments on Stronger Near-Term Growth Markets
Chemicals & Refining• Investments continue in downstream value-chain
in Middle East / Africa• Reduced feedstock prices in North America drive
investments in Chemical industry• Asia Pacific will continue investments, but at a
slower rate
Power• Power investments driven by increasing
demand in emerging markets and modernization spending
• China’s commitment to Nuclear driving significant project funnel
• North America investments moving to combined cycle and gas
Life Sciences
• Life Science investments continue based on global demands and growing middle class
• Growth seen broadly in Europe, Asia, and North America
Midstream Oil & Gas
• Global monetization of gas drives Floating LNG, terminals, and increased need for pipeline & terminal automation
• Refineries margins are up; demanding more versatility of their plants to handle different crudes
2017-2019 Growth Outlook : ~4%
2017-2019 Growth Outlook : 3% – 5%
2017-2019 Growth Outlook : ~4%
2017-2019 Growth Outlook : ~4%
End Market Focus

14
This Slide Intentionally Omitted
1515
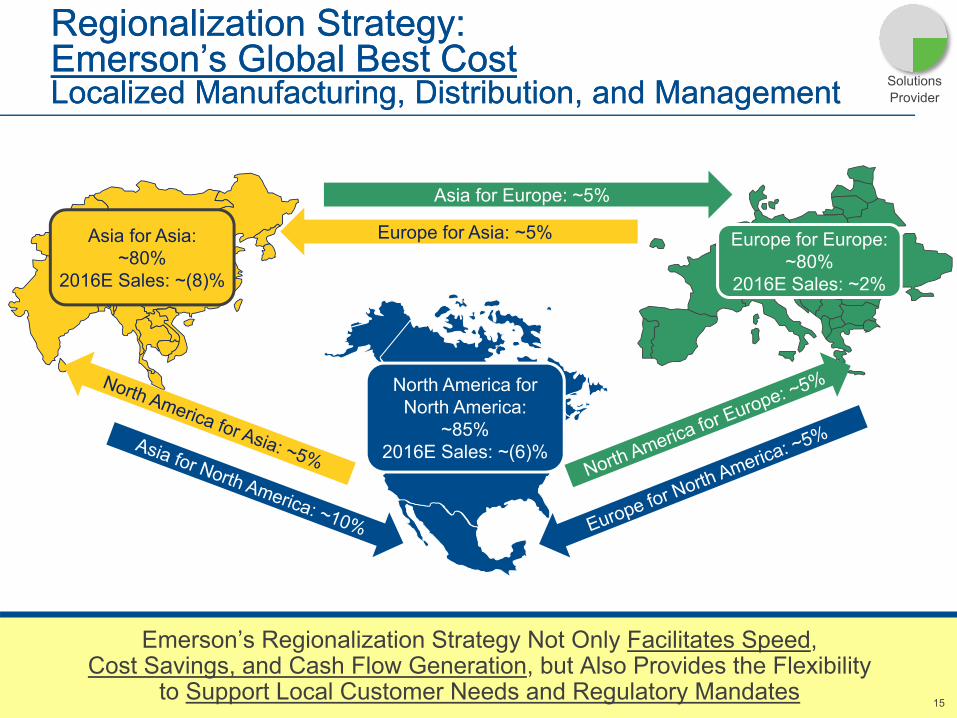
Regionalization Strategy:Emerson’s Global Best CostLocalized Manufacturing, Distribution, and Management
Regionalization Strategy:Emerson’s Global Best CostLocalized Manufacturing, Distribution, and Management
Emerson’s Regionalization Strategy Not Only Facilitates Speed,Cost Savings, and Cash Flow Generation, but Also Provides the Flexibility
to Support Local Customer Needs and Regulatory Mandates
Asia for Europe: ~5%
Europe for Asia: ~5%Asia for Asia: ~80%
2016E Sales: ~(8)%
Europe for Europe:~80%
2016E Sales: ~2%
North America for North America:
~85% 2016E Sales: ~(6)%
Solutions Provider
1616
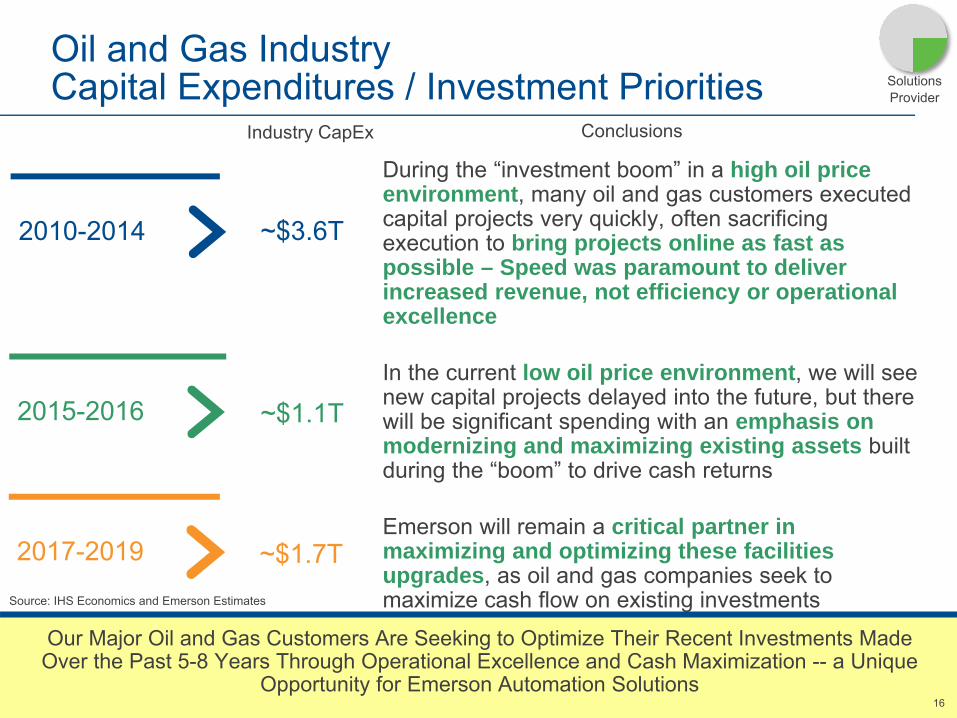
Oil and Gas Industry Capital Expenditures / Investment Priorities
Our Major Oil and Gas Customers Are Seeking to Optimize Their Recent Investments Made Over the Past 5-8 Years Through Operational Excellence and Cash Maximization -- a Unique
Opportunity for Emerson Automation Solutions
2010-2014
2015-2016
2017-2019
~$3.6T
~$1.1T
~$1.7TSource: IHS Economics and Emerson Estimates
Industry CapEx Conclusions
Solutions Provider
During the “investment boom” in a high oil price environment, many oil and gas customers executed capital projects very quickly, often sacrificing execution to bring projects online as fast as possible – Speed was paramount to deliver increased revenue, not efficiency or operational excellence
In the current low oil price environment, we will see new capital projects delayed into the future, but there will be significant spending with an emphasis on modernizing and maximizing existing assets built during the “boom” to drive cash returns
Emerson will remain a critical partner in maximizing and optimizing these facilities upgrades, as oil and gas companies seek to maximize cash flow on existing investments

17
This Slide Intentionally Omitted

18
This Slide Intentionally Omitted

19
This Slide Intentionally Omitted

20
Markets and
Customers
Brand
Business Platforms
Product Lines
AutomationSolutions
Includes:
• Systems and Solutions• Final Control• Measurement and Analytical• Flow• Discrete and Industrial
Includes:
• Air Conditioning • Refrigeration• Electronics and Solutions• Sensors and Controls• Tools and Home Products
Industries Served:Oil and GasRefiningChemicalPowerLife Sciences
Commercial & Residential Solutions
Customer Categories:ConstructionCommercial BuildingsFood RetailFood ServiceRetail Service
Food and BevMetals and MiningWater Discrete Manuf.Fluid Automation
TransportationContractorsHomeowners
Redefine and Focus the Emerson Portfolio for Higher Growth / Higher Value Built on Foundation of Proven Businesses
$10+B $5+B

21
Emerson New Business Focus and Market Growth Opportunities
Near-Term Growth DriversAutomation Solutions
• Lifecycle Services• Hybrid and Discrete
Automation • Wireless Solutions • Pipeline Management• Integrated Coordination
and Control• Bolt-on Acquisitions
Commercial & Residential Solutions• Retail Solutions• Environmentally Friendly
Refrigerants• Sensors, Controls
and Connectivity• Global Disposer
Adoption• E-commerce• Bolt-on Acquisitions
Transformational OpportunitiesAutomation Solutions
• Pervasive Sensing• Digitalization of Installed
Base• Enriched Business Models
to improve Energy Management, Reliability and Safety
• Strategic Acquisitions
Commercial & Residential Solutions• Residential Solutions• Commercial Solutions• Transportation Solutions • Food Waste
to Energy• Strategic Acquisitions
Automation Solutions
$100B Potential
$10.1B $5.3B
Commercial & Residential Solutions$30BPotential
$15.4B

2222
Commercial & Residential Solutions BusinessThe Value Proposition and Strategic Growth Rationale• The Commercial & Residential Solutions business has a strong
history of growth and profitability, built upon our ability to lead the industry through change with technology and application expertise
• Four end markets will drive our growth in the near term –Residential, Commercial, Food Service / Retail, and Transport
• We have an extensive portfolio of products, services, and solutions that puts us in a unique position to deliver superior value to end customers
• We continue to invest in intelligent technologies, integrated solutions and new business models to drive value-creating change in our markets
• The new platform offers acquisition growth opportunities within the core market segments and in new white-space adjacencies
We Will Leverage Our Industry Shaping Technology and Deep Expertise to Keep People Comfortable and Healthy and Their Food and Water Safe in an
Environmentally Responsible Way
2323
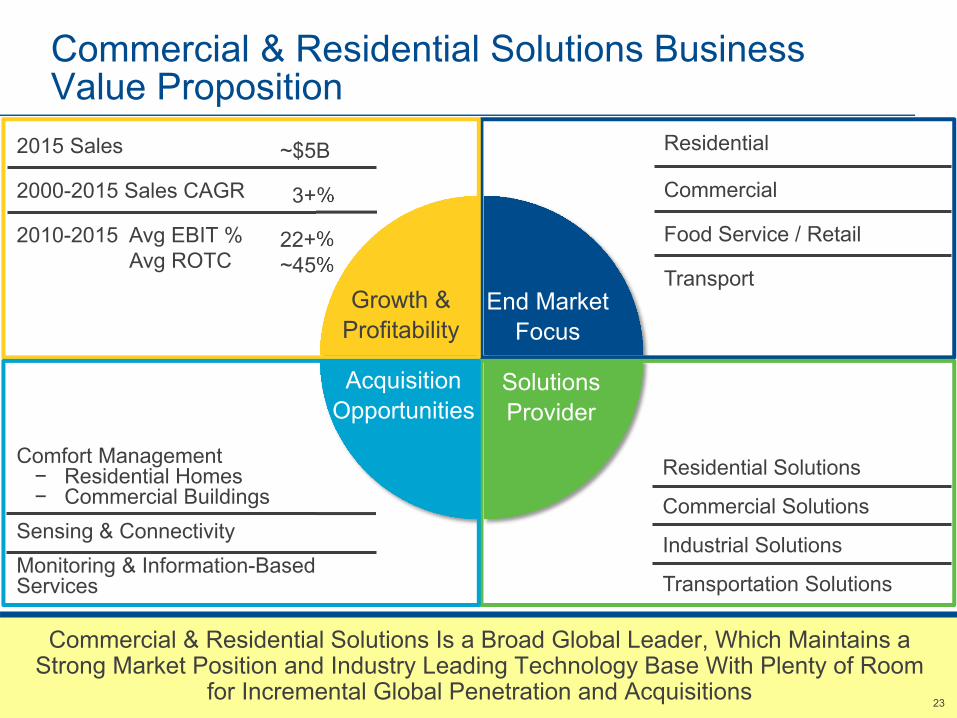
Comfort Management− Residential Homes− Commercial Buildings
Sensing & ConnectivityMonitoring & Information-Based Services
Residential Solutions
Commercial Solutions
Industrial Solutions
Transportation Solutions
2015 Sales ~$5B
2000-2015 Sales CAGR 3+%
2010-2015 Avg EBIT %Avg ROTC
22+%~45%
Commercial & Residential Solutions BusinessValue Proposition
Commercial & Residential Solutions Is a Broad Global Leader, Which Maintains a Strong Market Position and Industry Leading Technology Base With Plenty of Room
for Incremental Global Penetration and Acquisitions
Growth & Profitability
Acquisition Opportunities
Solutions Provider
End Market Focus
Residential
Commercial
Food Service / Retail
Transport
24
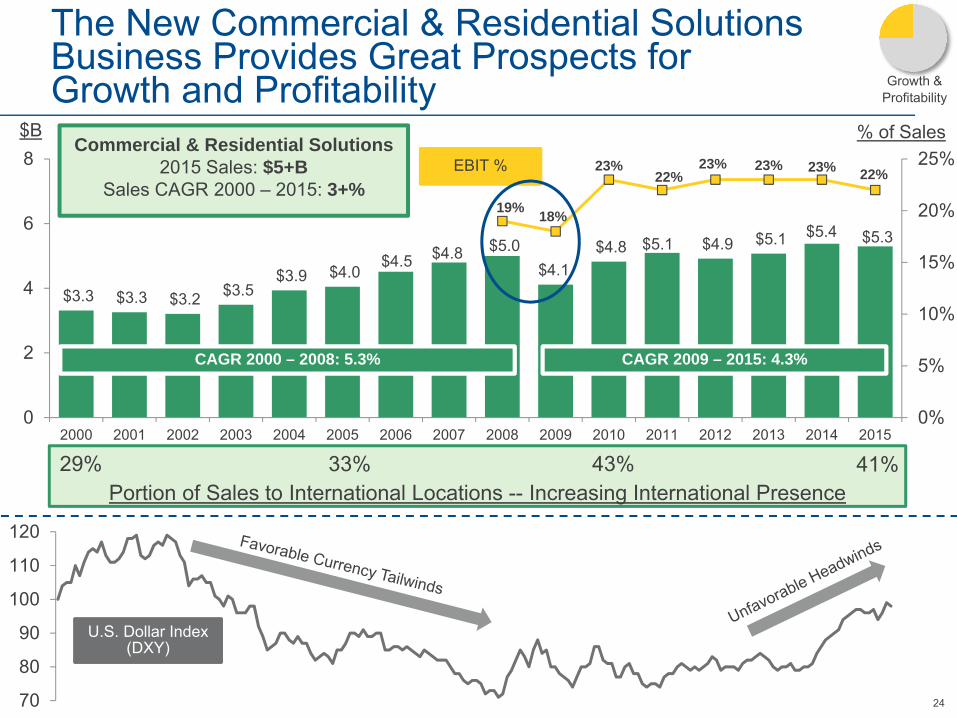
$3.3 $3.3 $3.2 $3.5 $3.9 $4.0
$4.5 $4.8 $5.0 $4.1
$4.8 $5.1 $4.9 $5.1 $5.4 $5.3
19% 18%
23%22%
23% 23% 23% 22%
0%
5%
10%
15%
20%
25%
0
2
4
6
8
2000 2001 2002 2003 2004 2005 2006 2007 2008 2009 2010 2011 2012 2013 2014 2015
The New Commercial & Residential Solutions Business Provides Great Prospects forGrowth and Profitability
EBIT %
CAGR 2009 – 2015: 4.3%
Commercial & Residential Solutions2015 Sales: $5+B
Sales CAGR 2000 – 2015: 3+%
CAGR 2000 – 2008: 5.3%
29% 33% 43% 41%
Growth & Profitability
$B % of Sales
Portion of Sales to International Locations -- Increasing International Presence
70
80
90
100
110
120
U.S. Dollar Index(DXY)

25
Energy Efficiency
Emerging Market Expansion Connectivity
Environmental Standards
Emerson Has Shown Agility Through Multiple Regulatory and Disruptive Technology Changes
• Emerson has effectively managed the ongoing transition to more environmentally friendly refrigerants in the HVAC and refrigeration markets
• More countries have adopted efficiency requirements and Emerson is adept at identifying, capturing, and leading the industry transitions
• As the emerging market middle class and business environment has grown, Emerson has met and led the changing demands in the HVAC and perishable food cold chain environments
• As the internet of things disruption continues to unfold, Emerson is well positioned to lead the integration with our suite of technologies and solutions for homes, commercial buildings, and the cold chain
25
We Will Continue to Quickly Adapt, Lead, and Capitalize on Opportunities Within Our Industries During Periods of Disruptive Change
Growth & Profitability

26Source: IHS Economics and Management Assessment, 2017 – 2019 Outlook
• Air Conditioning & Heating – Energy conservation, home automation / wireless, mobile control of home comfort
• Construction – Continued trend of housing starts and consumer spending on home repair, renovation, shifting home format in emerging markets
• Air Conditioning & Heating – Emerging market growth, energy scarcity, indoor air quality, building automation
• Construction – Non-residential construction expansion modest in 2016, with growth expected in 2017
• Growth in perishable shipments by marine container
• Food safety modernization act and spoilage minimization
• Public transportation growth in emerging markets
Residential Commercial
Food Service / Retail Transport
• Sensors and real-time monitoring services
• Food safety modernization act and spoilage minimization
• Growing numbers of small format stores• Cold chain development in emerging
markets
Our End Markets Show Good Prospects forGrowth Driven by Key Macro and Government Driven Trends End Market
Focus

2727
Focusing on Specific End Customers Categories Will Enhance Our Value Proposition
Realigning the Commercial & Residential Business Will Expand Our Solutions Offering, and Enhance Emerson’s Relevance With End Customers
Commercial Buildings• Create connectivity solutions offering• Lead cordless transition from traditional corded
cleaning solutions• Enable diagnostics and cleaning management
solutions through sensors and other intelligence equipment
• Start to build commercial building data platform
Contractors• Help contractors become more efficient with
electronics – “Check Engine” solution• Leverage use of service contracts • Focus on e-commerce and omni-channel
selling• Digital engagement (social networks and
forums)
Retail Sites• Adoption of building control solutions• Food retail: reliability need for food safety
and operational efficiency • Address retail and grocery chain food waste
excess • Leverage areas with food waste to landfill
bans
Homeowners• Connected Home • Installed solutions to maximize comfort,
efficiency, & reliability• Increase presence in retail channel • Direct e-commerce channel
End Market Focus

2828
Residential
Evolution of Commercial & ResidentialSolutions Business
Over the Years, We Have Developed Capabilities Towards Solutions-Oriented and Multi-Customer Focused Business Models
Why? Expands Markets, Expands Value, Expands Relevance, and Expands Profitability
Prior to 1995 1995 – 2000 2000 – 2010 2010 – 2015 Beyond 2015
Transport
Food Service / Retail
Commercial
New MarketsMarket Focus
Technology Focus
Customer Focus
OEM Multi-Channel• Home Owners• Consultants• Contractors• Utilities• Big Box Retailers
Components, Tools, Sensors
Solutions Provider
Electronic Controls
Software & System Controls
Integrated Solutions
New Business Models

29
We Offer a Unique Portfolio of Solutions forVarious Customer Segments, With FutureOpportunities for Expansion
Energy Efficiency
Sustainability Productivity E-Commerce Connectivity / Monitoring
Emerging Markets
Residential
Commercial
Food Serv. / Retail
Transport
Residential Commercial Food Serv. / Retail Transport• Our innovations around
energy efficient solutions help customers save costs
• Developing a solutionsportfolio around home comfort
• Driving waste disposer solutions through technology innovations
• New energy efficient upgrades enable customers to quickly comply with regulations
• Air quality monitoring solutions increase comfort & productivity
• Connectivity solutions enable real-time monitoring of facilities
• Our comprehensive approach helps customers evaluate their refrigeration system holistically
• Growing presence with major food retailers by providing end-to-end solutions
• Focusing investments on emerging marketscold chain growth
• Our innovative compressor technology reduces costs & downtime
• Our cargo monitoring solutions improve operational efficiency of fleets
• Food safety tracking solutions reduce food waste
Market DriversKey
Markets
Robust Offering Developing Offering
Solutions Provider
Legend:

30
This Slide Intentionally Omitted

31
This Slide Intentionally Omitted
3232
Automation Solutions and Commercial & Residential Solutions Provide the Foundation for Our Future
• Rebasing to two global franchise platforms allows the company to effectively pivot towards and concentrate on higher growth and higher margin businesses -- with ample growth opportunities
• It also gives us the runway to focus on providing top-tier solutions and services to all of our global customers
• Expands the relevant market space for Emerson’s core businesses• Facilitates more simple, cohesive, and navigable brand offerings for our
customers• Focuses on customer end markets that are more receptive and adoptive
to high value technology offerings -- global franchise• Creates the right size corporate “umbrella” that is small enough to
effectively assimilate and nurture bolt-on additions, but also large enough to accommodate adoption and integration of significant, transformational acquisitions
The Corporate Organization Will Be Refocused and Smaller to Support the Two Large Global Franchise Businesses -- A New Approach Versus the Last 15 Years of
Expansion to Serve a More Diverse Company

33
This Slide Intentionally Omitted

34
This Slide Intentionally Omitted

35
This Slide Intentionally Omitted
3636
• Transforming a $25B company down to $15B, and back up to a $20B global enterprise in a challenging global economic / business environment
– While protecting and improving profitability -- OP Margin, EBIT Margin and ROTC
• Resetting a stronger and more profitable, flexible balance sheet company
– With the ability to control our own destiny through internal investments, acquisitions, and share repurchase
• Rebalancing the touch points and leverage points between the two business platforms and corporate support & services
• Executing an orderly transition to a new organizational structure and leadership team
Our Focus Is to Return to a Premium Growth, Premium Profitability, and Then Premium Valuation
2016-2019: Emerson Has Embarked on a Unique Transition Period to a New Stronger, More Dynamic, More Valuable Company

3737
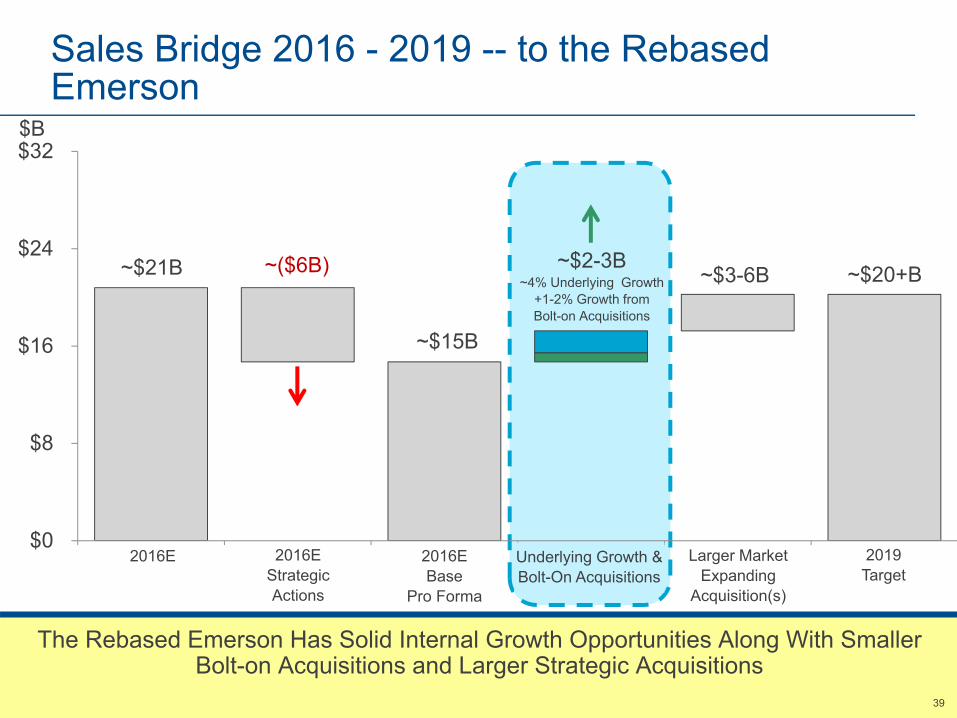
Sales Bridge 2016 - 2019 -- to the Rebased Emerson
The Rebased Emerson Has Solid Internal Growth Opportunities Along With Smaller Bolt-on Acquisitions and Larger Strategic Acquisitions
$0
$8
$16
$24
$32
2016E 2016 StrategicActions
2016 Base ProForma
Underlying Growth TransformationalAcquisition(s)
2019 Target
~$15B
~($6B) ~$3-6B ~$20+B
$B
2016E 2016E Strategic Actions
2016E Base
Pro Forma
Larger Market Expanding
Acquisition(s)
2019 Target
~$21B ~$2-3B~4% Underlying Growth
+1-2% Growth from Bolt-on Acquisitions
Underlying Growth & Bolt-On Acquisitions

3838
World Gross Fixed Investment Trends: 2016-2019 Expectations
We Expect Emerging Markets to Re-Establish a Generally Stronger Growth Profile Over Mature Markets Starting in 2017 --
Emerson Is Well Positioned to Capitalize on This Trend
Canada
2016E - 2019P~2.5%
United States
2016E - 2019P~4.0%
Europe
2016E - 2019P~2.5%
Source: IHS Economics and Emerson Management Assessment
Latin America
2016E - 2019P~2.5%
2016E - 2019P~4.5%
China
2016E - 2019P~5.0%
Asia Pacific
2016E - 2019P~5.0%
Middle East & Africa
World
2016E - 2019P~3.5%
3939
Sales Bridge 2016 - 2019 -- to the Rebased Emerson
The Rebased Emerson Has Solid Internal Growth Opportunities Along With Smaller Bolt-on Acquisitions and Larger Strategic Acquisitions
$0
$8
$16
$24
$32
2016E 2016 StrategicActions
2016 Base ProForma
Underlying Growth TransformationalAcquisition(s)
2019 Target
~$15B
~($6B) ~$2-3B~4% Underlying Growth
+1-2% Growth from Bolt-on Acquisitions
$B
2016E 2016E Strategic Actions
2016E Base
Pro Forma
Underlying Growth & Bolt-On Acquisitions
Larger Market Expanding
Acquisition(s)
2019 Target
~$3-6B ~$20+B~$21B

40
This Slide Intentionally Omitted
4141
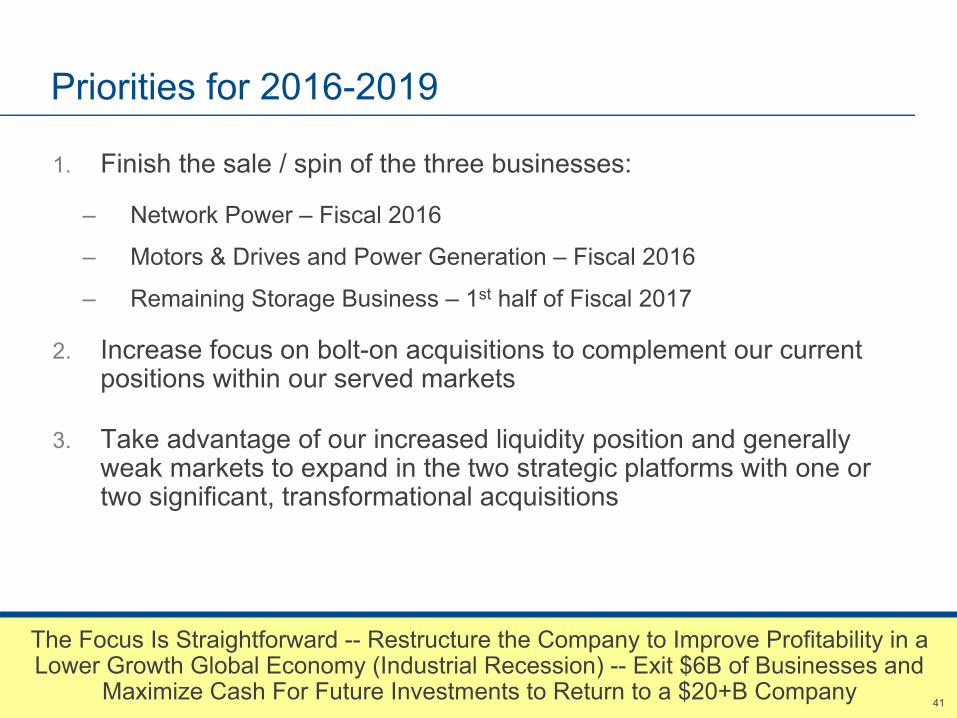
Priorities for 2016-2019
1. Finish the sale / spin of the three businesses:
– Network Power – Fiscal 2016
– Motors & Drives and Power Generation – Fiscal 2016
– Remaining Storage Business – 1st half of Fiscal 2017
2. Increase focus on bolt-on acquisitions to complement our current positions within our served markets
3. Take advantage of our increased liquidity position and generally weak markets to expand in the two strategic platforms with one or two significant, transformational acquisitions
The Focus Is Straightforward -- Restructure the Company to Improve Profitability in a Lower Growth Global Economy (Industrial Recession) -- Exit $6B of Businesses and
Maximize Cash For Future Investments to Return to a $20+B Company

4242
The 2016 Pro-Forma Company Illustrates the Core Emerson Strength Gained Through Realignment
This Assumes We Deliver the Mid-Point of Our 2016E Forecast and We Have Executed on the Spin / Sale of the Network Power Business and We Complete the
Sale of the Motors & Drives / Power Generation Businesses by September 30, 2016-- A View of the P&L of the Rebased Emerson
2016E2016E
Pro-Forma
Sales ~$20.6B ~$15B
Gross Profit % ~41.2% ~43.9%
EBIT %* ~15.4% ~18.3%
Net Income ~$2.0B ~$1.7B
EPS ~$3.15 ~$2.6012016E excludes separation costs related to portfolio repositioningNote: Pro Forma assumes all strategic actions have been completed

4343
$2.00
$2.50
$3.00
$3.50
$4.00
2016E 2016 StrategicActions
2016 Base ProForma
UnderlyingGrowth
Repo TransformationalAcquisition(s)
2019 Target
EPS Bridge 2016 - 2019 – to the Rebased Emerson
The Goal of the New, Smaller, More Profitable Emerson Is to Grow Faster, Expand EBIT Margins, and Increase Acquisitions to Drive a Faster EPS Growth Company
~$2.60
~($0.55)
~$0.12-0.17~$0.70-0.80(~8% CAGR)
~$0.18-0.23 ~$3.60-3.80
2016E Separated Businesses
2016E Base
Pro Forma
Underlying Growth
Share Repurchase
Acquisition(s) 2019 Target
2016E
~$3.15
2016E Guidance Range* is $3.05-3.25
3-year CAGR11-14%
Underlying Sales Growth: ~4%EBIT Expansion: ~4%
Note: Pro Forma assumes all strategic actions have been completed
4444
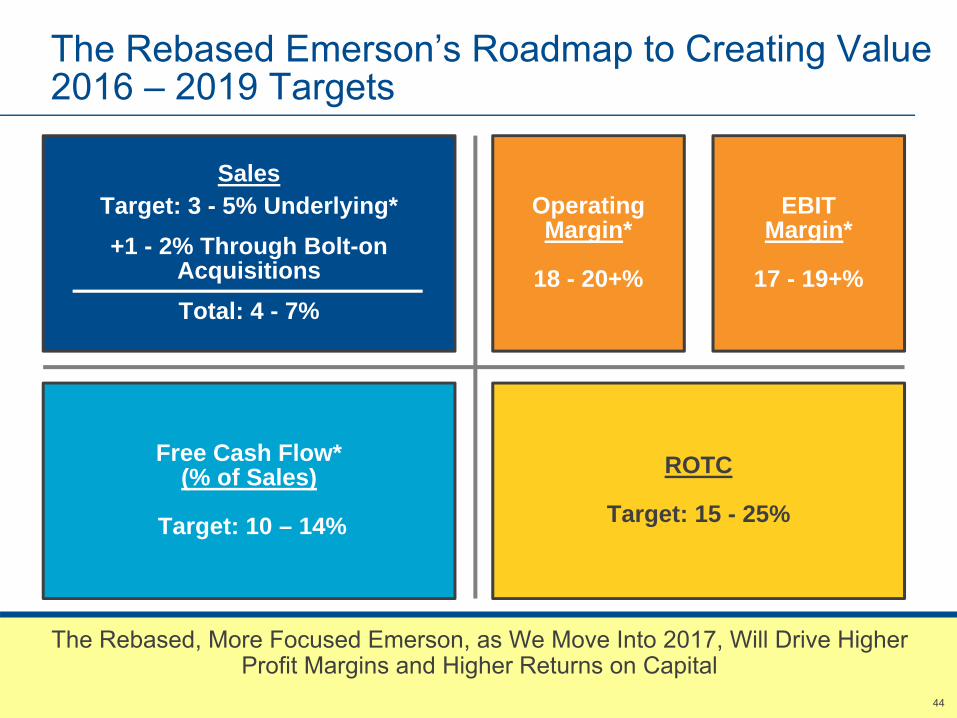
The Rebased Emerson’s Roadmap to Creating Value 2016 – 2019 Targets
The Rebased, More Focused Emerson, as We Move Into 2017, Will Drive Higher Profit Margins and Higher Returns on Capital
SalesTarget: 3 - 5% Underlying*+1 - 2% Through Bolt-on
AcquisitionsTotal: 4 - 7%
Free Cash Flow*(% of Sales)
Target: 10 – 14%
Operating Margin*
18 - 20+%
ROTC
Target: 15 - 25%
EBIT Margin*
17 - 19+%
4545
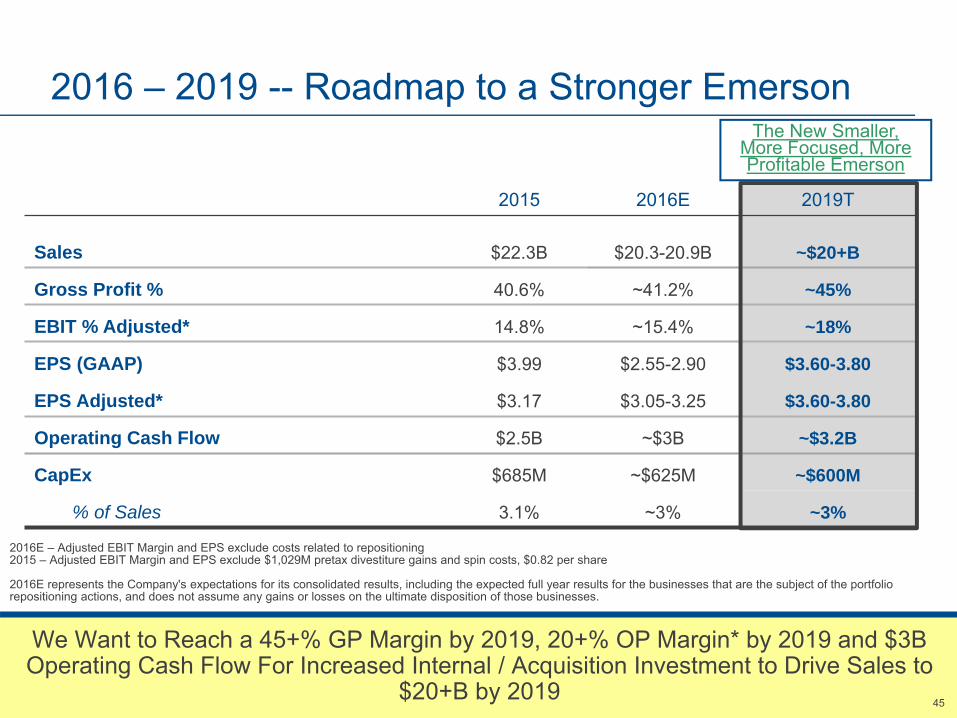
2015 2016E 2019T
Sales $22.3B $20.3-20.9B ~$20+B
Gross Profit % 40.6% ~41.2% ~45%
EBIT % Adjusted* 14.8% ~15.4% ~18%
EPS (GAAP) $3.99 $2.55-2.90 $3.60-3.80
EPS Adjusted* $3.17 $3.05-3.25 $3.60-3.80
Operating Cash Flow $2.5B ~$3B ~$3.2B
CapEx $685M ~$625M ~$600M
% of Sales 3.1% ~3% ~3%
2016 – 2019 -- Roadmap to a Stronger Emerson
We Want to Reach a 45+% GP Margin by 2019, 20+% OP Margin* by 2019 and $3B Operating Cash Flow For Increased Internal / Acquisition Investment to Drive Sales to
$20+B by 2019
The New Smaller,More Focused, More Profitable Emerson
2016E – Adjusted EBIT Margin and EPS exclude costs related to repositioning2015 – Adjusted EBIT Margin and EPS exclude $1,029M pretax divestiture gains and spin costs, $0.82 per share
2016E represents the Company's expectations for its consolidated results, including the expected full year results for the businesses that are the subject of the portfolio repositioning actions, and does not assume any gains or losses on the ultimate disposition of those businesses.

46
Key Messages For 2016-2019 ActionsActions
Step 1
Restructure and reduce costs in-line with a challenging global economy and a smaller, more focused Emerson
Started February 2015 and ongoing through 2016 – 2017, until global growth returns
Step 2
Complete the spin or sale of the Network Power business, and sale of the Motors & Drives / Power Generation businesses and the remaining storage business
Started June 2015 -- Targeted to be completed by September 2016 (ClosetMaid by 1st half of 2017)
Step 3
Aggressively pursue acquisitions to rebuild the new core, focused Emerson to ~$20B
On-going and increasing focus

4747
2015 2016E 2019T
Sales $22.3B $20.3-20.9B ~$20+B
Gross Profit % 40.6% ~41.2% ~45%
EBIT % Adjusted* 14.8% ~15.4% ~18%
EPS (GAAP) $3.99 $2.55-2.90 $3.60-3.80
EPS Adjusted* $3.17 $3.05-3.25 $3.60-3.80
Operating Cash Flow $2.5B ~$3B ~$3.2B
CapEx $685M ~$625M ~$600M
% of Sales 3.1% ~3% ~3%
2016 – 2019 -- Roadmap to a Stronger Emerson
We Want to Reach a 45+% GP Margin by 2019, 20+% OP Margin* by 2019 and $3B Operating Cash Flow For Increased Internal / Acquisition Investment to Drive Sales to
$20+B by 2019
The New Smaller,More Focused, More Profitable Emerson
2016E – Adjusted EBIT Margin and EPS exclude costs related to repositioning2015 – Adjusted EBIT Margin and EPS exclude $1,029M pretax divestiture gains and spin costs, $0.82 per share
2016E represents the Company's expectations for its consolidated results, including the expected full year results for the businesses that are the subject of the portfolio repositioning actions, and does not assume any gains or losses on the ultimate disposition of those businesses.
48
Non-GAAP Reconciliations
• The 2016E financial measures contained herein represent the Company’s expectations for its consolidated results including the expected full year results for the businesses that are the subject of the portfolio repositioning actions, and does not assume any gain or loss on the sale of those businesses.
• Any “pro forma” or “rebased” financial measures contained herein represent the businesses that are expected to remain part of Emerson and comprise the Automation Solutions and Commercial & Residential Solutions business groups after completion of Emerson’s portfolio repositioning actions described herein.
• Operational tax rate excludes the impact of the costs associated with the planned spinoff or sale of the network power systems business and the other strategic repositioning actions being undertaken by the Company to provide additional insight into the tax rate applicable to the Company’s ordinary on-going operations and facilitate period-to-period comparisons. Management believes that presenting operational tax rate may be more useful for investors (U.S. GAAP measures: tax rate).
• References to underlying orders in this presentation refer to the Company's trailing three-month average orders growth versus the prior year, excluding currency, acquisitions and divestitures.

49
Non-GAAP Reconciliations2013 2014
Sales % chg. vs. PY Q1 Q2 Q3 Q4 Q1 Q2 Q3 Q4Underlying growth* 6% 2% (1%) 2% 3% 2% 3% 4%Acq/Div/FX (1%) (1%) (1%) 0% (2%) (4%) (4%) (4%)GAAP growth 5% 1% (2%) 2% 1% (2%) (1%) 0%
2015Sales % chg. vs. PY Q1 Q2 Q3 Q4 FYUnderlying growth* 5% 0% (5%) (7%) (2%)Acq/Div/FX (6%) (7%) (8%) (8%) (7%)GAAP growth (1%) (7%) (13%) (15%) (9%)
2016E sales % chg. vs 2015Process
ManagementIndustrial
Automation Network PowerClimate
Technologies
Commercial & Residential Solutions Total
Underlying growth* ~(9) - (7%) ~(6) - (3%) ~(2) - 0% ~0 - 3% ~1 - 4% ~(5) - (2%)Acq/Div/FX ~(1%) ~(8%) ~(3%) ~(1%) ~(16%) ~(4%)GAAP growth ~(10) - (8%) ~(14) - (11%) ~(5) - (3%) ~(1) - 2% ~(15) - (12)% ~(9) - (6%)
2016 2016ESales % chg. vs. PY Q1 Q2Underlying growth* (9%) ~(6) - (4%)Acq/Div/FX (7%) ~(4%)GAAP growth (16%) ~(10) - (8%)
Sales % chg. vs. PY 2016EHigh Mid-Range of (5) – (2)% Guidance Q3 Q4 FYUnderlying growth* ~0 - 2% ~0 - 2% ~(3%)Acq/Div/FX ~(3%) ~(3%) ~(4%)GAAP growth ~(3) - (1%) ~(3) - (1%) ~(7%)
50
Non-GAAP Reconciliations
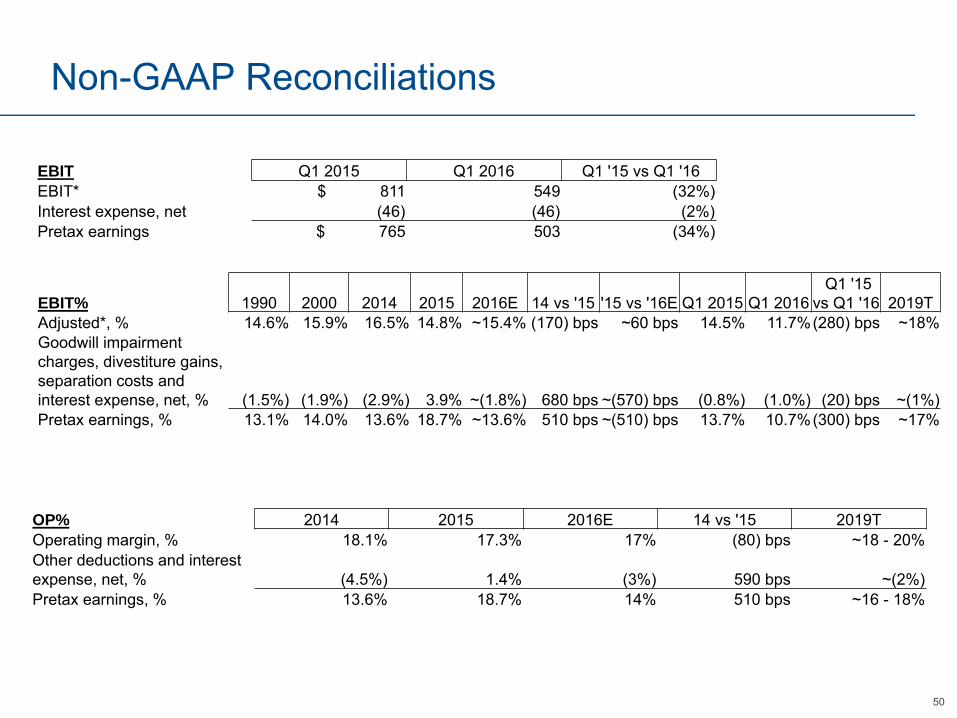
EBIT Q1 2015 Q1 2016 Q1 '15 vs Q1 '16EBIT* $ 811 549 (32%)Interest expense, net (46) (46) (2%)Pretax earnings $ 765 503 (34%)
EBIT% 1990 2000 2014 2015 2016E 14 vs '15 '15 vs '16E Q1 2015 Q1 2016Q1 '15
vs Q1 '16 2019TAdjusted*, % 14.6% 15.9% 16.5% 14.8% ~15.4% (170) bps ~60 bps 14.5% 11.7%(280) bps ~18%Goodwill impairment charges, divestiture gains, separation costs and interest expense, net, % (1.5%) (1.9%) (2.9%) 3.9% ~(1.8%) 680 bps ~(570) bps (0.8%) (1.0%) (20) bps ~(1%)Pretax earnings, % 13.1% 14.0% 13.6% 18.7% ~13.6% 510 bps ~(510) bps 13.7% 10.7%(300) bps ~17%
OP% 2014 2015 2016E 14 vs '15 2019TOperating margin, % 18.1% 17.3% 17% (80) bps ~18 - 20%Other deductions and interest expense, net, % (4.5%) 1.4% (3%) 590 bps ~(2%)Pretax earnings, % 13.6% 18.7% 14% 510 bps ~16 - 18%
51
Non-GAAP Reconciliations
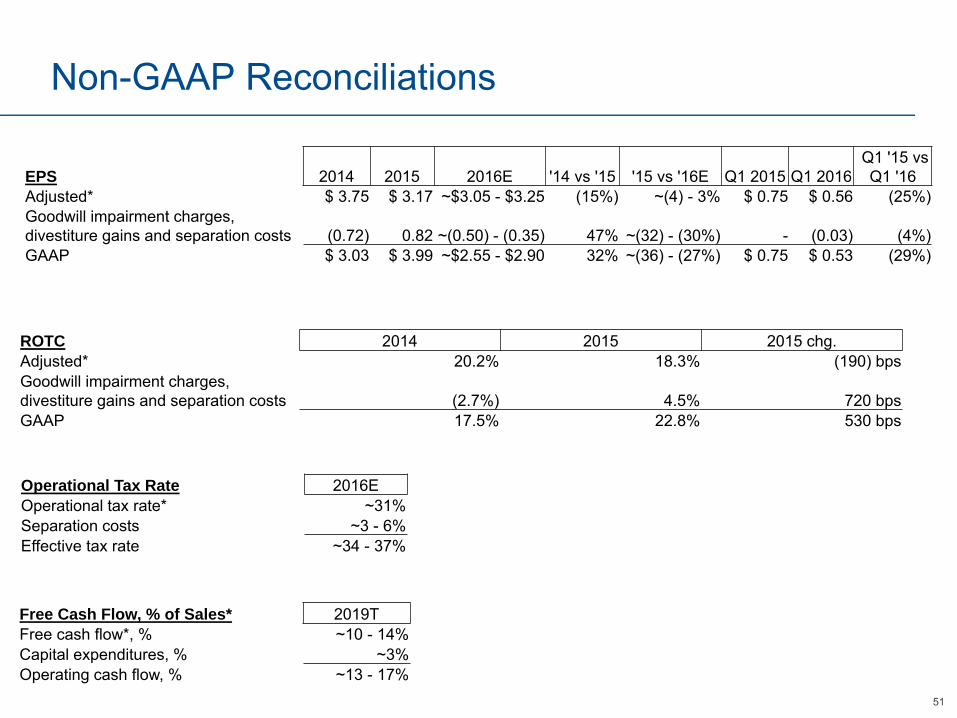
EPS 2014 2015 2016E '14 vs '15 '15 vs '16E Q1 2015 Q1 2016Q1 '15 vs Q1 '16
Adjusted* $ 3.75 $ 3.17 ~$3.05 - $3.25 (15%) ~(4) - 3% $ 0.75 $ 0.56 (25%)Goodwill impairment charges, divestiture gains and separation costs (0.72) 0.82 ~(0.50) - (0.35) 47% ~(32) - (30%) - (0.03) (4%)GAAP $ 3.03 $ 3.99 ~$2.55 - $2.90 32% ~(36) - (27%) $ 0.75 $ 0.53 (29%)
ROTC 2014 2015 2015 chg.Adjusted* 20.2% 18.3% (190) bpsGoodwill impairment charges, divestiture gains and separation costs (2.7%) 4.5% 720 bpsGAAP 17.5% 22.8% 530 bps
Operational Tax Rate 2016EOperational tax rate* ~31%Separation costs ~3 - 6%Effective tax rate ~34 - 37%
Free Cash Flow, % of Sales* 2019TFree cash flow*, % ~10 - 14%Capital expenditures, % ~3%Operating cash flow, % ~13 - 17%

52
Non-GAAP Reconciliations
Automation Solutions2016E
Pro FormaUnderlying* (8) - (6%)Acq./Div./FX (2%)GAAP Reported (10) - (8%)
Commercial & Residential Solutions2016E
Pro FormaUnderlying* 1 - 3%Acq./Div./FX (2%)GAAP Reported (1) - 1%
Debt / EBITDA* 2015 2016PFDebt / EBITDA, adjusted* 1.7 1.3
Impact of planned strategic actions, divestiture gains, separation costs, depreciation and amortization, interest expense, net and income taxes 0.8 0.8 Debt / Net earnings 2.5 2.1
2016 Pro forma (PF) assumes all strategic actions have been completed
Top Related