![CPA Vision project · CPA Vision Project [ 1 ] The CPAVision Project 2011 and Beyond The CPAVision Process is an unprecedented, profession-wide initiative undertaken by one of the](https://static.fdocuments.in/doc/165x107/5afbd1d17f8b9a446590d1be/cpa-vision-vision-project-1-the-cpavision-project-2011-and-beyond-the-cpavision.jpg)


Languages
Pages
Legal


2015 CPA PROFESSION
COMPENSATION STUDY
REPORT
2015
FALL 2015

2015 CPA Profession Compensation Study
1
Table of Contents Contents Summary of Key Findings .............................................................................................................................. 2
Methodology ................................................................................................................................................. 4
Note on Reporting ........................................................................................................................................ 4
Feedback on this Report ............................................................................................................................... 5
Structure of the Summary Report ................................................................................................................ 5
Section 1: Overall Compensation .................................................................................................................. 6
All CPA Members (National & International) ............................................................................................ 6
Total Compensation by Industry – 2014 v 2012 ....................................................................................... 8
Owners Compensation............................................................................................................................ 10
Non-Owners Compensation.................................................................................................................... 10
Non-Base Compensation ........................................................................................................................ 11
Compensation by Province ..................................................................................................................... 11
Sole Practitioners .................................................................................................................................... 12
Partners ................................................................................................................................................... 13
Owners of Other Businesses ................................................................................................................... 14
Non-Owners ............................................................................................................................................ 14
Prospects for 2015 .................................................................................................................................. 15
Compensation by Major Cities ................................................................................................................ 17
Compensation by Job Title ...................................................................................................................... 20
Compensation by Area of Focus ............................................................................................................. 21
Compensation by Years of Work Experience .......................................................................................... 23
Section 2: Vacation, Benefits, Work/Life Balance, and Leaves ................................................................... 26
Vacation Entitlement .............................................................................................................................. 24
Benefits by Employer Size ....................................................................................................................... 25
Benefits by Industry ................................................................................................................................ 26
Work/Life Balance ................................................................................................................................... 29
Work/Life Balance Programs Used by Industry ...................................................................................... 29
Leaves...................................................................................................................................................... 30

2015 CPA Profession Compensation Study
2
Summary of Key Findings
The findings of this report are based on a sample of 27,863 professional accountants and may not, in all
cases, represent the profession as a whole. Please refer to the Methodology section for more details.
Compensation
Findings from the 2015 Member Compensation Study (which reviews self-reported 2014
compensation figures provided by members of the CPA profession) reveal that holding the CPA
designation is quite lucrative with an average annual compensation of $151K, and a median of
$108K among members.
Compared to compensation levels reported in 2012, mean compensation increased by
approximately 7% in 2014 with median compensation showing an increase of 3%. For
reference, mean compensation in 2012 was $141K, while the median was $105K.
From a provincial standpoint, average compensation among all members was highest in Alberta
($184K), followed by Ontario ($150K), and Saskatchewan ($146K). Average compensation was
also above average in both the Northwest Territories ($204K) and Nunavut ($181K). However,
compensation results for members in the territories should be interpreted with caution due to
small sample sizes.
In cities with at least 100 members, mean compensation in 2014 was highest for those living in
Calgary, Edmonton and Toronto ($196K, $167K and $167K, respectively).
That said, it is much more lucrative for CPAs to work internationally with average compensation
figures for 2014 at $284K (vs. $146K nationally). Focusing on individual counties, members
based out of the Cayman Islands, Singapore, Hong Kong, United Arab Emirates and the United
States are averaging over $320K. Interestingly, members working internationally only had one
more year of work experience (on average) compared to those working within Canada.
Members working in the Mining, Holding and Conglomerate and Oil and Gas industries reported
the highest mean compensation overall ($227K, $223K and $212K, respectively). This is
consistent with compensation levels reported in 2012 where the same three industries received
the highest mean compensation.
Industries with the highest median compensation gain (based on the percentage increase
between 2012 and 2014) include Pharmaceuticals and Chemicals (+20% over 2012) and Hotels
and Restaurants/Food services (+11% over 2012).
Looking ahead, the majority of members expect their compensation to increase in 2015 with the
exception of those in the Oil & Gas sector where less than half (45%) of members expect an
increase over the next 12 months. More than one in five members in the Oil & Gas industry also
expect a decrease (21%), the highest among all the industries.
Approximately one-in-ten professional accountants reported owning a business in 2014. The
majority of these members owned accounting firms while the rest owned another form of
business. In terms of monetary incentives, it is most financially rewarding to be an owner of a
non-accounting based firm as average compensation was $316K in 2014. Comparatively,
Partners of an accounting firm earned $211K on average with Sole Practitioners earning $136K
and Partners earning $276K in 2014.
2015 CPA Profession Compensation Study
3
On average, non-owners earned $141K in 2014, of which, $114K was attributed to their base
compensation (i.e. salary) while $27K came from Non-Base Compensation. Overall, non-base
compensation was driven by bonuses with over half (55%) of members receiving this type of
compensation.
Among non-owners, the highest mean compensation goes to members who spend the majority
of their time on Investments, Management/General Management, Strategy & Governance,
Operations and Business Development/Management.
Not surprisingly, professional accountants with the titles of President/CEO and Senior Vice
President earned the highest overall compensation in 2014 (each receiving $402K and $397K,
respectively).
Vacation, Leave, Benefits, and Work/Life Balance
In 2014, the bulk of professional accountants were entitled to a vacation of about 3-5 weeks (15
to 24 working days) in 2014 with only one in twenty (5%) entitled to fewer than 3 weeks (15
days). There is, however, a gap in usage, with 18% of members having taken 14 days of vacation
or less, despite being entitled to more days.
In terms of workplace benefits, CPA Canada members were most likely to have received medical
(health and dental) benefits (85%) followed by Life Insurance (66%), Long Term Disability
Insurance (63%) and Pension Benefits (53%). Fewer than one-in-ten (8%) members did not
receive any workplace benefits in 2014.
Training programs, flexible working hours, leaves for personal reasons and employee assistance
programs were the most likely work/life balance programs to be offered to employees. The
most used work/life balance programs were training programs and being able to work from
home which were utilized by about eight-in-ten eligible members (81% and 79%, respectively).
Sabbaticals are currently being under-utilized by employees with fewer than one-in-ten (7%)
taking advantage of the program even though it’s offered to 17% of employees.
About one-quarter (24%) of members have taken time off for maternity/paternity/parental
leave while one-in-ten (10%) have taken a medical leave at some point in their career.

2015 CPA Profession Compensation Study
4
Introduction
CPA Canada commissioned Harris Poll, a division of Nielsen, to conduct a compensation survey of 29,744
Chartered Professional Accountants between June 18, 2015 and July 16, 2015. This report relies on self-
reported compensation from professional accountants answering the survey. Although attempts were
made to minimize respondents’ data entry errors by removing inconsistent data, no attempts were
made to independently verify the data they provided.
When reviewing the mean averages it is important to consider that a small portion of responses may
skew the mean average quite higher than it would be otherwise. In most cases a better measure of a
typical compensation level is the median.
Methodology CPA Canada commissioned Harris Poll, a division of Nielsen to conduct quantitative research among its
active and retired members. Survey invitations were sent to 184,430 via email, with 18,627 bounce
backs for a total of 165,803 members receiving the email. There were 29,744 members who responded
for a response rate of 18%. There were 1,719 who were excluded from the compensation data for a
total of 28,025 members who are included in the compensation analysis. Respondents who provided no
answers are excluded from analysis. In total, compensation data is reported for a total of 27,863
members.
It should be noted that findings in this report are representative of those responding and may not
precisely represent the CPA profession as a whole.
Unless otherwise specified, compensation figures shown in this report include annualized data for
members who worked at least two months, either part-time or full-time during 2014.
Note on Reporting To protect the privacy of respondents and to avoid misleading results, the mean and median for
compensation data is only presented when there are at least 10 respondents in a subcategory and upper
and lower quartile information is only shown when there are at least 20 respondents in a subcategory.
Definitions of the four statistical measures used in this report are provided below for reference:
• Mean: (also called average) is the sum of all cases divided by the total number of cases
• Median: (or 50th percentile) is the value above and below which half the cases fall. If there
is an even number of cases, then it is the average of the two middle cases. As compared to
the mean, the median is not sensitive to outlying (a few very high or very low) values. In
some cases this may make it a more reliable measure to compare individual compensation.
• 25th Percentile: is the value above which 75% of the cases fall
• 75th Percentile: is the value below which 75% of the cases fall
2015 CPA Profession Compensation Study
5
Interpreting Differences in Compensation Between 2014 and 2012 Although comparisons between 2014 and 2012 compensation figures have been made throughout the
report, these differences should be interpreted with caution due to methodological changes in the
survey design and reporting of results.
Feedback on this Report Questions or comments related to this report can be directed to Paul Long ([email protected]).
Structure of the Summary Report This report is organized into two sections. “Section 1: Compensation” includes overall compensation
data and compensation data broken out by demographic information. “Section 2: Vacation, Leave,
Benefits and Work/Life Balance” includes statistics on vacation received, leaves taken, benefits
provided, and work/life balance options offered and used.
Permission to Store or Reprint This publication is protected by copyright and written permission is required to reproduce, store in a
retrieval system or transmit in any form or by any means (electronic, mechanical, photocopying,
recording or otherwise).
For information regarding permission, please contact [email protected]
2015 CPA Profession Compensation Study
6
Section 1: Compensation
Overall Compensation
All CPA Members (National & International)
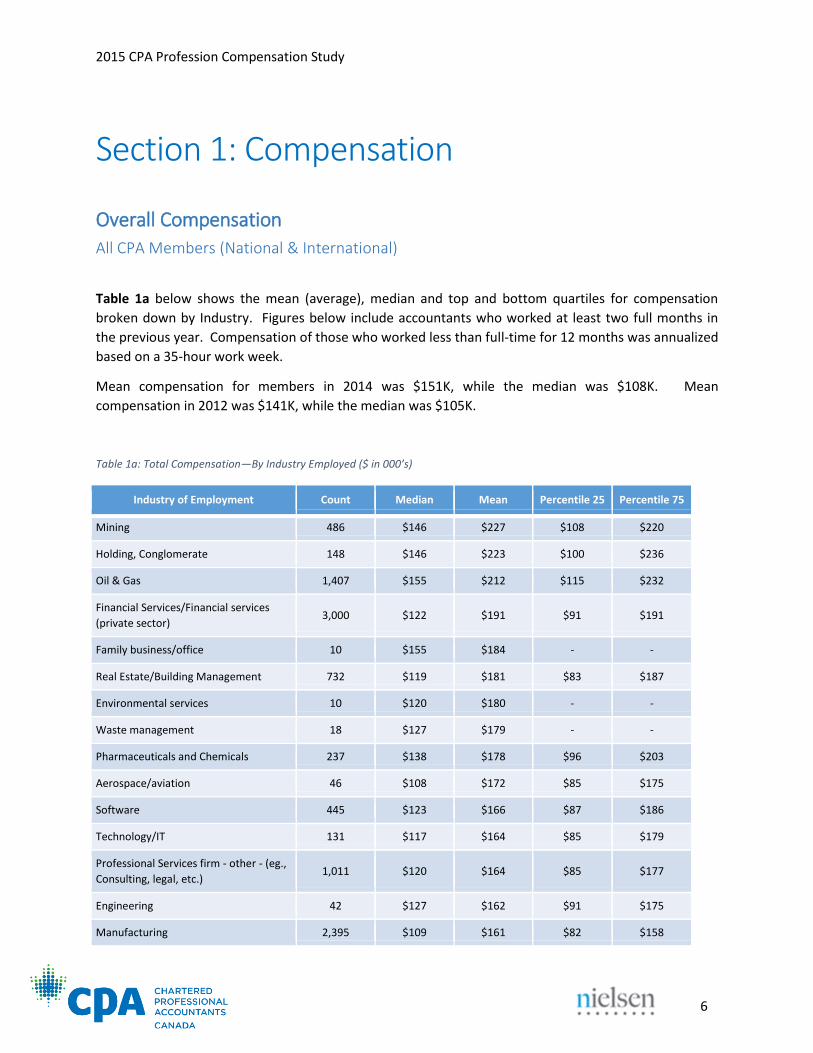
Table 1a below shows the mean (average), median and top and bottom quartiles for compensation
broken down by Industry. Figures below include accountants who worked at least two full months in
the previous year. Compensation of those who worked less than full-time for 12 months was annualized
based on a 35-hour work week.
Mean compensation for members in 2014 was $151K, while the median was $108K. Mean
compensation in 2012 was $141K, while the median was $105K.
Table 1a: Total Compensation—By Industry Employed ($ in 000’s)
Industry of Employment Count Median Mean Percentile 25 Percentile 75
Mining 486 $146 $227 $108 $220
Holding, Conglomerate 148 $146 $223 $100 $236
Oil & Gas 1,407 $155 $212 $115 $232
Financial Services/Financial services
(private sector) 3,000 $122 $191 $91 $191
Family business/office 10 $155 $184 - -
Real Estate/Building Management 732 $119 $181 $83 $187
Environmental services 10 $120 $180 - -
Waste management 18 $127 $179 - -
Pharmaceuticals and Chemicals 237 $138 $178 $96 $203
Aerospace/aviation 46 $108 $172 $85 $175
Software 445 $123 $166 $87 $186
Technology/IT 131 $117 $164 $85 $179
Professional Services firm - other - (eg.,
Consulting, legal, etc.) 1,011 $120 $164 $85 $177
Engineering 42 $127 $162 $91 $175
Manufacturing 2,395 $109 $161 $82 $158

2015 CPA Profession Compensation Study
7
Industry of Employment Count Median Mean Percentile 25 Percentile 75
Agriculture, Forestry, Fisheries 404 $100 $160 $78 $150
Private Sector - Healthcare 37 $127 $159 $82 $192
Transportation, Distribution 676 $113 $158 $84 $171
Utilities 540 $125 $157 $97 $169
Retail, Wholesale/CPG 1,431 $106 $153 $80 $164
Travel/tourism 31 $85 $152 $68 $165
Arts, Entertainment, Leisure 214 $105 $146 $77 $160
Service/services (unspecified) 17 $132 $145 - -
Construction 839 $113 $143 $85 $164
Hotels and Restaurants/Food services 222 $112 $143 $75 $159
Media, Communications, Publishing,
Marketing/Advertising 316 $109 $142 $78 $152
Telecommunications 428 $110 $139 $82 $160
Professional Services firm - public
practice (a firm that primarily delivers
auditing, accounting/auditing services)
5,545 $94 $137 $68 $150
Automotive services 40 $112 $136 $78 $199
Public Sector - Hospital, library, health
organization, or social services
organization/healthcare/medical
services
670 $97 $123 $82 $126
Educational Institution (e.g., university,
college, primary or secondary school,
etc.)
1,009 $106 $122 $84 $140
Public Sector - Crown corporation 663 $104 $120 $86 $128
Not for profit (eg., trade association,
charity, religious group, etc.) 942 $95 $115 $75 $130
Public Sector - Federal, provincial, first
nations or municipal government
including ministries, departments,
agencies,
3,183 $100 $110 $84 $118
Public Sector - Office of the auditor
general (federal, provincial, or
municipal)
188 $97 $107 $78 $127
Security systems/services 19 $100 $98 - -
Other 309 $110 $169 $78 $168
2015 CPA Profession Compensation Study
8
Industry of Employment Count Median Mean Percentile 25 Percentile 75
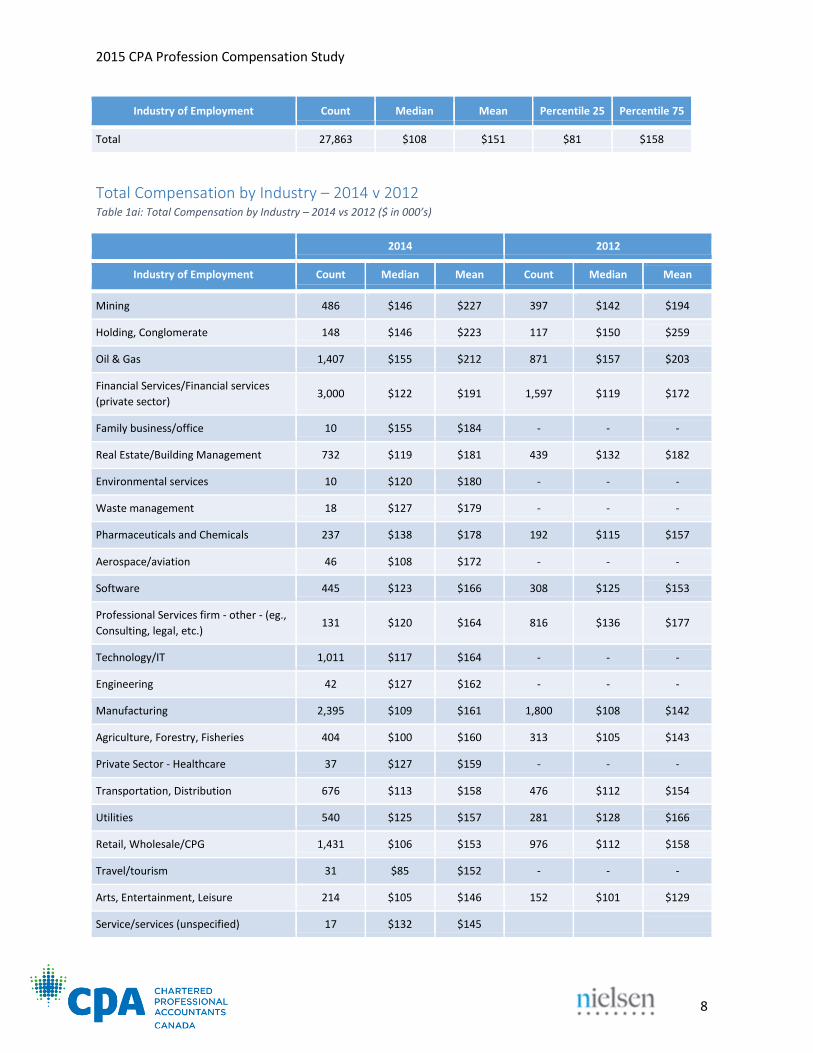
Total 27,863 $108 $151 $81 $158
Total Compensation by Industry – 2014 v 2012
Table 1ai: Total Compensation by Industry – 2014 vs 2012 ($ in 000’s)
2014 2012
Industry of Employment Count Median Mean Count Median Mean
Mining 486 $146 $227 397 $142 $194
Holding, Conglomerate 148 $146 $223 117 $150 $259
Oil & Gas 1,407 $155 $212 871 $157 $203
Financial Services/Financial services
(private sector) 3,000 $122 $191 1,597 $119 $172
Family business/office 10 $155 $184 - - -
Real Estate/Building Management 732 $119 $181 439 $132 $182
Environmental services 10 $120 $180 - - -
Waste management 18 $127 $179 - - -
Pharmaceuticals and Chemicals 237 $138 $178 192 $115 $157
Aerospace/aviation 46 $108 $172 - - -
Software 445 $123 $166 308 $125 $153
Professional Services firm - other - (eg.,
Consulting, legal, etc.) 131 $120 $164 816 $136 $177
Technology/IT 1,011 $117 $164 - - -
Engineering 42 $127 $162 - - -
Manufacturing 2,395 $109 $161 1,800 $108 $142
Agriculture, Forestry, Fisheries 404 $100 $160 313 $105 $143
Private Sector - Healthcare 37 $127 $159 - - -
Transportation, Distribution 676 $113 $158 476 $112 $154
Utilities 540 $125 $157 281 $128 $166
Retail, Wholesale/CPG 1,431 $106 $153 976 $112 $158
Travel/tourism 31 $85 $152 - - -
Arts, Entertainment, Leisure 214 $105 $146 152 $101 $129
Service/services (unspecified) 17 $132 $145
2015 CPA Profession Compensation Study
9
2014 2012
Industry of Employment Count Median Mean Count Median Mean
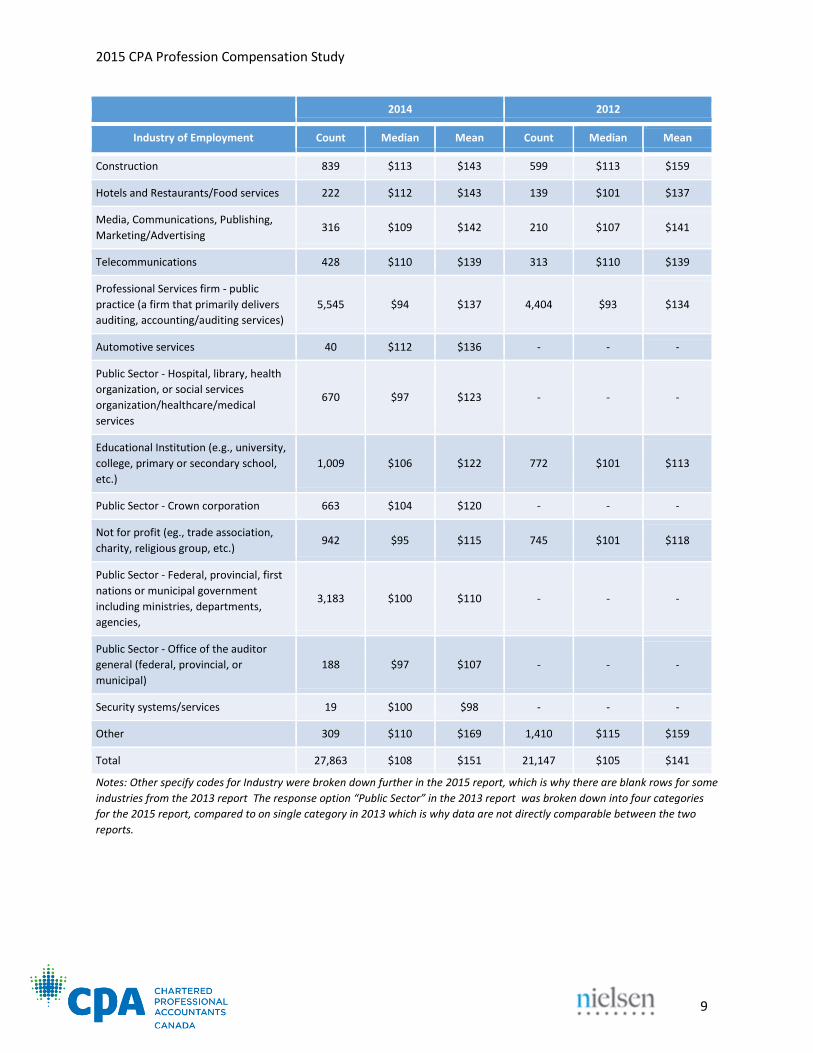
Construction 839 $113 $143 599 $113 $159
Hotels and Restaurants/Food services 222 $112 $143 139 $101 $137
Media, Communications, Publishing,
Marketing/Advertising 316 $109 $142 210 $107 $141
Telecommunications 428 $110 $139 313 $110 $139
Professional Services firm - public
practice (a firm that primarily delivers
auditing, accounting/auditing services)
5,545 $94 $137 4,404 $93 $134
Automotive services 40 $112 $136 - - -
Public Sector - Hospital, library, health
organization, or social services
organization/healthcare/medical
services
670 $97 $123 - - -
Educational Institution (e.g., university,
college, primary or secondary school,
etc.)
1,009 $106 $122 772 $101 $113
Public Sector - Crown corporation 663 $104 $120 - - -
Not for profit (eg., trade association,
charity, religious group, etc.) 942 $95 $115 745 $101 $118
Public Sector - Federal, provincial, first
nations or municipal government
including ministries, departments,
agencies,
3,183 $100 $110 - - -
Public Sector - Office of the auditor
general (federal, provincial, or
municipal)
188 $97 $107 - - -
Security systems/services 19 $100 $98 - - -
Other 309 $110 $169 1,410 $115 $159
Total 27,863 $108 $151 21,147 $105 $141
Notes: Other specify codes for Industry were broken down further in the 2015 report, which is why there are blank rows for some
industries from the 2013 report The response option “Public Sector” in the 2013 report was broken down into four categories
for the 2015 report, compared to on single category in 2013 which is why data are not directly comparable between the two
reports.
2015 CPA Profession Compensation Study
10
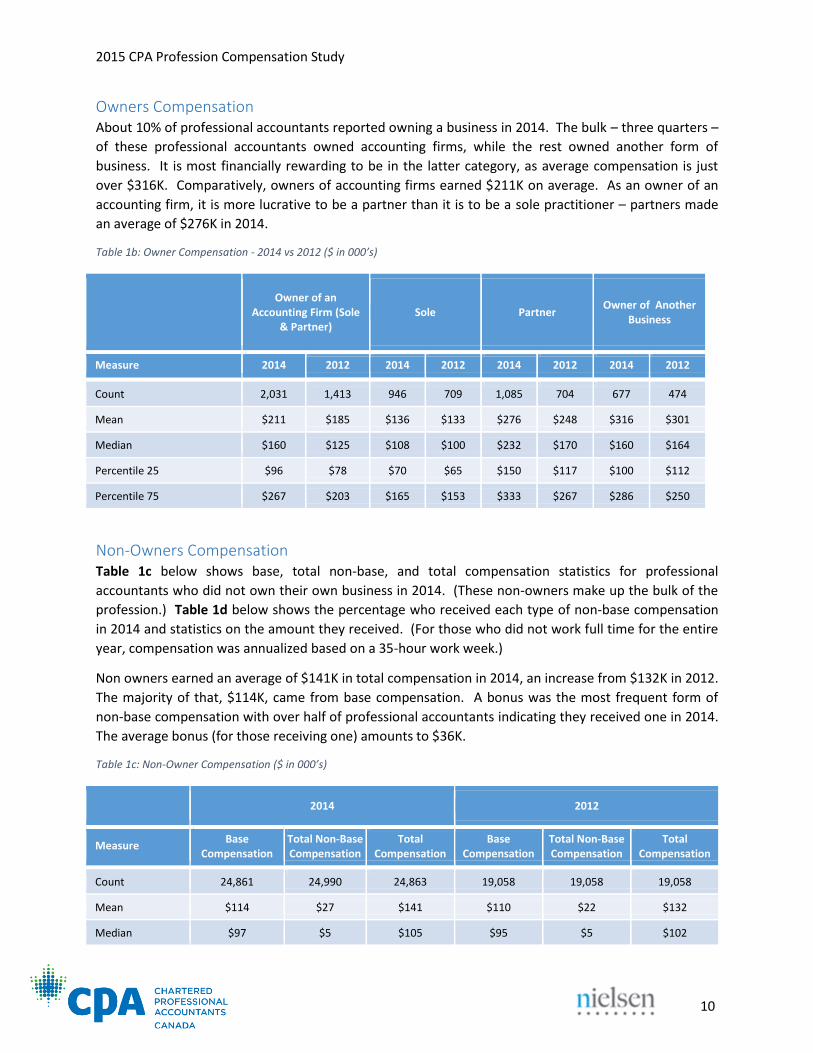
Owners Compensation About 10% of professional accountants reported owning a business in 2014. The bulk – three quarters –
of these professional accountants owned accounting firms, while the rest owned another form of
business. It is most financially rewarding to be in the latter category, as average compensation is just
over $316K. Comparatively, owners of accounting firms earned $211K on average. As an owner of an
accounting firm, it is more lucrative to be a partner than it is to be a sole practitioner – partners made
an average of $276K in 2014.
Table 1b: Owner Compensation - 2014 vs 2012 ($ in 000’s)
Owner of an Accounting Firm (Sole
& Partner) Sole Partner
Owner of Another Business
Measure 2014 2012 2014 2012 2014 2012 2014 2012
Count 2,031 1,413 946 709 1,085 704 677 474
Mean $211 $185 $136 $133 $276 $248 $316 $301
Median $160 $125 $108 $100 $232 $170 $160 $164
Percentile 25 $96 $78 $70 $65 $150 $117 $100 $112
Percentile 75 $267 $203 $165 $153 $333 $267 $286 $250
Non-Owners Compensation Table 1c below shows base, total non-base, and total compensation statistics for professional
accountants who did not own their own business in 2014. (These non-owners make up the bulk of the
profession.) Table 1d below shows the percentage who received each type of non-base compensation
in 2014 and statistics on the amount they received. (For those who did not work full time for the entire
year, compensation was annualized based on a 35-hour work week.)
Non owners earned an average of $141K in total compensation in 2014, an increase from $132K in 2012.
The majority of that, $114K, came from base compensation. A bonus was the most frequent form of
non-base compensation with over half of professional accountants indicating they received one in 2014.
The average bonus (for those receiving one) amounts to $36K.
Table 1c: Non-Owner Compensation ($ in 000’s)
2014 2012
Measure Base
Compensation Total Non-Base Compensation
Total Compensation
Base Compensation
Total Non-Base Compensation
Total Compensation
Count 24,861 24,990 24,863 19,058 19,058 19,058
Mean $114 $27 $141 $110 $22 $132
Median $97 $5 $105 $95 $5 $102

2015 CPA Profession Compensation Study
11
Percentile 25 $75 $0 $80 $75 $0 $78
Percentile 75 $129 $18 $150 $125 $17 $144
Non-Base Compensation Table 1d: Non-Base Compensation ($ in 000’s)
Compensation by Province Looking at all professional accountants, average compensation within the provinces was highest in
Alberta ($184K), followed by Ontario ($150K), and Saskatchewan ($146K).
Table 2a: All Members by Province/Country ($ in 000's)
Measure Profit Sharing Bonus Overtime Commissions Allowances Other Non-
base
Count 3,644 13,844 3,599 522 3,653 3,211
Percent Received 15% 55% 14% 2% 15% 13%
Mean $28 $26 $5 $55 $8 $36
Median $6 $10 $2 $3 $3 $6
Percentile 25 $2 $4 $1 $0 $1 $2
Percentile 75 $19 $25 $5 $23 $10 $18
Count Median Mean Percentile 25 Percentile 75
BC 3,737 $100 $138 $76 $146
Alberta 4,089 $132 $184 $98 $193
Saskatchewan 936 $113 $146 $87 $159
Manitoba 1,149 $100 $126 $78 $130
Ontario 10,106 $108 $150 $83 $156
Quebec 4,907 $98 $123 $73 $133
PEI 78 $86 $106 $65 $120
Newfoundland 282 $100 $132 $79 $136
New Brunswick 483 $90 $108 $70 $121
Nova Scotia 613 $95 $120 $71 $132
Yukon 23 $106 $130 $86 $142
Northwest Territories 36 $145 $204 $129 $206
Nunavut 18 $140 $181
Total Canada 26,457 $106 $146 $81 $154

2015 CPA Profession Compensation Study
12
Sole Practitioners The average compensation for sole practitioners was highest in Alberta at $191K, followed by
Saskatchewan and Ontario ($174K and $134K respectively). Although Newfoundland has a high mean
compensation, results should be interpreted with caution due to low base sizes.
Table 2b: Sole Practitioners by Province/Country ($ in 000's)
Australia 43 $150 $171 $95 $210
Barbados 34 $91 $154 $47 $230
Bermuda 84 $207 $289 $154 $363
Cayman Islands 71 $181 $347 $120 $300
China 87 $73 $193 $48 $200
Germany 14 $203 $303
Hong Kong 90 $154 $331 $99 $332
Singapore 16 $280 $332 $114 $525
Switzerland 37 $243 $302 $180 $318
United Arab Emirates 18 $291 $329
United Kingdom 37 $163 $267 $115 $300
United States 441 $195 $321 $135 $320
Other 207 $154 $231 $88 $262
Total International 1,181 $179 $284 $107 $300
Count Median Mean Percentile 25 Percentile 75
BC 204 $100 $128 $70 $149
Alberta 129 $134 $191 $90 $240
Saskatchewan 29 $151 $174 $100 $215
Manitoba 33 $108 $123 $64 $160
Ontario 328 $101 $134 $70 $175
Quebec 168 $85 $108 $61 $131
PEI 1 - - - -
Newfoundland 10 $123 $137 - -
New Brunswick 7 - - - -
Nova Scotia 17 $92 $94 - -
Yukon 2 - - - -
Nunavut 1 - - - -

2015 CPA Profession Compensation Study
13
Partners The average compensation for partners within the provinces was highest in Alberta at $310K, followed
by Ontario and Saskatchewan ($302 and $285K, respectively).
Table 2c: Partners by Province ($ in 000's)
Total Canada 929 $108 $136 $70 $165
Total International 10 $208 $208 $53 $300
Count Median Mean Percentile 25 Percentile 75
BC 214 $219 $259 $145 $301
Alberta 183 $266 $310 $185 $394
Saskatchewan 50 $250 $285 $190 $375
Manitoba 36 $159 $190 $110 $261
Ontario 321 $250 $302 $173 $372
Quebec 190 $171 $212 $110 $250
PEI 3 - - - -
Newfoundland 5 - - - -
New Brunswick 16 $188 $204 - -
Nova Scotia 21 $200 $206 $158 $265
Yukon 2 - - - -
Northwest Territories 4 - - - -
Nunavut 1 - - - -
Total Canada 1,046 $229 $270 $150 $330
Total International 29 $400 $505 $245 $500
2015 CPA Profession Compensation Study
14
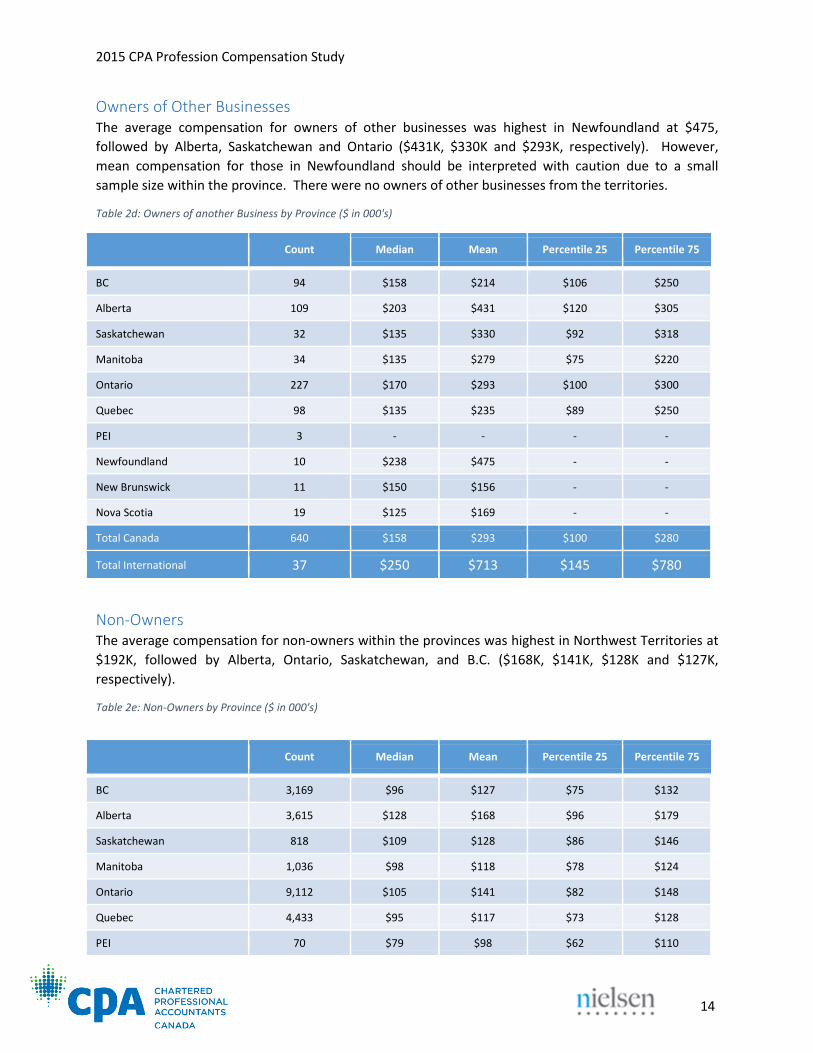
Owners of Other Businesses The average compensation for owners of other businesses was highest in Newfoundland at $475,
followed by Alberta, Saskatchewan and Ontario ($431K, $330K and $293K, respectively). However,
mean compensation for those in Newfoundland should be interpreted with caution due to a small
sample size within the province. There were no owners of other businesses from the territories.
Table 2d: Owners of another Business by Province ($ in 000's)
Non-Owners The average compensation for non-owners within the provinces was highest in Northwest Territories at
$192K, followed by Alberta, Ontario, Saskatchewan, and B.C. ($168K, $141K, $128K and $127K,
respectively).
Table 2e: Non-Owners by Province ($ in 000's)
Count Median Mean Percentile 25 Percentile 75
BC 94 $158 $214 $106 $250
Alberta 109 $203 $431 $120 $305
Saskatchewan 32 $135 $330 $92 $318
Manitoba 34 $135 $279 $75 $220
Ontario 227 $170 $293 $100 $300
Quebec 98 $135 $235 $89 $250
PEI 3 - - - -
Newfoundland 10 $238 $475 - -
New Brunswick 11 $150 $156 - -
Nova Scotia 19 $125 $169 - -
Total Canada 640 $158 $293 $100 $280
Total International 37 $250 $713 $145 $780
Count Median Mean Percentile 25 Percentile 75
BC 3,169 $96 $127 $75 $132
Alberta 3,615 $128 $168 $96 $179
Saskatchewan 818 $109 $128 $86 $146
Manitoba 1,036 $98 $118 $78 $124
Ontario 9,112 $105 $141 $82 $148
Quebec 4,433 $95 $117 $73 $128
PEI 70 $79 $98 $62 $110
2015 CPA Profession Compensation Study
15
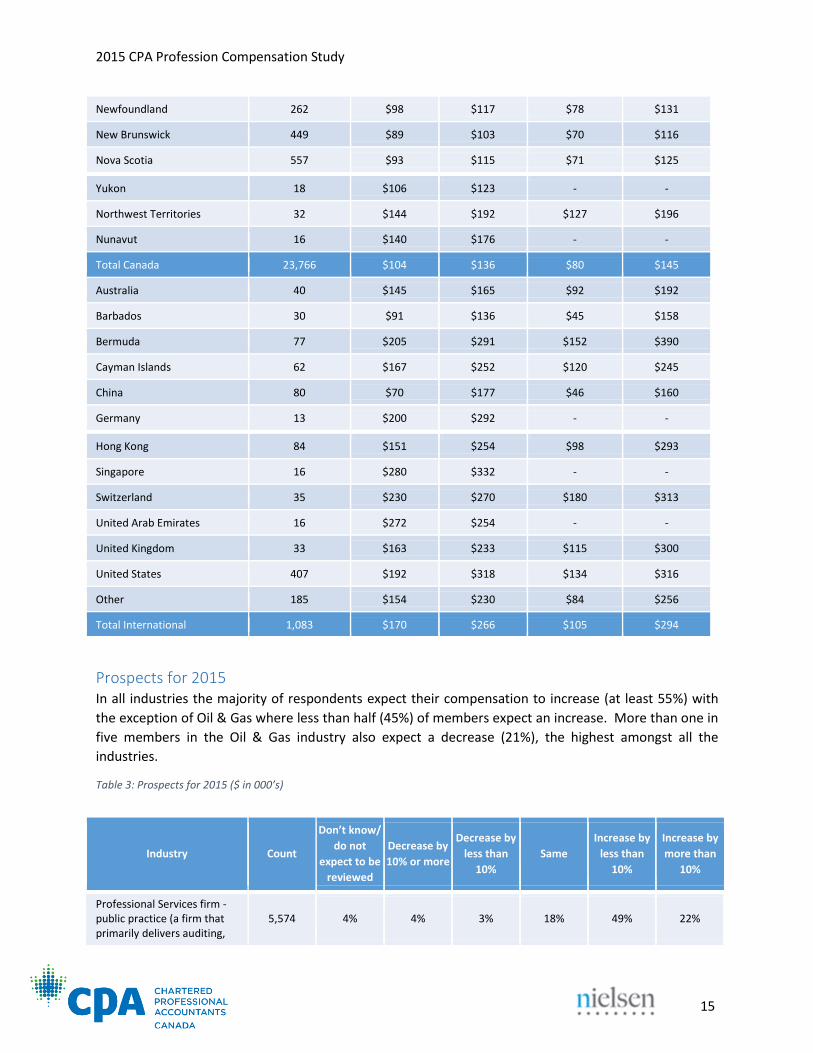
Prospects for 2015 In all industries the majority of respondents expect their compensation to increase (at least 55%) with
the exception of Oil & Gas where less than half (45%) of members expect an increase. More than one in
five members in the Oil & Gas industry also expect a decrease (21%), the highest amongst all the
industries.
Table 3: Prospects for 2015 ($ in 000’s)
Newfoundland 262 $98 $117 $78 $131
New Brunswick 449 $89 $103 $70 $116
Nova Scotia 557 $93 $115 $71 $125
Yukon 18 $106 $123 - -
Northwest Territories 32 $144 $192 $127 $196
Nunavut 16 $140 $176 - -
Total Canada 23,766 $104 $136 $80 $145
Australia 40 $145 $165 $92 $192
Barbados 30 $91 $136 $45 $158
Bermuda 77 $205 $291 $152 $390
Cayman Islands 62 $167 $252 $120 $245
China 80 $70 $177 $46 $160
Germany 13 $200 $292 - -
Hong Kong 84 $151 $254 $98 $293
Singapore 16 $280 $332 - -
Switzerland 35 $230 $270 $180 $313
United Arab Emirates 16 $272 $254 - -
United Kingdom 33 $163 $233 $115 $300
United States 407 $192 $318 $134 $316
Other 185 $154 $230 $84 $256
Total International 1,083 $170 $266 $105 $294
Industry Count
Don’t know/
do not
expect to be
reviewed
Decrease by
10% or more
Decrease by
less than
10%
Same
Increase by
less than
10%
Increase by
more than
10%
Professional Services firm - public practice (a firm that primarily delivers auditing,
5,574 4% 4% 3% 18% 49% 22%

2015 CPA Profession Compensation Study
16
accounting/auditing services)
Public Sector - Federal, provincial, first nations or municipal government including ministries, departments, agencies,
3,200 4% 2% 2% 27% 62% 3%
Financial Services/Financial services (private sector)
3,010 4% 4% 3% 16% 59% 14%
Manufacturing 2,409 4% 5% 3% 17% 60% 11%
Retail, Wholesale/CPG 1,442 5% 4% 3% 19% 53% 15%
Oil & Gas 1,412 5% 15% 6% 28% 36% 9%
Professional Services firm - other - (eg., Consulting, legal, etc.)
1,016 6% 7% 3% 21% 44% 19%
Educational Institution (e.g., university, college, primary or secondary school, etc.)
1,014 4% 3% 2% 23% 62% 6%
Not for profit (eg., trade association, charity, religious group, etc.)
945 3% 3% 1% 19% 65% 8%
Construction 841 5% 5% 2% 22% 52% 14%
Real Estate/Building Management
740 5% 5% 2% 16% 56% 16%
Transportation, Distribution 680 6% 3% 4% 19% 55% 13%
Public Sector - Hospital, library, health organization, or social services organization/healthcare/medical services
671 4% 3% 1% 32% 54% 6%
Public Sector - Crown corporation
667 2% 3% 3% 25% 62% 6%
Utilities 542 3% 4% 2% 24% 59% 8%
Mining 489 5% 10% 4% 23% 46% 12%
Software 446 5% 7% 4% 18% 48% 18%
Telecommunications 428 3% 4% 3% 21% 60% 10%
Agriculture, Forestry, Fisheries
406 5% 4% 2% 17% 58% 14%
Media, Communications, Publishing, Marketing/Advertising
317 7% 3% 5% 21% 50% 14%
Pharmaceuticals and Chemicals
239 4% 3% 1% 13% 66% 13%

2015 CPA Profession Compensation Study
17
Compensation by Major Cities The top three major cities with the highest average compensation are Grand Prairie with $225K, Wood
Buffalo with $214K, and Calgary with $196K. Edmonton and Toronto are in fourth with $167K.
Table 4: Total Compensation by Major City ($ in 000’s)
Hotels and Restaurants/Food services
223 3% 7% 3% 16% 50% 21%
Arts, Entertainment, Leisure 215 6% 7% 2% 14% 53% 17%
Public Sector - Office of the auditor general (federal, provincial, or municipal)
189 6% 1% 3% 24% 59% 7%
Holding, Conglomerate 149 3% 11% 2% 22% 50% 13%
Technology/IT 132 6% 5% 1% 26% 48% 14%
Aerospace/aviation 46 - 7% 2% 17% 65% 9%
Engineering 44 9% 7% 5% 11% 52% 16%
Automotive services 40 8% 8% - 25% 55% 5%
Private Sector - Healthcare 37 5% - 3% 19% 54% 19%
Travel/tourism 31 3% 13% - 29% 35% 19%
Security systems/services 19 - - - 21% 74% 5%
Waste management 18 11% 6% 6% 17% 56% 6%
Service/services (unspecified)
17 - - - 24% 65% 12%
Family business/office 10 - - - 20% 40% 40%
Environmental services 10 20% 20% - 20% 40% -
Industrial products/services 5 - - - - - -
Other 312 4% 5% 3% 24% 49% 15%
Count Median Mean Percentile 25 Percentile 75
BRITISH COLUMBIA
Vancouver 2,561 $102 $145 $77 $150
Prince George 63 $105 $131 $80 $132
Vernon 45 $107 $127 $82 $145
Victoria 341 $94 $125 $77 $131
Abbottsford 88 $96 $125 $73 $137
Kelowna 166 $96 $124 $75 $132

2015 CPA Profession Compensation Study
18
Nanaimo 59 $90 $120 $65 $122
Kamloops 74 $85 $120 $65 $123
ALBERTA
Grande Prairie 53 $155 $225 $90 $291
Wood Buffalo 47 $197 $214 $130 $248
Calgary 2,194 $143 $196 $105 $210
Edmonton 1,250 $119 $167 $91 $170
Medicine Hat 47 $103 $146 $82 $132
Red Deer 77 $118 $130 $87 $152
Lethbridge 98 $98 $124 $74 $156
SASKATCHEWAN
Moose Jaw 22 $128 $159 $90 $190
Saskatoon 367 $112 $156 $88 $160
Regina 373 $113 $138 $88 $157
Swift Current 17 $99 $137 - -
MANITOBA
Winnipeg 956 $100 $127 $79 $129
Brandon 48 $94 $119 $70 $132
ONTARIO/QUEBEC
Ottawa – Gatineau 1,527 $107 $130 $87 $137
ONTARIO
Toronto 5,675 $114 $167 $85 $174
Oshawa 101 $100 $139 $85 $146
Sarnia 36 $140 $139 $87 $181
Kitchener - Cambridge - Waterloo
492 $103 $135 $80 $144
Kingston 92 $101 $134 $79 $147
Barrie 64 $100 $133 $81 $148
Hamilton 451 $99 $132 $77 $137
London 340 $97 $132 $74 $136
Guelph 141 $96 $129 $79 $135
Windsor 113 $99 $129 $73 $144
St. Catharines – Niagara 148 $100 $128 $80 $140
Peterborough 56 $93 $120 $74 $142

2015 CPA Profession Compensation Study
19
North Bay 30 $94 $114 $58 $115
Sudbury 97 $95 $108 $75 $123
Sault Ste. Marie 61 $88 $106 $73 $118
Thunder Bay 61 $84 $101 $70 $119
QUEBEC
Montréal 2,959 $104 $137 $79 $146
Rouyn-Noranda 29 $94 $123 $80 $115
Saint-Hyacinthe 62 $85 $117 $67 $144
Drummondville 40 $80 $107 $62 $111
Québec 763 $88 $104 $70 $115
Victoriaville 28 $88 $104 $70 $129
Saguenay 88 $86 $98 $60 $113
Sherbrooke 115 $77 $96 $62 $106
Trois-Rivières 94 $86 $95 $63 $111
Granby 37 $82 $94 $67 $104
Rimouski 29 $88 $93 $68 $110
NEW BRUNSWICK
Saint John 139 $93 $115 $74 $125
Fredericton 109 $90 $106 $68 $110
Moncton 142 $92 $105 $71 $119
NOVA SCOTIA
Halifax 466 $96 $119 $73 $134
New Glasgow 29 $78 $97 $63 $103
PRINCE EDWARD ISLAND
Charlottetown 53 $86 $109 $62 $117
NEWFOUNDLAND
St. Johns 242 $101 $137 $80 $138
Corner Brook 16 $75 $90 - -
TERRITORIES
Yellowknife 25 $162 $224 $135 $216
Whitehorse 21 $121 $134 $90 $142
2015 CPA Profession Compensation Study
20
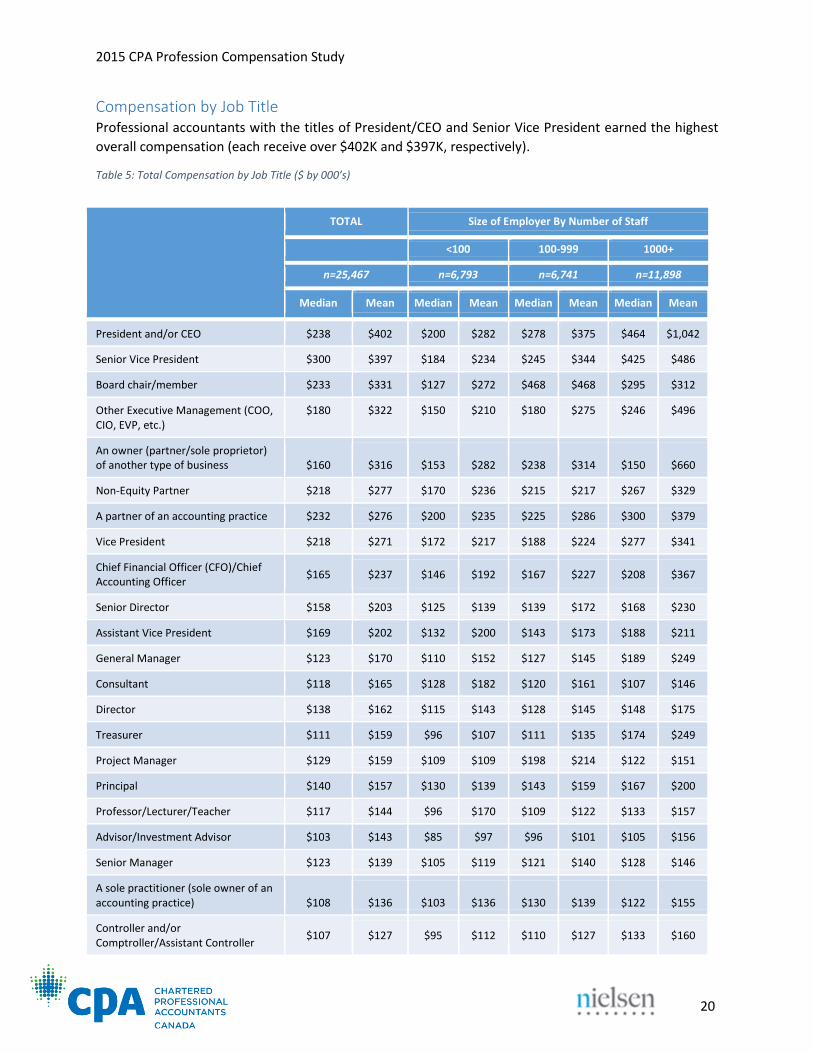
Compensation by Job Title Professional accountants with the titles of President/CEO and Senior Vice President earned the highest
overall compensation (each receive over $402K and $397K, respectively).
Table 5: Total Compensation by Job Title ($ by 000’s)
TOTAL Size of Employer By Number of Staff
<100 100-999 1000+
n=25,467 n=6,793 n=6,741 n=11,898
Median Mean Median Mean Median Mean Median Mean
President and/or CEO $238 $402 $200 $282 $278 $375 $464 $1,042
Senior Vice President $300 $397 $184 $234 $245 $344 $425 $486
Board chair/member $233 $331 $127 $272 $468 $468 $295 $312
Other Executive Management (COO, CIO, EVP, etc.)
$180 $322 $150 $210 $180 $275 $246 $496
An owner (partner/sole proprietor) of another type of business $160 $316 $153 $282 $238 $314 $150 $660
Non-Equity Partner $218 $277 $170 $236 $215 $217 $267 $329
A partner of an accounting practice $232 $276 $200 $235 $225 $286 $300 $379
Vice President $218 $271 $172 $217 $188 $224 $277 $341
Chief Financial Officer (CFO)/Chief Accounting Officer
$165 $237 $146 $192 $167 $227 $208 $367
Senior Director $158 $203 $125 $139 $139 $172 $168 $230
Assistant Vice President $169 $202 $132 $200 $143 $173 $188 $211
General Manager $123 $170 $110 $152 $127 $145 $189 $249
Consultant $118 $165 $128 $182 $120 $161 $107 $146
Director $138 $162 $115 $143 $128 $145 $148 $175
Treasurer $111 $159 $96 $107 $111 $135 $174 $249
Project Manager $129 $159 $109 $109 $198 $214 $122 $151
Principal $140 $157 $130 $139 $143 $159 $167 $200
Professor/Lecturer/Teacher $117 $144 $96 $170 $109 $122 $133 $157
Advisor/Investment Advisor $103 $143 $85 $97 $96 $101 $105 $156
Senior Manager $123 $139 $105 $119 $121 $140 $128 $146
A sole practitioner (sole owner of an accounting practice) $108 $136 $103 $136 $130 $139 $122 $155
Controller and/or Comptroller/Assistant Controller
$107 $127 $95 $112 $110 $127 $133 $160

2015 CPA Profession Compensation Study
21
Compensation by Area of Focus among Non-Owners Investments is the highest average compensation per area of focus for members, followed by
management.
Table 5b: Compensation by Area of Focus among Non-Owners ($ by 000’s)
Count Median Mean Percentile 25 Percentile 75
Investments 49 $220 $450 $150 $413
Management/General Management 182 $175 $276 $121 $299
Leadership 14 $167 $274 - -
Strategy & Governance 1,490 $165 $258 $120 $259
Operations 206 $172 $236 $120 $247
Business Development/Management 61 $169 $231 $130 $256
Procurement/Acquisition/Mergers/M&A 58 $161 $223 $100 $280
Specialist $104 $125 $270 $270 $81 $86 $110 $130
Associate/Assistant Director $113 $123 $96 $108 $104 $119 $120 $131
Manager/Accounting Manager/Account Manager/Finance Manager
$101 $114 $90 $98 $100 $113 $105 $119
Tax Specialist/Senior Tax Advisor/Analyst/Associate
$96 $112 $83 $104 $97 $117 $99 $113
Supervisor $96 $108 $82 $89 $92 $96 $103 $116
Team Leader $96 $107 $90 $90 $78 $82 $100 $112
Internal Auditor $95 $107 $87 $114 $88 $99 $96 $108
Investigator $100 $101 - - $113 $110 $91 $99
Administrator $75 $100 $56 $96 $66 $96 $106 $107
Associate/Assistant Manager $82 $92 $76 $84 $78 $84 $86 $97
Analyst/Business, Financial, Senior and Senior Financial Analyst
$83 $91 $76 $91 $79 $87 $85 $92
Senior Auditor/Accountant $77 $88 $70 $82 $78 $88 $81 $92
Coordinator $85 $84 $99 $86 $83 $76 $86 $87
Finance officer $72 $76 $54 $54 $75 $73 $80 $85
Auditor/Accountant/Cost Accountant
$68 $76 $60 $68 $68 $76 $78 $85
Junior Auditor/Accountant $51 $59 $50 $61 $47 $51 $61 $60
Other $102 $133 $89 $117 $86 $139 $104 $137

2015 CPA Profession Compensation Study
22
Financial Planning/Financial Planning and
Analysis/FP&A/Wealth Management
68 $123 $219 $97 $219
Marketing/Sales 106 $146 $217 $110 $260
Supply/Supply Chain 25 $160 $214 $120 $240
Contracts/Contracting 17 $171 $192
Restructuring 14 $121 $189 - -
Consulting 60 $139 $169 $106 $193
Human Resources 56 $122 $167 $96 $173
Project Management 71 $121 $160 $94 $169
Finance 5,186 $112 $158 $85 $165
Regulatory 36 $154 $158 $118 $176
Systems/System
Management/Integration/Implementation
34 $117 $156 $93 $165
Commercial banking services 20 $145 $154 $94 $173
IT 166 $123 $154 $100 $155
Policy/Policy Analysis 19 $125 $150 - -
Risk management/Control/Internal audit 972 $113 $146 $90 $154
Advisory 33 $95 $139 $85 $131
Project (unspecified) 13 $129 $139 - -
Administration 34 $110 $137 $102 $150
Valuation 42 $120 $135 $87 $146
Compliance 43 $111 $134 $96 $139
Financial Systems/Financial Systems Support 31 $104 $132 $93 $165
Insolvency 22 $121 $131 $97 $156
Education 65 $112 $131 $100 $148
Software 22 $108 $129 $100 $165
Investigation 18 $125 $128 - -
ERP systems/implementation 18 $116 $127 - -
Forensic/Forensic Accounting 51 $103 $126 $88 $126
Treasury 14 $102 $126 - -
Financial and/or Non-Financial Reporting 6,609 $101 $126 $79 $139
Taxation 1,983 $100 $125 $79 $136
Management Accounting 3,423 $101 $121 $80 $135
2015 CPA Profession Compensation Study
23
Business Analysis/Intelligence 18 $90 $110 - -
Payroll 27 $97 $109 $68 $123
Accounting/Bookkeeping 109 $89 $107 $68 $124
Budget 52 $91 $98 $74 $116
Audit and Assurance 3,146 $83 $96 $65 $106
Compilations 10 $90 $87 - -
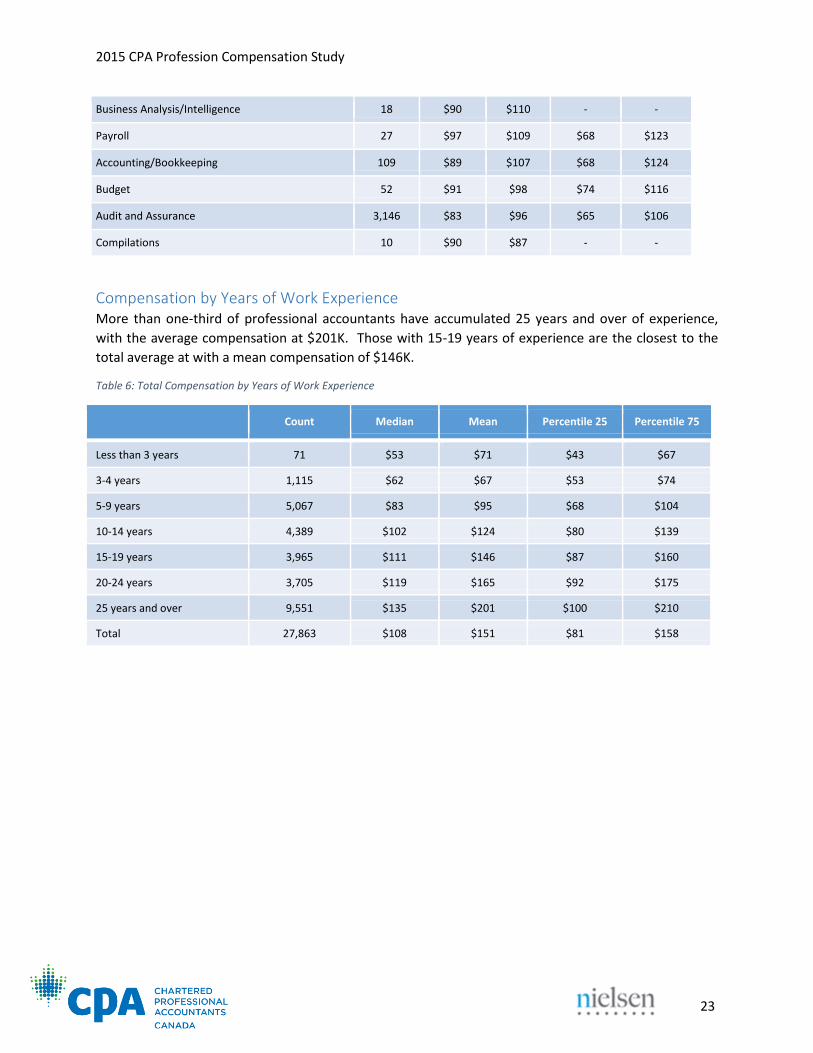
Compensation by Years of Work Experience More than one-third of professional accountants have accumulated 25 years and over of experience,
with the average compensation at $201K. Those with 15-19 years of experience are the closest to the
total average at with a mean compensation of $146K.
Table 6: Total Compensation by Years of Work Experience
Count Median Mean Percentile 25 Percentile 75
Less than 3 years 71 $53 $71 $43 $67
3-4 years 1,115 $62 $67 $53 $74
5-9 years 5,067 $83 $95 $68 $104
10-14 years 4,389 $102 $124 $80 $139
15-19 years 3,965 $111 $146 $87 $160
20-24 years 3,705 $119 $165 $92 $175
25 years and over 9,551 $135 $201 $100 $210
Total 27,863 $108 $151 $81 $158
2015 CPA Profession Compensation Study
24
Section 2: Vacation, Leave, Benefits, and Work/Life Balance Vacation Entitlement
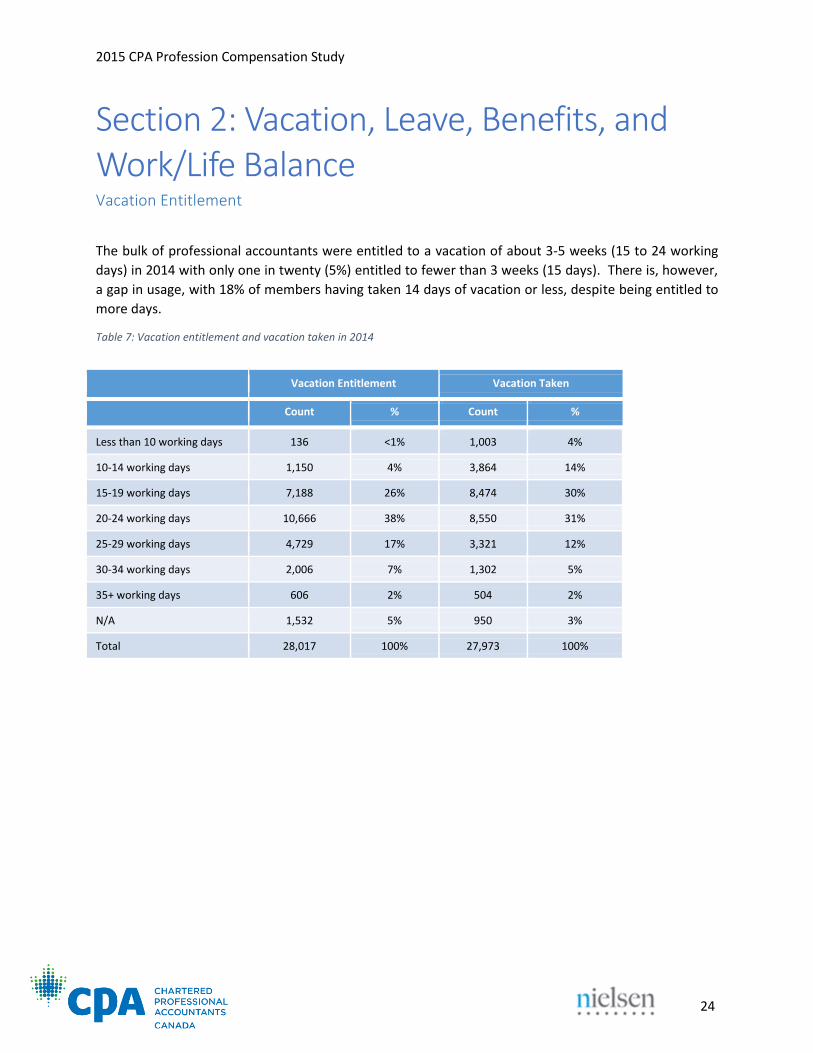
The bulk of professional accountants were entitled to a vacation of about 3-5 weeks (15 to 24 working
days) in 2014 with only one in twenty (5%) entitled to fewer than 3 weeks (15 days). There is, however,
a gap in usage, with 18% of members having taken 14 days of vacation or less, despite being entitled to
more days.
Table 7: Vacation entitlement and vacation taken in 2014
Vacation Entitlement Vacation Taken
Count % Count %
Less than 10 working days 136 <1% 1,003 4%
10-14 working days 1,150 4% 3,864 14%
15-19 working days 7,188 26% 8,474 30%
20-24 working days 10,666 38% 8,550 31%
25-29 working days 4,729 17% 3,321 12%
30-34 working days 2,006 7% 1,302 5%
35+ working days 606 2% 504 2%
N/A 1,532 5% 950 3%
Total 28,017 100% 27,973 100%
2015 CPA Profession Compensation Study
25
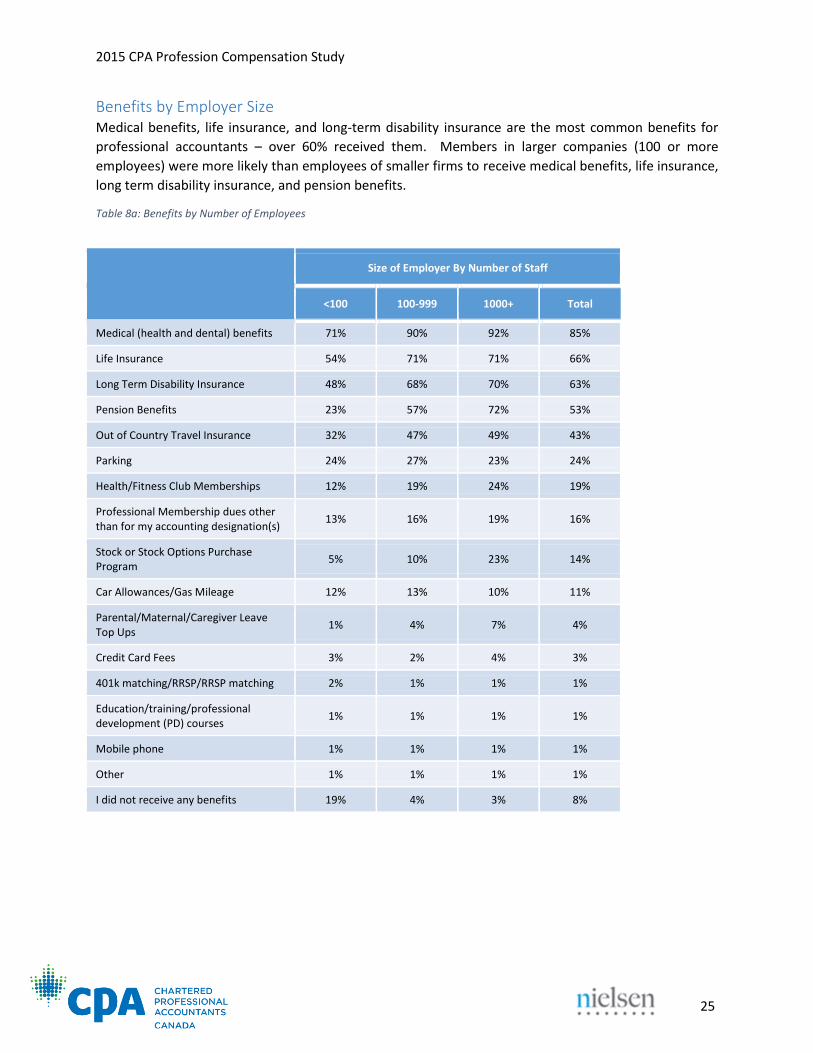
Benefits by Employer Size Medical benefits, life insurance, and long-term disability insurance are the most common benefits for
professional accountants – over 60% received them. Members in larger companies (100 or more
employees) were more likely than employees of smaller firms to receive medical benefits, life insurance,
long term disability insurance, and pension benefits.
Table 8a: Benefits by Number of Employees
Size of Employer By Number of Staff
<100 100-999 1000+ Total
Medical (health and dental) benefits 71% 90% 92% 85%
Life Insurance 54% 71% 71% 66%
Long Term Disability Insurance 48% 68% 70% 63%
Pension Benefits 23% 57% 72% 53%
Out of Country Travel Insurance 32% 47% 49% 43%
Parking 24% 27% 23% 24%
Health/Fitness Club Memberships 12% 19% 24% 19%
Professional Membership dues other than for my accounting designation(s)
13% 16% 19% 16%
Stock or Stock Options Purchase Program
5% 10% 23% 14%
Car Allowances/Gas Mileage 12% 13% 10% 11%
Parental/Maternal/Caregiver Leave Top Ups
1% 4% 7% 4%
Credit Card Fees 3% 2% 4% 3%
401k matching/RRSP/RRSP matching 2% 1% 1% 1%
Education/training/professional development (PD) courses
1% 1% 1% 1%
Mobile phone 1% 1% 1% 1%
Other 1% 1% 1% 1%
I did not receive any benefits 19% 4% 3% 8%
2015 CPA Profession Compensation Study
26
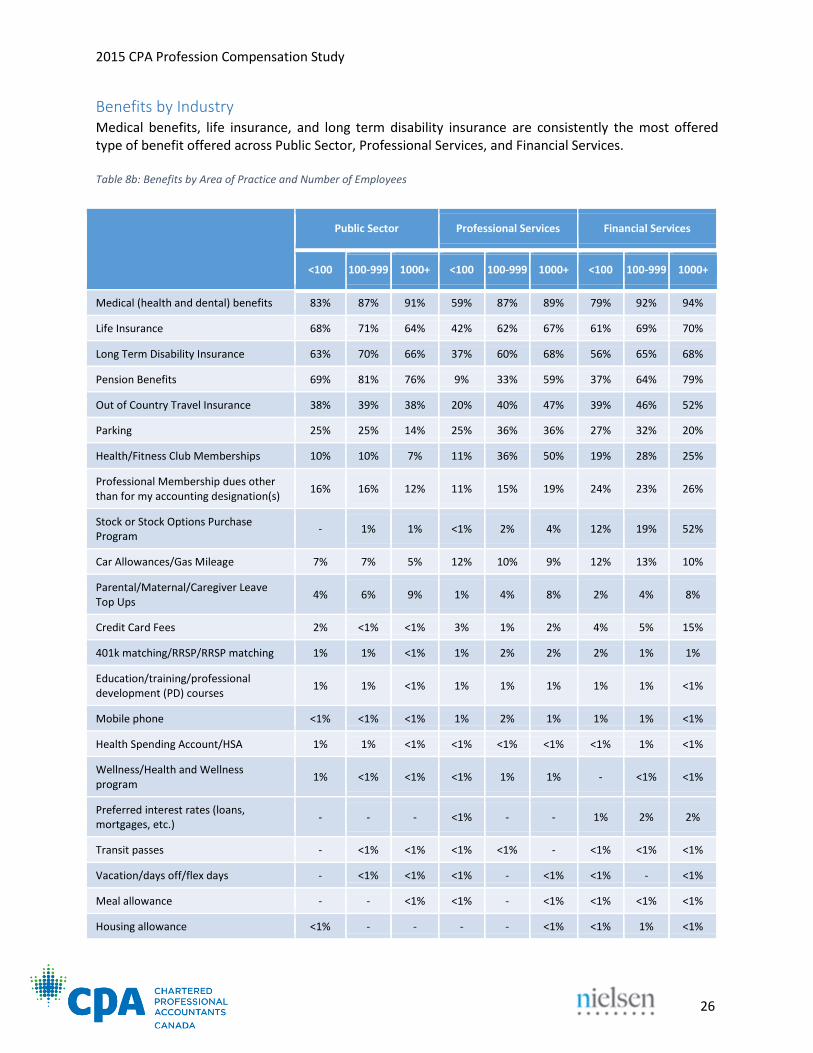
Benefits by Industry Medical benefits, life insurance, and long term disability insurance are consistently the most offered type of benefit offered across Public Sector, Professional Services, and Financial Services. Table 8b: Benefits by Area of Practice and Number of Employees
Public Sector Professional Services Financial Services
<100 100-999 1000+ <100 100-999 1000+ <100 100-999 1000+
Medical (health and dental) benefits 83% 87% 91% 59% 87% 89% 79% 92% 94%
Life Insurance 68% 71% 64% 42% 62% 67% 61% 69% 70%
Long Term Disability Insurance 63% 70% 66% 37% 60% 68% 56% 65% 68%
Pension Benefits 69% 81% 76% 9% 33% 59% 37% 64% 79%
Out of Country Travel Insurance 38% 39% 38% 20% 40% 47% 39% 46% 52%
Parking 25% 25% 14% 25% 36% 36% 27% 32% 20%
Health/Fitness Club Memberships 10% 10% 7% 11% 36% 50% 19% 28% 25%
Professional Membership dues other than for my accounting designation(s)
16% 16% 12% 11% 15% 19% 24% 23% 26%
Stock or Stock Options Purchase Program
- 1% 1% <1% 2% 4% 12% 19% 52%
Car Allowances/Gas Mileage 7% 7% 5% 12% 10% 9% 12% 13% 10%
Parental/Maternal/Caregiver Leave Top Ups
4% 6% 9% 1% 4% 8% 2% 4% 8%
Credit Card Fees 2% <1% <1% 3% 1% 2% 4% 5% 15%
401k matching/RRSP/RRSP matching 1% 1% <1% 1% 2% 2% 2% 1% 1%
Education/training/professional development (PD) courses
1% 1% <1% 1% 1% 1% 1% 1% <1%
Mobile phone <1% <1% <1% 1% 2% 1% 1% 1% <1%
Health Spending Account/HSA 1% 1% <1% <1% <1% <1% <1% 1% <1%
Wellness/Health and Wellness program
1% <1% <1% <1% 1% 1% - <1% <1%
Preferred interest rates (loans, mortgages, etc.)
- - - <1% - - 1% 2% 2%
Transit passes - <1% <1% <1% <1% - <1% <1% <1%
Vacation/days off/flex days - <1% <1% <1% - <1% <1% - <1%
Meal allowance - - <1% <1% - <1% <1% <1% <1%
Housing allowance <1% - - - - <1% <1% 1% <1%

2015 CPA Profession Compensation Study
27
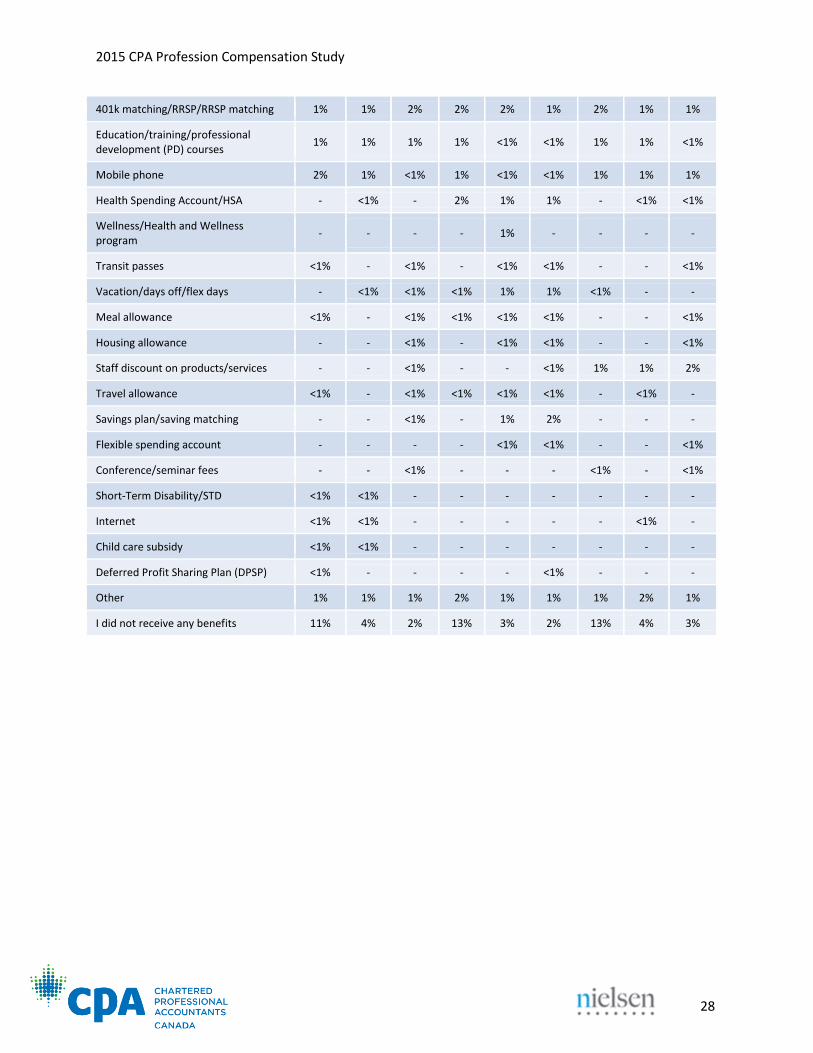
Benefits by Industry (cont’d) Medical benefits, life insurance, and long term disability insurance are consistently the most offered type of benefit across Manufacturing, Oil & Gas, and Retail/Wholesale industries. Table 8c: Benefits by Area of Practice and Number of Employees
Staff discount on products/services - <1% - - - <1% - - <1%
Free/no-fee banking services - - - - - - <1% 1% 2%
Travel allowance - <1% <1% - - <1% <1% - -
Savings plan/saving matching - - - - - - - - <1%
Flexible spending account <1% - <1% <1% <1% <1% - - -
Conference/seminar fees <1% - <1% <1% <1% - <1% <1% <1%
Short-Term Disability/STD - <1% <1% <1% - - <1% <1% <1%
Internet - - - <1% <1% - <1% - -
Deferred Profit Sharing Plan (DPSP) - - - - <1% - - - <1%
Home/car insurance - - - - - - - - <1%
Other 2% 1% 1% 1% 1% 1% 1% 1% 1%
I did not receive any benefits 10% 5% 6% 27% 4% 2% 12% 4% 2%
Manufacturing Oil & Gas Retail/Wholesale
<100 100-999 1000+ <100 100-999 1000+ <100 100-999 1000+
Medical (health and dental) benefits 83% 91% 95% 79% 92% 94% 77% 91% 92%
Life Insurance 70% 77% 78% 62% 73% 77% 62% 72% 70%
Long Term Disability Insurance 62% 70% 74% 56% 75% 77% 55% 66% 69%
Pension Benefits 33% 58% 76% 20% 43% 76% 22% 42% 61%
Out of Country Travel Insurance 49% 55% 56% 42% 51% 59% 42% 51% 49%
Parking 12% 18% 21% 43% 36% 26% 15% 21% 26%
Health/Fitness Club Memberships 9% 13% 19% 25% 31% 35% 9% 15% 18%
Professional Membership dues other than for my accounting designation(s)
11% 13% 17% 17% 20% 24% 8% 14% 19%
Stock or Stock Options Purchase Program
6% 9% 25% 26% 35% 50% 3% 8% 30%
Car Allowances/Gas Mileage 16% 14% 15% 9% 10% 7% 22% 23% 17%
Parental/Maternal/Caregiver Leave Top Ups
<1% 1% 3% - 3% 5% 1% 2% 5%
Credit Card Fees 3% 2% 4% 2% 1% 2% 5% 3% 2%
2015 CPA Profession Compensation Study
28
401k matching/RRSP/RRSP matching 1% 1% 2% 2% 2% 1% 2% 1% 1%
Education/training/professional development (PD) courses
1% 1% 1% 1% <1% <1% 1% 1% <1%
Mobile phone 2% 1% <1% 1% <1% <1% 1% 1% 1%
Health Spending Account/HSA - <1% - 2% 1% 1% - <1% <1%
Wellness/Health and Wellness program
- - - - 1% - - - -
Transit passes <1% - <1% - <1% <1% - - <1%
Vacation/days off/flex days - <1% <1% <1% 1% 1% <1% - -
Meal allowance <1% - <1% <1% <1% <1% - - <1%
Housing allowance - - <1% - <1% <1% - - <1%
Staff discount on products/services - - <1% - - <1% 1% 1% 2%
Travel allowance <1% - <1% <1% <1% <1% - <1% -
Savings plan/saving matching - - <1% - 1% 2% - - -
Flexible spending account - - - - <1% <1% - - <1%
Conference/seminar fees - - <1% - - - <1% - <1%
Short-Term Disability/STD <1% <1% - - - - - - -
Internet <1% <1% - - - - - <1% -
Child care subsidy <1% <1% - - - - - - -
Deferred Profit Sharing Plan (DPSP) <1% - - - - <1% - - -
Other 1% 1% 1% 2% 1% 1% 1% 2% 1%
I did not receive any benefits 11% 4% 2% 13% 3% 2% 13% 4% 3%

2015 CPA Profession Compensation Study
29
Work/Life Balance Flexible working hours and training programs were most commonly offered to promote work/life
balance. These were also the most commonly taken programs by members. Work from home was
offered by 49% of employers, and taken by 79% of those who were offered. This is echoed across
industry as seen in Table 9b.
Table 9a: Work/Life Balance Programs
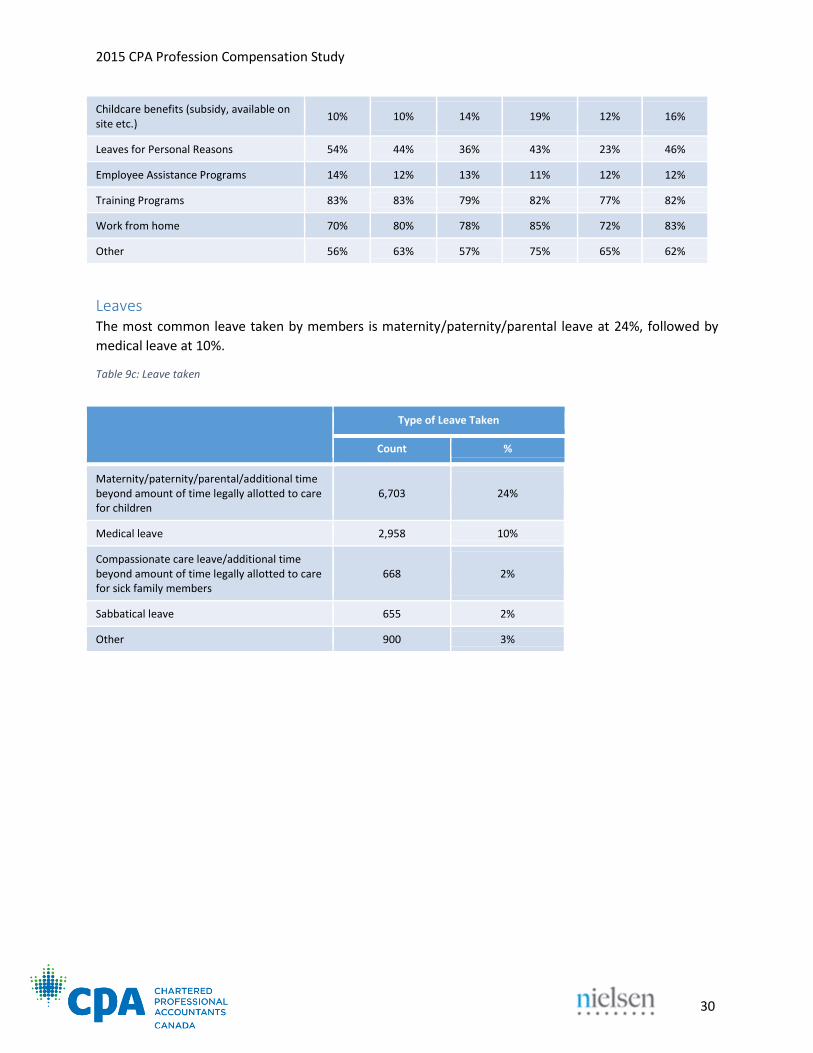
Work/Life Balance Programs Used by Industry Flexible working hours, training programs, and work from home are the programs most used by
members in the Public Sector, Professional Services, Financial Services, Manufacturing, Oil & Gas, and
Retail/Wholesale industries.
Table 9b: Work/Life Balance Programs Used by Industry
Work/Life Balance Programs
Offered Taken
Count % Count %
Flexible working hours 16,333 65% 12,640 77%
Sabbaticals 4,279 17% 301 7%
Compressed Work Weeks 5,603 22% 2,427 43%
Time off for volunteer work 7,437 30% 3,653 49%
Childcare benefits (subsidy, available on site etc.) 1,546 6% 185 12%
Leaves for Personal Reasons 15,589 62% 6,645 43%
Employee Assistance Programs 15,336 61% 1,896 12%
Training Programs 17,801 71% 14,413 81%
Work from home 12,246 49% 9,692 79%
Other 1,313 5% 831 63%
Work/Life Balance Programs Used
Public
Sector
Professional
Services
Financial
Services Manufacturing
Oil &
Gas
Retail/
Wholesale
Flexible working hours 74% 78% 73% 84% 74% 79%
Sabbaticals 5% 7% 6% 12% 4% 18%
Compressed Work Weeks 47% 33% 23% 56% 56% 60%
Time off for volunteer work 56% 48% 46% 47% 42% 47%
2015 CPA Profession Compensation Study
30
Leaves The most common leave taken by members is maternity/paternity/parental leave at 24%, followed by
medical leave at 10%.
Table 9c: Leave taken
Childcare benefits (subsidy, available on site etc.)
10% 10% 14% 19% 12% 16%
Leaves for Personal Reasons 54% 44% 36% 43% 23% 46%
Employee Assistance Programs 14% 12% 13% 11% 12% 12%
Training Programs 83% 83% 79% 82% 77% 82%
Work from home 70% 80% 78% 85% 72% 83%
Other 56% 63% 57% 75% 65% 62%
Type of Leave Taken
Count %
Maternity/paternity/parental/additional time beyond amount of time legally allotted to care for children
6,703 24%
Medical leave 2,958 10%
Compassionate care leave/additional time beyond amount of time legally allotted to care for sick family members
668 2%
Sabbatical leave 655 2%
Other 900 3%
Top Related