


Languages
Pages
Legal


Portfolio Additional Estimates Statements 2015-16
Foreign Affairs and Trade Portfolio
Explanations of Additional Estimates 2015-16

© Commonwealth of Australia 2016
ISBN 978-1-74322-293-5
This publication is available for your use under a Creative Commons BY Attribution
3.0 Australia licence, with the exception of the Commonwealth Coat of Arms, the
Department of Foreign Affairs and Trade logo, photographs, images, signatures and
where otherwise stated. The full licence terms are available from
http://creativecommons.org/licenses/by/3.0/au/legalcode.
Use of Foreign Affairs and Trade Portfolio material under a Creative Commons BY Attribution 3.0 Australia licence requires you to attribute the work (but not in any way
that suggests that the Foreign Affairs and Trade Portfolio endorses you or your use of
the work).
Foreign Affairs and Trade Portfolio material used 'as supplied'
Provided you have not modified or transformed Foreign Affairs and Trade Portfolio
material in any way including, for example, by changing the text; calculating percentage changes; graphing or charting data; or deriving new statistics from
published statistics – then the Foreign Affairs and Trade Portfolio prefers the following
attribution:
Source: The Australian Government Foreign Affairs and Trade Portfolio
Derivative material
If you have modified or transformed Foreign Affairs and Trade Portfolio material, or
derived new material from those of the Foreign Affairs and Trade Portfolio in any way,
then the Foreign Affairs and Trade Portfolio prefers the following attribution:
Based on The Australian Government Foreign Affairs and Trade Portfolio data
Use of the Coat of Arms
The terms under which the Coat of Arms can be used are set out on the It’s an Honour
website (see www.itsanhonour.gov.au).
Other Uses
Inquiries regarding this licence and any other use of this document are welcome at:
Mr Paul Wood, Chief Financial Officer, Department of Foreign Affairs and Trade.

iii
MINISTER
PARLIAMENT HOUSE
CANBERRA 2600
President of the Senate
Australian Senate
Parliament House CANBERRA ACT 2600
Speaker
House of Representatives Parliament House
CANBERRA ACT 2600
Dear Mr President Dear Mr Speaker
We hereby submit Portfolio Additional Estimates Statements in support of the 2015-16 Additional Estimates for the Foreign Affairs and Trade Portfolio.
These statements have been developed, and are submitted to the Parliament, as a
statement on the funding requirements being sought for the Portfolio.
We present these statements by virtue of our ministerial responsibility for
accountability to the Parliament and, through it, the public.
Yours sincerely
The Hon Julie Bishop MP The Hon Andrew Robb AO MP Minister for Foreign Affairs Minister for Trade and Investment

iv
ABBREVIATIONS AND CONVENTIONS
The following notations may be used:
NEC/nec not elsewhere classified
- nil
.. not zero, but rounded to zero
na not applicable (unless otherwise specified)
nfp not for publication
$m $ million
Figures in tables and in the text may be rounded. Figures in text are generally rounded
to one decimal place, whereas figures in tables are generally rounded to the nearest
thousand. Discrepancies in tables between totals and sums of components are due to
rounding.
Enquiries
Should you have any enquiries regarding this publication please contact
Mr Paul Wood, Chief Financial Officer in the Department of Foreign Affairs and Trade
on (02) 6261 1240.
Links to Portfolio Budget Statements (including Portfolio Additional Estimates
Statements and Portfolio Supplementary Additional Estimates Statements) can be
located on the Australian Government Budget website at www.budget.gov.au.
USER GUIDE TO THE
PORTFOLIO ADDITIONAL ESTIMATE STATEMENTS

vii
USER GUIDE
The purpose of the 2015-16 Portfolio Additional Estimates Statements (PAES), like that of the Portfolio Budget Statements (PB Statements), is to inform Senators and Members
of Parliament of the proposed allocation of resources to Government outcomes by
entities within the Portfolio. The focus of the PAES differs from the PB Statements in
one important aspect. While the PAES include an Entity Resource Statement to inform Parliament of the revised estimate of the total resources available to an entity, the focus
of the PAES is on explaining the changes in resourcing by outcome(s) since the Budget.
As such, the PAES provides information on new measures and their impact on the
financial and/or non-financial planned performance of programmes supporting those outcomes.
The PAES facilitate understanding of the proposed appropriations in Appropriation
Bills (Nos. 3 and 4) 2015-16. In this sense the PAES is declared by the Additional
Estimates Appropriation Bills to be a ‘relevant document’ to the interpretation of the Bills according to section 15AB of the Acts Interpretation Act 1901.
Whereas the Mid-Year Economic and Fiscal Outlook (MYEFO) 2015-16 is a mid-year
budget report which provides updated information to allow the assessment of the
Government’s fiscal performance against its fiscal strategy, the PAES update the most recent budget appropriations for entities within the Portfolio.

User Guide
viii
Structure of the Portfolio Additional Estimates Statements
The PAES are presented in three parts with subsections.
User guide
Provides a brief introduction explaining the purpose of the PAES.
Portfolio overview
Provides an overview of the Portfolio, including a chart that outlines the outcomes for entities
in the Portfolio.
Entity Additional Estimates Statements
A statement (under the name of the entity) for each entity affected by Additional Estimates.
Section 1: Entity
overview and resources
This section details the changes in total resources available to an
entity, the impact of any measures since Budget, and impact of
Appropriation Bills Nos. 3 and 4.
Section 2: Revisions to
outcomes and planned
performance
This section details changes to Government outcomes and/or
changes to the planned performance of entity programmes.
Section 3: Explanatory
tables and budgeted
financial statements
This section contains updated explanatory tables on special
account flows and staffing levels and revisions to the budgeted
financial statements.
Portfolio glossary Explains key terms relevant to the Portfolio.

ix
CONTENTS
Portfolio overview ..................................................................................................... 3
Entity additional estimates statements .................................................................... 8
Department of Foreign Affairs and Trade (DFAT) ........................................................ 9
Australian Trade Commission (Austrade) .................................................................. 62
Tourism Australia ...................................................................................................... 89
Portfolio glossary .................................................................................................. 109


2
PORTFOLIO OVERVIEW

3
PORTFOLIO OVERVIEW
The four portfolio ministers are the Minister for Foreign Affairs, the Hon Julie Bishop MP, the Minister for Trade and Investment, the Hon Andrew Robb AO MP, the
Minister for International Development and the Pacific, the Hon Steven Ciobo MP, and
the Minister for Tourism and International Education and the Minister Assisting the
Minister for Trade and Investment, Senator the Hon Richard Colbeck. Mr Ciobo and Senator Colbeck were sworn in on 21 September 2015.
A full outline of the Foreign Affairs and Trade Portfolio Overview can be found in the
Portfolio Budget Statements 2015-16.
ADDITIONAL ESTIMATES AND VARIATIONS – PORTFOLIO LEVEL
The Portfolio is seeking a net increase of $61.6 million in Appropriation Bills No. 3 and
No. 4 for 2015-16.
Department of Foreign Affairs and Trade (DFAT) $44.6 million
Departmental items
• $1.3m funding for the Department’s engagement with the Asian Infrastructure
Investment Bank;
• ($0.3m) adjustment for savings on Public Sector Superannuation accumulation
plan (PSSap) administration costs;
• $0.8m adjustment for overseas inflation;
• $27.1m adjustment for foreign exchange movements; and
• ($7.7m) adjustment for passport funding due to lower than expected passports
issued in 2015-16.
Administered items
• $0.2m adjustment for foreign exchange movements;
• $10.4m adjustment for contributions to UN Peacekeeping Operations;
• $6.4m adjustment for contributions to International Organisations; and
• $6.5m adjustment for contributions from Other Government Departments to
the Official Development Assistance — reprioritised funding measure.

Portfolio Overview
4
Australian Trade Commission (Austrade) $10.3 million
Departmental items
• $6.0m adjustment for a movement of funds for Free Trade Agreement
Promotion;
• $0.8m adjustment for simpler land arrangements to support investment in the
north;
• $3.5m adjustment for foreign exchange movements; and
• ($0.04m) adjustment for savings on Public Sector Superannuation
accumulation plan (PSSap) administration costs.
Australian Centre for International Agricultural Research (ACIAR)
There are no additional measures or variations for ACIAR.
Australian Secret Intelligence Service (ASIS)
There are no additional measures or variations for ASIS.
Export Finance and Insurance Corporation (EFIC)
EFIC does not appear in the Portfolio Additional Estimates Statements as it is not part
of the general government sector.
Tourism Australia $6.7 million
Departmental items
• $6.7m adjustment for foreign exchange movements in 2014-15.

Portfolio Overview
5
Figure 1: Foreign Affairs and Trade portfolio structure and outcomes
Minister for Foreign Affairs
The Hon Julie Bishop MP
Minister for Trade and Investment
The Hon Andrew Robb AO MP
Minister for International Development
and the Pacific
The Hon Steven Ciobo MP
Minister for Tourism and
International Education,
Minister Assisting the
Minister for Trade and Investment
Senator the Hon Richard Colbeck
Department of Foreign Affairs and Trade
Secretary, Mr Peter Varghese AO
Outcome 1: The advancement of Australia’s international strategic, security, and economic interests
including through bilateral, regional and multilateral engagement on Australian Government foreign,
trade and international development policy priorities
Outcome 2: The protection and welfare of Australians abroad and access to secure international
travel documentation through timely and responsive travel advice and consular and passport
services in Australia and overseas
Outcome 3: A secure Australian Government presence overseas through the provision of security
services and information and communications technology infrastructure, and the management of
the Commonwealth’s overseas owned estate
Australian Centre for International
Agricultural Research
Chief Executive Officer, Dr Nick Austin
Outcome 1: To achieve more productive and
sustainable agricultural systems for the
benefit of developing countries and Australia
through international agricultural research
and training partnerships
Australian Trade Commission
Chief Executive Officer, Mr Bruce Gosper
Outcome 1: Contribute to Australia’s economic
prosperity by promoting Australia’s export and
other international economic interests through the
provision of information, advice and services to
business, associations, institutions and government
Outcome 2: The protection and welfare of
Australians abroad through timely and responsive
consular and passport service in specific locations
overseas
Tourism Australia
Chair, Mr Anthony South
Managing Director, Mr John O’Sullivan
Outcome 1: Grow demand for and foster a
competitive and sustainable tourism industry
through partnership marketing to targeted
consumers in key markets
Australian Secret Intelligence Service
Director-General, Mr Nick Warner AO PSM
Outcome 1: Enhanced understanding for the
Government of the overseas environment
affecting Australia’s interests through the
provision of covert intelligence services
about the capabilities, intentions or activities
of people or organisations outside Australia
Export Finance and Insurance Corporation
Chair, Mr James M Millar AM
Managing Director, Mr Andrew Hunter
Purpose: Facilitate and encourage Australian
export trade on a commercial basis

Portfolio Overview
6
Portfolio resources
Table 1 shows those entities reporting in the PAES and the additional resources
provided to the Portfolio in the 2015-16 budget year, by entity.
Table 1: Portfolio Resources (2015-16 Additional Estimates)
Appropriation
Bill No. 3
($m)
Appropriation
Bill No. 4
($m)
Special
appropriation
($m)
Receipts
($m)
Total
($m)
Department of Foreign
Affairs and Trade
Administered appropriations 23.5 - - - 23.5
Departmental appropriations 21.1 - - - 21.1
Total: 44.6 - - - 44.6
Australian Trade
Commission
Administered appropriations 10.3 - - - 10.3
Departmental appropriations - - - - -
Total: 10.3 - - - 10.3
Tourism Australia
Administered appropriations - - - - -
Departmental appropriations 6.7 - - - 6.7
Total: 6.7 - - - 6.7
Portfolio total 61.6
61.6Resources available w ithin portfolio:


8
ENTITY ADDITIONAL ESTIMATES
STATEMENTS
Department of Foreign Affairs and Trade (DFAT) .................................................... 9
Australian Trade Commission (Austrade) .............................................................. 62
Tourism Australia .................................................................................................... 89
9
DEPARTMENT OF FOREIGN AFFAIRS AND TRADE
Section 1: Entity overview and resources ............................................................. 11
1.1 Strategic direction statement .............................................................................. 11
1.2 Entity resource statement ................................................................................... 11
1.3 Entity measures ................................................................................................. 15
1.4 Additional estimates and variations ..................................................................... 17
1.5 Breakdown of additional estimates by appropriation bill ...................................... 19
Section 2: Revisions to outcomes and planned performance .............................. 22
2.1 Outcomes and performance information ............................................................. 22
Section 3: Explanatory tables and budgeted financial statements ....................... 42
3.1 Explanatory tables .............................................................................................. 42
3.2 Budgeted financial statements ............................................................................ 44


11
DEPARTMENT OF FOREIGN AFFAIRS AND TRADE
Section 1: Entity overview and resources
1.1 STRATEGIC DIRECTION STATEMENT
To further progress the priorities outlined in the Portfolio Budget Statements 2015-16, the
Government has allocated funds for Australia’s investment as a founding member of
the Asian Infrastructure Investment Bank (AIIB). The Department and the Treasury are
together engaging the AIIB, with staff assigned in Canberra and the deployment of a
staff member to Beijing (China), to facilitate Australia’s participation as a member of the bank.
A full outline of DFAT’s Strategic Direction can be found in the Portfolio Budget
Statements 2015-16.
1.2 ENTITY RESOURCE STATEMENT
The Entity Resource Statement details the resourcing for DFAT at Additional
Estimates. Table 1.1 outlines the total resourcing available from all sources for the 2015-16 Budget year, including variations through Appropriation Bill Nos. 3 and No. 4,
Special Appropriations and Special Accounts.

DFAT Additional Estimates Statements
12
Table 1.1: DFAT resource statement — Additional Estimates for 2015-16 as at Additional Estimates February 2016
Table continued on the following page.
Actual
Available
Appropriation
2014-15
$'000
Estimate as at
Budget
2015-16
$'000
Proposed
Additional
Estimate
2015-16
$'000
Total estimate
at Additional
Estimates
2015-16
$'000
Ordinary annual services (a)
Departmental appropriation
Prior year appropriations (b) 292,010 - - 292,010
Departmental appropriation (c) - 1,399,990 21,096 1,421,086
s74 Retained revenue receipts (d) - 81,599 - 81,599
Total 292,010 1,481,589 21,096 1,794,695
Administered expenses
Outcome 1 (e) 411,328 3,579,158 23,518 4,014,004
Outcome 2 159 750 - 750
Payments to corporate entities (f) - 137,290 6,728 144,018
Total 411,487 3,717,198 30,246 4,158,931
Total ordinary annual services [A] 703,497 5,198,787 51,342 5,953,626
Departmental non-operating
Prior year appropriations (b) 109,956 - - 109,956
Equity injections (g) - 205,241 - 205,241
Total 109,956 205,241 - 315,197
Administered non-operating
Prior year appropriations (b) 2,174,844 - - 2,174,844
Administered assets and liabilities - 13,527 - 13,527
Total 2,174,844 13,527 - 2,188,371
Total other services [B] 2,284,800 218,768 - 2,503,568
Total available annual appropriations
[A+B] 2,988,297 5,417,555 51,342 8,457,194

DFAT Additional Estimates Statements
13
Table 1.1: DFAT resource statement — Additional Estimates for 2015-16 as at Additional Estimates February 2016 (continued)
(a) Appropriation Bill (No.1 and No. 3) 2015-16. (b) Estimated adjusted balance carried forward from previous year. (c) Includes an amount of $52.171m in 2015-16 for the Departmental Capital Budget (refer to Table 3.2.5 for
further details). For accounting purposes this amount has been designated as 'contributions by owners'. (d) Estimated retained revenue receipts under section 74 of the PGPA Act. (e) Includes an amount of $2.325m in 2015-16 for the Administered Capital Budget (refer to Table 3.2.10 for
further details). For accounting purposes this amount has been designated as 'contributions by owners'. (f) 'Corporate entities' are corporate Commonwealth entities and Commonwealth companies as defined
under the PGPA Act 2013. (g) Appropriation Bills (No.2 and No. 4) 2015-16. (h) Repayments not provided for under other appropriations. Amounts received on or before 30 June 2014
were repaid under section 28 of the Financial Management and Accountability Act 1997. (i) Estimated opening balance for special accounts (less ‘Special Public Money’ held in accounts like Other
Trust Monies accounts (OTM), Services for other Government and Non-agency Bodies accounts (SOG), or Services for Other Entities and Trust Moneys accounts (SOETM)).
(j) For further information on special accounts see Table 3.1.1. (k) Appropriation receipts from DFAT annual and special appropriations for 2015-16 included above. (l) Appropriation receipts from other entities credited to DFAT's special accounts. Reader note: All figures are GST exclusive. These figures may not match figures in the cash flow statement.
Table continued on the following page.
Actual
Available
Appropriation
2014-15
$'000
Estimate as at
Budget
2015-16
$'000
Proposed
Additional
Estimate
2015-16
$'000
Total estimate
at Additional
Estimates
2015-16
$'000
Special appropriations
Special appropriations limited by
criteria/entitlement
Public Governance, Performance and
Accountability Act 2013 - s77 (h)
Passport Refunds 945 1,010 - 1,010
Total special appropriations [C] 945 1,010 - 1,010
Total appropriations excluding special
accounts
2,989,242 5,418,565 51,342 8,459,149
Special accounts
Opening balance (i) 281,327 154,027 53,432 207,459
Appropriation receipts (j) 166,057 65,765 - 65,765
Appropriation receipts - other entities (k) 30,445 24,271 - 24,271
Non-appropriation receipts to Special
Accounts 5,246 5,540 (2,477) 3,063
Total special accounts [D] 483,075 249,603 50,955 300,558
Total resourcing [A+B+C+D] 3,472,317 5,668,168 102,297 8,758,762
Less appropriations draw n from annual
or special appropriations above and
credited to special accounts (166,057) (65,765) - (65,765)and/or payments to corporate entities
through annual appropriations - (137,290) (6,728) (144,018)
Total net resourcing for DFAT 3,306,260 5,465,113 95,569 8,548,979
DFAT Additional Estimates Statements
14
Table 1.1: DFAT resource statement — Additional Estimates for 2015-16 as at Additional Estimates February 2016 (continued)
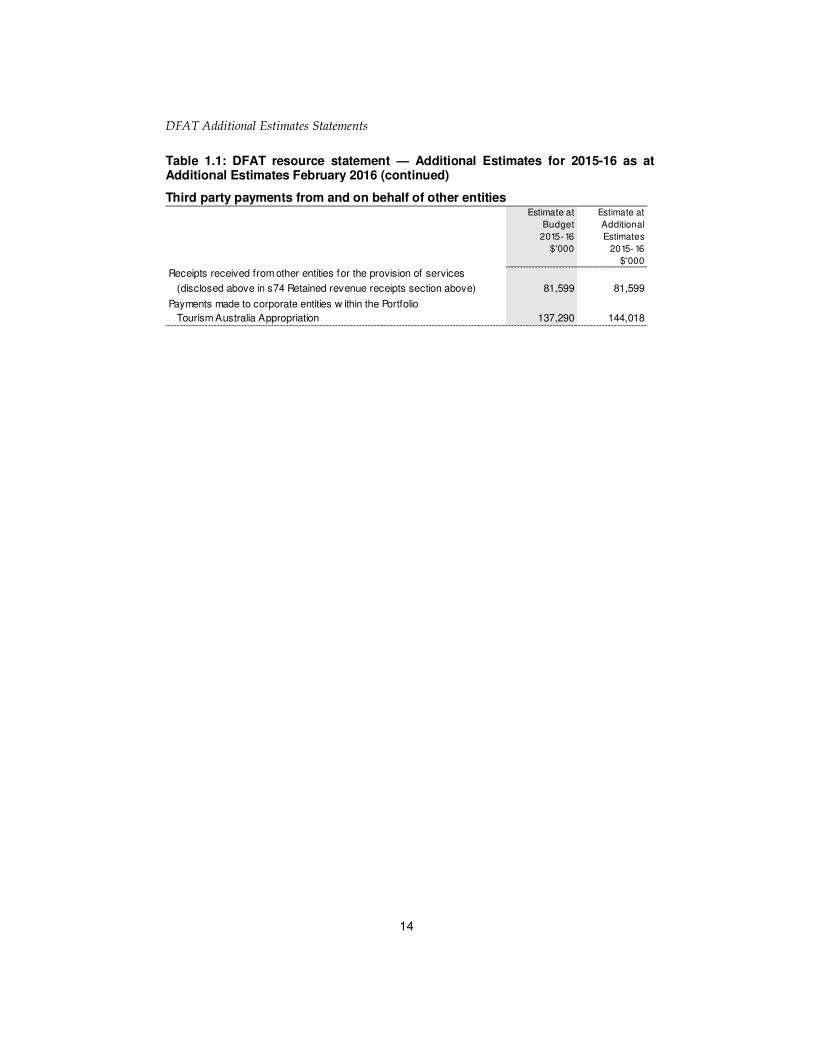
Third party payments from and on behalf of other entities
Estimate at
Budget
2015- 16
$'000
Estimate at
Additional
Estimates
2015- 16
$'000
Receipts received from other entities for the provision of services
(disclosed above in s74 Retained revenue receipts section above) 81,599 81,599
Payments made to corporate entities w ithin the Portfolio
Tourism Australia Appropriation 137,290 144,018
DFAT Additional Estimates Statements
15
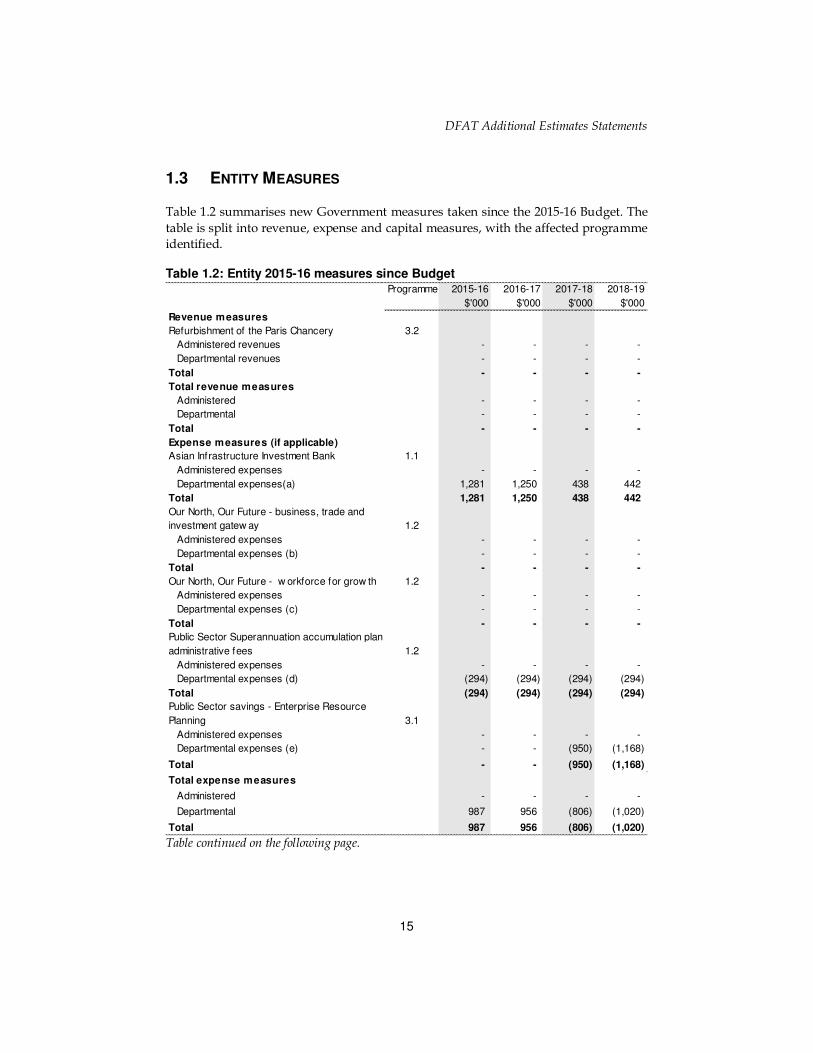
1.3 ENTITY MEASURES
Table 1.2 summarises new Government measures taken since the 2015-16 Budget. The
table is split into revenue, expense and capital measures, with the affected programme identified.
Table 1.2: Entity 2015-16 measures since Budget
Table continued on the following page.
Programme 2015-16
$'000
2016-17
$'000
2017-18
$'000
2018-19
$'000
Revenue measures
Refurbishment of the Paris Chancery 3.2
Administered revenues - - - -
Departmental revenues - - - -
Total - - - -
Total revenue measures
Administered - - - -
Departmental - - - -
Total - - - -
Expense measures (if applicable)
Asian Infrastructure Investment Bank 1.1
Administered expenses - - - -
Departmental expenses(a) 1,281 1,250 438 442
Total 1,281 1,250 438 442
Our North, Our Future - business, trade and
investment gatew ay 1.2
Administered expenses - - - -
Departmental expenses (b) - - - -
Total - - - -
Our North, Our Future - w orkforce for grow th 1.2
Administered expenses - - - -
Departmental expenses (c) - - - -
Total - - - -
Public Sector Superannuation accumulation plan
administrative fees 1.2
Administered expenses - - - -
Departmental expenses (d) (294) (294) (294) (294)
Total (294) (294) (294) (294)
Public Sector savings - Enterprise Resource
Planning 3.1
Administered expenses - - - -
Departmental expenses (e) - - (950) (1,168)
Total - - (950) (1,168)
Total expense measures
Administered - - - -
Departmental 987 956 (806) (1,020)
Total 987 956 (806) (1,020)

DFAT Additional Estimates Statements
16
Table 1.2: Entity 2015-16 measures since Budget (continued)
Prepared on a Government Financial Statistics (fiscal) basis. (a) The lead entity for Asian Infrastructure Investment Bank is Treasury. The full measure description and
package details appear in MYEFO under the Treasury Portfolio. (b) The lead entity for Our North, Our Future - business, trade and investment gateway is the Department of
Industry, Innovation and Science. The full measure description and package details appear in MYEFO under the Industry, Innovation and Science Portfolio.
(c) The lead entity for Our North, Our Future — workforce for growth is the Department of Immigration and Border Protection. The full measure description and package details appear in MYEFO under the Immigration and Border Protection Portfolio.
(d) Public Sector Superannuation accumulation plan administration fees is a cross portfolio measure lead by the Department of Finance. The full measure description appears in 2014-15 MYEFO under cross portfolio measures. Savings for this measure were included as a 'decision taken but not yet announced'
in the 2014‑15 Budget. (e) Public Sector savings - Enterprise Resource Planning is a cross portfolio measure lead by the
Department of Finance. The full measure description and package appear in the 2015-16 Budget under cross portfolio measures.
Programme 2015-16
$'000
2016-17
$'000
2017-18
$'000
2018-19
$'000
Capital measures (if applicable)
Refurbishment of the Paris Chancery 3.2
Administered capital - - - -
Departmental capital - - - -
Total - - - -
Savings from Overseas Property Repairs and
Maintenance 3.2
Administered capital - - - -
Departmental capital - - - -
Total - - - -
Total capital measures
Administered - - - -
Departmental - - - -
Total - - - -

DFAT Additional Estimates Statements
17
1.4 ADDITIONAL ESTIMATES AND VARIATIONS
The following tables detail the changes to the resourcing for DFAT at Additional
Estimates, by outcome. Table 1.3 details the Additional Estimates and variations resulting from new measures since the 2015-16 Budget in Appropriation Bills Nos. 3
and 4. Table 1.4 details Additional Estimates or variations through other factors, such
as parameter adjustments.
Table 1.3: Additional estimates and variations to outcomes from measures since 2015-16 Budget
Programme
impacted
2015-16
$'000
2016-17
$'000
2017-18
$'000
2018-19
$'000
Outcome 1
Increase in estimates (departmental)
Asian Infrastructure Investment Bank 1.1 1,281 1,250 438 442
Decrease in estimates (departmental)
Public Sector Superannuation Accumulation
Plan administrative fees 1.1 (294) (294) (294) (294)
Net impact on estimates for Outcome 1
(departmental)987 956 144 148
Outcome 3
Decrease in estimates (departmental)
Whole of Government savings - Enterprise
Resource Planning 3.1 - - (950) (1,168)
Net impact on estimates for Outcome 3
(departmental)- - (950) (1,168)

DFAT Additional Estimates Statements
18
Table 1.4: Additional estimates and variations to outcomes from other variations
Programme
impacted
2015-16
$'000
2016-17
$'000
2017-18
$'000
2018-19
$'000
Outcome 1
Increase in estimates (administered)
Adjustment for Foreign Exchange 1.1 182 169 156 185
Adjustment for UN Peacekeeping
Operations1.5 10,445 11,279 11,545 13,547
Adjustment for International Organisations 1.5 6,400 6,853 7,016 8,207
Adjustment for contributions from Other
Government Departments to Aid
reprioritisation
1.2 6,491 - - -
Net impact on estimates for Outcome
1 (administered)23,518 18,301 18,717 21,939
Increase in estimates (departmental)
Adjustment for Overseas Inf lation 1.1 383 383 383 383
Adjustment for Foreign Exchange 1.1 4,314 4,314 4,314 4,314
Adjustment for 2014-15 Foreign Exchange
Rebasing1.1 9,505 - - -
Net impact on estimates for Outcome
1 (departmental)14,202 4,697 4,697 4,697
Outcome 2
Increase in estimates (departmental)
Adjustment for Overseas Inf lation 2.1,2.2 248 248 248 248
Adjustment for Foreign Exchange 2.1,2.2 2,792 2,792 2,792 2,792
Decrease in estimates (departmental)
Adjustment for Passport Funding due to
low er than expected passport issues 2015-
16
2.2 (7,738) (12,797) (12,281) (12,048)
Net impact on estimates for Outcome
2 (departmental)(4,698) (9,757) (9,241) (9,008)
Outcome 3
Increase in estimates (departmental)
Adjustment for Overseas Inflation 3.1 120 120 120 120
Adjustment for Foreign Exchange 3.1 1,352 1,352 1,352 1,352
Adjustment for 2014-15 Foreign
Exchange Rebasing3.1 9,133 - - -
Decrease in estimates (departmental)
Capital injection (departmental)
reduction in equity due to change of
scope for the diplomatic accomodation
project in Kabul
3.1 (3,730) (16,475) - -
Net impact on estimates for Outcome
3 (departmental)6,875 (15,003) 1,472 1,472

DFAT Additional Estimates Statements
19
1.5 BREAKDOWN OF ADDITIONAL ESTIMATES BY APPROPRIATION
BILL
The following tables detail the Additional Estimates sought for DFAT through
Appropriation Bills Nos. 3 and 4.
Table 1.5: Appropriation Bill (No. 3) 2015-16
Table continued on the following page.
2014-15
Available
$'000
2015-16
Budget
$'000
2015-16
Revised
$'000
Additional
Estimates
$'000
Reduced
Estimates
$'000
Administered items
Outcome 1 - The advancement
of Australia's international
strategic, security and economic
interests including through
bilateral, regional and multilateral
engagement on Australian
Government foreign, trade and
international development policy
priorities
4,530,015 3,579,158 3,602,676 23,518 -
Total administered 4,530,015 3,579,158 3,602,676 23,518 -

DFAT Additional Estimates Statements
20
Table 1.5: Appropriation Bill (No. 3) 2015-16 (continued)
2014-15
Available
$'000
2015-16
Budget
$'000
2015-16
Revised
$'000
Additional
Estimates
$'000
Reduced
Estimates
$'000
Departmental programmes
Outcome 1 - The advancement
of Australia's international
strategic, security and economic
interests including through
bilateral, regional and multilateral
engagement on Australian
Government foreign, trade and
international development policy
priorities
841,458 866,556 881,745 15,189 -
Outcome 2 - The protection
and w elfare of Australians
abroad and access to secure
international travel
documentation through timely
and responsive travel advice
and consular and passport
services in Australia and
overseas
329,264 340,091 335,393 - (4,698)
Outcome 3 - A secure
Australian Government
presence overseas through the
provision of security services
and information and
communications technology
infrastructure, and the
management of the
Commonw ealth's overseas
ow ned estate
206,594 193,343 203,948 10,605 -
Total departmental 1,377,316 1,399,990 1,421,086 25,794 (4,698)
Total administered and
departmental5,907,331 4,979,148 5,023,762 49,312 (4,698)

DFAT Additional Estimates Statements
21
Table 1.6: Appropriation Bill (No. 4) 2015-16
There is no change to DFAT information supplied in the Portfolio Budget Statements
2015-16.

DFAT Additional Estimates Statements
22
Section 2: Revisions to outcomes and planned performance
2.1 OUTCOMES AND PERFORMANCE INFORMATION
There is no change to DFAT’s outcomes and performance information as expressed in the Portfolio Budget Statements 2015-16.
OUTCOME 1: THE ADVANCEMENT OF AUSTRALIA’S INTERNATIONAL
STRATEGIC, SECURITY AND ECONOMIC INTERESTS INCLUDING
THROUGH BILATERAL, REGIONAL AND MULTILATERAL ENGAGEMENT ON
AUSTRALIAN GOVERNMENT FOREIGN, TRADE AND INTERNATIONAL
DEVELOPMENT POLICY PRIORITIES
Outcome 1 strategy
There is no change to the Department’s Outcome Strategy as expressed in the Portfolio
Budget Statements 2015-16.
Measures being funded through Additional Estimates reflect the Government’s
foreign, trade, international development and security policy priorities through
Australia’s bilateral, regional and multilateral relationships.
As part of the Mid-Year Economic and Fiscal Outlook (MYEFO), the Government allocated funds to support Australia’s founding membership of the Asian
Infrastructure Investment Bank (AIIB).

DFAT Additional Estimates Statements
23
Table 2.1.1 Budgeted expenses for Outcome 1
Table continued on the following page.
Outcome 1: The advancement of Australia's international
strategic, security and economic interests including through
bilateral, regional and multilateral engagement on Australian
Government foreign, trade and international development
policy priorities
2014-15
Actual
expenses
$'000
2015-16
Estimated
actual
expenses
$'000
Programme 1.1: Foreign Affairs and Trade Operations
Administered expenses
Ordinary annual services (Appropriation Act No. 1 & Bill No. 3) 25,750 8,721
Other services (Appropriation Act No. 2 & Bill No. 4) (a ) 212,033 13,452
Special accounts (b) 277,056 257,000
Expenses not requiring appropriation in the Budget year (d) 11,022 13,452
Departmental expenses
Departmental appropriation (c) 606,612 671,532
Expenses not requiring appropriation in the Budget year (d) 95,509 123,303
Total for programme 1.1 1,227,982 1,087,460
Programme 1.2: Official Development Assistance
Administered expenses
Ordinary annual services (Appropriation Act No. 1 & Bill No. 3) - 3,112,214
Expenses not requiring appropriation in the Budget year - 1,507
Other services (Appropriation Act No. 2 & Bill No. 4) - -
Departmental expenses
Departmental appropriation (c) 231,898 230,823
Total for programme 1.2 231,898 3,344,544
Programme 1.3: Official Development Assistance - Multilateral
Replenishments
Administered expenses
Ordinary annual services (Appropriation Act No. 1 & Bill No. 3) 106,868 -
Other services (Appropriation Act No. 2 & Bill No. 4) - -
Expenses not requiring appropriation in the Budget year (e) 105,577 -
Total for Programme 1.3 212,445 -
Programme 1.4: Official Development Assistance - East Asia
AIPRD
Administered expenses
AIPRD Loans Special Account (b) 19,282 -
AIPRD Loans Special Account 2015 (b) 18,775 -
Expenses not requiring appropriation in the Budget year (e) 17,740 -
Total for Programme 1.4 55,797 -
Programme 1.5: Payments to International Organisations
Administered expenses
Ordinary annual services (Appropriation Bill No. 1 & No. 3) 319,910 432,649
Total for Programme 1.5 319,910 432,649

DFAT Additional Estimates Statements
24
Table 2.1.1 Budgeted expenses for Outcome 1 (continued)
Table continued on the following page.
Outcome 1:
2014-15
Actual
expenses
$'000
2015-16
Estimated
actual
expenses
$'000Programme 1.6: New Colombo Plan - Transforming Regional
RelationshipsAdministered expenses
Ordinary annual services (Appropriation Act No. 1 & Bill No. 3) 10,514 27,742
Other services (Appropriation Act No. 2 & Bill No. 4) 665 75
Total for Programme 1.6 11,179 27,817
Programme 1.7: Public Information Services and Public
Diplomacy
Administered expenses
Ordinary annual services (Appropriation Act No. 1 & Bill No. 3) 15,138 5,044
Total for Programme 1.7 15,138 5,044
Programme 1.8: Programmes to Promote Australia's
International Tourism Interests
Administered expenses
Tourism Australia - Corporate Commonw ealth Entity 138,865 144,018
Ordinary annual services (Appropriation Act No. 1 & Bill No. 3) 22,274 14,000
Total for Programme 1.8 161,139 158,018
Programme 1.9: Official Development Assistance - PNG & Pacific
(f)
Administered expenses
Ordinary annual services (Appropriation Act No. 1) 949,133 -
Total for Programme 1.9 949,133 -
Programme 1.10: Official Development Assistance - East Asia (f)
Administered expenses
Ordinary annual services (Appropriation Act No. 1) 1,068,435 -
Total for Programme 1.10 1,068,435 -
Programme 1.11: Official Development Assistance - Africa,
South and Central Asia, Middle East and Other (f)
Administered expenses
Ordinary annual services (Appropriation Act No. 1) 1,007,508 -
Expenses not requiring appropriation in the Budget year 1,325 -
Total for Programme 1.11 1,008,833 -
Programme 1.12: Official Development Assistance - Emergency,
Humanitarian and Refugee Programme (f)
Administered expenses
Ordinary annual services (Appropriation Act No. 1) 251,294 -
Total for Programme 1.12 251,294 -
Programme 1.13: Official Development Assistance - UN
Commonwealth and Other International Organisations (f)
Administered expenses
Ordinary annual services (Appropriation Act No. 1) 551,673 -
Total for Programme 1.13 551,673 -

DFAT Additional Estimates Statements
25
Table 2.1.1 Budgeted expenses for Outcome 1 (continued)
(a) Includes payments for the Debt-to-Health Swap with the Government of Indonesia of $12.0 million in
2014-15 and $13.4 million in 2015-16. (b) This reflects the amount of funding to be disbursed on a cash basis, not an expense basis. (c) Departmental appropriation combines 'Ordinary annual services (Appropriation Bill No. 1)' and 'Revenue
from independent sources (s 74)'. (d) Expenses not requiring appropriation in the Budget year are made up of depreciation expenses,
amortisation expenses, make good expenses, audit fees. (e) Expenses not requiring appropriation in the Budget year relates to the concessional investment discount
for the discounting of the investment component for the International Development Association and Asian Development Fund.
(f) A new programme (Programme 1.2: Official Development Assistance) has been created effective from 1 July 2015 which combines the forward estimates of these programmes.
(g) Average Staffing Levels (ASL) figures are estimates only. ASL allocated to Outcome 1 may also, at times, contribute to Outcome 2 and Outcome 3.
Note: Departmental appropriation splits and totals are indicative estimates and may change in the course of the budget year as Government priorities change.
Outcome 1:
2014-15
Actual
expenses
$'000
2015-16
Estimated
actual
expenses
$'000
Programme 1.14: Official Development Assistance - NGO,
Volunteer and Community Programmes (f)
Administered expenses
Ordinary annual services (Appropriation Act No. 1) 202,401 -
Total for Programme 1.14 202,401 -
Outcome 1 Totals by appropriation type
Administered Expenses
Ordinary annual services (Appropriation Act No. 1 & Bill No. 3) 4,530,898 3,600,370
Corporate Commonw ealth Entity 138,865 144,018
Other services (Appropriation Act No. 2 & Bill No. 4) 212,698 13,527
Special Accounts 315,113 257,000
Expenses not requiring appropriation in the Budget year 135,664 14,959
Departmental expenses
Departmental appropriation 838,510 902,355
Expenses not requiring appropriation in the Budget year 95,509 123,303
Total expenses for Outcome 1 6,267,257 5,055,532
2014-15 2015-16
Average staffing level (number) (g) 3,762 3,728

DFAT Additional Estimates Statements
26
Programme 1.1: Foreign Affairs and Trade Operations
Programme objective 1.1
There is no change to the objective for Programme 1.1 as expressed in the Portfolio
Budget Statements 2015-16.
Programme expenses 1.1
(a) Includes Programme 1.4: International Climate Change Engagement Programme published in Portfolio Additional Estimates Statements 2014-15.
(b) Expenses not requiring appropriation in the Budget year are made up of depreciation expenses, amortisation expenses, make good expenses, audit fees.
Programme deliverables 1.1
There is no change to the deliverables for Programme 1.1 as expressed in the Portfolio Budget Statements 2015-16.
Programme key performance indicators 1.1
There is no change to the key performance indicators for Programme 1.1 as expressed in the Portfolio Budget Statements 2015-16.
2014-15
Actual
$'000
2015-16
Estimated
Budget
$'000
2016-17
Forw ard
estimate
$'000
2017-18
Forw ard
estimate
$'000
2018-19
Forw ard
estimate
$'000
Annual administered expenses:
Foreign Affairs and Trade Operations
Export Finance and Insurance Corporation
(EFIC) - National Interest Account Expenses 16,370 2,078 1,300 1,300 1,300
International Climate Change Engagement (a) 2,875 3,000 3,000 3,000 3,000
Personal Benefits - Locally Engaged Staff
pension schemes 6,505 2,980 2,909 3,012 3,030
Other Administered Items 571 663 679 694 710
Other services (Appropriation Act No. 2 & Bill No. 4)
Capital Injection for EFIC 200,000 - - - -
Special Account Expenses
Administered Payments and Receipts for
Other Entities 272,309 250,000 250,000 250,000 250,000Services for Other Entities and Trust Moneys -
Foreign Affairs and Trade 4,747 7,000 7,000 7,000 7,000
Expositions Special Account - - - - -
Expenses not requiring appropriation in the
Budget year (b) - - - - -
Debt-to-Health Sw ap w ith Government of
Indonesia 12,033 13,452 15,027 - -
Other Administered Items 10,451 - - - -
Annual departmental expenses:
Foreign Affairs and Trade Operations 606,612 671,532 669,093 610,254 609,691
Expenses not requiring appropriation in the
Budget year (b) 95,509 123,303 125,348 115,327 108,874
Total programme expenses 1,227,982 1,074,008 1,074,356 990,587 983,605

DFAT Additional Estimates Statements
27
Programme 1.2: Official Development Assistance
Programme objective 1.2
There is no change to the objective for Programme 1.2 as expressed in the Portfolio
Budget Statements 2015-16.
Programme expenses 1.2
(a) Expenses not requiring appropriation in the Budget year are made up of depreciation expenses, amortisation expenses, make good expenses, audit fees.
Programme deliverables 1.2
There is no change to the deliverables for Programme 1.2 as expressed in the Portfolio Budget Statements 2015-16.
Programme key performance indicators 1.2
There is no change to the key performance indicators for Programme 1.2 as expressed
in the Portfolio Budget Statements 2015-16.
2014-15
Actual
$'000
2015-16
Estimated
Budget
$'000
2016-17
Forw ard
estimate
$'000
2017-18
Forw ard
estimate
$'000
2018-19
Forw ard
estimate
$'000
Annual administered expenses:
Off icial Development Assistance - 3,112,214 2,915,190 3,170,934 3,382,150
Expenses not requiring appropriation in the
Budget year (a) - 1,507 1,489 1,489 2,440
Annual departmental expenses:
Off icial Development Assistance 231,898 230,823 245,466 254,532 263,523
Total programme expenses 231,898 3,344,544 3,162,145 3,426,955 3,648,113
DFAT Additional Estimates Statements
28
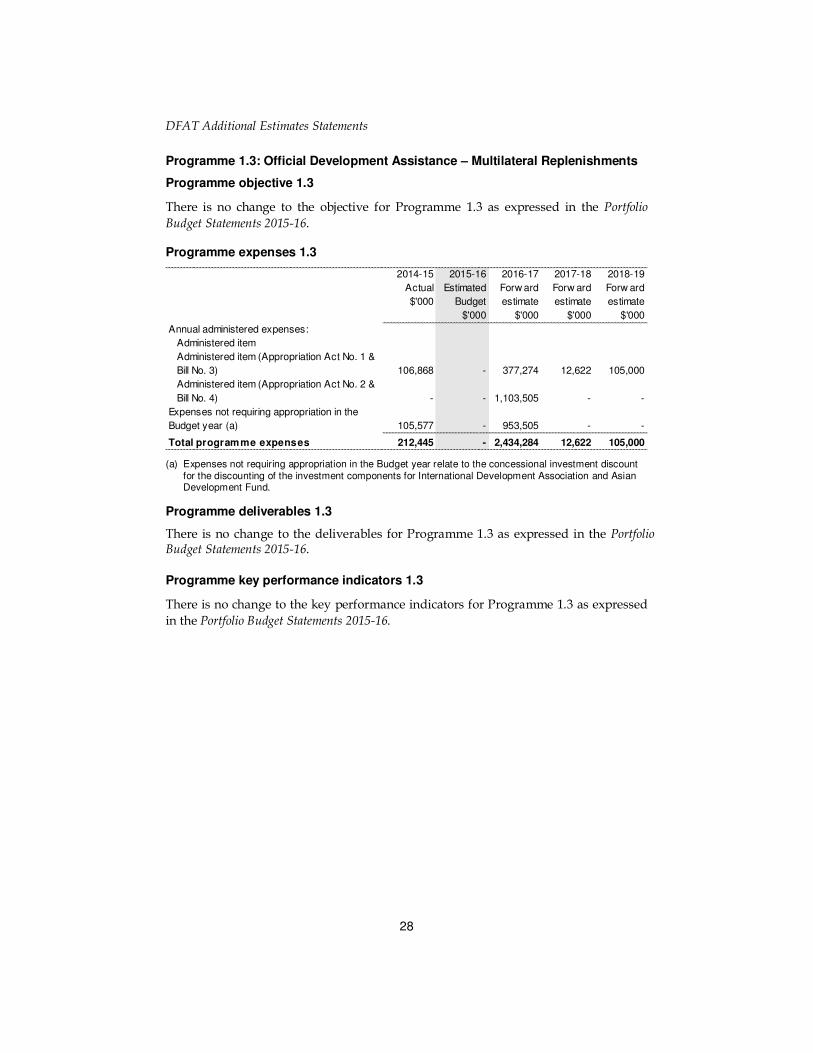
Programme 1.3: Official Development Assistance – Multilateral Replenishments
Programme objective 1.3
There is no change to the objective for Programme 1.3 as expressed in the Portfolio
Budget Statements 2015-16.
Programme expenses 1.3
(a) Expenses not requiring appropriation in the Budget year relate to the concessional investment discount for the discounting of the investment components for International Development Association and Asian Development Fund.
Programme deliverables 1.3
There is no change to the deliverables for Programme 1.3 as expressed in the Portfolio Budget Statements 2015-16.
Programme key performance indicators 1.3
There is no change to the key performance indicators for Programme 1.3 as expressed
in the Portfolio Budget Statements 2015-16.
2014-15
Actual
$'000
2015-16
Estimated
Budget
$'000
2016-17
Forw ard
estimate
$'000
2017-18
Forw ard
estimate
$'000
2018-19
Forw ard
estimate
$'000
Annual administered expenses:
Administered item
Administered item (Appropriation Act No. 1 &
Bill No. 3) 106,868 - 377,274 12,622 105,000
Administered item (Appropriation Act No. 2 &
Bill No. 4) - - 1,103,505 - -
Expenses not requiring appropriation in the
Budget year (a) 105,577 - 953,505 - -
Total programme expenses 212,445 - 2,434,284 12,622 105,000

DFAT Additional Estimates Statements
29
Programme 1.4: Official Development Assistance – East Asia AIPRD
Programme objective 1.4
There is no change to the objective for Programme 1.4 as expressed in the Portfolio
Budget Statements 2015-16.
Programme expenses 1.4
(a) This reflects the amount of funding to be disbursed on a cash basis, not an expense basis. (b) Expenses not requiring appropriation year relates to the concessional discounting of the loan.
Programme deliverables 1.4
There is no change to the deliverables for Programme 1.4 as expressed in the Portfolio Budget Statements 2015-16.
Programme key performance indicators 1.4
There is no change to the key performance indicators for Programme 1.4 as expressed
in the Portfolio Budget Statements 2015-16.
2014-15
Actual
$'000
2015-16
Estimated
Budget
$'000
2016-17
Forw ard
estimate
$'000
2017-18
Forw ard
estimate
$'000
2018-19
Forw ard
estimate
$'000
Annual administered expenses:
Special Account Expenses
AIPRD Loans Special Account (a) 19,282 - - - -
AIPRD Loans Special Account 2015 (a) 18,775 - - - -
Expenses not requiring appropriation in the
Budget year (b) 17,740 - - - -
Total programme expenses 55,797 - - - -

DFAT Additional Estimates Statements
30
Programme 1.5: Payments to International Organisations
Programme objective 1.5
There is no change to the objective for Programme 1.5 as expressed in the Portfolio
Budget Statements 2015-16.
Programme expenses 1.5
Programme deliverables 1.5
There is no change to the deliverables for Programme 1.5 as expressed in the Portfolio Budget Statements 2015-16.
Programme key performance indicators 1.5
There is no change to the key performance indicators for Programme 1.5 as expressed
in the Portfolio Budget Statements 2015-16.
2014-15
Actual
$'000
2015-16
Estimated
Budget
$'000
2016-17
Forw ard
estimate
$'000
2017-18
Forw ard
estimate
$'000
2018-19
Forw ard
estimate
$'000
Annual administered expenses:
Administered item
Payments to International Organisations 319,910 432,649 454,727 479,156 506,005
Total programme expenses 319,910 432,649 454,727 479,156 506,005

DFAT Additional Estimates Statements
31
Programme 1.6: New Colombo Plan – Transforming Regional Relationships
Programme objective 1.6
There is no change to the objective for Programme 1.6 as expressed in the Portfolio
Budget Statements 2015-16.
Programme expenses 1.6
Programme deliverables 1.6
There is no change to the deliverables for Programme 1.6 as expressed in the Portfolio Budget Statements 2015-16.
Programme key performance indicators 1.6
There is no change to the key performance indicators for Programme 1.6 as expressed
in the Portfolio Budget Statements 2015-16.
2014-15
Actual
$'000
2015-16
Estimated
Budget
$'000
2016-17
Forw ard
estimate
$'000
2017-18
Forw ard
estimate
$'000
2018-19
Forw ard
estimate
$'000
Annual administered expenses:
Administered item
New Colombo Plan - Transforming Regional
Relationships 10,514 27,742 27,790 50,933 50,933
Administered item (Appropriation Act No. 2 &
Bill No. 4) 665 75 425 150 -
Total programme expenses 11,179 27,817 28,215 51,083 50,933

DFAT Additional Estimates Statements
32
Programme 1.7: Public Information Services and Public Diplomacy
Programme objective 1.7
There is no change to the objective for Programme 1.7 as expressed in the Portfolio
Budget Statements 2015-16.
Programme expenses 1.7
Programme deliverables 1.7
There is no change to the deliverables for Programme 1.7 as expressed in the Portfolio Budget Statements 2015-16.
Programme key performance indicators 1.7
There is no change to the key performance indicators for Programme 1.7 as expressed in the Portfolio Budget Statements 2015-16.
2014-15
Actual
$'000
2015-16
Estimated
Budget
$'000
2016-17
Forw ard
estimate
$'000
2017-18
Forw ard
estimate
$'000
2018-19
Forw ard
estimate
$'000
Annual administered expenses:
International Relations Grants Programme 4,550 4,594 4,594 4,594 4,594
Australia Netw ork 10,588 - - - -
Bali Peace Park - 450 - - -
Total programme expenses 15,138 5,044 4,594 4,594 4,594
DFAT Additional Estimates Statements
33
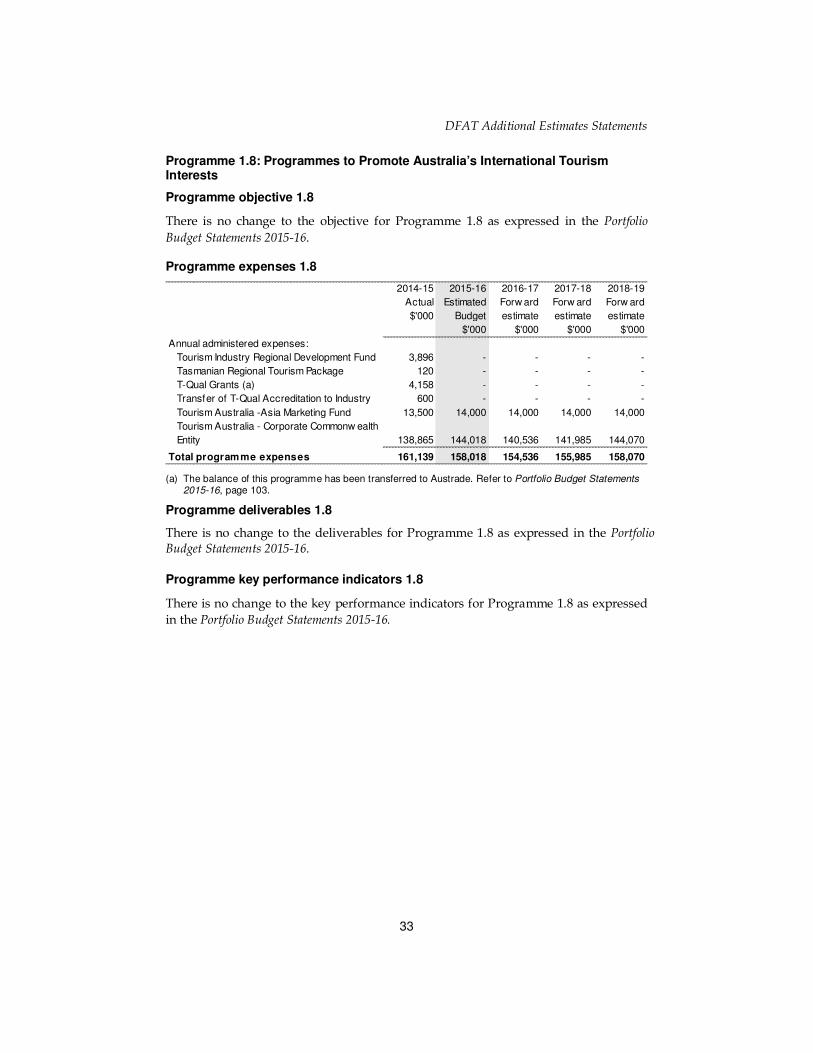
Programme 1.8: Programmes to Promote Australia’s International Tourism Interests
Programme objective 1.8
There is no change to the objective for Programme 1.8 as expressed in the Portfolio
Budget Statements 2015-16.
Programme expenses 1.8
(a) The balance of this programme has been transferred to Austrade. Refer to Portfolio Budget Statements 2015-16, page 103.
Programme deliverables 1.8
There is no change to the deliverables for Programme 1.8 as expressed in the Portfolio Budget Statements 2015-16.
Programme key performance indicators 1.8
There is no change to the key performance indicators for Programme 1.8 as expressed
in the Portfolio Budget Statements 2015-16.
2014-15
Actual
$'000
2015-16
Estimated
Budget
$'000
2016-17
Forw ard
estimate
$'000
2017-18
Forw ard
estimate
$'000
2018-19
Forw ard
estimate
$'000
Annual administered expenses:
Tourism Industry Regional Development Fund 3,896 - - - -
Tasmanian Regional Tourism Package 120 - - - -
T-Qual Grants (a) 4,158 - - - -
Transfer of T-Qual Accreditation to Industry 600 - - - -
Tourism Australia -Asia Marketing Fund 13,500 14,000 14,000 14,000 14,000
Tourism Australia - Corporate Commonw ealth
Entity 138,865 144,018 140,536 141,985 144,070
Total programme expenses 161,139 158,018 154,536 155,985 158,070

DFAT Additional Estimates Statements
34
OUTCOME 2: THE PROTECTION AND WELFARE OF AUSTRALIANS
ABROAD AND ACCESS TO SECURE INTERNATIONAL TRAVEL
DOCUMENTATION THROUGH TIMELY AND RESPONSIVE TRAVEL ADVICE
AND CONSULAR AND PASSPORT SERVICES IN AUSTRALIA AND
OVERSEAS
Outcome 2 strategy
There is no change to the Department’s Outcome Strategy as expressed in the Portfolio Budget Statements 2015-16.
DFAT will return $7.7m of passport funding due to lower than expected numbers of
passports issued in 2015-16.

DFAT Additional Estimates Statements
35
Table 2.1.2 Budgeted expenses for Outcome 2
(a) This reflects actual cash disbursements from the property account. (b) Departmental appropriation combines 'Ordinary annual services (Appropriation Act No. 1 & Bill No. 3)'
and 'Revenue from independent sources (s 74)'. (c) Expenses not requiring appropriation in the Budget year are made up of depreciation expenses,
amortisation expenses, make good expenses, audit fees. (d) Average Staffing Levels (ASL) figures are estimates only. ASL allocated to Outcome 2 may also, at
times, contribute to Outcome 1 and Outcome 3. Note: Departmental appropriation splits and totals are indicative estimates and may change in the course of the budget year as Government priorities change.
Outcome 2: The protection and welfare of Australians abroad
and access to secure international travel documentation
through timely and responsive travel advice and consular and
passport services in Australia and overseas
2014-15
Actual
expenses
$'000
2015-16
Estimated actual
expenses
$'000
Programme 2.1: Consular Services
Administered expenses
Ordinary annual services (Appropriation Act No. 1 & Bill No. 3) 159 200
Special accounts (a) 192 101
Departmental expenses (b)
Consular Services 63,535 93,983
Expenses not requiring appropriation in the Budget year (c) 2,927 -
Total for programme 2.1 66,813 94,284
Programme 2.2: Passport Services
Administered expenses
Special appropriations 945 1,010
Departmental expenses (b)
Passport Services 234,388 231,410
Expenses not requiring appropriation in the Budget year (c) 2,064 -
Total for programme 2.2 237,397 232,420
Outcome 2 Totals by appropriation type
Administered expenses
Ordinary annual services (Appropriation Act No. 1 & Bill No. 3) 159 200
Special appropriations 945 1,010
Special accounts 192 101
Departmental expenses
Departmental appropriation (b) 297,923 325,393
Expenses not requiring appropriation in the Budget year (c) 4,991 -
Total expenses for Outcome 2 304,210 326,704
2014-15 2015-16
Average staffing level (number) (d) 1,088 1,077

DFAT Additional Estimates Statements
36
Programme 2.1: Consular Services
Programme objective 2.1
There is no change to the objective for Programme 2.1 as expressed in the Portfolio
Budget Statements 2015-16.
Programme expenses 2.1
(a) This expense does not include $0.55m for Traveller’s Emergency Loans, as these are treated as receivables and form part of the receivable balance in Table 3.2.8.
(b) Expenses not requiring appropriation in the Budget year are made up of depreciation expenses, amortisation expenses, make-good expenses, audit fees.
Programme deliverables 2.1
There is no change to the deliverables for Programme 2.1 as expressed in the Portfolio Budget Statements 2015-16.
Programme key performance indicators 2.1
There is no change to the key performance indicators for Programme 2.1 as expressed
in the Portfolio Budget Statements 2015-16.
2014-15
Actual
$'000
2015-16
Estimated
actual
$'000
2016-17
Forw ard
estimate
$'000
2017-18
Forw ard
estimate
$'000
2018-19
Forw ard
estimate
$'000
Annual administered expenses:
Administered item
Consular Emergency Services (a) 159 200 200 200 200
Special account expenses:
Consular Services Special Account 192 101 100 100 100
Annual departmental expenses:
Consular Services 63,535 93,983 93,967 95,153 95,233
Expenses not requiring appropriation in the
Budget year (b)2,927 - - - -
Total programme expenses 66,813 94,284 94,267 95,453 95,533

DFAT Additional Estimates Statements
37
Programme 2.2: Passport Services
Programme objective 2.2
There is no change to the objective for Programme 2.2 as expressed in the Portfolio
Budget Statements 2015-16.
Programme expenses 2.2
(a) Expenses not requiring appropriation in the Budget year are made up of depreciation expenses, amortisation expenses, make-good expenses, audit fees.
Programme deliverables 2.2
There is no change to the deliverables for Programme 2.2 as expressed in the Portfolio Budget Statements 2015-16.
Programme key performance indicators 2.2
There is no change to the key performance indicators for Programme 2.2 as expressed in the Portfolio Budget Statements 2015-16.
2014-15
Actual
$'000
2015-16
Estimated
actual
$'000
2016-17
Forw ard
estimate
$'000
2017-18
Forw ard
estimate
$'000
2018-19
Forw ard
estimate
$'000
Annual administered expenses:
Special appropriations:
PGPA Act s77 - Passport Refunds 945 1,010 1,010 1,010 1,010
Annual departmental expenses:
Passport Services 234,388 231,410 226,530 227,354 227,362
Expenses not requiring appropriation in the
Budget year (a) 2,064 - - - -
Total programme expenses 237,397 232,420 227,540 228,364 228,372

DFAT Additional Estimates Statements
38
OUTCOME 3: A SECURE AUSTRALIAN GOVERNMENT PRESENCE
OVERSEAS THROUGH THE PROVISION OF SECURITY SERVICES AND
INFORMATION AND COMMUNICATIONS TECHNOLOGY INFRASTRUCTURE, AND THE MANAGEMENT OF THE COMMONWEALTH’S OVERSEAS OWNED
ESTATE
Outcome 3 strategy
There is no change to the Department’s Outcome Strategy as expressed in the Portfolio Budget Statements 2015-16.

DFAT Additional Estimates Statements
39
Table 2.1.3 Budgeted expenses for Outcome 3
(a) Departmental appropriation combines 'Ordinary annual services (Appropriation Act No. 1 and Bill No. 3)'
and 'Revenue from independent sources (s 74)'. (b) Expenses not requiring appropriation in the Budget year are made up of depreciation expenses,
amortisation expenses, make-good expenses, audit fees. (c) This reflects actual cash disbursements from the property account. (d) Average Staffing Levels (ASL) figures are estimates only. ASL allocated to Outcome 3 may also, at
times, contribute to Outcome 1 and Outcome 2. Note: Departmental appropriation splits and totals are indicative estimates and may change in the course of the budget year as Government priorities change.
Outcome 3: A secure Australian presence overseas through
the provision of security services and inform ation and
communication technology infrastructure, and the
management of the Commonwealth's overseas owned estate
2014-15
Actual
expenses
$'000
2015-16
Estimated
actual
expenses
$'000
Programme 3.1: Foreign Affairs and Trade Security and IT
Departmental expenses
Foreign Affairs and Trade Security and IT (a) 188,169 204,815
Expenses not requiring appropriation in the Budget year (b) 34,843 -
Total for programme 3.1 223,012 204,815
Programme 3.2: Overseas Property
Departmental expenses
Special Accounts (c) 275,616 163,586
Expenses not requiring appropriation in the Budget year (b) 75,456 19,295
Total for programme 3.2 351,072 182,881
Outcome 3 Totals by appropriation type
Departmental expenses
Departmental appropriation (a) 188,169 204,815
Special accounts 275,616 163,586
Expenses not requiring appropriation in the Budget year (b) 110,299 19,295
Total expenses for Outcom e 3 574,084 387,696
2014-15 2015-16
Average staffing level (number) (d) 872 864

DFAT Additional Estimates Statements
40
Programme objective 3.1
There is no change to the objective for Programme 3.1 as expressed in the Portfolio
Budget Statements 2015-16.
Programme expenses 3.1
(a) Expenses not requiring appropriation in the Budget year are made up of depreciation expenses, amortisation expenses, make-good expenses, audit fees.
Programme deliverables 3.1
There is no change to the deliverables for Programme 3.1 as expressed in the Portfolio Budget Statements 2015-16.
Programme key performance indicators 3.1
There is no change to the key performance indicators for Programme 3.1 as expressed
in the Portfolio Budget Statements 2015-16.
2014-15
Actual
$'000
2015-16
Estimated
actual
$'000
2016-17
Forw ard
estimate
$'000
2017-18
Forw ard
estimate
$'000
2018-19
Forw ard
estimate
$'000
Annual departmental expenses:
Foreign Affairs and Trade Security and IT 188,169 204,815 208,177 146,884 146,938
Expenses not requiring appropriation in the
Budget year (a) 34,843 - - - -
Total programme expenses 223,012 204,815 208,177 146,884 146,938
DFAT Additional Estimates Statements
41
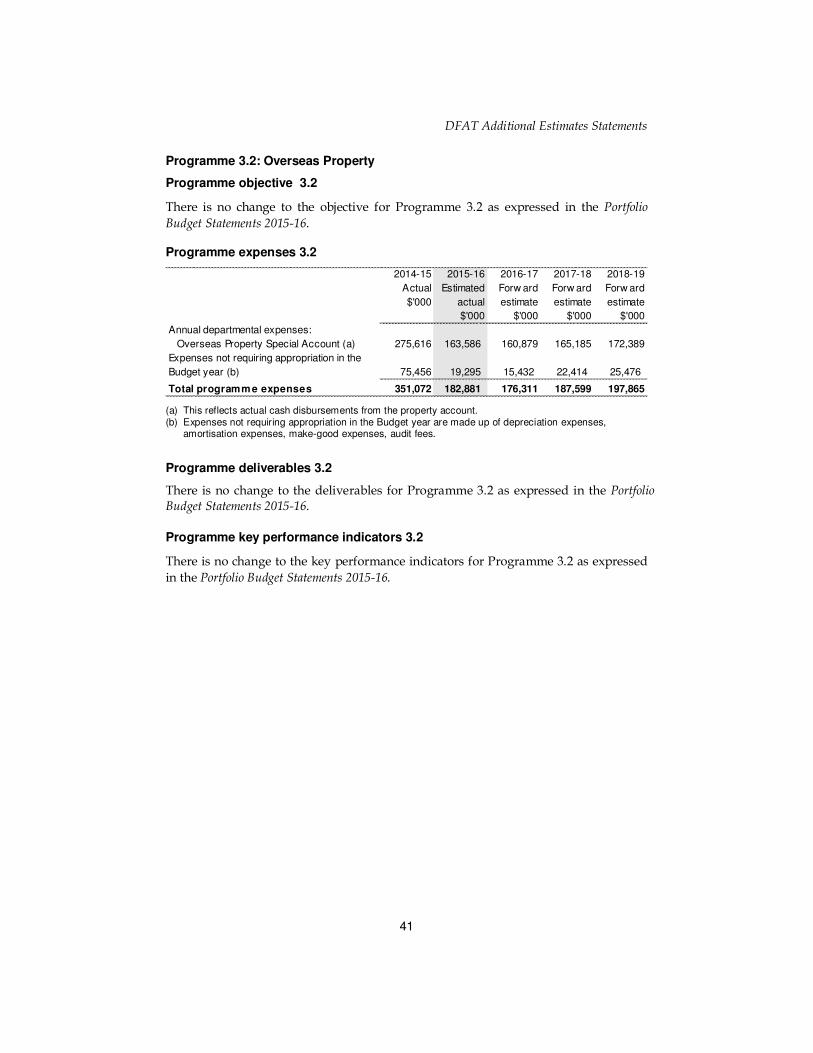
Programme 3.2: Overseas Property
Programme objective 3.2
There is no change to the objective for Programme 3.2 as expressed in the Portfolio
Budget Statements 2015-16.
Programme expenses 3.2
(a) This reflects actual cash disbursements from the property account. (b) Expenses not requiring appropriation in the Budget year are made up of depreciation expenses,
amortisation expenses, make-good expenses, audit fees.
Programme deliverables 3.2
There is no change to the deliverables for Programme 3.2 as expressed in the Portfolio Budget Statements 2015-16.
Programme key performance indicators 3.2
There is no change to the key performance indicators for Programme 3.2 as expressed
in the Portfolio Budget Statements 2015-16.
2014-15
Actual
$'000
2015-16
Estimated
actual
$'000
2016-17
Forw ard
estimate
$'000
2017-18
Forw ard
estimate
$'000
2018-19
Forw ard
estimate
$'000
Annual departmental expenses:
Overseas Property Special Account (a) 275,616 163,586 160,879 165,185 172,389
Expenses not requiring appropriation in the
Budget year (b) 75,456 19,295 15,432 22,414 25,476
Total programme expenses 351,072 182,881 176,311 187,599 197,865

DFAT Additional Estimates Statements
42
Section 3: Explanatory tables and budgeted financial statements
3.1 EXPLANATORY TABLES
Estimates of special account flows
Special Accounts provide a means to set aside and record amounts used for specified
purposes. Table 3.1.1 shows the expected additions (receipts) and reductions (payments) for each account used by DFAT. The corresponding table in the 2015-16 PB
Statements is Table 3.1.2.
Table 3.1.1: Estimates of special account flows and balances
Table continued on the following page.
Outcome Opening
balance
$'000
Receipts
$'000
Payments
$'000
Adjustments
$'000
Closing
balance
$'000
Administered Payments and Receipts for
Other Entities Special Account - s20 FMA
Act Det 2000/13 (A) - 2015-16
1 5,000 250,000 (250,000) - 5,000
Administered Payments and Receipts for
Other Entities Special Account - s20 FMA
Act Det 2000/13 (A) - 2014-15
1 5,000 272,309 (272,309) - 5,000
Consular Services Special Account - s78
PGPA Act Determination 2015/05 (A) -
2015-16
2 - 83 (83) 37 37
Consular Services Special Account - s20
FMA Act Det 2005/38 (A) - 2015-16 (a)2 38 17 (18) (37) -
Consular Services Special Account - s20
FMA Act Det 2005/38 (A) - 2014-152 34 196 (192) - 38
-
Expositions Special Account - s20 FMA Act
Det 2007/14 (A) 2015-16 (A) - 2015-161 994 - - - 994
Expositions Special Accounts - s20 FMA
Act Det 2007/14 (A) - 2014-151 994 - - - 994
Australia-Indonesia Partnership for
Reconstruction and Development (Loans)
Special Account - s78 PGPA Act
Determination 2015/01 (A) - 2015-16
1 - - - - -
Australia-Indonesia Partnership for
Reconstruction and Development (Loans)
Special Account - s78 PGPA Act
Determination 2015/01 (A) - 2014-15
1 - 18,775 (18,775) - -
Australia-Indonesia Partnership for
Reconstruction and Development (Loans)
Special Account - s20 FMA Act Det
2005/03 (A) - 2014-15 (b)
1 38,057 - (19,282) (18,775) -

DFAT Additional Estimates Statements
43
Table 3.1.1: Estimates of special account flows and balances (continued)
(A) = Administered (D) = Departmental (a) Note that this account was closed in August 2015 and replaced with the Consular Services Special
Account - s78 PGPA Act Determination 2015/05. (b) Note that this account was closed in April 2015 and replaced with the Australia-Indonesia Partnership for
Reconstruction and Development (Loans) Special Account - s78 PGPA Act Determination 2015/01.
Outcome Opening
balance
$'000
Receipts
$'000
Payments
$'000
Adjustments
$'000
Closing
balance
$'000
Services for Other Entities and Trust Monies -
s20 FMA Act Det 2009/25 (A) - 2015-161 7,399 7,000 (7,000) - 7,399
Services for Other Entities and Trust
Monies - s20 FMA Act Det 2009/25 (A) -
2014-15
1 6,978 13,781 (7,297) (6,063) 7,399
Overseas Property Special Account - DFAT -
s20 FMA Act Det 2002/01 (D) - 2015-163 207,459 91,528 (163,586) - 135,401
Overseas Property Special Account -
DFAT - s20 FMA Act Det 2002/01 (D) -
2014-15
3 281,327 201,748 (275,616) - 207,459
Total Special Accounts
2015-16 Budget estimate 220,890 348,545 (420,604) (37) 148,794
Total Special Accounts
2014-15 actual 332,390 506,809 (593,471) (24,838) 220,890

DFAT Additional Estimates Statements
44
3.2 BUDGETED FINANCIAL STATEMENTS
Differences in agency resourcing and financial statements
In accordance with the Government Finance Statistics provided by the Australian
Bureau of Statistics, the budgeted financial statements do not recognise concessionality
and the associated discounting of concessional loans. Australian Accounting
Standards require concessional loans to reflect a market related rate of interest and be
discounted over the loan maturity period. DFAT has two programmes that are
affected by this treatment:
• Asian Development Fund replenishments – investment component; and
• International Development Association replenishments – investment component.
The investment component does not impact on the fiscal or underlying cash balances,
as the provision of a loan only affects the composition of the Australian Government
investment in financial assets.
Budget Departmental Income Statement
The Department will receive a net increase in revenue from Government of
$2.5 million (excluding equity injections) in 2015-16.
DFAT’s change in revenue is primarily attributable to funding for the Department’s engagement with the Asian Infrastructure Investment Bank, an adjustment for within
year foreign exchange movements and an adjustment for passport funding due to
lower than expected passports issued in 2015-16.
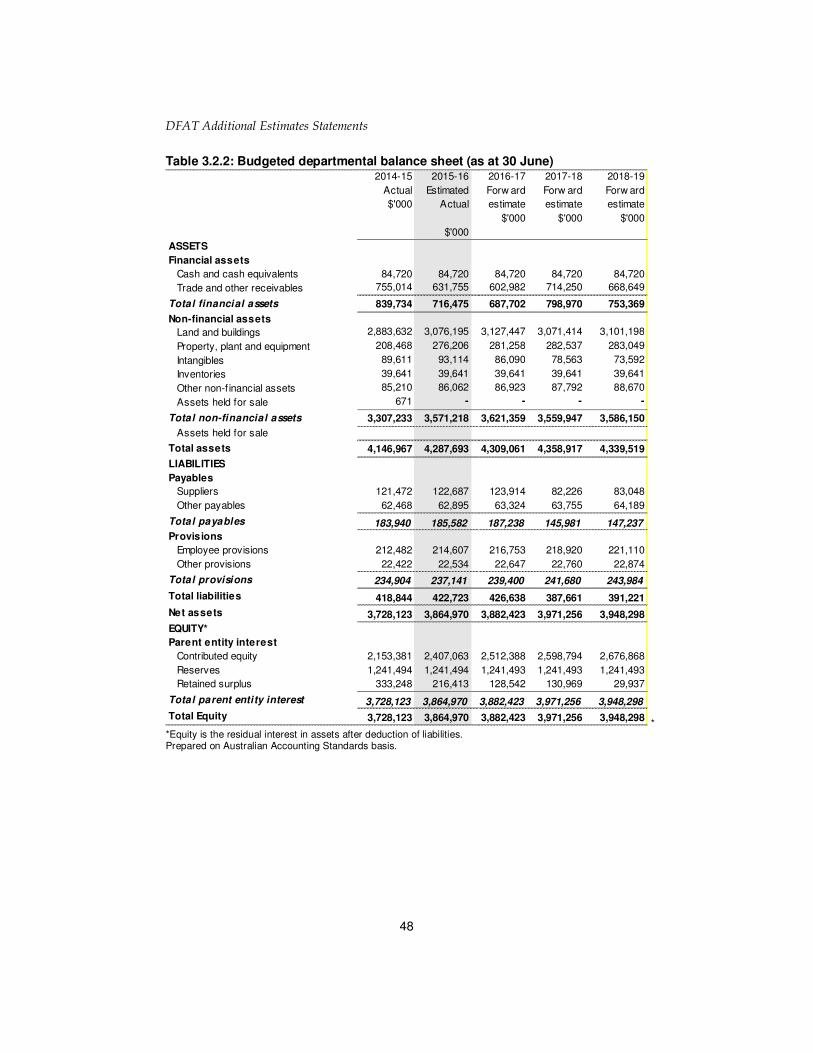
Budgeted Departmental Balance Sheet
The Department will not receive additional equity in 2015-16. For 2015-16, the
Department’s non-financial asset position is budgeted to be $3,865.0 million at year-
end. The major asset component is $3,076.2 million for Land and Buildings.
Schedule of budgeted income and expenses administered on behalf of Government
This schedule identifies the main revenues and expenses for those programs managed
and implemented by DFAT on behalf of the Government.
Administered revenues are forecast to decrease by $22.3 million from the 2015-16
Budget primarily due to a decrease in passport revenues.
Administered expenses are forecast to increase by $30.2 million from the 2015-16
Budget primarily due to an increase in UN peacekeeping operations and other
payments to International Organisations.

DFAT Additional Estimates Statements
45
Schedule of budgeted assets and liabilities administered on behalf of Government
This schedule shows the administered assets and liabilities administered on behalf of
the Government.
Asset and liabilities administered on behalf of the Government are budgeted at
$4,305.5 million and $1,902.5 million respectively for the year ending 30 June 2016.
Schedule of budgeted administered cash flows
This schedule shows the budgeted cash flows. It provides information on the extent
and nature of cash flows by categorising them into expected cash flows from operating activities, investing activities and financing activities.

DFAT Additional Estimates Statements
46
3.2.1 Budgeted financial statements
Table 3.2.1: Comprehensive income statement (showing net cost of services) for the period ended 30 June
2014-15
Actual
$'000
2015-16
Estimated
actual
$'000
2016-17
Forw ard
estimate
$'000
2017-18
Forw ard
estimate
$'000
2018-19
Forw ard
estimate
$'000
EXPENSES
Employee benef its 725,252 740,491 745,704 728,508 731,365
Suppliers 636,431 674,895 674,097 584,468 588,513
Grants 7,929 5,000 4,930 4,930 4,930
Depreciation and amortisation 147,490 154,775 159,282 154,012 152,289
Write dow n and impairment of assets 17,950 - - - -
Finance costs - unw inding of discount 349 - - - -
Total expenses 1,535,401 1,575,161 1,584,013 1,471,918 1,477,097
LESS:
OWN-SOURCE INCOME
Ow n-source revenue
Sale of goods and rendering of services 104,953 99,062 104,863 110,769 113,817
Other 10,602 8,300 8,300 8,300 8,300
Total ow n-source revenue 115,555 107,362 113,163 119,069 122,117
Gains
Sale of assets 536 - - - -
Reveral of previous impairments 34 - - - -
Foreign exchange gains - non-speculative 6,280 - - - -
Other gains - gains on restoration obligations 2,120 - 21,345 102,698 -
Other - 687 694 701 708
Total gains 8,970 687 22,039 103,399 708
Total ow n-source income 124,525 108,049 135,202 222,468 122,825
Net cost of services 1,410,876 1,467,112 1,448,811 1,249,450 1,354,272
Revenue from Government 1,303,974 1,350,277 1,360,940 1,251,877 1,260,440
Deficit attributable to the Australian
Government (106,902) (116,835) (87,871) 2,427 (93,832)
OTHER COMPREHENSIVE INCOME
Changes in asset revaluation surplus 473,709 - - - -
Total other comprehensive income 473,709 - - - -
Total comprehensive income/(loss) 366,807 (116,835) (87,871) 2,427 (93,832)
Total comprehensive income/(loss)
attributable to the Australian
Government 366,807 (116,835) (87,871) 2,427 (93,832)
Note: Impact of net cash appropriation arrangements

DFAT Additional Estimates Statements
47
Table 3.2.1: Comprehensive income statement (showing net cost of services) for the period ended 30 June (continued)
(a) From 2010-11, the Government introduced net cash appropriation arrangements where Bill 1 revenue
appropriations for the depreciation/amortisation expenses of non-corporate Commonwealth entities (and select corporate Commonwealth entities) were replaced with a separate capital budget (the Departmental Capital Budget, or DCB) provided through Bill 1 equity appropriations. For information regarding DCBs, please refer to Table 3.2.5 Departmental Capital Budget Statement.
Prepared on Australian Accounting Standards basis.
Total comprehensive income/(loss)
excluding depreciation/amortisation
expenses previously funded through
revenue appropriations514,297 37,940 71,411 156,439 58,457
less depreciation/amortisation expenses
previously funded through revenue
appropriations (a)147,490 154,775 159,282 154,012 152,289
Total comprehensive income/(loss) -
as per the statement of
comprehensive income 366,807 (116,835) (87,871) 2,427 (93,832)
DFAT Additional Estimates Statements
48
Table 3.2.2: Budgeted departmental balance sheet (as at 30 June)
* *Equity is the residual interest in assets after deduction of liabilities. Prepared on Australian Accounting Standards basis.
2014-15
Actual
$'000
2015-16
Estimated
Actual
$'000
2016-17
Forw ard
estimate
$'000
2017-18
Forw ard
estimate
$'000
2018-19
Forw ard
estimate
$'000
ASSETS
Financial assets
Cash and cash equivalents 84,720 84,720 84,720 84,720 84,720
Trade and other receivables 755,014 631,755 602,982 714,250 668,649
Total financial assets 839,734 716,475 687,702 798,970 753,369
Non-financial assets
Land and buildings 2,883,632 3,076,195 3,127,447 3,071,414 3,101,198
Property, plant and equipment 208,468 276,206 281,258 282,537 283,049
Intangibles 89,611 93,114 86,090 78,563 73,592
Inventories 39,641 39,641 39,641 39,641 39,641
Other non-f inancial assets 85,210 86,062 86,923 87,792 88,670
Assets held for sale 671 - - - -
Total non-financial assets 3,307,233 3,571,218 3,621,359 3,559,947 3,586,150
Assets held for sale
Total assets 4,146,967 4,287,693 4,309,061 4,358,917 4,339,519
LIABILITIES
Payables
Suppliers 121,472 122,687 123,914 82,226 83,048
Other payables 62,468 62,895 63,324 63,755 64,189
Total payables 183,940 185,582 187,238 145,981 147,237
Provisions
Employee provisions 212,482 214,607 216,753 218,920 221,110
Other provisions 22,422 22,534 22,647 22,760 22,874
Total provisions 234,904 237,141 239,400 241,680 243,984
Total liabilities 418,844 422,723 426,638 387,661 391,221
Net assets 3,728,123 3,864,970 3,882,423 3,971,256 3,948,298
EQUITY*
Parent entity interest
Contributed equity 2,153,381 2,407,063 2,512,388 2,598,794 2,676,868
Reserves 1,241,494 1,241,494 1,241,493 1,241,493 1,241,493
Retained surplus 333,248 216,413 128,542 130,969 29,937
Total parent entity interest 3,728,123 3,864,970 3,882,423 3,971,256 3,948,298
Total Equity 3,728,123 3,864,970 3,882,423 3,971,256 3,948,298

DFAT Additional Estimates Statements
49
Table 3.2.3: Departmental statement of changes in equity — summary of movement (Budget Year 2015-16)
Prepared on Australian Accounting Standards basis.
Retained
earnings
$'000
Asset
revaluation
reserve
$'000
Contributed
equity/ capital
$'000
Total equity
$'000
Opening balance as at 1 July 2015
Balance carried forw ard from previous
period 333,248 1,241,494 2,153,381 3,728,123
Adjusted opening balance 333,248 1,241,494 2,153,381 3,728,123
Comprehensive income
Other comprehensive income - - - -
Surplus/(deficit) for the period (116,835) - - (116,835)
Total comprehensive income (116,835) - - (116,835)
of w hich:
Attributable to the Australian
Government (116,835) - - (116,835)
Transactions with owners
Distributions to owners
Returns of capital:
Cash transfer to the OPA - - - -
Contributions by owners
Equity Injection - Appropriation - - 201,511 201,511
Departmental Capital Budget (DCB) - - 52,171 52,171
Sub-total transactions with owners - - 253,682 253,682
Estimated closing balance as at 30
June 2016 216,413 1,241,494 2,407,063 3,864,970
Closing balance attributable to the
Australian Government 216,413 1,241,494 2,407,063 3,864,970

DFAT Additional Estimates Statements
50
Table 3.2.4: Budgeted departmental statement of cash flows (for the period ended 30 June)
Prepared on Australian Accounting Standards basis.
2014-15
Actual
$'000
2015-16
Estimated
Actual
$'000
2016-17
Forw ard
estimate
$'000
2017-18
Forw ard
estimate
$'000
2018-19
Forw ard
estimate
$'000
OPERATING ACTIVITIES
Cash received
Appropriations 1,576,118 1,350,277 1,360,940 1,251,877 1,260,440
Sale of goods and rendering of
services 86,898 107,362 113,163 119,069 122,117
Net GST received 37,798 - - - -
Other 9,236 - - - -
Total cash received 1,710,050 1,457,639 1,474,103 1,370,946 1,382,557
Cash used
Employees 722,755 737,939 743,129 725,910 728,741
Suppliers 661,344 673,253 672,441 542,349 587,257
Section 74 receipts transferred to OPA 97,699 - - - -
Other 7,731 4,802 4,732 4,732 4,732
Total cash used 1,489,529 1,415,994 1,420,302 1,272,991 1,320,730
Net cash from/(used by) operating
activities 220,521 41,645 53,801 97,955 61,827
INVESTING ACTIVITIES
Cash received
Proceeds from sales of property, plant
and equipment 1,660 - 21,345 102,698 -
Total cash received 1,660 - 21,345 102,698 -
Cash used
Purchase of property, plant, equipment
and intangibles 378,855 536,814 313,910 139,359 170,736
Total cash used 378,855 536,814 313,910 139,359 170,736
Net cash from/(used by) investing
activities (377,195) (536,814) (292,565) (36,661) (170,736)
FINANCING ACTIVITIES
Cash received
Contributed equity 159,345 232,209 70,768 39,898 5,806
Other - 304,605 243,142 99,461 164,930
Total cash received 159,345 536,814 313,910 139,359 170,736
Cash used
Returns of equity - - - - 7,200
Total cash used - - - - 7,200
Net cash used by financing activities 159,345 536,814 313,910 139,359 163,536
Net increase in cash held 2,671 41,645 75,146 200,653 54,627
Cash and cash equivalents at the
beginning of the reporting period 75,769 84,720 84,720 84,720 84,720
Effect of exchange rate movements on
cash and cash equivalents at the
beginning of the reporting period 6,280 - - - -
Cash and cash equivalents at the
end of the reporting period 84,720 84,720 84,720 84,720 84,720

DFAT Additional Estimates Statements
51
Table 3.2.5: Departmental capital budget statement (for the period ended 30 June)
(a) Includes both Act 2, Bill 4 and prior Act 2/4/6 appropriations and special capital appropriations. (b) Does not include annual finance lease costs. Include purchases from current and previous years'
Departmental Capital Budgets (DCBs). (c) Includes the following sources of funding:
- Act 1, Bill 3 and prior year Act 1/3/5 appropriations (excluding amounts from the DCB); - internally developed assets; - s 74 Retained revenue receipts; - proceeds from the sale of assets.
Prepared on Australian Accounting Standards basis.
2014-15
Actual
$'000
2015-16
Estimated
Actual
$'000
2016-17
Forw ard
estimate
$'000
2017-18
Forw ard
estimate
$'000
2018-19
Forw ard
estimate
$'000
NEW CAPITAL APPROPRIATIONS
Capital budget - Act 1 & Bill 3 (DCB) 58,508 52,171 51,908 47,590 72,268
Equity injections - Act 2 & Bill 4 100,837 201,511 53,417 38,816 5,806
Total new capital appropriations 159,345 253,682 105,325 86,406 78,074
Provided for:
Purchase of non-financial assets 159,345 253,682 105,325 86,406 78,074
Total Items 159,345 253,682 105,325 86,406 78,074
PURCHASE OF NON-FINANCIAL
ASSETS
Funded by capital appropriations (a) 100,837 232,209 70,768 39,898 5,806
Funded by capital appropriation -
DCB (b) 58,508 52,171 51,908 47,590 72,268
Funded internally from departmental
resources (c) 219,510 252,434 191,234 51,871 92,662
TOTAL 378,855 536,814 313,910 139,359 170,736
RECONCILIATION OF CASH USED TO
ACQUIRE ASSETS TO ASSET
MOVEMENT TABLE
Total purchases 378,855 536,814 313,910 139,359 170,736
Total cash used to acquire assets 378,855 536,814 313,910 139,359 170,736

DFAT Additional Estimates Statements
52
Table 3.2.6: Statement of asset movements (2015-16 Budget year)
(a) “Appropriation equity” refers to equity injections or Administered Assets and Liabilities appropriations
provided through Appropriation Act (No.2) 2015-16 and Bill (No.4) 2015-16, including CDABs. (b) “Appropriation ordinary annual services” refers to funding provided through Appropriation Act (No.1)
2015-16 and Bill (No.3) 2015-16 for depreciation/amortisation expenses, DCBs or other operational expenses.
Prepared on Australian Accounting Standards basis.
Land
$'000
Buildings
$'000
Other
property,
plant and
equipment
Computer
softw are
and
intangibles
Total
$'000
As at 1 July 2015
Gross book value 1,575,435 1,128,916 250,167 120,964 3,075,482
Accumulated depreciation/amortisation
and impairment - (149,282) (83,116) (78,247) (310,645)
Work in progress - 328,563 41,417 46,894 416,874
Opening net book balance 1,575,435 1,308,197 208,468 89,611 3,181,711
Capital asset additions
Estimated expenditure on new or
replacement assets
By purchase - appropriation equity (a) - 5,425 159,627 67,157 232,209
By purchase - appropriation ordinary
annual services (b) - 304,605 - - 304,605
Total additions - 310,030 159,627 67,157 536,814
Other movements
Depreciation/amortisation expense - (87,543) (50,472) (16,760) (154,775)
Other - - - - -
Work in progress movements (29,924) (41,417) (46,894) (118,235)
Total other movements - (117,467) (91,889) (63,654) (273,010)
As at 30 June 2016
Gross book value 1,575,435 1,438,946 409,794 188,121 3,612,296
Accumulated depreciation/amortisation
and impairment - (236,825) (133,588) (95,007) (465,420)
Work in progress - 298,639 - - 298,639
Closing net book balance 1,575,435 1,500,760 276,206 93,114 3,445,515

DFAT Additional Estimates Statements
53
Table 3.2.7: Schedule of budgeted income and expenses administered on behalf of Government (for the period ended 30 June)
2014-15
Actual
$'000
2015-16
Estimated
Actual
$'000
2016-17
Forw ard
estimate
$'000
2017-18
Forw ard
estimate
$'000
2018-19
Forw ard
estimate
$'000
EXPENSES
Employee benefits 6,505 2,980 2,909 3,012 3,030
Suppliers 11,999 1,673 1,689 1,704 1,720
International Development Assistance 3,427,544 3,112,214 2,915,190 3,170,934 3,382,150
Aid Programme 696,282 - - - -
IDA/ADF Multilateral Replenishment grants (a) - - 248,764 - -
Other Multilateral Replenishment grants - - 128,510 12,622 105,000
Finance costs 59,165 - - - -
Write dow n and impairment of assets 9,187 - - - -
Concessional loan discount 17,740 - - - -
Concessional investment discount - - 953,505 - -
Grants and contributions 360,526 482,635 504,311 551,883 578,732
Depreciation and amortisation 1,322 1,507 1,489 1,489 2,440
Net foreign exchange losses - non
speculative 11,022 - - - -
Other expenses 67,039 15,530 16,327 1,300 1,300
Payments to Corporate entities 138,865 144,018 140,536 141,985 144,070
Total expenses administered on behalf of
Government 4,807,196 3,760,557 4,913,230 3,884,929 4,218,442
LESS:
OWN-SOURCE INCOME
Non-taxation revenue
Sale of goods and rendering of services 402,558 432,805 450,526 459,951 469,886
Interest 13,289 1,105 96 96 96
Dividends 18,153 13,654 6,900 9,300 10,200
Other revenue 33,099 158 158 158 159
Returns of prior year administered
expenses 38,953 54,814 59,145 59,066 88,222
Total non-taxation revenue 506,052 502,536 516,825 528,571 568,563
Gains
Reversals of previous asset - - - - -
w rite-dow ns 391,236 - - - -
Total gains administered on behalf of
Government 391,236 - - - -
Total ow n-sourced income administered
on behalf of Government 897,288 502,536 516,825 528,571 568,563
Net (cost of) services (3,909,908) (3,258,021) (4,396,405) (3,356,358) (3,649,879)

DFAT Additional Estimates Statements
54
Table 3.2.7: Schedule of budgeted income and expenses administered on behalf of Government (for the period ended 30 June) (continued)
(a) International Development Association (IDA) and Asian Development Fund (ADF). Prepared on Australian Accounting Standards basis.
2014-15
Actual
$'000
2015-16
Estimated
Actual
$'000
2016-17
Forw ard
estimate
$'000
2017-18
Forw ard
estimate
$'000
2018-19
Forw ard
estimate
$'000
OTHER COMPREHENSIVE INCOME
Re-measurement of defined benefit plans (7,108) - - - -
Movement in the carrying amount of
investments 14,053 - - - -
Total other comprehensive income 6,945 - - - -
Total comprehensive income/(loss) (3,902,963) (3,258,021) (4,396,405) (3,356,358) (3,649,879)

DFAT Additional Estimates Statements
55
Table 3.2.8: Schedule of budgeted assets and liabilities administered on behalf of Government (as at 30 June)
(a) International Development Association (IDA) and Asian Development Fund (ADF). Prepared on Australian Accounting Standards basis.
2014-15
Actual
$'000
2015-16
Estimated
Actual
$'000
2016-17
Forw ard
estimate
$'000
2017-18
Forw ard
estimate
$'000
2018-19
Forw ard
estimate
$'000
ASSETS
Financial assets
Cash and cash equivalents 1,832 1,832 1,832 1,832 1,832
Trade and other receivables 33,123 - - - -
Loans and receivables 142,510 142,411 142,961 143,511 144,061
Investments (IDA/ADF)(a) 1,936,071 1,936,071 2,086,071 2,086,071 2,086,071
Investment accounted for
using the equity method 456,302 456,302 456,302 456,302 456,302
Appropriation receivable
- other - 1,761,645 2,879,737 2,527,016 2,373,302
Total financial assets 2,569,838 4,298,261 5,566,903 5,214,732 5,061,568
Non-financial assets
Leasehold improvements 1,661 2,482 3,361 2,847 2,440
Infrastructure, plant and equipment 18 33 48 1,516 1,987
Intangibles 4,586 4,568 4,568 4,568 4,568
Other non-financial assets 151 151 151 151 151
Total non-financial assets 6,416 7,234 8,128 9,082 9,146
Total assets administered on behalf
of Government 2,576,254 4,305,495 5,575,031 5,223,814 5,070,714
LIABILITIES
Payables
Suppliers 159,020 152,225 152,227 152,229 152,231
IDA/ADF grant component (a) 285,809 301,104 467,802 390,227 327,808
IDA/ADF concessional component (a) 892,360 1,028,954 1,856,847 1,597,542 1,392,797
Aid programme payable 304,640 308,826 405,356 389,359 502,802
Other payables 20,638 30,663 32,934 32,938 32,943
Total payables 1,662,467 1,821,772 2,915,166 2,562,295 2,408,581
Provisions
Employee provisions 80,749 80,749 80,749 80,749 80,749
Total provisions 80,749 80,749 80,749 80,749 80,749
Total liabilities administered on
behalf of Government 1,743,216 1,902,521 2,995,915 2,643,044 2,489,330
Net assets 833,038 2,402,974 2,579,116 2,580,770 2,581,384

DFAT Additional Estimates Statements
56
Table 3.2.9: Schedule of budgeted administered cash flows (for the period ended 30 June)
Prepared on Australian Accounting Standards basis.
2014-15
Actual
$'000
2015-16
Estimated
Actual
$'000
2016-17
Forw ard
estimate
$'000
2017-18
Forw ard
estimate
$'000
2018-19
Forw ard
estimate
$'000
OPERATING ACTIVITIES
Cash received
Sales of goods and rendering of
services 404,858 432,805 450,526 459,951 469,886
Interest 2,804 1,105 96 96 96
Dividends 18,153 13,654 6,900 9,300 10,200
Return of prior year administered
expenses 33,099 54,814 59,145 59,066 88,222
Other 118,849 158 158 158 159
Total cash received 577,763 502,536 516,825 528,571 568,563
Cash used
Grants and contributions 1,078,226 482,635 504,311 551,883 578,732
Personal benef its 2,297 2,980 2,909 3,012 3,030
International Development
Assistance 3,511,560 3,454,563 3,316,612 3,544,108 3,683,387
Suppliers 9,876 1,673 1,689 1,704 1,720
National Interest Account expenses 16,989 - - - -
Payments to corporate entities 138,865 144,018 140,536 141,985 144,070
Other 1,024 15,530 16,327 1,300 1,300
Cash to OPA 581,417 502,536 516,825 528,571 568,563
Total cash used 5,340,254 4,603,935 4,499,209 4,772,563 4,980,802
Net cash used by operating
activities(4,762,491) (4,101,399) (3,982,384) (4,243,992) (4,412,239)
INVESTING ACTIVITIES
Cash used
Purchase of property, plant and
equipment 291 2,325 2,383 2,443 2,504
Purchase of concessional
f inancial instruments 292,043 - - - -
Investment in Export Finance and
Investment Corporation 200,000 - - - -
Total cash used 492,334 2,325 2,383 2,443 2,504
Net cash used by investing
activities(492,334) (2,325) (2,383) (2,443) (2,504)
Net increase/(decrease)
in cash held (5,254,825) (4,103,724) (3,984,767) (4,246,435) (4,414,743)

DFAT Additional Estimates Statements
57
Table 3.2.9: Schedule of budgeted administered cash flows (for the period ended 30 June) (continued)
Prepared on Australian Accounting Standards basis.
2014-15
Actual
$'000
2015-16
Estimated
Actual
$'000
2016-17
Forw ard
estimate
$'000
2017-18
Forw ard
estimate
$'000
2018-19
Forw ard
estimate
$'000
Cash and cash equivalents at
beginning of reporting period16,414 1,832 1,832 1,832 1,832
Cash from Official Public Account for:
- Appropriations 5,209,782 4,103,724 3,984,767 4,246,435 4,414,743
- Special accounts 41,483 - - - -
Total cash from Official Public
Account 5,251,265 4,103,724 3,984,767 4,246,435 4,414,743
Effect of exchange rate movements
on cash and cash equivalents at the
beginning of the reporting period (11,022) - - - -
Cash and cash equivalents at end
of reporting period 1,832 1,832 1,832 1,832 1,832

DFAT Additional Estimates Statements
58
Table 3.2.10: Schedule of administered capital budget (for the period ended 30 June)
(a) Includes purchases from current and previous years' administered capital budgets (ACBs). Prepared on Australian Accounting Standards basis.
2014-15
Actual
$'000
2015-16
Estimated
Actual
$'000
2016-17
Forw ard
estimate
$'000
2017-18
Forw ard
estimate
$'000
2018-19
Forw ard
estimate
$'000
NEW CAPITAL APPROPRIATIONS
Capital budget - Bill 1 & Bill 3 (ACB) 291 2,325 2,383 2,443 2,504
Administered Assets and Liabilities
- Bill 2 & Bill 4 212,698 13,527 1,118,957 150 -
Total new capital appropriations 212,989 15,852 1,121,340 2,593 2,504
Provided for:
Purchase of non-financial assets 291 2,325 2,383 2,443 2,504
Other Items 212,698 13,527 1,118,957 150 -
Total i tems 212,989 15,852 1,121,340 2,593 2,504
PURCHASE OF NON-FINANCIAL
ASSETS
Funded by capital appropriation - ACB (a) 291 2,325 2,383 2,443 2,504
TOTAL 291 2,325 2,383 2,443 2,504
RECONCILIATION OF CASH USED TO
ACQUIRE ASSETS TO ASSET
MOVEMENT TABLE
Total accrual purchases 291 2,325 2,383 2,443 2,504
Total cash used to acquire assets 291 2,325 2,383 2,443 2,504

DFAT Additional Estimates Statements
59
Table 3.2.11: Statement of administered asset movements (2015-16 Budget year)
(a) 'Appropriation ordinary annual services' refers to funding provided through Appropriation Bills (No.1 &
No. 3) 2015-16 for depreciation/amortisation expenses, ACBs or other operational expenses. Prepared on Australian Accounting Standards basis.
Buildings
$'000
Other
property,
plant and
equipment
$'000
Other
$'000
Total
$'000
As at 1 July 2015
Gross book value 4,396 517 11,985 16,898
Accumulated depreciation/amortisation and
impairment (2,735) (499) (7,399) (10,633)
Opening net book balance 1,661 18 4,586 6,265
CAPITAL ASSET ADDITIONS
Estimated expenditure on new or
replacement assets
By purchase - appropriation ordinary annual
services (a) 1,830 495 - 2,325
Total additions 1,830 495 - 2,325
Other movements
Depreciation/amortisation expense (1,009) (480) (18) (1,507)
Total other movements (1,009) (480) (18) (1,507)
As at 30 June 2016
Gross book value 6,226 1,012 11,985 19,223
Accumulated depreciation/amortisation and
impairment (3,744) (979) (7,417) (12,140)
Closing net book balance 2,482 33 4,568 7,083
DFAT Additional Estimates Statements
60
Notes to the financial statements
Departmental Financial Statements and Schedule of Administered Activity
Under the Australian Government’s accrual-based budgeting framework, and
consistent with Australian Accounting Standards, transactions that agencies control (Departmental transactions) are separately budgeted for and reported on from
transactions agencies do not have control over (Administered transactions). This
ensures that agencies are only held fully accountable for the transactions over which
they have control.
• Departmental items are those assets, liabilities, revenues and expenses in
relation to an agency or authority that are controlled by the agency.
Departmental expenses include employee and supplier expenses and other
administrative costs, which are incurred by the agency in providing its goods and services.
• Administered items are revenues, expenses, assets and liabilities that are
managed by an agency or authority on behalf of the Government according to
set Government directions. Administered expenses include subsidies, grants and personal benefit payments and Administered revenues include taxes, fees,
fines and excises.
Appropriations in the accrual budgeting framework
Under the Australian Government’s accrual budgeting framework, separate annual appropriations are provided for:
• Departmental price of outputs appropriations: representing the Government’s
funding for outputs from agencies;
• Departmental capital appropriations: for investments by the Government for either additional equity or loans to agencies;
• Administered expense appropriations: for the estimated administered
expenses relating to an existing outcome, a new outcome or a Specific Purpose
Payment to the states; and • Administered capital appropriations: for increases in administered equity
through funding non-expense administered payments.
Special appropriations fund the majority of payments from the Consolidated Revenue Fund (especially those that are entitlement driven or involve transfers to State
governments).
Administered investments in controlled entities
The Department has two administered investments in:
• Export Finance and Insurance Corporation with an estimated asset value of $436.8 million as at 30 June 2016; and
• Tourism Australia with an estimated asset value of $19.5 million as at 30 June
2016.

DFAT Additional Estimates Statements
61
Asset Valuation
In accordance with current Australian accounting standards and the Finance Minister’s Orders, the Department’s assets are carried at fair value.

62
AUSTRALIAN TRADE COMMISSION (AUSTRADE)
Section 1: Entity overview and resources ............................................................. 63
1.1 Strategic direction statement .............................................................................. 63
1.2 Entity resource statement ................................................................................... 64
1.3 Entity measures ................................................................................................. 65
1.4 Additional estimates and variations ..................................................................... 66
1.5 Breakdown of additional estimates by appropriation bill ...................................... 68
Section 2: Revisions to outcomes and planned performance .............................. 69
2.1 Outcomes and performance information ............................................................. 69
Section 3: Explanatory tables and budgeted financial statements ....................... 75
3.1 Explanatory tables .............................................................................................. 75
3.2 Budgeted financial statements ............................................................................ 76

63
AUSTRALIAN TRADE COMMISSION (AUSTRADE)
Section 1: Entity overview and resources
1.1 STRATEGIC DIRECTION STATEMENT
A full outline of Austrade’s current strategic direction can be found in the Portfolio
Budget Statements 2015-16.
1.2 ENTITY RESOURCE STATEMENT
The Entity Resource Statement details the resourcing for Austrade at Additional
Estimates. Table 1.1 outlines the total resourcing available from all sources for the
2015-16 Budget year, including variations through Appropriation Bill No. 3 and No. 4,
special appropriations and special accounts.

Austrade Additional Estimates Statements
64
Table 1.1: Austrade Resource Statement — Additional Estimates for 2015-16 as at Additional Estimates February 2016
(a) Appropriation Act (No. 1) 2015-16 and Appropriation Bill (No. 3) 2015-16. (b) Estimated adjusted balance carried from previous year for annual appropriations. (c) Includes an amount of $14.160m in 2015-16 for the Departmental Capital Budget (refer to table 3.2.5
for further details). For accounting purposes this amount has been designated as 'contributions by owners'.
(d) Estimated retained revenue receipts under section 74 of the Public Governance, Performance and Accountability (PGPA) Act 2013.
Reader note: All figures are GST exclusive. These figures may not match figures in the cash flow statement.
Actual
available
appropriation
2014-15
$'000
Estimate as at
Budget
2015-16
$'000
Proposed
Additional
Estimate
2015-16
$'000
Total estimate
at Additional
Estimates
2015-16
$'000
Ordinary annual services(a)
Departmental appropriation
Prior year departmental appropriation(b) 45,277 42,914 - 42,914
Departmental appropriation(c) - 221,215 10,306 231,521
s74 Retained Revenue Receipts(d) - 20,000 5,100 25,100
Total 45,277 284,129 15,406 299,535
Administered expenses
Outcome 1 1,777 145,277 - 145,277
Total 1,777 145,277 - 145,277
Total ordinary annual services [A] 47,054 429,406 15,406 444,812
Other services
Departmental non-operating
Equity injections - 2,718 - 2,718
Total - 2,718 - 2,718
Total other services [B] - 2,718 - 2,718
Total available annual appropriations 47,054 432,124 15,406 447,530
Total appropriations excluding Special
Accounts 47,054 432,124 15,406 447,530
Total resourcing [A+B] 47,054 432,124 15,406 447,530
Total net resourcing for Austrade 47,054 432,124 15,406 447,530

Austrade Additional Estimates Statements
65
1.3 ENTITY MEASURES
Table 1.2 summarises new Government measures taken since the 2015-16 Budget. The
table is split into revenue, expense and capital measures, with the affected programme identified.
Table 1.2: Entity 2015-16 measures since Budget
Prepared on a Government Financial Statistics (fiscal) basis. (a) The lead entity for measure National Innovation and Science Agenda - Global Innovation Strategy is the
Department of Industry, Innovation and Science. The full measure description and package details appear in MYEFO under the Industry, Innovation and Science Portfolio.
(b) The lead entity for measure Our North, Our Future - simpler land arrangements to support investment is the Department of the Prime Minister and Cabinet. The full measure description and package details appear in MYEFO under the Prime Minister and Cabinet Portfolio.
Programme 2015-16
$'000
2016-17
$'000
2017-18
$'000
2018-19
$'000
Expense measures
National Innovation and Science
Agenda - Global Innovation Strategy
1.1
Departmental expenses(a) - 2,058 2,068 3,282
Total - 2,058 2,068 3,282
Our North, Our Future - simpler land
arrangements to support investment
1.1
Departmental expenses(b) 816 507 406 256
Total 816 507 406 256
Total expense measures
Departmental 816 2,565 2,474 3,538
Total 816 2,565 2,474 3,538
Capital measures
National Innovation and Science
Agenda - Global Innovation Strategy
1.1
Departmental capital(a) - 300 - 190
Total - 300 - 190
Total capital measures
Departmental - 300 - 190
Total - 300 - 190

Austrade Additional Estimates Statements
66
1.4 ADDITIONAL ESTIMATES AND VARIATIONS
The following tables detail the changes to the resourcing for Austrade at Additional
Estimates, by outcome. Table 1.3 details the Additional Estimates and variations resulting from new measures since the 2015-16 Budget in Appropriation Bill No. 3
and No. 4. Table 1.4 details Additional Estimates or variations through other factors,
such as parameter adjustments.
Table 1.3: Additional estimates and variations to outcomes from measures since 2015-16 Budget
Programme
impacted
2015-16
$'000
2016-17
$'000
2017-18
$'000
2018-19
$'000
Outcome 1
Increase in estimates (departmental)
National Innovation and Science
Agenda - Global Innovation Strategy -
expense
1.1 - 2,058 2,068 3,282
Our North, Our Future - simpler land
arrangements to support investment -
expense
1.1 816 507 406 256
National Innovation and Science
Agenda - Global Innovation Strategy -
capital
1.1 - 300 - 190
Net impact on estimates for
Outcome 1 (departmental) 816 2,865 2,474 3,728

Austrade Additional Estimates Statements
67
Table 1.4: Additional estimates and variations to outcomes from other variations
Programme
impacted
2015-16
$'000
2016-17
$'000
2017-18
$'000
2018-19
$'000
Outcome 1
Increase in estimates (departmental)
Movement of Funds - FTA Promotion 1.1 6,000 (6,000) - -
Changes in Foreign Exchange 1.1 3,529 30 30 30
Decrease in estimates (departmental)
Changes in Price and Wage Indices 1.1 - (59) (158) (259)
Enterprise Resource Planning Systems -
savings 1.1 - - (132) (163)
PSSap administration costs - savings 1.1 (39) (39) (39) (39)
Net impact on estimates for
Outcome 1 (departmental) 9,490 (6,068) (299) (431)
Outcome 2
Decrease in estimates (departmental)
Changes in Price and Wage Indices 2.1 - (9) (19) (28)
Net impact on estimates for
Outcome 2 (departmental) - (9) (19) (28)

Austrade Additional Estimates Statements
68
1.5 BREAKDOWN OF ADDITIONAL ESTIMATES BY APPROPRIATION
BILL
The following tables detail the Additional Estimates sought for Austrade through
Appropriation Bill No. 3 and No. 4.
Table 1.5: Appropriation Bill (No. 3) 2015-16
Note: 2014-15 available appropriation is included to allow a comparison of this year's appropriation with what was made available for use in the previous year. Available appropriation is the amount available to be drawn down, and is equal to: Budget Appropriation + Additional Estimates Appropriation + AFM - section 51 withholdings - administrative quarantines +/- Machinery of Government transfers.
Table 1.6: Appropriation Bill (No. 4) 2015-16
There is no change to Austrade information supplied in the Portfolio Budget Statements
2015-16.
2014-15
Available
$'000
2015-16
Budget
$'000
2015-16
Revised
$'000
Additional
Estimates
$'000
Reduced
Estimates
$'000
Administered items
Outcome 1 - Contribute to Australia’s
economic prosperity by promoting
Australia’s export and other
international economic interests
through the provision of information,
advice and services to business,
associations, institutions and
government 139,400 145,277 145,277 - -
Total administered 139,400 145,277 145,277 - -
Departmental programmes
Outcome 1 - Contribute to Australia’s
economic prosperity by promoting
Australia’s export and other
international economic interests
through the provision of information,
advice and services to business,
associations, institutions and
government 197,465 211,718 222,024 10,306 -
Outcome 2 - The protection and
w elfare of Australians abroad through
timely and responsive consular and
passport services in specific locations
overseas 9,314 9,497 9,497 - -
Total departmental 206,779 221,215 231,521 10,306 -
Total administered and
departmental 346,179 366,492 376,798 10,306 -

Austrade Additional Estimates Statements
69
Section 2: Revisions to outcomes and planned performance
2.1 OUTCOMES AND PERFORMANCE INFORMATION
There is no change to Austrade’s outcomes and performance information as expressed
in the Portfolio Budget Statements 2015-16.
OUTCOME 1: CONTRIBUTE TO AUSTRALIA’S ECONOMIC PROSPERITY
BY PROMOTING AUSTRALIA’S EXPORT AND OTHER INTERNATIONAL
ECONOMIC INTERESTS THROUGH THE PROVISION OF INFORMATION, ADVICE AND SERVICES TO BUSINESS, ASSOCIATIONS, INSTITUTIONS
AND GOVERNMENT
Outcome 1 strategy
There is no change to Austrade’s Outcome Strategy as expressed in the Portfolio Budget Statements 2015-16.

Austrade Additional Estimates Statements
70
Table 2.1.1 Budgeted expenses for Outcome 1
(a) Departmental Appropriation combines "Ordinary annual services” (Appropriation Act No. 1 and Bill No.
3)" and "Retained Revenue Receipts under s74 of the PGPA Act 2013". (b) Expenses not requiring appropriation in the Budget year is made up of Depreciation Expense,
Amortisation Expense, Makegood Expense, Audit Fees.
Outcome 1: Contribute to Australia’s economic prosperity by
promoting Australia’s export and other international economic
interests through the provision of information, advice and
services to business, associations, institutions and government
2014-15
Actual
expenses
$'000
2015-16
Revised
estimated
expenses
$'000
Programme 1.1: Promotion of Australia's export and other
international economic interests
Departmental expenses
Departmental appropriation(a) 192,235 226,165
Special Accounts 620 1,018
Expenses not requiring appropriation in the Budget year(b) 18,234 19,000
Total for Programme 1.1 211,089 246,183
Program 1.2: Programmes to promote Australia's exports and
other international economic interests
Administered expenses
Ordinary annual services (Appropriation Act No. 1 and Bill No. 3) 146,001 145,277
Total for Programme 1.2 146,001 145,277
Outcome 1 Totals by appropriation type
Administered Expenses
Ordinary annual services (Appropriation Act No. 1 and Bill No. 3) 146,001 145,277
Departmental expenses
Departmental appropriation(a) 192,235 226,165
Special Accounts 620 1,018
Expenses not requiring appropriation in the Budget year(b) 18,234 19,000
Total expenses for Outcome 1 357,090 391,460
2014-15 2015-16
Average Staffing Level (number) 972 978

Austrade Additional Estimates Statements
71
Program 1.1: Promotion of Australia’s exports and other international economic interests
Programme objective 1.1
There is no change to the objective for Programme 1.1 as expressed in the Portfolio
Budget Statements 2015-16.
Programme expenses 1.1
(a) Expenses not requiring appropriation in the Budget year is made up of Depreciation Expense, Amortisation Expense, Makegood Expense, Audit Fees.
Programme deliverables 1.1
There is no change to the deliverables for Programme 1.1 as expressed in the Portfolio
Budget Statements 2015-16.
Programme key performance indicators 1.1
There is no change to the key performance indicators for Programme 1.1 as expressed in the Portfolio Budget Statements 2015-16.
2014-15
Actual
$'000
2015-16
Revised
budget
$'000
2016-17
Forw ard
year 1
$'000
2017-18
Forw ard
year 2
$'000
2018-19
Forw ard
year 3
$'000
Special Account Expenses:
Services for Other Entities and Trust Monies
Special Account 620 1,018 10 - -
Annual departmental expenses:
Departmental item 192,235 226,165 213,260 213,365 216,226
Expenses not requiring appropriation in the Budget
year(a) 18,234 19,000 17,500 17,500 17,500
Total programme expenses 211,089 246,183 230,770 230,865 233,726

Austrade Additional Estimates Statements
72
Program 1.2: Programmes to promote Australia’ export and other international economic interests
Programme objective 1.2
There is no change to the objective for Programme 1.2 as expressed in the Portfolio
Budget Statements 2015-16.
Programme expenses 1.2
Programme deliverables 1.2
There is no change to the deliverables for Programme 1.2 as expressed in the Portfolio
Budget Statements 2015-16.
Programme key performance indicators 1.2
There is no change to the key performance indicators for Programme 1.2 as expressed
in the Portfolio Budget Statements 2015-16.
2014-15
Actual
$'000
2015-16
Revised
budget
$'000
2016-17
Forw ard
year 1
$'000
2017-18
Forw ard
year 2
$'000
2018-19
Forw ard
year 3
$'000
Annual administered expenses:
Export Market Development Grants (EMDG)
Scheme 144,621 137,900 137,900 137,900 137,900
Asian Business Engagement (ABE) Plan 1,380 600 200 - -
Free Trade Agreement Promotion - 1,372 773 - -
Tasmania Regional Tourism Package - 4,380 - - -
Developing Northern Australia - positioning the
north as a leader in tropical health - 1,025 1,841 2,258 2,046
Total programme expenses 146,001 145,277 140,714 140,158 139,946

Austrade Additional Estimates Statements
73
OUTCOME 2: THE PROTECTION AND WELFARE OF AUSTRALIANS
ABROAD THROUGH TIMELY AND RESPONSIVE CONSULAR AND
PASSPORT SERVICES IN SPECIFIC LOCATIONS OVERSEAS
Outcome 2 strategy
There is no change to Austrade’s Outcome Strategy as expressed in the Portfolio Budget Statements 2015-16.
Table 2.1.2 Budgeted expenses for Outcome 2
(a) Departmental Appropriation combines "Ordinary annual services (Appropriation Act No. 1 and Bill No. 3)" and "Retained Revenue Receipts under s74 of the PGPA Act 2013". (b) Expenses not requiring appropriation in the Budget year is made up of Depreciation Expense, Amortisation Expense, Makegood Expense, Audit Fees.
Outcome 2: The protection and welfare of Australians abroad
through timely and responsive consular and passport services in
specific locations overseas
2014-15
Actual
expenses
$'000
2015-16
Revised
estimated
expenses
$'000
Programme 2.1: Consular Services
Departmental expenses
Departmental appropriation(a) 12,058 13,001
Expenses not requiring appropriation in the Budget year(b) 1,129 -
Total for Programme 2.1 13,187 13,001
Outcome 2 Totals by appropriation type
Departmental expenses
Departmental appropriation(a) 12,058 13,001
Expenses not requiring appropriation in the Budget year(b) 1,129 -
Total expenses for Outcome 2 13,187 13,001
2014-15 2015-16
Average Staffing Level (number) 41 40
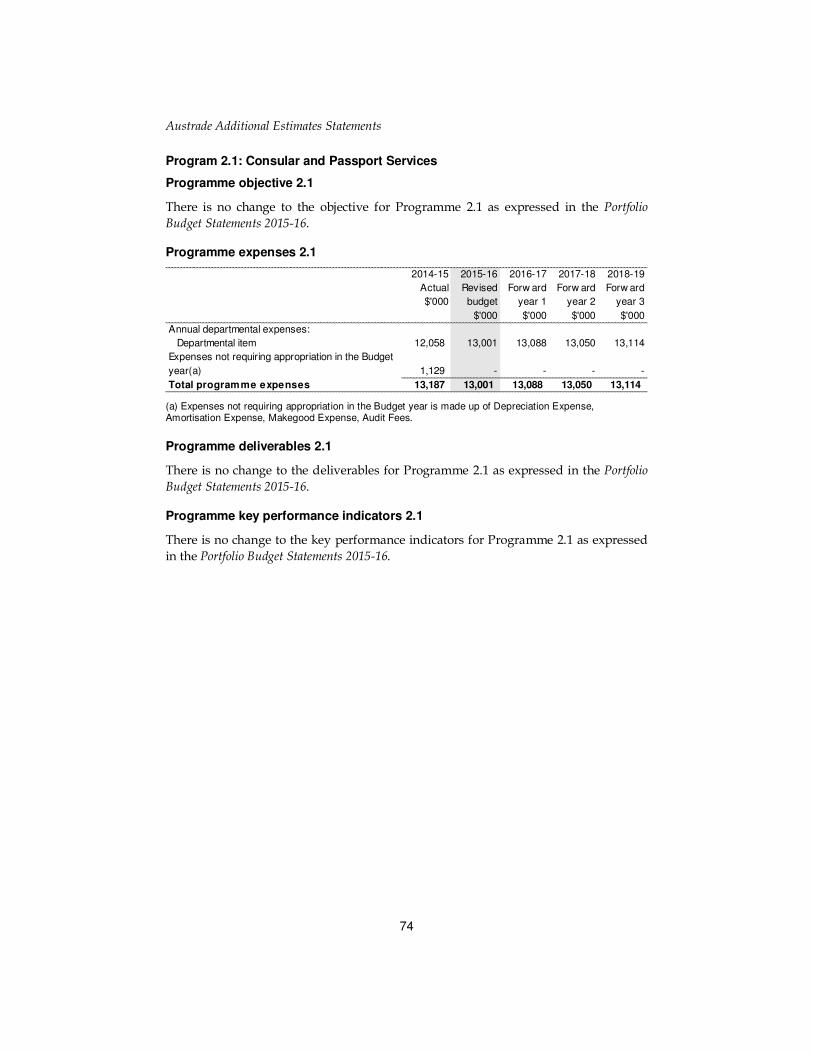
Austrade Additional Estimates Statements
74
Program 2.1: Consular and Passport Services
Programme objective 2.1
There is no change to the objective for Programme 2.1 as expressed in the Portfolio
Budget Statements 2015-16.
Programme expenses 2.1
(a) Expenses not requiring appropriation in the Budget year is made up of Depreciation Expense, Amortisation Expense, Makegood Expense, Audit Fees.
Programme deliverables 2.1
There is no change to the deliverables for Programme 2.1 as expressed in the Portfolio
Budget Statements 2015-16.
Programme key performance indicators 2.1
There is no change to the key performance indicators for Programme 2.1 as expressed
in the Portfolio Budget Statements 2015-16.
2014-15
Actual
$'000
2015-16
Revised
budget
$'000
2016-17
Forw ard
year 1
$'000
2017-18
Forw ard
year 2
$'000
2018-19
Forw ard
year 3
$'000
Annual departmental expenses:
Departmental item 12,058 13,001 13,088 13,050 13,114
Expenses not requiring appropriation in the Budget
year(a) 1,129 - - - -
Total programme expenses 13,187 13,001 13,088 13,050 13,114

Austrade Additional Estimates Statements
75
Section 3: Explanatory tables and budgeted financial statements
3.1 EXPLANATORY TABLES
Estimates of special account flows
Special Accounts provide a means to set aside and record amounts used for specified purposes. Table 3.1.1 shows the expected additions (receipts) and reductions
(payments) for each account used by Austrade. The corresponding table in the 2015-16
Portfolio Budget Statements is Table 3.1.2.
Table 3.1.1: Estimates of special account flows and balances
Outcome Opening
balance
$'000
Receipts
$'000
Payments
$'000
Adjustments
$'000
Closing
balance
$'000
Administered Payments
and Receipts for Other
Entities (A)
2015-16
1 100 9,200 (9,200) - 100
Administered Payments
and Receipts for Other
Entities (A)
2014-15
1 100 10,217 (10,217) - 100
Services for Other Entities
and Trust Monies (D)
2015-16
1 1,023 5 (1,018) - 10
Services for Other
Entities and Trust
Monies (D)
2014-15
1 947 696 (620) - 1,023
Total special accounts
2015-16 Budget
estimate
1,123 9,205 (10,218) - 110
Total special accounts
2014-15 actual1,047 10,913 (10,837) - 1,123
(A) = Administered
(D) = Departmental

Austrade Additional Estimates Statements
76
3.2 BUDGETED FINANCIAL STATEMENTS
3.2.1 Analysis of budgeted financial statements
An analysis of Austrade’s budgeted financial statements, as reflected in the
departmental financial statements and administered schedules, is provided below.
3.2.2 Budgeted financial statements
Departmental Financial Statements
The Departmental financial statements represent the assets, liabilities, revenues and
expenses which are controlled by Austrade. Departmental expenses include employee
and supplier expenses and other administrative costs which are incurred by Austrade
in undertaking its operations.
Budgeted departmental comprehensive income statement
This statement provides actual financial results for 2014-15 and the estimated revenue
and expenses for 2015-16 and forward years.
Total income in 2015-16 is estimated to be $240.2 million, an increase of $12.9 million
from the Budget. The increase is mainly due to a $6.0 million movement of funds for
Free Trade Agreement Promotion and a $5.1 million increase in estimated own-source
income. The 2015-16 total income excludes $3.1 million supplementation for foreign exchange movements as they relate to prior years’ activities. These amounts are
included in Table 1.1 Austrade Resource Statement.
Total estimated expenses for 2015-16 have increased by $13.6 million from Budget to
reflect the increase in income and estimated depreciation.
Budgeted departmental balance sheet
This statement discloses the estimated end of year financial position for Austrade.
Austrade’s budgeted net asset position at the end of 2015-16 of $62.7 million is
consistent with the 2014-15 actual of $62.9 million in Table 3.2.2.
Departmental capital budget statement
This statement shows all planned departmental capital expenditure on non-financial
assets, whether funded through capital appropriations, additional equity, borrowings,
or funds from internal sources.
Departmental statement of asset movements
This statement shows budgeted acquisitions and disposals of non-financial assets
during the budget year.

Austrade Additional Estimates Statements
77
Schedule of administered activity
Details of transactions administered by Austrade on behalf of the Government are
shown in the following schedules to the financial statements.
Schedule of budgeted income and expenses administered on behalf of
Government
This schedule discloses revenue and expenses administered on behalf of the
Government.
Administered expenses of $145.3 million for 2015-16 relate to the EMDG Scheme
($137.9 million), ABE Plan ($0.6 million), Free Trade Agreement Promotion ($1.4 million), Tasmania Regional Tourism Package ($4.4 million) and Tropical Health
($1.0 million). The EMDG Scheme is comprised of $131.0 million in grant expenditure
and $6.9 million in expenditure for the costs of administration on behalf of the
Government. ABE Plan, FTA Promotion, Tasmania Regional Tourism Package and Tropical Health are wholly comprised of grant expenditure.
Schedule of budgeted assets and liabilities administered on behalf of
Government
This schedule identifies the assets and liabilities administered on behalf of the
Government.
Total administered assets and liabilities for 2015-16 are estimated at $0.04 million and
$8.8 million respectively.
Schedule of budgeted administered cash flows
This schedule shows cash flows administered on behalf of the Government. All cash received is expected to be expended on the relevant programs.

Austrade Additional Estimates Statements
78
Table 3.2.1: Comprehensive income statement (showing net cost of services) for the period ended 30 June
Table continued on the following page.
2014-15
Actual
$'000
2015-16
Revised
budget
$'000
2016-17
Forw ard
estimate
$'000
2017-18
Forw ard
estimate
$'000
2018-19
Forw ard
estimate
$'000
EXPENSES
Employee benef its 129,294 135,002 139,820 140,108 140,633
Suppliers 74,642 105,182 85,575 85,243 87,493
Depreciation and amortisation 19,203 19,000 19,000 19,000 19,000
Losses from asset sales 49 - - - -
Other expenses 1,088 - - - -
Total expenses 224,276 259,184 244,395 244,351 247,126
LESS:
OWN-SOURCE INCOME
Own-source revenue
Sale of goods and rendering of services 22,913 22,868 22,010 22,000 22,000
Rental income 75 100 100 100 100
Other revenue 3,040 3,000 3,000 3,000 3,000
Total own-source revenue 26,028 25,968 25,110 25,100 25,100
Gains
Other 257 - - - -
Total gains 257 - - - -
Total own-source income 26,285 25,968 25,110 25,100 25,100
Net cost of (contribution by) services197,991 233,216 219,285 219,251 222,026
Revenue from Government 182,483 214,216 200,285 200,251 203,026
Surplus/(deficit) attributable to the
Australian Government (15,508) (19,000) (19,000) (19,000) (19,000)
OTHER COMPREHENSIVE INCOME
Changes in asset revaluation surplus
Total other comprehensive income - - - - -
Total comprehensive income/(loss) (15,508) (19,000) (19,000) (19,000) (19,000)

Austrade Additional Estimates Statements
79
Table 3.2.1: Comprehensive income statement (showing net cost of services) for the period ended 30 June (continued)
(a) From 2010-11, the Government introduced net cash appropriation arrangements where Appropriation Act No. 1 or Bill No. 3 revenue appropriations for the depreciation/amortisation expenses of non-corporate Commonwealth entities were replaced with a separate capital budget (the Departmental Capital Budget, or DCB) provided through Appropriation Act No. 1 or Bill No. 3 equity appropriations. For information regarding DCBs, please refer to Table 3.2.5 Departmental Capital Budget Statement. Prepared on Australian Accounting Standards basis.
Note: Impact of net cash appropriation arrangements
2014-15
$'000
2015-16
$'000
2016-17
$'000
2017-18
$'000
2018-19
$'000
Total comprehensive income/(loss)
excluding depreciation/amortisation
expenses previously funded through
revenue appropriations
3,695 - - - -
less depreciation/amortisation expenses
previously funded through revenue
appropriations(a) 19,203 19,000 19,000 19,000 19,000
Total comprehensive income/(loss) - as
per the Statement of Comprehensive
Income
(15,508) (19,000) (19,000) (19,000) (19,000)

Austrade Additional Estimates Statements
80
Table 3.2.2: Budgeted departmental balance sheet (as at 30 June)
*Equity is the residual interest in assets after the deduction of liabilities. Prepared on Australian Accounting Standards basis.
2014-15
Actual
$'000
2015-16
Revised
budget
$'000
2016-17
Forw ard
estimate
$'000
2017-18
Forw ard
estimate
$'000
2018-19
Forw ard
estimate
$'000
ASSETS
Financial assets
Cash and cash equivalents 5,881 5,500 5,500 5,500 5,500
Trade and other receivables 47,674 48,055 48,055 48,055 48,055
Total financial assets 53,555 53,555 53,555 53,555 53,555
Non-financial assets
Land and buildings 13,382 14,082 13,742 14,242 12,541
Property, plant and equipment 18,084 13,364 11,903 10,058 7,403
Intangibles 21,735 25,533 27,435 27,606 27,600
Other non-financial assets 7,769 7,769 7,769 7,769 7,769
Total non-financial assets 60,970 60,748 60,849 59,675 55,313
Assets held for sale
Total assets 114,525 114,303 114,404 113,230 108,868
LIABILITIES
Payables
Suppliers 10,996 10,996 10,996 10,996 10,996
Other payables 2,536 2,536 2,536 2,536 2,536
Total payables 13,532 13,532 13,532 13,532 13,532
Provisions
Employee provisions 36,684 36,684 36,684 36,684 36,684
Other provisions 1,395 1,395 1,395 1,395 1,395
Total provisions 38,079 38,079 38,079 38,079 38,079
Total liabilities 51,611 51,611 51,611 51,611 51,611
Net assets 62,914 62,692 62,793 61,619 57,257
EQUITY*
Parent entity interest
Contributed equity 87,302 87,695 103,296 117,622 132,260
Reserves 66,319 28,494 31,994 35,494 35,494
Retained surplus/(accumulated deficit) (90,707) (53,497) (72,497) (91,497) (110,497)
Total parent entity interest 62,914 62,692 62,793 61,619 57,257
Total Equity 62,914 62,692 62,793 61,619 57,257

Austrade Additional Estimates Statements
81
Table 3.2.3: Departmental statement of changes in equity — summary of movement (Budget Year 2015-16)
Prepared on Australian Accounting Standards basis.
Retained
earnings
$'000
Asset
revaluation
reserve
$'000
Other
reserves
$'000
Contributed
equity/
capital
$'000
Total equity
$'000
Opening balance as at 1 July 2015
Balance carried forw ard from previous
period (90,707) 27,594 38,725 87,302 62,914
Adjusted opening balance (90,707) 27,594 38,725 87,302 62,914
Comprehensive income
Other comprehensive income -
Surplus/(def icit) for the period (19,000) 900 - - (18,100)
Total comprehensive income (19,000) 900 - - (18,100)
of w hich:
Attributable to the Australian
Government (19,000) 900 - - (18,100)
Transactions w ith owners
Contributions by owners
Equity Injection - Appropriation 2,718 2,718
Departmental Capital Budget (DCB) 15,160 15,160
Sub-total transactions with owners - - - 17,878 17,878
Transfers betw een equity components 56,210 - (38,725) (17,485) -
Estimated closing balance as at 30
June 2016 (53,497) 28,494 - 87,695 62,692
Closing balance attributable to the
Australian Government (53,497) 28,494 - 87,695 62,692

Austrade Additional Estimates Statements
82
Table 3.2.4: Budgeted departmental statement of cash flows (for the period ended 30 June)
Prepared on Australian Accounting Standards basis.
2014-15
Actual
$'000
2015-16
Revised
budget
$'000
2016-17
Forw ard
estimate
$'000
2017-18
Forw ard
estimate
$'000
2018-19
Forw ard
estimate
$'000
OPERATING ACTIVITIES
Cash received
Appropriations 181,766 212,635 199,748 199,815 202,740
Sale of goods and rendering of services 23,037 22,968 22,110 22,100 22,100
Net GST received 3,731 3,731 3,731 3,731 3,731
Other 2,781 3,000 3,000 3,000 3,000
Total cash received 211,315 242,334 228,589 228,646 231,571
Cash used
Employees 129,599 135,002 139,820 140,108 140,633
Suppliers 78,998 107,713 88,769 88,538 90,938
Total cash used 208,597 242,715 228,589 228,646 231,571
Net cash from/(used by) operating activities 2,718 (381) - - -
INVESTING ACTIVITIES
Cash received
Proceeds from sales of property, plant and
equipment 180 - - - -
Total cash received 180 - - - -
Cash used
Purchase of property, plant, equipment and
intangibles 18,651 17,878 15,601 14,326 14,638
Total cash used 18,651 17,878 15,601 14,326 14,638
Net cash from/(used by) investing activities(18,471) (17,878) (15,601) (14,326) (14,638)
FINANCING ACTIVITIES
Cash received
Contributed equity 18,040 17,878 15,601 14,326 14,638
Total cash received 18,040 17,878 15,601 14,326 14,638
Cash used
Total cash used - - - - -
Net cash used by financing activities 18,040 17,878 15,601 14,326 14,638
Net increase/(decrease) in cash held 2,287 (381) - - -
Cash and cash equivalents at the beginning of
the reporting period 3,594 5,881 5,500 5,500 5,500
Cash and cash equivalents at the end of the
reporting period 5,881 5,500 5,500 5,500 5,500

Austrade Additional Estimates Statements
83
Table 3.2.5: Departmental capital budget statement (for the period ended 30 June)
(a) Includes both current and prior Act 3 and Bills 4/6 appropriations and special capital appropriations. (b) Does not include annual finance lease costs. Includes purchases from current and previous years’ Departmental Capital Budgets (DCBs). Prepared on Australian Accounting Standards basis.
2014-15
Actual
$'000
2015-16
Revised
budget
$'000
2016-17
Forw ard
estimate
$'000
2017-18
Forw ard
estimate
$'000
2018-19
Forw ard
estimate
$'000
NEW CAPITAL APPROPRIATIONS
Capital budget - Act No. 1 (DCB) 17,287 15,160 14,306 14,326 14,448
Equity injections - Act No. 2 2,718 1,295 - 190
Total new capital appropriations 17,287 17,878 15,601 14,326 14,638
Provided for:
Purchase of non-financial assets 17,287 17,878 15,601 14,326 14,638
Total Items 17,287 17,878 15,601 14,326 14,638
PURCHASE OF NON-FINANCIAL ASSETS
Funded by capital appropriations(a) 505 2,718 1,295 - 190
Funded by capital appropriation - DCB(b) 18,146 15,160 14,306 14,326 14,448
TOTAL AMOUNT SPENT 18,651 17,878 15,601 14,326 14,638
RECONCILIATION OF CASH USED TO ACQUIRE
ASSETS TO ASSET MOVEMENT TABLE
Total purchases 18,651 17,878 15,601 14,326 14,638
TOTAL CASH REQUIRED TO ACQUIRE ASSETS 18,651 17,878 15,601 14,326 14,638

Austrade Additional Estimates Statements
84
Table 3.2.6: Statement of asset movements (2015-16 Budget year)
(a) “Appropriation equity” refers to equity injections or Administered Assets and Liabilities appropriations
provided through Appropriation Act (No.2) 2015-16 and Bill (No.4) 2015-16, including CDABs. (b) “Appropriation ordinary annual services” refers to funding provided through Appropriation Act (No.1)
2015-16 and Bill (No.3) 2015-16 for depreciation/amortisation expenses, DCBs or other operational expenses.
Prepared on Australian Accounting Standards basis.
Buildings
$'000
Other
property,
plant and
equipment
$'000
Computer
softw are
and
intangibles
$'000
Total
$'000
As at 1 July 2015
Gross book value 13,382 30,209 66,231 109,822
Accumulated depreciation/amortisation and
impairment - (12,125) (44,496) (56,621)
Opening net book balance 13,382 18,084 21,735 53,201
Capital asset additions
Estimated expenditure on new or
replacement assets
By purchase - appropriation equity(a) 2,718 - - 2,718
By purchase - appropriation ordinary annual
services(b) 3,482 402 11,276 15,160
Total additions 6,200 402 11,276 17,878
Other movements
Depreciation/amortisation expense (5,500) (5,622) (7,878) (19,000)
Other - 500 400 900
Total other movements (5,500) (5,122) (7,478) (18,100)
As at 30 June 2016
Gross book value 19,582 31,111 77,907 128,600
Accumulated depreciation/amortisation and
impairment (5,500) (17,747) (52,374) (75,621)
Closing net book balance 14,082 13,364 25,533 52,979

Austrade Additional Estimates Statements
85
Table 3.2.7: Schedule of budgeted income and expenses administered on behalf of Government (for the period ended 30 June)
Prepared on Australian Accounting Standards basis.
2014-15
Actual
$'000
2015-16
Revised
budget
$'000
2016-17
Forw ard
estimate
$'000
2017-18
Forw ard
estimate
$'000
2018-19
Forw ard
estimate
$'000
EXPENSES ADMINISTERED ON BEHALF OF
GOVERNMENT
Employee benef its 5,234 5,000 5,000 5,000 5,000
Suppliers 1,547 1,895 1,895 1,895 1,895
Grants 139,220 138,382 133,819 133,263 133,051
Total expenses administered on behalf of
Government 146,001 145,277 140,714 140,158 139,946
LESS:
OWN-SOURCE INCOME
Own-source revenue
Non-taxation revenue
Other revenue 270 - - - -
Total non-taxation revenue 270 - - - -
Total own-source revenue administered
on behalf of Government 270 - - - -
Total own-source income administered on
behalf of Government 270 - - - -
Net cost of/(contribution by) services 145,731 145,277 140,714 140,158 139,946
Surplus/(Deficit) 145,731 145,277 140,714 140,158 139,946
OTHER COMPREHENSIVE INCOME
Total other comprehensive income - - - - -
Total comprehensive income (loss) 145,731 145,277 140,714 140,158 139,946

Austrade Additional Estimates Statements
86
Table 3.2.8: Schedule of budgeted assets and liabilities administered on behalf of Government (as at 30 June)
Prepared on Australian Accounting Standards basis.
2014-15
Actual
$'000
2015-16
Revised
budget
$'000
2016-17
Forw ard
estimate
$'000
2017-18
Forw ard
estimate
$'000
2018-19
Forw ard
estimate
$'000
ASSETS
Financial assets
Cash and cash equivalents - - - - -
Trade and other receivables 41 41 41 41 41
Total financial assets 41 41 41 41 41
Total assets administered on behalf of
Government 41 41 41 41 41
LIABILITIES
Payables
Suppliers 30 30 30 30 30
Grants 635 635 635 635 635
Other payables 22 22 22 22 22
Total payables 687 687 687 687 687
Provisions
Employee provisions 2,035 2,035 2,035 2,035 2,035
Other provisions 6,066 6,066 6,066 6,066 6,066
Total provisions 8,101 8,101 8,101 8,101 8,101
Total liabilities administered on behalf of
Government 8,788 8,788 8,788 8,788 8,788
Net assets/(liabilities) (8,747) (8,747) (8,747) (8,747) (8,747)

Austrade Additional Estimates Statements
87
Table 3.2.9: Schedule of budgeted administered cash flows (for the period ended 30 June)
Prepared on Australian Accounting Standards basis.
2014-15
Actual
$'000
2015-16
Revised
budget
$'000
2016-17
Forw ard
estimate
$'000
2017-18
Forw ard
estimate
$'000
2018-19
Forw ard
estimate
$'000
OPERATING ACTIVITIES
Cash received
Net GST received 165 195 195 195 195
Other 260 - - - -
Total cash received 425 195 195 195 195
Cash used
Grants 141,988 138,382 133,819 133,263 133,051
Suppliers 1,716 2,090 2,090 2,090 2,090
Employees 5,087 5,000 5,000 5,000 5,000
Total cash used 148,791 145,472 140,909 140,353 140,141
Net cash from/(used by) operating
activities (148,366) (145,277) (140,714) (140,158) (139,946)
Net increase/(decrease) in cash held (148,366) (145,277) (140,714) (140,158) (139,946)
Cash and cash equivalents at beginning of
reporting period - - - - -
Cash from Off icial Public Account for:
- Appropriations 148,758 145,277 140,714 140,158 139,946
Total cash from Official Public Account 148,758 145,277 140,714 140,158 139,946
Cash to Off icial Public Account for:
- Appropriations (392) - - - -
Total cash to Official Public Account (392) - - - -
Cash and cash equivalents at end of
reporting period - - - - -

Austrade Additional Estimates Statements
88
Notes to the financial statements
Austrade’s budgeted statements are prepared on an Australian Equivalents to
International Financial Standards (AEIFRS) basis.
Under the Government’s budgeting framework, transactions that agencies control
(departmental transactions) are separately budgeted for and reported on from
transactions that agencies do not have control over (administered transactions). This
ensures that agencies are only held fully accountable for the transactions over which they have control.
Departmental
Departmental assets, liabilities, revenues and expenses in relation to an agency or
authority are those which are controlled by the agency. Departmental expenses include employee and supplier expenses and other administrative costs which are incurred by
the agency in providing its goods and services.
Administered
Administered items are revenues, expenses, assets and liabilities which are managed
by an agency or authority on behalf of the Government according to set Government
directions. Administered expenses include subsidies, grants and personal benefit
payments and administered revenues include taxes, fees, fines and excises.
89
TOURISM AUSTRALIA
Section 1: Entity overview and resources ............................................................. 90
1.1 Strategic direction statement .............................................................................. 90
1.2 Entity resource statement ................................................................................... 90
1.3 Entity measures ................................................................................................. 92
1.4 Additional estimates and variations ..................................................................... 93
1.5 Breakdown of additional estimates by appropriation bill ...................................... 93
Section 2: Revisions to outcomes and planned performance .............................. 94
2.1 Outcomes and performance information ............................................................. 94
Section 3: Explanatory tables and budgeted financial statements ....................... 96
3.1 Explanatory tables .............................................................................................. 96
3.2 Budgeted financial statements ............................................................................ 97

90
TOURISM AUSTRALIA
Section 1: Entity overview and resources
1.1 STRATEGIC DIRECTION STATEMENT
There is no change to Tourism Australia’s Strategic Direction. For further details please refer to Portfolio Budget Statements 2015-16 Budget Related Paper No. 1.9 Foreign Affairs and Trade Portfolio.
1.2 ENTITY RESOURCE STATEMENT
The Entity Resource Statement details the resourcing for Tourism Australia at Additional Estimates. Table 1.1 outlines the total resourcing available from all sources
for the 2015-16 Budget year, including variations through Appropriation Bill Nos. 3 and
No. 4, special appropriations and special accounts.
An additional appropriation of $6.7 million representing a supplementation of foreign exchange loss relates to the prior year’s activities (2014-15).
Tourism Australia does not receive any special appropriations nor does it have any
special accounts.

Tourism Australia Additional Estimates Statements
91
Table 1.1: CAC Act Body Tourism Australia Resource Statement — Additional Estimates for 2015-16 as at Additional Estimates February 2016
(a) Appropriation Act (No. 1 and No. 3) 2015-2016. (b) Estimated adjusted balance carried from previous year for annual appropriations. Reader note: All figures are GST exclusive.
Total Estimate as Proposed Total
available at Budget + Additional = estimate
appropriation Estimate at Additional
Estimates
2014-15 2015-16 2015-16 2015-16
$'000 $'000 $'000 $'000
Ordinary annual services(a)
Departmental appropriation
Departmental appropriation(b) 138,865 137,290 6,728 144,018
Total 138,865 137,290 6,728 144,018
Total available annual
appropriations 138,865 137,290 6,728 144,018
Total Estimate as Proposed Total
available at Budget + Additional = estimate
appropriation Estimate at Additional
Estimates
2014-15 2015-16 2015-16 2015-16
$'000 $'000 $'000 $'000
Total net resourcing for entity 138,865 137,290 6,728 144,018

Tourism Australia Additional Estimates Statements
92
1.3 ENTITY MEASURES TABLE
Tourism Australia has no new measures, and no new decisions taken but not yet
announced, since the 2015-16 Budget.
1.4 ADDITIONAL ESTIMATES AND VARIATIONS
The following table details the changes to the resourcing for Tourism Australia at
Additional Estimates, by outcome. Table 1.4 details Additional Estimates or variations
through factors such as parameter adjustments.
Table 1.4: Additional estimates and variations to outcomes from other variations
Programme 2015-16 2016-17 2017-18 2018-19
impacted $'000 $'000 $'000 $'000
Outcome 1
Increase in estimates (departmental) 6,728 4,312 4,225 4,697
FOREX Rebasing
Decrease in estimates (departmental) (536) (678) (686)
Parameter Adjustment
Net impact on estimates
for Outcome 1 (departmental) 6,728 3,776 3,547 4,011

Tourism Australia Additional Estimates Statements
93
1.5 BREAKDOWN OF ADDITIONAL ESTIMATES BY APPROPRIATION
BILL
The following tables detail the Additional Estimates sought for Tourism Australia
through Appropriation Bills Nos. 3 and 4.
Table 1.5: Appropriation Bill (No. 3) 2015-16
Note 1: 2015-16 available appropriation is included to allow a comparison of this year's appropriation with what was made available for use in the previous year. Available appropriation is the amount available to be drawn down, and is equal to: Budget Appropriation + Additional Estimates Appropriation + AFM – Savings - Other Reductions (includes all quarantines + movement of funds) +/- Machinery of Government transfers - formal reductions determined by the Finance Minister.
Table 1.6: Appropriation Bill (No. 4) 2015-16
There is no change to Tourism Australia information supplied in the Portfolio Budget
Statements 2015-16.
2014-15 2015-16 2015-16 Additional Reduced
Available Budget Revised Estimates Estimates
$'000 $'000 $'000 $'000 $'000
DEPARTMENTAL PROGRAMMES
Outcome 1
Grow demand and foster a
competitive and sustainable
Australian tourism industry
through partnership marketing to
targeted global consumers in
key markets
138,865 137,290 144,018 6,728
Total 138,865 137,290 144,018 6,728 -
Total administered and
departmental 138,865 137,290 144,018 6,728 -

Tourism Australia Additional Estimates Statements
94
Section 2: Revisions to outcomes and planned performance
2.1 OUTCOMES AND PERFORMANCE INFORMATION
There is no change to Tourism Australia’s outcomes and performance information as expressed in the Portfolio Budget Statements 2015-16.
OUTCOME 1: GROW DEMAND AND FOSTER A COMPETITIVE AND
SUSTAINABLE AUSTRALIAN TOURISM INDUSTRY THROUGH
PARTNERSHIP MARKETING TO TARGETED GLOBAL CONSUMERS IN KEY
MARKETS
Outcome 1 strategy
There is no change to Tourism Australia’s Outcome Strategy as expressed in the
Portfolio Budget Statements 2015-16. For further details please refer to Portfolio Budget
Statements 2015-16 Budget Related Paper No. 1.9 Foreign Affairs and Trade Portfolio.
Table 2.1 Budgeted expenses for Outcome 1
Outcome 1: Grow demand and foster a competitive and sustainable 2014-15 2015-16
Australian tourism industry through partnership Actual Revised
marketing to targeted global consumers in key markets expenses estimated
expenses
$'000 $'000
Programme 1.1: (Supporting Outcome 1)
Revenue from Government
Ordinary annual services (Appropriation Act No. 1 and Bill No. 3 ) 138,865 144,018
Payment from related entities(Portfolio Agency) 13,500 14,000
Revenues from other independent sources 24,150 17,874
Total for Programme 1.1 176,515 175,892
Outcome 1 Totals by resource type
Revenue from Government
Ordinary annual services (Appropriation Act No. 1 and Bill No. 3 ) 138,865 144,018
Payment from related entities 13,500 14,000
Revenues from other independent sources 24,150 17,874
Total expenses for Outcome 1 176,515 175,892
2014-15 2015-16
Average Staffing Level (number) 204 207

Tourism Australia Additional Estimates Statements
95
Programme objective 1.1
Programme objective, deliverables and key performance indicators remain consistent
with those published in the Portfolio Budget Statements 2015-16.
Programme expenses 1.1
Table 2.2 provides a breakdown of programme 1 expenses by component.
Table 2.2 Programme 1 Expenses by Component
2014-15 2015-16 2016-17 2017-18 2018-19
Actual Revised Forward Forward Forward
budget year 1 year 2 year 3
$'000 $'000 $'000 $'000 $'000
Annual departmental expenses:
1.1.1 - Component 1 - Grow Demand
Programme Support 149,470 148,932 145,984 147,215 148,982
Total component expenses 149,470 148,932 145,984 147,215 148,982
1.1.2 - Component 2 - Industry Development
Programme Support 27,045 26,960 26,426 26,644 26,962
Total component expenses 27,045 26,960 26,426 26,644 26,962
Total programme expenses 176,515 175,892 172,410 173,859 175,944

Tourism Australia Additional Estimates Statements
96
Section 3: Explanatory Tables and Budgeted Financial Statements
3.1 EXPLANATORY TABLES
Estimates of special account flows
A Special Account Statement is not applicable as Tourism Australia has no special
accounts.

Tourism Australia Additional Estimates Statements
97
3.2 BUDGETED FINANCIAL STATEMENTS
3.2.1 Analysis of budgeted financial statements
The financial framework upon which the financial statements are based has not
changed since the 2015-16 Budget.
Departmental financial statements
• An additional appropriation of $6.7 million, representing supplementation of a foreign exchange loss, relates to the prior year’s activities (2014-15).
• Total additional appropriation of $13.2 million represents supplementation of foreign exchange movement in the following forward Budget years: 2016-17 ($4.3m), 2017-18 ($4.2m) and 2018-19 ($4.7m) periods.

Tourism Australia Additional Estimates Statements
98
3.2.2 Budgeted financial statements
Table 3.2.1: Comprehensive income statement (showing net cost of services) for the period ended 30 June
Table continued on the following page. Prepared on Australian Accounting Standards basis.
Actual Revised Forw ard Forw ard Forw ard
budget estimate estimate estimate
2014-15 2015-16 2016-17 2017-18 2018-19
$'000 $'000 $'000 $'000 $'000
EXPENSES
Employee benefits 29,924 30,473 30,469 30,996 30,996
Suppliers 141,588 136,686 133,208 134,130 136,215
Depreciation and amortisation 4,460 4,500 4,500 4,500 4,500
Finance costs 10 33 33 33 33
Write-dow n and impairment of assets 11
Losses from asset sales
Other expenses 4,200 4,200 4,200 4,200
Total expenses 175,993 175,892 172,410 173,859 175,944
LESS:
OWN-SOURCE INCOME
Ow n-source revenue
Interest 1,299 1,300 1,300 1,300 1,300
Other revenue 36,351 30,574 30,574 30,574 30,574
Total own-source revenue 37,650 31,874 31,874 31,874 31,874
Gains
Sale of assets 10
Other gains 2,621
Total gains 2,631 - - - -
Total own-source income 40,281 31,874 31,874 31,874 31,874
Net cost of (contribution by)
services 135,712 144,018 140,536 141,985 144,070
Revenue from Government 138,865 144,018 140,536 141,985 144,070
Surplus (Deficit) before income tax
on continuing operations 3,153 - - - -
Surplus (Deficit) after income tax
on continuing operations 3,153 - - - -
Surplus (Deficit) after income tax 3,153 - - - -
OTHER COMPREHENSIVE INCOME
Items not subject to subsequent
reclassification to profit or loss
Changes in asset revaluation surplus
Total other comprehensive income
after income tax - - - - -
Total comprehensive income (loss) 3,153 - - - -
Note: Impact of Net Cash Appropriation Arrangements

Tourism Australia Additional Estimates Statements
99
Table 3.2.1: Comprehensive income statement (showing net cost of services) for the period ended 30 June (continued)
(a) From 2009-10, the Government replaced Appropriation Act No. 1 and Bill No. 3 revenue appropriations for the heritage and cultural depreciation expenses of Designated Collection Institutions, with a separate capital budget (the Collection Development Acquisition Budget, or CDAB) provided through Appropriation Act No. 2 and Bill No. 4 equity appropriations. For information regarding CDABs, please refer to Table 3.2.5 Departmental Capital Budget Statement. Prepared on Australian Accounting Standards basis.
Actual Revised Forw ard Forw ard Forw ard
budget estimate estimate estimate
2014-15 2015-16 2016-17 2017-18 2018-19
$'000 $'000 $'000 $'000 $'000
Total Comprehensive Income
(loss) excluding heritage and cultural
depreciation expenses previously
funded through revenue appropriations 3,153 - - - -
Total Comprehensive Income
(loss) - as per the Statement of
Comprehensive Income 3,153 - - - -

Tourism Australia Additional Estimates Statements
100
Table 3.2.2: Budgeted departmental balance sheet (as at 30 June)
Table continued on the following page. Prepared on Australian Accounting Standards basis.
Actual Revised Forw ard Forw ard Forw ard
budget estimate estimate estimate
2014-15 2015-16 2016-17 2017-18 2018-19
$'000 $'000 $'000 $'000 $'000
ASSETS
Financial assets
Cash and cash equivalents 13,929 13,929 13,896 13,896 13,896
Trade and other receivables 5,954 5,954 5,954 5,954 5,954
Total financial assets 19,883 19,883 19,850 19,850 19,850
Non-financial assets
Land and buildings 3,675 3,675 3,675 3,675 3,675
Property, plant and equipment 1,040 740 740 740 740
Intangibles 8,176 8,476 8,476 8,476 8,476
Other non-f inancial assets 4,794 4,794 4,794 4,794 4,794
Total non-financial assets 17,685 17,685 17,685 17,685 17,685
Assets held for sale
Total assets 37,568 37,568 37,535 37,535 37,535
LIABILITIES
Payables
Suppliers 6,544 6,544 6,511 6,511 6,511
Other payables 5,481 5,481 5,481 5,481 5,481
Total payables 12,025 12,025 11,992 11,992 11,992
Provisions
Employee provisions 5,275 5,275 5,275 5,275 5,275
Other provisions 766 766 766 766 766
Total provisions 6,041 6,041 6,041 6,041 6,041
Liabilities included in disposal
groups held for sale
Total liabilities 18,066 18,066 18,033 18,033 18,033
Net assets 19,502 19,502 19,502 19,502 19,502
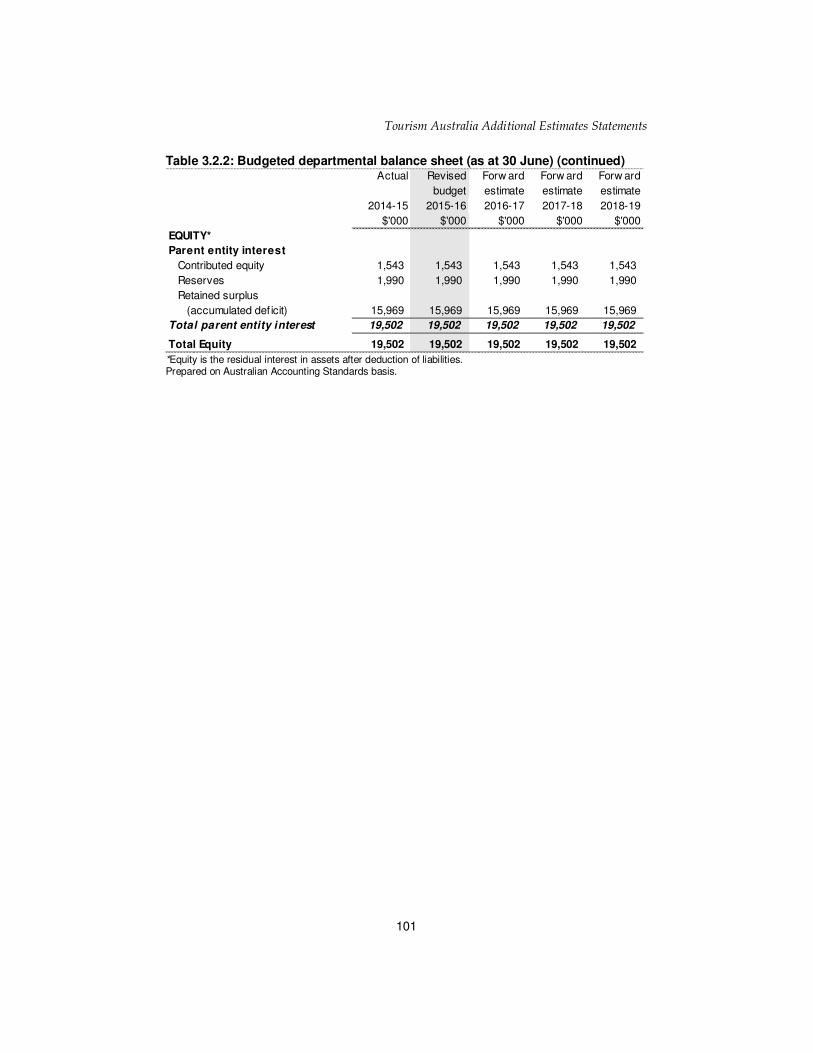
Tourism Australia Additional Estimates Statements
101
Table 3.2.2: Budgeted departmental balance sheet (as at 30 June) (continued)
*Equity is the residual interest in assets after deduction of liabilities. Prepared on Australian Accounting Standards basis.
Actual Revised Forw ard Forw ard Forw ard
budget estimate estimate estimate
2014-15 2015-16 2016-17 2017-18 2018-19
$'000 $'000 $'000 $'000 $'000
EQUITY*
Parent entity interest
Contributed equity 1,543 1,543 1,543 1,543 1,543
Reserves 1,990 1,990 1,990 1,990 1,990
Retained surplus
(accumulated def icit) 15,969 15,969 15,969 15,969 15,969
Total parent entity interest 19,502 19,502 19,502 19,502 19,502
Total Equity 19,502 19,502 19,502 19,502 19,502

Tourism Australia Additional Estimates Statements
102
Table 3.2.3: Departmental statement of changes in equity — summary of movement (Budget Year 2015-16)
* This disclosure is not required if an entity does not have non-controlling interests. Prepared on Australian Accounting Standards basis.
Retained Asset Other Contributed Total
earnings revaluation reserves equity/ equity
reserve capital
$'000 $'000 $'000 $'000 $'000
Opening balance as at 1 July 2015
Balance carried forw ard from
previous period 15,969 1,990 - 1,543 19,502
Adjustment for changes in -
accounting policies -
Adjusted opening balance 15,969 1,990 - 1,543 19,502
Comprehensive income
Other comprehensive income -
Surplus (def icit) for the period -
Total comprehensive income - - - - -
of w hich:
Attributable to the Australian Government -
Attributable to non-controlling interest* -
Estimated closing balance
as at 30 June 2016 15,969 1,990 - 1,543 19,502
Less: non-controlling interests * -
Closing balance 15,969 1,990 - 1,543 19,502

Tourism Australia Additional Estimates Statements
103
Table 3.2.4: Budgeted departmental statement of cash flows (for the period ended 30 June)
Table continued on the following page. Prepared on Australian Accounting Standards basis.
Actual Revised Forw ard Forw ard Forw ard
budget estimate estimate estimate
2014-15 2015-16 2016-17 2017-18 2018-19
$'000 $'000 $'000 $'000 $'000
OPERATING ACTIVITIES
Cash received
Appropriations 138,865 144,018 140,536 141,985 144,451
Interest 1,286 1,300 1,300 1,300 1,300
Other 41,270 30,574 30,574 30,574 17,558
Total cash received 181,421 175,892 172,410 173,859 163,309
Cash used
Employees 29,502 29,173 30,469 30,996 30,996
Suppliers 145,074 137,986 133,241 134,163 123,613
Other - 4,233 4,200 4,200 4,200
Total cash used 174,576 171,392 167,910 169,359 158,809
Net cash from (used by)
operating activities 6,845 4,500 4,500 4,500 4,500
INVESTING ACTIVITIES
Cash received
Other - -
Total cash received - - - - -
Cash used
Purchase of property, plant,
equipment and intangibles 5,541 4,500 4,500 4,500 4,500
Total cash used 5,541 4,500 4,500 4,500 4,500
Net cash from (used by)
investing activities (5,541) (4,500) (4,500) (4,500) (4,500)
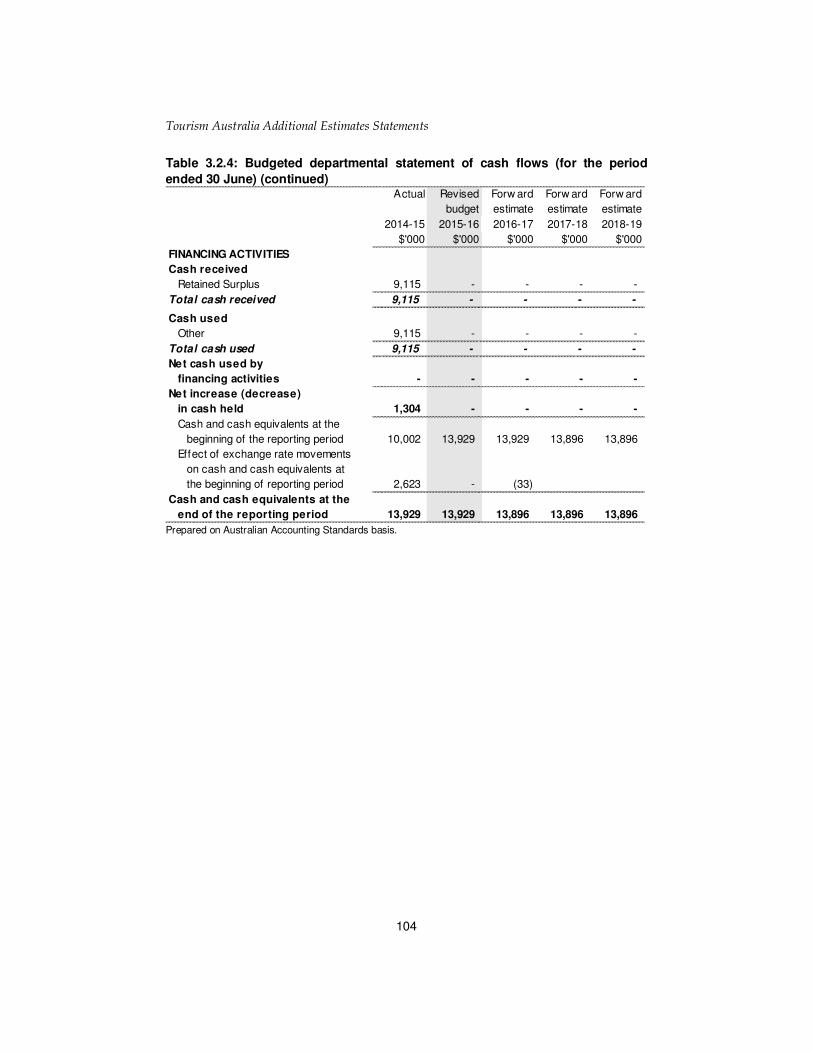
Tourism Australia Additional Estimates Statements
104
Table 3.2.4: Budgeted departmental statement of cash flows (for the period
ended 30 June) (continued)
Prepared on Australian Accounting Standards basis.
Actual Revised Forw ard Forw ard Forw ard
budget estimate estimate estimate
2014-15 2015-16 2016-17 2017-18 2018-19
$'000 $'000 $'000 $'000 $'000
FINANCING ACTIVITIES
Cash received
Retained Surplus 9,115 - - - -
Total cash received 9,115 - - - -
Cash used
Other 9,115 - - - -
Total cash used 9,115 - - - -
Net cash used by
financing activities - - - - -
Net increase (decrease)
in cash held 1,304 - - - -
Cash and cash equivalents at the
beginning of the reporting period 10,002 13,929 13,929 13,896 13,896
Effect of exchange rate movements
on cash and cash equivalents at
the beginning of reporting period 2,623 - (33)
Cash and cash equivalents at the
end of the reporting period 13,929 13,929 13,896 13,896 13,896

Tourism Australia Additional Estimates Statements
105
Table 3.2.5: Departmental capital budget statement (for the period ended 30 June)
(a) Includes Appropriation Bills (No. 2 and No. 4) and prior Appropriation Bills (No. 2 and No. 4) and special
capital appropriations. (b) Includes the following sources of funding:
- current and prior Appropriation Bills (No. 3 and No. 5) (excluding amounts from the Departmental Capital Budget)
- donations and contributions - gifts - internally developed assets - s74 Retained Revenue Receipts - proceeds from the sale of assets.
Prepared on Australian Accounting Standards basis.
Actual Revised Forw ard Forw ard Forw ard
budget estimate estimate estimate
2014-15 2015-16 2016-17 2017-18 2018-19
$'000 $'000 $'000 $'000 $'000
NEW CAPITAL APPROPRIATIONS
Equity injections - Act No. 2 - - -
Total new capital appropriations - - - - -
Provided for:
Other Items -
Total Items - - - - -
PURCHASE OF NON-FINANCIAL
ASSETS
Funded by capital appropriations(a) -
Funded internally f rom
departmental resources(b) 4,500 4,500 4,500 4,500 4,500
TOTAL AMOUNT SPENT 4,500 4,500 4,500 4,500 4,500
RECONCILIATION OF CASH
USED TO ACQUIRE ASSETS
TO ASSET MOVEMENT TABLE
Total purchases 4,500 4,500 4,500 4,500 4,500
Total cash used to
acquire assets 4,500 4,500 4,500 4,500 4,500
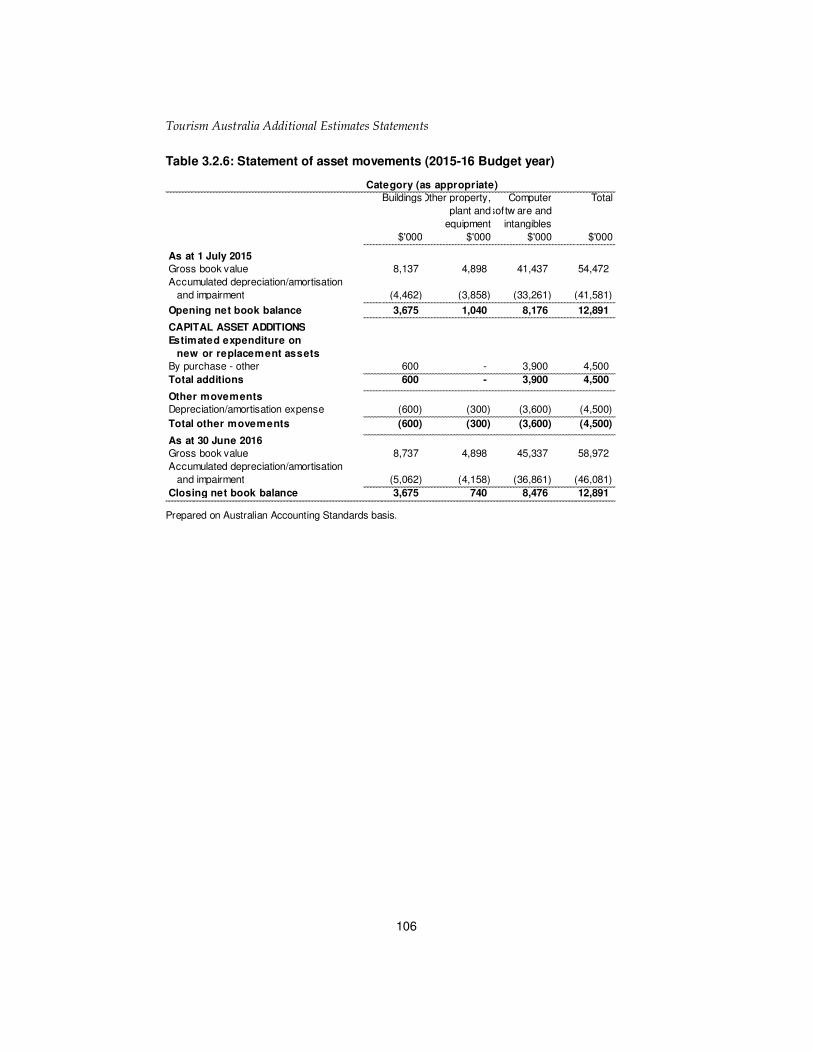
Tourism Australia Additional Estimates Statements
106
Table 3.2.6: Statement of asset movements (2015-16 Budget year)
Prepared on Australian Accounting Standards basis.
Category (as appropriate)
BuildingsOther property, Computer Total
plant andsoftw are and
equipment intangibles
$'000 $'000 $'000 $'000
As at 1 July 2015
Gross book value 8,137 4,898 41,437 54,472
Accumulated depreciation/amortisation
and impairment (4,462) (3,858) (33,261) (41,581)
Opening net book balance 3,675 1,040 8,176 12,891-
CAPITAL ASSET ADDITIONS
Estimated expenditure on
new or replacement assets
By purchase - other 600 - 3,900 4,500
Total additions 600 - 3,900 4,500
Other movements
Depreciation/amortisation expense (600) (300) (3,600) (4,500)
Total other movements (600) (300) (3,600) (4,500)
As at 30 June 2016
Gross book value 8,737 4,898 45,337 58,972
Accumulated depreciation/amortisation
and impairment (5,062) (4,158) (36,861) (46,081)
Closing net book balance 3,675 740 8,476 12,891

Tourism Australia Additional Estimates Statements
107
Notes to the financial statements
The financial statements have been prepared in accordance with:
- Finance Minister’s Orders;
- Australian Accounting Standards and Accounting Interpretations issued by the Australian Accounting Board; and
- Consensus Views of the Urgent Issues Group.
Assets and liabilities are recognised in the Balance Sheet when and only when it is
probable that future economic benefits will flow and the amounts of the assets or liabilities can be reliably measured.
Revenues and expenses are recognised in the Income Statement when and only when
the flow or consumption or loss of economic benefits has occurred and can be reliably
measured.
The Analysis of Budgeted Financial Statements provides an overview of the key
elements of Tourism Australia’s financial statements, including variations in major
aggregates from actual of 2014-15 to budget estimate of 2015-16.


Glossary
109
PORTFOLIO GLOSSARY
Term Meaning
Accrual accounting System of accounting where items are brought to account and
included in the financial statements as they are earned or
incurred, rather than as they are received or paid.
Accumulated
depreciation
The aggregate depreciation recorded for a particular
depreciating asset.
Additional Estimates
Where amounts appropriated at Budget time are insufficient, Parliament may appropriate more funds to portfolios through
the Additional Estimates Acts.
Administered Revenues, expenses, assets or liabilities managed by agencies
on behalf of the Commonwealth. Agencies do not control administered items. Administered expenses include grants,
subsidies and benefits. In many cases, administered expenses
fund the delivery of third party outputs.
Annual
appropriation
Two appropriation Bills are introduced into Parliament in
May and comprise the Budget for the financial year beginning
1 July. Further Bills are introduced later in the financial year
as part of the additional estimates. Parliamentary departments have their own appropriations.
Appropriation An authorisation by Parliament to spend monies from the
Consolidated Revenue Fund for a particular purpose.
Capital
expenditure
Expenditure by an agency on capital projects, for example
purchasing a building.
Consolidated
Revenue Fund
Section 81 of the Constitution stipulates that all revenue raised
or money received by the Commonwealth forms the one consolidated revenue fund (CRF).
Departmental Revenue, expenses, assets and liabilities that are controlled by
the agency in providing its outputs. Departmental items would generally include computers, plant and equipment
assets used by agencies in providing goods and services and
most employee expenses, supplier costs and other
administrative expenses incurred.

Glossary
110
Depreciation Apportionment of an asset’s capital value as an expense over
its estimated useful life to take account of normal usage,
obsolescence, or the passage of time.
Effectiveness
indicators
Measure the joint or independent contribution of programmes
to the achievement of their specified outcome.
Efficiency
indicators
Measure the adequacy of an agency’s management of its
programmes. Includes price, quality and quantity indicators. The interrelationship between the three efficiency indicators of
any one programme should be considered when judging
efficiency.
Equity or net assets Residual interest in the assets of an entity after deduction of its liabilities.
Expense Total value of all of the resources consumed in producing
goods and services or the loss of future economic benefits in
the form of reductions in assets or increases in liabilities of an
entity.
Fair value Valuation methodology: the amount for which an asset could
be exchanged, or a liability settled, between knowledgeable and willing parties in an arm’s length transaction. The fair
value can be affected by the conditions of the sale, market
conditions and the intentions of the asset holder.
Operating result Equals revenue less expense.
Outcomes The Government’s objectives in each portfolio area. Outcomes
are desired results, impacts or consequences for the Australian
community as influenced by the actions of the Australian
Government. Actual outcomes are assessments of the end
results or impacts actually achieved.
Price One of the three key efficiency indicators. The amount the Government or the community pays for the delivery of
programmes.
Programme Activity that delivers benefits, services or transfer payments to
individuals, industry and/or the community as a whole, with the aim of achieving the intended result specified in an
outcome statement.
Quality One of the three key efficiency indicators. Relates to the
characteristics by which customers or stakeholders judge an

Glossary
111
organisation, product or service. Assessment of quality
involves use of information gathered from interested parties
to identify differences between the user’s expectations and
experiences.
Quantity One of the three key efficiency indicators. Examples include:
the size of a programme; count or volume measures; how
many or how much.
Revenue Total value of resources earned or received to cover the
production of goods and services.
Special Account Special Accounts allow money in the Consolidated Revenue
Fund to be acknowledged as set-aside (hypothecated) for a particular purpose. Amounts credited to a Special Account
may only be spent for the purposes of the Special Account.
Special Accounts can only be established by a written
determination of the Finance Minister (section 78 of the Public
Governance, Performance and Accountability (PGPA) Act 2013) or
through an Act of Parliament (section 80 of the PGPA Act
2013).
Special
Appropriations
(including Standing
Appropriations)
An amount of money appropriated by a particular Act of
Parliament for a specific purpose and number of years. For
Special Appropriations the authority to withdraw funds from
the Consolidated Revenue Fund does not generally cease at the end of the financial year. Standing Appropriations are a
sub-category consisting of ongoing Special Appropriations -
the amount appropriated will depend on circumstances
specified in the legislation.
Top Related