


Languages
Pages
Legal


2014 Illinois Farm Economics SummitThe Profitability of Illinois Agriculture: Back to the Future?
2014 Farm Bill—Farm 2014 Farm Bill—Farm Program DecisionsProgram Decisions
Gary Schnitkey, Jonathan Coppess & Nick Paulson
University of Illinois

2014 Illinois Farm Economics Summit
Development & Outreach Coalition
• University of Illinois• Watts & Associates• The Ohio State University• Michigan State University• Delaware State University• University of Arkansas-Pine Bluff• North Carolina A&T University• Montana State University
2014 Illinois Farm Economics Summit
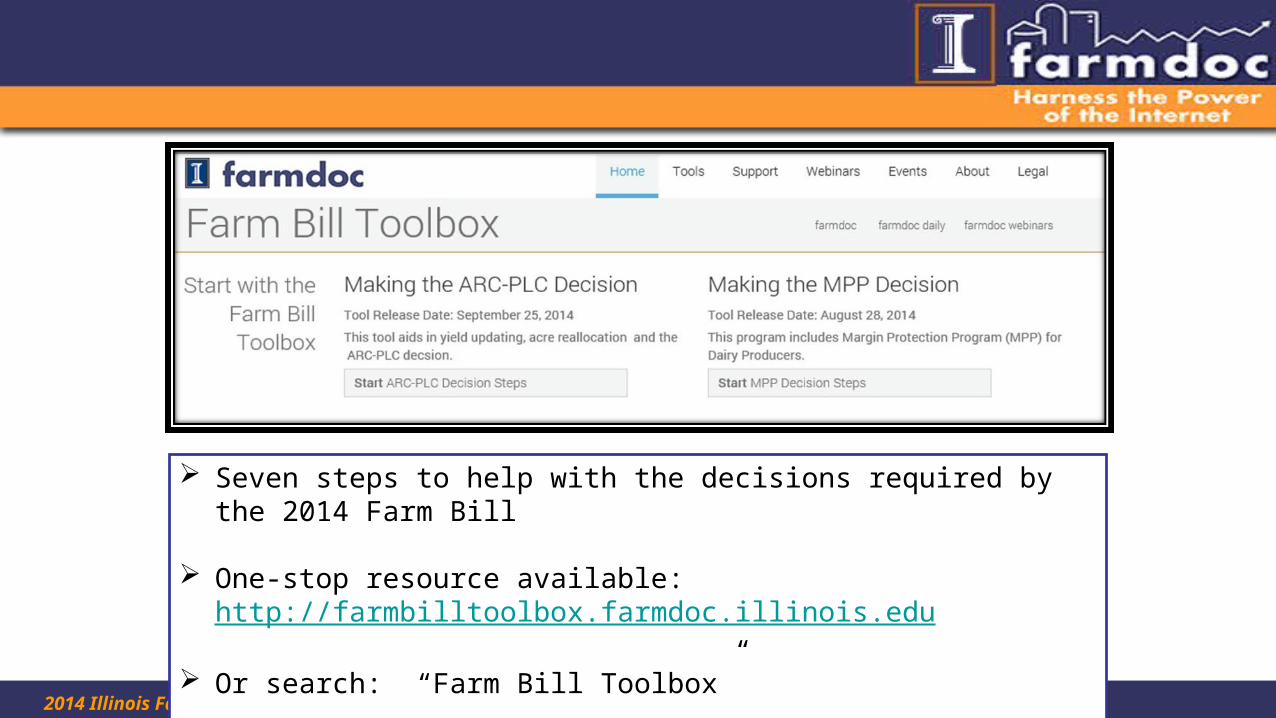
Seven steps to help with the decisions required by the 2014 Farm Bill
One-stop resource available: http://farmbilltoolbox.farmdoc.illinois.edu
Or search: “Farm Bill Toolbox”

0
1. Retain or update payment yields (Feb. 27, 2015)
2. Retain or reallocate base acres (Feb. 27, 2015)
3. Programs: ARC-CO; PLC; ARC-IC (Mar. 31, 2015)
Each decision made by FSA farm; one-time and irrevocable

1
Collect Information.—FSA Letter from August: existing payment yields and base acres for each FSA farm
FSA letter also provides record of acres planted on the FSA farm for 2008 to 2013 crop years
Also need crop yield history for 2008 to 2012; crop insurance records will be accepted
2
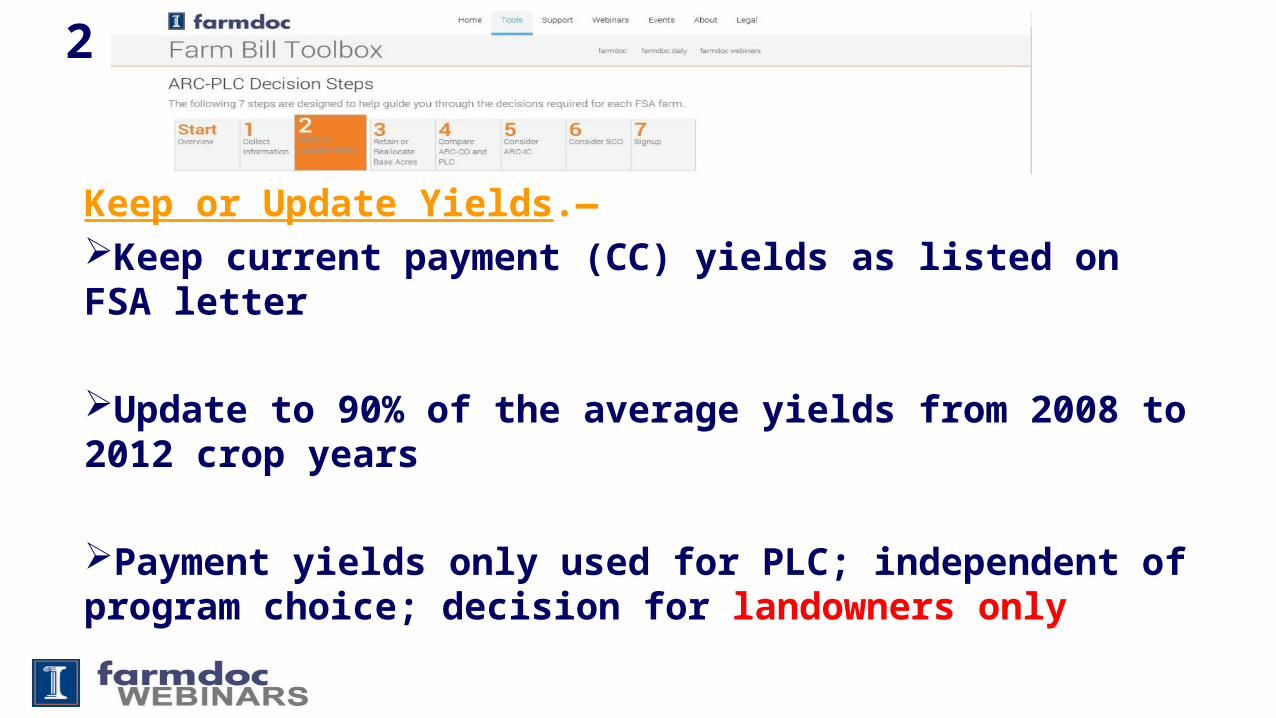
Keep or Update Yields.—Keep current payment (CC) yields as listed on FSA letter
Update to 90% of the average yields from 2008 to 2012 crop years
Payment yields only used for PLC; independent of program choice; decision for landowners only

3
Retain or Reallocate Base Acres.—Keep current base acre distribution as listed on FSA letter
Reallocate base to ratio of planted acres for program crops in 2009 to 2012 crop years; FSA letter determines
All programs pay on base acres; decision covers all program crops; decision for landowners only

4
Compare ARC-CO and PLC.—Decision for all producers on the farm (not landowners in a cash lease); a crop-by-crop decision; 85% of base
ARC-CO: revenue-based assistance using county average yields and national average prices
PLC: fixed-price, deficiency payment program when national average price is below statutory reference price

4
OPERATIONAL COMPARISONARC-CO PLC
5-year Olympic moving average marketing year average (MYA) price (reference price plug)
Reference price fixed in statute; does not change
5-year Olympic moving average of county yields (70% of T-yield plug)
Payment yield used to calculate payments; does not change (after update)—no yield coverage provided
Coverage is from 86% down to 76% of county revenue (i.e. a 10% maximum)
Coverage is for prices below the reference price and down to the loan rate

4
4
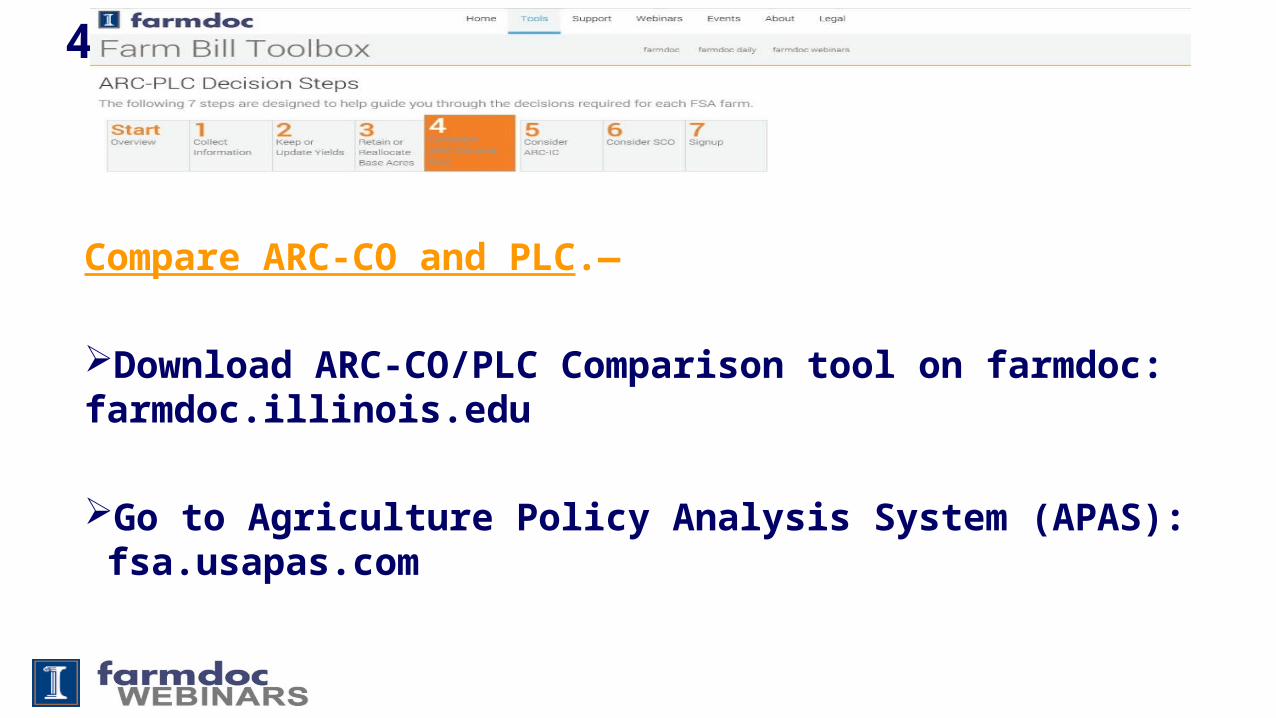
Compare ARC-CO and PLC.—
Download ARC-CO/PLC Comparison tool on farmdoc: farmdoc.illinois.edu
Go to Agriculture Policy Analysis System (APAS): fsa.usapas.com

4
4
4
4
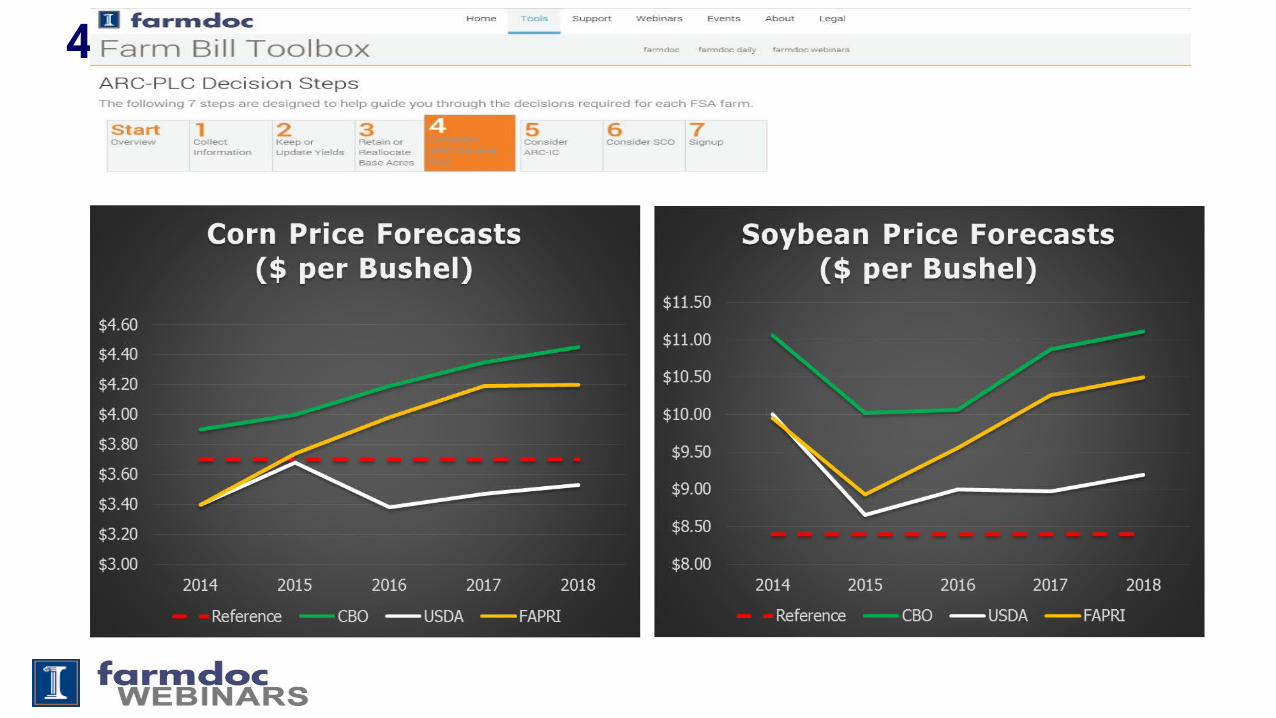
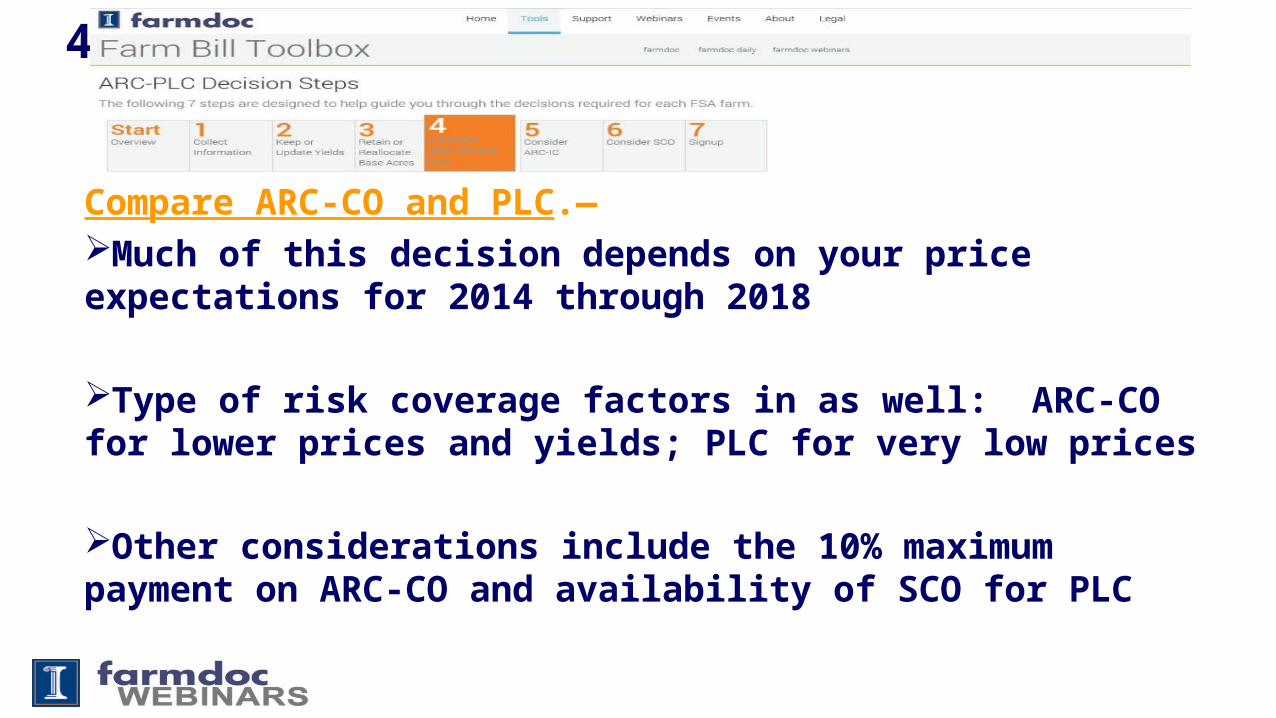
Compare ARC-CO and PLC.—Much of this decision depends on your price expectations for 2014 through 2018
Type of risk coverage factors in as well: ARC-CO for lower prices and yields; PLC for very low prices
Other considerations include the 10% maximum payment on ARC-CO and availability of SCO for PLC

4
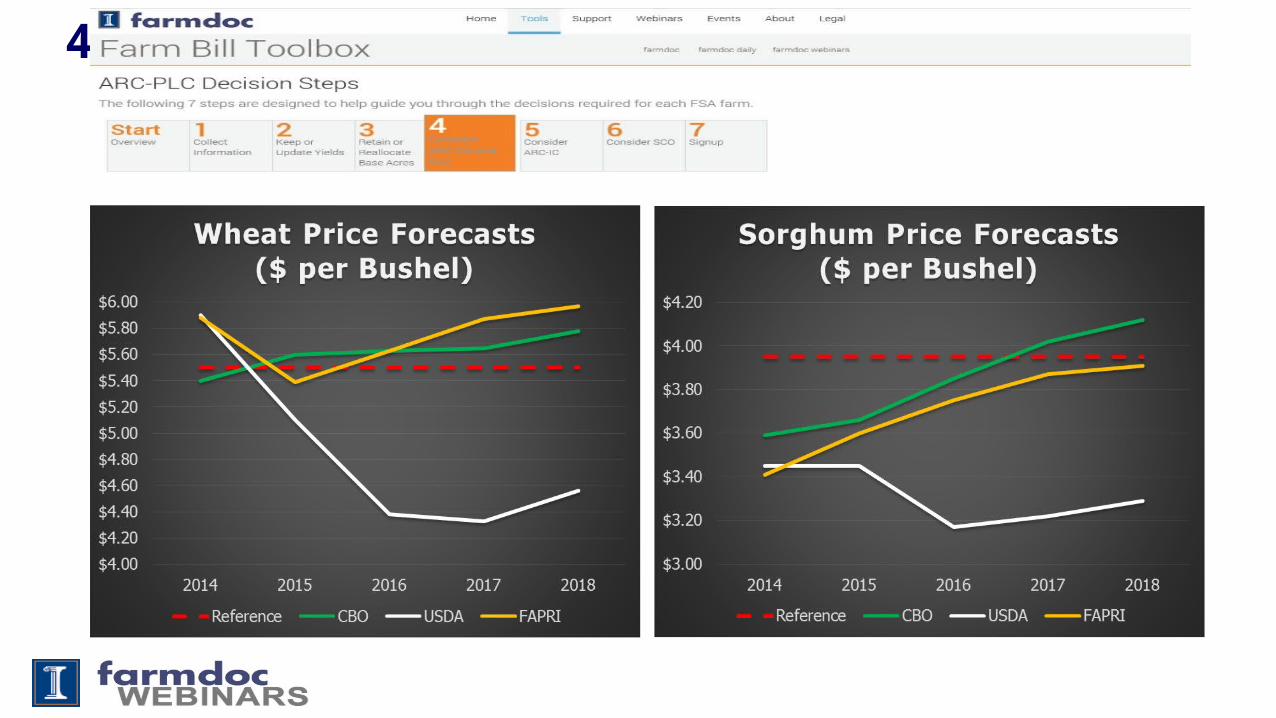
Compare ARC-CO and PLC.—Soybeans: all forecasts have prices above reference; difficult for PLC to be effective
Corn: close call, how low on price expectations (USDA?); keep in mind impact of big yields in 2014
Wheat: even closer call on price expectations; SCO may also be a significant factor

5
Consider ARC-IC.—Uses the sum of all program crops on the farm weighted by actual planted acres
All farms in the state enrolled in ARC-IC; producer’s share
Payments made on 65% of total base acres for the farm (all program crop base)

5

5
ARC-IC Example CalculationsCorn: 60 acres planted Soybeans: 40 acres planted
Year Yield Price Revenue Yield Price Revenue
2014 180 $3.50 $630 51 $10.00 $510
Benchmark (Max.) (0.6 x $764) + (0.4 x $590) = $695 (x 10% = $69.50)
Guarantee 86% of $695 = $597
Actual (0.6 x $630) + (0.4 x $510) = $582
Difference $597 - $582 = $15
Estimated Payment $15 x 100 x 65% = $995 ($9.95 per base acre)
6
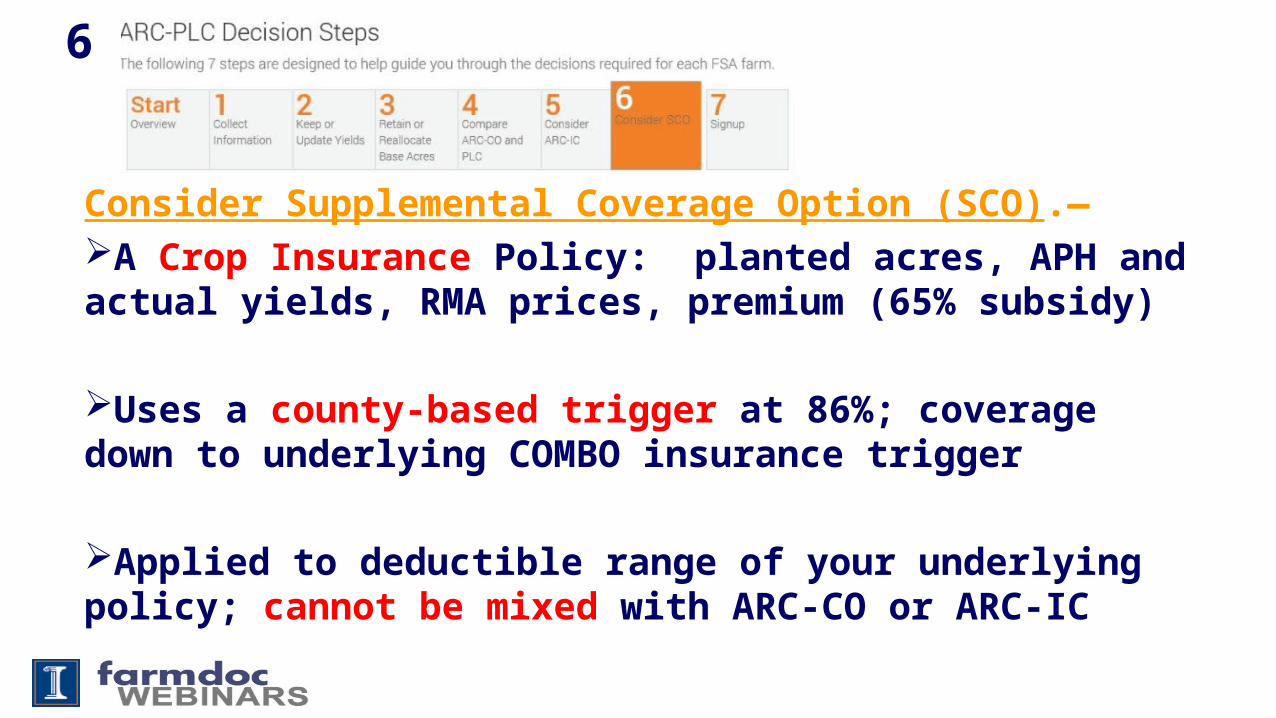
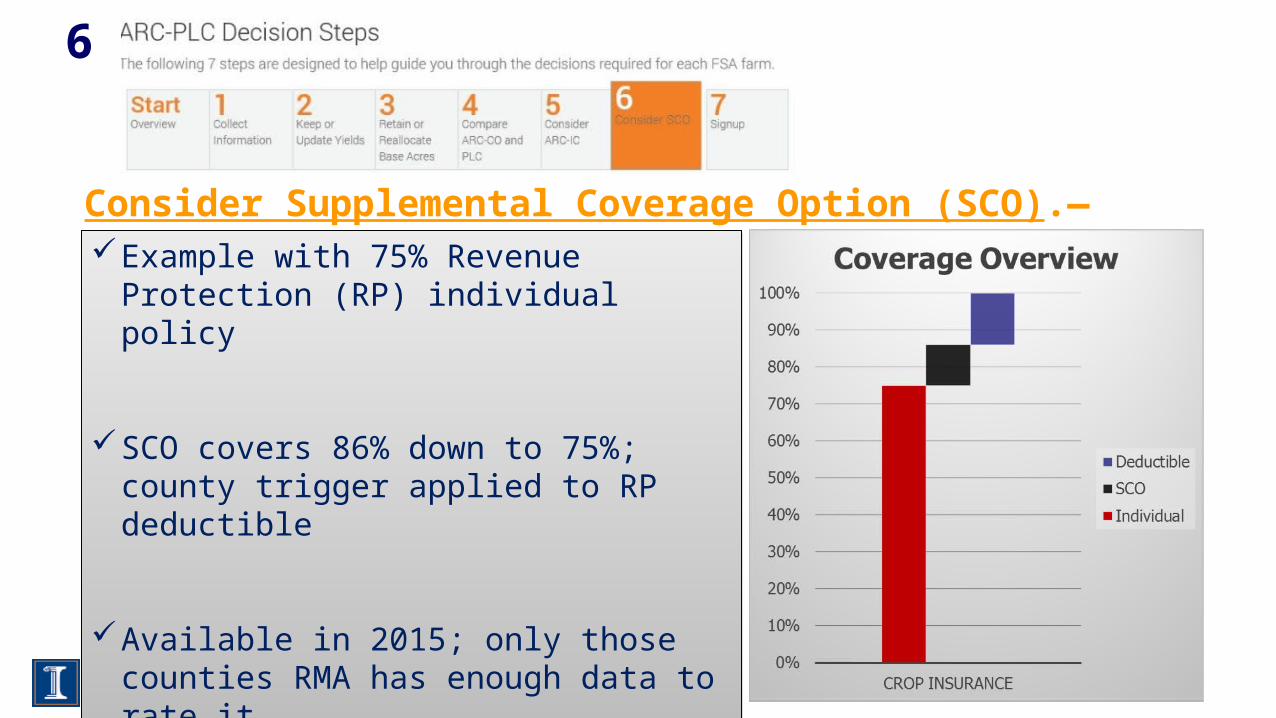
Consider Supplemental Coverage Option (SCO).—A Crop Insurance Policy: planted acres, APH and actual yields, RMA prices, premium (65% subsidy)
Uses a county-based trigger at 86%; coverage down to underlying COMBO insurance trigger
Applied to deductible range of your underlying policy; cannot be mixed with ARC-CO or ARC-IC
6
Consider Supplemental Coverage Option (SCO).—Example with 75% Revenue
Protection (RP) individual policy
SCO covers 86% down to 75%; county trigger applied to RP deductible
Available in 2015; only those counties RMA has enough data to rate it
Example with 75% Revenue Protection (RP) individual policy
SCO covers 86% down to 75%; county trigger applied to RP deductible
Available in 2015; only those counties RMA has enough data to rate it

6
Consider SCO: Wheat Example (75% RP)County Calculations
Base Price County Trend Yield
Revenue County Trigger Revenue Limit
$6.00 65 $390 86% x $390 = $335
75% x $390 = $293
Farm Calculations
Base Price Farm APH Revenue RP Trigger Max. Payment
$6.00 60 $360 75% x $360 = $270
(86%-75%) x $360 = $40
SCO Coverage and Expected Payment
Harvest Price County Yield County Rev. Shortfall Factor
$5.50 55 $303 ($335-$303)/($335-$293) = 0.76
Expected Payment
0.76 x $40 = $30.48

6
Consider Supplemental Coverage Option (SCO).—A Crop Insurance Policy: planted acres, APH and within year prices; no payment limits or AGI requirements
Purchasing a county-based trigger using farm yields; effectiveness compared to individual buy-up
Comparing PLC + SCO + COMBO vs. ARC-CO + COMBO vs. ARC-IC + COMBO
7
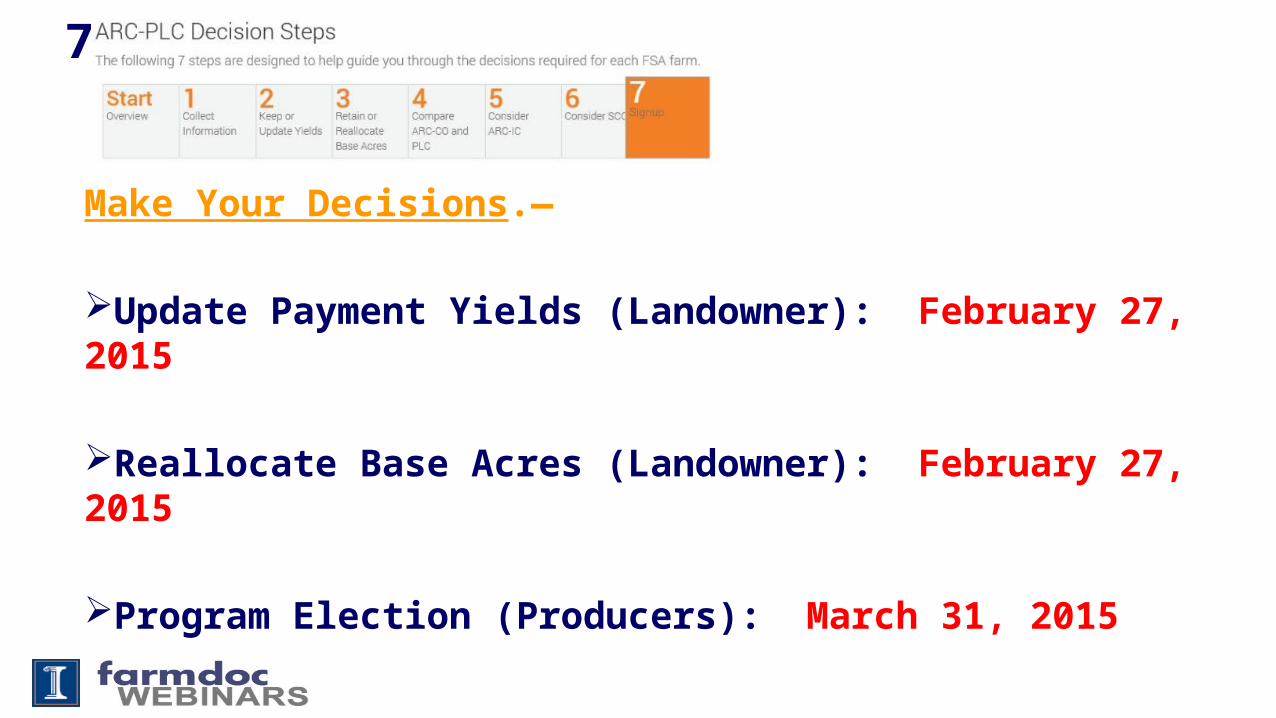
Make Your Decisions.—
Update Payment Yields (Landowner): February 27, 2015
Reallocate Base Acres (Landowner): February 27, 2015
Program Election (Producers): March 31, 2015

7
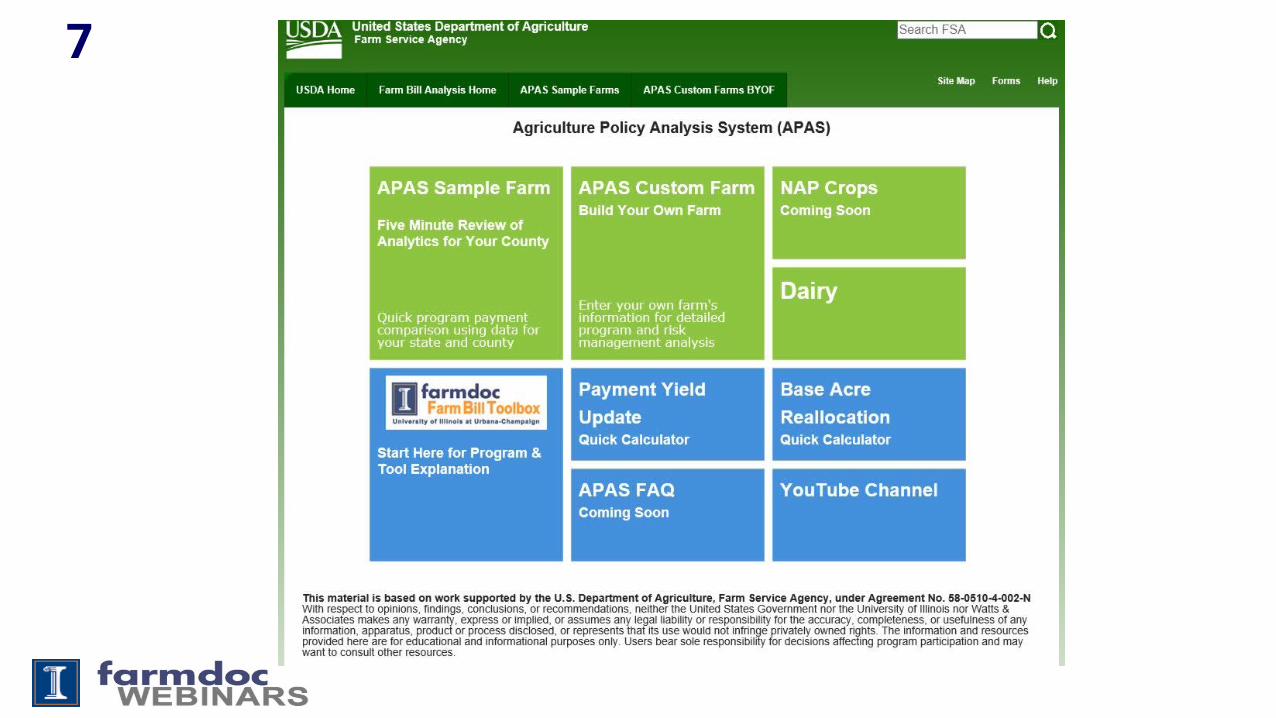
Make Your Decisions.—
Agriculture Policy Analysis System (APAS): http://fsa.usapas.com for program payment estimates
Farm Bill Toolbox for decision steps, background information, analysis, webinars and more
7
Top Related