


Languages
Pages
Legal

REPORT OF THE 2012 NATIONAL SURVEY OF
SCIENCE AND MATHEMATICS EDUCATION
FEBRUARY 2013
ERIC R. BANILOWER P. SEAN SMITH IRIS R. WEISS
KRISTEN A. MALZAHN KIIRA M. CAMPBELL
AARON M. WEIS
HORIZON RESEARCH, INC. CHAPEL HILL, NC

Horizon Research, Inc. ii February 2013
Disclaimer The Report of the 2012 National Survey of Science and Mathematics Education was prepared with support from the National Science Foundation under grant number DRL-1008228. Any opinions, findings, and conclusions or recommendations expressed in this material are those of the authors and do not necessarily reflect the views of the National Science Foundation. Suggested Citation Banilower, E. R., Smith, P. S., Weiss, I. R., Malzahn, K. A., Campbell, K. M., & Weis, A. M. (2013). Report of the 2012 National Survey of Science and Mathematics Education. Chapel Hill, NC: Horizon Research, Inc.

Horizon Research, Inc. iii February 2013
TABLE OF CONTENTS
Page List of Tables ................................................................................................................................. v List of Figures .............................................................................................................................. xv Acknowledgements ................................................................................................................... xvii Chapter One: Introduction .......................................................................................................... 1 Background and Purpose of the Study ................................................................................ 1 Sample Design and Sampling Error Considerations ........................................................... 2 Instrument Development ..................................................................................................... 3 Data Collection ................................................................................................................... 4 Outline of This Report ........................................................................................................ 5 Chapter Two: Teacher Background and Beliefs........................................................................ 7 Overview ............................................................................................................................. 7 Teacher Characteristics ....................................................................................................... 7 Teacher Preparation .......................................................................................................... 10 Teacher Pedagogical Beliefs ............................................................................................. 20 Teachers’ Perceptions of Preparedness ............................................................................. 23 Summary ........................................................................................................................... 31 Chapter Three: Science and Mathematics Professional Development .................................. 33 Overview ........................................................................................................................... 33 Teacher Professional Development .................................................................................. 33 Professional Development Offerings at the School Level ................................................ 43 Summary ........................................................................................................................... 51 Chapter Four: Science and Mathematics Courses .................................................................. 53 Overview ........................................................................................................................... 53 Time Spent in Elementary Science and Mathematics Instruction .................................... 53 Science and Mathematics Course Offerings ..................................................................... 54 Other Characteristics of Science and Mathematics Classes ............................................. 62 Summary ........................................................................................................................... 66 Chapter Five: Instructional Decision Making, Objectives, and Activities ............................ 69 Overview ........................................................................................................................... 69 Teachers’ Perceptions of Their Decision-Making Autonomy .......................................... 69 Objectives of Science and Mathematics Instruction ......................................................... 71 Class Activities ................................................................................................................. 74

Horizon Research, Inc. iv February 2013
Homework and Assessment Practices .............................................................................. 85 Summary ........................................................................................................................... 88 Chapter Six: Instructional Resources ....................................................................................... 91 Overview ........................................................................................................................... 91 Textbook Usage ................................................................................................................ 91 Facilities and Equipment................................................................................................. 100 Summary ......................................................................................................................... 107 Chapter Seven: Factors Affecting Instruction ....................................................................... 109 Overview ......................................................................................................................... 109 School Programs and Practices ....................................................................................... 109 Extent of Influence of State Standards............................................................................ 113 Factors That Promote and Inhibit Instruction ................................................................. 114 Summary ......................................................................................................................... 125 Appendix A: Sample Design Appendix B: Survey Questionnaires Appendix C: Pre-Data Collection Communication Appendix D: Description of Data Collection Appendix E: Description of Reporting Variables Appendix F: Additional Equity Cross-tabulations

Horizon Research, Inc. v February 2013
LIST OF TABLES
Page Chapter Two: Teacher Background and Beliefs 2.1 Characteristics of the Science Teaching Force, by Grade Range .................................................................... 8 2.2 Characteristics of the Mathematics Teaching Force, by Grade Range ............................................................ 9 2.3 Classes Taught by Teachers with Varying Experience Teaching Subject, by Subject and
Proportion of Students Eligible for Free/Reduced-Price Lunch ...................................................... 10 2.4 Classes Taught by Non-Asian Minority Teachers, by Subject and Proportion of Non-
Asian Minority Students in Class .................................................................................................... 10 2.5 Teacher Degrees, by Grade Range ................................................................................................................ 11 2.6 Secondary Teachers with a Degree in Discipline, by Proportion of Students Eligible for
Free/Reduced-Price Lunch .............................................................................................................. 11 2.7 Science Teachers with College Coursework in Various Science Disciplines, By Grade
Range .............................................................................................................................................. 12 2.8 Secondary Science Teachers Completing Various Biology/Life Science Courses, by
Grade Range .................................................................................................................................... 12 2.9 Secondary Science Teachers Completing Various Chemistry Courses, by Grade Range ............................. 13 2.10 Secondary Science Teachers Completing Various Physics Courses, by Grade Range ................................. 13 2.11 Secondary Science Teachers Completing Various Earth/Space Science Courses, by Grade
Range .............................................................................................................................................. 13 2.12 Secondary Science Teachers Completing Various Environmental Science Courses, by
Grade Range .................................................................................................................................... 14 2.13 Secondary Science Teachers Completing Various Engineering Courses, by Grade Range .......................... 14 2.14 Teachers Completing at Least One Course in Their Field at Two-Year Institutions, by
Grade Range .................................................................................................................................... 14 2.15 Average Percentage of Courses Teachers Completed in Their Field at Two-Year
Institutions, by Grade Range ........................................................................................................... 15 2.16 Elementary Science Teachers Meeting NSTA Course-Background Standards ............................................. 15 2.17 Middle School Teachers of General/Integrated Science Meeting NSTA Course-
Background Standards .................................................................................................................... 15 2.18 Secondary Science Teachers with Varying Levels of Background in Subject .............................................. 16 2.19 Secondary Science Classes Taught by Teachers with Substantial Background in Subject
of Selected Class, by Equity Factors ............................................................................................... 17 2.20 Elementary Mathematics Teachers Completing Various College Courses ................................................... 17 2.21 Elementary Mathematics Teachers’ Coursework Related to NCTM Course-Background
Standards ......................................................................................................................................... 18 2.22 Secondary Mathematics Teachers Completing Various College Courses, by Grade Range ......................... 19 2.23 Middle School Mathematics Teachers’ Coursework Related to NCTM Course-
Background Standards .................................................................................................................... 19 2.24 High School Mathematics Teachers’ Coursework Related to NCTM Course-Background
Standards ......................................................................................................................................... 20 2.25 Teachers’ Paths to Certification, by Subject and Grade Range ..................................................................... 20

Horizon Research, Inc. vi February 2013
2.26 Science Teachers Agreeing with Various Statements about Teaching and Learning, by Grade Range .................................................................................................................................... 22
2.27 Mathematics Teachers Agreeing with Various Statements about Teaching and Learning, by Grade Range ............................................................................................................................... 23
2.28 Elementary Teachers’ Perceptions of Their Preparedness to Teach Each Subject ........................................ 24 2.29 Elementary Teachers’ Perceptions of Their Preparedness to Teach Various Science
Disciplines....................................................................................................................................... 24 2.30 Elementary Teachers’ Perceptions of Their Preparedness to Teach Selected Mathematics
Topics .............................................................................................................................................. 25 2.31 Secondary Science Teachers Considering Themselves Very Well Prepared to Teach Each
of a Number of Topics, by Grade Range ........................................................................................ 26 2.32 Secondary Mathematics Teachers Considering Themselves Very Well Prepared to Teach
Each of a Number of Topics, by Grade Range................................................................................ 27 2.33 Science Teachers Considering Themselves Very Well Prepared for Each of a Number of
Tasks, by Grade Range ................................................................................................................... 28 2.34 Science Classes in Which Teachers Feel Very Well Prepared for Each of a Number of
Tasks in the Most Recent Unit, by Grade Range ............................................................................ 28 2.35 Class Mean Scores for Science Teacher Perceptions of Preparedness Composites, by
Equity Factors ................................................................................................................................. 29 2.36 Mathematics Teachers Considering Themselves Very Well Prepared for Each of a
Number of Tasks, by Grade Range ................................................................................................. 30 2.37 Mathematics Classes in Which Teachers Feel Very Well Prepared for Each of a Number
of Tasks in the Most Recent Unit, by Grade Range ........................................................................ 30 2.38 Class Mean Scores for Mathematics Teacher Perceptions of Preparedness Composites, by
Equity Factors ................................................................................................................................. 31 Chapter Three: Science and Mathematics Professional Development 3.1 Science Teachers’ Most Recent Participation in Science-Focused Professional
Development, by Grade Range ....................................................................................................... 33 3.2 Mathematics Teachers’ Most Recent Participation in Mathematics-Focused Professional
Development, by Grade Range ....................................................................................................... 34 3.3 Time Spent on Professional Development in the Last Three Years, by Subject and Grade
Range .............................................................................................................................................. 34 3.4 Classes Taught by Teachers with More than 35 Hours of Professional Development in the
Last Three Years, by Subject and Equity Factors ........................................................................... 35 3.5 Science Teachers Participating in Various Professional Development Activities in the
Last Three Years, by Grade Range ................................................................................................. 35 3.6 Mathematics Teachers Participating in Various Professional Development Activities in
the Last Three Years, by Grade Range ........................................................................................... 36 3.7 Science Teachers Whose Professional Development in the Last Three Years Had Each of
a Number of Characteristics to a Substantial Extent, by Grade Range ........................................... 37 3.8 Mathematics Teachers Whose Professional Development in the Last Three Years Had
Each of a Number of Characteristics to a Substantial Extent, by Grade Range .............................. 37 3.9 Teacher Mean Scores for the Quality of Professional Development Composite, by
Subject and Grade Range ................................................................................................................ 37 3.10 Class Mean Scores for the Quality of Professional Development Composite, by Subject
and Equity Factors .......................................................................................................................... 38 3.11 Science Teachers’ Most Recent College Coursework in Field, by Grade Range .......................................... 39 3.12 Mathematics Teachers’ Most Recent College Coursework in Field, by Grade Range .................................. 39 3.13 Science Teachers Reporting That Their Professional Development/Coursework in the
Last Three Years Gave Heavy Emphasis to Various Areas, by Grade Range ................................ 40

Horizon Research, Inc. vii February 2013
3.14 Mathematics Teachers Reporting That Their Professional Development/Coursework in the Last Three Years Gave Heavy Emphasis to Various Areas, by Grade Range .......................... 41
3.15 Teacher Mean Score on the Extent to which Professional Development/Coursework Focused on Student-Centered Instruction Composite, by Subject and Grade Range .............................................................................................................................................. 41
3.16 Class Mean Scores on the Extent to which Professional Development/Coursework
Focused on Student-Centered Instruction Composite, by Subject and Equity Factors ............................................................................................................................................. 42
3.17 Science Teachers Serving in Various Leadership Roles in the Last Three Years, by Grade Range .............................................................................................................................................. 42
3.18 Mathematics Teachers Serving in Various Leadership Roles in the Last Three Years, by Grade Range .................................................................................................................................... 42
3.19 Professional Development Workshops Offered Locally in the Last Three Years, by Subject and Grade Range ................................................................................................................ 43
3.20 Locally Offered Professional Development Workshops in the Last Three Years with a Substantial Focus in Each of a Number of Areas, by Subject ......................................................... 44
3.21 Teacher Study Groups Offered at Schools in the Last Three Years, by Subject and Grade
Range .............................................................................................................................................. 44 3.22 Characteristics of Teacher Study Groups, by Subject ................................................................................... 45 3.23 Origin of Designated Leaders of Teacher Study Groups, by Subject ............................................................ 45 3.24 Frequency and Duration of Teacher Study Groups, by Subject .................................................................... 45 3.25 Composition of Teacher Study Groups, by Subject ...................................................................................... 46 3.26 Description of Activities in Typical Teacher Study Groups, by Subject ....................................................... 46 3.27 How Schools Provide Time for Science/Mathematics Professional Development ....................................... 47 3.28 Schools Providing One-on-One Science/Mathematics Coaching.................................................................. 47 3.29 Teaching Professionals Providing Science- and Mathematics-Focused One-on-One
Coaching ........................................................................................................................................ 47 3.30 Professionals Providing Science- and Mathematics-Focused One-on-One Coaching to a
Substantial Extent ........................................................................................................................... 48 3.31 Services Provided to Science Teachers in Need of Special Assistance in Teaching, by
Grade Range .................................................................................................................................... 48 3.32 Services Provided to Mathematics Teachers in Need of Special Assistance in Teaching,
by Grade Range ............................................................................................................................... 49 3.33 Schools Providing Various Services to Science Teachers, by Equity Factors ............................................... 49 3.34 Schools Providing Various Services to Mathematics Teachers, by Equity Factors ...................................... 50 Chapter Four: Science and Mathematics Courses 4.1 Frequency with Which Self-Contained Elementary Classes Receive Science and
Mathematics, by Subject ................................................................................................................. 53 4.2 Average Number of Minutes per Day Spent Teaching Each Subject in Self-Contained
Classes, by Grades .......................................................................................................................... 54 4.3 Type of Middle School Science Courses Offered, by Grade ......................................................................... 54 4.4 High Schools Offering Various Science Courses .......................................................................................... 55 4.5 Access to AP Science Courses ...................................................................................................................... 56 4.6 Number of AP Science Courses Offered at High Schools ............................................................................ 56 4.7 Average Number of AP Science Courses Offered at High Schools, by Equity Factors ................................ 57 4.8 Science Programs and Practices Currently Being Implemented in High Schools ......................................... 57 4.9 Middle Schools with Various Percentages of 8th Graders Completing Algebra 1 and
Geometry Prior to 9th Grade ............................................................................................................ 58
Horizon Research, Inc. viii February 2013
4.10 Average Percentage of 8th Graders Completing Algebra I and Geometry Prior to 9th Grade, by Equity Factors ................................................................................................................ 58
4.11 High Schools Offering Various Mathematics Courses .................................................................................. 59 4.12 Access to AP Mathematics Courses .............................................................................................................. 59 4.13 Number of AP Mathematics Courses Offered at High Schools .................................................................... 59 4.14 Average Number of AP Mathematics Courses Offered at High Schools, by Equity
Factors ............................................................................................................................................. 60 4.15 Mathematics Programs and Practices Currently Being Implemented in High Schools ................................. 61 4.16 Most Commonly Offered High School Science Courses .............................................................................. 61 4.17 Most Commonly Offered High School Mathematics Courses ...................................................................... 62 4.18 Average Class Size, by Subject and Course Type ......................................................................................... 62 4.19 Prior-Achievement Grouping in Classes, by Subject and Grade Range ........................................................ 64 4.20 Prior-Achievement Grouping in High School Courses, by Subject .............................................................. 64 4.21 Prior-Achievement Grouping in Grade K–12 Science Classes with Low, Medium, and
High Percentages of Non-Asian Minority Students ........................................................................ 65 4.22 Prior-Achievement Grouping in Grade K–12 Mathematics Classes with Low, Medium,
and High Percentages of Non-Asian Minority Students ................................................................. 65 4.23 Average Percentages of Female and Non-Asian Minority Students in Courses, by Grade
Range and Course Type .................................................................................................................. 66 Chapter Five: Instructional Decision Making, Objectives, and Activities 5.1 Science Classes in Which Teachers Report Having Strong Control Over Various
Curriculum and Instruction Decisions, by Grade Range ................................................................. 69 5.2 Mathematics Classes in Which Teachers Report Having Strong Control Over Various
Curriculum and Instruction Decisions, by Grade Range ................................................................. 70 5.3 Class Mean Scores for Curriculum Control and Pedagogical Control Composites, by
Subject and Grade Range ................................................................................................................ 70 5.4 Class Mean Scores for Curriculum Control and Pedagogical Control Composites, by
Subject and Region ......................................................................................................................... 71 5.5 Science Classes with Heavy Emphasis on Various Instructional Objectives, by Grade
Range .............................................................................................................................................. 71 5.6 Science Class Mean Scores on the Reform-Oriented Instructional Objectives Composite,
by Grade Range ............................................................................................................................... 72 5.7 Science Class Mean Scores on the Reform-Oriented Instructional Objectives Composite,
by Equity Factors ............................................................................................................................ 72 5.8 Mathematics Classes with Heavy Emphasis on Various Instructional Objectives, by
Grade Range .................................................................................................................................... 73 5.9 Mathematics Class Mean Scores on the Reform-Oriented Instructional Objectives
Composite, by Grade Range ........................................................................................................... 73 5.10 Mathematics Class Mean Scores on the Reform-Oriented Instructional Objectives
Composite, by Equity Factors ......................................................................................................... 74 5.11 Science Classes in Which Teachers Report Using Various Activities in All or Almost All
Lessons, by Grade Range ................................................................................................................ 75 5.12 Science Classes in Which Teachers Report Using Various Activities at Least Once a
Week, by Grade Range ................................................................................................................... 76 5.13 Science Classes in Which Teachers Report Never Using Various Activities, by Grade
Range .............................................................................................................................................. 77 5.14 Science Classes in Which Teachers Report that Students Use Various Instructional
Technologies at Least Once a Week, by Grade Range ................................................................... 77 5.15 Class Mean Scores on Science Teaching Practice Composites, by Grade Range ......................................... 78

Horizon Research, Inc. ix February 2013
5.16 Class Mean Scores on Science Teaching Practice Composites, by Equity Factors ....................................... 78 5.17 Science Classes Participating in Various Activities in the Most Recent Lesson, by Grade
Range .............................................................................................................................................. 79 5.18 Average Percentage of Time Spent on Different Activities in the Most Recent Science
Lesson, by Grade Range ................................................................................................................. 79 5.19 Mathematics Classes in Which Teachers Report Using Various Activities in All or
Almost All Lessons, by Grade Range ............................................................................................. 80 5.20 Mathematics Classes in Which Teachers Report Using Various Activities at Least Once a
Week, by Grade Range ................................................................................................................... 81 5.21 Mathematics Classes in Which Teachers Report Never Using Various Activities, by
Grade Range .................................................................................................................................... 82 5.22 Mathematics Classes in Which Teachers Report that Students Use Various Instructional
Technologies at Least Once a Week, by Grade Range ................................................................... 83 5.23 Class Mean Scores on Mathematics Teaching Practice Composites, by Grade Range ................................. 83 5.24 Class Mean Scores on Mathematics Teaching Practice Composites, by Equity Factors............................... 84 5.25 Mathematics Classes Participating in Various Activities in the Most Recent Lesson, by
Grade Range .................................................................................................................................... 84 5.26 Average Percentage of Time Spent on Different Activities in the Most Recent
Mathematics Lesson, by Grade Range ............................................................................................ 85 5.27 Amount of Homework Assigned in Classes per Week, by Subject and Grade Range .................................. 85 5.28 Science Classes in Which Teachers Report Assessing Students Using Various Methods in
the Most Recent Unit, by Grade Range ........................................................................................... 86 5.29 Mathematics Classes in Which Teachers Report Assessing Students Using Various
Methods in the Most Recent Unit, by Grade Range ........................................................................ 87 5.30 Frequency of Required External Testing in Classes, by Subject and Grade Range ...................................... 87 5.31 Classes Required to Take External Assessments Two or More Times per Year, by Subject
and Equity Factors .......................................................................................................................... 88 Chapter Six: Instructional Resources 6.1 Classes Using Commercially Published Textbooks/Programs, by Subject ................................................... 91 6.2 Instructional Materials Used in Mathematics Classes, by Grade Range ....................................................... 92 6.3 Instructional Materials Used in Science Classes, by Grade Range ............................................................... 92 6.4 Market Share of Commercial Textbook Publishers, by Subject and Grade Range ....................................... 93 6.5 Most Commonly Used Science Textbooks, by Grade Range and Course ..................................................... 94 6.6 Most Commonly Used Mathematics Textbooks, by Grade Range and Course ............................................. 95 6.7 Classes Using Instructional Materials Developed with NSF Funding, by Subject and
Grade Range .................................................................................................................................... 95 6.8 Publication Year of Textbooks/Programs, by Subject and Grade Range ...................................................... 96 6.9 Perceived Quality of Textbooks/Programs Used in Classes, by Subject and Grade Range .......................... 96 6.10 Percentage of Textbooks/Programs Covered during the Course, by Subject and Grade
Range .............................................................................................................................................. 97 6.11 Percentage of Instructional Time Spent Using Instructional Materials during the Course,
by Grade Range ............................................................................................................................... 97 6.12 Ways Teachers Substantially Used Their Textbook in the Most Recent Unit, by Grade
Range .............................................................................................................................................. 98 6.13 Reasons Why Parts of the Textbook Are Skipped, by Grade Range ............................................................. 99 6.14 Reasons Why the Textbook Is Supplemented, by Grade Range ................................................................. 100 6.15 Availability of Instructional Technologies in Science Classes, by Grade Range ........................................ 101

Horizon Research, Inc. x February 2013
6.16 Availability of Instructional Technologies in Science Classes, by Prior Achievement
Level of Students .......................................................................................................................... 101 6.17 Availability of Instructional Technologies in Mathematics Classes, by Grade Range ................................ 102 6.18 Availability of Instructional Technologies in Mathematics Classes, by Percent of Non-
Asian Minority Students in Class .................................................................................................. 102 6.19 Expectations that Students will Provide their Own Instructional Technologies, by Grade
Range ............................................................................................................................................ 103 6.20 Median Amount Schools Spend per Pupil on Science and Mathematics Equipment and
Consumable Supplies, by Grade Range ........................................................................................ 103 6.21 Median Amount Schools Spend per Pupil on Science Equipment and Consumable
Supplies, by Equity Factors........................................................................................................... 104 6.22 Median Amount Schools Spend per Pupil on Mathematics Equipment and Consumable
Supplies, by Equity Factors........................................................................................................... 105 6.23 Science Classes with Adequate Resources for Instruction, by Grade Range .............................................. 105 6.24 Mathematics Classes with Adequate Resources for Instruction, by Grade Range ...................................... 106 6.25 Class Mean Scores on the Adequacy of Resources for Instruction Composite, by Grade
Range ............................................................................................................................................ 106 6.26 Class Mean Scores on the Adequacy of Resources for Instruction Composite, by Equity
Factors ........................................................................................................................................... 107 Chapter Seven: Factors Affecting Instruction 7.1 Use of Various Instructional Arrangements in Elementary Schools, by Subject ........................................ 110 7.2 High School Graduation vs. State University Entrance Requirements, by Subject ..................................... 110 7.3 Prevalence of Block Scheduling .................................................................................................................. 111 7.4 School Programs/Practices to Enhance Students’ Interest and/or Achievement in
Science/Engineering, by Grade Range .......................................................................................... 111 7.5 School Programs/Practices to Enhance Students’ Interest and/or Achievement in
Mathematics, by Grade Range ...................................................................................................... 112 7.6 School Programs/Practices to Enhance Students’ Interest in Science/Engineering, by
School Size.................................................................................................................................... 112 7.7 School Programs/Practices to Enhance Students’ Interest in Mathematics, by School Size ....................... 113 7.8 Respondents Agreeing with Various Statements Regarding State Science Standards, by
School Type .................................................................................................................................. 113 7.9 Respondents Agreeing with Various Statements Regarding State Mathematics Standards,
by School Type ............................................................................................................................. 114 7.10 School Mean Scores on the Focus on State Standards Composite .............................................................. 114 7.11 Effect of Various Factors on Science Instruction ........................................................................................ 115 7.12 Effect of Various Factors on Mathematics Instruction ................................................................................ 115 7.13 Science Program Representatives Viewing Each of a Number of Factors as a Serious
Problem for Science Instruction in Their School, by Grade Range .............................................. 116 7.14 Mathematics Program Representatives Viewing Each of a Number of Factors as a Serious
Problem for Mathematics Instruction in Their School, by Grade Range ...................................... 117 7.15 School Mean Scores on Factors Affecting Instruction Composites, by Grade Range................................. 118 7.16 School Mean Scores for Factors Affecting Science Instruction Composites, by Equity
Factors ........................................................................................................................................... 118 7.17 School Mean Scores for Factors Affecting Mathematics Instruction Composites, by
Equity Factors ............................................................................................................................... 119 7.18 Effect of Various Factors on Instruction in the Randomly Selected Science Class..................................... 120
Horizon Research, Inc. xi February 2013
7.19 Factors Seen as Promoting Effective Instruction in the Randomly Selected Mathematics Class, by Grade Range .................................................................................................................. 121
7.20 Factors Seen as Inhibiting Effective Instruction in the Randomly Selected Mathematics Class, by Grade Range .................................................................................................................. 121
7.21 Extent to Which Technology Quality Is a Serious Problem for Instruction in the
Randomly Selected Science Class, by Grade Range ..................................................................... 122 7.22 Extent to Which Technology Quality Is a Serious Problem for Instruction in the
Randomly Selected Mathematics Class, by Grade Range ............................................................. 122 7.23 Class Mean Scores on Factors Affecting Instruction Composites, by Grade Range ................................... 123 7.24 Class Mean Scores on Factors Affecting Science Instruction Composites, by Equity
Factors ........................................................................................................................................... 124 7.25 Class Mean Scores on Factors Affecting Mathematics Instruction Composites, by Equity
Factors ........................................................................................................................................... 125 Appendix A: Sample Design A-1 Definition of School Locale Code, Based on School Address .................................................................... A-3 A-2 Distribution of Sample, by Stratum ............................................................................................................. A-4 A-3 Teachers Selected in Each School Stratum ................................................................................................. A-6 Appendix D: Description of Data Collection D-1 School Participation, By Stratum ................................................................................................................ D-3 D-2 Results of Program Questionnaires, by Stratum and Subject ...................................................................... D-4 D-3 Results of Teacher Questionnaires, by Stratum and Subject ....................................................................... D-5 Appendix E: Description of Reporting Variables E-1 Quality of Professional Development ......................................................................................................... E-4 E-2 Extent to Which Professional Development/Coursework Focused on Student-Centered
Instruction ..................................................................................................................................... E-5 E-3S Perceptions of Content Preparedness: Science ............................................................................................ E-6 E-3M Perceptions of Content Preparedness: Mathematics ................................................................................... E-8 E-4 Perceptions of Preparedness to Teach Diverse Learners ............................................................................. E-9 E-5 Perceptions of Preparedness to Encourage Students ................................................................................. E-10 E-6 Perceptions of Preparedness to Implement Instruction in Particular Unit ................................................. E-11 E-7 Curriculum Control ................................................................................................................................... E-12 E-8 Pedagogical Control .................................................................................................................................. E-13 E-9 Reform-Oriented Instructional Objectives ................................................................................................ E-14 E-10S Use of Reform-Oriented Teaching Practices: Science .............................................................................. E-15 E-10M Use of Reform-Oriented Teaching Practices: Mathematics ..................................................................... E-16 E-11 Use of Instructional Technology ............................................................................................................... E-17 E-12S Adequacy of Resources for Instruction: Science ....................................................................................... E-18 E-12M Adequacy of Resources for Instruction: Mathematics .............................................................................. E-19 E-13 Extent to Which the Quality of Instructional Technology Is Problematic for Instruction ......................... E-20 E-14 Extent to Which the Policy Environment Promotes Effective Instruction ................................................ E-21 E-15 Extent to Which Stakeholders Promote Effective Instruction ................................................................... E-22 E-16 Extent to Which School Support Promotes Effective Instruction ............................................................. E-23 E-17 Focus on State Science/Mathematics Standards ........................................................................................ E-25 E-18 Supportive Context for Science/Mathematics Instruction ......................................................................... E-26 E-19 Extent to Which a Lack of Materials and Supplies Is Problematic ........................................................... E-27 E-20 Extent to Which Student Issues Are Problematic ...................................................................................... E-28

Horizon Research, Inc. xii February 2013
E-21 Extent to Which Teacher Issues Are Problematic ..................................................................................... E-29 E-22 Extent to Which a Lack of Time Is Problematic ....................................................................................... E-30 Appendix F: Additional Equity Cross-tabulations F-1 Science Classes Taught by Teachers with Varying Experience Teaching Science, by
Equity Factors ............................................................................................................................... F-1 F-2 Mathematics Classes Taught by Teachers with Varying Experience Teaching
Mathematics, by Equity Factors .................................................................................................... F-2 F-3 Secondary Teachers with a Degree in Discipline, by Equity Factors .......................................................... F-3 F-4 Secondary Science Classes Taught by Teachers with Substantial Background in Subject
of Selected Class, by Equity Factors ............................................................................................. F-4 F-5 Class Mean Scores for Science Teacher Perceptions of Preparedness Composites, by
Equity Factors ............................................................................................................................... F-5 F-6 Class Mean Scores for Mathematics Teacher Perceptions of Preparedness Composites, by
Equity Factors ............................................................................................................................... F-6 F-7 Classes Taught by Teachers with More than 35 Hours of Professional Development in the
Last Three Years, by Subject and Equity Factors ......................................................................... F-7 F-8 Class Mean Scores for the Quality of Professional Development Composite, by Subject
and Equity Factors ........................................................................................................................ F-8 F-9 Class Mean Scores on the Extent to which Professional Development/Coursework
Focused on Student-Centered Instruction Composite, by Subject and Equity Factors ........................................................................................................................................... F-9
F-10 Schools Providing Various Services to Science Teachers, by Equity Factors ........................................... F-10 F-11 Schools Providing Various Services to Mathematics Teachers, by Equity Factors .................................. F-11 F-12 Average Number of AP Science Courses Offered at High Schools, by Equity Factors ............................ F-12 F-13 Average Percentage of 8th Graders Completing Algebra I and Geometry Prior to 9th
Grade, by Equity Factors ............................................................................................................ F-13 F-14 Average Number of AP Mathematics Courses Offered at High Schools, by Equity
Factors ......................................................................................................................................... F-14 F-15 Science Class Mean Scores on the Reform-Oriented Instructional Objectives Composite,
by Equity Factors ........................................................................................................................ F-15 F-16 Mathematics Class Mean Scores on the Reform-Oriented Instructional Objectives
Composite, by Equity Factors ..................................................................................................... F-16 F-17 Class Mean Scores on Science Teaching Practice Composites, by Equity Factors ................................... F-17 F-18 Class Mean Scores on Mathematics Teaching Practice Composites, by Equity Factors........................... F-18 F-19 Classes Required to Take External Assessments Two or More Times per Year, by Subject
and Equity Factors ...................................................................................................................... F-19 F-20 Availability of Instructional Technologies in Science Classes, by Equity Factors ................................... F-20 F-21 Availability of Instructional Technologies in Mathematics Classes, by Equity Factors ........................... F-21 F-22 Median Amount Schools Spend per Pupil on Science Equipment, Consumable Supplies,
and Software, by Equity Factors ................................................................................................. F-22 F-23 Median Amount Schools Spend per Pupil on Mathematics Equipment, Consumable
Supplies, and Software, by Equity Factors ................................................................................. F-23 F-24 Class Mean Scores on the Adequacy of Resources for Instruction Composite, by Equity
Factors ......................................................................................................................................... F-24 F-25 School Mean Scores for Factors Affecting Science Instruction Composites, by Equity
Factors ......................................................................................................................................... F-25 F-26 School Mean Scores for Factors Affecting Mathematics Instruction Composites, by
Equity Factors ............................................................................................................................. F-26

Horizon Research, Inc. xiii February 2013
F-27 Class Mean Scores on Factors Affecting Science Instruction Composites, by Equity Factors ......................................................................................................................................... F-27
F-28 Class Mean Scores on Factors Affecting Mathematics Instruction Composites, by Equity Factors ......................................................................................................................................... F-28

Horizon Research, Inc. xiv February 2013
Horizon Research, Inc. xv February 2013
LIST OF FIGURES
Page Chapter Four: Science and Mathematics Courses 4.1 Class Size, Science: Elementary .................................................................................................................... 63 4.2 Class Size, Science: Middle .......................................................................................................................... 63 4.3 Class Size, Science: High .............................................................................................................................. 63 4.4 Class Size, Mathematics: Elementary ........................................................................................................... 63 4.5 Class Size, Mathematics: Middle .................................................................................................................. 63 4.6 Class Size, Mathematics: High ...................................................................................................................... 63 Appendix E: Description of Reporting Variables E-1 K–12 Science: Quality of Professional Development ................................................................................. E-4 E-2 K–12 Mathematics: Quality of Professional Development ......................................................................... E-4 E-3 K–12 Science: Extent to which Professional Development/Coursework Focused on
Student-Centered Instruction ........................................................................................................ E-5 E-4 K–12 Mathematics: Extent to which Professional Development/Coursework Focused on
Student-Centered Instruction ........................................................................................................ E-5 E-5 Perceptions of Content Preparedness: Biology/Life Science ...................................................................... E-7 E-6 Perceptions of Content Preparedness: Chemistry ........................................................................................ E-7 E-7 Perceptions of Content Preparedness: Earth Science .................................................................................. E-7 E-8 Perceptions of Content Preparedness: Integrated/General Science ............................................................. E-7 E-9 Perceptions of Content Preparedness: Physical Science ............................................................................. E-7 E-10 Perceptions of Content Preparedness: Physics ............................................................................................ E-7 E-11 Perceptions of Content Preparedness: Mathematics .................................................................................... E-8 E-12 K–12 Science: Perceptions of Preparedness to Teach Diverse Learners ..................................................... E-9 E-13 K–12 Mathematics: Perceptions of Preparedness to Teach Diverse Learners ............................................. E-9 E-14 K–12 Science: Perceptions of Preparedness to Encourage Students in Science and/or
Engineering ................................................................................................................................. E-10 E-15 K–12 Mathematics: Perceptions of Preparedness to Encourage Students in Mathematics ....................... E-10 E-16 K–12 Science: Perceptions of Preparedness to Implement Instruction in Unit ......................................... E-11 E-17 K–12 Mathematics: Perceptions of Preparedness to Implement Instruction in Unit ................................. E-11 E-18 K–12 Science: Curriculum Control ........................................................................................................... E-12 E-19 K–12 Mathematics: Curriculum Control ................................................................................................... E-12 E-20 K–12 Science: Pedagogical Control .......................................................................................................... E-13 E-21 K–12 Mathematics: Pedagogical Control .................................................................................................. E-13 E-22 K–12 Science: Reform-Oriented Instructional Objectives ........................................................................ E-14 E-23 K–12 Mathematics: Reform-Oriented Instructional Objectives ................................................................ E-14 E-24 K–12 Science: Use of Reform-Oriented Teaching Practices ..................................................................... E-15
Horizon Research, Inc. xvi February 2013
E-25 K–12 Mathematics: Use of Reform-Oriented Teaching Practices ............................................................ E-16 E-26 K–12 Science: Use of Instructional Technology ....................................................................................... E-17 E-27 K–12 Mathematics: Use of Instructional Technology ............................................................................... E-17 E-28 K–12 Science: Adequacy of Resources for Instruction ............................................................................. E-18 E-29 K–12 Mathematics: Adequacy of Resources for Instruction ..................................................................... E-19 E-30 K–12 Science: Extent to Which Quality of IT Is Problematic for Instruction ........................................... E-20 E-31 K–12 Mathematics: Extent to Which Quality of IT Is Problematic for Instruction .................................. E-20 E-32 K–12 Science: Extent to Which the Policy Environment Promotes Effective Instruction ........................ E-21 E-33 K–12 Mathematics: Extent to Which the Policy Environment Promotes Effective
Instruction ................................................................................................................................... E-21 E-34 K–12 Science: Extent to Which Stakeholders Promote Effective Instruction ........................................... E-22 E-35 K–12 Mathematics: Extent to Which Stakeholders Promote Effective Instruction ................................... E-22 E-36 K–12 Science: Extent to Which School Support Promotes Effective Instruction ..................................... E-23 E-37 K–12 Mathematics: Extent to Which School Support Promotes Effective Instruction ............................. E-23 E-38 K–12 Science: Focus on State Standards .................................................................................................. E-25 E-39 K–12 Mathematics: Focus on State Standards .......................................................................................... E-25 E-40 K–12 Science: Supportive Context for Science Instruction ...................................................................... E-26 E-41 K–12 Mathematics: Supportive Context for Mathematics Instruction ...................................................... E-26 E-42 K–12 Science: Extent to Which a Lack of Materials and Supplies Is Problematic ................................... E-27 E-43 K–12 Mathematics: Extent to Which a Lack of Materials and Supplies Is Problematic ........................... E-27 E-44 K–12 Science: Extent to Which Student Issues Are Problematic ............................................................. E-28 E-45 K–12 Mathematics: Extent to Which Student Issues Are Problematic ..................................................... E-28 E-46 K–12 Science: Extent to Which Teacher Issues Are Problematic ............................................................. E-29 E-47 K–12 Mathematics: Extent to Which Teacher Issues Are Problematic ..................................................... E-29 E-48 K–12 Science: Extent to Which a Lack of Time Is Problematic ............................................................... E-30 E-49 K–12 Mathematics: Extent to Which a Lack of Time Is Problematic ....................................................... E-30

Horizon Research, Inc. xvii February 2013
ACKNOWLEDGEMENTS
The 2012 National Survey of Science and Mathematics Education was coordinated by Horizon Research, Inc. (HRI) of Chapel Hill, North Carolina with support from the National Science Foundation (NSF). The project was led by Eric R. Banilower, P. Sean Smith, and Iris R. Weiss. A number of other HRI staff assisted with the study, including Belle Booker, Alison Bowes, Jayme Dunnon, William Fulkerson, Susan Hudson, Leonard Lind, Scott Pion, Adrienne Smith, and Peggy Trygstad. The sample design was developed by Mike Brick and Pam Broene of Westat, Inc. of Rockville, Maryland. The project advisory board, consisting of a number of science and mathematics educators contributed to the design of the survey. Board members were Rolf Blank, Hilda Borko, Jere Confrey, Doug Grouws, Thomas Hoffer, Frances Lawrenz, Ohkee Lee, Shirley Malcom, Jim Minstrell, Andrew Porter, Senta Raizen, Sharon Senk, Margaret (Peg) Smith, and Brian Stecher. Janice Earle of NSF’s Division of Research on Learning in Formal and Informal Settings provided valuable advice as Program Officer for the study. Special thanks are due to the thousands of teachers throughout the United States who took time from their busy schedules to provide information about their science and mathematics teaching. Finally, special acknowledgment is due to Iris R. Weiss who founded HRI and served as President until her retirement in 2012. Dr. Weiss began the National Survey effort in 1977. Through her invaluable leadership, there have been four successive iterations, including the 2012 National Survey.

Horizon Research, Inc. xviii February 2013
Horizon Research, Inc. 1 February 2013
CHAPTER ONE
Introduction Background and Purpose of the Study In 2012, the National Science Foundation supported the fifth in a series of national surveys of science and mathematics education through a grant to Horizon Research, Inc. (HRI). The first survey was conducted in 1977 as part of a major assessment of science and mathematics education consisting of a comprehensive review of the literature; case studies of 11 districts throughout the United States; and a national survey of teachers, principals, and district and state personnel. A second survey of teachers and principals was conducted in 1985–86 to identify trends since 1977, a third survey was conducted in 1993, and a fourth in 2000. The 2012 National Survey of Science and Mathematics Education was designed to provide up-to-date information and to identify trends in the areas of teacher background and experience, curriculum and instruction, and the availability and use of instructional resources. A total of 7,752 science and mathematics teachers in schools across the United States participated in this survey. The research questions addressed by the survey are:
1. To what extent do science and mathematics instruction and ongoing assessment mirror current understanding of learning?
2. What influences teachers’ decisions about content and pedagogy?
3. What are the characteristics of the science/mathematics teaching force in terms of race, gender, age, content background, beliefs about teaching and learning, and perceptions of preparedness?
4. What are the most commonly used textbooks/programs, and how are they used?
5. What formal and informal opportunities do science/mathematics teachers have for ongoing development of their knowledge and skills?
6. How are resources for science/mathematics education, including well-prepared teachers and course offerings, distributed among schools in different types of communities and different socioeconomic levels?
The design and implementation of the 2012 National Survey involved developing a sampling strategy and selecting samples of schools and teachers, developing and piloting survey instruments, collecting data from sample members, and preparing data files and analyzing the
Horizon Research, Inc. 2 February 2013
data. These activities are described in the following sections. The final section of this chapter outlines the contents of the remainder of the report. Sample Design and Sampling Error Considerations The 2012 National Survey is based on a national probability sample of science and mathematics schools and teachers in grades K–12 in the 50 states and the District of Columbia. The sample was designed to allow national estimates of science and mathematics course offerings and enrollment, teacher background preparation, textbook usage, instructional techniques, and availability and use of science and mathematics facilities and equipment. Every eligible school and teacher in the target population had a known, positive probability of being drawn into the sample. The sample design involved clustering and stratification prior to sample selection. The first stage units consisted of elementary and secondary schools. Science and mathematics teachers constituted the second stage units. The target sample sizes were designed to be large enough to allow sub-domain estimates such as for particular regions or types of community. The sampling frame for the school sample was constructed from the Common Core of Data and Private School Survey databases—programs of the U.S. Department of Education’s National Center for Education Statistics—which include school name and address and information about the school needed for stratification and sample selection. The sampling frame for the teacher sample was constructed from lists provided by sample schools, identifying current teachers and the specific science and mathematics subjects they were teaching. As biology is by far the most common science course at the high school level, selecting a random sample of science teachers would result in a much larger number of biology teachers than chemistry or physics teachers. Similarly, random selection of mathematics teachers might result in a smaller than desired sample of teachers of advanced mathematics courses. In order to ensure that the sample would include a sufficient number of advanced science and mathematics teachers for separate analysis, information on teaching assignments was used to create separate domains (e.g., for teachers of chemistry and physics), and sampling rates were adjusted by domain. The study design included obtaining in-depth information from each teacher about curriculum and instruction in a single randomly selected class. Most elementary teachers were reported by their principals to teach in self-contained classrooms; i.e., they were responsible for teaching all academic subjects to a single group of students. Each such sample teacher was randomly assigned to one of two groups—science or mathematics—and received a questionnaire specific to that subject. Most secondary teachers in the sample taught several classes of a single subject; some taught both science and mathematics. For each such teacher, one class was randomly selected. Whenever a sample is anything other than a simple random sample of a population, the results must be weighted to take the sample design into account. In the 2012 National Survey, the weight for each respondent was calculated as the inverse of the probability of selecting the
Horizon Research, Inc. 3 February 2013
individual into the sample multiplied by a non-response adjustment factor.1 In the case of data about a randomly selected class, the teacher weight was adjusted to reflect the number of classes taught, and therefore, the probability of a particular class being selected. Detailed information about the sample design, weighting procedures, and non-response adjustments used in the 2012 National Survey is included in Appendix A. The results of any survey based on a sample of a population (rather than on the entire population) are subject to sampling variability. The sampling error (or standard error) provides a measure of the range within which a sample estimate can be expected to fall a certain proportion of the time. For example, it may be estimated that 7 percent of all elementary mathematics lessons involve the use of computers. If it is determined that the sampling error for this estimate was 1 percent, then, according to the Central Limit Theorem, 95 percent of all possible samples of that same size selected in the same way would yield computer usage estimates between 5 percent and 9 percent (that is, 7 percent ± 2 standard error units). In survey research, the decision to obtain information from a sample rather than from the entire population is made in the interest of reducing costs, in terms of both money and the burden on the population to be surveyed. The particular sample design chosen is the one that is expected to yield the most accurate information for the least cost. It is important to realize that, other things being equal, estimates based on small sample sizes are subject to larger standard errors than those based on large samples. Also, for the same sample design and sample size, the closer a percentage is to zero or 100, the smaller the standard error. The standard errors for the estimates presented in this report are included in parentheses in the tables. The narrative sections of the report generally point out only those differences that are substantial as well as statistically significant at the 0.05 level.2 All population estimates presented in this report were computed using weighted data. Instrument Development As one purpose of the 2012 National Survey was to identify trends in science and mathematics education, the process of developing survey instruments began with the questionnaires that had been used in the earlier national surveys, in 1977, 1985–86, 1993, and 2000. The project Advisory Board, comprised of experienced researchers in science and mathematics education, reviewed these questionnaires and made recommendations about retaining or deleting particular items. Additional items needed to provide important information about the current status of science and mathematics education were also considered.
1 The aim of non-response adjustments is to reduce possible bias by distributing the non-respondents’ weights among the respondents expected to be most similar to these non-respondents. In this study, adjustment was made by region, school metro status, grade level, type (public, catholic, other private), and percent minority enrollment. 2 The False Discovery Rate was used to control the Type I error rate when comparing multiple groups on the same outcome. Benjamini, Y. and Hochberg, Y. (1995). Controlling the false discovery rate: A practical and powerful approach to multiple testing. Journal of the Royal Statistical Society, B, 57, 289–300.
Horizon Research, Inc. 4 February 2013
Preliminary drafts of the questionnaires were sent to a number of professional organizations for review; these included the National Science Teachers Association, the National Council of Teachers of Mathematics, the National Education Association, the American Federation of Teachers, and the National Catholic Education Association. The survey instruments were revised based on feedback from the various reviewers, field tested, and revised again. The instrument development process was a lengthy one, constantly compromising between information needs and data collection constraints. There were several iterations, including rounds of cognitive interviews with teachers and revision to help ensure that individual items were clear and unambiguous and that the survey as a whole would provide the necessary information with the least possible burden on participants. Copies of the questionnaires are included in Appendix B. Data Collection HRI secured permission for the study from education officials at various levels. First, notification letters were mailed to the Chief State School Officers. Similar letters were subsequently mailed to superintendents of districts including sampled public schools and diocesan offices of sampled Catholic schools, identifying the schools in the district/diocese that had been selected for the survey. (Information about this pre-survey mail-out is included in Appendix C.) Copies of the survey instruments and additional information about the study were provided when requested. Principals were asked to log onto the study website and designate a school contact person or “school coordinator.” The school coordinator designation page was designed to confirm the principal’s contact information, as well as to obtain the name, title, phone number, and email address of the coordinator. Of the 2,000 target slots, 1,504 schools were successfully recruited and 35 were ineligible (e.g., closed or merged with another school) for a response rate of 77 percent. An incentive system was developed to encourage school and teacher participation in the survey. School coordinators were offered an honorarium of up to $200 ($100 for completing a teacher list and school questionnaire, $15 for completing each program questionnaire (optional), and $10 for each completed teacher questionnaire). Teachers were offered a $25 honorarium for completing the teacher questionnaire. Survey invitation letters were mailed to teachers beginning in February 2012. In addition to the incentives described, phone calls and emails to school coordinators were used to encourage non-respondents to complete the questionnaires. In May 2012, a final questionnaire invitation mailing was sent to teachers who had not yet completed their questionnaires. The teacher response rate was 77 percent. The response rate for the school program questionnaires was 83 percent. A detailed description of the data collection procedures is included in Appendix D.

Horizon Research, Inc. 5 February 2013
Outline of This Report This report of the 2012 National Survey is organized into major topical areas. In most cases, results are presented for groups of teachers categorized by grade level—elementary, middle, and high. In addition, factor analysis was used to create several composite variables related to key constructs measured on the questionnaires. Composite variables, which are more reliable than individual survey items, were computed to have a minimum possible value of 0 and a maximum possible value of 100. The definitions of these and other reporting variables used in this report are included in Appendix E. Chapter Two focuses on science and mathematics teacher backgrounds and beliefs. Basic demographic data are presented along with information about course background, perceptions of preparedness, and pedagogical beliefs. Chapter Three examines data on the professional status of teachers, including their opportunities for continued professional development. Chapter Four presents information about the time spent on science and mathematics instruction in the elementary grades, and about science and mathematics course offerings at the secondary level. Chapter Five examines the instructional objectives of science and mathematics classes, and the activities used to achieve these objectives, followed by a discussion of the availability and use of various types of instructional resources in Chapter Six. Finally, Chapter Seven presents data about a number of factors that are likely to affect science and mathematics instruction, including school-wide programs, practices, and problems. In addition, each chapter contains a set of “equity tables.” These tables show the distribution of key outcomes across schools and classes of different demographic characteristics. For these tables, data from the program questionnaires are examined by four school-level factors: percentage of students eligible for free/reduced-price lunch (FRL), school size, community type, and region. Data from the teacher questionnaires were examined by an additional two factors: prior achievement level of students in the randomly selected class, and percentage of non-Asian minority students in the randomly selected class. Although the specific equity factors displayed in the body of the report vary by outcome, tables showing each examined outcome by all relevant equity factors are included in Appendix F.

Horizon Research, Inc. 6 February 2013

Horizon Research, Inc. 7 February 2013
CHAPTER TWO
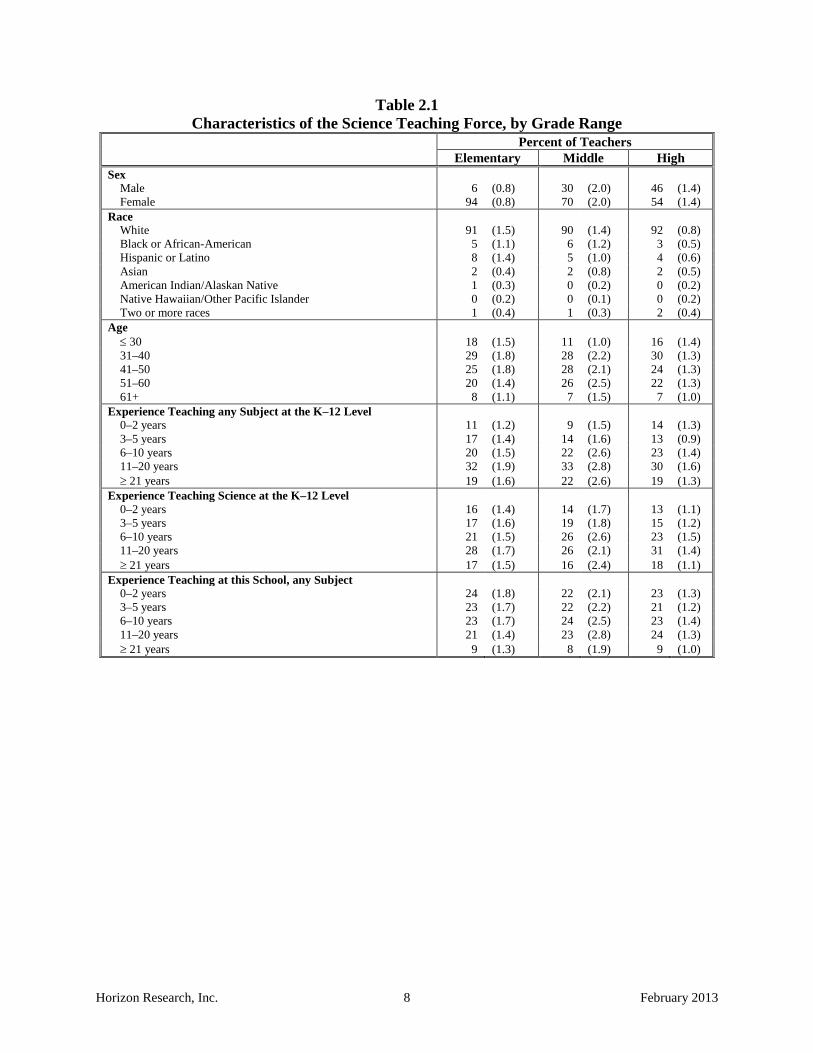
Teacher Background and Beliefs Overview A well-prepared teaching force is essential for effective science and mathematics education. This chapter provides data about the nation’s science and mathematics teachers, including their age, gender, race/ethnicity, teaching experience, and course backgrounds. Teacher Characteristics As can be seen in Tables 2.1 and 2.2, the vast majority of science and mathematics teachers at the elementary level are female. The proportion of science/mathematics teachers who are female decreases as grade level increases, to roughly half at the high school level. In contrast, the teacher experience data—experience teaching any subject at the K–12 level, experience teaching science/mathematics, and experience teaching at the present school—are striking in their similarity by subject and grade range. Black, Hispanic, and other minority teachers continue to be underrepresented in the science and mathematics teaching force; at a time when only 62 percent of the K–12 student enrollment is White and non-Hispanic, roughly 90 percent of science/mathematics teachers in each grade range characterize themselves that way. In addition, the majority of the science/mathematics teaching force is older than 40. It is difficult to predict whether teacher supply will meet demand, as many people who prepare to become teachers do not enter the profession, and others who leave the classroom return at a later date. However, the fact that more than 25 percent of science/mathematics teachers in each grade range are older than 50, and smaller percentages are age 30 or younger, raises concerns about having an adequate supply of science/mathematics teachers in the future.
Horizon Research, Inc. 8 February 2013
Table 2.1 Characteristics of the Science Teaching Force, by Grade Range
Percent of Teachers Elementary Middle High
Sex Male 6 (0.8) 30 (2.0) 46 (1.4) Female 94 (0.8) 70 (2.0) 54 (1.4)
Race White 91 (1.5) 90 (1.4) 92 (0.8) Black or African-American 5 (1.1) 6 (1.2) 3 (0.5) Hispanic or Latino 8 (1.4) 5 (1.0) 4 (0.6) Asian 2 (0.4) 2 (0.8) 2 (0.5) American Indian/Alaskan Native 1 (0.3) 0 (0.2) 0 (0.2) Native Hawaiian/Other Pacific Islander 0 (0.2) 0 (0.1) 0 (0.2) Two or more races 1 (0.4) 1 (0.3) 2 (0.4)
Age ≤ 30 18 (1.5) 11 (1.0) 16 (1.4) 31–40 29 (1.8) 28 (2.2) 30 (1.3) 41–50 25 (1.8) 28 (2.1) 24 (1.3) 51–60 20 (1.4) 26 (2.5) 22 (1.3) 61+ 8 (1.1) 7 (1.5) 7 (1.0)
Experience Teaching any Subject at the K–12 Level 0–2 years 11 (1.2) 9 (1.5) 14 (1.3) 3–5 years 17 (1.4) 14 (1.6) 13 (0.9) 6–10 years 20 (1.5) 22 (2.6) 23 (1.4) 11–20 years 32 (1.9) 33 (2.8) 30 (1.6) ≥ 21 years 19 (1.6) 22 (2.6) 19 (1.3)
Experience Teaching Science at the K–12 Level 0–2 years 16 (1.4) 14 (1.7) 13 (1.1) 3–5 years 17 (1.6) 19 (1.8) 15 (1.2) 6–10 years 21 (1.5) 26 (2.6) 23 (1.5) 11–20 years 28 (1.7) 26 (2.1) 31 (1.4) ≥ 21 years 17 (1.5) 16 (2.4) 18 (1.1)
Experience Teaching at this School, any Subject 0–2 years 24 (1.8) 22 (2.1) 23 (1.3) 3–5 years 23 (1.7) 22 (2.2) 21 (1.2) 6–10 years 23 (1.7) 24 (2.5) 23 (1.4) 11–20 years 21 (1.4) 23 (2.8) 24 (1.3) ≥ 21 years 9 (1.3) 8 (1.9) 9 (1.0)
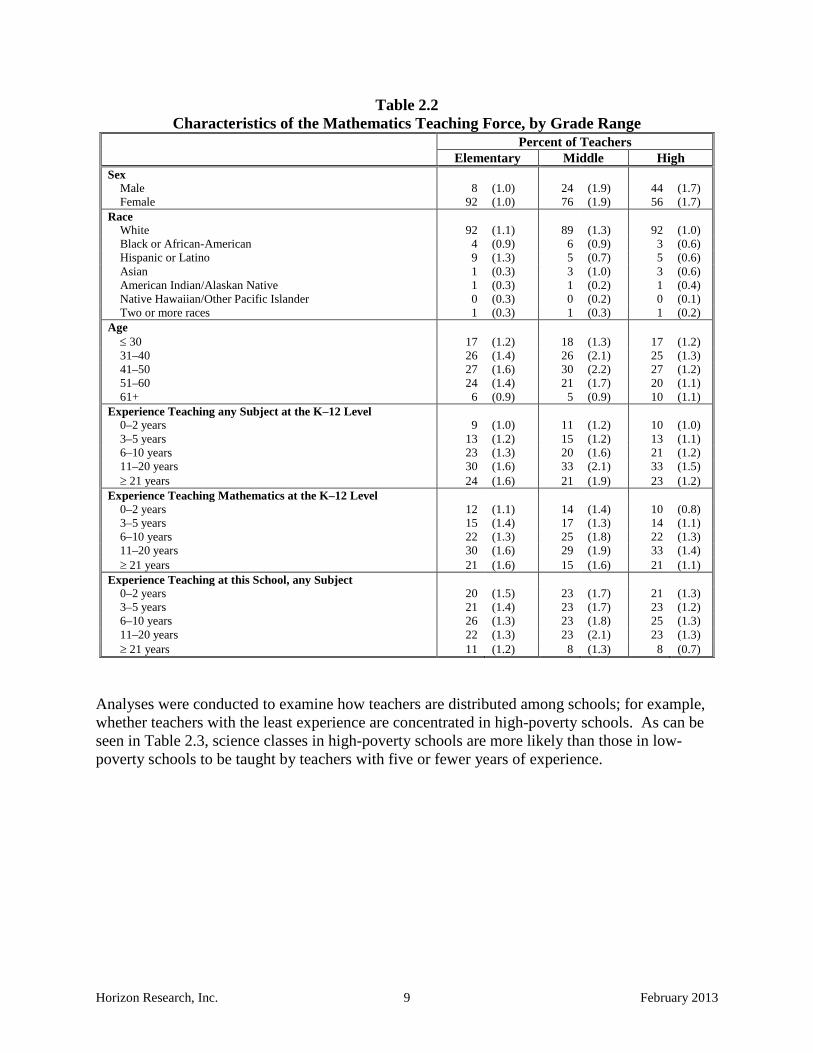
Horizon Research, Inc. 9 February 2013
Table 2.2 Characteristics of the Mathematics Teaching Force, by Grade Range
Percent of Teachers Elementary Middle High
Sex Male 8 (1.0) 24 (1.9) 44 (1.7) Female 92 (1.0) 76 (1.9) 56 (1.7)
Race White 92 (1.1) 89 (1.3) 92 (1.0) Black or African-American 4 (0.9) 6 (0.9) 3 (0.6) Hispanic or Latino 9 (1.3) 5 (0.7) 5 (0.6) Asian 1 (0.3) 3 (1.0) 3 (0.6) American Indian/Alaskan Native 1 (0.3) 1 (0.2) 1 (0.4) Native Hawaiian/Other Pacific Islander 0 (0.3) 0 (0.2) 0 (0.1) Two or more races 1 (0.3) 1 (0.3) 1 (0.2)
Age ≤ 30 17 (1.2) 18 (1.3) 17 (1.2) 31–40 26 (1.4) 26 (2.1) 25 (1.3) 41–50 27 (1.6) 30 (2.2) 27 (1.2) 51–60 24 (1.4) 21 (1.7) 20 (1.1) 61+ 6 (0.9) 5 (0.9) 10 (1.1)
Experience Teaching any Subject at the K–12 Level 0–2 years 9 (1.0) 11 (1.2) 10 (1.0) 3–5 years 13 (1.2) 15 (1.2) 13 (1.1) 6–10 years 23 (1.3) 20 (1.6) 21 (1.2) 11–20 years 30 (1.6) 33 (2.1) 33 (1.5) ≥ 21 years 24 (1.6) 21 (1.9) 23 (1.2)
Experience Teaching Mathematics at the K–12 Level 0–2 years 12 (1.1) 14 (1.4) 10 (0.8) 3–5 years 15 (1.4) 17 (1.3) 14 (1.1) 6–10 years 22 (1.3) 25 (1.8) 22 (1.3) 11–20 years 30 (1.6) 29 (1.9) 33 (1.4) ≥ 21 years 21 (1.6) 15 (1.6) 21 (1.1)
Experience Teaching at this School, any Subject 0–2 years 20 (1.5) 23 (1.7) 21 (1.3) 3–5 years 21 (1.4) 23 (1.7) 23 (1.2) 6–10 years 26 (1.3) 23 (1.8) 25 (1.3) 11–20 years 22 (1.3) 23 (2.1) 23 (1.3) ≥ 21 years 11 (1.2) 8 (1.3) 8 (0.7)
Analyses were conducted to examine how teachers are distributed among schools; for example, whether teachers with the least experience are concentrated in high-poverty schools. As can be seen in Table 2.3, science classes in high-poverty schools are more likely than those in low-poverty schools to be taught by teachers with five or fewer years of experience.

Horizon Research, Inc. 10 February 2013
Table 2.3 Classes Taught by Teachers with Varying Experience Teaching Subject,
by Subject and Proportion of Students Eligible for Free/Reduced-Price Lunch Percent of Classes
Lowest Quartile
Second Quartile
Third Quartile
Highest Quartile
Experience Teaching Science 0–2 years 10 (1.3) 11 (1.4) 16 (1.7) 23 (2.6) 3–5 years 15 (1.8) 16 (2.0) 16 (1.7) 22 (2.5) 6–10 years 26 (2.3) 23 (2.0) 21 (2.0) 23 (2.1) 11–20 years 34 (2.5) 30 (1.9) 30 (2.0) 21 (2.2) ≥ 21 years 15 (1.6) 20 (2.2) 17 (1.6) 11 (1.4)
Experience Teaching Mathematics 0–2 years 12 (2.2) 12 (1.0) 12 (1.4) 14 (1.6) 3–5 years 13 (1.4) 13 (1.4) 16 (1.8) 19 (1.9) 6–10 years 24 (1.9) 24 (1.7) 22 (1.8) 21 (1.7) 11–20 years 30 (2.1) 32 (2.0) 30 (1.8) 31 (2.1) ≥ 21 years 22 (2.0) 19 (1.5) 21 (1.6) 15 (1.6)
Table 2.4 shows the percentage of classes taught by non-Asian minority teachers by the proportion of non-Asian minority students in the class. Note that in both science and mathematics, classes in the highest quartile in terms of students from underrepresented groups are more likely than those in the lowest quartile to be taught by teachers from underrepresented groups.
Table 2.4 Classes Taught by Non-Asian Minority Teachers,
by Subject and Proportion of Non-Asian Minority Students in Class Percent of Classes
Science Mathematics Lowest Quartile of Non-Asian Minority Students 3 (0.8) 1 (0.5) Second Quartile of Non-Asian Minority Students 3 (0.9) 4 (0.7) Third Quartile of Non-Asian Minority Students 7 (1.0) 12 (1.7) Highest Quartile of Non-Asian Minority Students 34 (2.5) 33 (2.7)
Teacher Preparation In order to help students learn science/mathematics content, teachers must themselves have a firm grasp of the important ideas in the discipline. Because direct measures of teachers’ content knowledge were not feasible in this study, the survey used a number of proxy measures, including teachers’ major areas of study and courses completed. As can be seen in Table 2.5, very few teachers of science/mathematics at the elementary level have college or graduate degrees in these disciplines. The percentage of teachers with one or more degrees in science/mathematics increases with increasing grade range, with 52 percent of high school mathematics teachers and 61 percent of high school science teachers having a major in their discipline. If the definition of degree in discipline is expanded to include degrees in
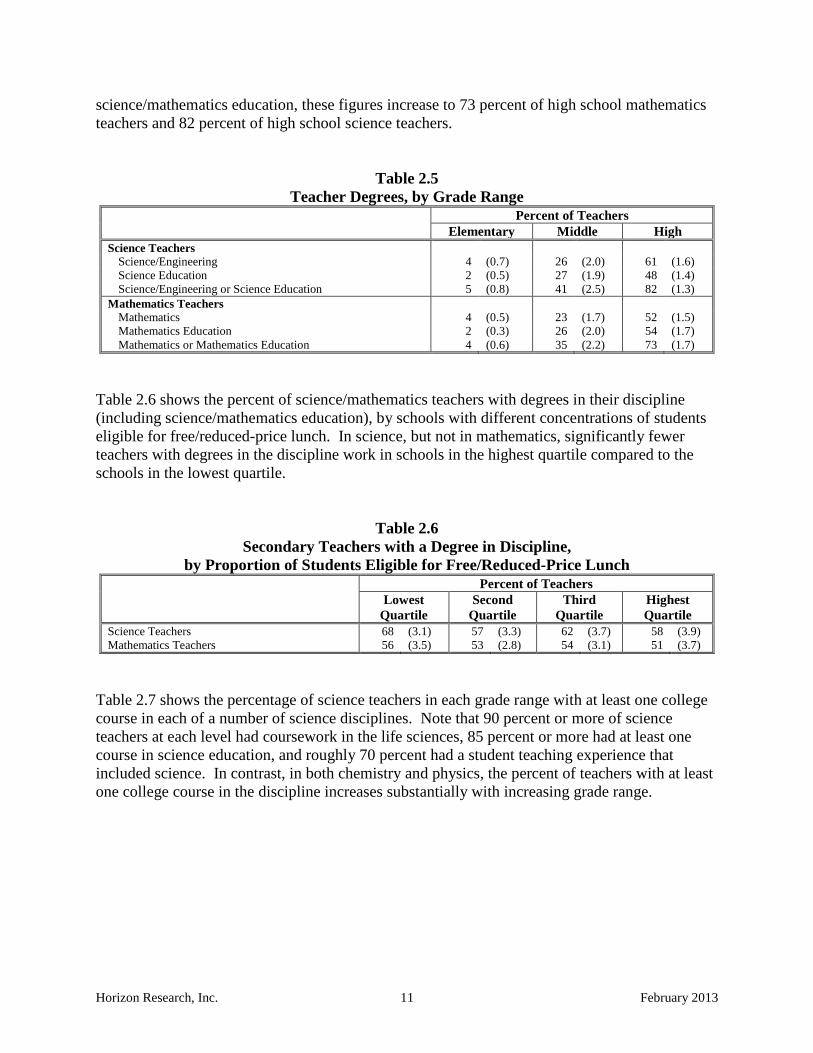
Horizon Research, Inc. 11 February 2013
science/mathematics education, these figures increase to 73 percent of high school mathematics teachers and 82 percent of high school science teachers.
Table 2.5 Teacher Degrees, by Grade Range
Percent of Teachers Elementary Middle High Science Teachers
Science/Engineering 4 (0.7) 26 (2.0) 61 (1.6) Science Education 2 (0.5) 27 (1.9) 48 (1.4) Science/Engineering or Science Education 5 (0.8) 41 (2.5) 82 (1.3)
Mathematics Teachers Mathematics 4 (0.5) 23 (1.7) 52 (1.5) Mathematics Education 2 (0.3) 26 (2.0) 54 (1.7) Mathematics or Mathematics Education 4 (0.6) 35 (2.2) 73 (1.7)
Table 2.6 shows the percent of science/mathematics teachers with degrees in their discipline (including science/mathematics education), by schools with different concentrations of students eligible for free/reduced-price lunch. In science, but not in mathematics, significantly fewer teachers with degrees in the discipline work in schools in the highest quartile compared to the schools in the lowest quartile.
Table 2.6 Secondary Teachers with a Degree in Discipline,
by Proportion of Students Eligible for Free/Reduced-Price Lunch Percent of Teachers Lowest
Quartile Second
Quartile Third
Quartile Highest Quartile
Science Teachers 68 (3.1) 57 (3.3) 62 (3.7) 58 (3.9) Mathematics Teachers 56 (3.5) 53 (2.8) 54 (3.1) 51 (3.7)
Table 2.7 shows the percentage of science teachers in each grade range with at least one college course in each of a number of science disciplines. Note that 90 percent or more of science teachers at each level had coursework in the life sciences, 85 percent or more had at least one course in science education, and roughly 70 percent had a student teaching experience that included science. In contrast, in both chemistry and physics, the percent of teachers with at least one college course in the discipline increases substantially with increasing grade range.
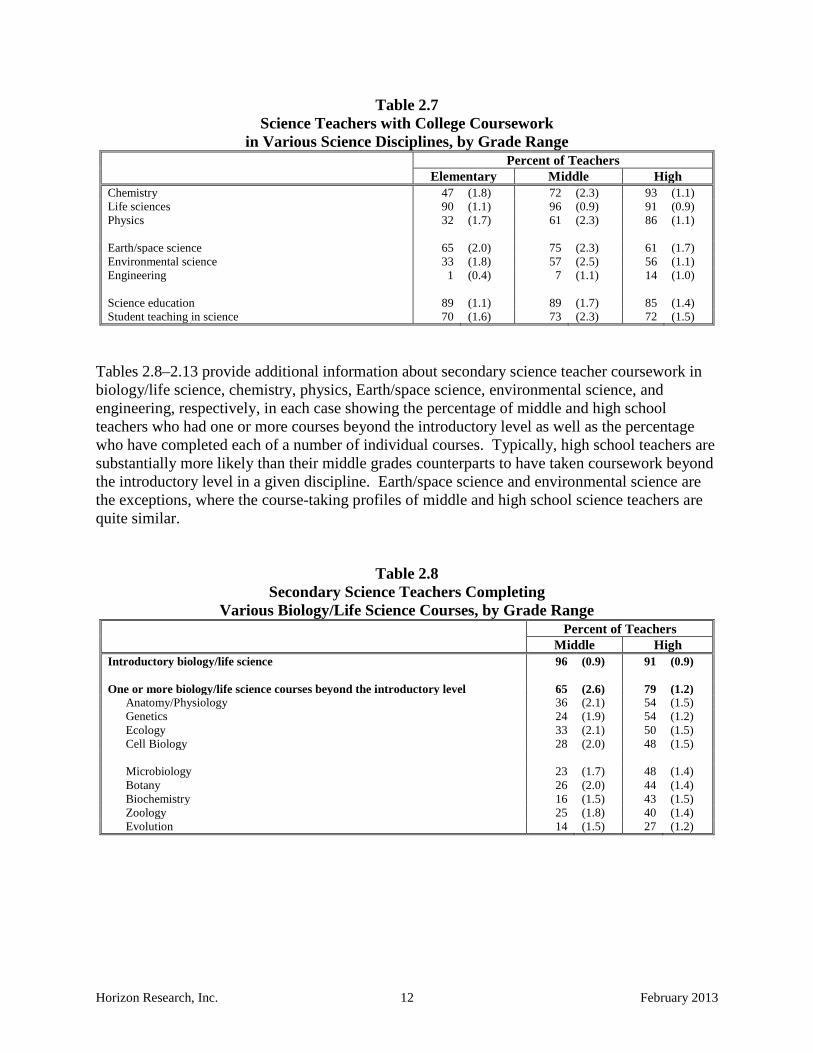
Horizon Research, Inc. 12 February 2013
Table 2.7 Science Teachers with College Coursework
in Various Science Disciplines, by Grade Range Percent of Teachers Elementary Middle High Chemistry 47 (1.8) 72 (2.3) 93 (1.1) Life sciences 90 (1.1) 96 (0.9) 91 (0.9) Physics 32 (1.7) 61 (2.3) 86 (1.1) Earth/space science 65 (2.0) 75 (2.3) 61 (1.7) Environmental science 33 (1.8) 57 (2.5) 56 (1.1) Engineering 1 (0.4) 7 (1.1) 14 (1.0) Science education 89 (1.1) 89 (1.7) 85 (1.4) Student teaching in science 70 (1.6) 73 (2.3) 72 (1.5)
Tables 2.8–2.13 provide additional information about secondary science teacher coursework in biology/life science, chemistry, physics, Earth/space science, environmental science, and engineering, respectively, in each case showing the percentage of middle and high school teachers who had one or more courses beyond the introductory level as well as the percentage who have completed each of a number of individual courses. Typically, high school teachers are substantially more likely than their middle grades counterparts to have taken coursework beyond the introductory level in a given discipline. Earth/space science and environmental science are the exceptions, where the course-taking profiles of middle and high school science teachers are quite similar.
Table 2.8 Secondary Science Teachers Completing
Various Biology/Life Science Courses, by Grade Range Percent of Teachers Middle High Introductory biology/life science 96 (0.9) 91 (0.9) One or more biology/life science courses beyond the introductory level 65 (2.6) 79 (1.2)
Anatomy/Physiology 36 (2.1) 54 (1.5) Genetics 24 (1.9) 54 (1.2) Ecology 33 (2.1) 50 (1.5) Cell Biology 28 (2.0) 48 (1.5) Microbiology 23 (1.7) 48 (1.4) Botany 26 (2.0) 44 (1.4) Biochemistry 16 (1.5) 43 (1.5) Zoology 25 (1.8) 40 (1.4) Evolution 14 (1.5) 27 (1.2)

Horizon Research, Inc. 13 February 2013
Table 2.9 Secondary Science Teachers Completing
Various Chemistry Courses, by Grade Range Percent of Teachers Middle High Introductory chemistry 72 (2.3) 93 (1.1) One or more chemistry courses beyond the introductory level 35 (2.3) 74 (1.3)
Organic Chemistry 25 (2.0) 64 (1.5) Inorganic Chemistry 17 (1.7) 46 (1.7) Biochemistry 14 (1.4) 40 (1.4) Analytical Chemistry 7 (1.3) 29 (1.5) Physical Chemistry 11 (1.1) 26 (1.4) Quantum Chemistry 2 (0.6) 8 (0.8)
Table 2.10 Secondary Science Teachers Completing
Various Physics Courses, by Grade Range Percent of Teachers Middle High Introductory physics 61 (2.3) 86 (1.1) One or more physics courses beyond the introductory level 15 (1.5) 36 (1.6)
Mechanics 6 (1.1) 22 (1.1) Electricity and Magnetism 8 (1.2) 21 (1.1) Heat and Thermodynamics 6 (0.8) 21 (1.1) Modern or Quantum Physics 3 (0.5) 16 (1.0) Optics 3 (0.5) 13 (1.1) Nuclear Physics 1 (0.3) 9 (0.8)
Table 2.11 Secondary Science Teachers Completing
Various Earth/Space Science Courses, by Grade Range Percent of Teachers Middle High Introductory Earth/space science 75 (2.3) 61 (1.7) One or more Earth/space science courses beyond the introductory level 28 (1.8) 30 (1.4)
Geology 22 (1.6) 23 (1.2) Astronomy 16 (1.3) 17 (1.1) Physical Geography 14 (1.2) 11 (0.9) Meteorology 9 (1.0) 11 (1.0) Oceanography 10 (1.4) 10 (0.9)

Horizon Research, Inc. 14 February 2013
Table 2.12 Secondary Science Teachers Completing
Various Environmental Science Courses, by Grade Range Percent of Teachers Middle High Introductory environmental science 57 (2.5) 56 (1.1) One or more environmental science courses beyond the introductory level 23 (1.7) 27 (1.3)
Ecology 17 (1.6) 21 (1.3) Conservation Biology 8 (1.1) 10 (1.0) Oceanography 6 (0.8) 9 (0.9) Hydrology 4 (0.8) 5 (0.6) Forestry 3 (0.6) 5 (0.6) Toxicology 2 (0.4) 3 (0.5)
Table 2.13 Secondary Science Teachers Completing
Various Engineering Courses, by Grade Range Percent of Teachers Middle High One or more engineering courses 7 (1.1) 14 (1.0)
Mechanical Engineering 1 (0.4) 5 (0.6) Electrical Engineering 2 (0.6) 4 (0.6) Chemical Engineering 1 (0.5) 3 (0.4) Computer Engineering 1 (0.3) 3 (0.6) Civil Engineering 1 (0.4) 2 (0.4) Bioengineering/Biomedical Engineering 1 (0.2) 1 (0.2) Industrial/Manufacturing Engineering 1 (0.2) 1 (0.3) Aerospace Engineering 0 (0.2) 1 (0.3)
In addition to asking teachers about the types of science/mathematics courses they had completed in college, the 2012 National Survey asked teachers how many of those courses they had taken at two-year institutions, including community colleges and technical schools, and how many at four-year colleges/universities. As can be seen in Table 2.14, similar proportions of teachers in the various subject/grade-range categories have taken at least some disciplinary courses at two-year institutions. The extent to which those teachers completed their science/mathematics coursework at two-year institutions varied considerably by grade range, with the proportion of courses taken decreasing with increasing grade level (see Table 2.15).
Table 2.14 Teachers Completing at Least One Course
in Their Field at Two-Year Institutions, by Grade Range Percent of Teachers Elementary Middle High Science 33 (2.4) 35 (3.0) 31 (2.2) Mathematics 35 (2.5) 28 (2.6) 31 (2.0)
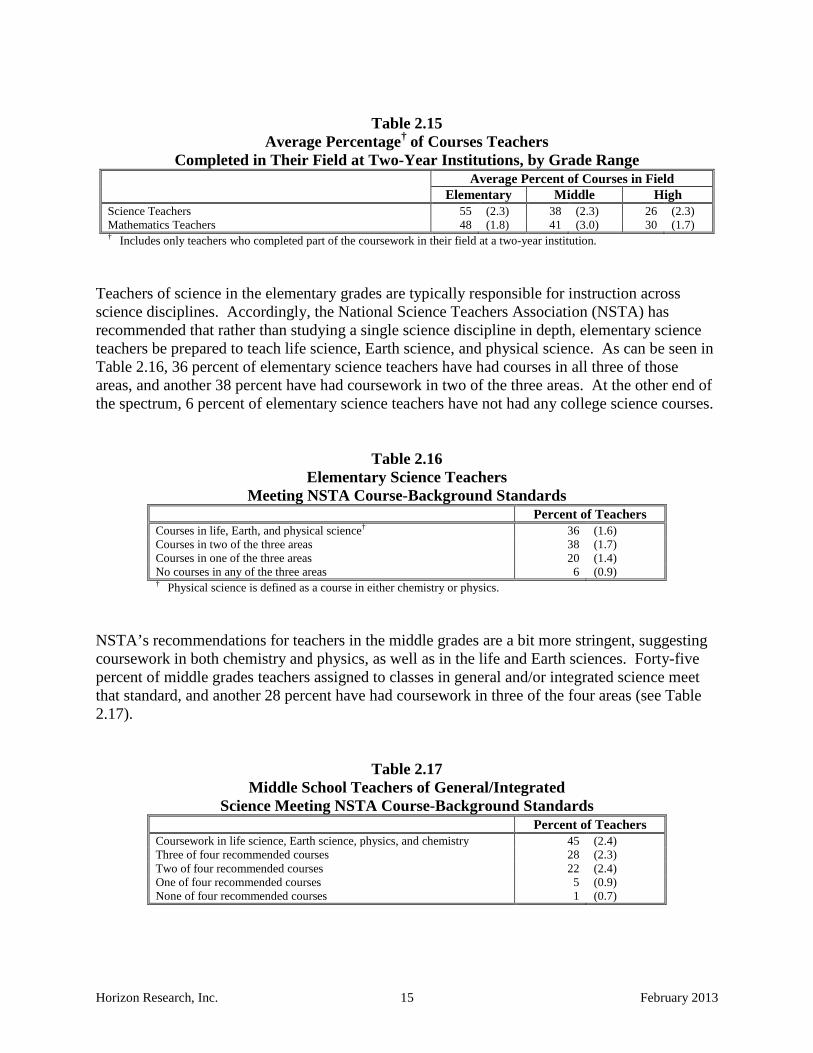
Horizon Research, Inc. 15 February 2013
Table 2.15
Average Percentage† of Courses Teachers Completed in Their Field at Two-Year Institutions, by Grade Range
Average Percent of Courses in Field Elementary Middle High Science Teachers 55 (2.3) 38 (2.3) 26 (2.3) Mathematics Teachers 48 (1.8) 41 (3.0) 30 (1.7) † Includes only teachers who completed part of the coursework in their field at a two-year institution.
Teachers of science in the elementary grades are typically responsible for instruction across science disciplines. Accordingly, the National Science Teachers Association (NSTA) has recommended that rather than studying a single science discipline in depth, elementary science teachers be prepared to teach life science, Earth science, and physical science. As can be seen in Table 2.16, 36 percent of elementary science teachers have had courses in all three of those areas, and another 38 percent have had coursework in two of the three areas. At the other end of the spectrum, 6 percent of elementary science teachers have not had any college science courses.
Table 2.16 Elementary Science Teachers
Meeting NSTA Course-Background Standards Percent of Teachers
Courses in life, Earth, and physical science† 36 (1.6) Courses in two of the three areas 38 (1.7) Courses in one of the three areas 20 (1.4) No courses in any of the three areas 6 (0.9) † Physical science is defined as a course in either chemistry or physics.
NSTA’s recommendations for teachers in the middle grades are a bit more stringent, suggesting coursework in both chemistry and physics, as well as in the life and Earth sciences. Forty-five percent of middle grades teachers assigned to classes in general and/or integrated science meet that standard, and another 28 percent have had coursework in three of the four areas (see Table 2.17).
Table 2.17 Middle School Teachers of General/Integrated
Science Meeting NSTA Course-Background Standards Percent of Teachers
Coursework in life science, Earth science, physics, and chemistry 45 (2.4) Three of four recommended courses 28 (2.3) Two of four recommended courses 22 (2.4) One of four recommended courses 5 (0.9) None of four recommended courses 1 (0.7)
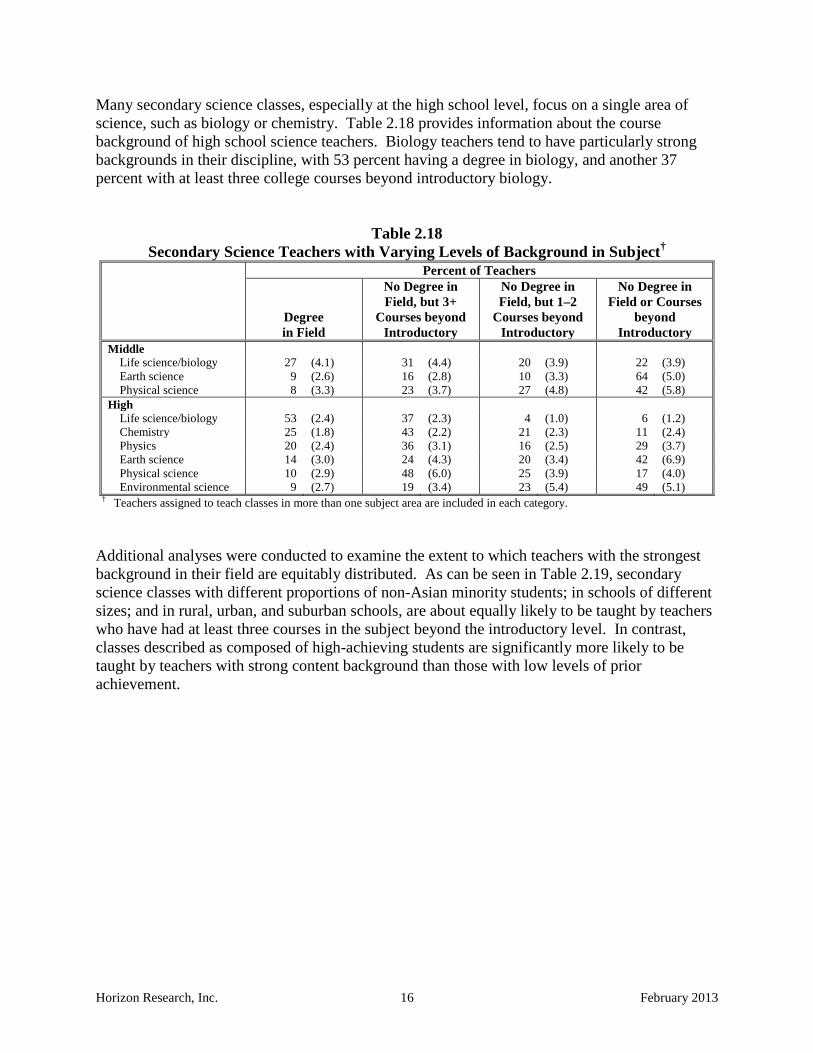
Horizon Research, Inc. 16 February 2013
Many secondary science classes, especially at the high school level, focus on a single area of science, such as biology or chemistry. Table 2.18 provides information about the course background of high school science teachers. Biology teachers tend to have particularly strong backgrounds in their discipline, with 53 percent having a degree in biology, and another 37 percent with at least three college courses beyond introductory biology.
Table 2.18 Secondary Science Teachers with Varying Levels of Background in Subject†
Percent of Teachers
Degree in Field
No Degree in Field, but 3+
Courses beyond Introductory
No Degree in Field, but 1–2
Courses beyond Introductory
No Degree in Field or Courses
beyond Introductory
Middle Life science/biology 27 (4.1) 31 (4.4) 20 (3.9) 22 (3.9) Earth science 9 (2.6) 16 (2.8) 10 (3.3) 64 (5.0) Physical science 8 (3.3) 23 (3.7) 27 (4.8) 42 (5.8)
High Life science/biology 53 (2.4) 37 (2.3) 4 (1.0) 6 (1.2) Chemistry 25 (1.8) 43 (2.2) 21 (2.3) 11 (2.4) Physics 20 (2.4) 36 (3.1) 16 (2.5) 29 (3.7) Earth science 14 (3.0) 24 (4.3) 20 (3.4) 42 (6.9) Physical science 10 (2.9) 48 (6.0) 25 (3.9) 17 (4.0) Environmental science 9 (2.7) 19 (3.4) 23 (5.4) 49 (5.1)
† Teachers assigned to teach classes in more than one subject area are included in each category. Additional analyses were conducted to examine the extent to which teachers with the strongest background in their field are equitably distributed. As can be seen in Table 2.19, secondary science classes with different proportions of non-Asian minority students; in schools of different sizes; and in rural, urban, and suburban schools, are about equally likely to be taught by teachers who have had at least three courses in the subject beyond the introductory level. In contrast, classes described as composed of high-achieving students are significantly more likely to be taught by teachers with strong content background than those with low levels of prior achievement.
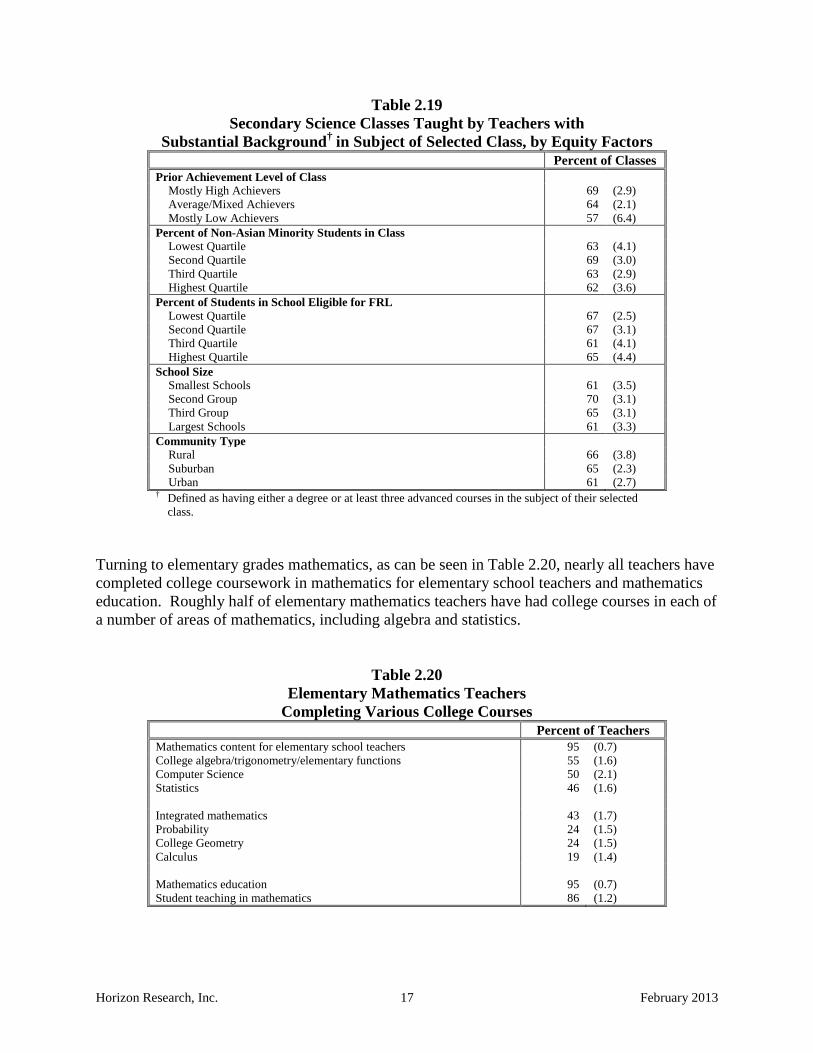
Horizon Research, Inc. 17 February 2013
Table 2.19 Secondary Science Classes Taught by Teachers with
Substantial Background† in Subject of Selected Class, by Equity Factors Percent of Classes Prior Achievement Level of Class
Mostly High Achievers 69 (2.9) Average/Mixed Achievers 64 (2.1) Mostly Low Achievers 57 (6.4)
Percent of Non-Asian Minority Students in Class Lowest Quartile 63 (4.1) Second Quartile 69 (3.0) Third Quartile 63 (2.9) Highest Quartile 62 (3.6)
Percent of Students in School Eligible for FRL Lowest Quartile 67 (2.5) Second Quartile 67 (3.1) Third Quartile 61 (4.1) Highest Quartile 65 (4.4)
School Size Smallest Schools 61 (3.5) Second Group 70 (3.1) Third Group 65 (3.1) Largest Schools 61 (3.3)
Community Type Rural 66 (3.8) Suburban 65 (2.3) Urban 61 (2.7)
† Defined as having either a degree or at least three advanced courses in the subject of their selected class.
Turning to elementary grades mathematics, as can be seen in Table 2.20, nearly all teachers have completed college coursework in mathematics for elementary school teachers and mathematics education. Roughly half of elementary mathematics teachers have had college courses in each of a number of areas of mathematics, including algebra and statistics.
Table 2.20 Elementary Mathematics Teachers
Completing Various College Courses Percent of Teachers
Mathematics content for elementary school teachers 95 (0.7) College algebra/trigonometry/elementary functions 55 (1.6) Computer Science 50 (2.1) Statistics 46 (1.6) Integrated mathematics 43 (1.7) Probability 24 (1.5) College Geometry 24 (1.5) Calculus 19 (1.4) Mathematics education 95 (0.7) Student teaching in mathematics 86 (1.2)

Horizon Research, Inc. 18 February 2013
The National Council of Teachers of Mathematics (NCTM) has recommended that elementary mathematics teachers take college coursework in a number of different areas, including number and operations (for which “mathematics for elementary teachers” can serve as a proxy), algebra, geometry, probability, and statistics. As can be seen in Table 2.21, only 10 percent of elementary mathematics teachers have had courses in each of these areas; the typical elementary teacher has had coursework in only 1 or 2 of these 5 areas.
Table 2.21 Elementary Mathematics Teachers’
Coursework Related to NCTM Course-Background Standards Percent of Teachers
All 5 courses 10 (1.2) 3–4 courses 32 (1.6) 1–2 courses 57 (1.8) No courses 1 (0.3)
Table 2.22 shows the percentage of middle and high school mathematics teachers with coursework in each of a number of areas. Note that nearly all high school mathematics teachers have completed a calculus course, and 79 percent have taken a course in advanced calculus. Similarly, more than 3 out of 4 high school mathematics teachers have had college coursework in linear algebra and in statistics. Other college courses completed by a majority of high school mathematics teachers include abstract algebra, differential equations, axiomatic geometry, analytic geometry, probability, number theory, and discrete mathematics. Substantially fewer teachers at the middle grades have had college coursework in each of these areas.
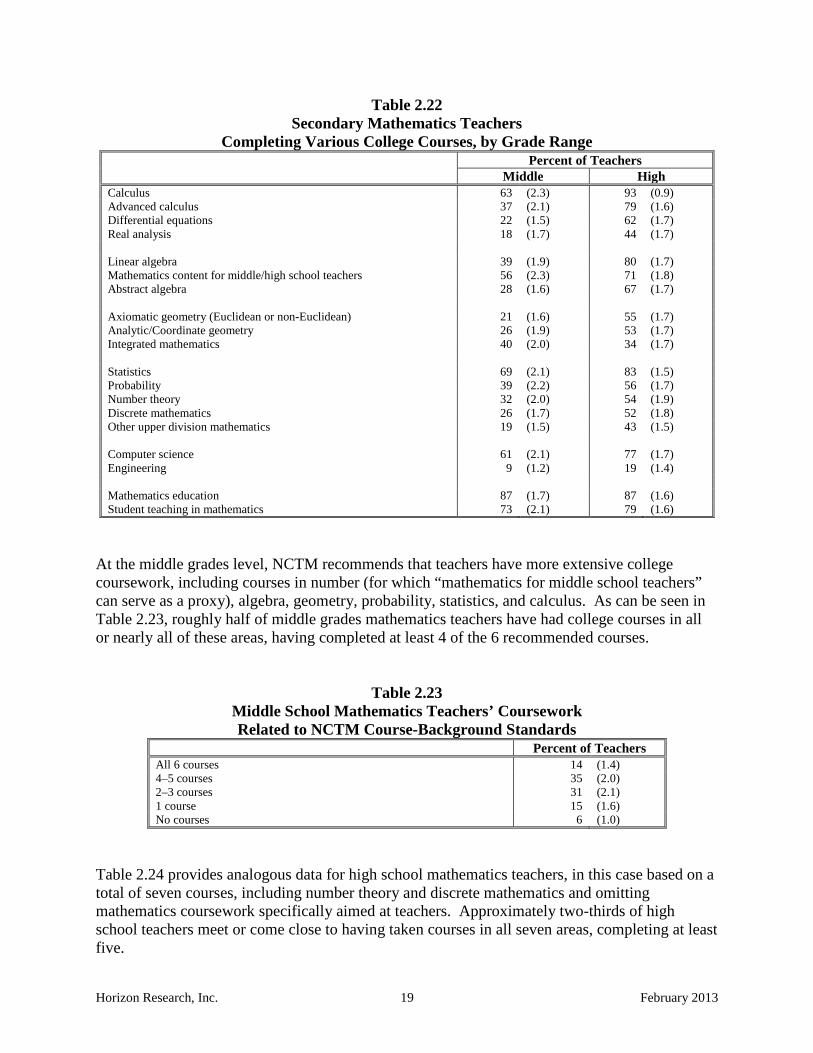
Horizon Research, Inc. 19 February 2013
Table 2.22 Secondary Mathematics Teachers
Completing Various College Courses, by Grade Range Percent of Teachers Middle High Calculus 63 (2.3) 93 (0.9) Advanced calculus 37 (2.1) 79 (1.6) Differential equations 22 (1.5) 62 (1.7) Real analysis 18 (1.7) 44 (1.7) Linear algebra 39 (1.9) 80 (1.7) Mathematics content for middle/high school teachers 56 (2.3) 71 (1.8) Abstract algebra 28 (1.6) 67 (1.7) Axiomatic geometry (Euclidean or non-Euclidean) 21 (1.6) 55 (1.7) Analytic/Coordinate geometry 26 (1.9) 53 (1.7) Integrated mathematics 40 (2.0) 34 (1.7) Statistics 69 (2.1) 83 (1.5) Probability 39 (2.2) 56 (1.7) Number theory 32 (2.0) 54 (1.9) Discrete mathematics 26 (1.7) 52 (1.8) Other upper division mathematics 19 (1.5) 43 (1.5) Computer science 61 (2.1) 77 (1.7) Engineering 9 (1.2) 19 (1.4) Mathematics education 87 (1.7) 87 (1.6) Student teaching in mathematics 73 (2.1) 79 (1.6)
At the middle grades level, NCTM recommends that teachers have more extensive college coursework, including courses in number (for which “mathematics for middle school teachers” can serve as a proxy), algebra, geometry, probability, statistics, and calculus. As can be seen in Table 2.23, roughly half of middle grades mathematics teachers have had college courses in all or nearly all of these areas, having completed at least 4 of the 6 recommended courses.
Table 2.23 Middle School Mathematics Teachers’ Coursework Related to NCTM Course-Background Standards
Percent of Teachers All 6 courses 14 (1.4) 4–5 courses 35 (2.0) 2–3 courses 31 (2.1) 1 course 15 (1.6) No courses 6 (1.0)
Table 2.24 provides analogous data for high school mathematics teachers, in this case based on a total of seven courses, including number theory and discrete mathematics and omitting mathematics coursework specifically aimed at teachers. Approximately two-thirds of high school teachers meet or come close to having taken courses in all seven areas, completing at least five.

Horizon Research, Inc. 20 February 2013
Table 2.24 High School Mathematics Teachers’ Coursework Related to NCTM Course-Background Standards
Percent of Teachers All 7 courses 26 (1.5) 5–6 courses 40 (1.6) 3–4 courses 22 (1.6) 1–2 courses 10 (1.4) No courses 2 (0.7)
Teachers were also asked about their path to certification. As can be seen in Table 2.25, elementary science/mathematics teachers are more likely than those at the high school level to have had an undergraduate program leading to a bachelor’s degree and a teaching credential. In contrast, high school science/mathematics teachers are more likely than their elementary school counterparts to have completed a post-baccalaureate credentialing program that did not include a master’s degree. Ten percent of high school mathematics teachers and eight percent of high school science teachers have not had any formal teacher preparation.
Table 2.25 Teachers’ Paths to Certification, by Subject and Grade Range
Percent of Teachers Elementary Middle High
Science An undergraduate program leading to a bachelor’s degree and a
teaching credential 61 (2.6) 47 (3.6) 34 (2.0) A post-baccalaureate credentialing program (no master’s degree
awarded) 13 (1.8) 23 (2.5) 30 (1.9) A master’s program that also awarded a teaching credential 25 (2.3) 26 (3.1) 28 (1.8) No formal teacher preparation 1 (0.5) 4 (1.5) 8 (1.3)
Mathematics An undergraduate program leading to a bachelor’s degree and a
teaching credential 63 (2.2) 55 (3.1) 48 (2.3) A post-baccalaureate credentialing program (no master’s degree
awarded) 14 (1.9) 17 (2.1) 20 (1.8) A master’s program that also awarded a teaching credential 22 (2.0) 25 (2.7) 22 (1.6) No formal teacher preparation 1 (0.4) 3 (1.1) 10 (1.9)
Teacher Pedagogical Beliefs Teachers were asked about their beliefs regarding effective teaching and learning in science/mathematics. Table 2.26 shows the percentage of science teachers in each grade range agreeing with each of the statements; data for mathematics teachers are shown in Table 2.27. It is interesting to note that elementary, middle, and high school science teachers have similar views about a number of elements of science instruction. More than 85 percent of teachers in each grade range agree that: (1) students should be provided with the purpose for a lesson as it

Horizon Research, Inc. 21 February 2013
begins; (2) most class periods should include review of previously covered material; (3) most class periods should provide students opportunities to share their thinking/reasoning; and (4) most class periods should conclude with a summary of the key ideas addressed in that lesson. A similarly large proportion of science teachers in each grade range believe that inadequacies in students’ science background can be overcome by effective teaching. In contrast, teacher opinions about ability grouping vary considerably by grade range, with 65 percent of high school science teachers, 48 percent of those in the middle grades, and 32 percent at the elementary level indicating that students learn science best in classes with students of similar abilities. There are also inconsistent views in relation to a number of elements of effective science instruction. Approximately three-fourths of teachers at each grade range agree that it is better to focus on ideas in depth, even if it means covering fewer topics, one of the central tenets of calls for reform in science instruction. At the same time, despite research on learning that suggests otherwise,3 roughly 40 percent of science teachers at each grade level agree that teachers should explain an idea to students before having them consider evidence for that idea; and more than half indicate that laboratory activities should be used primarily to reinforce ideas that the students have already learned. And despite recommendations that students develop understanding of concepts first and learn the scientific language later, from 70 to 85 percent of science teachers at the various grade ranges indicate that students should be given definitions for new vocabulary at the beginning of instruction on a science idea.
3 National Research Council. (2005). How students learn: History, mathematics, and science in the classroom. M. S. Donovan and J. D. Bransford, (Eds.) Washington, DC: National Academy Press.

Horizon Research, Inc. 22 February 2013
Table 2.26 Science Teachers Agreeing† with Various
Statements about Teaching and Learning, by Grade Range Percent of Teachers Elementary Middle High Most class periods should provide opportunities for students to share
their thinking and reasoning 98 (0.5) 95 (1.1) 92 (0.9) Most class periods should conclude with a summary of the key ideas
addressed 96 (0.7) 93 (1.1) 88 (1.0) Students should be provided with the purpose for a lesson as it begins 93 (1.0) 90 (1.3) 88 (1.0) Most class periods should include some review of previously covered
ideas and skills 91 (1.1) 89 (1.5) 86 (1.2) Inadequacies in students’ science background can be overcome by
effective teaching 89 (1.2) 89 (1.9) 84 (1.1) It is better for science instruction to focus on ideas in depth, even if that
means covering fewer topics 72 (1.6) 77 (1.9) 73 (1.3) At the beginning of instruction on a science idea, students should be
provided with definitions for new scientific vocabulary that will be used 85 (1.3) 78 (2.1) 70 (1.7)
Students learn science best in classes with students of similar abilities 32 (1.7) 48 (2.3) 65 (1.7) Hands-on/laboratory activities should be used primarily to reinforce a
science idea that the students have already learned 54 (1.9) 57 (2.8) 56 (1.9) Students should be assigned homework most days 38 (2.2) 33 (2.4) 48 (1.4) Teachers should explain an idea to students before having them
consider evidence that relates to the idea 45 (1.9) 41 (2.3) 39 (1.7) † Includes teachers indicating “strongly agree” or “agree” on a 5-point scale ranging from 1 “strongly disagree” to 5 “strongly
agree.” As can be seen in Table 2.27, mathematics teachers share many of the views of their science counterparts, with at least 85 percent of teachers in each grade range agreeing that students should be provided with the purpose for a lesson as it begins and that most class periods should include review, provide students opportunities to share their thinking and reasoning, and conclude with a summary of the key ideas addressed. More than three-fourths of mathematics teachers at each grade range indicate that inadequacies in students’ mathematics background can be overcome by effective teaching. At the same time, 51 percent of elementary mathematics teachers, increasing to 69 percent in the middle grades, and 77 percent at the high school level, indicate that students learn mathematics best in classes with students of similar abilities. As is the case in science, most mathematics teachers agree with the notion of covering fewer ideas in greater depth, but sizeable proportions do not agree with other recommendations for improving mathematics teaching and learning. For example, from 37 to 48 percent of mathematics teachers, depending on grade range, believe that teachers should explain ideas to students before they investigate those ideas. Similarly, from 39 to 52 percent agree that hands-on activities/manipulatives should be used primarily to reinforce ideas the students have already learned, despite recommendations that these be used to help students develop their initial understanding of key concepts. And even larger proportions of mathematics teachers, from 81
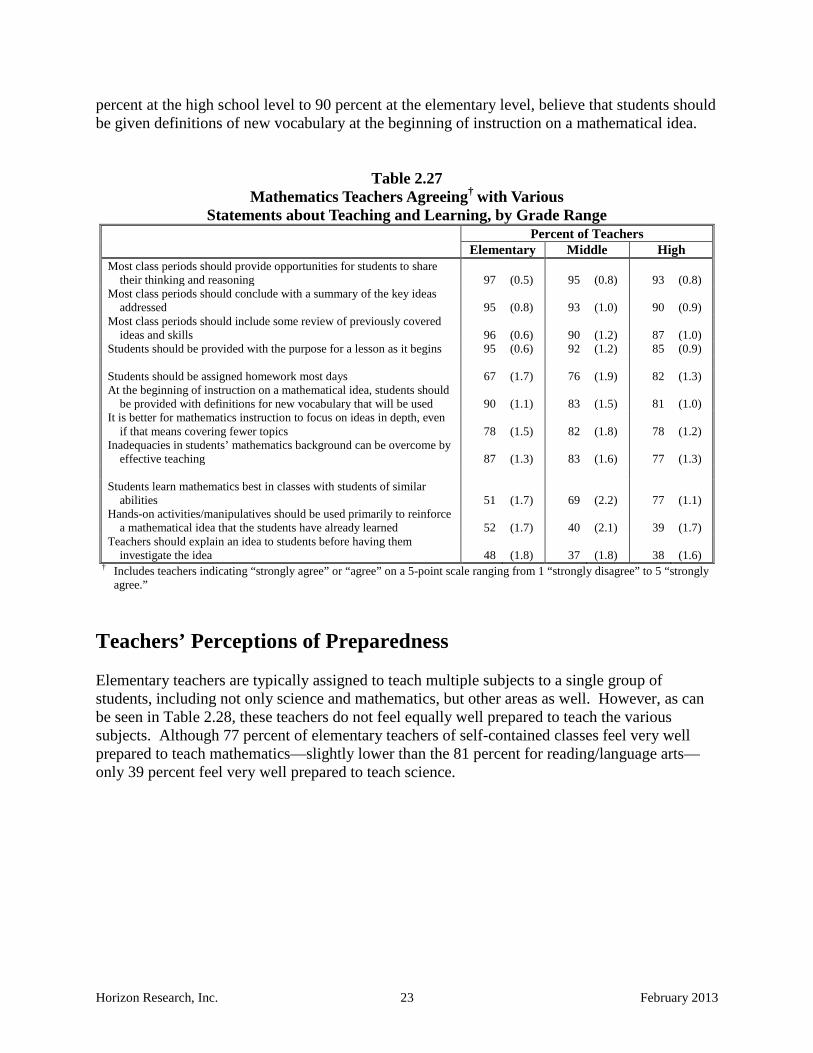
Horizon Research, Inc. 23 February 2013
percent at the high school level to 90 percent at the elementary level, believe that students should be given definitions of new vocabulary at the beginning of instruction on a mathematical idea.
Table 2.27 Mathematics Teachers Agreeing† with Various
Statements about Teaching and Learning, by Grade Range Percent of Teachers Elementary Middle High Most class periods should provide opportunities for students to share
their thinking and reasoning 97 (0.5) 95 (0.8) 93 (0.8) Most class periods should conclude with a summary of the key ideas
addressed 95 (0.8) 93 (1.0) 90 (0.9) Most class periods should include some review of previously covered
ideas and skills 96 (0.6) 90 (1.2) 87 (1.0) Students should be provided with the purpose for a lesson as it begins 95 (0.6) 92 (1.2) 85 (0.9) Students should be assigned homework most days 67 (1.7) 76 (1.9) 82 (1.3) At the beginning of instruction on a mathematical idea, students should
be provided with definitions for new vocabulary that will be used 90 (1.1) 83 (1.5) 81 (1.0) It is better for mathematics instruction to focus on ideas in depth, even
if that means covering fewer topics 78 (1.5) 82 (1.8) 78 (1.2) Inadequacies in students’ mathematics background can be overcome by
effective teaching 87 (1.3) 83 (1.6) 77 (1.3) Students learn mathematics best in classes with students of similar
abilities 51 (1.7) 69 (2.2) 77 (1.1) Hands-on activities/manipulatives should be used primarily to reinforce
a mathematical idea that the students have already learned 52 (1.7) 40 (2.1) 39 (1.7) Teachers should explain an idea to students before having them
investigate the idea 48 (1.8) 37 (1.8) 38 (1.6) † Includes teachers indicating “strongly agree” or “agree” on a 5-point scale ranging from 1 “strongly disagree” to 5 “strongly
agree.” Teachers’ Perceptions of Preparedness Elementary teachers are typically assigned to teach multiple subjects to a single group of students, including not only science and mathematics, but other areas as well. However, as can be seen in Table 2.28, these teachers do not feel equally well prepared to teach the various subjects. Although 77 percent of elementary teachers of self-contained classes feel very well prepared to teach mathematics—slightly lower than the 81 percent for reading/language arts—only 39 percent feel very well prepared to teach science.
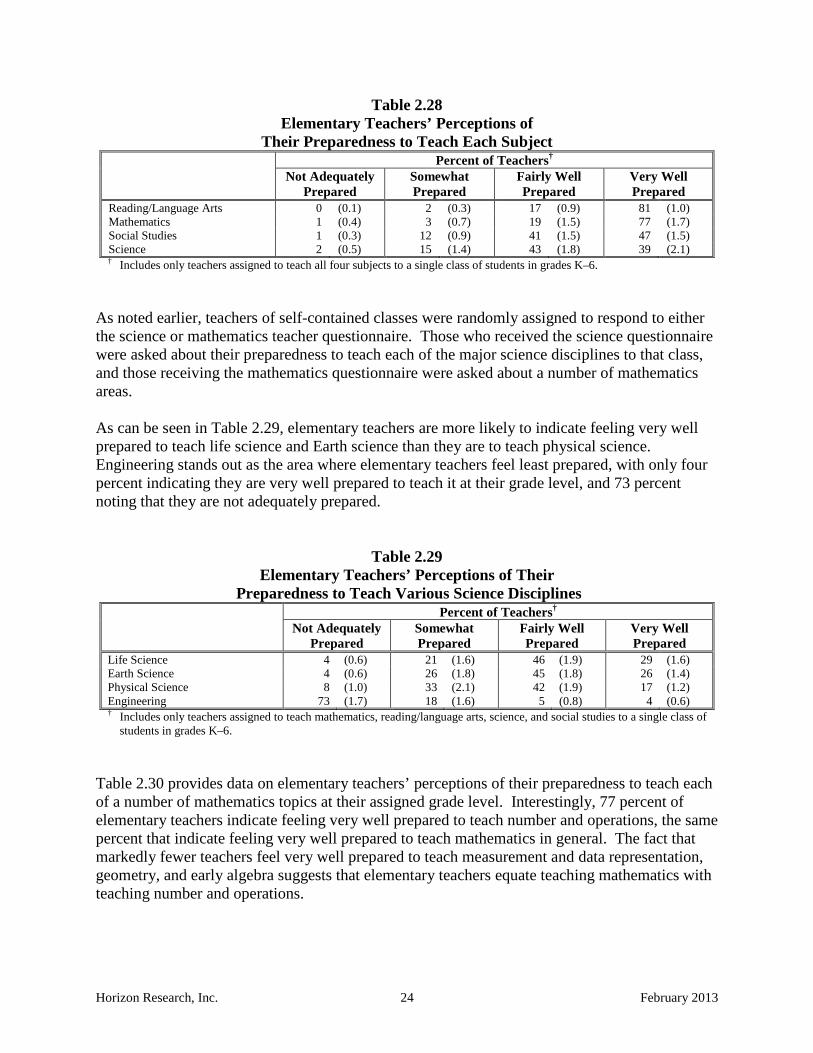
Horizon Research, Inc. 24 February 2013
Table 2.28 Elementary Teachers’ Perceptions of
Their Preparedness to Teach Each Subject Percent of Teachers† Not Adequately
Prepared Somewhat Prepared
Fairly Well Prepared
Very Well Prepared
Reading/Language Arts 0 (0.1) 2 (0.3) 17 (0.9) 81 (1.0) Mathematics 1 (0.4) 3 (0.7) 19 (1.5) 77 (1.7) Social Studies 1 (0.3) 12 (0.9) 41 (1.5) 47 (1.5) Science 2 (0.5) 15 (1.4) 43 (1.8) 39 (2.1) † Includes only teachers assigned to teach all four subjects to a single class of students in grades K–6.
As noted earlier, teachers of self-contained classes were randomly assigned to respond to either the science or mathematics teacher questionnaire. Those who received the science questionnaire were asked about their preparedness to teach each of the major science disciplines to that class, and those receiving the mathematics questionnaire were asked about a number of mathematics areas. As can be seen in Table 2.29, elementary teachers are more likely to indicate feeling very well prepared to teach life science and Earth science than they are to teach physical science. Engineering stands out as the area where elementary teachers feel least prepared, with only four percent indicating they are very well prepared to teach it at their grade level, and 73 percent noting that they are not adequately prepared.
Table 2.29 Elementary Teachers’ Perceptions of Their
Preparedness to Teach Various Science Disciplines Percent of Teachers† Not Adequately
Prepared Somewhat Prepared
Fairly Well Prepared
Very Well Prepared
Life Science 4 (0.6) 21 (1.6) 46 (1.9) 29 (1.6) Earth Science 4 (0.6) 26 (1.8) 45 (1.8) 26 (1.4) Physical Science 8 (1.0) 33 (2.1) 42 (1.9) 17 (1.2) Engineering 73 (1.7) 18 (1.6) 5 (0.8) 4 (0.6) † Includes only teachers assigned to teach mathematics, reading/language arts, science, and social studies to a single class of
students in grades K–6. Table 2.30 provides data on elementary teachers’ perceptions of their preparedness to teach each of a number of mathematics topics at their assigned grade level. Interestingly, 77 percent of elementary teachers indicate feeling very well prepared to teach number and operations, the same percent that indicate feeling very well prepared to teach mathematics in general. The fact that markedly fewer teachers feel very well prepared to teach measurement and data representation, geometry, and early algebra suggests that elementary teachers equate teaching mathematics with teaching number and operations.

Horizon Research, Inc. 25 February 2013
Table 2.30 Elementary Teachers’ Perceptions of Their
Preparedness to Teach Selected Mathematics Topics Percent of Teachers† Not Adequately
Prepared Somewhat Prepared
Fairly Well Prepared
Very Well Prepared
Number and Operations 0 (0.1) 2 (0.4) 21 (1.3) 77 (1.4) Measurement and Data Representation 1 (0.4) 9 (1.1) 33 (1.9) 56 (2.0) Geometry 3 (0.6) 10 (1.0) 33 (1.7) 54 (1.9) Early Algebra 5 (0.7) 13 (1.1) 36 (1.7) 46 (2.0) † Includes only teachers assigned to teach mathematics, reading/language arts, science, and social studies to a single class of
students in grades K–6. As noted earlier, the teacher questionnaires included a series of items about a single, randomly selected class. Middle and high school science teachers were shown a list of topics based on the subject of that class, and asked how well prepared they feel to teach each of those topics at the grade levels they teach. As can be seen in Table 2.31, high school chemistry teachers are more likely to report a high level of preparedness than teachers in any other subject/grade-range group, with 66–83 percent indicating they feel very well prepared to teach the various topics. (It is interesting to note the variation among topics within physics, with only 19 percent of high school physics teachers reporting feeling very well prepared to teach modern physics, e.g., relativity, compared to 43–71 percent for the other topics in the list.) High school biology, chemistry, and physics teachers are more likely than their middle grades counterparts to report feeling very well prepared to teach topics within those disciplines, differences not seen in Earth/space science and environmental science. Finally, fewer than 10 percent of middle and high school science teachers feel very well prepared to teach engineering concepts. This finding is not surprising given that few teachers have had college coursework in engineering (see Table 2.13), and engineering has not traditionally been part of the school curriculum. As the Next Generation Science Standards include engineering concepts for K–12, there will likely be a need for a major professional development effort focused on engineering.
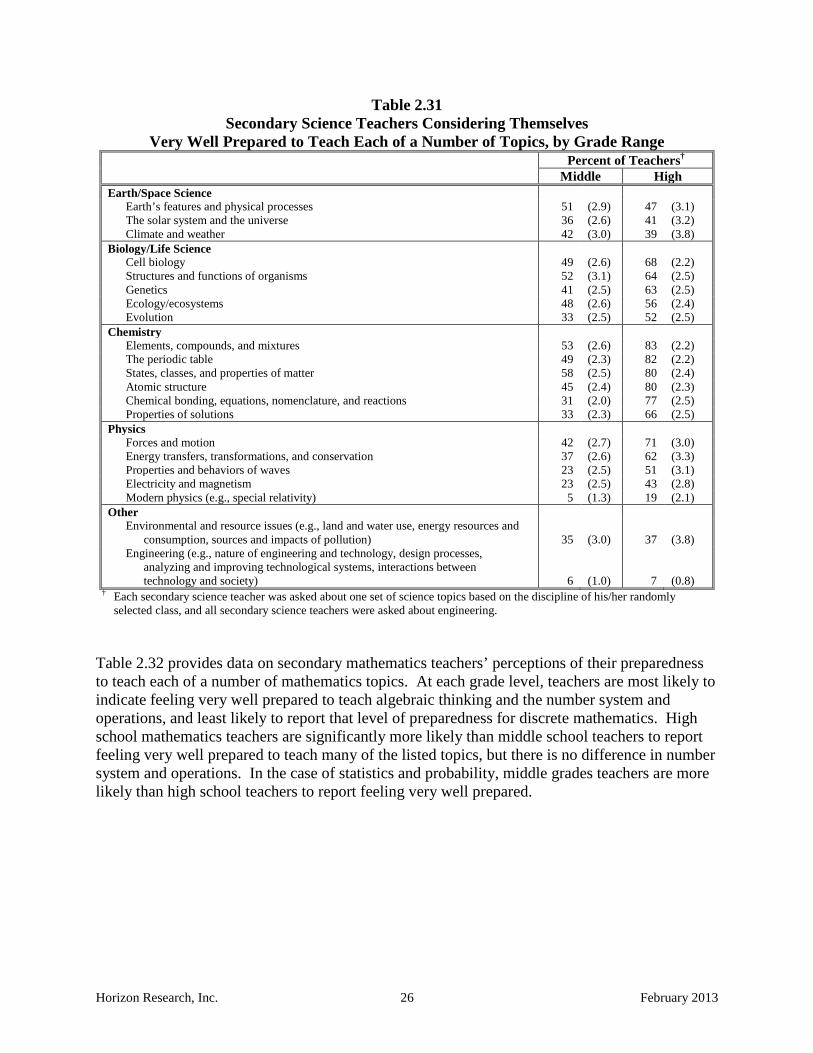
Horizon Research, Inc. 26 February 2013
Table 2.31 Secondary Science Teachers Considering Themselves
Very Well Prepared to Teach Each of a Number of Topics, by Grade Range Percent of Teachers† Middle High Earth/Space Science
Earth’s features and physical processes 51 (2.9) 47 (3.1) The solar system and the universe 36 (2.6) 41 (3.2) Climate and weather 42 (3.0) 39 (3.8)
Biology/Life Science Cell biology 49 (2.6) 68 (2.2) Structures and functions of organisms 52 (3.1) 64 (2.5) Genetics 41 (2.5) 63 (2.5) Ecology/ecosystems 48 (2.6) 56 (2.4) Evolution 33 (2.5) 52 (2.5)
Chemistry Elements, compounds, and mixtures 53 (2.6) 83 (2.2) The periodic table 49 (2.3) 82 (2.2) States, classes, and properties of matter 58 (2.5) 80 (2.4) Atomic structure 45 (2.4) 80 (2.3) Chemical bonding, equations, nomenclature, and reactions 31 (2.0) 77 (2.5) Properties of solutions 33 (2.3) 66 (2.5)
Physics Forces and motion 42 (2.7) 71 (3.0) Energy transfers, transformations, and conservation 37 (2.6) 62 (3.3) Properties and behaviors of waves 23 (2.5) 51 (3.1) Electricity and magnetism 23 (2.5) 43 (2.8) Modern physics (e.g., special relativity) 5 (1.3) 19 (2.1)
Other Environmental and resource issues (e.g., land and water use, energy resources and
consumption, sources and impacts of pollution) 35 (3.0) 37 (3.8) Engineering (e.g., nature of engineering and technology, design processes,
analyzing and improving technological systems, interactions between technology and society) 6 (1.0) 7 (0.8)
† Each secondary science teacher was asked about one set of science topics based on the discipline of his/her randomly selected class, and all secondary science teachers were asked about engineering.
Table 2.32 provides data on secondary mathematics teachers’ perceptions of their preparedness to teach each of a number of mathematics topics. At each grade level, teachers are most likely to indicate feeling very well prepared to teach algebraic thinking and the number system and operations, and least likely to report that level of preparedness for discrete mathematics. High school mathematics teachers are significantly more likely than middle school teachers to report feeling very well prepared to teach many of the listed topics, but there is no difference in number system and operations. In the case of statistics and probability, middle grades teachers are more likely than high school teachers to report feeling very well prepared.

Horizon Research, Inc. 27 February 2013
Table 2.32
Secondary Mathematics Teachers Considering Themselves Very Well Prepared to Teach Each of a Number of Topics, by Grade Range
Percent of Teachers Middle High
Algebraic thinking 76 (1.9) 91 (0.9) The number system and operations 88 (1.4) 90 (1.1) Functions 60 (1.9) 84 (1.5) Measurement 66 (2.1) 79 (1.2) Geometry 62 (2.0) 70 (1.4) Modeling 49 (2.3) 58 (2.0) Statistics and probability 48 (2.2) 30 (1.2) Discrete mathematics 18 (1.5) 25 (1.2)
Two series of items focused on teacher preparedness for a number of tasks associated with instruction. First, teachers were asked how well prepared they feel to address diverse learners in their science/mathematics instruction, including encouraging participation of each of a number of underrepresented groups. Second, teachers were asked about how well prepared they feel to monitor and address student understanding, focusing on a specific unit in the randomly selected class. As can be seen in Table 2.33, the majority of science teachers in each grade range report feeling very well prepared to manage classroom discipline, which is a necessary precursor to effective teaching. A majority of high school teachers also feel very well prepared to encourage the participation of females and to encourage student interest in science and/or engineering; the proportion of teachers feeling very well prepared decreases with decreasing grade level. Fewer teachers at all grade levels feel very well prepared to encourage the participation of students from low socioeconomic backgrounds and racial or ethnic minorities in science and/or engineering. Few teachers indicate feeling very well prepared to teach science to students who have learning or physical disabilities, or are English-language learners.
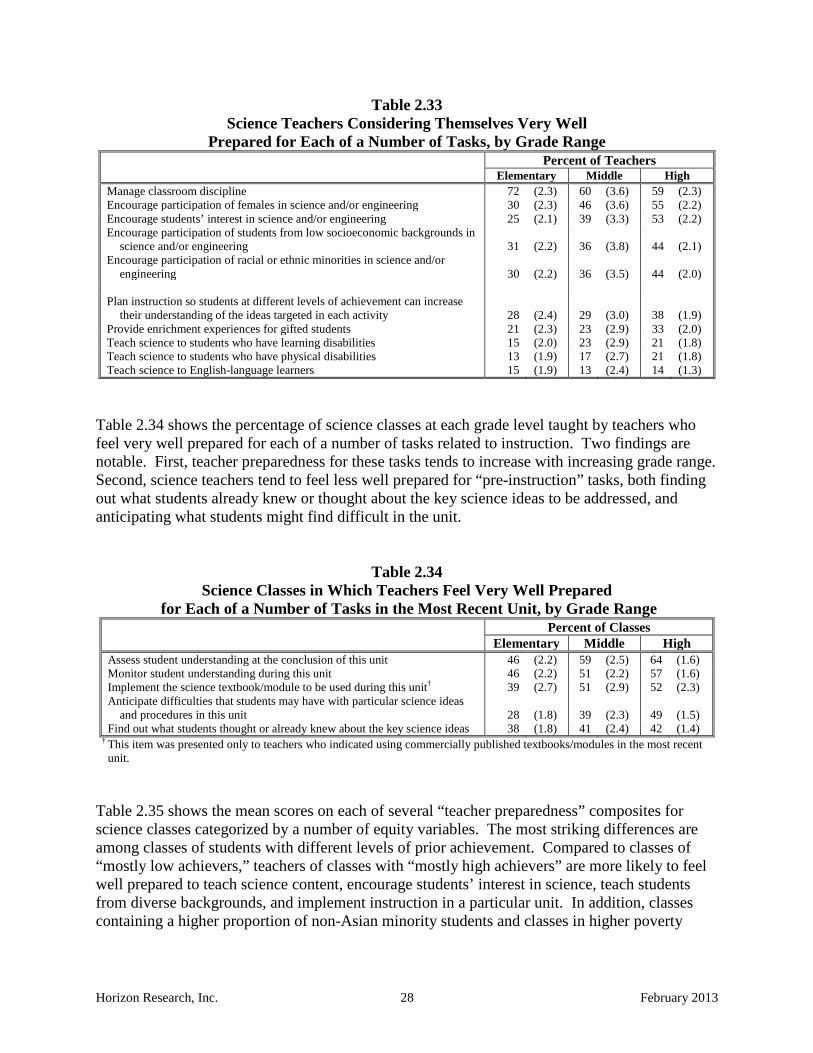
Horizon Research, Inc. 28 February 2013
Table 2.33 Science Teachers Considering Themselves Very Well
Prepared for Each of a Number of Tasks, by Grade Range Percent of Teachers Elementary Middle High Manage classroom discipline 72 (2.3) 60 (3.6) 59 (2.3) Encourage participation of females in science and/or engineering 30 (2.3) 46 (3.6) 55 (2.2) Encourage students’ interest in science and/or engineering 25 (2.1) 39 (3.3) 53 (2.2) Encourage participation of students from low socioeconomic backgrounds in
science and/or engineering 31 (2.2) 36 (3.8) 44 (2.1) Encourage participation of racial or ethnic minorities in science and/or
engineering 30 (2.2) 36 (3.5) 44 (2.0) Plan instruction so students at different levels of achievement can increase
their understanding of the ideas targeted in each activity 28 (2.4) 29 (3.0) 38 (1.9) Provide enrichment experiences for gifted students 21 (2.3) 23 (2.9) 33 (2.0) Teach science to students who have learning disabilities 15 (2.0) 23 (2.9) 21 (1.8) Teach science to students who have physical disabilities 13 (1.9) 17 (2.7) 21 (1.8) Teach science to English-language learners 15 (1.9) 13 (2.4) 14 (1.3)
Table 2.34 shows the percentage of science classes at each grade level taught by teachers who feel very well prepared for each of a number of tasks related to instruction. Two findings are notable. First, teacher preparedness for these tasks tends to increase with increasing grade range. Second, science teachers tend to feel less well prepared for “pre-instruction” tasks, both finding out what students already knew or thought about the key science ideas to be addressed, and anticipating what students might find difficult in the unit.
Table 2.34 Science Classes in Which Teachers Feel Very Well Prepared
for Each of a Number of Tasks in the Most Recent Unit, by Grade Range Percent of Classes Elementary Middle High Assess student understanding at the conclusion of this unit 46 (2.2) 59 (2.5) 64 (1.6) Monitor student understanding during this unit 46 (2.2) 51 (2.2) 57 (1.6) Implement the science textbook/module to be used during this unit† 39 (2.7) 51 (2.9) 52 (2.3) Anticipate difficulties that students may have with particular science ideas
and procedures in this unit 28 (1.8) 39 (2.3) 49 (1.5) Find out what students thought or already knew about the key science ideas 38 (1.8) 41 (2.4) 42 (1.4)
† This item was presented only to teachers who indicated using commercially published textbooks/modules in the most recent unit.
Table 2.35 shows the mean scores on each of several “teacher preparedness” composites for science classes categorized by a number of equity variables. The most striking differences are among classes of students with different levels of prior achievement. Compared to classes of “mostly low achievers,” teachers of classes with “mostly high achievers” are more likely to feel well prepared to teach science content, encourage students’ interest in science, teach students from diverse backgrounds, and implement instruction in a particular unit. In addition, classes containing a higher proportion of non-Asian minority students and classes in higher poverty

Horizon Research, Inc. 29 February 2013
schools are more likely to be taught by teachers who feel less well prepared to encourage students’ interest in science and implement instruction in a particular unit.
Table 2.35 Class Mean Scores for Science Teacher
Perceptions of Preparedness Composites, by Equity Factors Mean Score
Teach Students from Diverse Backgrounds
Encourage Students’ Interest
in Science
Teach Science
Content†
Implement Instruction in
Particular Unit Prior Achievement Level of Class
Mostly High Achievers 57 (1.8) 80 (1.3) 83 (1.1) 84 (1.0) Average/Mixed Achievers 56 (1.0) 69 (1.2) 79 (0.8) 77 (0.5) Mostly Low Achievers 51 (2.5) 65 (2.8) 73 (3.7) 75 (1.1)
Percent of Non-Asian Minority Students in Class Lowest Quartile 54 (1.8) 72 (1.8) 79 (1.6) 80 (1.0) Second Quartile 54 (1.6) 70 (1.7) 81 (1.0) 79 (0.9) Third Quartile 57 (1.4) 72 (1.5) 80 (1.1) 79 (0.9) Highest Quartile 55 (1.4) 65 (2.4) 79 (1.7) 76 (1.0)
Percent of Students in School Eligible for FRL Lowest Quartile 60 (2.0) 74 (1.9) 81 (1.0) 79 (1.0) Second Quartile 57 (1.5) 70 (1.8) 80 (1.1) 80 (0.6) Third Quartile 54 (1.4) 67 (2.8) 79 (1.3) 76 (0.9) Highest Quartile 54 (1.7) 68 (1.6) 80 (1.7) 76 (1.1)
† Perceptions of Preparedness to Teach Science Content score was computed only for non-self-contained classes and is based on content in the randomly selected class.
As in science, most mathematics teachers feel very well prepared to manage classroom discipline, and very few feel very well prepared to teach mathematics to students who have learning or physical disabilities, or are English-language learners (see Table 2.36). The majority of mathematics teachers feel very well prepared to encourage the participation of females in mathematics. In contrast to science, high school teachers feel less well prepared to encourage students from low socioeconomic backgrounds and racial or ethnic minorities in mathematics than do elementary and middle grades teachers.
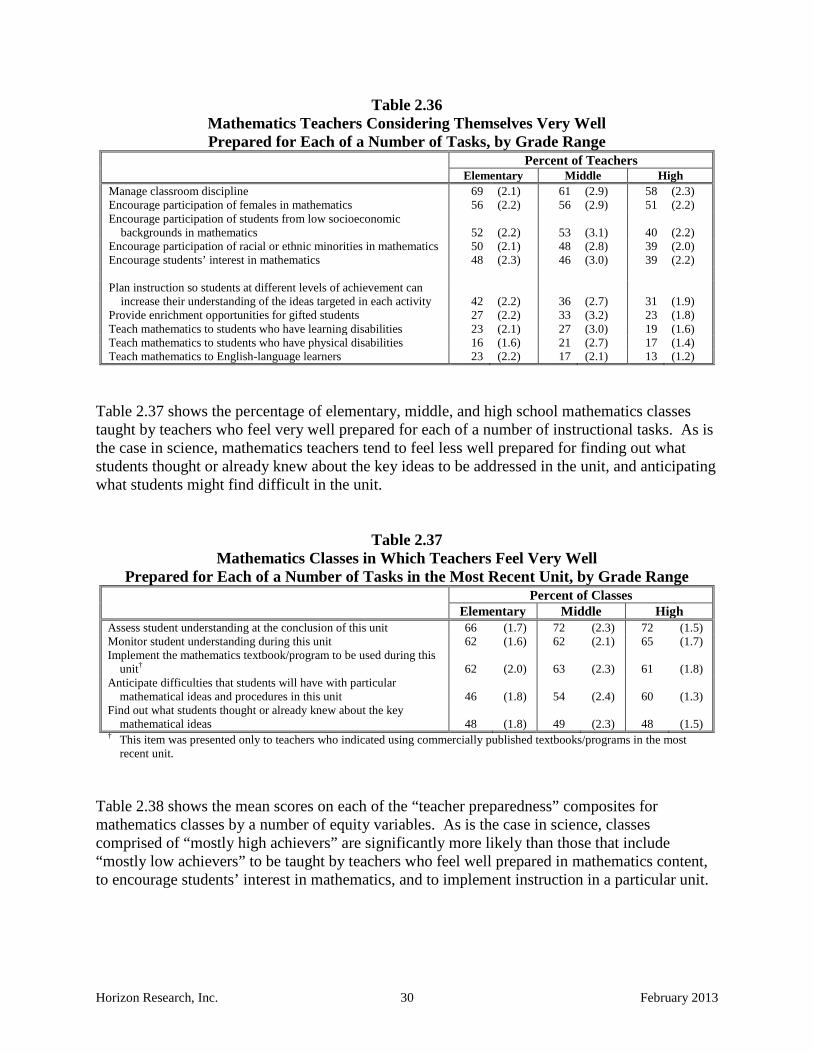
Horizon Research, Inc. 30 February 2013
Table 2.36 Mathematics Teachers Considering Themselves Very Well Prepared for Each of a Number of Tasks, by Grade Range
Percent of Teachers Elementary Middle High Manage classroom discipline 69 (2.1) 61 (2.9) 58 (2.3) Encourage participation of females in mathematics 56 (2.2) 56 (2.9) 51 (2.2) Encourage participation of students from low socioeconomic
backgrounds in mathematics 52 (2.2) 53 (3.1) 40 (2.2) Encourage participation of racial or ethnic minorities in mathematics 50 (2.1) 48 (2.8) 39 (2.0) Encourage students’ interest in mathematics 48 (2.3) 46 (3.0) 39 (2.2) Plan instruction so students at different levels of achievement can
increase their understanding of the ideas targeted in each activity 42 (2.2) 36 (2.7) 31 (1.9) Provide enrichment opportunities for gifted students 27 (2.2) 33 (3.2) 23 (1.8) Teach mathematics to students who have learning disabilities 23 (2.1) 27 (3.0) 19 (1.6) Teach mathematics to students who have physical disabilities 16 (1.6) 21 (2.7) 17 (1.4) Teach mathematics to English-language learners 23 (2.2) 17 (2.1) 13 (1.2)
Table 2.37 shows the percentage of elementary, middle, and high school mathematics classes taught by teachers who feel very well prepared for each of a number of instructional tasks. As is the case in science, mathematics teachers tend to feel less well prepared for finding out what students thought or already knew about the key ideas to be addressed in the unit, and anticipating what students might find difficult in the unit.
Table 2.37 Mathematics Classes in Which Teachers Feel Very Well
Prepared for Each of a Number of Tasks in the Most Recent Unit, by Grade Range Percent of Classes Elementary Middle High Assess student understanding at the conclusion of this unit 66 (1.7) 72 (2.3) 72 (1.5) Monitor student understanding during this unit 62 (1.6) 62 (2.1) 65 (1.7) Implement the mathematics textbook/program to be used during this
unit† 62 (2.0) 63 (2.3) 61 (1.8) Anticipate difficulties that students will have with particular
mathematical ideas and procedures in this unit 46 (1.8) 54 (2.4) 60 (1.3) Find out what students thought or already knew about the key
mathematical ideas 48 (1.8) 49 (2.3) 48 (1.5) † This item was presented only to teachers who indicated using commercially published textbooks/programs in the most
recent unit. Table 2.38 shows the mean scores on each of the “teacher preparedness” composites for mathematics classes by a number of equity variables. As is the case in science, classes comprised of “mostly high achievers” are significantly more likely than those that include “mostly low achievers” to be taught by teachers who feel well prepared in mathematics content, to encourage students’ interest in mathematics, and to implement instruction in a particular unit.

Horizon Research, Inc. 31 February 2013
Table 2.38 Class Mean Scores for Mathematics Teacher
Perceptions of Preparedness Composites, by Equity Factors Mean Score
Teach Students from Diverse Backgrounds
Encourage Students’ Interest in
Mathematics
Teach Mathematics
Content†
Implement Instruction in
Particular Unit Prior Achievement Level of Class
Mostly High Achievers 59 (1.4) 79 (1.3) 86 (0.5) 88 (0.7) Average/Mixed Achievers 58 (0.8) 78 (0.8) 81 (0.6) 83 (0.5) Mostly Low Achievers 58 (1.5) 75 (1.5) 80 (0.8) 83 (0.8)
Percent of Non-Asian Minority Students in Class
Lowest Quartile 55 (1.5) 75 (1.4) 82 (1.0) 85 (0.7) Second Quartile 57 (1.2) 78 (1.2) 85 (0.6) 85 (0.7) Third Quartile 59 (1.2) 78 (1.2) 82 (0.8) 84 (0.7) Highest Quartile 61 (1.4) 79 (1.3) 81 (0.9) 83 (0.8)
Percent of Students in School Eligible for FRL
Lowest Quartile 58 (1.4) 76 (1.5) 85 (0.6) 86 (0.7) Second Quartile 60 (1.3) 79 (1.3) 82 (0.9) 85 (0.6) Third Quartile 57 (1.2) 77 (1.2) 82 (1.0) 84 (0.7) Highest Quartile 61 (1.6) 79 (1.5) 81 (1.0) 82 (0.8)
† Perceptions of Preparedness to Teach Mathematics Content score was computed only for non-self-contained classes. Summary Data in this chapter provide insight on teachers’ preparation and indicate that science and mathematics teachers, especially in the elementary and middle grades, do not have strong content preparation in their respective subjects. Elementary teachers are typically assigned to teach science, mathematics, and other academic subjects to one group of students, but it is clear that they do not feel equally prepared in each area. Roughly 80 percent of elementary teachers feel very well prepared to teach reading/language arts and mathematics, but fewer than half feel very well prepared to teach science. In part, this result may be due to very few elementary science and mathematics teachers having undergraduate majors in these fields. Elementary teachers also have less extensive college coursework in science/mathematics than do their middle grade counterparts, who in turn have had less science/mathematics coursework than their high school counterparts. Still, many teachers at all grade levels have less extensive backgrounds in the discipline they teach than is recommended by NSTA and NCTM. In addition, few teachers at any grade level feel well prepared to teach engineering, a key element of the Next Generation Science Standards. Science and mathematics teachers’ beliefs about effective instruction are, in some ways, in line with current recommendations from research and, in other ways, are not well aligned. A large majority of teachers in all subject/grade-range categories believe that it is better to cover fewer topics in depth. However, many believe that students should be given definitions for new vocabulary at the beginning of instruction, that teachers should explain an idea to students before

Horizon Research, Inc. 32 February 2013
having them consider evidence for it, and that hands-on activities should be used primarily to reinforce ideas students have already learned. The 2012 National Survey also found that well-prepared teachers are not necessarily equitably distributed. Classes in schools with high proportions of students eligible for free/reduced-price lunch are more likely than classes in schools with few such students to be taught by relatively inexperienced teachers. In addition, science and mathematics classes categorized as consisting of “mostly high achievers” are more likely than those categorized as “mostly low achievers” to be taught by teachers who feel well prepared to teach science/mathematics, encourage students’ interest in the discipline, and implement instruction in a unit (e.g., monitor student understanding).
Horizon Research, Inc. 33 February 2013
CHAPTER THREE
Science and Mathematics Professional Development Overview Science and mathematics teachers, like all professionals, need opportunities to keep up with advances in their field, including both disciplinary content and how to help their students learn important science/mathematics content. Staying up-to-date is particularly challenging for teachers at the elementary level, as they typically teach multiple subjects. The 2012 National Survey collected data on teachers’ participation in in-service education and other professional activities, as well as data on study groups, one-on-one coaching, and other professional growth opportunities provided by schools and districts. These data are discussed in this chapter. Teacher Professional Development One important measure of teachers’ continuing education is how long it has been since they participated in professional development. As can be seen in Tables 3.1 and 3.2, more than 80 percent of middle and high school science teachers, and mathematics teachers at each grade range, have participated in discipline-focused professional development (i.e., focused on science/mathematics content or the teaching of science/mathematics) within the last three years. Elementary teachers stand out for the relative paucity of professional development in science or science teaching, with only 59 percent having participated in the last three years.
Table 3.1 Science Teachers’ Most Recent Participation in
Science-Focused† Professional Development, by Grade Range Percent of Teachers Elementary Middle High In the last 3 years 59 (2.0) 82 (2.3) 85 (1.3) 4–6 years ago 16 (1.4) 6 (1.2) 7 (0.7) 7–10 years ago 5 (0.8) 3 (1.0) 2 (0.3) More than 10 years ago 5 (0.8) 4 (1.3) 1 (0.4) Never 15 (1.4) 6 (1.4) 5 (1.0) † Includes professional development focused on science or science teaching.

Horizon Research, Inc. 34 February 2013
Table 3.2 Mathematics Teachers’ Most Recent Participation in
Mathematics-Focused† Professional Development, by Grade Range Percent of Teachers Elementary Middle High In the last 3 years 87 (1.3) 89 (1.6) 88 (1.0) 4–6 years ago 7 (0.9) 4 (0.7) 6 (0.6) 7–10 years ago 1 (0.4) 1 (0.5) 2 (0.4) More than 10 years ago 1 (0.3) 2 (0.6) 1 (0.3) Never 3 (0.7) 4 (1.0) 4 (0.7) † Includes professional development focused on mathematics or mathematics teaching.
Although some involvement in professional development may be better than none, a brief exposure of a few hours over several years is not likely to be sufficient to enhance teachers’ knowledge and skills in meaningful ways. Accordingly, teachers were asked about the total amount of time they had spent on professional development related to science/mathematics teaching. As can be seen in Table 3.3, roughly 30 percent of middle and high school science and mathematics teachers, and far fewer of their elementary colleagues, participated in more than 35 hours of science/mathematics-focused professional development in the last three years.
Table 3.3 Time Spent on Professional Development in the Last Three Years, by Subject and Grade Range
Percent of Teachers Elementary Middle High Science
Less than 6 hours 65 (1.9) 30 (2.6) 23 (1.6) 6–15 hours 22 (1.7) 24 (1.8) 20 (1.1) 16–35 hours 8 (0.9) 20 (2.0) 21 (1.4) More than 35 hours 4 (0.7) 27 (2.0) 36 (1.1)
Mathematics Less than 6 hours 35 (2.1) 22 (2.1) 23 (1.5) 6–15 hours 35 (1.6) 24 (2.1) 24 (1.4) 16–35 hours 20 (1.5) 23 (1.6) 22 (1.1) More than 35 hours 11 (1.0) 31 (1.9) 32 (1.5)
The data were also analyzed to examine the extent to which science and mathematics classes with different characteristics are taught by teachers who have participated in more than 35 hours of professional development. Interestingly, in science and mathematics, classes at both ends of the spectrum in terms of level of prior achievement are more likely than classes with students of average or mixed prior achievement to be taught by teachers who have had more than 35 hours of professional development in the last three years (see Table 3.4). Note also that mathematics classes with the highest percentage of non-Asian minority students are more likely than those with the lowest percentage to be taught by teachers who have participated in a relatively large amount of professional development in their field in the last three years.

Horizon Research, Inc. 35 February 2013
Table 3.4 Classes Taught by Teachers with More than 35 Hours of
Professional Development in the Last Three Years, by Subject and Equity Factors Percent of Classes
Science Mathematics Prior Achievement Level of Class
Mostly High Achievers 33 (2.6) 28 (1.8) Average/Mixed Achievers 19 (1.0) 20 (1.0) Mostly Low Achievers 25 (2.8) 30 (2.2)
Percent of Non-Asian Minority Students in Class Lowest Quartile 20 (1.9) 19 (1.6) Second Quartile 19 (1.5) 21 (1.4) Third Quartile 27 (2.0) 23 (1.7) Highest Quartile 23 (2.0) 29 (1.9)
Teachers who indicated they had recently participated in professional development were asked about the nature of those activities. Data for science teachers are shown in Table 3.5, and for mathematics teachers in Table 3.6. For each subject/grade-range combination, workshops are the most prevalent activity, with 84–92 percent of teachers who had participated in professional development activities in the last three years indicating they had attended a workshop. Roughly three-fourths of middle and high school mathematics and science teachers, but fewer of their elementary school colleagues, report participating in professional learning communities or other types of teacher study groups. Middle and high school teachers also attend science/mathematics teacher association meetings at a higher rate than do elementary teachers, likely a reflection of the fact that elementary teachers are responsible for teaching, and keeping up with, multiple disciplines. Finally, not only are elementary science teachers less likely to have participated recently in professional development, they are far less likely to have received feedback on their teaching from a mentor/coach than any other group.
Table 3.5 Science Teachers Participating in Various Professional
Development Activities in the Last Three Years, by Grade Range Percent of Teachers Elementary Middle High
Attended a workshop on science or science teaching 84 (1.8) 91 (1.7) 90 (1.2) Participated in a professional learning community/lesson study/teacher
study group focused on science or science teaching 55 (2.4) 75 (2.5) 73 (1.6) Received feedback about your science teaching from a mentor/coach
formally assigned by the school/district/diocese† 24 (2.5) 47 (3.5) 54 (2.4) Attended a national, state, or regional science teacher association
meeting 8 (1.2) 35 (2.8) 44 (1.7) † This item was asked of all teachers whether or not they had participated in professional development in the last three years.

Horizon Research, Inc. 36 February 2013
Table 3.6 Mathematics Teachers Participating in Various Professional
Development Activities in the Last Three Years, by Grade Range Percent of Teachers Elementary Middle High
Attended a workshop on mathematics or mathematics teaching 91 (1.0) 92 (1.4) 89 (1.0) Participated in a professional learning community/lesson study/teacher
study group focused on mathematics or mathematics teaching 66 (1.7) 76 (2.2) 73 (2.1) Received feedback about your mathematics teaching from a
mentor/coach formally assigned by the school/district/diocese† 46 (2.2) 57 (3.0) 54 (2.2) Attended a national, state, or regional mathematics teacher association
meeting 10 (1.0) 32 (2.5) 38 (1.5) † This item was asked of all teachers whether or not they had participated in professional development in the last three years.
The emerging consensus about effective professional development suggests that teachers need opportunities to work with colleagues who face similar challenges, including other teachers from their school and those who have similar teaching assignments. Other recommendations include engaging teachers in investigations, both to learn disciplinary content and to experience inquiry-oriented learning; to examine student work and other classroom artifacts for evidence of what students do and do not understand; and to apply what they have learned in their classrooms and subsequently discuss how it went.4 Accordingly, teachers who had participated in professional development in the last three years were asked a series of additional questions about the nature of those experiences. As can be seen in Tables 3.7 and 3.8, many secondary science and mathematics teachers (ranging from 54 to 70 percent) have had substantial opportunity to work closely with other teachers from their school and/or subject in their professional development. These percentages are somewhat lower for elementary teachers, especially for science-focused professional development activities. Similarly, only about a third of elementary science teachers, compared to roughly half of teachers in the other subject/grade categories have had substantial opportunity to try out and then discuss what they have learned in their professional development. Relatively few teachers in any subject/grade-range combination (ranging from 31 to 44 percent) have had substantial opportunity to examine classroom artifacts. Still, teachers who have participated in professional development appear to be pleased with the experiences as very few teachers believe that their recent professional development was a waste of their time.
4 Elmore, R. F. (2002). Bridging the gap between standards and achievement: The imperative for professional development in education. Washington, DC: Albert Shanker Institute. Garet, M. S., Porter, A. C., Desimone, L., Birman, B. F., and Yoon, K. S. (2001). What makes professional development effective? Results from a national sample of teachers. American Educational Research Journal 38(4), 915–945.

Horizon Research, Inc. 37 February 2013
Table 3.7 Science Teachers Whose Professional Development in the Last Three Years
Had Each of a Number of Characteristics to a Substantial Extent,† by Grade Range Percent of Teachers Elementary Middle High Worked closely with other science teachers from your school 34 (3.5) 61 (3.5) 62 (2.6) Worked closely with other science teachers who taught the same grade
and/or subject whether or not they were from your school 37 (3.4) 54 (4.0) 58 (2.6) Had opportunities to try out what you learned in your classroom and
then talk about it as part of the professional development 34 (3.3) 51 (4.5) 47 (2.4) Had opportunities to engage in science investigations 48 (3.5) 52 (3.0) 45 (2.8) Had opportunities to examine classroom artifacts (e.g., student work
samples) 31 (3.5) 40 (3.4) 33 (2.4) The professional development was a waste of time 8 (2.0) 5 (1.1) 8 (1.1)
† Includes teachers indicating 4 or 5 on a 5-point scale ranging from 1 “Not at all” to 5 “To a great extent.”
Table 3.8 Mathematics Teachers Whose Professional Development in the Last Three Years
Had Each of a Number of Characteristics to a Substantial Extent,† by Grade Range Percent of Teachers Elementary Middle High Worked closely with other mathematics teachers from your school 54 (2.3) 70 (3.0) 67 (2.3) Worked closely with other mathematics teachers who taught the same
grade and/or subject whether or not they were from your school 49 (2.3) 57 (3.2) 56 (2.4) Had opportunities to try out what you learned in your classroom and
then talk about it as part of the professional development 46 (2.6) 51 (2.7) 47 (2.4) Had opportunities to engage in mathematics investigations 46 (2.3) 51 (3.1) 41 (2.0) Had opportunities to examine classroom artifacts (e.g., student work
samples) 43 (2.4) 44 (3.1) 36 (2.4) The professional development was a waste of time 5 (1.0) 4 (1.1) 7 (0.9)
† Includes teachers indicating 4 or 5 on a 5-point scale ranging from 1 “Not at all” to 5 “To a great extent.” Responses to these six items describing the characteristics of professional development experiences were combined into a single composite variable called “quality of professional development.” As can be seen in Table 3.9, the mean scores on this composite are quite similar across subject/grade-range categories except for elementary science where teachers rated the quality of their professional development lower than the other subject/grade-range combinations.
Table 3.9 Teacher Mean Scores for the Quality of Professional
Development Composite, by Subject and Grade Range Mean Score Science Mathematics Elementary 55 (1.8) 62 (1.0) Middle 65 (1.5) 66 (1.3) High 62 (1.2) 63 (1.2)
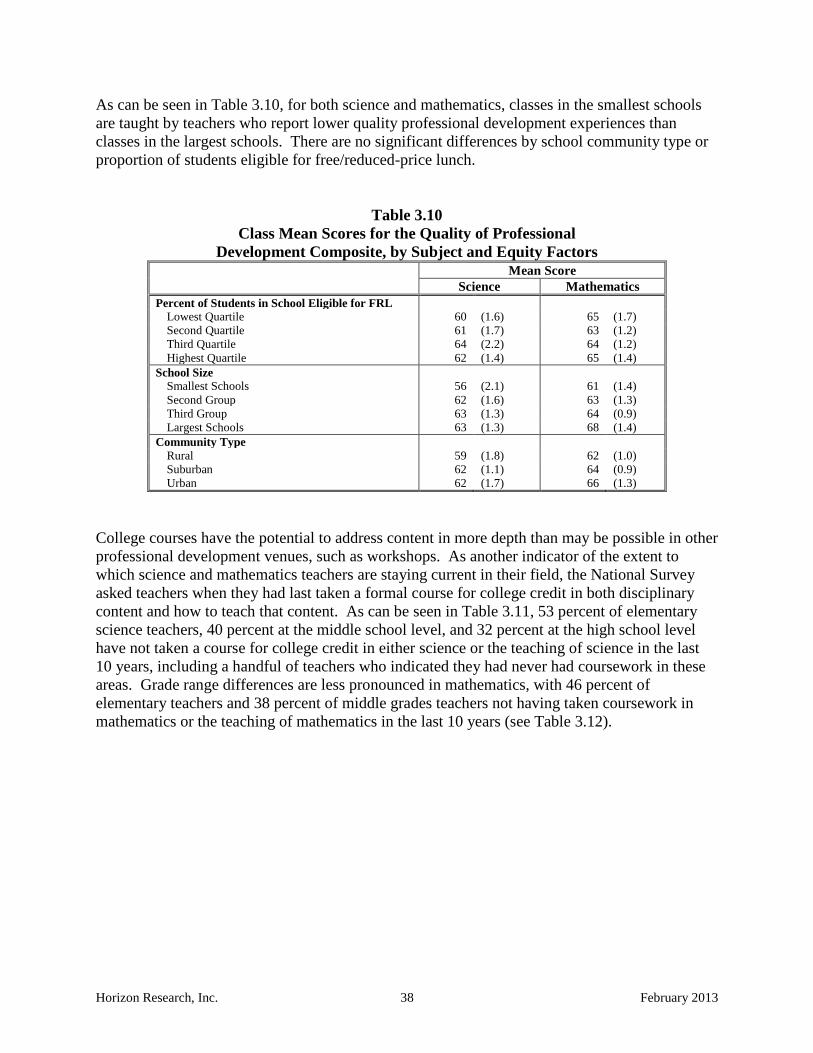
Horizon Research, Inc. 38 February 2013
As can be seen in Table 3.10, for both science and mathematics, classes in the smallest schools are taught by teachers who report lower quality professional development experiences than classes in the largest schools. There are no significant differences by school community type or proportion of students eligible for free/reduced-price lunch.
Table 3.10 Class Mean Scores for the Quality of Professional
Development Composite, by Subject and Equity Factors Mean Score
Science Mathematics Percent of Students in School Eligible for FRL
Lowest Quartile 60 (1.6) 65 (1.7) Second Quartile 61 (1.7) 63 (1.2) Third Quartile 64 (2.2) 64 (1.2) Highest Quartile 62 (1.4) 65 (1.4)
School Size Smallest Schools 56 (2.1) 61 (1.4) Second Group 62 (1.6) 63 (1.3) Third Group 63 (1.3) 64 (0.9) Largest Schools 63 (1.3) 68 (1.4)
Community Type Rural 59 (1.8) 62 (1.0) Suburban 62 (1.1) 64 (0.9) Urban 62 (1.7) 66 (1.3)
College courses have the potential to address content in more depth than may be possible in other professional development venues, such as workshops. As another indicator of the extent to which science and mathematics teachers are staying current in their field, the National Survey asked teachers when they had last taken a formal course for college credit in both disciplinary content and how to teach that content. As can be seen in Table 3.11, 53 percent of elementary science teachers, 40 percent at the middle school level, and 32 percent at the high school level have not taken a course for college credit in either science or the teaching of science in the last 10 years, including a handful of teachers who indicated they had never had coursework in these areas. Grade range differences are less pronounced in mathematics, with 46 percent of elementary teachers and 38 percent of middle grades teachers not having taken coursework in mathematics or the teaching of mathematics in the last 10 years (see Table 3.12).
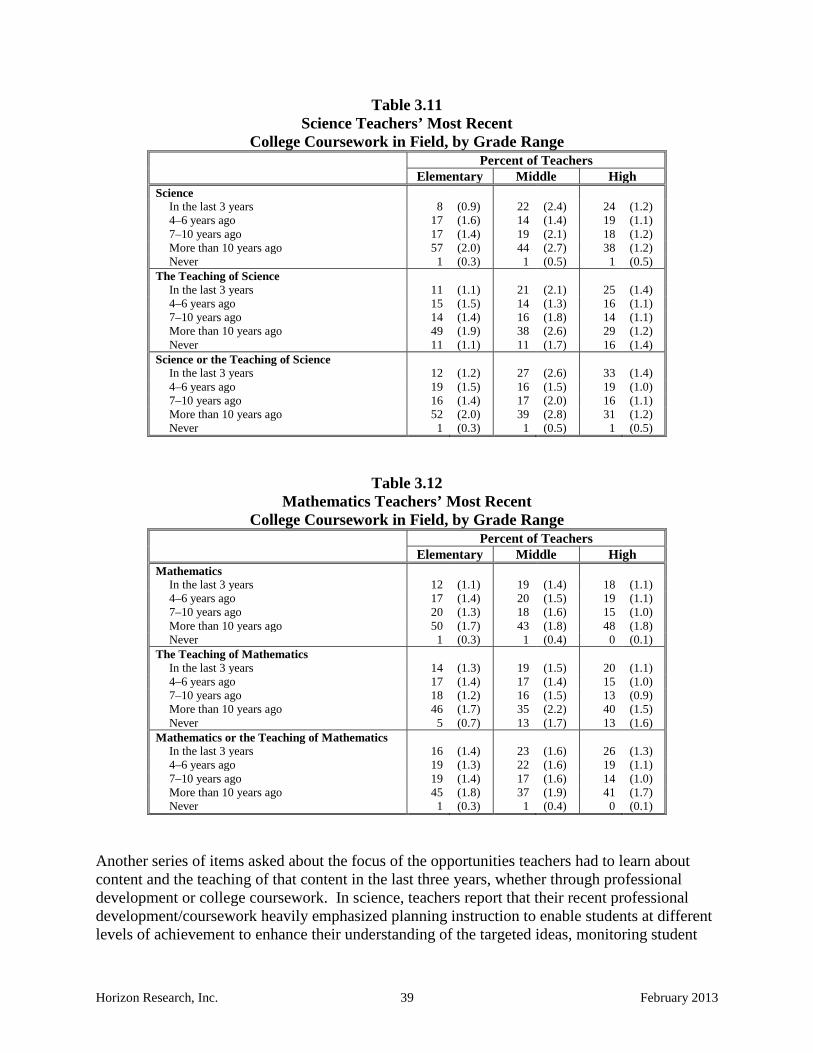
Horizon Research, Inc. 39 February 2013
Table 3.11 Science Teachers’ Most Recent
College Coursework in Field, by Grade Range Percent of Teachers
Elementary Middle High Science
In the last 3 years 8 (0.9) 22 (2.4) 24 (1.2) 4–6 years ago 17 (1.6) 14 (1.4) 19 (1.1) 7–10 years ago 17 (1.4) 19 (2.1) 18 (1.2) More than 10 years ago 57 (2.0) 44 (2.7) 38 (1.2) Never 1 (0.3) 1 (0.5) 1 (0.5)
The Teaching of Science In the last 3 years 11 (1.1) 21 (2.1) 25 (1.4) 4–6 years ago 15 (1.5) 14 (1.3) 16 (1.1) 7–10 years ago 14 (1.4) 16 (1.8) 14 (1.1) More than 10 years ago 49 (1.9) 38 (2.6) 29 (1.2) Never 11 (1.1) 11 (1.7) 16 (1.4)
Science or the Teaching of Science In the last 3 years 12 (1.2) 27 (2.6) 33 (1.4) 4–6 years ago 19 (1.5) 16 (1.5) 19 (1.0) 7–10 years ago 16 (1.4) 17 (2.0) 16 (1.1) More than 10 years ago 52 (2.0) 39 (2.8) 31 (1.2) Never 1 (0.3) 1 (0.5) 1 (0.5)
Table 3.12 Mathematics Teachers’ Most Recent
College Coursework in Field, by Grade Range Percent of Teachers
Elementary Middle High Mathematics
In the last 3 years 12 (1.1) 19 (1.4) 18 (1.1) 4–6 years ago 17 (1.4) 20 (1.5) 19 (1.1) 7–10 years ago 20 (1.3) 18 (1.6) 15 (1.0) More than 10 years ago 50 (1.7) 43 (1.8) 48 (1.8) Never 1 (0.3) 1 (0.4) 0 (0.1)
The Teaching of Mathematics In the last 3 years 14 (1.3) 19 (1.5) 20 (1.1) 4–6 years ago 17 (1.4) 17 (1.4) 15 (1.0) 7–10 years ago 18 (1.2) 16 (1.5) 13 (0.9) More than 10 years ago 46 (1.7) 35 (2.2) 40 (1.5) Never 5 (0.7) 13 (1.7) 13 (1.6)
Mathematics or the Teaching of Mathematics In the last 3 years 16 (1.4) 23 (1.6) 26 (1.3) 4–6 years ago 19 (1.3) 22 (1.6) 19 (1.1) 7–10 years ago 19 (1.4) 17 (1.6) 14 (1.0) More than 10 years ago 45 (1.8) 37 (1.9) 41 (1.7) Never 1 (0.3) 1 (0.4) 0 (0.1)
Another series of items asked about the focus of the opportunities teachers had to learn about content and the teaching of that content in the last three years, whether through professional development or college coursework. In science, teachers report that their recent professional development/coursework heavily emphasized planning instruction to enable students at different levels of achievement to enhance their understanding of the targeted ideas, monitoring student
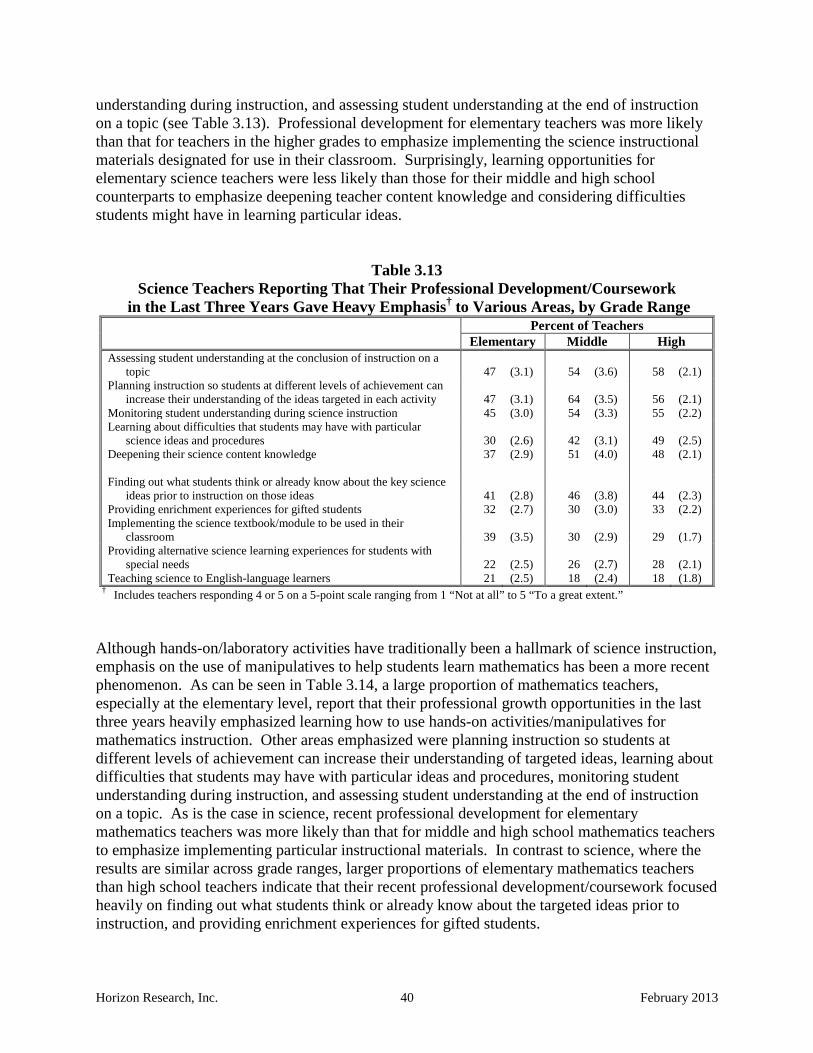
Horizon Research, Inc. 40 February 2013
understanding during instruction, and assessing student understanding at the end of instruction on a topic (see Table 3.13). Professional development for elementary teachers was more likely than that for teachers in the higher grades to emphasize implementing the science instructional materials designated for use in their classroom. Surprisingly, learning opportunities for elementary science teachers were less likely than those for their middle and high school counterparts to emphasize deepening teacher content knowledge and considering difficulties students might have in learning particular ideas.
Table 3.13 Science Teachers Reporting That Their Professional Development/Coursework
in the Last Three Years Gave Heavy Emphasis† to Various Areas, by Grade Range Percent of Teachers Elementary Middle High Assessing student understanding at the conclusion of instruction on a
topic 47 (3.1) 54 (3.6) 58 (2.1) Planning instruction so students at different levels of achievement can
increase their understanding of the ideas targeted in each activity 47 (3.1) 64 (3.5) 56 (2.1) Monitoring student understanding during science instruction 45 (3.0) 54 (3.3) 55 (2.2) Learning about difficulties that students may have with particular
science ideas and procedures 30 (2.6) 42 (3.1) 49 (2.5) Deepening their science content knowledge 37 (2.9) 51 (4.0) 48 (2.1) Finding out what students think or already know about the key science
ideas prior to instruction on those ideas 41 (2.8) 46 (3.8) 44 (2.3) Providing enrichment experiences for gifted students 32 (2.7) 30 (3.0) 33 (2.2) Implementing the science textbook/module to be used in their
classroom 39 (3.5) 30 (2.9) 29 (1.7) Providing alternative science learning experiences for students with
special needs 22 (2.5) 26 (2.7) 28 (2.1) Teaching science to English-language learners 21 (2.5) 18 (2.4) 18 (1.8)
† Includes teachers responding 4 or 5 on a 5-point scale ranging from 1 “Not at all” to 5 “To a great extent.” Although hands-on/laboratory activities have traditionally been a hallmark of science instruction, emphasis on the use of manipulatives to help students learn mathematics has been a more recent phenomenon. As can be seen in Table 3.14, a large proportion of mathematics teachers, especially at the elementary level, report that their professional growth opportunities in the last three years heavily emphasized learning how to use hands-on activities/manipulatives for mathematics instruction. Other areas emphasized were planning instruction so students at different levels of achievement can increase their understanding of targeted ideas, learning about difficulties that students may have with particular ideas and procedures, monitoring student understanding during instruction, and assessing student understanding at the end of instruction on a topic. As is the case in science, recent professional development for elementary mathematics teachers was more likely than that for middle and high school mathematics teachers to emphasize implementing particular instructional materials. In contrast to science, where the results are similar across grade ranges, larger proportions of elementary mathematics teachers than high school teachers indicate that their recent professional development/coursework focused heavily on finding out what students think or already know about the targeted ideas prior to instruction, and providing enrichment experiences for gifted students.
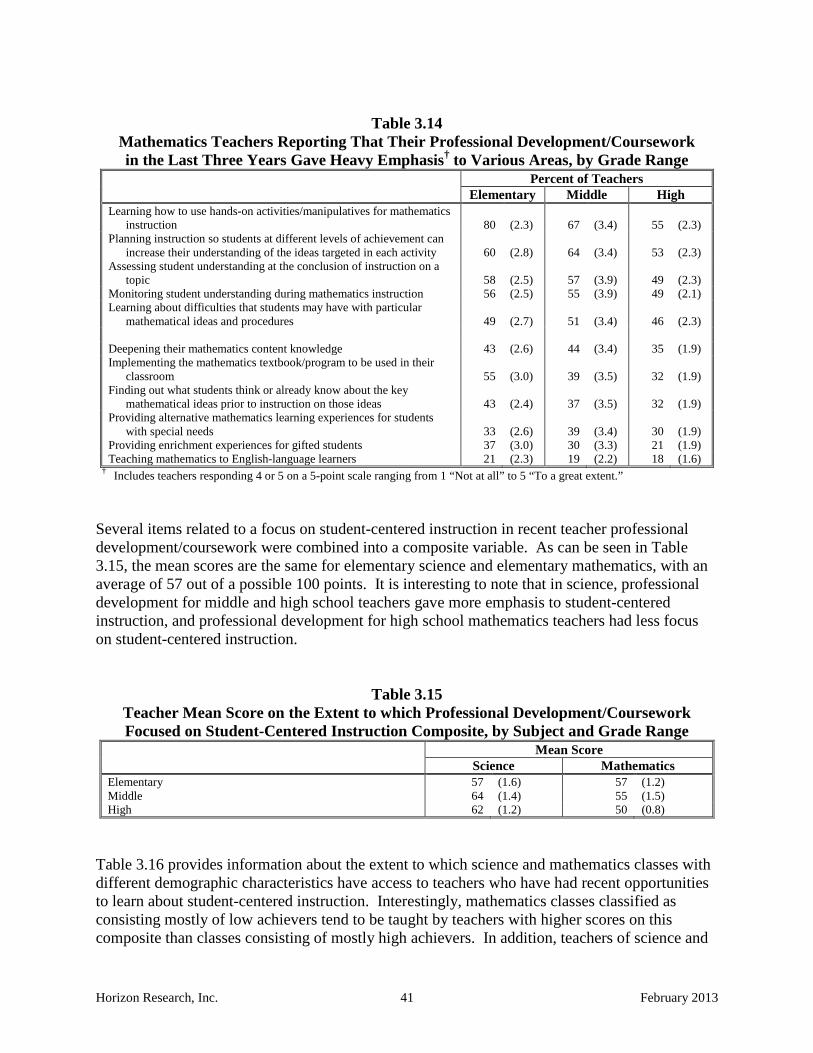
Horizon Research, Inc. 41 February 2013
Table 3.14
Mathematics Teachers Reporting That Their Professional Development/Coursework in the Last Three Years Gave Heavy Emphasis† to Various Areas, by Grade Range
Percent of Teachers Elementary Middle High Learning how to use hands-on activities/manipulatives for mathematics
instruction 80 (2.3) 67 (3.4) 55 (2.3) Planning instruction so students at different levels of achievement can
increase their understanding of the ideas targeted in each activity 60 (2.8) 64 (3.4) 53 (2.3) Assessing student understanding at the conclusion of instruction on a
topic 58 (2.5) 57 (3.9) 49 (2.3) Monitoring student understanding during mathematics instruction 56 (2.5) 55 (3.9) 49 (2.1) Learning about difficulties that students may have with particular
mathematical ideas and procedures 49 (2.7) 51 (3.4) 46 (2.3) Deepening their mathematics content knowledge 43 (2.6) 44 (3.4) 35 (1.9) Implementing the mathematics textbook/program to be used in their
classroom 55 (3.0) 39 (3.5) 32 (1.9) Finding out what students think or already know about the key
mathematical ideas prior to instruction on those ideas 43 (2.4) 37 (3.5) 32 (1.9) Providing alternative mathematics learning experiences for students
with special needs 33 (2.6) 39 (3.4) 30 (1.9) Providing enrichment experiences for gifted students 37 (3.0) 30 (3.3) 21 (1.9) Teaching mathematics to English-language learners 21 (2.3) 19 (2.2) 18 (1.6)
† Includes teachers responding 4 or 5 on a 5-point scale ranging from 1 “Not at all” to 5 “To a great extent.” Several items related to a focus on student-centered instruction in recent teacher professional development/coursework were combined into a composite variable. As can be seen in Table 3.15, the mean scores are the same for elementary science and elementary mathematics, with an average of 57 out of a possible 100 points. It is interesting to note that in science, professional development for middle and high school teachers gave more emphasis to student-centered instruction, and professional development for high school mathematics teachers had less focus on student-centered instruction.
Table 3.15 Teacher Mean Score on the Extent to which Professional Development/Coursework Focused on Student-Centered Instruction Composite, by Subject and Grade Range
Mean Score Science Mathematics Elementary 57 (1.6) 57 (1.2) Middle 64 (1.4) 55 (1.5) High 62 (1.2) 50 (0.8)
Table 3.16 provides information about the extent to which science and mathematics classes with different demographic characteristics have access to teachers who have had recent opportunities to learn about student-centered instruction. Interestingly, mathematics classes classified as consisting mostly of low achievers tend to be taught by teachers with higher scores on this composite than classes consisting of mostly high achievers. In addition, teachers of science and
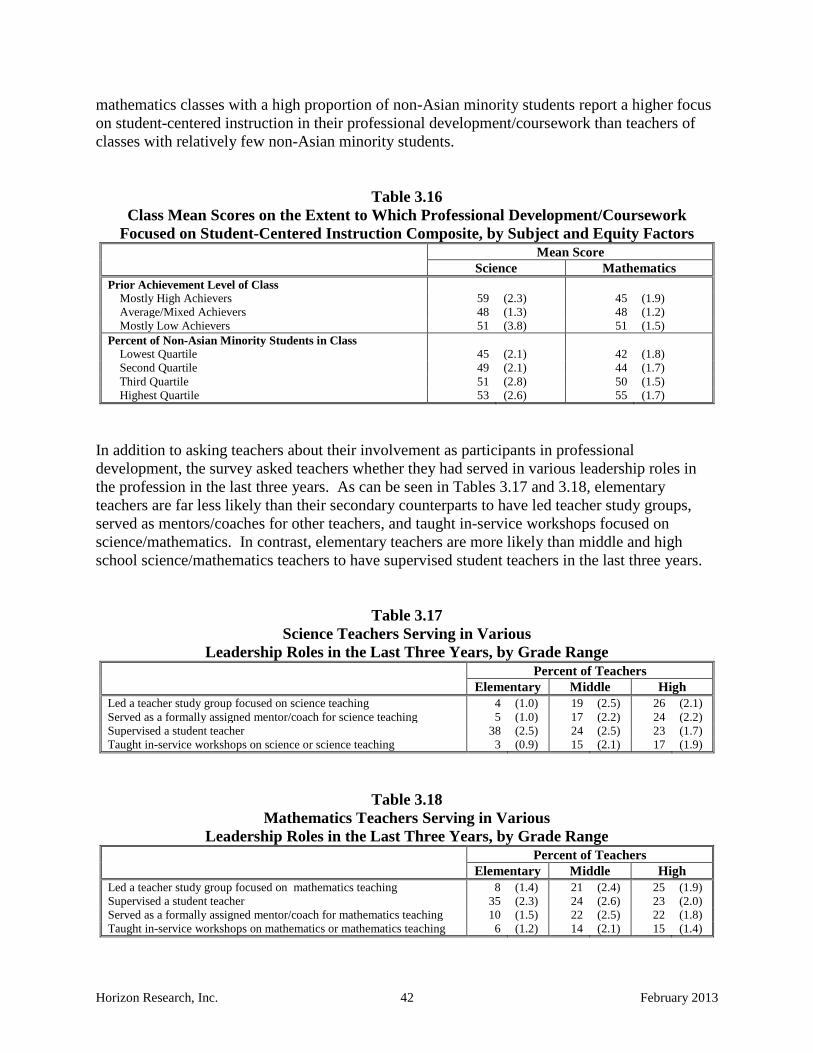
Horizon Research, Inc. 42 February 2013
mathematics classes with a high proportion of non-Asian minority students report a higher focus on student-centered instruction in their professional development/coursework than teachers of classes with relatively few non-Asian minority students.
Table 3.16 Class Mean Scores on the Extent to Which Professional Development/Coursework
Focused on Student-Centered Instruction Composite, by Subject and Equity Factors Mean Score
Science Mathematics Prior Achievement Level of Class
Mostly High Achievers 59 (2.3) 45 (1.9) Average/Mixed Achievers 48 (1.3) 48 (1.2) Mostly Low Achievers 51 (3.8) 51 (1.5)
Percent of Non-Asian Minority Students in Class Lowest Quartile 45 (2.1) 42 (1.8) Second Quartile 49 (2.1) 44 (1.7) Third Quartile 51 (2.8) 50 (1.5) Highest Quartile 53 (2.6) 55 (1.7)
In addition to asking teachers about their involvement as participants in professional development, the survey asked teachers whether they had served in various leadership roles in the profession in the last three years. As can be seen in Tables 3.17 and 3.18, elementary teachers are far less likely than their secondary counterparts to have led teacher study groups, served as mentors/coaches for other teachers, and taught in-service workshops focused on science/mathematics. In contrast, elementary teachers are more likely than middle and high school science/mathematics teachers to have supervised student teachers in the last three years.
Table 3.17 Science Teachers Serving in Various
Leadership Roles in the Last Three Years, by Grade Range Percent of Teachers
Elementary Middle High Led a teacher study group focused on science teaching 4 (1.0) 19 (2.5) 26 (2.1) Served as a formally assigned mentor/coach for science teaching 5 (1.0) 17 (2.2) 24 (2.2) Supervised a student teacher 38 (2.5) 24 (2.5) 23 (1.7) Taught in-service workshops on science or science teaching 3 (0.9) 15 (2.1) 17 (1.9)
Table 3.18 Mathematics Teachers Serving in Various
Leadership Roles in the Last Three Years, by Grade Range Percent of Teachers
Elementary Middle High Led a teacher study group focused on mathematics teaching 8 (1.4) 21 (2.4) 25 (1.9) Supervised a student teacher 35 (2.3) 24 (2.6) 23 (2.0) Served as a formally assigned mentor/coach for mathematics teaching 10 (1.5) 22 (2.5) 22 (1.8) Taught in-service workshops on mathematics or mathematics teaching 6 (1.2) 14 (2.1) 15 (1.4)

Horizon Research, Inc. 43 February 2013
Professional Development Offerings at the School Level The data presented in this chapter thus far are drawn from the teacher questionnaires. The 2012 National Survey of Science and Mathematics Education also included “School Program Questionnaires” for science and mathematics, each completed by a person designated by the school coordinator as knowledgeable about school programs, policies, and practices in the designated subject. School science and mathematics program representatives were asked whether professional development workshops in the designated discipline were offered by their school and/or district/diocese (if relevant), possibly in conjunction with other school systems, colleges or universities, museums, professional associations, and/or commercial vendors. As can be seen in Table 3.19, locally offered workshops are more prevalent in mathematics than in science, and within each subject, are more prevalent in schools that include elementary grades than those that include grades 9–12.5
Table 3.19 Professional Development Workshops Offered
Locally in the Last Three Years, by Subject and Grade Range Percent of Schools Science Mathematics Elementary 48 (2.9) 65 (2.8) Middle 42 (3.6) 60 (3.3) High 36 (4.0) 51 (4.3)
Respondents who indicated that mathematics/science workshops were offered locally were asked about the extent to which that professional development addressed each of a number of areas. In both science and mathematics, locally offered workshops are more likely to emphasize state standards than any other of the listed areas. Locally offered workshops in science have a greater focus on investigation-oriented teaching strategies than those in mathematics. In contrast, workshops offered at the local level in mathematics are more likely than those in science to emphasize how to monitor student understanding during instruction and how to provide alternative learning experiences for students with special needs (see Table 3.20).
5 Elementary school is defined as any school containing grade K, 1, 2, 3, 4, and/or 5; middle school is defined as any school containing grade 6, 7, or 8; and high school is defined as any school containing grade 9, 10, 11, or 12.

Horizon Research, Inc. 44 February 2013
Table 3.20 Locally Offered Professional Development Workshops in the
Last Three Years with a Substantial Focus† in Each of a Number of Areas, by Subject Percent of Schools Science Mathematics State science/mathematics standards 64 (2.9) 76 (2.5) Science/mathematics content 52 (3.2) 60 (3.0) How to use particular science/mathematics instructional materials 52 (3.1) 55 (3.1) How to use technology in science/mathematics instruction 41 (2.9) 46 (2.9) How to monitor student understanding during science/mathematics instruction 33 (2.6) 43 (2.7) How students think about various science/mathematics ideas 31 (2.4) 39 (2.8) How to adapt science/mathematics instruction to address student misconceptions 31 (2.7) 38 (2.8) How to use investigation-oriented science/mathematics teaching strategies 51 (3.2) 36 (2.9) How to provide alternative science/mathematics learning experiences for students with
special needs 11 (1.7) 22 (2.8) How to teach science/mathematics to students who are English language learners 18 (2.5) 20 (2.3)
† Includes schools where respondent indicated 4 or 5 on a 5-point scale ranging from 1 “Not at all” to 5 “To a great extent.” One concern about professional development workshops is that teachers may not be given adequate assistance in applying what they are learning to their own instruction. Teacher study groups (Professional Learning Communities, lesson study, etc.) have the potential to help teachers focus on instruction. School science and mathematics program representatives were asked whether their school has offered teacher study groups in the last three years where teachers meet on a regular basis to discuss science/mathematics teaching and learning. As can be seen in Table 3.21, in elementary schools, study groups are more likely to have been offered in mathematics than in science.
Table 3.21 Teacher Study Groups Offered at Schools
in the Last Three Years, by Subject and Grade Range Percent of Schools Science Mathematics Elementary 32 (3.0) 46 (3.0) Middle 43 (3.7) 51 (3.7) High 47 (4.4) 48 (4.4)
Tables 3.22–3.26 present additional information provided by school program representatives about school-based teacher study groups focused on science and mathematics. As can be seen in Table 3.22, these study groups are similar in terms of whether teachers have been required to participate, whether the groups have operated on specified schedules, and whether they have had designated leaders. When study groups have had designated leaders, in both science and mathematics, the leaders have been most likely to come from within the school (see Table 3.23).
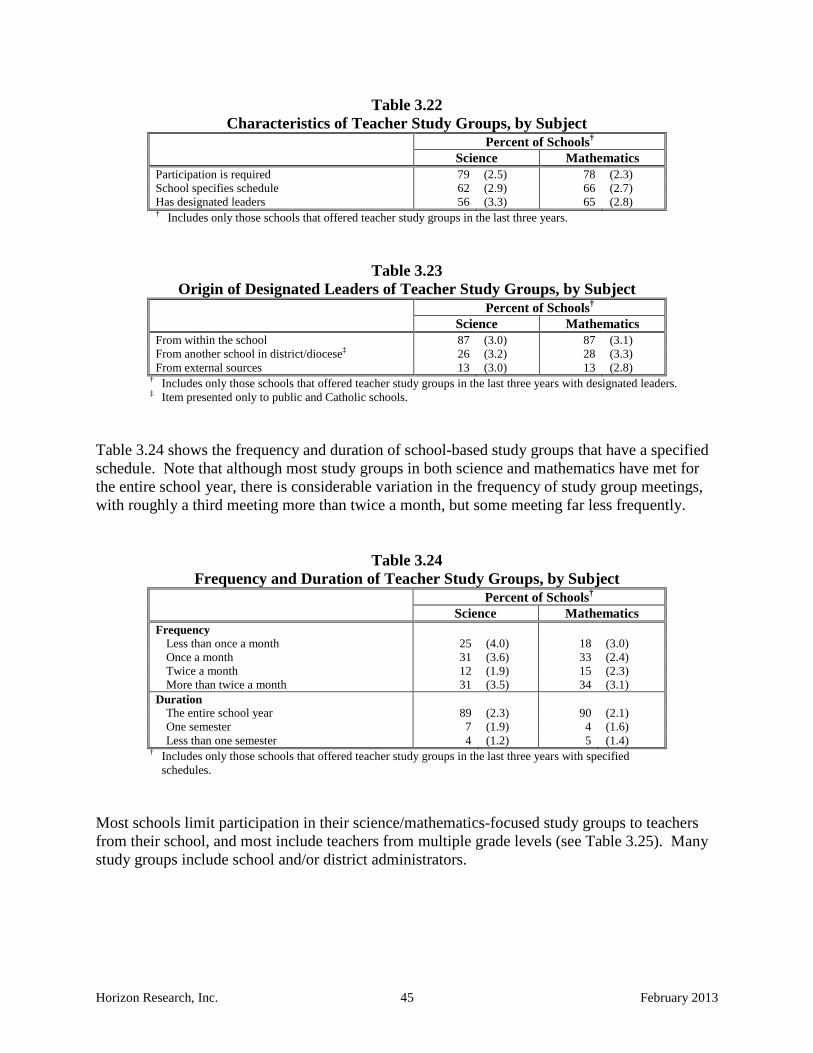
Horizon Research, Inc. 45 February 2013
Table 3.22 Characteristics of Teacher Study Groups, by Subject
Percent of Schools† Science Mathematics Participation is required 79 (2.5) 78 (2.3) School specifies schedule 62 (2.9) 66 (2.7) Has designated leaders 56 (3.3) 65 (2.8) † Includes only those schools that offered teacher study groups in the last three years.
Table 3.23 Origin of Designated Leaders of Teacher Study Groups, by Subject
Percent of Schools† Science Mathematics
From within the school 87 (3.0) 87 (3.1) From another school in district/diocese‡ 26 (3.2) 28 (3.3) From external sources 13 (3.0) 13 (2.8)
† Includes only those schools that offered teacher study groups in the last three years with designated leaders. ‡ Item presented only to public and Catholic schools.
Table 3.24 shows the frequency and duration of school-based study groups that have a specified schedule. Note that although most study groups in both science and mathematics have met for the entire school year, there is considerable variation in the frequency of study group meetings, with roughly a third meeting more than twice a month, but some meeting far less frequently.
Table 3.24
Frequency and Duration of Teacher Study Groups, by Subject Percent of Schools† Science Mathematics Frequency
Less than once a month 25 (4.0) 18 (3.0) Once a month 31 (3.6) 33 (2.4) Twice a month 12 (1.9) 15 (2.3) More than twice a month 31 (3.5) 34 (3.1)
Duration The entire school year 89 (2.3) 90 (2.1) One semester 7 (1.9) 4 (1.6) Less than one semester 4 (1.2) 5 (1.4)
† Includes only those schools that offered teacher study groups in the last three years with specified schedules.
Most schools limit participation in their science/mathematics-focused study groups to teachers from their school, and most include teachers from multiple grade levels (see Table 3.25). Many study groups include school and/or district administrators.

Horizon Research, Inc. 46 February 2013
Table 3.25 Composition of Teacher Study Groups, by Subject
Percent of Schools† Science Mathematics
Limited to teachers from this school 66 (3.9) 76 (2.8) Include teachers from other schools in the district/diocese‡ 35 (3.8) 23 (2.7) Include teachers from other schools outside of their jurisdiction 7 (3.0) 4 (1.7) Include teachers from multiple grade levels 65 (3.4) 61 (2.3) Include school and/or district/diocese administrators 44 (3.7) 50 (2.7) Include higher education faculty or other “consultants” 10 (2.4) 15 (2.0) Include parents/guardians or other community members 0 (0.1) 3 (1.0) † Includes only those schools that offered teacher study groups in the last three years. ‡ Item presented only to public and Catholic schools.
School program representatives were also asked about the activities typically included in teacher study groups focused on science/mathematics teaching and learning. As can be seen in Table 3.26, 73 percent of study groups in science and 83 percent in mathematics have involved teachers in analyzing student assessment results. Roughly two-thirds of study groups in each subject have had teachers analyze student instructional materials and plan lessons together. Considerably fewer study groups have engaged teachers in the analysis of classroom artifacts and conducting science/mathematics investigations.
Table 3.26
Description of Activities in Typical Teacher Study Groups, by Subject Percent of Schools† Science Mathematics
Teachers analyze student science/mathematics assessment results 73 (3.5) 83 (2.4) Teachers analyze science/mathematics instructional materials 65 (3.3) 65 (2.7) Teachers plan science/mathematics lessons together 67 (3.0) 62 (3.2) Teachers analyze classroom artifacts 37 (3.6) 34 (2.7) Teachers engage in science/mathematics investigations 25 (2.9) 30 (2.3) † Includes only those schools that offered teacher study groups in the last three years.
Although there is general agreement that teachers can benefit from participating in professional development workshops and study groups, it is often difficult to find time for them to do so. In schools that offered in-service workshops and/or teacher study groups within the last three years, school representatives were given a list of ways in which time might be provided for teachers to participate, and asked to indicate which were used in their school. As can be seen in Table 3.27, teacher work days during the school year have been the most likely to be used, including 63 percent of schools for mathematics and 55 percent for science. Somewhat fewer schools have used common planning time, teacher work days outside the regular school year, substitute teachers, and early dismissal or late start for students to provide time for professional development.
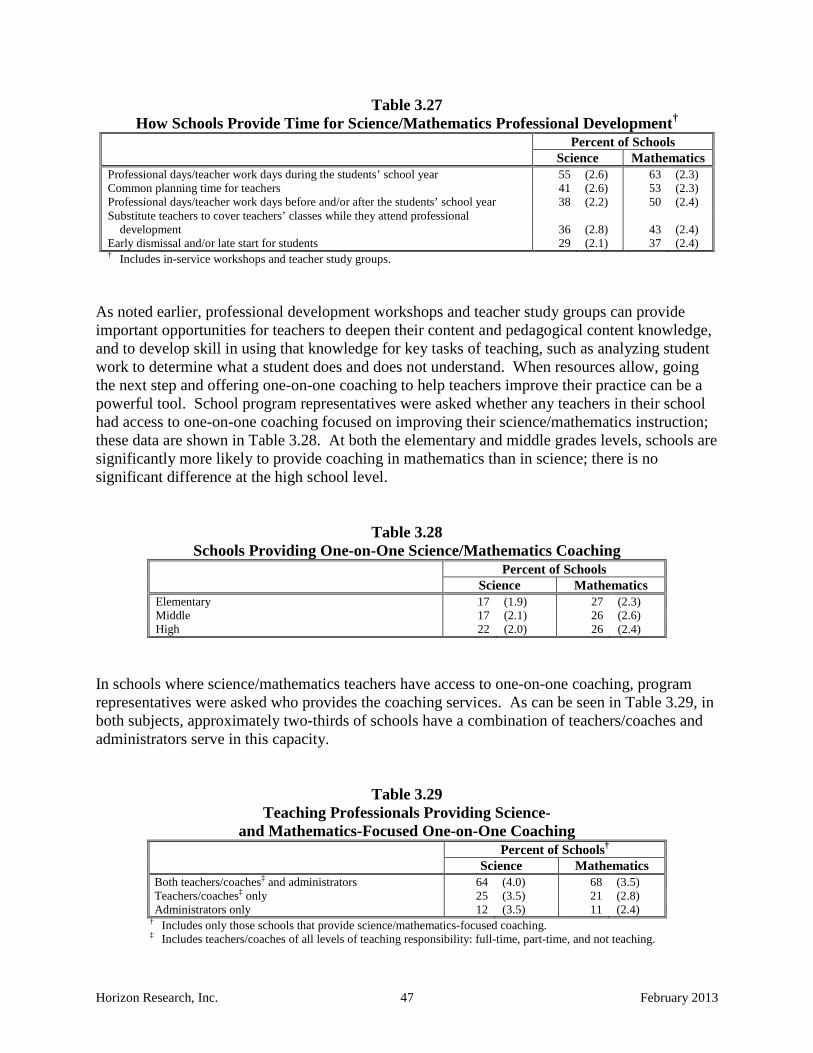
Horizon Research, Inc. 47 February 2013
Table 3.27 How Schools Provide Time for Science/Mathematics Professional Development†
Percent of Schools Science Mathematics
Professional days/teacher work days during the students’ school year 55 (2.6) 63 (2.3) Common planning time for teachers 41 (2.6) 53 (2.3) Professional days/teacher work days before and/or after the students’ school year 38 (2.2) 50 (2.4) Substitute teachers to cover teachers’ classes while they attend professional
development 36 (2.8) 43 (2.4) Early dismissal and/or late start for students 29 (2.1) 37 (2.4) † Includes in-service workshops and teacher study groups.
As noted earlier, professional development workshops and teacher study groups can provide important opportunities for teachers to deepen their content and pedagogical content knowledge, and to develop skill in using that knowledge for key tasks of teaching, such as analyzing student work to determine what a student does and does not understand. When resources allow, going the next step and offering one-on-one coaching to help teachers improve their practice can be a powerful tool. School program representatives were asked whether any teachers in their school had access to one-on-one coaching focused on improving their science/mathematics instruction; these data are shown in Table 3.28. At both the elementary and middle grades levels, schools are significantly more likely to provide coaching in mathematics than in science; there is no significant difference at the high school level.
Table 3.28 Schools Providing One-on-One Science/Mathematics Coaching
Percent of Schools Science Mathematics Elementary 17 (1.9) 27 (2.3) Middle 17 (2.1) 26 (2.6) High 22 (2.0) 26 (2.4)
In schools where science/mathematics teachers have access to one-on-one coaching, program representatives were asked who provides the coaching services. As can be seen in Table 3.29, in both subjects, approximately two-thirds of schools have a combination of teachers/coaches and administrators serve in this capacity.
Table 3.29 Teaching Professionals Providing Science-
and Mathematics-Focused One-on-One Coaching Percent of Schools†
Science Mathematics Both teachers/coaches‡ and administrators 64 (4.0) 68 (3.5) Teachers/coaches‡ only 25 (3.5) 21 (2.8) Administrators only 12 (3.5) 11 (2.4)
† Includes only those schools that provide science/mathematics-focused coaching. ‡ Includes teachers/coaches of all levels of teaching responsibility: full-time, part-time, and not teaching.
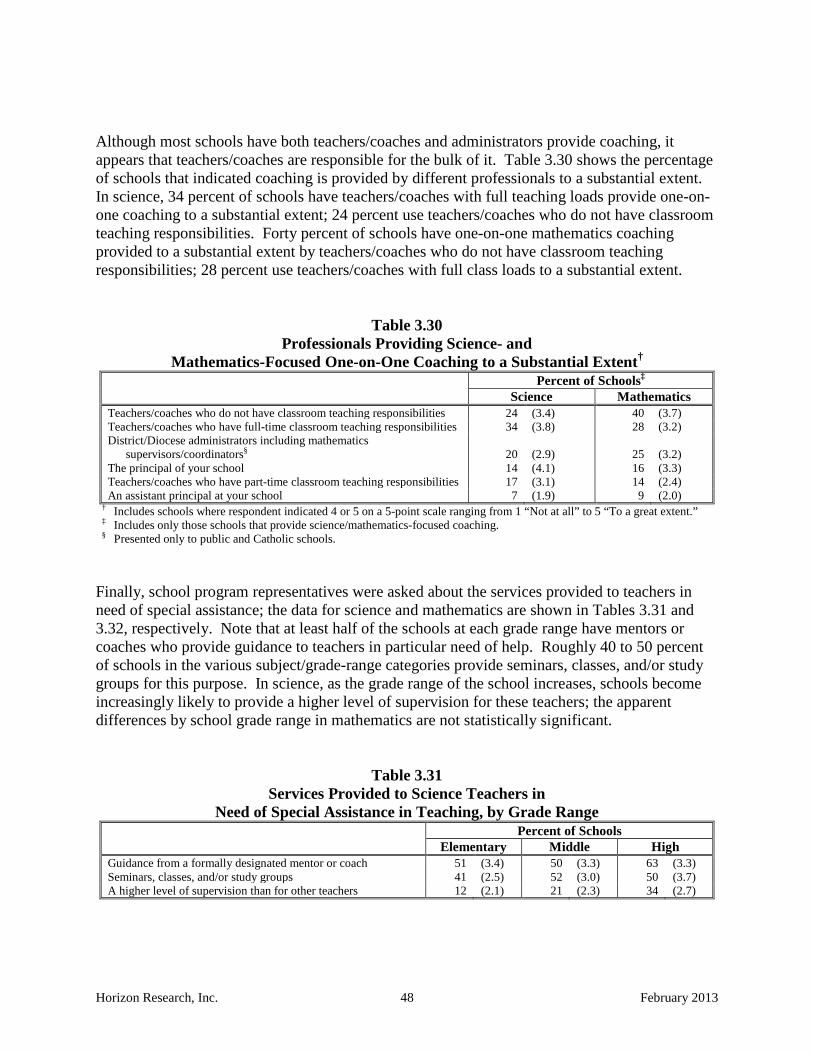
Horizon Research, Inc. 48 February 2013
Although most schools have both teachers/coaches and administrators provide coaching, it appears that teachers/coaches are responsible for the bulk of it. Table 3.30 shows the percentage of schools that indicated coaching is provided by different professionals to a substantial extent. In science, 34 percent of schools have teachers/coaches with full teaching loads provide one-on-one coaching to a substantial extent; 24 percent use teachers/coaches who do not have classroom teaching responsibilities. Forty percent of schools have one-on-one mathematics coaching provided to a substantial extent by teachers/coaches who do not have classroom teaching responsibilities; 28 percent use teachers/coaches with full class loads to a substantial extent.
Table 3.30 Professionals Providing Science- and
Mathematics-Focused One-on-One Coaching to a Substantial Extent† Percent of Schools‡ Science Mathematics
Teachers/coaches who do not have classroom teaching responsibilities 24 (3.4) 40 (3.7) Teachers/coaches who have full-time classroom teaching responsibilities 34 (3.8) 28 (3.2) District/Diocese administrators including mathematics
supervisors/coordinators§ 20 (2.9) 25 (3.2) The principal of your school 14 (4.1) 16 (3.3) Teachers/coaches who have part-time classroom teaching responsibilities 17 (3.1) 14 (2.4) An assistant principal at your school 7 (1.9) 9 (2.0)
† Includes schools where respondent indicated 4 or 5 on a 5-point scale ranging from 1 “Not at all” to 5 “To a great extent.” ‡ Includes only those schools that provide science/mathematics-focused coaching. § Presented only to public and Catholic schools.
Finally, school program representatives were asked about the services provided to teachers in need of special assistance; the data for science and mathematics are shown in Tables 3.31 and 3.32, respectively. Note that at least half of the schools at each grade range have mentors or coaches who provide guidance to teachers in particular need of help. Roughly 40 to 50 percent of schools in the various subject/grade-range categories provide seminars, classes, and/or study groups for this purpose. In science, as the grade range of the school increases, schools become increasingly likely to provide a higher level of supervision for these teachers; the apparent differences by school grade range in mathematics are not statistically significant.
Table 3.31 Services Provided to Science Teachers in
Need of Special Assistance in Teaching, by Grade Range Percent of Schools
Elementary Middle High Guidance from a formally designated mentor or coach 51 (3.4) 50 (3.3) 63 (3.3) Seminars, classes, and/or study groups 41 (2.5) 52 (3.0) 50 (3.7) A higher level of supervision than for other teachers 12 (2.1) 21 (2.3) 34 (2.7)

Horizon Research, Inc. 49 February 2013
Table 3.32 Services Provided to Mathematics Teachers in
Need of Special Assistance in Teaching, by Grade Range Percent of Schools
Elementary Middle High Guidance from a formally designated mentor or coach 56 (3.5) 59 (3.4) 66 (3.6) Seminars, classes, and/or study groups 53 (3.2) 49 (3.4) 43 (3.6) A higher level of supervision than for other teachers 25 (2.5) 30 (2.7) 36 (3.7)
Additional analyses were conducted to see if each of a number of professional development resources is equitably distributed across schools. As can be seen in Table 3.33, schools with different proportions of students eligible for free/reduced-price lunch are about equally likely to provide assistance to science teachers in need. In contrast, the largest schools are significantly more likely than the smallest schools to offer science-focused teacher study groups. The most variation is in the percentage of schools offering one-on-one coaching, which is more likely to be offered in schools in the highest quartile of proportion of students eligible for free/reduced-price lunch than in schools in the lowest quartile. The largest schools are more likely than the smallest to offer coaching, and schools in urban areas are most likely and schools in rural areas least likely to offer one-on-one coaching.
Table 3.33 Schools Providing Various Services to Science Teachers, by Equity Factors
Percent of Schools
Science-Focused Study Groups
One-on-One Science-Focused
Coaching
Assistance to Science Teachers
in Need† Percent of Students in School Eligible for FRL
Lowest Quartile 34 (4.7) 16 (3.1) 81 (4.0) Second Quartile 34 (4.1) 17 (3.9) 78 (3.3) Third Quartile 49 (4.0) 18 (2.6) 79 (3.6) Highest Quartile 40 (4.2) 28 (3.8) 86 (3.0)
School Size Smallest Schools 35 (4.6) 14 (2.4) 82 (2.8) Second Group 41 (4.2) 21 (3.0) 80 (3.3) Third Group 41 (4.1) 24 (3.1) 83 (3.5) Largest Schools 49 (3.9) 30 (4.1) 81 (3.8)
Community Type Rural 42 (4.4) 11 (2.2) 80 (3.1) Suburban 38 (3.2) 20 (2.1) 83 (2.3) Urban 38 (4.0) 30 (2.8) 80 (3.7)
† Assistance defined as guidance from a formally designated mentor or coach; seminars, classes, and/or study groups; or a higher level of supervision than for other teachers.
Table 3.34 shows analogous data for mathematics. The largest schools are substantially more likely than the smallest schools to offer each of these services, and schools with the largest proportion of students eligible for free/reduced-price lunch are substantially more likely than those in the lowest quartile to offer mathematics-focused study groups and one-on-one coaching.

Horizon Research, Inc. 50 February 2013
In addition, urban schools are much more likely than either rural or suburban schools to offer one-on-one coaching in mathematics.
Table 3.34 Schools Providing Various Services to Mathematics Teachers, by Equity Factors
Percent of Schools Mathematics-Focused Study
Groups
One-on-One Mathematics-
Focused Coaching
Assistance to Mathematics
Teachers in Need† Percent of Students in School Eligible for FRL
Lowest Quartile 39 (4.8) 22 (3.6) 76 (5.5) Second Quartile 46 (4.9) 26 (4.5) 87 (4.0) Third Quartile 56 (4.0) 29 (3.8) 90 (3.0) Highest Quartile 61 (4.4) 41 (3.9) 81 (3.3)
School Size Smallest Schools 40 (4.4) 22 (3.0) 78 (4.2) Second Group 52 (4.5) 30 (3.3) 86 (3.6) Third Group 55 (3.8) 31 (3.5) 87 (2.8) Largest Schools 67 (4.1) 43 (4.1) 91 (2.7)
Community Type Rural 48 (4.5) 18 (2.8) 84 (3.5) Suburban 47 (3.4) 25 (2.5) 85 (3.0) Urban 54 (4.2) 47 (4.0) 80 (3.2)
† Assistance defined as guidance from a formally designated mentor or coach; seminars, classes, and/or study groups; or a higher level of supervision than for other teachers.
Summary With the exception of elementary science, a large percentage of science and mathematics teachers have participated in science/mathematics-focused professional development in the last three years. However, the extent to which professional development experiences incorporate elements of best practice varies. For example, of the science and mathematics teachers who have participated in professional development, the majority of secondary teachers have had opportunities to work closely with other teachers from their school or who teach the same subject/grade. In contrast, few science and mathematics teachers have had more than 35 hours of professional development in the last three years. Workshops are the most prevalent form of professional development, and participation in teacher study groups is also quite common. Roughly one-third of secondary science and mathematics teachers have attended a meeting of a national, state, or regional professional association; few elementary teachers have attended such meetings in the last three years. Similar percentages of teachers have taken a formal course for college credit in science/mathematics, or the teaching of science/mathematics, in the last three years. The emphasis of these professional development opportunities, across the subject and grade-range categories, has largely been on planning instruction to enable students at different levels of achievement to enhance their understanding, monitoring student understanding during instruction, and assessing student understanding at the end of instruction on a topic. Learning
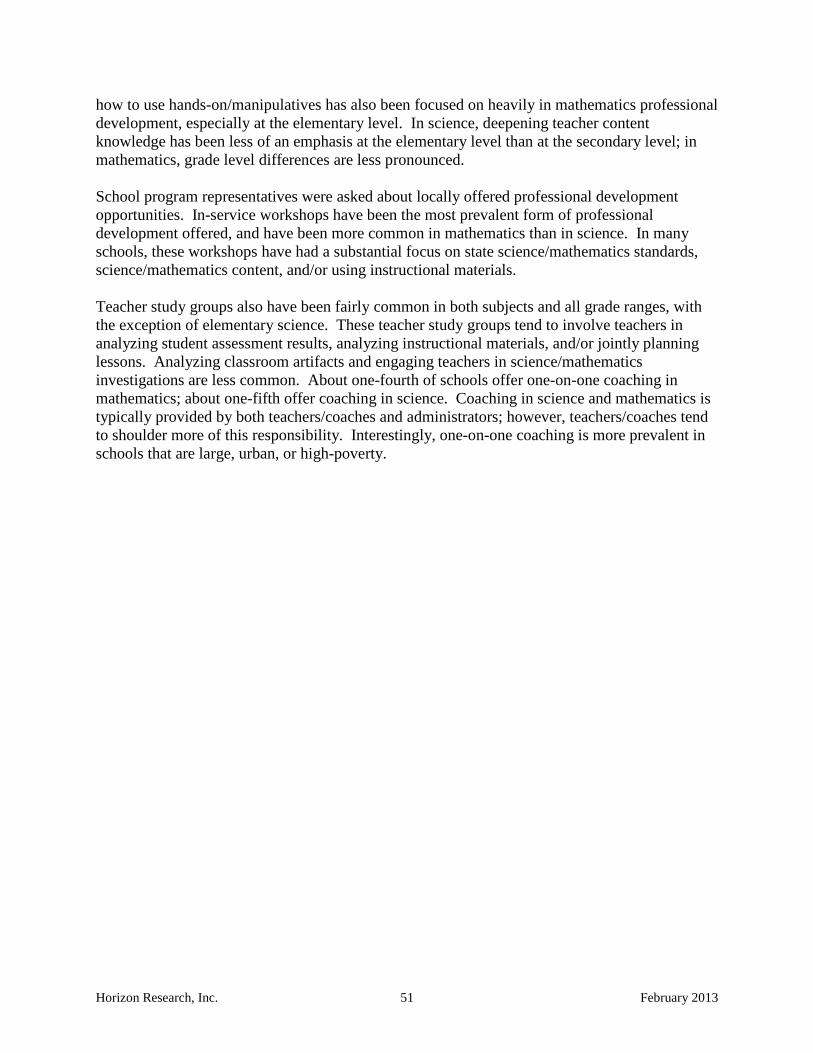
Horizon Research, Inc. 51 February 2013
how to use hands-on/manipulatives has also been focused on heavily in mathematics professional development, especially at the elementary level. In science, deepening teacher content knowledge has been less of an emphasis at the elementary level than at the secondary level; in mathematics, grade level differences are less pronounced. School program representatives were asked about locally offered professional development opportunities. In-service workshops have been the most prevalent form of professional development offered, and have been more common in mathematics than in science. In many schools, these workshops have had a substantial focus on state science/mathematics standards, science/mathematics content, and/or using instructional materials. Teacher study groups also have been fairly common in both subjects and all grade ranges, with the exception of elementary science. These teacher study groups tend to involve teachers in analyzing student assessment results, analyzing instructional materials, and/or jointly planning lessons. Analyzing classroom artifacts and engaging teachers in science/mathematics investigations are less common. About one-fourth of schools offer one-on-one coaching in mathematics; about one-fifth offer coaching in science. Coaching in science and mathematics is typically provided by both teachers/coaches and administrators; however, teachers/coaches tend to shoulder more of this responsibility. Interestingly, one-on-one coaching is more prevalent in schools that are large, urban, or high-poverty.

Horizon Research, Inc. 52 February 2013
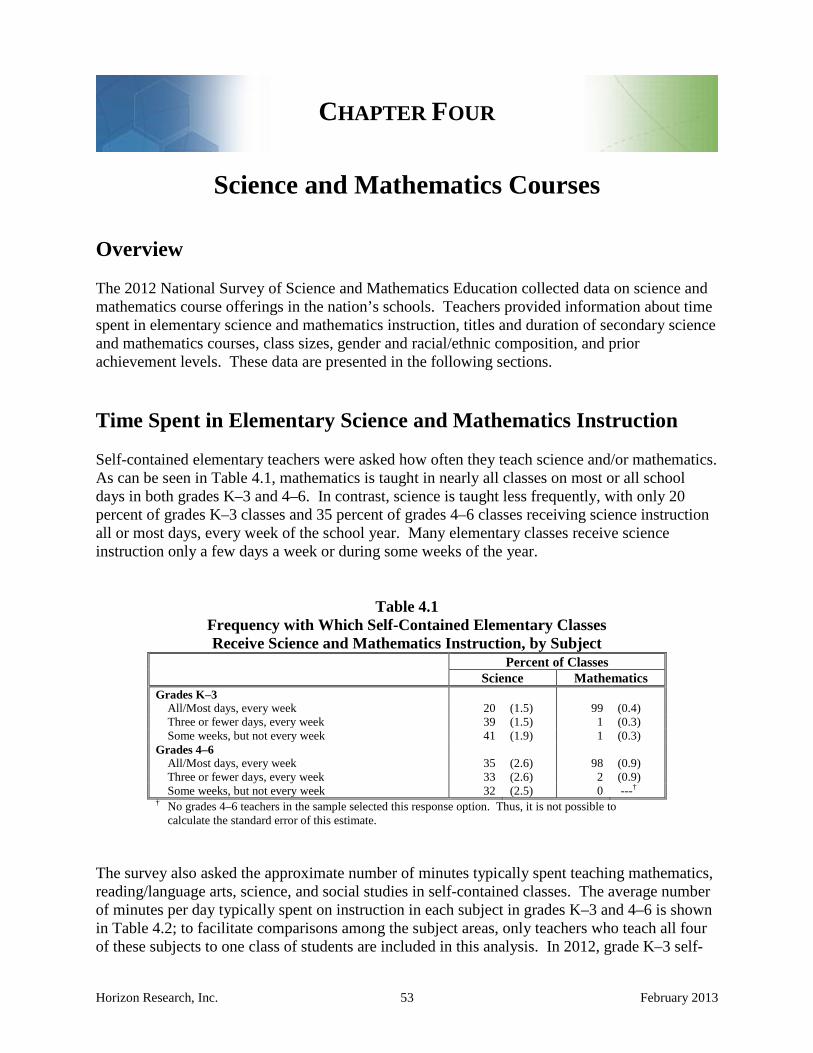
Horizon Research, Inc. 53 February 2013
CHAPTER FOUR
Science and Mathematics Courses Overview The 2012 National Survey of Science and Mathematics Education collected data on science and mathematics course offerings in the nation’s schools. Teachers provided information about time spent in elementary science and mathematics instruction, titles and duration of secondary science and mathematics courses, class sizes, gender and racial/ethnic composition, and prior achievement levels. These data are presented in the following sections. Time Spent in Elementary Science and Mathematics Instruction Self-contained elementary teachers were asked how often they teach science and/or mathematics. As can be seen in Table 4.1, mathematics is taught in nearly all classes on most or all school days in both grades K–3 and 4–6. In contrast, science is taught less frequently, with only 20 percent of grades K–3 classes and 35 percent of grades 4–6 classes receiving science instruction all or most days, every week of the school year. Many elementary classes receive science instruction only a few days a week or during some weeks of the year.
Table 4.1 Frequency with Which Self-Contained Elementary Classes Receive Science and Mathematics Instruction, by Subject
Percent of Classes Science Mathematics Grades K–3
All/Most days, every week 20 (1.5) 99 (0.4) Three or fewer days, every week 39 (1.5) 1 (0.3) Some weeks, but not every week 41 (1.9) 1 (0.3)
Grades 4–6 All/Most days, every week 35 (2.6) 98 (0.9) Three or fewer days, every week 33 (2.6) 2 (0.9) Some weeks, but not every week 32 (2.5) 0 ---†
† No grades 4–6 teachers in the sample selected this response option. Thus, it is not possible to calculate the standard error of this estimate.
The survey also asked the approximate number of minutes typically spent teaching mathematics, reading/language arts, science, and social studies in self-contained classes. The average number of minutes per day typically spent on instruction in each subject in grades K–3 and 4–6 is shown in Table 4.2; to facilitate comparisons among the subject areas, only teachers who teach all four of these subjects to one class of students are included in this analysis. In 2012, grade K–3 self-

Horizon Research, Inc. 54 February 2013
contained classes spent an average of 89 minutes per day on reading instruction and 54 minutes on mathematics instruction, compared to only 19 minutes on science and 16 minutes on social studies instruction. The pattern in grades 4–6 is similar, with 83 minutes per day devoted to reading, 61 minutes to mathematics, 24 minutes to science, and 21 minutes to social studies instruction. (Note: There are no substantive differences in instructional time on these subjects by the various equity factors; see Appendix F.)
Table 4.2 Average Number of Minutes per Day Spent
Teaching Each Subject in Self-Contained Classes,† by Grades Number of Minutes Grades K–3 Grades 4–6 Reading/Language Arts 89 (1.7) 83 (2.2) Mathematics 54 (1.0) 61 (1.4) Science 19 (0.5) 24 (0.9) Social Studies 16 (0.4) 21 (0.8) † Only teachers who indicated they teach reading/language arts, mathematics, science, and
social studies to one class of students were included in these analyses. Science and Mathematics Course Offerings Middle and high schools in the sample were given a list of science and mathematics courses and asked to specify the number of sections of each course offered in the school. Respondents were also asked about opportunities provided to students to take courses not offered on site such as through telecommunications or at another school. Middle schools were asked whether they offered single-discipline science courses (e.g., life science, physical science), coordinated/integrated science courses, or both in each grade 6–8 contained in the school. As can be seen in Table 4.3, 45 percent of schools containing 6th grade offer only coordinated/integrated science, and 36 percent offer only single-discipline courses; this pattern is reversed in grades 7 and 8. Fewer than 1 in 5 schools containing these grades offer both types of courses.
Table 4.3 Type of Middle School Science Courses Offered, by Grade
Percent of Schools Grade 6 Grade 7 Grade 8 Single-Discipline Science Courses Only 36 (3.6) 46 (3.8) 47 (3.8) Coordinated or Integrated Science Courses Only 45 (4.1) 38 (3.7) 36 (3.7) Both 19 (3.5) 15 (3.6) 18 (3.5)
Table 4.4 shows courses offered in high schools. Almost all (98 percent) schools with grades 9–12 offer courses in biology/life science, with 73 percent offering non-college prep courses, 89 percent offering 1st year college preparatory courses, and 64 percent offering at least one 2nd year
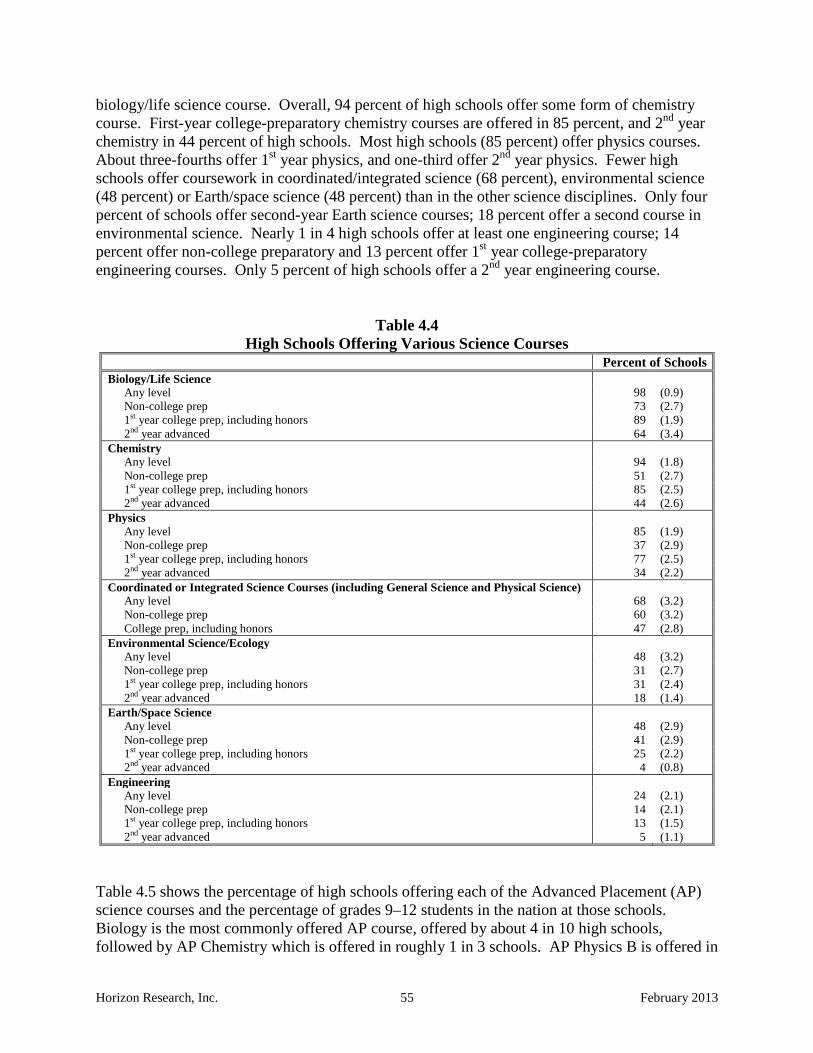
Horizon Research, Inc. 55 February 2013
biology/life science course. Overall, 94 percent of high schools offer some form of chemistry course. First-year college-preparatory chemistry courses are offered in 85 percent, and 2nd year chemistry in 44 percent of high schools. Most high schools (85 percent) offer physics courses. About three-fourths offer 1st year physics, and one-third offer 2nd year physics. Fewer high schools offer coursework in coordinated/integrated science (68 percent), environmental science (48 percent) or Earth/space science (48 percent) than in the other science disciplines. Only four percent of schools offer second-year Earth science courses; 18 percent offer a second course in environmental science. Nearly 1 in 4 high schools offer at least one engineering course; 14 percent offer non-college preparatory and 13 percent offer 1st year college-preparatory engineering courses. Only 5 percent of high schools offer a 2nd year engineering course.
Table 4.4 High Schools Offering Various Science Courses
Percent of Schools Biology/Life Science
Any level 98 (0.9) Non-college prep 73 (2.7) 1st year college prep, including honors 89 (1.9) 2nd year advanced 64 (3.4)
Chemistry Any level 94 (1.8) Non-college prep 51 (2.7) 1st year college prep, including honors 85 (2.5) 2nd year advanced 44 (2.6)
Physics Any level 85 (1.9) Non-college prep 37 (2.9) 1st year college prep, including honors 77 (2.5) 2nd year advanced 34 (2.2)
Coordinated or Integrated Science Courses (including General Science and Physical Science) Any level 68 (3.2) Non-college prep 60 (3.2) College prep, including honors 47 (2.8)
Environmental Science/Ecology Any level 48 (3.2) Non-college prep 31 (2.7) 1st year college prep, including honors 31 (2.4) 2nd year advanced 18 (1.4)
Earth/Space Science Any level 48 (2.9) Non-college prep 41 (2.9) 1st year college prep, including honors 25 (2.2) 2nd year advanced 4 (0.8)
Engineering Any level 24 (2.1) Non-college prep 14 (2.1) 1st year college prep, including honors 13 (1.5) 2nd year advanced 5 (1.1)
Table 4.5 shows the percentage of high schools offering each of the Advanced Placement (AP) science courses and the percentage of grades 9–12 students in the nation at those schools. Biology is the most commonly offered AP course, offered by about 4 in 10 high schools, followed by AP Chemistry which is offered in roughly 1 in 3 schools. AP Physics B is offered in

Horizon Research, Inc. 56 February 2013
22 percent of high schools; AP Physics C in only 12 percent of high schools. AP Environmental Science is offered in 17 percent of high schools. That the percentage of high school students with access to each course is much larger than the percentage of schools offering it indicates that larger schools are more likely than smaller schools to offer AP science courses.
Table 4.5 Access to AP Science Courses
Percent of High Schools Offering
Percent of High School Students with Access
AP Biology 43 (2.8) 74 (1.7) AP Chemistry 34 (2.3) 67 (1.8) AP Physics B 22 (1.8) 48 (1.9) AP Environmental Science 17 (1.3) 38 (2.0) AP Physics C 12 (1.2) 25 (2.0)
Across the disciplines, 47 percent of high schools offer at least one AP science course, either this year or in alternating years (see Table 4.6). Approximately the same percentage of schools offers 1–4 AP science courses, with about 10 percent of schools in each category. Only 5 percent of schools offer all of the AP science courses.
Table 4.6 Number of AP Science
Courses Offered at High Schools Percent of Schools† 0 courses 53 (3.1) 1 course 11 (2.1) 2 courses 10 (1.4) 3 courses 11 (1.4) 4 courses 10 (1.2) 5 courses 5 (0.8) † Only schools that responded about each AP science course
are included in this analysis. Table 4.7 shows the average number of AP science courses offered by various equity factors. Not surprisingly, small schools tend to offer fewer AP science courses than large schools. On average, suburban and urban schools offer more AP science courses than rural schools. In addition, schools with higher proportions of students eligible for free/reduced-price lunch offer fewer AP science courses.

Horizon Research, Inc. 57 February 2013
Table 4.7 Average Number of AP Science Courses
Offered at High Schools, by Equity Factors Average Number of Courses Percent of Students in School Eligible for FRL
Lowest Quartile 2.0 (0.2) Second Quartile 1.5 (0.3) Third Quartile 1.1 (0.2) Highest Quartile 1.1 (0.2)
School Size Smallest Schools 0.7 (0.1) Second Group 1.2 (0.2) Third Group 2.1 (0.2) Largest Schools 2.8 (0.2)
Community Type Rural 0.7 (0.1) Suburban 1.7 (0.2) Urban 1.7 (0.3)
The survey also asked schools about opportunities provided to students to take science and engineering courses not offered on site. As was described previously, 85 percent of high schools offer at least one physics course; a small additional percentage of schools provide students with access to physics, either by offering it in alternative years or by allowing students to take the course off campus (see Table 4.8). Over one-fourth of high schools provide access to concurrent credit/dual enrollment courses—courses that count for high school and college credit. Having students take science and/or engineering courses at a Career and Technical Education Center, at a college/university, or via telecommunications are each opportunities at about 1 in 5 high schools. Fewer than 10 percent of high schools have students take science/engineering courses at another high school.
Table 4.8 Science Programs and Practices
Currently Being Implemented in High Schools Percent of Schools Physics courses offered this school year or in alternating years, on or off site 88 (2.9) Concurrent credit/dual enrollment courses offered this school year or in alternating years 28 (2.8) Students go to a Career and Technical Education Center for science and/or engineering instruction 22 (3.2) Students go to a college or university for science and/or engineering courses 22 (2.4) Science and/or engineering courses offered by telecommunications 18 (2.9) Students go to another K–12 school for science and/or engineering courses 8 (2.5)
In mathematics, middle schools were asked how many 8th grade students would complete Algebra 1 and Geometry prior to 9th grade. As can be seen in Table 4.9, three-fourths of middle schools have had some students complete Algebra 1 and just over one-fourth have had students complete Geometry. Fewer than one-third of middle schools have had 51 percent or more of their students complete Algebra 1; in schools that offer Geometry, only a small percentage of students typically complete the course prior to 9th grade.
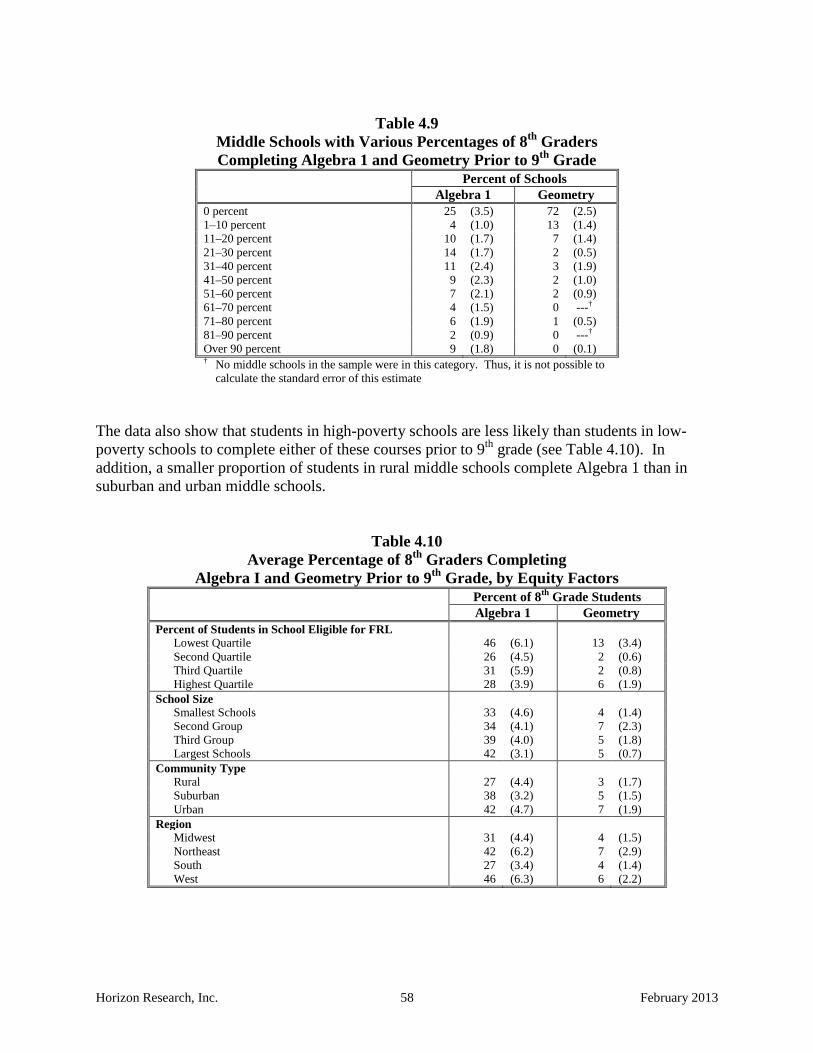
Horizon Research, Inc. 58 February 2013
Table 4.9
Middle Schools with Various Percentages of 8th Graders Completing Algebra 1 and Geometry Prior to 9th Grade
Percent of Schools
Algebra 1 Geometry 0 percent 25 (3.5) 72 (2.5) 1–10 percent 4 (1.0) 13 (1.4) 11–20 percent 10 (1.7) 7 (1.4) 21–30 percent 14 (1.7) 2 (0.5) 31–40 percent 11 (2.4) 3 (1.9) 41–50 percent 9 (2.3) 2 (1.0) 51–60 percent 7 (2.1) 2 (0.9) 61–70 percent 4 (1.5) 0 ---† 71–80 percent 6 (1.9) 1 (0.5) 81–90 percent 2 (0.9) 0 ---† Over 90 percent 9 (1.8) 0 (0.1) † No middle schools in the sample were in this category. Thus, it is not possible to
calculate the standard error of this estimate The data also show that students in high-poverty schools are less likely than students in low-poverty schools to complete either of these courses prior to 9th grade (see Table 4.10). In addition, a smaller proportion of students in rural middle schools complete Algebra 1 than in suburban and urban middle schools.
Table 4.10 Average Percentage of 8th Graders Completing
Algebra I and Geometry Prior to 9th Grade, by Equity Factors Percent of 8th Grade Students
Algebra 1 Geometry Percent of Students in School Eligible for FRL
Lowest Quartile 46 (6.1) 13 (3.4) Second Quartile 26 (4.5) 2 (0.6) Third Quartile 31 (5.9) 2 (0.8) Highest Quartile 28 (3.9) 6 (1.9)
School Size Smallest Schools 33 (4.6) 4 (1.4) Second Group 34 (4.1) 7 (2.3) Third Group 39 (4.0) 5 (1.8) Largest Schools 42 (3.1) 5 (0.7)
Community Type Rural 27 (4.4) 3 (1.7) Suburban 38 (3.2) 5 (1.5) Urban 42 (4.7) 7 (1.9)
Region Midwest 31 (4.4) 4 (1.5) Northeast 42 (6.2) 7 (2.9) South 27 (3.4) 4 (1.4) West 46 (6.3) 6 (2.2)

Horizon Research, Inc. 59 February 2013
Table 4.11 shows mathematics courses offered at the high school level. Nearly all high schools offer a first year formal/college-preparatory mathematics course such as Algebra 1 or Integrated Math 1. The vast majority of high schools also offer a second and third year of formal mathematics. Fewer, but still a large majority offer a fourth year of formal mathematics such as Pre-Calculus. About three-fourths of high schools offer mathematics courses that might qualify for college credit such as AP Calculus or AP statistics.
Table 4.11 High Schools Offering Various Mathematics Courses
Percent of Schools Non-college prep (e.g., Remedial Math, General Math, Consumer Math) 78 (3.2) Formal/College-prep Level 1 (e.g., Algebra 1, Integrated Math 1) 99 (0.7) Formal/College-prep Level 2 (e.g., Geometry, Integrated Math 2) 90 (3.7) Formal/College-prep Level 3 (e.g., Algebra 2, Algebra and Trigonometry) 94 (3.5) Formal/College-prep Level 4 (e.g., Pre-Calculus, Algebra 3) 85 (3.8) Courses that might qualify for college credit (e.g., AP Calculus, AP Statistics) 76 (4.0)
As can be seen in Table 4.12, just over half of high schools offer AP Calculus AB. AP Calculus BC and AP Statistics are each offered by about one-fourth of high schools. As was the case in science, AP mathematics courses are more likely to be offered in larger schools as the percentage of grades 9–12 students with access to each course is substantially greater than the percentage of schools offering it.
Table 4.12 Access to AP Mathematics Courses
Percent of High Schools Offering
Percent of High School Students with Access
AP Calculus AB 52 (3.5) 81 (1.6) AP Statistics 27 (2.1) 59 (1.9) AP Calculus BC 23 (2.5) 47 (2.1)
Twenty percent of high schools offer only one AP mathematics course (see Table 4.13). Seventeen percent offer two and 14 percent offer three different AP mathematics courses.
Table 4.13 Number of AP Mathematics
Courses Offered at High Schools Percent of Schools† 0 courses 49 (3.5) 1 course 20 (2.6) 2 courses 17 (2.7) 3 courses 14 (1.3) † Only schools that responded about each AP mathematics
course are included in this analysis.
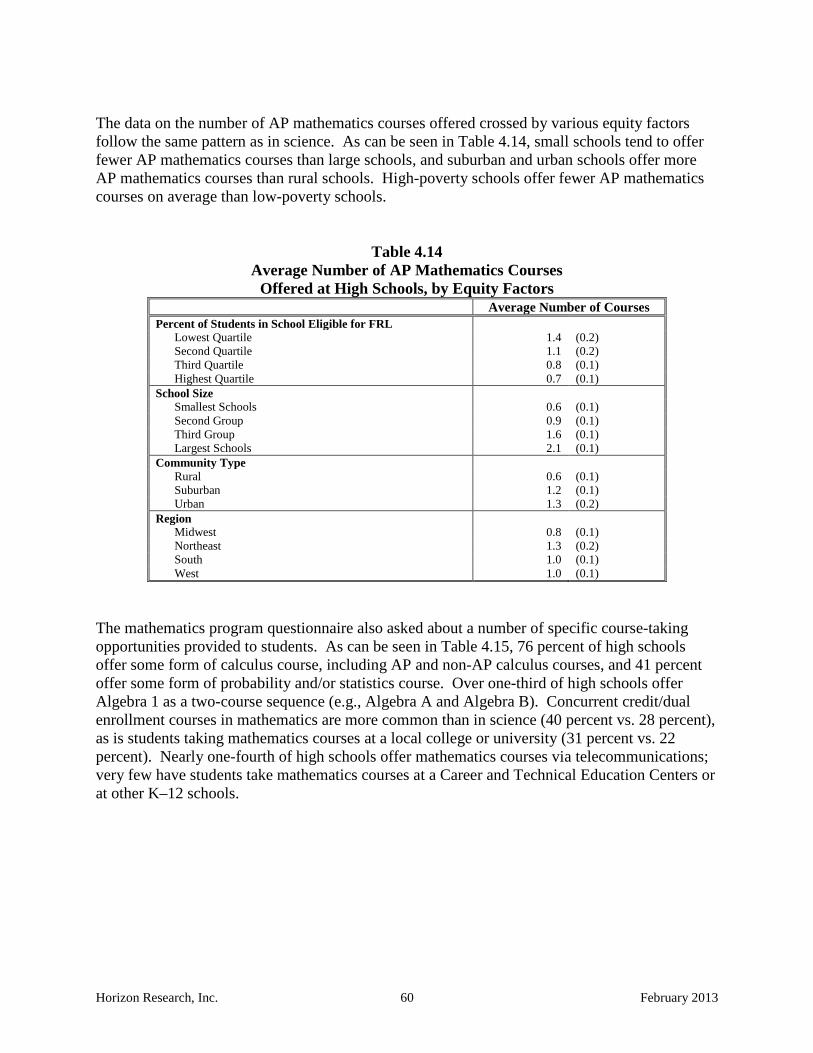
Horizon Research, Inc. 60 February 2013
The data on the number of AP mathematics courses offered crossed by various equity factors follow the same pattern as in science. As can be seen in Table 4.14, small schools tend to offer fewer AP mathematics courses than large schools, and suburban and urban schools offer more AP mathematics courses than rural schools. High-poverty schools offer fewer AP mathematics courses on average than low-poverty schools.
Table 4.14 Average Number of AP Mathematics Courses
Offered at High Schools, by Equity Factors Average Number of Courses Percent of Students in School Eligible for FRL
Lowest Quartile 1.4 (0.2) Second Quartile 1.1 (0.2) Third Quartile 0.8 (0.1) Highest Quartile 0.7 (0.1)
School Size Smallest Schools 0.6 (0.1) Second Group 0.9 (0.1) Third Group 1.6 (0.1) Largest Schools 2.1 (0.1)
Community Type Rural 0.6 (0.1) Suburban 1.2 (0.1) Urban 1.3 (0.2)
Region Midwest 0.8 (0.1) Northeast 1.3 (0.2) South 1.0 (0.1) West 1.0 (0.1)
The mathematics program questionnaire also asked about a number of specific course-taking opportunities provided to students. As can be seen in Table 4.15, 76 percent of high schools offer some form of calculus course, including AP and non-AP calculus courses, and 41 percent offer some form of probability and/or statistics course. Over one-third of high schools offer Algebra 1 as a two-course sequence (e.g., Algebra A and Algebra B). Concurrent credit/dual enrollment courses in mathematics are more common than in science (40 percent vs. 28 percent), as is students taking mathematics courses at a local college or university (31 percent vs. 22 percent). Nearly one-fourth of high schools offer mathematics courses via telecommunications; very few have students take mathematics courses at a Career and Technical Education Centers or at other K–12 schools.
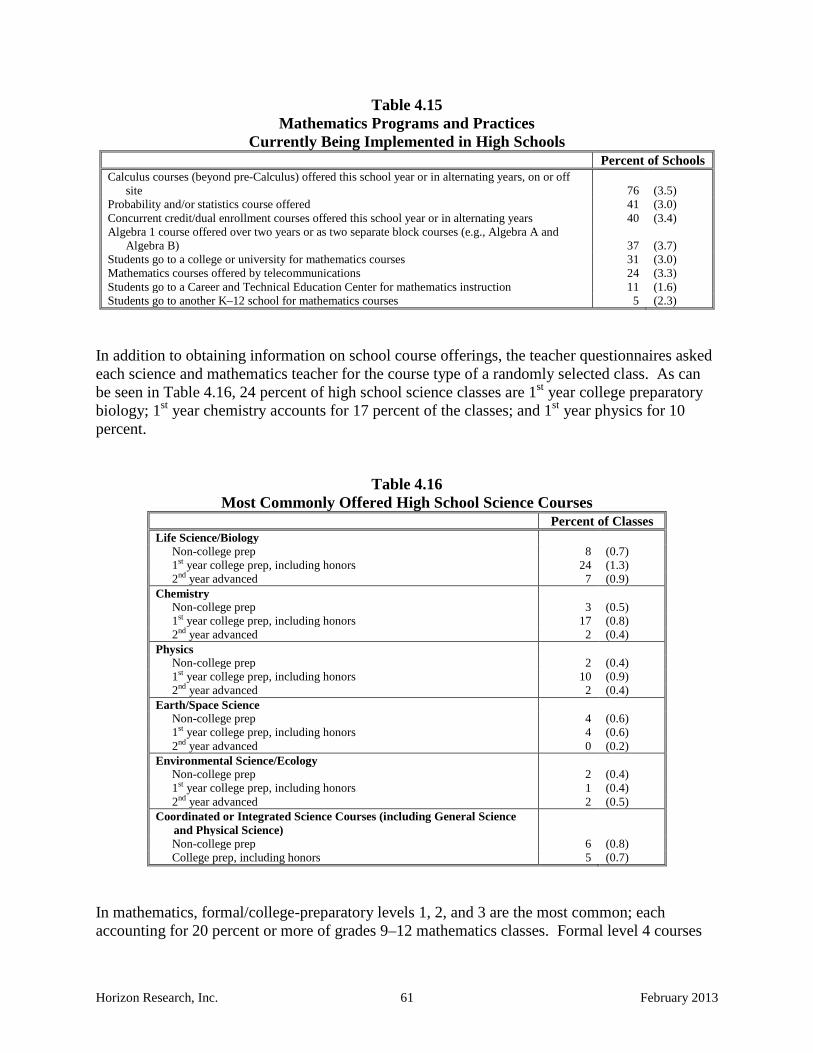
Horizon Research, Inc. 61 February 2013
Table 4.15 Mathematics Programs and Practices
Currently Being Implemented in High Schools Percent of Schools Calculus courses (beyond pre-Calculus) offered this school year or in alternating years, on or off
site 76 (3.5) Probability and/or statistics course offered 41 (3.0) Concurrent credit/dual enrollment courses offered this school year or in alternating years 40 (3.4) Algebra 1 course offered over two years or as two separate block courses (e.g., Algebra A and
Algebra B) 37 (3.7) Students go to a college or university for mathematics courses 31 (3.0) Mathematics courses offered by telecommunications 24 (3.3) Students go to a Career and Technical Education Center for mathematics instruction 11 (1.6) Students go to another K–12 school for mathematics courses 5 (2.3)
In addition to obtaining information on school course offerings, the teacher questionnaires asked each science and mathematics teacher for the course type of a randomly selected class. As can be seen in Table 4.16, 24 percent of high school science classes are 1st year college preparatory biology; 1st year chemistry accounts for 17 percent of the classes; and 1st year physics for 10 percent.
Table 4.16 Most Commonly Offered High School Science Courses
Percent of Classes Life Science/Biology
Non-college prep 8 (0.7) 1st year college prep, including honors 24 (1.3) 2nd year advanced 7 (0.9)
Chemistry Non-college prep 3 (0.5) 1st year college prep, including honors 17 (0.8) 2nd year advanced 2 (0.4)
Physics Non-college prep 2 (0.4) 1st year college prep, including honors 10 (0.9) 2nd year advanced 2 (0.4)
Earth/Space Science Non-college prep 4 (0.6) 1st year college prep, including honors 4 (0.6) 2nd year advanced 0 (0.2)
Environmental Science/Ecology Non-college prep 2 (0.4) 1st year college prep, including honors 1 (0.4) 2nd year advanced 2 (0.5)
Coordinated or Integrated Science Courses (including General Science and Physical Science) Non-college prep 6 (0.8) College prep, including honors 5 (0.7)
In mathematics, formal/college-preparatory levels 1, 2, and 3 are the most common; each accounting for 20 percent or more of grades 9–12 mathematics classes. Formal level 4 courses

Horizon Research, Inc. 62 February 2013
make up 15 percent of the classes; non-college prep mathematics 13 percent; and courses that might qualify for college credit account for eight percent of classes.
Table 4.17 Most Commonly Offered High School Mathematics Courses
Percent of Classes Non-college prep (e.g., Remedial Math, General Math, Consumer Math) 13 (1.0) Formal/College-prep Level 1 (e.g., Algebra 1, Integrated Math 1) 20 (1.3) Formal/College-prep Level 2 (e.g., Geometry, Integrated Math 2) 23 (1.2) Formal/College-prep Level 3 (e.g., Algebra 2, Algebra and Trigonometry) 21 (1.1) Formal/College-prep Level 4 (e.g., Pre-Calculus, Algebra 3) 15 (1.1) Courses that might qualify for college credit (e.g., AP Calculus, AP Statistics) 8 (0.7)
Other Characteristics of Science and Mathematics Classes The 2012 National Survey found that the average size of science and mathematics classes is generally around 21 to 24 students (see Table 4.18). However, as can be seen in Figures 4.1–4.6, averages obscure the wide variation in class sizes. For example, 20 percent of middle grades science classes have 30 or more students.
Table 4.18 Average Class Size, by Subject and Course Type
Average Number of Students Science Mathematics Grade Range
Elementary 21.9 (0.2) 21.4 (0.2) Middle 23.6 (0.4) 22.1 (0.4) High 21.7 (0.3) 21.4 (0.3)
High School Science Courses Non-college Prep 21.3 (0.5) — — 1st Year Biology 21.9 (0.7) — — 1st Year Chemistry 22.3 (0.6) — — 1st Year Physics 20.5 (1.0) — — Advanced Science Courses 18.9 (0.8) — —
High School Mathematics Courses Non-college Prep (e.g., Remedial Math, General Math, Consumer Math) — — 19.0 (0.7) Formal/College-prep Level 1 (e.g., Algebra 1, Integrated Math 1) — — 22.4 (0.5) Formal/College-prep Level 2 (e.g., Geometry, Integrated Math 2) — — 22.5 (0.5) Formal/College-prep Level 3 (e.g., Algebra 2, Algebra and Trigonometry) — — 21.4 (0.7) Formal/College-prep Level 4 (e.g., Pre-Calculus, Algebra 3) — — 21.1 (0.5) Courses that might qualify for college credit (e.g., AP Calculus, AP Statistics) — — 18.2 (0.9)
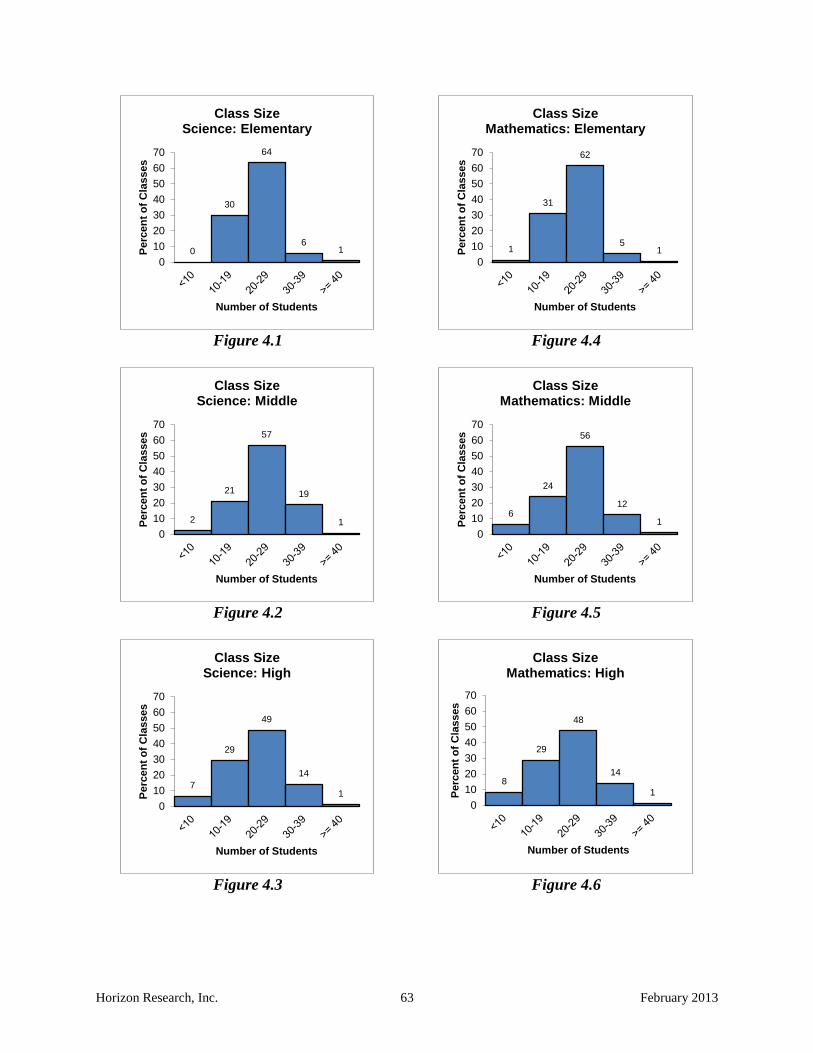
Horizon Research, Inc. 63 February 2013
Figure 4.1
Figure 4.4
Figure 4.2
Figure 4.5
Figure 4.3
Figure 4.6
0
30
64
6 1
010203040506070
Perc
ent o
f Cla
sses
Number of Students
Class Size Science: Elementary
1
31
62
5 1
010203040506070
Perc
ent o
f Cla
sses
Number of Students
Class Size Mathematics: Elementary
2
21
57
19
1 0
10203040506070
Perc
ent o
f Cla
sses
Number of Students
Class Size Science: Middle
6
24
56
12
1 0
10203040506070
Perc
ent o
f Cla
sses
Number of Students
Class Size Mathematics: Middle
7
29
49
14
1 0
10203040506070
Perc
ent o
f Cla
sses
Number of Students
Class Size Science: High
8
29
48
14
1 0
10203040506070
Perc
ent o
f Cla
sses
Number of Students
Class Size Mathematics: High

Horizon Research, Inc. 64 February 2013
Teachers were asked to indicate the prior achievement level of students in the selected class relative to other students in the school. At the elementary level, 45 percent of science and mathematics classes are heterogeneous in prior achievement; most of the remaining classes are composed primarily of average-achieving students (see Table 4.19). Heterogeneous grouping is less common at the secondary level in both science and mathematics.
Table 4.19 Prior-Achievement Grouping in Classes, by Subject and Grade Range
Percent of Classes Elementary Middle High Science Classes
Mostly low achievers 10 (1.3) 14 (2.0) 13 (1.1) Mostly average achievers 37 (1.8) 33 (2.0) 30 (1.3) Mostly high achievers 9 (1.1) 13 (1.6) 28 (1.3) A mixture of levels 45 (2.0) 39 (2.3) 29 (1.4)
Mathematics Classes Mostly low achievers 12 (1.0) 27 (1.8) 24 (1.1) Mostly average achievers 35 (1.6) 24 (1.8) 28 (1.5) Mostly high achievers 9 (0.9) 24 (1.7) 26 (1.1) A mixture of levels 45 (1.5) 26 (1.8) 22 (1.1)
Table 4.20 shows that the use of heterogeneous grouping in high school science classes is similar across courses with the exception of advanced science courses where the percentage drops. Not surprisingly, the percentage of science classes composed mostly of high achievers tends to increase across the traditional course sequence; for example, 28 percent of 1st year chemistry classes consist mostly of high achievers, compared to 48 percent of 1st year physics classes and 67 percent of 2nd year science classes. A similar trend occurs in mathematics, where 29 percent of level 3 classes are composed mostly of high achievers compared to 52 percent of level 4 classes and 74 percent of classes that might qualify for college credit.
Table 4.20 Prior-Achievement Grouping in High School Courses, by Subject
Percent of Classes Mostly
Low Achievers
Mostly Average
Achievers
Mostly High
Achievers
A Mixture of
Levels Science Courses
Non-college prep 25 (2.7) 31 (2.3) 10 (1.9) 33 (3.3) 1st Year Biology 16 (2.7) 31 (3.0) 22 (2.9) 31 (3.7) 1st Year Chemistry 6 (1.2) 36 (3.3) 28 (2.6) 30 (2.9) 1st Year Physics 4 (1.8) 19 (2.9) 48 (5.0) 30 (4.2) Advanced Science Courses 2 (1.2) 14 (3.6) 67 (4.3) 17 (3.3)
Mathematics Classes Non-college prep 72 (3.7) 14 (3.4) 2 (1.3) 12 (2.4) Formal/College-prep Level 1 37 (3.1) 33 (3.2) 6 (1.5) 24 (2.5) Formal/College-prep Level 2 17 (2.4) 37 (3.4) 21 (2.5) 26 (2.8) Formal/College-prep Level 3 12 (2.5) 35 (3.3) 29 (2.4) 24 (2.7) Formal/College-prep Level 4 4 (1.2) 28 (4.1) 52 (4.3) 17 (2.2) Courses that might qualify for college credit 4 (2.2) 4 (1.8) 74 (5.2) 18 (4.9)
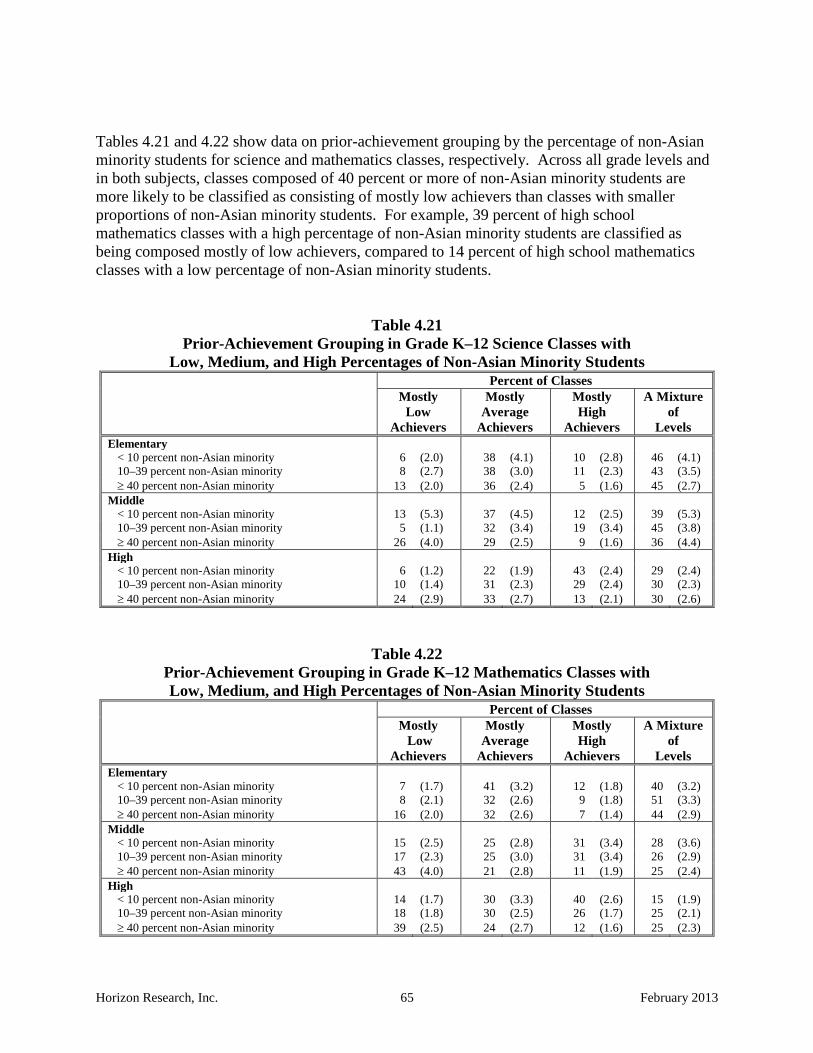
Horizon Research, Inc. 65 February 2013
Tables 4.21 and 4.22 show data on prior-achievement grouping by the percentage of non-Asian minority students for science and mathematics classes, respectively. Across all grade levels and in both subjects, classes composed of 40 percent or more of non-Asian minority students are more likely to be classified as consisting of mostly low achievers than classes with smaller proportions of non-Asian minority students. For example, 39 percent of high school mathematics classes with a high percentage of non-Asian minority students are classified as being composed mostly of low achievers, compared to 14 percent of high school mathematics classes with a low percentage of non-Asian minority students.
Table 4.21 Prior-Achievement Grouping in Grade K–12 Science Classes with
Low, Medium, and High Percentages of Non-Asian Minority Students Percent of Classes Mostly
Low Achievers
Mostly Average
Achievers
Mostly High
Achievers
A Mixture of
Levels Elementary
< 10 percent non-Asian minority 6 (2.0) 38 (4.1) 10 (2.8) 46 (4.1) 10–39 percent non-Asian minority 8 (2.7) 38 (3.0) 11 (2.3) 43 (3.5) ≥ 40 percent non-Asian minority 13 (2.0) 36 (2.4) 5 (1.6) 45 (2.7)
Middle < 10 percent non-Asian minority 13 (5.3) 37 (4.5) 12 (2.5) 39 (5.3) 10–39 percent non-Asian minority 5 (1.1) 32 (3.4) 19 (3.4) 45 (3.8) ≥ 40 percent non-Asian minority 26 (4.0) 29 (2.5) 9 (1.6) 36 (4.4)
High < 10 percent non-Asian minority 6 (1.2) 22 (1.9) 43 (2.4) 29 (2.4) 10–39 percent non-Asian minority 10 (1.4) 31 (2.3) 29 (2.4) 30 (2.3) ≥ 40 percent non-Asian minority 24 (2.9) 33 (2.7) 13 (2.1) 30 (2.6)
Table 4.22 Prior-Achievement Grouping in Grade K–12 Mathematics Classes with Low, Medium, and High Percentages of Non-Asian Minority Students
Percent of Classes Mostly
Low Achievers
Mostly Average
Achievers
Mostly High
Achievers
A Mixture of
Levels Elementary
< 10 percent non-Asian minority 7 (1.7) 41 (3.2) 12 (1.8) 40 (3.2) 10–39 percent non-Asian minority 8 (2.1) 32 (2.6) 9 (1.8) 51 (3.3) ≥ 40 percent non-Asian minority 16 (2.0) 32 (2.6) 7 (1.4) 44 (2.9)
Middle < 10 percent non-Asian minority 15 (2.5) 25 (2.8) 31 (3.4) 28 (3.6) 10–39 percent non-Asian minority 17 (2.3) 25 (3.0) 31 (3.4) 26 (2.9) ≥ 40 percent non-Asian minority 43 (4.0) 21 (2.8) 11 (1.9) 25 (2.4)
High < 10 percent non-Asian minority 14 (1.7) 30 (3.3) 40 (2.6) 15 (1.9) 10–39 percent non-Asian minority 18 (1.8) 30 (2.5) 26 (1.7) 25 (2.1) ≥ 40 percent non-Asian minority 39 (2.5) 24 (2.7) 12 (1.6) 25 (2.3)

Horizon Research, Inc. 66 February 2013
A similar pattern is seen in the class composition data for specific high school courses (see Table 4.23). The percentage of non-Asian minorities trends downward across the progression of science and mathematics courses. For example, 33 percent of students enrolled in 1st year Biology are classified as non-Asian minorities, similar to the overall percentage in high school science classes, compared to only 21 percent in advanced science courses. In mathematics, 39 percent of students in Formal/College-preparatory level 1 courses are non-Asian minorities, while fewer than one-fourth of students in level 4 or above courses are. In terms of gender, females are less likely than males to be enrolled in non-college preparatory science and mathematics classes, and more likely than males to be enrolled in advanced science courses.
Table 4.23 Average Percentages of Female and Non-Asian Minority Students in Courses, by Grade Range and Course Type
Science Mathematics
Female Non-Asian Minority Female
Non-Asian Minority
Grades Elementary 48 (0.5) 39 (1.9) 47 (0.5) 40 (1.5) Middle 46 (0.7) 36 (1.6) 48 (0.6) 37 (1.8) High 49 (0.8) 31 (1.2) 48 (0.7) 31 (1.1)
High School Science Courses Non-college prep 46 (1.2) 36 (2.3) — — — — 1st Year Biology 49 (1.6) 33 (2.7) — — — — 1st Year Chemistry 51 (1.4) 30 (1.8) — — — — 1st Year Physics 49 (1.8) 23 (2.7) — — — — Advanced Science Courses 54 (1.9) 21 (2.3) — — — —
High School Mathematics Courses Non-college prep — — — — 42 (1.4) 45 (3.3) Formal/College-prep Level 1 — — — — 48 (1.1) 39 (2.2) Formal/College-prep Level 2 — — — — 50 (1.5) 31 (2.0) Formal/College-prep Level 3 — — — — 51 (1.4) 27 (2.3) Formal/College-prep Level 4 — — — — 48 (2.1) 22 (2.0) Courses that might qualify for college credit — — — — 48 (1.7) 17 (2.0)
Summary Data from the 2012 National Survey indicate that in the early grades, mathematics is taught much more frequently than science. Almost all elementary classes spend time on mathematics instruction every school day; in contrast, only 1 in 3 classes in grades 4–6 and 1 in 5 classes in grades K–3 classes receive science instruction every school day. In addition, elementary mathematics lessons tend to be substantially longer than science lessons, although the amount of time devoted to science and mathematics is substantially less than reading/language arts. In terms of the number of high schools offering various courses, virtually all schools offer at least one biology course, and nearly all offer chemistry; somewhat fewer offer physics. Environmental science and Earth/space science courses are each offered in about half of high schools. In mathematics, although most middle schools offer Algebra 1, relatively few students

Horizon Research, Inc. 67 February 2013
complete it prior to 9th grade. At the high school level, almost all schools offer the three-course sequence of Algebra 1, Geometry, and Algebra 2. Nearly as many high schools offer a fourth year in the formal mathematics sequence; three-fourths of high schools offer a calculus course, though only about half offer Advanced Placement Calculus. It is somewhat surprising how few high schools offer science and mathematics courses by telecommunications (18–24 percent), a practice that will surely become more prominent as more states include taking an online class as a graduation requirement. Advanced Placement courses in science and mathematics are offered in about half of high schools. These courses are less likely to be offered in schools with a high proportion of students eligible for free/reduced-price lunch, and more likely to be offered in large schools. Advanced Placement courses are also more common in suburban and urban schools than in rural schools. The 2012 National Survey found that the percentage of classes that are heterogeneous in terms of prior achievement declines with increasing grade level. Further, students are assigned to classes that are homogeneous in regards to achievement disproportionally by race; classes with higher proportions of minority students are more likely to be labeled as consisting of “mostly low achievers.” In the sciences, about half of the students in high school biology, chemistry, and physics classes are females, though students in advanced science courses are more likely to be female than male. The proportion of females and males in college preparatory mathematics classes is about equal. Non-Asian minority students make up almost 40 percent of the enrollment in grades K–12, but at the high school level, the proportion of these students decreases as the level of science and mathematics increases.

Horizon Research, Inc. 68 February 2013
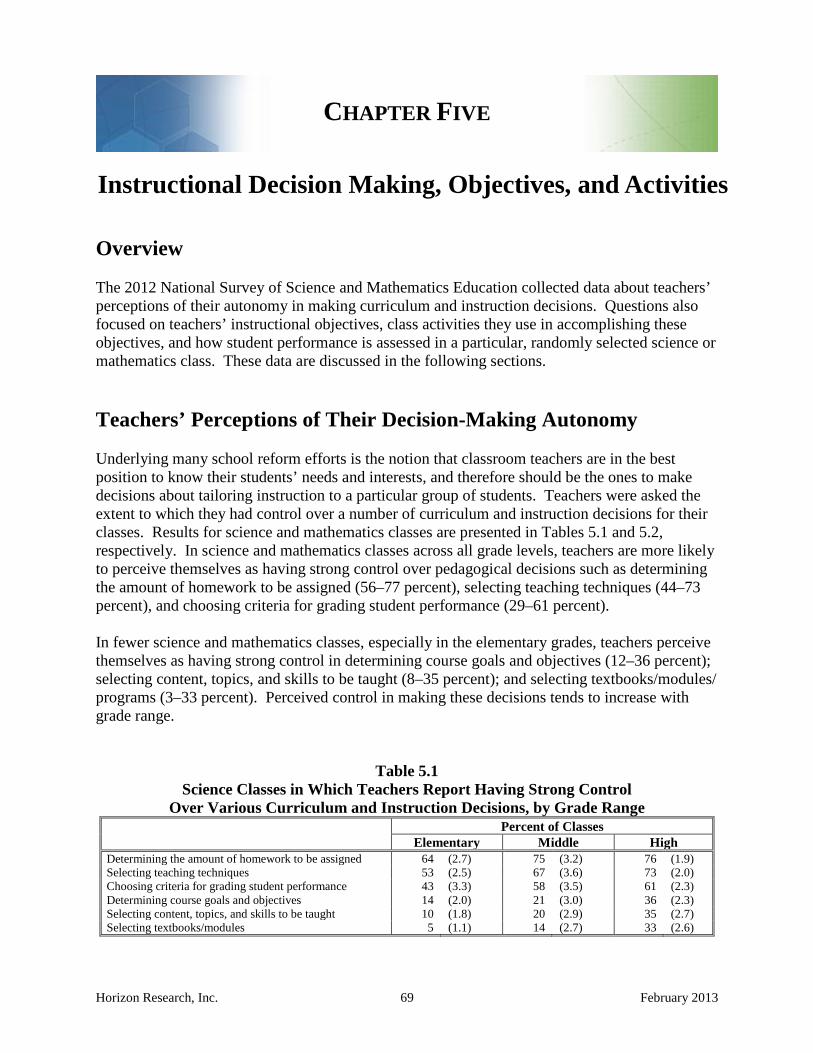
Horizon Research, Inc. 69 February 2013
CHAPTER FIVE
Instructional Decision Making, Objectives, and Activities Overview The 2012 National Survey of Science and Mathematics Education collected data about teachers’ perceptions of their autonomy in making curriculum and instruction decisions. Questions also focused on teachers’ instructional objectives, class activities they use in accomplishing these objectives, and how student performance is assessed in a particular, randomly selected science or mathematics class. These data are discussed in the following sections. Teachers’ Perceptions of Their Decision-Making Autonomy Underlying many school reform efforts is the notion that classroom teachers are in the best position to know their students’ needs and interests, and therefore should be the ones to make decisions about tailoring instruction to a particular group of students. Teachers were asked the extent to which they had control over a number of curriculum and instruction decisions for their classes. Results for science and mathematics classes are presented in Tables 5.1 and 5.2, respectively. In science and mathematics classes across all grade levels, teachers are more likely to perceive themselves as having strong control over pedagogical decisions such as determining the amount of homework to be assigned (56–77 percent), selecting teaching techniques (44–73 percent), and choosing criteria for grading student performance (29–61 percent). In fewer science and mathematics classes, especially in the elementary grades, teachers perceive themselves as having strong control in determining course goals and objectives (12–36 percent); selecting content, topics, and skills to be taught (8–35 percent); and selecting textbooks/modules/programs (3–33 percent). Perceived control in making these decisions tends to increase with grade range.
Table 5.1 Science Classes in Which Teachers Report Having Strong Control
Over Various Curriculum and Instruction Decisions, by Grade Range Percent of Classes Elementary Middle High
Determining the amount of homework to be assigned 64 (2.7) 75 (3.2) 76 (1.9) Selecting teaching techniques 53 (2.5) 67 (3.6) 73 (2.0) Choosing criteria for grading student performance 43 (3.3) 58 (3.5) 61 (2.3) Determining course goals and objectives 14 (2.0) 21 (3.0) 36 (2.3) Selecting content, topics, and skills to be taught 10 (1.8) 20 (2.9) 35 (2.7) Selecting textbooks/modules 5 (1.1) 14 (2.7) 33 (2.6)

Horizon Research, Inc. 70 February 2013
Table 5.2
Mathematics Classes in Which Teachers Report Having Strong Control Over Various Curriculum and Instruction Decisions, by Grade Range
Percent of Classes Elementary Middle High
Determining the amount of homework to be assigned 56 (2.6) 77 (2.4) 75 (2.0) Selecting teaching techniques 44 (2.5) 70 (2.6) 72 (1.8) Choosing criteria for grading student performance 29 (2.4) 56 (2.7) 55 (2.1) Determining course goals and objectives 12 (1.5) 24 (2.1) 28 (2.1) Selecting content, topics, and skills to be taught 8 (1.1) 23 (2.2) 24 (1.9) Selecting textbooks/programs 3 (0.8) 13 (2.3) 20 (2.1)
The items shown in Tables 5.1 and 5.2 were combined into two composite variables—Curriculum Control and Pedagogical Control. Curriculum Control comprises the following items:
• Determining course goals and objectives; • Selecting content, topics, and skills to be taught; and • Selecting textbooks/modules/programs.
For Pedagogical Control, the items are:
• Choosing criteria for grading student performance; • Determining the amount of homework to be assigned; and • Selecting teaching techniques.
Table 5.3 displays the composite scores for science and mathematics classes by grade range. These scores indicate that teachers perceive much more control over decisions related to pedagogy than curriculum. They also show that perceived control for both composite variables is greater in secondary classes than in elementary classes.
Table 5.3 Class Mean Scores for Curriculum Control and
Pedagogical Control Composites, by Subject and Grade Range Mean Score Curriculum Pedagogical Science Classes
Elementary 32 (1.7) 81 (1.2) Middle 45 (2.2) 88 (1.3) High 59 (1.6) 89 (0.7)
Mathematics Classes Elementary 29 (1.2) 74 (1.1) Middle 45 (1.5) 87 (1.4) High 52 (1.4) 88 (0.7)
When looking at the Curriculum Control composite scores by region, teachers of science and mathematics classes in the South perceive less control over curriculum-related decisions than

Horizon Research, Inc. 71 February 2013
teachers of classes in other regions (see Table 5.4). There is less variation by region in pedagogical control.
Table 5.4 Class Mean Scores for Curriculum Control and
Pedagogical Control Composites, by Subject and Region Mean Score Curriculum Pedagogical Science
Midwest 54 (2.4) 88 (1.1) Northeast 46 (2.0) 84 (1.5) South 34 (1.4) 83 (1.2) West 48 (2.6) 89 (1.3)
Mathematics Midwest 48 (1.6) 84 (1.1) Northeast 40 (2.0) 78 (1.8) South 33 (1.4) 81 (1.2) West 39 (2.0) 82 (1.4)
Objectives of Science and Mathematics Instruction The survey provided a list of possible objectives of science and mathematics instruction and asked teachers how much emphasis each would receive in an entire course of a particular, randomly selected class. Table 5.5 shows the percentage of science classes by grade range whose teachers indicated heavy emphasis for each objective. Understanding science concepts is frequently emphasized, although more so in secondary classes (80 percent of middle and high school classes) than in elementary (59 percent of classes). Across all grade levels, 45 percent or more of science classes have a heavy emphasis on increasing students’ interest in science, learning science process skills, and learning about real-life applications of science. Objectives least likely to be emphasized are learning test taking skills/strategies (fewer than 25 percent of science classes) and memorizing science vocabulary and/or facts (roughly 10 percent of science classes).
Table 5.5 Science Classes with Heavy Emphasis on
Various Instructional Objectives, by Grade Range Percent of Classes Elementary Middle High Understanding science concepts 59 (2.2) 80 (2.1) 80 (1.2) Increasing students’ interest in science 56 (2.0) 57 (2.2) 50 (1.4) Learning science process skills (e.g., observing, measuring) 47 (2.1) 54 (2.3) 49 (1.6) Preparing for further study in science 35 (2.0) 40 (2.1) 46 (1.3) Learning about real-life applications of science 46 (2.3) 45 (2.3) 45 (1.5) Learning test taking skills/strategies 22 (1.6) 24 (1.7) 22 (1.2) Memorizing science vocabulary and/or facts 10 (1.3) 10 (1.2) 13 (1.3)
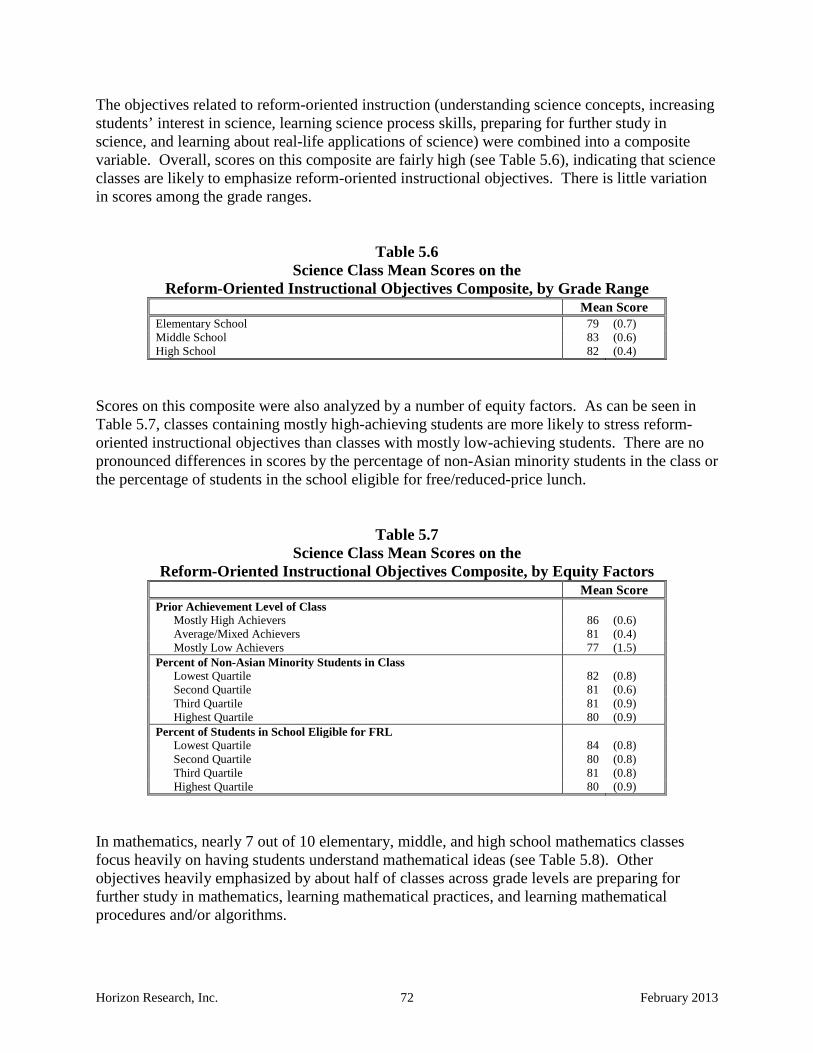
Horizon Research, Inc. 72 February 2013
The objectives related to reform-oriented instruction (understanding science concepts, increasing students’ interest in science, learning science process skills, preparing for further study in science, and learning about real-life applications of science) were combined into a composite variable. Overall, scores on this composite are fairly high (see Table 5.6), indicating that science classes are likely to emphasize reform-oriented instructional objectives. There is little variation in scores among the grade ranges.
Table 5.6 Science Class Mean Scores on the
Reform-Oriented Instructional Objectives Composite, by Grade Range Mean Score Elementary School 79 (0.7) Middle School 83 (0.6) High School 82 (0.4)
Scores on this composite were also analyzed by a number of equity factors. As can be seen in Table 5.7, classes containing mostly high-achieving students are more likely to stress reform-oriented instructional objectives than classes with mostly low-achieving students. There are no pronounced differences in scores by the percentage of non-Asian minority students in the class or the percentage of students in the school eligible for free/reduced-price lunch.
Table 5.7 Science Class Mean Scores on the
Reform-Oriented Instructional Objectives Composite, by Equity Factors Mean Score Prior Achievement Level of Class
Mostly High Achievers 86 (0.6) Average/Mixed Achievers 81 (0.4) Mostly Low Achievers 77 (1.5)
Percent of Non-Asian Minority Students in Class Lowest Quartile 82 (0.8) Second Quartile 81 (0.6) Third Quartile 81 (0.9) Highest Quartile 80 (0.9)
Percent of Students in School Eligible for FRL Lowest Quartile 84 (0.8) Second Quartile 80 (0.8) Third Quartile 81 (0.8) Highest Quartile 80 (0.9)
In mathematics, nearly 7 out of 10 elementary, middle, and high school mathematics classes focus heavily on having students understand mathematical ideas (see Table 5.8). Other objectives heavily emphasized by about half of classes across grade levels are preparing for further study in mathematics, learning mathematical practices, and learning mathematical procedures and/or algorithms.
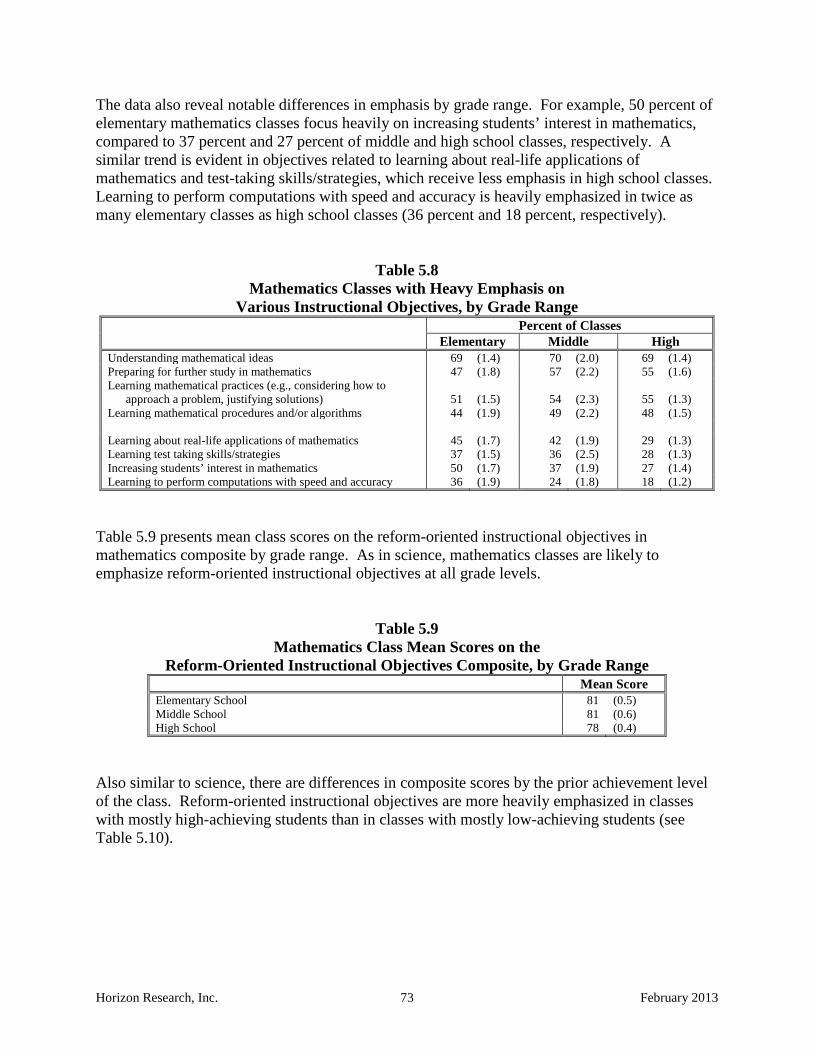
Horizon Research, Inc. 73 February 2013
The data also reveal notable differences in emphasis by grade range. For example, 50 percent of elementary mathematics classes focus heavily on increasing students’ interest in mathematics, compared to 37 percent and 27 percent of middle and high school classes, respectively. A similar trend is evident in objectives related to learning about real-life applications of mathematics and test-taking skills/strategies, which receive less emphasis in high school classes. Learning to perform computations with speed and accuracy is heavily emphasized in twice as many elementary classes as high school classes (36 percent and 18 percent, respectively).
Table 5.8 Mathematics Classes with Heavy Emphasis on
Various Instructional Objectives, by Grade Range Percent of Classes Elementary Middle High Understanding mathematical ideas 69 (1.4) 70 (2.0) 69 (1.4) Preparing for further study in mathematics 47 (1.8) 57 (2.2) 55 (1.6) Learning mathematical practices (e.g., considering how to
approach a problem, justifying solutions) 51 (1.5) 54 (2.3) 55 (1.3) Learning mathematical procedures and/or algorithms 44 (1.9) 49 (2.2) 48 (1.5) Learning about real-life applications of mathematics 45 (1.7) 42 (1.9) 29 (1.3) Learning test taking skills/strategies 37 (1.5) 36 (2.5) 28 (1.3) Increasing students’ interest in mathematics 50 (1.7) 37 (1.9) 27 (1.4) Learning to perform computations with speed and accuracy 36 (1.9) 24 (1.8) 18 (1.2)
Table 5.9 presents mean class scores on the reform-oriented instructional objectives in mathematics composite by grade range. As in science, mathematics classes are likely to emphasize reform-oriented instructional objectives at all grade levels.
Table 5.9 Mathematics Class Mean Scores on the
Reform-Oriented Instructional Objectives Composite, by Grade Range Mean Score Elementary School 81 (0.5) Middle School 81 (0.6) High School 78 (0.4)
Also similar to science, there are differences in composite scores by the prior achievement level of the class. Reform-oriented instructional objectives are more heavily emphasized in classes with mostly high-achieving students than in classes with mostly low-achieving students (see Table 5.10).

Horizon Research, Inc. 74 February 2013
Table 5.10 Mathematics Class Mean Scores on the
Reform-Oriented Instructional Objectives Composite, by Equity Factors Mean Score Prior Achievement Level of Class
Mostly High Achievers 85 (0.6) Average/Mixed Achievers 80 (0.4) Mostly Low Achievers 77 (0.7)
Percent of Non-Asian Minority Students in Class Lowest Quartile 80 (0.7) Second Quartile 80 (0.5) Third Quartile 80 (0.6) Highest Quartile 81 (0.6)
Percent of Students in School Eligible for FRL Lowest Quartile 82 (0.8) Second Quartile 79 (0.6) Third Quartile 80 (0.6) Highest Quartile 80 (0.8)
Class Activities Teachers were given a list of activities and asked how often they did each in the randomly selected class; response options were: never, rarely (e.g., a few times a year), sometimes (e.g., once or twice a month), often (e.g., once or twice a week), and all or almost all science/mathematics lessons. Results for science instruction are presented first, followed by mathematics instruction. Science Instruction As can be seen in Table 5.11, across the grade ranges, roughly 50 percent of classes include the teacher explaining science ideas in all or nearly all lessons. The majority of elementary science classes engage in whole class discussions in nearly every lesson, though this activity becomes less frequent as the grade level increases. Approximately a quarter of K–12 science classes have students work in small groups in all or almost all science lessons.

Horizon Research, Inc. 75 February 2013
Table 5.11 Science Classes in Which Teachers Report Using
Various Activities in All or Almost All Lessons, by Grade Range Percent of Classes Elementary Middle High Explain science ideas to the whole class 50 (1.8) 54 (2.2) 56 (1.6) Engage the whole class in discussions 57 (1.6) 48 (2.5) 38 (1.5) Have students work in small groups 28 (1.9) 25 (2.0) 22 (1.4) Require students to supply evidence in support of their claims 15 (1.4) 17 (1.8) 18 (1.0) Give tests and/or quizzes that are predominantly short-answer
(e.g., multiple choice, true /false, fill in the blank) 6 (0.9) 9 (1.4) 9 (0.8) Do hands-on/laboratory activities 16 (1.5) 10 (1.4) 8 (0.7) Have students represent and/or analyze data using tables, charts,
or graphs 8 (0.9) 8 (1.3) 8 (0.7) Give tests and/or quizzes that include constructed-
response/open-ended items 6 (0.7) 8 (1.5) 8 (0.8) Have students write their reflections (e.g., in their journals) in
class or for homework 13 (1.2) 13 (1.5) 7 (0.7) Have students read from a science textbook, module, or other
science-related material in class, either aloud or to themselves 15 (1.3) 12 (2.0) 7 (0.8)
Have students practice for standardized tests 4 (0.8) 5 (1.2) 5 (0.5) Focus on literacy skills (e.g., informational reading or writing
strategies) 17 (1.5) 10 (1.5) 4 (0.6) Engage the class in project-based learning (PBL) activities 9 (1.3) 6 (1.2) 3 (0.5) Have students make formal presentations to the rest of the class
(e.g., on individual or group projects) 4 (0.7) 1 (0.3) 2 (0.5) Have students attend presentations by guest speakers focused on
science and/or engineering in the workplace 1 (0.4) 1 (0.4) 1 (0.2) Three instructional activities occur at least once a week in most science classes across grade levels (see Table 5.12.): explaining science ideas to the whole class (88–96 percent), engaging the whole class in discussions (83–92 percent), and having students work in small groups (72–83 percent). Over half of K–12 science classes also include hands-on/laboratory activities and require students to supply evidence in support of their claims on a weekly basis; both activities are more likely to occur in high school classes than in elementary classes. Middle and high school science classes also include more frequent use of formal assessment practices (giving students short-answer or constructed-response tests/quizzes) than elementary classes. In contrast, elementary and middle school science classes are much more likely than high school classes to include literacy activities at least once a week. For example, students read from a science textbook, module, or other science-related material on a weekly basis in approximately 5 out of 10 elementary and middle grades classes, compared to in fewer than 4 in 10 high school classes. Having students write reflections at least once a week is twice as common in elementary and middle school classes as it is in high school classes. In addition, nearly half of elementary classes focus on literacy skills at least once a week, compared to only one-fourth of high school classes.

Horizon Research, Inc. 76 February 2013
Table 5.12 Science Classes in Which Teachers Report Using
Various Activities at Least Once a Week, by Grade Range Percent of Classes Elementary Middle High Explain science ideas to the whole class 88 (1.3) 96 (0.9) 95 (0.8) Engage the whole class in discussions 90 (0.9) 92 (1.0) 83 (1.0) Have students work in small groups 72 (1.8) 79 (1.9) 83 (1.2) Require students to supply evidence in support of their claims 54 (2.1) 64 (2.3) 61 (1.6) Give tests and/or quizzes that are predominantly short-answer
(e.g., multiple choice, true /false, fill in the blank) 31 (2.0) 44 (2.4) 44 (1.6) Do hands-on/laboratory activities 55 (1.9) 62 (2.4) 70 (1.5) Have students represent and/or analyze data using tables, charts,
or graphs 44 (2.0) 54 (1.9) 58 (1.6) Give tests and/or quizzes that include constructed-response/open-
ended items 21 (1.7) 36 (2.1) 40 (1.4) Have students write their reflections (e.g., in their journals) in
class or for homework 44 (2.0) 44 (2.1) 21 (1.3) Have students read from a science textbook, module, or other
science-related material in class, either aloud or to themselves 48 (2.4) 56 (2.3) 37 (1.6) Have students practice for standardized tests 19 (1.7) 23 (1.9) 20 (1.2) Focus on literacy skills (e.g., informational reading or writing
strategies) 48 (2.0) 44 (2.2) 25 (1.5) Engage the class in project-based learning (PBL) activities 30 (1.7) 23 (1.9) 18 (1.2) Have students make formal presentations to the rest of the class
(e.g., on individual or group projects) 12 (1.2) 10 (1.4) 9 (1.0) Have students attend presentations by guest speakers focused on
science and/or engineering in the workplace 3 (0.6) 3 (0.8) 2 (0.5) Table 5.13 shows the percentage of science classes never using these activities. Perhaps most striking, and in contrast to what is known from learning theory about the importance of reflection, is that students in one-fourth of high school science classes are never asked to write reflections on what they are learning. Having students attend presentations by guest speakers is also rare in grades K–12, with roughly 50 percent of science classes never having that experience.

Horizon Research, Inc. 77 February 2013
Table 5.13 Science Classes in Which Teachers Report
Never Using Various Activities, by Grade Range Percent of Classes Elementary Middle High Explain science ideas to the whole class 0 ---† 0 ---† 0 (0.1) Engage the whole class in discussions 0 ---† 0 (0.1) 1 (0.5) Have students work in small groups 0 (0.2) 0 (0.1) 0 (0.3) Require students to supply evidence in support of their claims 5 (0.7) 1 (0.7) 1 (0.3) Give tests and/or quizzes that are predominantly short-answer
(e.g., multiple choice, true /false, fill in the blank) 15 (1.3) 2 (0.5) 3 (0.4) Do hands-on/laboratory activities 2 (0.5) 2 (0.9) 1 (0.3) Have students represent and/or analyze data using tables,
charts, or graphs 2 (0.5) 0 (0.1) 0 (0.2) Give tests and/or quizzes that include constructed-
response/open-ended items 19 (1.5) 3 (0.5) 3 (0.4) Have students write their reflections (e.g., in their journals) in
class or for homework 10 (1.0) 9 (1.1) 25 (1.5) Have students read from a science textbook, module, or other
science-related material in class, either aloud or to themselves 9 (1.2) 4 (1.1) 10 (0.9)
Have students practice for standardized tests 32 (2.1) 13 (1.5) 19 (1.3) Focus on literacy skills (e.g., informational reading or writing
strategies) 6 (0.9) 3 (0.7) 9 (0.9) Engage the class in project-based learning (PBL) activities 8 (1.4) 4 (0.7) 9 (1.0) Have students make formal presentations to the rest of the
class (e.g., on individual or group projects) 16 (1.5) 6 (1.1) 11 (0.9) Have students attend presentations by guest speakers focused
on science and/or engineering in the workplace 51 (1.8) 45 (2.3) 51 (1.6) † No teachers at this grade level in the sample selected this response option. Thus, it is not possible to calculate the
standard error of this estimate. Teachers were also asked about the frequency with which they use various instructional technologies in their science classes. As can be seen in Table 5.14, technology use is generally low across grade ranges, with about one-third of classes using the Internet and 21–31 percent using personal computers at least once a week. Although calculators are used weekly in about 1 in 5 high school classes, very few elementary and middle school classes use them that often.
Table 5.14 Science Classes in Which Teachers Report that Students Use
Various Instructional Technologies at Least Once a Week, by Grade Range Percent of Classes Elementary Middle High Internet 31 (2.9) 32 (2.7) 35 (2.2) Personal computers, including laptops 21 (3.0) 23 (2.2) 31 (2.3) Calculators/Graphing calculators† 8 (1.7) 2 (0.5) 19 (1.7) Hand-held computers 2 (0.8) 4 (1.2) 9 (1.3) Probes for collecting data 7 (2.1) 2 (0.6) 8 (1.1) Classroom response system or “Clickers” 8 (2.8) 6 (1.0) 6 (1.0) † Elementary teachers were asked about their use of “calculators,” middle and high school teachers were asked about their use
of “graphing calculators.”

Horizon Research, Inc. 78 February 2013
Two composite variables were created from the instructional practices items: use of reform-oriented teaching practices (e.g., have students do hands-on/laboratory activities, require students to supply evidence in support of their claims, have students represent and/or analyze data using tables, charts, or graphs) and use of instructional technology. There is little, if any, difference in the use of reform-oriented teaching practices by grade level. Instructional technology is not used much in any grade level, but is used more heavily in high school classes.
Table 5.15 Class Mean Scores on
Science Teaching Practice Composites, by Grade Range Mean Score Elementary Middle High Use of Reform-Oriented Teaching Practices 60 (0.7) 63 (0.6) 59 (0.5) Use of Instructional Technology 25 (1.1) 26 (0.9) 34 (0.9)
Table 5.16 displays the science teaching practice composite scores by different equity factors. Both sets of practices are more commonly used in classes consisting mostly of high achievers than in classes with mostly low achievers. There are no substantive differences in scores on these composites by the percentage of non-Asian minority students or students eligible for free/reduced-price lunch in the school.
Table 5.16 Class Mean Scores on
Science Teaching Practice Composites, by Equity Factors Mean Score
Use of Reform-Oriented Teaching
Practices
Use of Instructional Technology
Prior Achievement Level of Class Mostly High Achievers 63 (0.8) 33 (1.6) Average/Mixed Achievers 60 (0.4) 27 (0.8) Mostly Low Achievers 59 (1.1) 25 (1.7)
Percent of Non-Asian Minority Students in Class Lowest Quartile 60 (0.6) 28 (1.2) Second Quartile 60 (0.9) 28 (1.2) Third Quartile 59 (0.8) 27 (1.1) Highest Quartile 61 (0.8) 25 (1.4)
Percent of Students in School Eligible for FRL Lowest Quartile 63 (0.8) 29 (1.0) Second Quartile 60 (0.9) 28 (1.3) Third Quartile 60 (0.6) 27 (1.4) Highest Quartile 60 (0.9) 26 (1.2)
In addition to asking about class activities in the course as a whole, the 2012 National Survey asked teachers about activities that took place during their most recent science lesson in the

Horizon Research, Inc. 79 February 2013
randomly selected class. As can be seen in Table 5.17, roughly 90 percent of classes in each grade range include the teacher explaining a science idea to the whole class in their most recent lesson. The use of whole class discussion is also prevalent, especially in elementary lessons (91 percent), but is less common in middle and high school lessons (77 and 67 percent, respectively). About half of elementary and middle school classes include students doing hands-on/laboratory activities and reading about science in the most recent lesson, compared to fewer than 4 in 10 high school classes. In contrast, students completing textbook/worksheet problems is more common in middle and high school science lessons (51 percent and 59 percent, respectively) than in elementary lessons (43 percent).
Table 5.17 Science Classes Participating in Various
Activities in the Most Recent Lesson, by Grade Range Percent of Classes
Elementary Middle High Teacher explaining a science idea to the whole class 89 (1.2) 89 (1.4) 90 (0.9) Whole class discussion 91 (1.1) 77 (1.8) 67 (1.4) Students completing textbook/worksheet problems 43 (1.8) 51 (2.2) 59 (1.6) Students doing hands-on/laboratory activities 52 (1.9) 50 (2.3) 39 (1.5) Students reading about science 53 (2.2) 50 (2.1) 35 (1.5) Teacher conducting a demonstration while students watched 40 (2.0) 32 (2.4) 32 (1.4) Students using instructional technology 22 (1.5) 30 (2.0) 27 (1.4) Test or quiz 12 (1.2) 22 (2.0) 20 (1.4) Practicing for standardized tests 5 (0.8) 9 (1.2) 10 (0.8)
The survey also asked teachers to estimate the time spent on each of a number of types of activities in this most recent science lesson. On average, there is little difference by grade level (see Table 5.18). Approximately 40 percent of class time is spent on whole class activities, 30 percent on small group work, and 20 percent on students working individually. Non-instructional activities, including attendance taking and interruptions, account for 10 percent or less of science class time.
Table 5.18 Average Percentage of Time Spent on Different
Activities in the Most Recent Science Lesson, by Grade Range Average Percent of Class Time Elementary Middle High Whole class activities (e.g., lectures, explanations, discussions) 43 (0.8) 40 (0.9) 43 (0.6) Small group work 32 (0.9) 31 (1.2) 30 (0.7) Students working individually (e.g., reading textbooks, completing
worksheets, taking a test or quiz) 19 (0.6) 20 (0.9) 18 (0.6) Non-instructional activities (e.g., attendance taking, interruptions) 6 (0.3) 10 (0.3) 9 (0.3)

Horizon Research, Inc. 80 February 2013
Mathematics Instruction Table 5.19 shows the percentage of K–12 mathematics classes in which teachers use various activities in all or almost all mathematics lessons. The teacher explaining mathematical ideas is very common across all grade levels, occurring in all or almost all lessons in 71–77 percent of mathematics classes. As is the case in science, the use of whole class discussion is more common in elementary classes, taking place in nearly all lessons in 76 percent classes, compared to 59 percent and 48 percent of middle and high school classes, respectively. Another striking difference between the grade ranges is manipulative use in problem solving/investigations, with 34 percent of elementary classes providing manipulatives to students in all or almost all lessons, compared to less than 5 percent of secondary classes.
Table 5.19 Mathematics Classes in Which Teachers Report Using
Various Activities in All or Almost All Lessons, by Grade Range Percent of Classes Elementary Middle High Explain mathematical ideas to the whole class 77 (1.7) 71 (1.8) 72 (1.4) Engage the whole class in discussions 76 (1.6) 59 (1.9) 48 (1.3) Have students explain and justify their method for solving a problem 49 (1.7) 48 (1.9) 36 (1.6) Have students work in small groups 34 (1.8) 24 (1.6) 20 (1.3) Have students consider multiple representations in solving a problem
(e.g., numbers, tables, graphs, pictures) 33 (1.9) 24 (1.7) 19 (1.0) Give tests and/or quizzes that include constructed-response/open-ended
items 9 (1.0) 13 (1.4) 18 (1.0) Have students compare and contrast different methods for solving a
problem 25 (1.5) 19 (1.5) 14 (1.0) Have students present their solution strategies to the rest of the class 26 (1.5) 21 (1.8) 12 (1.0) Give tests and/or quizzes that are predominantly short-answer (e.g.,
multiple choice, true/false, fill in the blank) 12 (1.4) 8 (0.9) 10 (0.8) Have students practice for standardized tests 9 (1.1) 10 (1.5) 9 (0.9) Have students read from a mathematics textbook/program or other
mathematics-related material in class, either aloud or to themselves 18 (1.5) 10 (1.3) 8 (0.8) Focus on literacy skills (e.g., informational reading or writing strategies) 15 (1.4) 5 (0.8) 4 (0.4) Have students write their reflections (e.g., in their journals) in class or
for homework 9 (1.2) 6 (0.9) 3 (0.4) Provide manipulatives for students to use in problem-
solving/investigations 34 (1.9) 4 (0.9) 3 (0.5) Have students attend presentations by guest speakers focused on
mathematics in the workplace 1 (0.3) 1 (0.5) 0 (0.1) The percentage of mathematics classes including these same activities at least once a week is displayed in Table 5.20. Not unexpectedly, nearly all classes at each grade level include explaining mathematical ideas and whole class discussions on a weekly basis. Having students explain and justify their method for solving a problem, a practice consistent with the “Standards for Mathematical Practice” in the Common Core State Standards for Mathematics,6 is also a
6 National Governors Association Center for Best Practices, Council of Chief State School Officers (2010). Common Core State Standards. Washington, DC: Author.
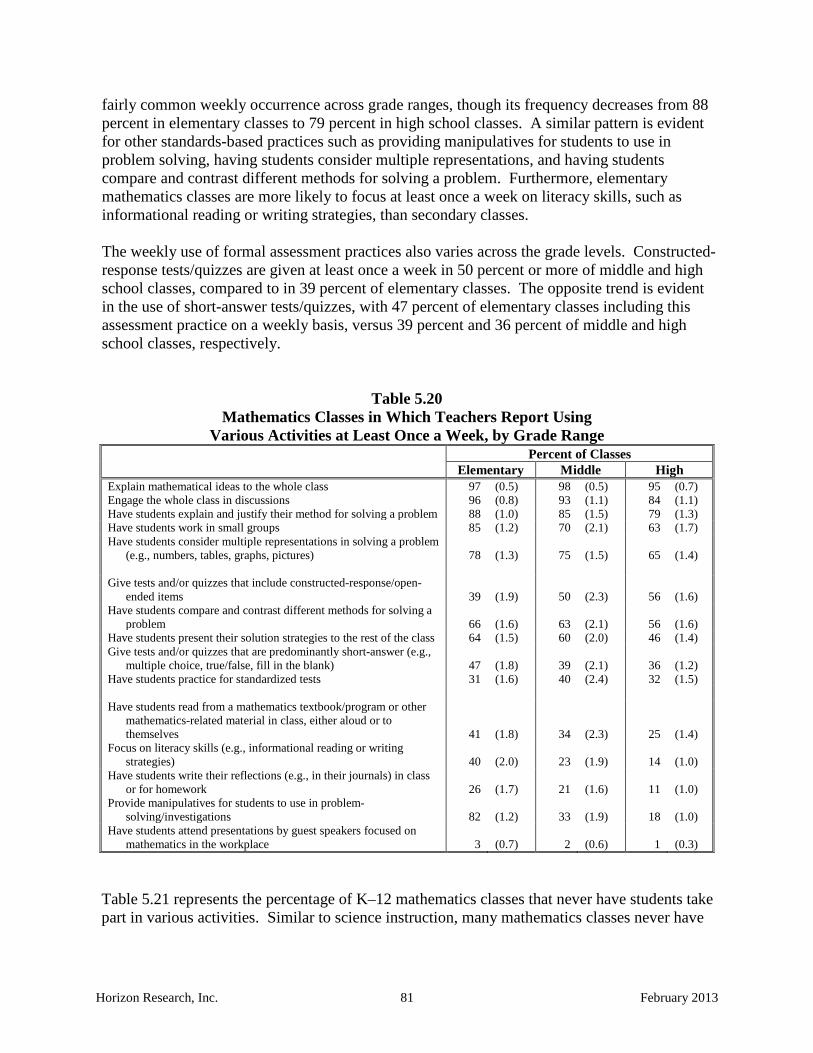
Horizon Research, Inc. 81 February 2013
fairly common weekly occurrence across grade ranges, though its frequency decreases from 88 percent in elementary classes to 79 percent in high school classes. A similar pattern is evident for other standards-based practices such as providing manipulatives for students to use in problem solving, having students consider multiple representations, and having students compare and contrast different methods for solving a problem. Furthermore, elementary mathematics classes are more likely to focus at least once a week on literacy skills, such as informational reading or writing strategies, than secondary classes. The weekly use of formal assessment practices also varies across the grade levels. Constructed-response tests/quizzes are given at least once a week in 50 percent or more of middle and high school classes, compared to in 39 percent of elementary classes. The opposite trend is evident in the use of short-answer tests/quizzes, with 47 percent of elementary classes including this assessment practice on a weekly basis, versus 39 percent and 36 percent of middle and high school classes, respectively.
Table 5.20 Mathematics Classes in Which Teachers Report Using
Various Activities at Least Once a Week, by Grade Range Percent of Classes Elementary Middle High Explain mathematical ideas to the whole class 97 (0.5) 98 (0.5) 95 (0.7) Engage the whole class in discussions 96 (0.8) 93 (1.1) 84 (1.1) Have students explain and justify their method for solving a problem 88 (1.0) 85 (1.5) 79 (1.3) Have students work in small groups 85 (1.2) 70 (2.1) 63 (1.7) Have students consider multiple representations in solving a problem
(e.g., numbers, tables, graphs, pictures) 78 (1.3) 75 (1.5) 65 (1.4) Give tests and/or quizzes that include constructed-response/open-
ended items 39 (1.9) 50 (2.3) 56 (1.6) Have students compare and contrast different methods for solving a
problem 66 (1.6) 63 (2.1) 56 (1.6) Have students present their solution strategies to the rest of the class 64 (1.5) 60 (2.0) 46 (1.4) Give tests and/or quizzes that are predominantly short-answer (e.g.,
multiple choice, true/false, fill in the blank) 47 (1.8) 39 (2.1) 36 (1.2) Have students practice for standardized tests 31 (1.6) 40 (2.4) 32 (1.5) Have students read from a mathematics textbook/program or other
mathematics-related material in class, either aloud or to themselves 41 (1.8) 34 (2.3) 25 (1.4)
Focus on literacy skills (e.g., informational reading or writing strategies) 40 (2.0) 23 (1.9) 14 (1.0)
Have students write their reflections (e.g., in their journals) in class or for homework 26 (1.7) 21 (1.6) 11 (1.0)
Provide manipulatives for students to use in problem-solving/investigations 82 (1.2) 33 (1.9) 18 (1.0)
Have students attend presentations by guest speakers focused on mathematics in the workplace 3 (0.7) 2 (0.6) 1 (0.3)
Table 5.21 represents the percentage of K–12 mathematics classes that never have students take part in various activities. Similar to science instruction, many mathematics classes never have
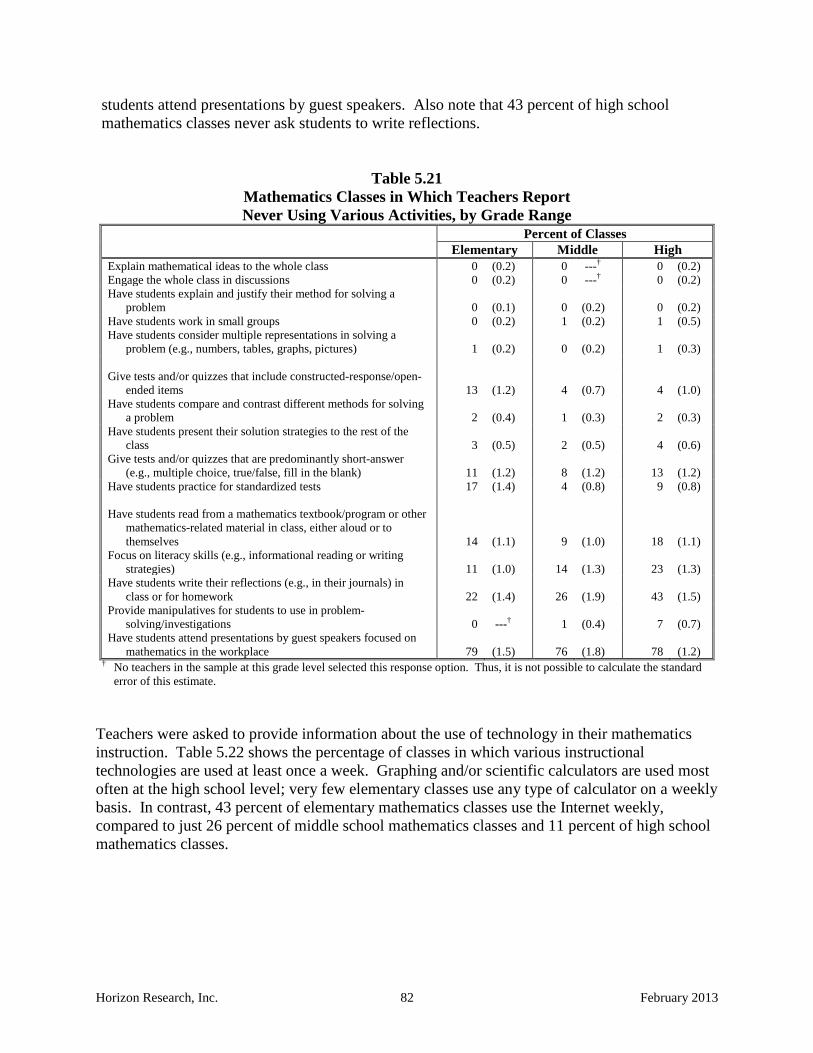
Horizon Research, Inc. 82 February 2013
students attend presentations by guest speakers. Also note that 43 percent of high school mathematics classes never ask students to write reflections.
Table 5.21 Mathematics Classes in Which Teachers Report Never Using Various Activities, by Grade Range
Percent of Classes Elementary Middle High Explain mathematical ideas to the whole class 0 (0.2) 0 ---† 0 (0.2) Engage the whole class in discussions 0 (0.2) 0 ---† 0 (0.2) Have students explain and justify their method for solving a
problem 0 (0.1) 0 (0.2) 0 (0.2) Have students work in small groups 0 (0.2) 1 (0.2) 1 (0.5) Have students consider multiple representations in solving a
problem (e.g., numbers, tables, graphs, pictures) 1 (0.2) 0 (0.2) 1 (0.3) Give tests and/or quizzes that include constructed-response/open-
ended items 13 (1.2) 4 (0.7) 4 (1.0) Have students compare and contrast different methods for solving
a problem 2 (0.4) 1 (0.3) 2 (0.3) Have students present their solution strategies to the rest of the
class 3 (0.5) 2 (0.5) 4 (0.6) Give tests and/or quizzes that are predominantly short-answer
(e.g., multiple choice, true/false, fill in the blank) 11 (1.2) 8 (1.2) 13 (1.2) Have students practice for standardized tests 17 (1.4) 4 (0.8) 9 (0.8) Have students read from a mathematics textbook/program or other
mathematics-related material in class, either aloud or to themselves 14 (1.1) 9 (1.0) 18 (1.1)
Focus on literacy skills (e.g., informational reading or writing strategies) 11 (1.0) 14 (1.3) 23 (1.3)
Have students write their reflections (e.g., in their journals) in class or for homework 22 (1.4) 26 (1.9) 43 (1.5)
Provide manipulatives for students to use in problem-solving/investigations 0 ---† 1 (0.4) 7 (0.7)
Have students attend presentations by guest speakers focused on mathematics in the workplace 79 (1.5) 76 (1.8) 78 (1.2)
† No teachers in the sample at this grade level selected this response option. Thus, it is not possible to calculate the standard error of this estimate.
Teachers were asked to provide information about the use of technology in their mathematics instruction. Table 5.22 shows the percentage of classes in which various instructional technologies are used at least once a week. Graphing and/or scientific calculators are used most often at the high school level; very few elementary classes use any type of calculator on a weekly basis. In contrast, 43 percent of elementary mathematics classes use the Internet weekly, compared to just 26 percent of middle school mathematics classes and 11 percent of high school mathematics classes.

Horizon Research, Inc. 83 February 2013
Table 5.22 Mathematics Classes in Which Teachers Report that Students Use
Various Instructional Technologies at Least Once a Week, by Grade Range Percent of Classes Elementary Middle High Graphing calculators 0 (0.0) 13 (2.2) 64 (2.0) Scientific calculators 4 (1.3) 40 (2.8) 53 (2.1) Four-function calculators 13 (1.7) 40 (2.5) 33 (2.2) Internet 43 (2.4) 26 (2.6) 11 (1.2) Personal computers, including laptops 36 (2.5) 22 (2.8) 10 (1.2) Classroom response system or “Clickers” 4 (1.3) 11 (1.6) 4 (0.7) Hand-held computers 5 (1.1) 5 (1.5) 4 (0.8) Probes for collecting data 0 (0.3) 1 (0.7) 1 (0.4)
Table 5.23 shows the means for composite variables related to mathematics teaching practice. Teachers at all grade levels report using reform-oriented teaching practices, such as having students solve problems and consider multiple representations, explain and justify their solution method, and compare and contrast different solution methods fairly often. However, the frequency of these practices is higher in elementary and middle grades classes than high school classes. In general, use of instructional technology is low in K–12 mathematics classes, and decreases with increasing grade level.
Table 5.23 Class Mean Scores on
Mathematics Teaching Practice Composites, by Grade Range Mean Score Elementary Middle High Use of Reform-Oriented Teaching Practices 74 (0.8) 73 (1.1) 67 (0.7) Use of Instructional Technology 33 (1.1) 28 (1.4) 21 (1.0)
With the exception of prior achievement level of class, there is little variation in composite scores related to mathematics teaching practices when analyzed by different equity factors (see Table 5.24). As is the case in science, reform-oriented teaching practices are more commonly used in mathematics classes consisting mainly of high achievers. In contrast, the use of instructional technology is slightly more frequent in mathematics classes of mainly low achievers than in classes with mainly high achievers.
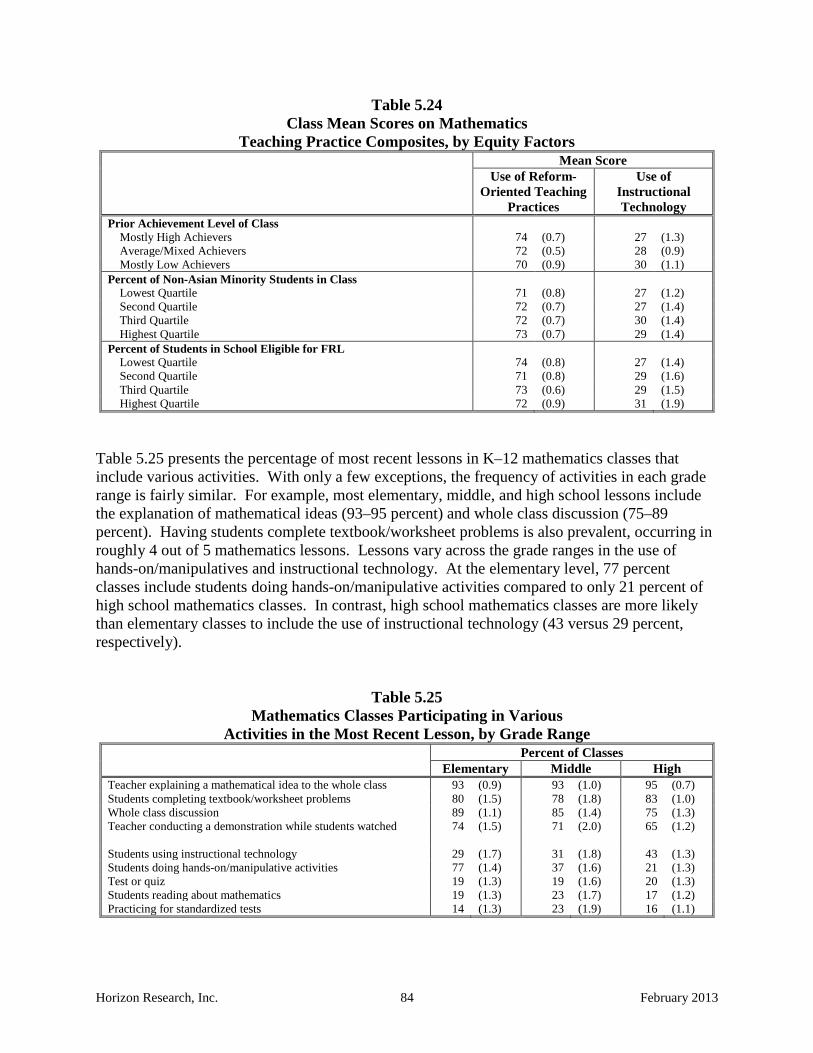
Horizon Research, Inc. 84 February 2013
Table 5.24 Class Mean Scores on Mathematics
Teaching Practice Composites, by Equity Factors Mean Score
Use of Reform-Oriented Teaching
Practices
Use of Instructional Technology
Prior Achievement Level of Class Mostly High Achievers 74 (0.7) 27 (1.3) Average/Mixed Achievers 72 (0.5) 28 (0.9) Mostly Low Achievers 70 (0.9) 30 (1.1)
Percent of Non-Asian Minority Students in Class Lowest Quartile 71 (0.8) 27 (1.2) Second Quartile 72 (0.7) 27 (1.4) Third Quartile 72 (0.7) 30 (1.4) Highest Quartile 73 (0.7) 29 (1.4)
Percent of Students in School Eligible for FRL Lowest Quartile 74 (0.8) 27 (1.4) Second Quartile 71 (0.8) 29 (1.6) Third Quartile 73 (0.6) 29 (1.5) Highest Quartile 72 (0.9) 31 (1.9)
Table 5.25 presents the percentage of most recent lessons in K–12 mathematics classes that include various activities. With only a few exceptions, the frequency of activities in each grade range is fairly similar. For example, most elementary, middle, and high school lessons include the explanation of mathematical ideas (93–95 percent) and whole class discussion (75–89 percent). Having students complete textbook/worksheet problems is also prevalent, occurring in roughly 4 out of 5 mathematics lessons. Lessons vary across the grade ranges in the use of hands-on/manipulatives and instructional technology. At the elementary level, 77 percent classes include students doing hands-on/manipulative activities compared to only 21 percent of high school mathematics classes. In contrast, high school mathematics classes are more likely than elementary classes to include the use of instructional technology (43 versus 29 percent, respectively).
Table 5.25 Mathematics Classes Participating in Various
Activities in the Most Recent Lesson, by Grade Range Percent of Classes Elementary Middle High Teacher explaining a mathematical idea to the whole class 93 (0.9) 93 (1.0) 95 (0.7) Students completing textbook/worksheet problems 80 (1.5) 78 (1.8) 83 (1.0) Whole class discussion 89 (1.1) 85 (1.4) 75 (1.3) Teacher conducting a demonstration while students watched 74 (1.5) 71 (2.0) 65 (1.2) Students using instructional technology 29 (1.7) 31 (1.8) 43 (1.3) Students doing hands-on/manipulative activities 77 (1.4) 37 (1.6) 21 (1.3) Test or quiz 19 (1.3) 19 (1.6) 20 (1.3) Students reading about mathematics 19 (1.3) 23 (1.7) 17 (1.2) Practicing for standardized tests 14 (1.3) 23 (1.9) 16 (1.1)

Horizon Research, Inc. 85 February 2013
The proportion of time spent on various instructional arrangements in mathematics lessons is relatively similar across the grade levels (see Table 5.26), though there is some variation. On average, more time is spent in whole class activities in high school mathematics classes than in elementary and middle school classes, ranging from 40 to 48 percent of class time. In contrast, the time spent in small group work decreases with increasing grade range, from 29 percent of time in elementary classes to 22 percent of time in high school mathematics classes.
Table 5.26 Average Percentage of Time Spent on Different Activities in the Most Recent Mathematics Lesson, by Grade Range
Average Percent of Class Time Elementary Middle High Whole class activities (e.g., lectures, explanations, discussions) 40 (0.6) 42 (0.8) 48 (0.7) Small group work 29 (0.8) 24 (0.9) 22 (0.8) Students working individually (e.g., reading textbooks, completing
worksheets, taking a test or quiz) 26 (0.6) 24 (0.7) 22 (0.6) Non-instructional activities (e.g., attendance taking, interruptions) 6 (0.3) 10 (0.2) 9 (0.2)
Homework and Assessment Practices Science and mathematics teachers were asked about the amount of homework assigned per week in the randomly selected class. Across the grade levels, students in mathematics classes are assigned more homework than students in science classes (see Table 5.27). This pattern is particularly evident in elementary classes, where students in 35 percent of classes are given 31–60 minutes of mathematics homework a week; only 7 percent of elementary classes are assigned this much science homework. Not surprisingly, the amount of time students are asked to spend on science and mathematics homework increases with grade range. For example, nearly two-thirds of high school mathematics classes are assigned one or more hours of homework per week, compared to under one-third of elementary classes.
Table 5.27 Amount of Homework Assigned in Classes per Week, by Subject and Grade Range
Percent of Classes Elementary Middle High Science
Fewer than 15 minutes per week 73 (2.8) 22 (2.2) 9 (1.1) 15–30 minutes per week 17 (2.5) 29 (2.7) 17 (1.6) 31–60 minutes per week 7 (2.0) 30 (2.6) 34 (2.1) 61–90 minutes per week 2 (1.2) 14 (2.1) 24 (1.8) 91–120 minutes per week 0 (0.2) 3 (0.8) 7 (1.1) More than 120 minutes per week 0 (0.3) 2 (1.6) 9 (1.1)
Mathematics Fewer than 15 minutes per week 16 (1.9) 5 (0.8) 7 (1.0) 15–30 minutes per week 19 (2.0) 13 (2.6) 8 (1.2) 31–60 minutes per week 35 (2.6) 28 (2.9) 22 (1.7) 61–90 minutes per week 17 (1.8) 29 (2.9) 27 (1.8) 91–120 minutes per week 9 (1.3) 14 (1.5) 13 (1.1) More than 120 minutes per week 4 (0.9) 10 (1.6) 23 (1.8)

Horizon Research, Inc. 86 February 2013
Teachers were also given a list of ways that they might assess student progress and asked to describe which practices they used in the most recently completed unit in the randomly selected class. These data are shown in Tables 5.28 and 5.29. In both science and mathematics, the vast majority of classes at all grade levels included informal assessment practices during the unit to see if students were “getting it.” For example, more than 90 percent of K–12 science and mathematics classes involved the teacher questioning students during activities to monitor understanding. Using whole class informal assessments such as “thumbs up/thumbs down” was another common practice, used in most science and mathematics classes (80–90 percent) during the unit. In addition, the use of formal assessment techniques such as grading student work, quizzes, and tests, as well as reviewing the correct answers to assignments were also prevalent features of science and mathematics units, especially in secondary classes. Middle and high school teachers in roughly 9 out of 10 classes administered a test or quiz to assign grades and assigned grades to student work; teachers in approximately 6 in 10 elementary classes used these practices during their most recent unit. In contrast, having students use rubrics to examine their own or their classmates’ work was infrequent across all grade levels.
Table 5.28 Science Classes in Which Teachers Report Assessing Students
Using Various Methods in the Most Recent Unit, by Grade Range Percent of Classes Elementary Middle High Questioned individual students during class activities to see if they
were “getting it” 94 (0.9) 95 (1.4) 97 (0.5) Reviewed student work (e.g., homework, notebooks, journals,
portfolios, projects) to see if they were “getting it” 89 (1.4) 96 (0.7) 94 (0.7) Assigned grades to student work (e.g., homework, notebooks, journals,
portfolios, projects) 60 (1.8) 94 (0.9) 92 (0.7) Administered one or more quizzes and/or tests to assign grades 56 (2.4) 90 (1.5) 91 (0.7) Went over the correct answers to assignments, quizzes, and/or tests
with the class as a whole 62 (2.2) 89 (1.7) 88 (1.0) Administered one or more quizzes and/or tests to see if students were
“getting it” 52 (2.5) 82 (1.7) 81 (1.3) Used information from informal assessments of the entire class (e.g.,
asking for a show of hands, thumbs up/thumbs down, clickers, exit tickets) to see if students were “getting it” 87 (1.3) 86 (1.8) 80 (1.3)
Administered an assessment, task, or probe at the beginning of the unit to find out what students thought or already knew about the key science ideas 54 (2.0) 62 (2.1) 53 (1.4)
Had students use rubrics to examine their own or their classmates’ work 14 (1.5) 27 (2.0) 18 (1.2)

Horizon Research, Inc. 87 February 2013
Table 5.29 Mathematics Classes in Which Teachers Report Assessing Students Using Various Methods in the Most Recent Unit, by Grade Range
Percent of Classes Elementary Middle High Questioned individual students during class activities to see if they
were “getting it” 97 (0.6) 98 (0.6) 97 (0.5) Reviewed student work (e.g., homework, notebooks, journals,
portfolios, projects) to see if they were “getting it” 96 (0.7) 95 (0.9) 96 (0.7) Administered one or more quizzes and/or tests to assign grades 73 (1.6) 88 (1.5) 94 (0.6) Went over the correct answers to assignments, quizzes, and/or tests
with the class as a whole 83 (1.2) 94 (0.9) 92 (0.7) Administered one or more quizzes and/or tests to see if students were
“getting it” 73 (1.7) 86 (1.5) 86 (1.4) Assigned grades to student work (e.g., homework, notebooks,
journals, portfolios, projects) 63 (1.9) 85 (1.6) 85 (0.9) Used information from informal assessments of the entire class (e.g.,
asking for a show of hands, thumbs up/thumbs down, clickers, exit tickets) to see if students were “getting it” 90 (1.1) 88 (1.3) 83 (1.1)
Administered an assessment, task, or probe at the beginning of the unit to find out what students thought or already knew about the key mathematical ideas 63 (1.8) 52 (2.2) 42 (1.8)
Had students use rubrics to examine their own or their classmates’ work 10 (1.1) 12 (1.3) 8 (0.7)
The survey asked how often students in the randomly selected class were required to take assessments the teachers did not develop, such as state or district benchmark assessments. Given the increased emphasis on high stakes assessment, a result of the 2001 No Child Left Behind Act, it is not surprising that the frequency of external testing is greater in mathematics classes than in science classes, particularly at the elementary and middle grades levels (see Table 5.30). At the elementary level, 50 percent of classes never administer external science assessments; only 9 percent never administer external mathematics assessments.
Table 5.30 Frequency of Required External Testing in Classes, by Subject and Grade Range
Percent of Classes Elementary Middle High Science
Never 50 (2.3) 21 (1.6) 30 (1.5) Once a year 17 (1.6) 28 (2.2) 35 (1.6) Twice a year 8 (1.2) 13 (1.8) 13 (1.0) Three or four times a year 16 (1.6) 23 (2.0) 14 (1.1) Five or more times a year 9 (1.6) 15 (1.4) 9 (0.9)
Mathematics Never 9 (0.9) 2 (0.4) 21 (1.3) Once a year 14 (1.3) 19 (2.2) 28 (1.3) Twice a year 7 (0.9) 10 (1.4) 15 (1.0) Three or four times a year 38 (1.7) 38 (2.4) 22 (1.2) Five or more times a year 31 (1.7) 31 (1.7) 14 (1.1)

Horizon Research, Inc. 88 February 2013
The prior achievement level of the class, percentage of non-Asian minority students in the class, and percentage of students in the school eligible for free/reduced-price lunch are all related to the frequency with which science and mathematics classes are required to take external assessments. As can be seen in Table 5.31, in both subjects, classes with mostly low-achieving students are more likely than classes with mostly high achievers to take external assessments two or more times per year. Similarly, the greater the percentage of non-Asian minority students in the class and the greater the percentage of students in the school eligible for free/reduced-price lunch, the more likely students are to be tested this frequently.
Table 5.31 Classes Required to Take External Assessments Two
or More Times per Year, by Subject and Equity Factors Percent of Classes Science Mathematics Prior Achievement Level of Class
Mostly High Achievers 36 (3.1) 60 (2.6) Average/Mixed Achievers 36 (1.7) 71 (1.4) Mostly Low Achievers 53 (3.6) 76 (2.2)
Percent of Non-Asian Minority Students in Class Lowest Quartile 26 (2.4) 56 (2.4) Second Quartile 30 (2.6) 65 (2.0) Third Quartile 38 (3.3) 71 (2.1) Highest Quartile 52 (2.4) 83 (1.5)
Percent of Students in School Eligible for FRL Lowest Quartile 33 (2.9) 66 (2.4) Second Quartile 35 (2.4) 73 (1.9) Third Quartile 45 (3.5) 75 (1.9) Highest Quartile 50 (3.0) 81 (1.7)
Summary Data from the 2012 National Survey indicate that science and mathematics teachers perceive more control over decisions related to pedagogy than curriculum. Perceived autonomy over curriculum and pedagogy tends to increase with grade range in both science and mathematics classes, with teachers of elementary classes having less control over what and how they teach than teachers of high school classes. Teachers of classes at all grade levels, and in both subjects, are fairly likely to emphasize reform-oriented instructional objectives, such as developing understanding of science concepts/mathematics ideas, increasing student interest in the subject, and connecting what students are learning to real-life applications. However, there are some important differences between the subjects and among the grade levels. For example, science classes are more likely than mathematics classes to have a heavy emphasis on increasing students’ interest in the subject. In both subjects, this objective is emphasized less in high school. Mathematics classes are more likely than science classes to focus on preparing students for further study in the discipline and, at the K–8 level, emphasize test taking skills.

Horizon Research, Inc. 89 February 2013
In terms of instructional activities, teacher explanation of science ideas and whole group discussion are very common across the grade levels. The use of small group work and hands-on activities are also fairly prevalent, with over half of K–12 science classes including these activities on a weekly basis. Given that accountability efforts in recent years have focused on reading/language arts and mathematics, it is not surprising that science classes in grades K–8 often include literacy activities. In contrast, the use of instructional technology and practicing for standardized tests in science is quite infrequent across grade levels. Explanation of ideas and whole group discussion are also very prominent in mathematics instruction, as is the use of textbook/worksheet problems. Having students engage in practices consistent with the Common Core State Standards for Mathematics, such as explaining and justifying methods for solving a problem and comparing/contrasting different solution methods, is also a common weekly occurrence across grade ranges, although the frequency of use decreases as grade range increases. For example, 78 percent of elementary classes have students consider multiple representations in solving a problem at least once per week, compared to only 65 percent of high school classes. Similar to science, the use of technology in mathematics instruction is fairly low across grade levels. In both science and mathematics, informal means of assessment—e.g., questioning students during activities, reviewing student work—are commonly used to monitor student progress. Grading student homework, quizzes, and tests is also quite frequent, especially at the secondary level. Not surprisingly, external testing occurs more frequently in mathematics classes than science classes. However, in both subjects, the frequency of external testing varies by grade range. Equity factors, in particular prior achievement level of the class, are related to objectives and instructional activities in science and mathematics. Classes with mostly high-achieving students are more likely to stress reform-oriented objectives and teaching practices than classes consisting of mostly low-achieving students. Classes of mostly low-achieving students tend to have to take external assessments more frequently than classes of mostly high-achieving students.

Horizon Research, Inc. 90 February 2013

Horizon Research, Inc. 91 February 2013
CHAPTER SIX
Instructional Resources Overview The quality and availability of instructional resources is a major factor in science and mathematics teaching. The 2012 National Survey of Science and Mathematics Education included a series of items on science and mathematics textbooks/programs—which ones were being used, how teachers used their textbooks, and teachers’ perceptions of textbook quality. Teachers were also asked about the availability and use of a number of other instructional resources, including various types of calculators, computers, and Internet capabilities. These results are presented in the following sections. Textbook Usage The 2012 National Survey collected data on the use of commercially published textbooks or programs in science and mathematics classes. As can be seen in Table 6.1, more than three-fourths of middle and high school science classes and elementary, middle, and high school mathematics classes use published textbooks/programs. Use of textbooks/programs is somewhat less common, however, in elementary science classes (69 percent).
Table 6.1 Classes Using Commercially Published Textbooks/Programs, by Subject
Percent of Classes Science Mathematics Elementary School 69 (2.1) 85 (1.5) Middle School 80 (1.9) 81 (1.8) High School 77 (1.2) 81 (1.0)
The survey also asked how if one textbook/program is used all or most of the time, or if multiple materials are used (see Tables 6.2 and 6.3). The percentage of mathematics classes using one or more commercially published materials is strikingly similar across grade ranges (81–85 percent). Most of these classes rely on a single textbook/program.
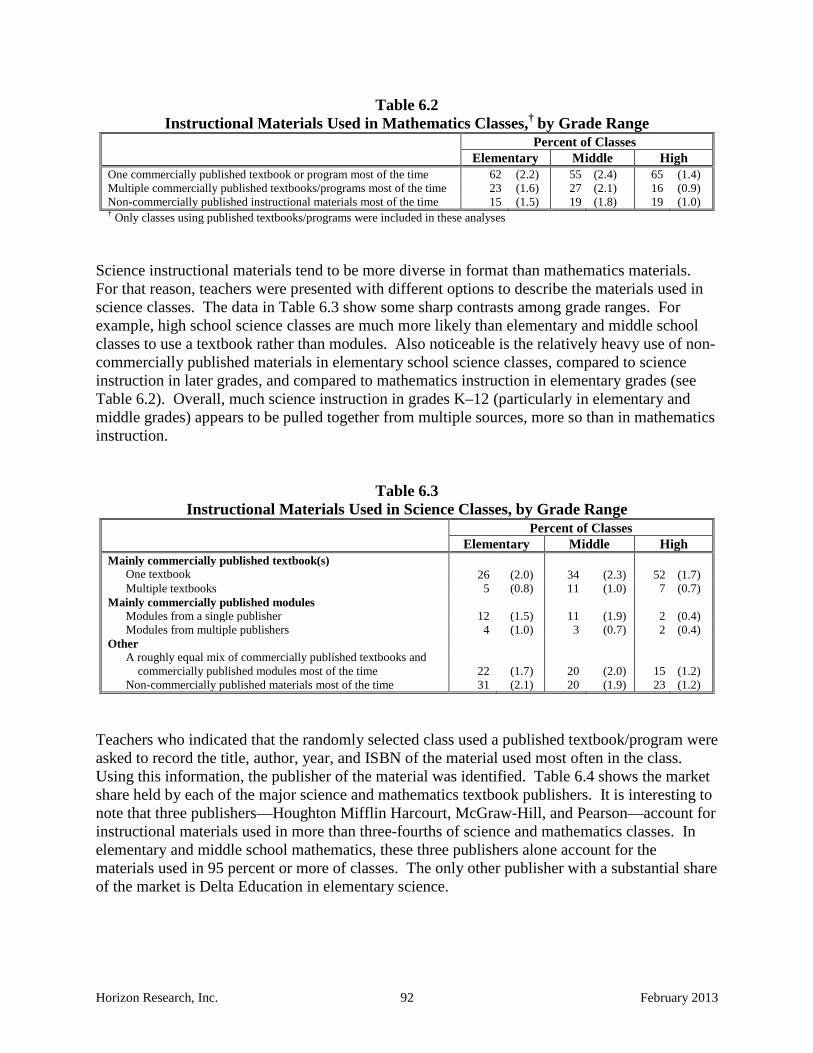
Horizon Research, Inc. 92 February 2013
Table 6.2 Instructional Materials Used in Mathematics Classes,† by Grade Range
Percent of Classes Elementary Middle High
One commercially published textbook or program most of the time 62 (2.2) 55 (2.4) 65 (1.4) Multiple commercially published textbooks/programs most of the time 23 (1.6) 27 (2.1) 16 (0.9) Non-commercially published instructional materials most of the time 15 (1.5) 19 (1.8) 19 (1.0) † Only classes using published textbooks/programs were included in these analyses
Science instructional materials tend to be more diverse in format than mathematics materials. For that reason, teachers were presented with different options to describe the materials used in science classes. The data in Table 6.3 show some sharp contrasts among grade ranges. For example, high school science classes are much more likely than elementary and middle school classes to use a textbook rather than modules. Also noticeable is the relatively heavy use of non-commercially published materials in elementary school science classes, compared to science instruction in later grades, and compared to mathematics instruction in elementary grades (see Table 6.2). Overall, much science instruction in grades K–12 (particularly in elementary and middle grades) appears to be pulled together from multiple sources, more so than in mathematics instruction.
Table 6.3 Instructional Materials Used in Science Classes, by Grade Range
Percent of Classes Elementary Middle High
Mainly commercially published textbook(s) One textbook 26 (2.0) 34 (2.3) 52 (1.7) Multiple textbooks 5 (0.8) 11 (1.0) 7 (0.7)
Mainly commercially published modules Modules from a single publisher 12 (1.5) 11 (1.9) 2 (0.4) Modules from multiple publishers 4 (1.0) 3 (0.7) 2 (0.4)
Other A roughly equal mix of commercially published textbooks and
commercially published modules most of the time 22 (1.7) 20 (2.0) 15 (1.2) Non-commercially published materials most of the time 31 (2.1) 20 (1.9) 23 (1.2)
Teachers who indicated that the randomly selected class used a published textbook/program were asked to record the title, author, year, and ISBN of the material used most often in the class. Using this information, the publisher of the material was identified. Table 6.4 shows the market share held by each of the major science and mathematics textbook publishers. It is interesting to note that three publishers—Houghton Mifflin Harcourt, McGraw-Hill, and Pearson—account for instructional materials used in more than three-fourths of science and mathematics classes. In elementary and middle school mathematics, these three publishers alone account for the materials used in 95 percent or more of classes. The only other publisher with a substantial share of the market is Delta Education in elementary science.

Horizon Research, Inc. 93 February 2013
Table 6.4 Market Share of Commercial Textbook Publishers†, by Subject and Grade Range
Percent of Classes Elementary Middle High
Science Pearson 15 (2.4) 31 (2.9) 43 (2.2) Houghton Mifflin Harcourt 47 (3.4) 33 (2.9) 22 (1.5) McGraw-Hill 16 (2.4) 25 (2.6) 18 (1.3) Cengage Learning 0 ---‡ 0 (0.2) 6 (0.8) Delta Education 11 (1.9) 1 (0.7) 1 (0.2) Carolina Biological Supply Company 2 (0.8) 2 (0.6) 0 ---‡ Lab-Aids 0 ---‡ 2 (1.6) 0 (0.0) National Geographic Society 4 (1.8) 0 (0.2) 0 ---‡
Mathematics Houghton Mifflin Harcourt 35 (2.7) 41 (3.2) 35 (1.6) Pearson 33 (3.0) 26 (2.5) 30 (2.0) McGraw-Hill 29 (2.5) 28 (2.8) 18 (1.6) Cengage Learning 0 ---‡ 0 ---‡ 9 (1.0) W. H. Freeman 0 ---‡ 0 ---‡ 2 (0.6)
† Only publishers with two percent or more of the market share in any grade range are included in this table. ‡ No teachers at this grade level in the sample reported using materials from this publisher. Thus, it is not possible to
calculate the standard error of this estimate. Tables 6.5 and 6.6 list the most commonly used science and mathematics textbooks in each grade range; secondary textbooks are shown by course type, as well.

Horizon Research, Inc. 94 February 2013
Table 6.5 Most Commonly Used Science Textbooks, by Grade Range and Course
Publisher Title Elementary Elementary Science Houghton Mifflin Harcourt Harcourt Science Pearson Scott Foresman Science Middle Life Science Houghton Mifflin Harcourt Life Science McGraw-Hill Life Science Earth Science Pearson Earth Science Houghton Mifflin Harcourt Earth Science Physical Science Houghton Mifflin Harcourt Physical Science Pearson Focus on Physical Science General/Integrated Science McGraw-Hill Glencoe Science Houghton Mifflin Harcourt Holt Science & Technology High Biology Pearson Biology Houghton Mifflin Harcourt Biology Earth Science Houghton Mifflin Harcourt Earth Science Pearson Earth Science Chemistry Pearson Chemistry Houghton Mifflin Harcourt Modern Chemistry Physics Pearson Conceptual Physics McGraw-Hill Physics - Principles and Problems Environmental Science Houghton Mifflin Harcourt Environmental Science Cengage Learning Living in the Environment Coordinated/Integrated Science Pearson Physical Science Concepts in Action McGraw-Hill Physical Science

Horizon Research, Inc. 95 February 2013
Table 6.6 Most Commonly Used Mathematics Textbooks, by Grade Range and Course
Publisher Title Elementary Elementary Mathematics Pearson Envision Math McGraw-Hill Everyday Mathematics Middle Middle School Mathematics McGraw-Hill Math Connects Pearson Connected Mathematics Houghton Mifflin Harcourt Mathematics Course 3 Houghton Mifflin Harcourt Algebra I Houghton Mifflin Harcourt Mathematics Course 2 High Non-college prep Mathematics Houghton Mifflin Harcourt Algebra 1 Houghton Mifflin Harcourt Geometry Pearson Algebra 1 Formal/College-prep Mathematics Level 1 Houghton Mifflin Harcourt Algebra 1 Pearson Algebra 1 McGraw-Hill Algebra 1 Formal/College-prep Mathematics Level 2 Houghton Mifflin Harcourt Geometry Pearson Geometry Formal/College-prep Mathematics Level 3 Houghton Mifflin Harcourt Algebra 2 Pearson Algebra 2 Formal/College-prep Mathematics Level 4 Cengage Learning Precalculus with Limits: A Graphing
Approach McGraw-Hill Advanced Mathematical Concepts:
Precalculus with Applications Courses that might qualify for college
credit Pearson Calculus: Graphical, Numerical,
Algebraic Cengage Learning Calculus of a Single Variable
Since 1950, the National Science Foundation (NSF) has funded the development of instructional materials in science and mathematics. Using title and publisher information, each textbook listed by teachers was coded as having been developed with NSF funding or not. As shown in Table 6.7, elementary mathematics classes are the most likely (25 percent) to be using such materials.
Table 6.7 Classes Using Instructional Materials
Developed with NSF Funding, by Subject and Grade Range Percent of Classes Science Mathematics Elementary School 10 (1.8) 25 (2.5) Middle School 6 (1.6) 11 (2.0) High School 3 (0.5) 0 (0.2)
Table 6.8 shows the publication year of science and mathematics textbooks. In 2012, more than half of science classes were using textbooks published prior to 2007. In general, mathematics

Horizon Research, Inc. 96 February 2013
classes are more likely than science classes to use newer textbooks. The contrast between elementary science and elementary mathematics is particularly striking, as science classes are much more likely than mathematics classes (58 percent vs. 30 percent) to use textbooks published in 2006 or earlier.
Table 6.8 Publication Year of Textbooks/Programs, by Subject and Grade Range
Percent of Classes† Elementary Middle High
Science 2006 or earlier 58 (3.0) 52 (2.6) 60 (1.9) 2007–09 24 (2.8) 35 (2.9) 26 (1.8) 2010–12 18 (2.6) 13 (2.0) 14 (1.3)
Mathematics 2006 or earlier 30 (2.4) 40 (2.4) 52 (1.9) 2007–09 52 (2.5) 44 (2.6) 33 (1.6) 2010–12 18 (2.3) 16 (1.4) 15 (1.0)
† Only classes using published textbooks/programs were included in these analyses. It is interesting to note that while national experts in science and mathematics education are often critical of textbook quality,7 most teachers consider their textbooks to be of relatively high quality. As can be seen in Table 6.9, teachers in the majority of science and mathematics classes in each grade range consider their textbooks/programs to be good or better, including 71–76 percent of classes in science and 76–78 percent of classes in mathematics at the various grade ranges.
Table 6.9 Perceived Quality of Textbooks/Programs
Used in Classes, by Subject and Grade Range Percent of Classes† Elementary Middle High
Science Very Poor 6 (2.6) 2 (1.5) 1 (0.5) Poor 4 (1.4) 3 (1.0) 3 (0.8) Fair 19 (2.6) 18 (2.5) 20 (2.6) Good 32 (2.9) 32 (3.5) 32 (2.3) Very Good 32 (3.7) 36 (3.3) 33 (2.6) Excellent 7 (1.8) 8 (2.6) 11 (1.5)
Mathematics Very Poor 1 (0.6) 2 (1.2) 1 (0.4) Poor 3 (0.9) 4 (0.9) 4 (0.8) Fair 20 (2.4) 19 (2.4) 16 (1.3) Good 38 (2.5) 34 (2.6) 33 (2.5) Very Good 30 (2.5) 33 (2.9) 37 (2.3) Excellent 9 (1.4) 9 (1.6) 8 (1.0)
† Only classes using published textbooks/programs were included in these analyses.
7 For example, American Association for the Advancement of Science (2000). Middle grades mathematics textbooks: A benchmarks-based evaluation. Washington, DC: American Association for the Advancement of Science.

Horizon Research, Inc. 97 February 2013
Table 6.10 shows the percentages of science and mathematics classes in elementary, middle, and high school that “cover” various proportions of their textbooks. Note that in each grade range mathematics classes are more likely than science classes to go through a substantial portion of their textbook, often covering 75 percent or more of their textbooks.
Table 6.10 Percentage of Textbooks/Programs Covered
during the Course, by Subject and Grade Range Percent of Classes† Elementary Middle High
Science Less than 25 percent 13 (3.3) 3 (1.3) 8 (1.7) 25–49 percent 8 (2.6) 15 (3.9) 18 (2.4) 50–74 percent 27 (4.7) 35 (4.7) 33 (2.8) 75–100 percent 52 (5.6) 47 (5.7) 41 (3.5)
Mathematics Less than 25 percent 2 (0.8) 2 (0.7) 1 (0.4) 25–49 percent 5 (1.3) 7 (2.1) 7 (1.2) 50–74 percent 13 (1.8) 22 (3.1) 25 (2.1) 75–100 percent 81 (2.4) 69 (3.5) 67 (2.1)
† Only classes using published textbooks/programs were included in these analyses Mathematics classes at all grade ranges are more likely than science classes to spend a substantial portion of their time using the textbook (see Table 6.11). For example, almost half of high school mathematics classes use the textbook more than 75 percent of the time, compared to only 13 percent of high school science classes. It is also striking that in most high school science classes, less than half of the instructional time is spent using the textbook.
Table 6.11 Percentage of Instructional Time Spent Using
Instructional Materials during the Course, by Grade Range Percent of Classes† Elementary Middle High
Science Less than 25 percent 15 (3.2) 25 (5.1) 46 (2.8) 25–49 percent 27 (3.4) 22 (3.3) 26 (2.3) 50–74 percent 22 (4.0) 26 (3.2) 15 (2.4) 75 percent or more 35 (4.2) 26 (4.8) 13 (2.1)
Mathematics Less than 25 percent 4 (1.2) 14 (2.0) 21 (2.2) 25–49 percent 12 (2.3) 14 (1.9) 14 (1.7) 50–74 percent 20 (2.6) 23 (3.2) 20 (1.7) 75 percent or more 64 (3.4) 49 (3.5) 45 (2.7)
† Only classes using published textbooks/programs were included in these analyses

Horizon Research, Inc. 98 February 2013
Survey respondents were asked to describe how they used their textbook in their most recent unit. Two important findings emerge from these data. First, textbooks heavily influence science and mathematics instruction at all grade ranges (see Table 6.12). Teachers in 64 percent or more of classes in the various subject/grade-range categories report using the textbook substantially to guide the overall structure and content emphasis in their most recent unit; large proportions (45–74 percent) use the textbook for more detailed organization. There is some evidence that teachers in upper grades are less likely than those in lower grades to rely on the textbook for organizing instructional units. For example, in 45 percent of high school science classes, teachers use the textbook substantially to guide the detailed structure of the unit, compared to 65 percent of elementary classes. Second, it is clear that teachers deviate from their textbooks substantially when designing instruction. In more than half of science and mathematics classes, teachers report incorporating activities from other sources substantially; more than 4 in 10 report “picking and choosing” from the textbook.
Table 6.12 Ways Teachers Substantially† Used Their
Textbook in the Most Recent Unit, by Grade Range Percent of Classes‡ Elementary Middle High
Science Classes You incorporated activities (e.g., problems, investigations,
readings) from other sources to supplement what the textbook/module was lacking 64 (2.7) 75 (2.5) 79 (1.7)
You used the textbook/module to guide the overall structure and content emphasis of the unit 77 (2.8) 66 (2.7) 64 (2.1)
You picked what is important from the textbook/module and skipped the rest 42 (2.2) 49 (3.2) 51 (2.0)
You followed the textbook/module to guide the detailed structure and content emphasis of the unit 65 (2.8) 51 (3.0) 45 (2.3)
Mathematics Classes You incorporated activities (e.g., problems, investigations,
readings) from other sources to supplement what the textbook/program was lacking 62 (2.1) 68 (2.6) 56 (1.9)
You used the textbook/program to guide the overall structure and content emphasis of the unit 81 (1.6) 71 (2.2) 74 (1.5)
You picked what is important from the textbook/program and skipped the rest 43 (2.0) 51 (2.5) 52 (1.6)
You followed the textbook/program to guide the detailed structure and content emphasis of the unit 74 (2.0) 56 (2.7) 57 (1.5)
† Includes those responding 4 or 5 on a 5-point scale ranging from 1 “not at all” to 5 “to a great extent.” ‡ Only classes using published textbooks/programs in the most recent unit were included in these analyses.
Teachers in over 40 percent of science and mathematics classes skip activities in the textbook substantially. In both subjects, the most often selected reason is having another activity that works better than the one skipped (see Table 6.13). Teachers cite this reason with striking consistency across grade ranges. Differences across grades, however, are also apparent. For example, in mathematics, teachers in 31 percent of elementary classes cite the difficulty of the activity as the reason for skipping it, compared to 55 percent in high school mathematics classes.
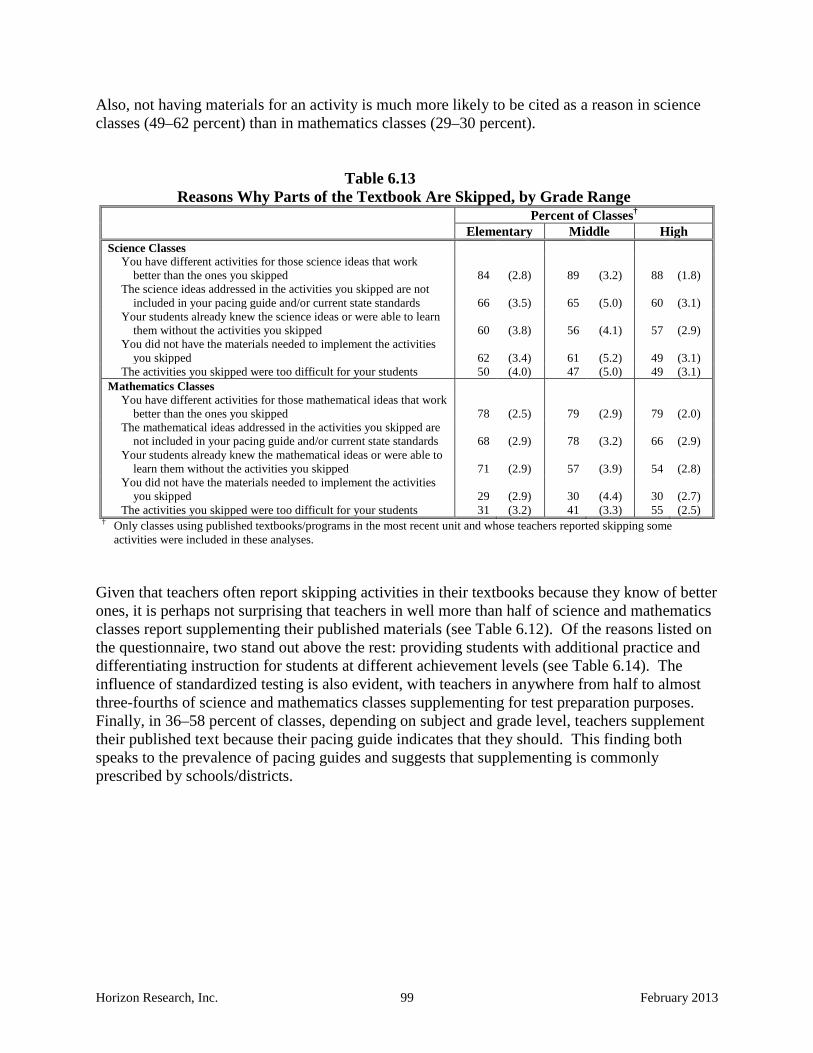
Horizon Research, Inc. 99 February 2013
Also, not having materials for an activity is much more likely to be cited as a reason in science classes (49–62 percent) than in mathematics classes (29–30 percent).
Table 6.13 Reasons Why Parts of the Textbook Are Skipped, by Grade Range
Percent of Classes† Elementary Middle High Science Classes
You have different activities for those science ideas that work better than the ones you skipped 84 (2.8) 89 (3.2) 88 (1.8)
The science ideas addressed in the activities you skipped are not included in your pacing guide and/or current state standards 66 (3.5) 65 (5.0) 60 (3.1)
Your students already knew the science ideas or were able to learn them without the activities you skipped 60 (3.8) 56 (4.1) 57 (2.9)
You did not have the materials needed to implement the activities you skipped 62 (3.4) 61 (5.2) 49 (3.1)
The activities you skipped were too difficult for your students 50 (4.0) 47 (5.0) 49 (3.1) Mathematics Classes
You have different activities for those mathematical ideas that work better than the ones you skipped 78 (2.5) 79 (2.9) 79 (2.0)
The mathematical ideas addressed in the activities you skipped are not included in your pacing guide and/or current state standards 68 (2.9) 78 (3.2) 66 (2.9)
Your students already knew the mathematical ideas or were able to learn them without the activities you skipped 71 (2.9) 57 (3.9) 54 (2.8)
You did not have the materials needed to implement the activities you skipped 29 (2.9) 30 (4.4) 30 (2.7)
The activities you skipped were too difficult for your students 31 (3.2) 41 (3.3) 55 (2.5) † Only classes using published textbooks/programs in the most recent unit and whose teachers reported skipping some
activities were included in these analyses. Given that teachers often report skipping activities in their textbooks because they know of better ones, it is perhaps not surprising that teachers in well more than half of science and mathematics classes report supplementing their published materials (see Table 6.12). Of the reasons listed on the questionnaire, two stand out above the rest: providing students with additional practice and differentiating instruction for students at different achievement levels (see Table 6.14). The influence of standardized testing is also evident, with teachers in anywhere from half to almost three-fourths of science and mathematics classes supplementing for test preparation purposes. Finally, in 36–58 percent of classes, depending on subject and grade level, teachers supplement their published text because their pacing guide indicates that they should. This finding both speaks to the prevalence of pacing guides and suggests that supplementing is commonly prescribed by schools/districts.

Horizon Research, Inc. 100 February 2013
Table 6.14 Reasons Why the Textbook Is Supplemented, by Grade Range
Percent of Classes† Elementary Middle High Science Classes
Supplemental activities were needed to provide students with additional practice 86 (2.1) 94 (2.4) 93 (1.6)
Supplemental activities were needed so students at different levels of achievement could increase their understanding of the ideas targeted in each activity 93 (1.6) 96 (1.2) 92 (1.4)
Supplemental activities were needed to prepare students for standardized tests 49 (4.1) 63 (5.4) 53 (3.3)
Your pacing guide indicated that you should use supplemental activities 58 (3.2) 49 (4.6) 37 (2.5)
Mathematics Classes Supplemental activities were needed to provide students with
additional practice 95 (1.5) 96 (1.1) 94 (1.3) Supplemental activities were needed so students at different levels
of achievement could increase their understanding of the ideas targeted in each activity 96 (1.0) 97 (1.0) 91 (1.7)
Supplemental activities were needed to prepare students for standardized tests 65 (2.7) 72 (4.4) 55 (2.6)
Your pacing guide indicated that you should use supplemental activities 49 (3.1) 40 (4.2) 36 (2.1)
† Only classes using published textbooks/programs in the most recent unit and whose teachers reported skipping some activities were included in these analyses.
Facilities and Equipment Teachers were presented with a list of instructional technologies and asked about their availability in the randomly selected class. The three response options were:
• Do not have one per group available; • At least one per group available upon request or in another room; and • At least one per group located in your classroom.
The percentages of science classes with at least some availability (either in the classroom, upon request, or in another room) are shown in Table 6.15. Internet access is particularly widespread, regardless of grade range. Personal computers are also widely available. Other, more science-specific resources, seem to follow predictable patterns of availability. For example, microscopes and probes for collecting data are more prevalent in middle and high school than in elementary school classrooms, perhaps due to the sophistication of science activities in secondary grades.

Horizon Research, Inc. 101 February 2013
Table 6.15 Availability† of Instructional
Technologies in Science Classes, by Grade Range Percent of Classes Elementary Middle High Internet access 84 (1.9) 85 (2.4) 86 (1.3) Microscopes 48 (3.2) 82 (1.9) 81 (1.9) Personal computers, including laptops 69 (2.4) 75 (2.9) 79 (1.6) Non-graphing calculators 69 (2.9) 83 (2.3) 77 (2.1) Probes for collecting data (e.g., motion sensors, temperature probes) 32 (3.1) 43 (2.9) 64 (2.5) Classroom response system or “Clickers” (handheld devices used to
respond electronically to questions in class) 41 (3.8) 46 (2.7) 47 (2.3) Graphing calculators 9 (2.3) 30 (2.9) 44 (2.3) Hand-held computers (e.g., PDAs, tablets, smartphones, iPads) 20 (2.3) 19 (2.2) 20 (1.5)
† Includes only those rating the availability as at least one per group available, either in the classroom, upon request, or in another room.
Interestingly, the availability of some resources depends on the achievement level of students in the class. For example, as shown in Table 6.16, calculators, probes for collecting data, and microscopes are much more likely to be available in classes with mostly high-achieving students than in classes with mostly low-achieving students.
Table 6.16 Availability† of Instructional Technologies in
Science Classes, by Prior Achievement Level of Students Percent of Classes Mostly High
Achievers Average/Mixed
Achievers Mostly Low Achievers
Graphing calculators 39 (3.6) 23 (1.5) 18 (3.3) Non-graphing calculators 79 (3.3) 77 (1.6) 61 (6.0) Probes for collecitng data 58 (4.7) 43 (2.1) 34 (4.4) Microscopes 82 (3.0) 63 (2.0) 59 (5.1) † Availability defined as having at least one instructional technology per small group (4–5 students).
In mathematics, it is not surprising that more sophisticated calculators are more widely available in secondary classes than in elementary classes. For example, the availability of graphing calculators ranges from 11 percent of elementary classes to 83 percent of high school classes (see Table 6.17).

Horizon Research, Inc. 102 February 2013
Table 6.17 Availability† of Instructional
Technologies in Mathematics Classes, by Grade Range Percent of Classes Elementary Middle High Graphing calculators 11 (1.9) 50 (2.9) 83 (1.7) Scientific calculators 16 (2.2) 69 (2.7) 74 (1.7) Internet access 80 (1.9) 80 (2.0) 70 (1.9) Four-function calculators 58 (3.0) 77 (2.0) 61 (1.9) Personal computers, including laptops 68 (2.5) 68 (2.5) 58 (2.3) Classroom response system or “Clickers” (handheld devices used to
respond electronically to questions in class) 39 (2.6) 53 (3.0) 44 (2.5) Probes for collecting data (e.g., motion sensors, temperature probes) 19 (2.0) 18 (2.1) 26 (2.2) Hand-held computers (e.g., PDAs, tablets, smartphones, iPads) 17 (2.2) 21 (2.5) 17 (1.4)
† Includes only those rating the availability as at least one per group available, either in the classroom, upon request, or in another room.
As in science, some resources are not distributed evenly across all mathematics classes. One obvious disparity is associated with the percentage of non-Asian minority students in the class. As can be seen in Table 6.18, calculators and probes for collecting data are much more likely to be available in classes with the lowest percentages of these students, compared to classes with the highest percentages.
Table 6.18 Availability† of Instructional Technologies in
Mathematics Classes, by Percent of Non-Asian Minority Students in Class Percent of Classes Lowest
Quartile Second
Quartile Third
Quartile Highest Quartile
Scientific calculators 58 (2.4) 50 (3.5) 43 (3.1) 37 (3.2) Graphing calculators 53 (2.6) 44 (3.0) 39 (3.2) 34 (3.2) Probes for collecting data 30 (2.4) 18 (2.2) 20 (3.0) 16 (2.0)
† Availability defined as having at least one instructional technology per small group (4–5 students). Clearly, not all mathematics classes have access to all types of calculators. It appears that teachers compensate in part by expecting students to provide their own; especially in the case of more sophisticated calculators in high school mathematics classes (see Table 6.19). For example, students in almost 4 out of 10 high school mathematics classes are expected to bring their own scientific calculator.

Horizon Research, Inc. 103 February 2013
Table 6.19 Expectations that Students will Provide
their Own Instructional Technologies, by Grade Range Percent of Classes Elementary Middle High Science Classes
Graphing/Other calculators 4 (1.0) 27 (2.6) 55 (2.2) Laptop computers 2 (0.8) 2 (0.9) 8 (1.1) Hand-held computers 1 (0.7) 3 (1.3) 7 (1.0)
Mathematics Classes Scientific calculators 3 (0.8) 22 (2.2) 38 (2.0) Graphing calculators 3 (0.7) 8 (1.9) 30 (2.0) Four-function calculators 5 (1.3) 23 (2.4) 23 (1.8) Laptop computers 3 (0.9) 4 (0.9) 7 (1.1) Hand-held computers 3 (0.8) 3 (0.9) 6 (0.9)
The 2012 National Survey also asked science and mathematics program representatives how much money their schools spent during the most recently completed year on three kinds of resources: equipment (excluding computers), consumable supplies (e.g., chemicals, graph paper), and software specific to science and mathematics instruction. By dividing these amounts by school enrollment, per-pupil estimates were generated (see Table 6.20). In science, per-pupil spending on equipment and supplies increases sharply with grade range, as does overall per-pupil spending. In mathematics, per-pupil spending is substantially higher in elementary schools than in middle and high schools.
Table 6.20 Median Amount Schools Spend per Pupil on Science and
Mathematics Equipment and Consumable Supplies,† by Grade Range Median Amount
Elementary Middle High Science
Equipment $ 0.26 (0.1)‡ $ 0.71 (0.2) $ 2.06 (0.3) Consumable Supplies $ 0.95 (0.1) $ 1.45 (0.1) $ 3.44 (0.2) Total§ $ 1.55 (0.3) $ 3.13 (0.4) $ 6.11 (0.7)
Mathematics Equipment $ 0.95 (0.2) $ 0.73 (0.1) $ 1.05 (0.2) Consumable Supplies $ 1.08 (0.2) $ 0.64 (0.1) $ 0.61 (0.1) Total§ $ 4.27 (0.7) $ 2.76 (0.4) $ 2.46 (0.4)
† The survey asked about spending on software in addition to equipment and supplies. The median per pupil spending on software in each subject/grade-range combination is $0.00.
‡ Standard errors for medians are typically computed in Wesvar 5.1 using the Woodruff method. Wesvar was unable to compute a standard error for this estimate using this method; thus, the potentially less-consistent replication standard error is reported.
§ Includes spending on software. Expenditures for science and mathematics are not distributed equally across all schools. For example, rural schools spend more per pupil than suburban and urban schools on science and mathematics resources (see Tables 6.21 and 6.22). Per-pupil expenditures on science and mathematics equipment do not vary widely by the percentage of students in the school who are

Horizon Research, Inc. 104 February 2013
eligible for free/reduced-price lunch. And although there appears to be some variation in spending on supplies by percentage of students eligible for free/reduced-price lunch, there is no clear pattern.
Table 6.21 Median Amount Schools Spend per Pupil on Science
Equipment and Consumable Supplies, by Equity Factors Median Amount
Equipment Consumable Supplies Total† Percent of Students in School Eligible for FRL
Lowest Quartile $ 0.63 (0.2) $ 1.67 (0.5) $ 3.56 (0.8) Second Quartile $ 0.27 (0.1)‡ $ 0.98 (0.3) $ 1.85 (0.5) Third Quartile $ 0.57 (0.2) $ 1.17 (0.2) $ 2.47 (0.6) Highest Quartile $ 0.35 (0.4)‡ $ 0.65 (0.1) $ 1.54 (0.5)
School Size Smallest Schools $ 0.78 (0.2) $ 1.95 (0.4) $ 3.94 (0.5) Second Group $ 0.30 (0.1)‡ $ 1.08 (0.2) $ 1.96 (0.4) Third Group $ 0.40 (0.1) $ 0.95 (0.2) $ 1.82 (0.4) Largest Schools $ 0.44 (0.1) $ 0.79 (0.2) $ 2.04 (0.4)
Community Type Rural $ 0.81 (0.2) $ 1.63 (0.3) $ 3.78 (0.4) Suburban $ 0.39 (0.1) $ 1.40 (0.2) $ 2.49 (0.3) Urban $ 0.34 (0.2) $ 0.98 (0.2) $ 1.91 (0.7)
Region Midwest $ 0.55 (0.2) $ 1.80 (0.5) $ 3.18 (0.7) Northeast $ 1.34 (0.3) $ 1.99 (0.5) $ 4.15 (1.0) South $ 0.56 (0.1) $ 0.92 (0.1) $ 2.42 (0.4) West $ 0.14 (0.3)‡ $ 0.99 (0.2) $ 1.45 (0.5)
† The “Total” column includes spending on software. ‡ Standard errors for medians are typically computed in Wesvar 5.1 using the Woodruff method. Wesvar was unable to
compute a standard error for this estimate using this method; thus, the potentially less-consistent replication standard error is reported.
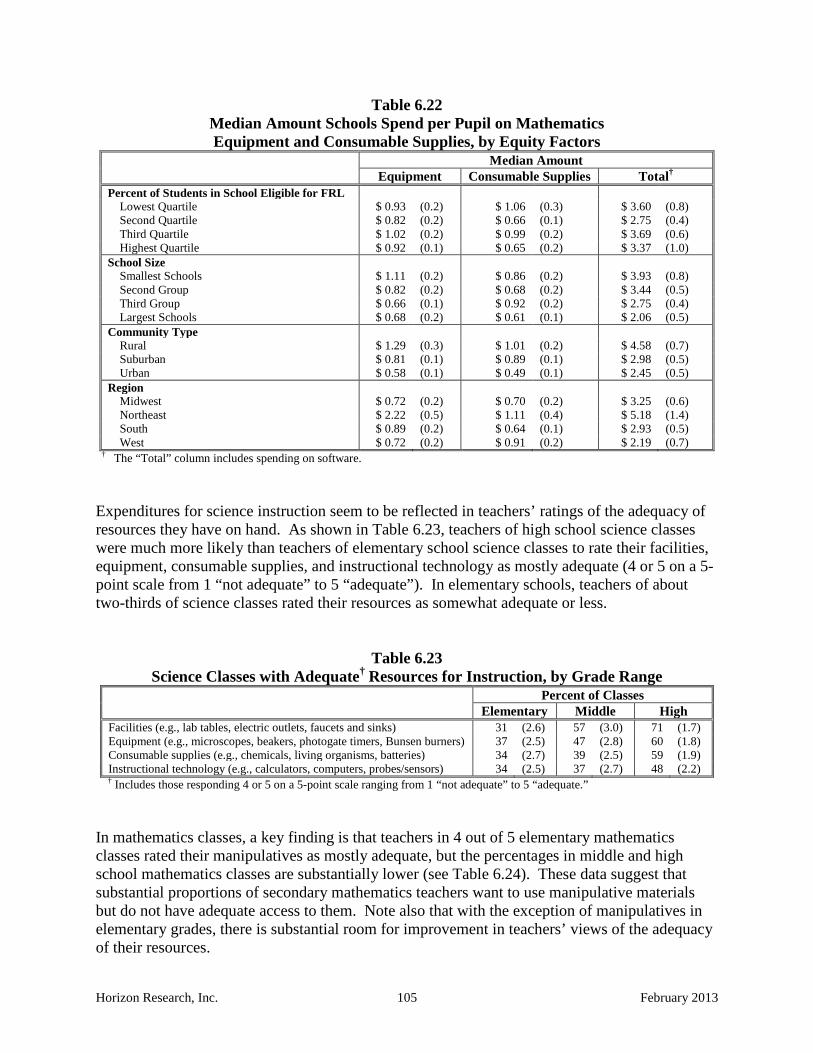
Horizon Research, Inc. 105 February 2013
Table 6.22 Median Amount Schools Spend per Pupil on Mathematics Equipment and Consumable Supplies, by Equity Factors
Median Amount Equipment Consumable Supplies Total†
Percent of Students in School Eligible for FRL Lowest Quartile $ 0.93 (0.2) $ 1.06 (0.3) $ 3.60 (0.8) Second Quartile $ 0.82 (0.2) $ 0.66 (0.1) $ 2.75 (0.4) Third Quartile $ 1.02 (0.2) $ 0.99 (0.2) $ 3.69 (0.6) Highest Quartile $ 0.92 (0.1) $ 0.65 (0.2) $ 3.37 (1.0)
School Size Smallest Schools $ 1.11 (0.2) $ 0.86 (0.2) $ 3.93 (0.8) Second Group $ 0.82 (0.2) $ 0.68 (0.2) $ 3.44 (0.5) Third Group $ 0.66 (0.1) $ 0.92 (0.2) $ 2.75 (0.4) Largest Schools $ 0.68 (0.2) $ 0.61 (0.1) $ 2.06 (0.5)
Community Type Rural $ 1.29 (0.3) $ 1.01 (0.2) $ 4.58 (0.7) Suburban $ 0.81 (0.1) $ 0.89 (0.1) $ 2.98 (0.5) Urban $ 0.58 (0.1) $ 0.49 (0.1) $ 2.45 (0.5)
Region Midwest $ 0.72 (0.2) $ 0.70 (0.2) $ 3.25 (0.6) Northeast $ 2.22 (0.5) $ 1.11 (0.4) $ 5.18 (1.4) South $ 0.89 (0.2) $ 0.64 (0.1) $ 2.93 (0.5) West $ 0.72 (0.2) $ 0.91 (0.2) $ 2.19 (0.7)
† The “Total” column includes spending on software. Expenditures for science instruction seem to be reflected in teachers’ ratings of the adequacy of resources they have on hand. As shown in Table 6.23, teachers of high school science classes were much more likely than teachers of elementary school science classes to rate their facilities, equipment, consumable supplies, and instructional technology as mostly adequate (4 or 5 on a 5-point scale from 1 “not adequate” to 5 “adequate”). In elementary schools, teachers of about two-thirds of science classes rated their resources as somewhat adequate or less.
Table 6.23 Science Classes with Adequate† Resources for Instruction, by Grade Range
Percent of Classes Elementary Middle High Facilities (e.g., lab tables, electric outlets, faucets and sinks) 31 (2.6) 57 (3.0) 71 (1.7) Equipment (e.g., microscopes, beakers, photogate timers, Bunsen burners) 37 (2.5) 47 (2.8) 60 (1.8) Consumable supplies (e.g., chemicals, living organisms, batteries) 34 (2.7) 39 (2.5) 59 (1.9) Instructional technology (e.g., calculators, computers, probes/sensors) 34 (2.5) 37 (2.7) 48 (2.2) † Includes those responding 4 or 5 on a 5-point scale ranging from 1 “not adequate” to 5 “adequate.”
In mathematics classes, a key finding is that teachers in 4 out of 5 elementary mathematics classes rated their manipulatives as mostly adequate, but the percentages in middle and high school mathematics classes are substantially lower (see Table 6.24). These data suggest that substantial proportions of secondary mathematics teachers want to use manipulative materials but do not have adequate access to them. Note also that with the exception of manipulatives in elementary grades, there is substantial room for improvement in teachers’ views of the adequacy of their resources.

Horizon Research, Inc. 106 February 2013
Table 6.24 Mathematics Classes with Adequate† Resources for Instruction, by Grade Range
Percent of Classes Elementary Middle High Measurement tools (e.g., protractors, rulers) 67 (1.9) 70 (2.1) 70 (1.4) Instructional technology (e.g., calculators, computers, probes/sensors) 50 (2.1) 62 (2.2) 69 (1.7) Consumable supplies (e.g., graphing paper, batteries) 57 (1.8) 62 (2.3) 66 (1.7) Manipulatives (e.g., pattern blocks, algebra tiles) 82 (1.8) 58 (2.1) 43 (1.7)
† Includes those responding 4 or 5 on a 5-point scale ranging from 1 “not adequate” to 5 “adequate.” A composite variable named “Adequacy of Resources for Instruction” was created from these items. As shown in Table 6.25, perceptions of the adequacy of resources vary substantially by content area in elementary and middle school classrooms but are essentially the same in high school classrooms. This summary view echoes other findings reported in this section, suggesting that science instruction in the earlier grades is underresourced from the teachers’ point of view.
Table 6.25 Class Mean Scores on the
Adequacy of Resources for Instruction Composite, by Grade Range Percent of Classes Science Mathematics Elementary School 49 (1.4) 70 (0.9) Middle School 57 (1.4) 71 (1.0) High School 68 (0.9) 70 (0.8)
Mathematics teachers’ views of the adequacy of their resources do not tend to differ substantially by various equity factors. In science, teachers of classes with mostly high-achieving students have the most positive views about their resources, compared to classes with average/mixed achievers and those with mostly low-achieving students (see Table 6.26). Similarly, teachers of classes with the lowest percentage of non-Asian minority students have more positive views than those with the highest percentage, as do teachers of classes with the lowest percentage of free/reduced-price lunch students, compared to those with higher percentages.

Horizon Research, Inc. 107 February 2013
Table 6.26 Class Mean Scores on the Adequacy of
Resources for Instruction Composite, by Equity Factors Mean Score
Science Mathematics Prior Achievement Level of Class
Mostly High Achievers 69 (1.6) 74 (0.9) Average/Mixed Achievers 56 (0.9) 70 (0.7) Mostly Low Achievers 47 (2.4) 68 (1.4)
Percent of Non-Asian Minority Students in Class Lowest Quartile 60 (1.5) 73 (0.9) Second Quartile 59 (1.5) 71 (1.1) Third Quartile 58 (1.3) 70 (1.0) Highest Quartile 50 (1.7) 69 (1.3)
Percent of Students in School Eligible for FRL Lowest Quartile 64 (1.7) 73 (1.3) Second Quartile 55 (1.4) 71 (1.0) Third Quartile 54 (1.5) 69 (1.1) Highest Quartile 50 (1.7) 68 (1.4)
Summary
An investigation of the textbooks and equipment teachers use with their classes reveals a great deal about the learning environment experienced by grade K–12 students in 2012. Science classes are more likely than mathematics classes to use multiple textbooks (or programs or modules), especially at the elementary level. Across both science and mathematics, the same three publishers dominate, accounting for at least 75 percent of the market at each level. Science classes are more likely than mathematics classes to use older textbooks. For example, 58 percent of elementary science classes that use a textbook have one published before 2007, compared to 30 percent of elementary mathematics classes. Interestingly, more than 70 percent of teachers in both subjects rate their textbooks as good or better. Textbooks appear to exert substantial influence on instruction, from the amount of class time spent using the textbook (especially in mathematics) to the ways teachers use them to plan for and organize instruction. At the same time, it is clear that teachers deviate from their published materials substantially, both skipping parts of the text (most often because teachers know of something better) and supplementing with other materials (most often to provide additional practice or to differentiate instruction). The availability of instructional equipment follows somewhat predictable patterns in both subjects. More sophisticated technologies (e.g., microscopes, graphing calculators) are more likely to be present in high schools than elementary schools. However, across classes, these resources are sometimes not distributed equitably. In science for example, classes composed of mostly high-achieving students are more likely than those composed of mixed or low-achieving students to have access to microscopes and graphing calculators. The amount of money schools report spending on instructional resources seems quite inadequate, especially viewed as a per-pupil expenditure. In science, the problem is especially pronounced in elementary grades, where median per-pupil spending is half of that spent in middle schools

Horizon Research, Inc. 108 February 2013
and less than one-third of spending in high schools. The lack of spending is related to the finding that elementary science teachers are less likely than their middle school and high school counterparts to view their resources as adequate. There is no such disparity by grade level in mathematics. An analysis of spending by school poverty suggests no major differences; however, urban and suburban schools tend to spend less per pupil than rural ones on science and mathematics equipment and supplies. This disparity is almost certainly related to school size, as small schools spend substantially more per pupil than large schools.
Horizon Research, Inc. 109 February 2013
CHAPTER SEVEN
Factors Affecting Instruction Overview Students’ opportunities to learn science and mathematics are affected by a myriad of factors, including teacher preparedness, school and district policies and practices, and administrator and community support. Although the primary focus of the 2012 National Survey of Science and Mathematics Education was on teachers and teaching, the study also collected information on the context of classroom practice. Among the data collected were the extent of use of various programs and practices in the school, the extent of influence of state standards for science and mathematics education, and the extent of various problems that may affect science and mathematics instruction in the school. These data are presented in the following sections. School Programs and Practices The designated school program representatives were given a list of programs and practices and asked to indicate whether each was being implemented in the school. These individuals were also asked about several instructional arrangements for students in self-contained classrooms—whether they were pulled out for remediation or enrichment in science and mathematics and whether they received science and mathematics instruction from specialists instead of, or in addition to, their regular teacher. Table 7.1 shows the percentage of elementary schools indicating that each program or practice is in place. The use of science specialists, either in place of or in addition to the regular classroom teacher, is uncommon (10–16 percent of schools). Pull-out instruction, whether for remediation or enrichment, is also quite rare (7–10 percent of schools). The picture is quite different in elementary school mathematics instruction. Students are pulled out for remediation in almost 60 percent of schools, and in roughly one-third of schools, students are pulled out for enrichment. The prevalence of these practices may be due in part to the fact that mathematics is much more likely than science to be tested for accountability purposes. In addition, Title 1 funds are more likely to be targeted for remediation in mathematics and reading than in science.
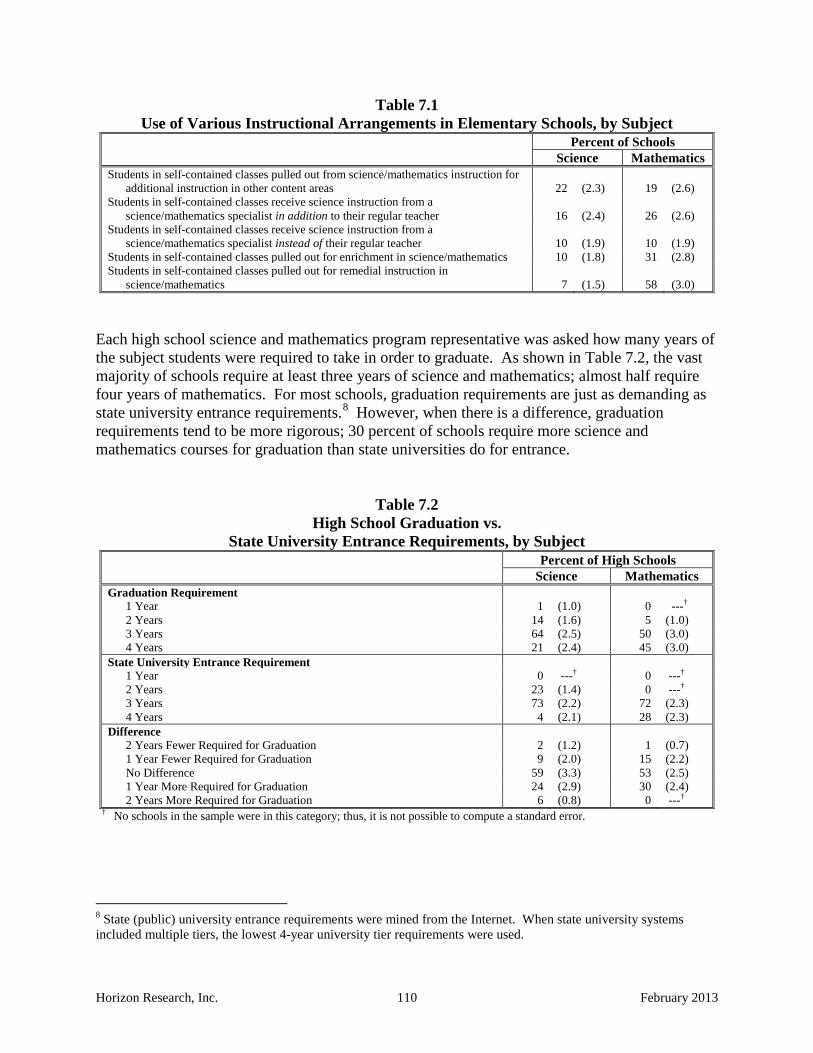
Horizon Research, Inc. 110 February 2013
Table 7.1 Use of Various Instructional Arrangements in Elementary Schools, by Subject
Percent of Schools Science Mathematics
Students in self-contained classes pulled out from science/mathematics instruction for additional instruction in other content areas 22 (2.3) 19 (2.6)
Students in self-contained classes receive science instruction from a science/mathematics specialist in addition to their regular teacher 16 (2.4) 26 (2.6)
Students in self-contained classes receive science instruction from a science/mathematics specialist instead of their regular teacher 10 (1.9) 10 (1.9)
Students in self-contained classes pulled out for enrichment in science/mathematics 10 (1.8) 31 (2.8) Students in self-contained classes pulled out for remedial instruction in
science/mathematics 7 (1.5) 58 (3.0) Each high school science and mathematics program representative was asked how many years of the subject students were required to take in order to graduate. As shown in Table 7.2, the vast majority of schools require at least three years of science and mathematics; almost half require four years of mathematics. For most schools, graduation requirements are just as demanding as state university entrance requirements.8 However, when there is a difference, graduation requirements tend to be more rigorous; 30 percent of schools require more science and mathematics courses for graduation than state universities do for entrance.
Table 7.2 High School Graduation vs.
State University Entrance Requirements, by Subject Percent of High Schools Science Mathematics
Graduation Requirement 1 Year 1 (1.0) 0 ---† 2 Years 14 (1.6) 5 (1.0) 3 Years 64 (2.5) 50 (3.0) 4 Years 21 (2.4) 45 (3.0)
State University Entrance Requirement 1 Year 0 ---† 0 ---† 2 Years 23 (1.4) 0 ---† 3 Years 73 (2.2) 72 (2.3) 4 Years 4 (2.1) 28 (2.3)
Difference 2 Years Fewer Required for Graduation 2 (1.2) 1 (0.7) 1 Year Fewer Required for Graduation 9 (2.0) 15 (2.2) No Difference 59 (3.3) 53 (2.5) 1 Year More Required for Graduation 24 (2.9) 30 (2.4) 2 Years More Required for Graduation 6 (0.8) 0 ---†
† No schools in the sample were in this category; thus, it is not possible to compute a standard error.
8 State (public) university entrance requirements were mined from the Internet. When state university systems included multiple tiers, the lowest 4-year university tier requirements were used.

Horizon Research, Inc. 111 February 2013
The study asked schools whether they had implemented block scheduling. The rationale for block scheduling is largely two-fold. First, the schedule affords longer class periods, which can be especially important in science, where a 50-minute class constrains the kinds of laboratory activities that can be conducted. Second, students can take eight classes per year instead of six or seven. As shown in Table 7.3, approximately one-third of all middle and high schools use block scheduling.
Table 7.3 Prevalence of Block Scheduling
Percent of Schools Middle Schools 31 (3.4) High Schools 34 (3.1)
Finally, science and mathematics program representatives were asked to indicate which of several practices their school included to enhance student interest and/or achievement. The results are shown in Tables 7.4 and 7.5. Especially in science, such programs tend to be more prevalent as grade range increases. For example, almost half of high schools have science clubs, compared to 20 percent of elementary schools. Similarly, 40 percent of high schools have one or more teams participating in science competitions, whereas only 13 percent of elementary schools do. In mathematics, the percentage of schools offering school-based programs to enhance interest and achievement (apart from tutoring) is strikingly low. For example, only one-third of high schools have mathematics clubs, and less than a fourth of all schools offer after-school enrichment in mathematics.
Table 7.4 School Programs/Practices to Enhance Students’
Interest and/or Achievement in Science/Engineering, by Grade Range Percent of Schools Elementary Middle High
Offers after-school help in science and/or engineering (e.g., tutoring) 31 (2.7) 53 (3.6) 81 (2.9) Encourages students to participate in science and/or engineering summer
programs or camps offered by community colleges, universities, museums, or science centers 50 (3.5) 63 (3.6) 75 (3.5)
Sponsors visits to business, industry, and/or research sites related to science and/or engineering 30 (2.7) 35 (3.4) 48 (3.6)
Offers one or more science clubs 20 (2.6) 29 (3.0) 47 (3.4) Participates in a local or regional science and/or engineering fair 35 (3.0) 39 (3.3) 46 (3.2) Has one or more teams participating in science competitions (e.g., Science
Olympiad) 13 (2.0) 22 (2.2) 40 (3.4) Has one or more teams participating in engineering competitions (e.g.,
Robotics) 11 (1.9) 19 (2.4) 33 (2.4) Offers formal after-school programs for enrichment in science and/or
engineering 17 (2.5) 24 (2.7) 29 (3.1) Sponsors meetings with adult mentors who work in science and/or
engineering fields 16 (2.4) 24 (3.0) 28 (2.6) Offers one or more engineering clubs 7 (2.0) 13 (2.5) 21 (2.0) Holds family science and/or engineering nights 26 (2.8) 23 (3.0) 16 (2.9)

Horizon Research, Inc. 112 February 2013
Table 7.5 School Programs/Practices to Enhance Students’
Interest and/or Achievement in Mathematics, by Grade Range Percent of Schools Elementary Middle High
Offers after-school help in mathematics (e.g., tutoring) 67 (2.4) 80 (2.8) 92 (2.7) Encourages students to participate in mathematics summer programs or
camps offered by community colleges, universities, museums or mathematics centers 44 (2.7) 51 (2.8) 55 (3.6)
Has one or more teams participating in mathematics competitions (e.g., Math Counts) 24 (2.4) 35 (2.7) 43 (3.6)
Offers one or more mathematics clubs 15 (2.0) 23 (2.0) 32 (2.7) Offers formal after-school programs for enrichment in mathematics 18 (2.0) 24 (2.5) 21 (2.9) Participates in a local or regional mathematics fair 13 (2.2) 17 (2.6) 21 (3.4) Sponsors visits to business, industry, and/or research sites related to
mathematics 15 (2.3) 15 (2.2) 17 (2.8) Holds family math nights 31 (2.6) 19 (2.3) 10 (2.8) Sponsors meetings with adult mentors who work in mathematics fields 10 (1.7) 9 (1.6) 10 (1.5)
Interestingly, these programs are not distributed equally across all types of schools. Some differences are particularly evident by size of school. For example, 37 percent of the largest schools hold family science nights compared to only 16 percent of the smallest schools (see Table 7.6). A similarly large gap exists for the prevalence of family math nights (see Table 7.7). Disparities are also evident for enrichment programs, discipline-specific clubs, participation in competitions, and participation in science fairs.
Table 7.6 School Programs/Practices to Enhance
Students’ Interest in Science/Engineering, by School Size† Percent of Schools
Smallest Schools
Second Group
Third Group
Largest Schools
Encourage students to participate in summer programs/camps 58 (4.0) 59 (4.2) 54 (4.2) 65 (4.3) Participation in local or regional science fair 28 (3.5) 43 (3.8) 45 (3.7) 54 (4.2) After-school help 45 (3.8) 47 (3.7) 39 (3.4) 51 (4.0) Science clubs 21 (3.0) 32 (3.3) 42 (3.8) 38 (4.0) Family nights 16 (2.8) 23 (3.9) 29 (4.2) 37 (4.2) Sponsor visits to business, industry, and/or research sites 34 (3.3) 31 (3.4) 34 (3.8) 36 (3.8) After-school programs for enrichment 19 (2.9) 20 (2.9) 26 (2.7) 32 (4.1) Participation in science competitions 18 (2.4) 19 (2.4) 27 (3.0) 29 (3.2) Participation in engineering competitions 14 (2.4) 20 (2.8) 20 (2.5) 27 (2.9) Sponsor meetings with mentors who work in science and/or
engineering fields 17 (3.1) 23 (3.3) 19 (2.8) 21 (3.4) Engineering clubs 10 (2.5) 10 (1.9) 16 (2.1) 19 (2.7) † See Appendix E for a definition of the school size categories.
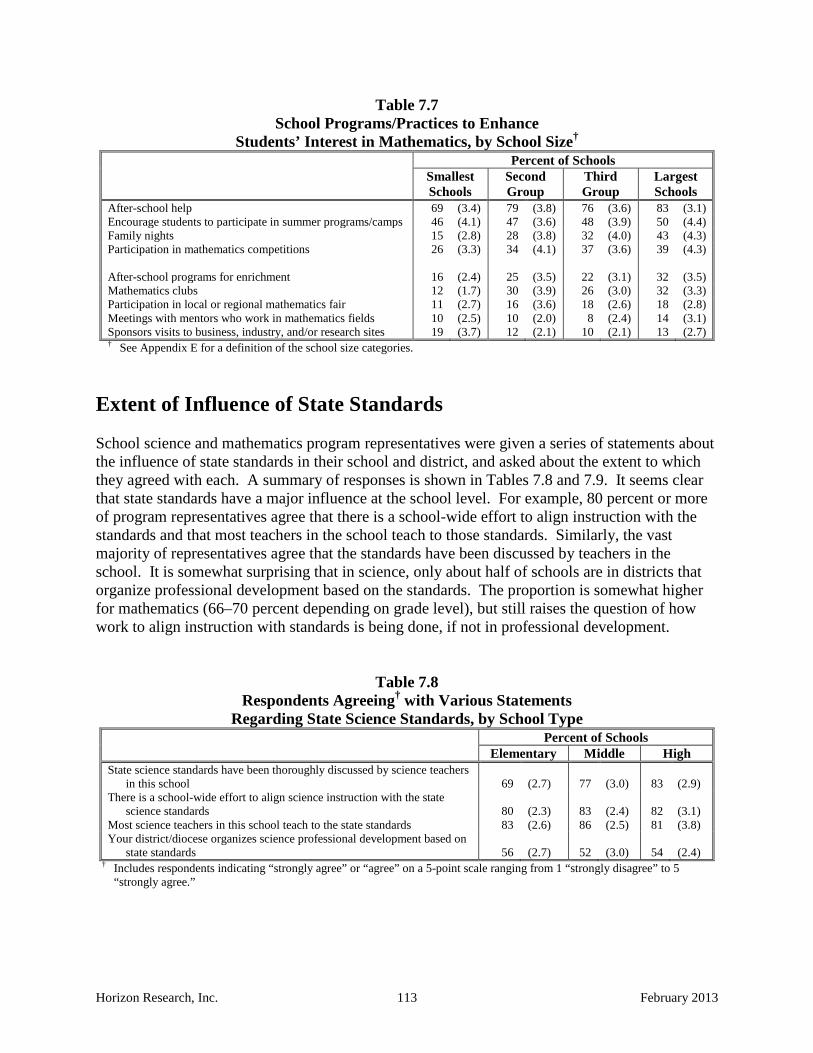
Horizon Research, Inc. 113 February 2013
Table 7.7 School Programs/Practices to Enhance
Students’ Interest in Mathematics, by School Size† Percent of Schools
Smallest Schools
Second Group
Third Group
Largest Schools
After-school help 69 (3.4) 79 (3.8) 76 (3.6) 83 (3.1) Encourage students to participate in summer programs/camps 46 (4.1) 47 (3.6) 48 (3.9) 50 (4.4) Family nights 15 (2.8) 28 (3.8) 32 (4.0) 43 (4.3) Participation in mathematics competitions 26 (3.3) 34 (4.1) 37 (3.6) 39 (4.3) After-school programs for enrichment 16 (2.4) 25 (3.5) 22 (3.1) 32 (3.5) Mathematics clubs 12 (1.7) 30 (3.9) 26 (3.0) 32 (3.3) Participation in local or regional mathematics fair 11 (2.7) 16 (3.6) 18 (2.6) 18 (2.8) Meetings with mentors who work in mathematics fields 10 (2.5) 10 (2.0) 8 (2.4) 14 (3.1) Sponsors visits to business, industry, and/or research sites 19 (3.7) 12 (2.1) 10 (2.1) 13 (2.7) † See Appendix E for a definition of the school size categories.
Extent of Influence of State Standards School science and mathematics program representatives were given a series of statements about the influence of state standards in their school and district, and asked about the extent to which they agreed with each. A summary of responses is shown in Tables 7.8 and 7.9. It seems clear that state standards have a major influence at the school level. For example, 80 percent or more of program representatives agree that there is a school-wide effort to align instruction with the standards and that most teachers in the school teach to those standards. Similarly, the vast majority of representatives agree that the standards have been discussed by teachers in the school. It is somewhat surprising that in science, only about half of schools are in districts that
organize professional development based on the standards. The proportion is somewhat higher for mathematics (66–70 percent depending on grade level), but still raises the question of how work to align instruction with standards is being done, if not in professional development.
Table 7.8 Respondents Agreeing† with Various Statements
Regarding State Science Standards, by School Type Percent of Schools Elementary Middle High
State science standards have been thoroughly discussed by science teachers in this school 69 (2.7) 77 (3.0) 83 (2.9)
There is a school-wide effort to align science instruction with the state science standards 80 (2.3) 83 (2.4) 82 (3.1)
Most science teachers in this school teach to the state standards 83 (2.6) 86 (2.5) 81 (3.8) Your district/diocese organizes science professional development based on
state standards 56 (2.7) 52 (3.0) 54 (2.4) † Includes respondents indicating “strongly agree” or “agree” on a 5-point scale ranging from 1 “strongly disagree” to 5
“strongly agree.”
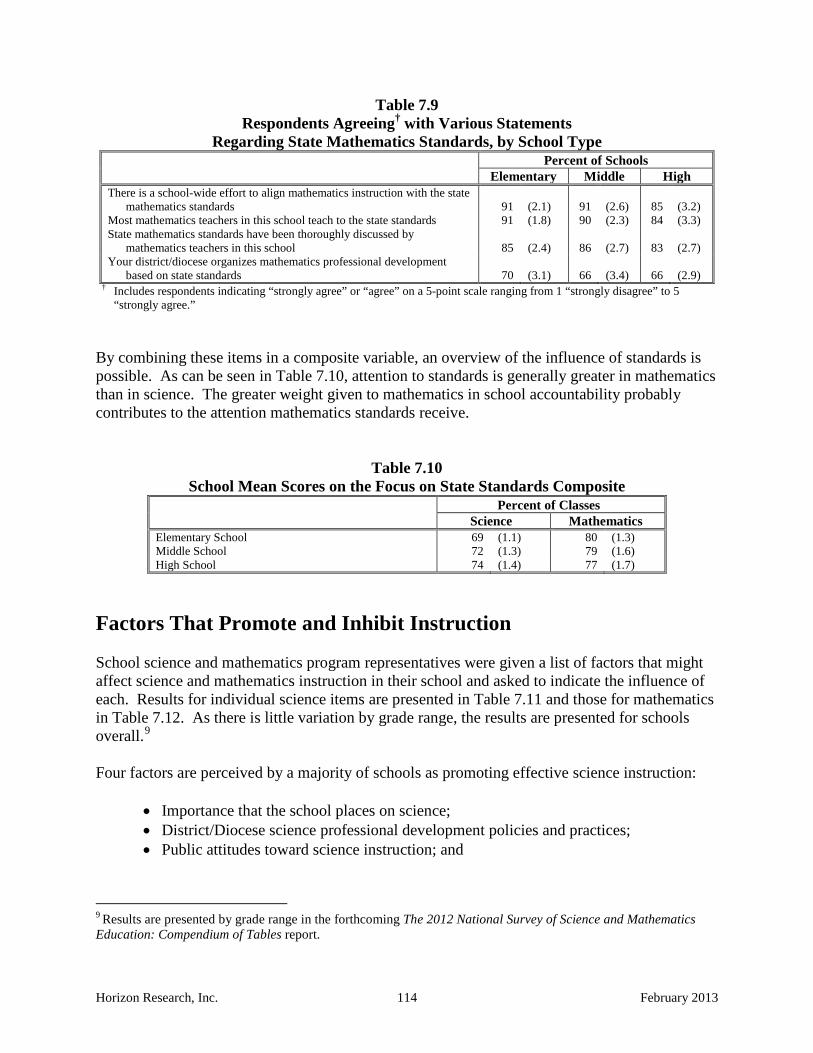
Horizon Research, Inc. 114 February 2013
Table 7.9 Respondents Agreeing† with Various Statements
Regarding State Mathematics Standards, by School Type Percent of Schools Elementary Middle High
There is a school-wide effort to align mathematics instruction with the state mathematics standards 91 (2.1) 91 (2.6) 85 (3.2)
Most mathematics teachers in this school teach to the state standards 91 (1.8) 90 (2.3) 84 (3.3) State mathematics standards have been thoroughly discussed by
mathematics teachers in this school 85 (2.4) 86 (2.7) 83 (2.7) Your district/diocese organizes mathematics professional development
based on state standards 70 (3.1) 66 (3.4) 66 (2.9) † Includes respondents indicating “strongly agree” or “agree” on a 5-point scale ranging from 1 “strongly disagree” to 5
“strongly agree.” By combining these items in a composite variable, an overview of the influence of standards is possible. As can be seen in Table 7.10, attention to standards is generally greater in mathematics than in science. The greater weight given to mathematics in school accountability probably contributes to the attention mathematics standards receive.
Table 7.10 School Mean Scores on the Focus on State Standards Composite
Percent of Classes Science Mathematics Elementary School 69 (1.1) 80 (1.3) Middle School 72 (1.3) 79 (1.6) High School 74 (1.4) 77 (1.7)
Factors That Promote and Inhibit Instruction School science and mathematics program representatives were given a list of factors that might affect science and mathematics instruction in their school and asked to indicate the influence of each. Results for individual science items are presented in Table 7.11 and those for mathematics in Table 7.12. As there is little variation by grade range, the results are presented for schools overall.9 Four factors are perceived by a majority of schools as promoting effective science instruction:
• Importance that the school places on science; • District/Diocese science professional development policies and practices; • Public attitudes toward science instruction; and
9 Results are presented by grade range in the forthcoming The 2012 National Survey of Science and Mathematics Education: Compendium of Tables report.
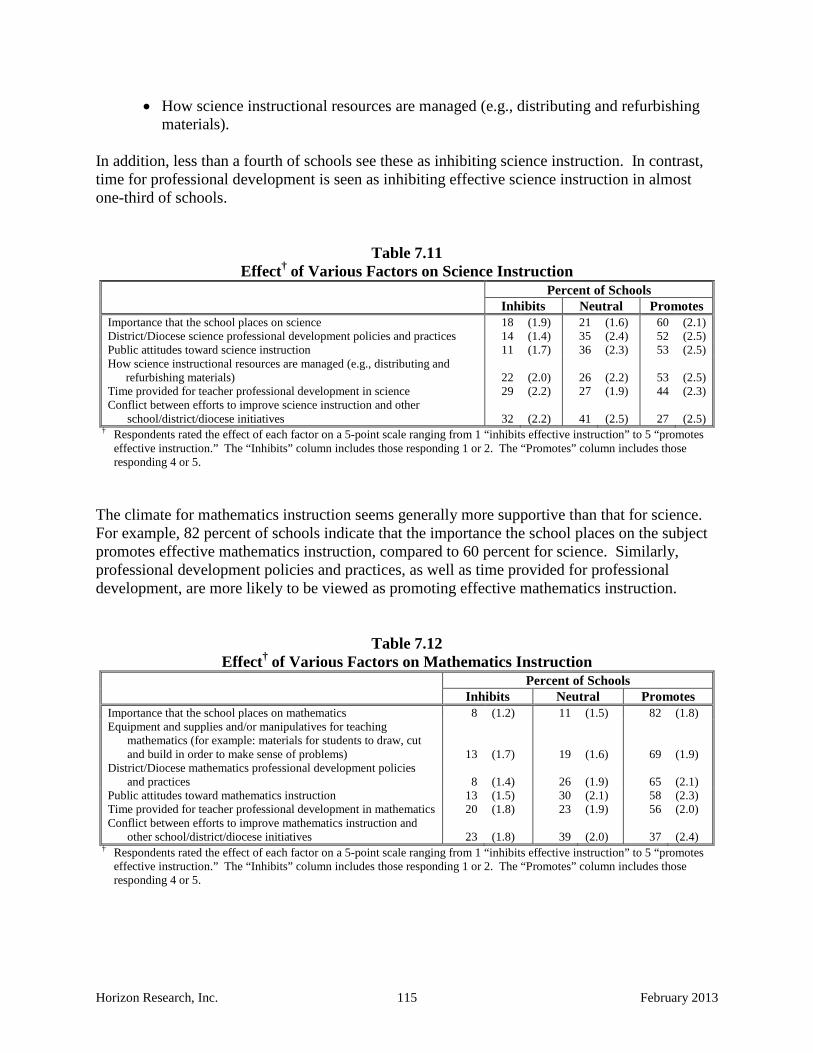
Horizon Research, Inc. 115 February 2013
• How science instructional resources are managed (e.g., distributing and refurbishing materials).
In addition, less than a fourth of schools see these as inhibiting science instruction. In contrast, time for professional development is seen as inhibiting effective science instruction in almost one-third of schools.
Table 7.11 Effect† of Various Factors on Science Instruction
Percent of Schools Inhibits Neutral Promotes
Importance that the school places on science 18 (1.9) 21 (1.6) 60 (2.1) District/Diocese science professional development policies and practices 14 (1.4) 35 (2.4) 52 (2.5) Public attitudes toward science instruction 11 (1.7) 36 (2.3) 53 (2.5) How science instructional resources are managed (e.g., distributing and
refurbishing materials) 22 (2.0) 26 (2.2) 53 (2.5) Time provided for teacher professional development in science 29 (2.2) 27 (1.9) 44 (2.3) Conflict between efforts to improve science instruction and other
school/district/diocese initiatives 32 (2.2) 41 (2.5) 27 (2.5) † Respondents rated the effect of each factor on a 5-point scale ranging from 1 “inhibits effective instruction” to 5 “promotes
effective instruction.” The “Inhibits” column includes those responding 1 or 2. The “Promotes” column includes those responding 4 or 5.
The climate for mathematics instruction seems generally more supportive than that for science. For example, 82 percent of schools indicate that the importance the school places on the subject promotes effective mathematics instruction, compared to 60 percent for science. Similarly, professional development policies and practices, as well as time provided for professional development, are more likely to be viewed as promoting effective mathematics instruction.
Table 7.12 Effect† of Various Factors on Mathematics Instruction
Percent of Schools Inhibits Neutral Promotes
Importance that the school places on mathematics 8 (1.2) 11 (1.5) 82 (1.8) Equipment and supplies and/or manipulatives for teaching
mathematics (for example: materials for students to draw, cut and build in order to make sense of problems) 13 (1.7) 19 (1.6) 69 (1.9)
District/Diocese mathematics professional development policies and practices 8 (1.4) 26 (1.9) 65 (2.1)
Public attitudes toward mathematics instruction 13 (1.5) 30 (2.1) 58 (2.3) Time provided for teacher professional development in mathematics 20 (1.8) 23 (1.9) 56 (2.0) Conflict between efforts to improve mathematics instruction and
other school/district/diocese initiatives 23 (1.8) 39 (2.0) 37 (2.4) † Respondents rated the effect of each factor on a 5-point scale ranging from 1 “inhibits effective instruction” to 5 “promotes
effective instruction.” The “Inhibits” column includes those responding 1 or 2. The “Promotes” column includes those responding 4 or 5.
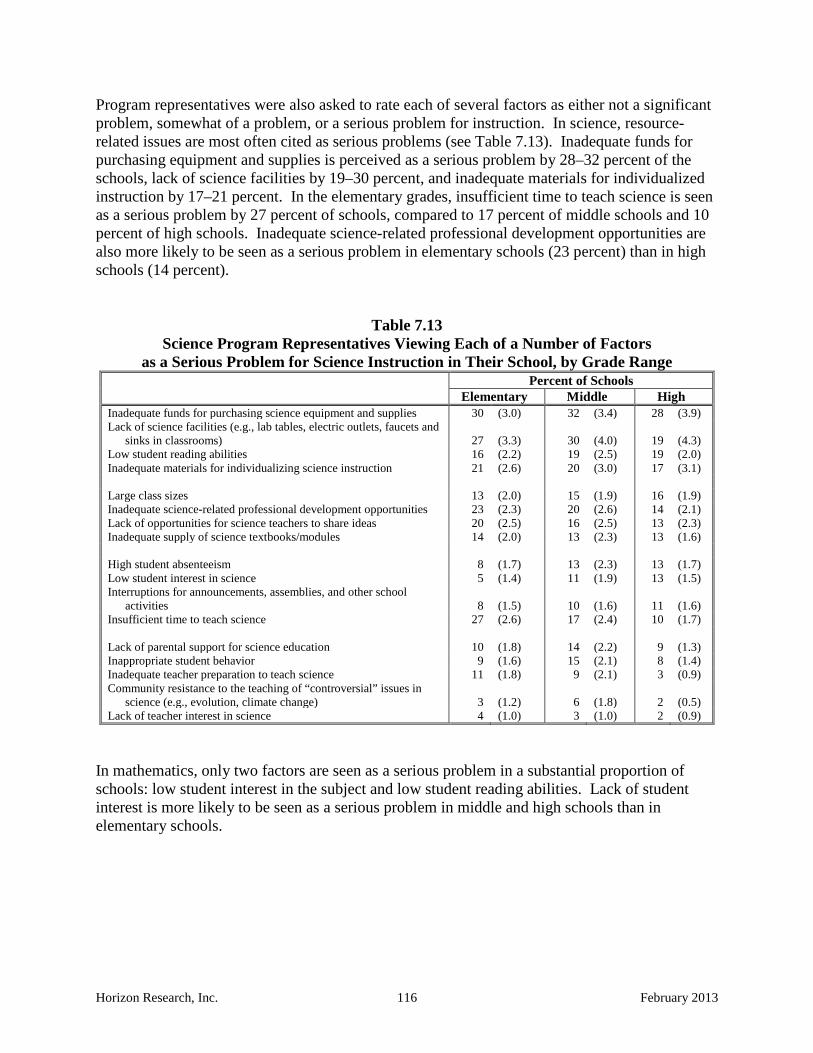
Horizon Research, Inc. 116 February 2013
Program representatives were also asked to rate each of several factors as either not a significant problem, somewhat of a problem, or a serious problem for instruction. In science, resource-related issues are most often cited as serious problems (see Table 7.13). Inadequate funds for purchasing equipment and supplies is perceived as a serious problem by 28–32 percent of the schools, lack of science facilities by 19–30 percent, and inadequate materials for individualized instruction by 17–21 percent. In the elementary grades, insufficient time to teach science is seen as a serious problem by 27 percent of schools, compared to 17 percent of middle schools and 10 percent of high schools. Inadequate science-related professional development opportunities are also more likely to be seen as a serious problem in elementary schools (23 percent) than in high schools (14 percent).
Table 7.13 Science Program Representatives Viewing Each of a Number of Factors
as a Serious Problem for Science Instruction in Their School, by Grade Range Percent of Schools
Elementary Middle High Inadequate funds for purchasing science equipment and supplies 30 (3.0) 32 (3.4) 28 (3.9) Lack of science facilities (e.g., lab tables, electric outlets, faucets and
sinks in classrooms) 27 (3.3) 30 (4.0) 19 (4.3) Low student reading abilities 16 (2.2) 19 (2.5) 19 (2.0) Inadequate materials for individualizing science instruction 21 (2.6) 20 (3.0) 17 (3.1) Large class sizes 13 (2.0) 15 (1.9) 16 (1.9) Inadequate science-related professional development opportunities 23 (2.3) 20 (2.6) 14 (2.1) Lack of opportunities for science teachers to share ideas 20 (2.5) 16 (2.5) 13 (2.3) Inadequate supply of science textbooks/modules 14 (2.0) 13 (2.3) 13 (1.6) High student absenteeism 8 (1.7) 13 (2.3) 13 (1.7) Low student interest in science 5 (1.4) 11 (1.9) 13 (1.5) Interruptions for announcements, assemblies, and other school
activities 8 (1.5) 10 (1.6) 11 (1.6) Insufficient time to teach science 27 (2.6) 17 (2.4) 10 (1.7) Lack of parental support for science education 10 (1.8) 14 (2.2) 9 (1.3) Inappropriate student behavior 9 (1.6) 15 (2.1) 8 (1.4) Inadequate teacher preparation to teach science 11 (1.8) 9 (2.1) 3 (0.9) Community resistance to the teaching of “controversial” issues in
science (e.g., evolution, climate change) 3 (1.2) 6 (1.8) 2 (0.5) Lack of teacher interest in science 4 (1.0) 3 (1.0) 2 (0.9)
In mathematics, only two factors are seen as a serious problem in a substantial proportion of schools: low student interest in the subject and low student reading abilities. Lack of student interest is more likely to be seen as a serious problem in middle and high schools than in elementary schools.

Horizon Research, Inc. 117 February 2013
Table 7.14 Mathematics Program Representatives Viewing Each of a Number of Factors
as a Serious Problem for Mathematics Instruction in Their School, by Grade Range Percent of Schools
Elementary Middle High Low student interest in mathematics 14 (2.0) 25 (2.1) 30 (2.7) Low student reading abilities 22 (1.8) 24 (2.1) 20 (2.3) Inadequate funds for purchasing mathematics equipment and
supplies 12 (2.1) 18 (2.7) 16 (3.3) High student absenteeism 8 (1.6) 13 (2.1) 16 (1.8) Lack of parental support for mathematics education 15 (1.9) 17 (2.0) 15 (1.6) Inadequate mathematics-related professional development
opportunities 18 (2.1) 16 (2.8) 15 (2.9) Inadequate materials for individualizing mathematics instruction 12 (1.8) 16 (2.5) 15 (3.2) Large class sizes 15 (1.6) 15 (1.7) 13 (1.7) Inadequate supply of mathematics textbooks/programs 9 (1.9) 13 (2.5) 11 (2.6) Inappropriate student behavior 10 (1.7) 16 (1.9) 10 (1.3) Insufficient time to teach mathematics 13 (2.1) 12 (2.4) 10 (2.0) Lack of opportunities for mathematics teachers to share ideas 15 (2.1) 14 (2.3) 9 (2.5) Interruptions for announcements, assemblies, and other school
activities 7 (1.3) 8 (1.4) 9 (1.5) Inadequate teacher preparation to teach mathematics 4 (0.9) 3 (0.9) 3 (1.0) Lack of teacher interest in mathematics 2 (0.7) 1 (0.4) 2 (0.7)
Composite variables created from these items allow for a summary of the factors affecting science and mathematics instruction. One striking difference is the generally more supportive context for elementary mathematics instruction compared to the climate for elementary science instruction (see Table 7.15). The difference is evidenced by the lack of time (for instruction, professional development, and teaching sharing) and lack of materials, as well as the magnitude of problems presented by teacher-related issues. Although some of these disparities exist in the middle grades as well, they tend to narrow considerably in high school. Within science, some differences across grade ranges are apparent, most notably with regard to time and teacher-related issues. Within mathematics, the influence of factors across grade ranges is much more similar.
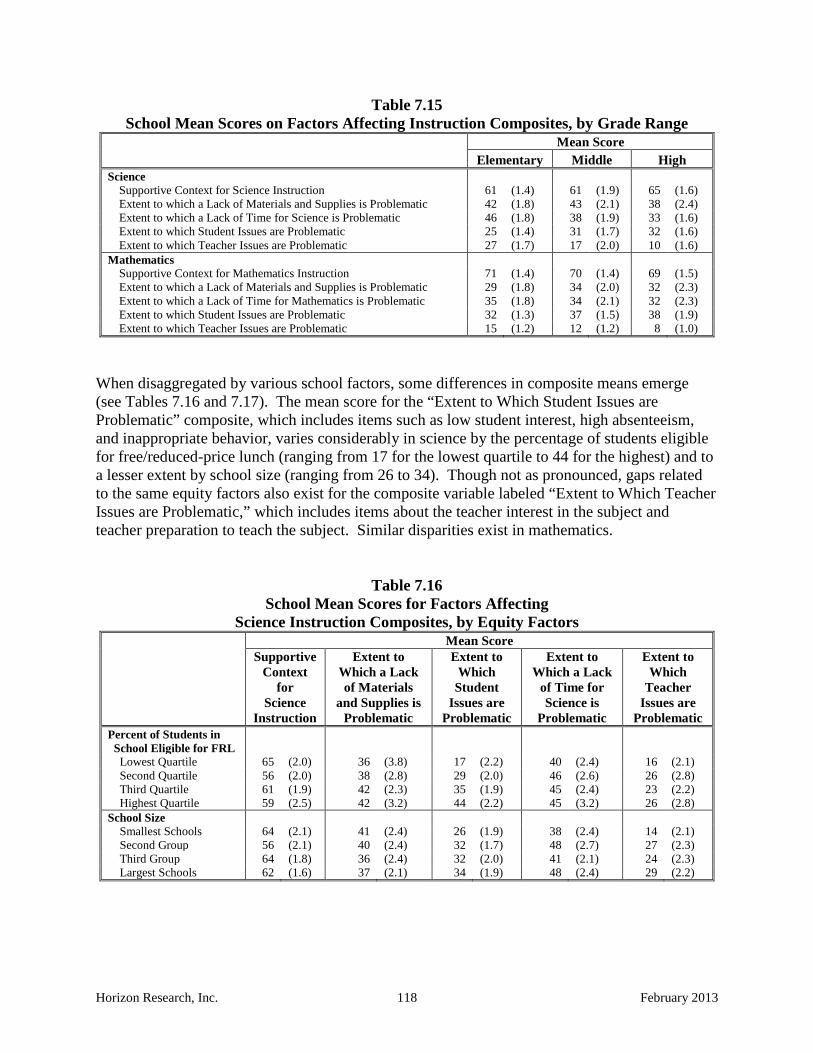
Horizon Research, Inc. 118 February 2013
Table 7.15 School Mean Scores on Factors Affecting Instruction Composites, by Grade Range
Mean Score Elementary Middle High
Science Supportive Context for Science Instruction 61 (1.4) 61 (1.9) 65 (1.6) Extent to which a Lack of Materials and Supplies is Problematic 42 (1.8) 43 (2.1) 38 (2.4) Extent to which a Lack of Time for Science is Problematic 46 (1.8) 38 (1.9) 33 (1.6) Extent to which Student Issues are Problematic 25 (1.4) 31 (1.7) 32 (1.6) Extent to which Teacher Issues are Problematic 27 (1.7) 17 (2.0) 10 (1.6)
Mathematics Supportive Context for Mathematics Instruction 71 (1.4) 70 (1.4) 69 (1.5) Extent to which a Lack of Materials and Supplies is Problematic 29 (1.8) 34 (2.0) 32 (2.3) Extent to which a Lack of Time for Mathematics is Problematic 35 (1.8) 34 (2.1) 32 (2.3) Extent to which Student Issues are Problematic 32 (1.3) 37 (1.5) 38 (1.9) Extent to which Teacher Issues are Problematic 15 (1.2) 12 (1.2) 8 (1.0)
When disaggregated by various school factors, some differences in composite means emerge (see Tables 7.16 and 7.17). The mean score for the “Extent to Which Student Issues are Problematic” composite, which includes items such as low student interest, high absenteeism, and inappropriate behavior, varies considerably in science by the percentage of students eligible for free/reduced-price lunch (ranging from 17 for the lowest quartile to 44 for the highest) and to a lesser extent by school size (ranging from 26 to 34). Though not as pronounced, gaps related to the same equity factors also exist for the composite variable labeled “Extent to Which Teacher Issues are Problematic,” which includes items about the teacher interest in the subject and teacher preparation to teach the subject. Similar disparities exist in mathematics.
Table 7.16 School Mean Scores for Factors Affecting
Science Instruction Composites, by Equity Factors Mean Score
Supportive Context
for Science
Instruction
Extent to Which a Lack of Materials
and Supplies is Problematic
Extent to Which
Student Issues are
Problematic
Extent to Which a Lack
of Time for Science is
Problematic
Extent to Which
Teacher Issues are
Problematic Percent of Students in
School Eligible for FRL Lowest Quartile 65 (2.0) 36 (3.8) 17 (2.2) 40 (2.4) 16 (2.1) Second Quartile 56 (2.0) 38 (2.8) 29 (2.0) 46 (2.6) 26 (2.8) Third Quartile 61 (1.9) 42 (2.3) 35 (1.9) 45 (2.4) 23 (2.2) Highest Quartile 59 (2.5) 42 (3.2) 44 (2.2) 45 (3.2) 26 (2.8)
School Size Smallest Schools 64 (2.1) 41 (2.4) 26 (1.9) 38 (2.4) 14 (2.1) Second Group 56 (2.1) 40 (2.4) 32 (1.7) 48 (2.7) 27 (2.3) Third Group 64 (1.8) 36 (2.4) 32 (2.0) 41 (2.1) 24 (2.3) Largest Schools 62 (1.6) 37 (2.1) 34 (1.9) 48 (2.4) 29 (2.2)

Horizon Research, Inc. 119 February 2013
Table 7.17 School Mean Scores for Factors Affecting
Mathematics Instruction Composites, by Equity Factors Mean Score
Supportive Context
for Mathematics Instruction
Extent to Which a Lack of Materials
and Supplies is Problematic
Extent to Which
Student Issues are
Problematic
Extent to Which a Lack
of Time for Mathematics is
Problematic
Extent to Which
Teacher Issues are
Problematic Percent of Students in
School Eligible for FRL Lowest Quartile 74 (2.4) 26 (2.9) 20 (2.1) 31 (2.0) 9 (1.2) Second Quartile 70 (2.0) 31 (2.8) 39 (2.3) 37 (3.1) 15 (2.3) Third Quartile 70 (1.7) 29 (2.6) 44 (2.2) 35 (2.0) 13 (1.8) Highest Quartile 68 (1.8) 35 (2.8) 50 (1.8) 37 (2.4) 19 (1.8)
School Size Smallest Schools 70 (1.9) 31 (2.6) 33 (2.0) 34 (2.5) 11 (1.6) Second Group 68 (2.0) 30 (2.3) 39 (2.1) 35 (2.4) 13 (1.6) Third Group 71 (1.6) 31 (2.2) 41 (1.7) 36 (2.1) 16 (1.9) Largest Schools 74 (1.7) 27 (2.6) 41 (2.0) 36 (2.8) 18 (2.4)
Teachers were asked about factors that affect instruction in their randomly selected class. Because responses did not vary by grade range in science, combined K–12 results are shown in Table 7.18. In almost three-fourths of science classes, teachers rate principal support as promoting effective science instruction. In addition, in the vast majority of science classes, teachers see their state standards as either promoting (63 percent) or neutral toward (27 percent) science instruction; in only 10 percent of science classes teachers indicate that their state standards inhibit effective instruction. The results for district curriculum frameworks are virtually identical to those for state standards. Factors seen as inhibiting science instruction in 20 percent or more of classes are:
• Time for planning; • Student reading abilities; • Time for professional development; and • Testing/accountability policies (both district and state).

Horizon Research, Inc. 120 February 2013
Table 7.18 Effect† of Various Factors on
Instruction in the Randomly Selected Science Class Percent of Classes Inhibits Neutral Promotes
Principal support 6 (0.7) 21 (1.4) 73 (1.4) Students’ motivation, interest, and effort in science 13 (1.1) 16 (1.1) 71 (1.3) Current state standards 10 (1.0) 27 (1.2) 63 (1.5) District/Diocese curriculum frameworks 10 (1.1) 28 (1.6) 62 (1.7) Time for you to plan, individually and with colleagues 25 (1.7) 17 (1.3) 58 (1.7) District/Diocese/School pacing guides 14 (1.3) 33 (1.7) 53 (1.7) Students’ reading abilities 26 (1.2) 21 (1.3) 53 (1.5) Time available for your professional development 23 (1.7) 25 (1.4) 51 (1.6) Teacher evaluation policies 10 (0.9) 41 (1.8) 49 (1.6) Parent expectations and involvement 19 (1.4) 33 (1.7) 48 (1.7) Textbook/module selection policies 19 (1.4) 34 (1.7) 47 (2.0) Community views on science instruction 13 (1.0) 41 (1.6) 46 (1.7) District/Diocese testing/accountability policies 21 (1.9) 40 (2.0) 39 (1.8) State testing/accountability policies 25 (1.6) 39 (1.8) 36 (1.7)
† Respondents rated the effect of each factor on a 5-point scale ranging from 1 “inhibits effective instruction” to 5 “promotes effective instruction.” The “Inhibits” column includes those responding 1 or 2. The “Promotes” column includes those responding 4 or 5.
The results for mathematics vary considerably by grade level. As such, they are presented separately in Tables 7.19 (factors seen as promoting effective instruction, by grade range) and 7.20 (factors seen as inhibiting effective instruction, by grade range). In general, the context for mathematics instruction is more supportive in elementary classes than in middle and high school classes. For example, in 78 percent of elementary classes, teachers see their students’ motivation, interest, and effort as promoting effective instruction, compared to 60 percent of middle grades classes and 55 percent of high school classes. Smaller, but still sizeable, gaps exist for parent expectations and involvement, community views on mathematics instruction, and both state and district testing/accountability policies. A similar image emerges when considering factors that inhibit mathematics instruction.

Horizon Research, Inc. 121 February 2013
Table 7.19 Factors Seen as Promoting† Effective Instruction
in the Randomly Selected Mathematics Class, by Grade Range Percent of Classes Elementary Middle High
Principal support 82 (1.8) 80 (2.3) 75 (1.9) District/Diocese curriculum frameworks 76 (2.2) 69 (2.8) 63 (2.0) District/Diocese/School pacing guides 69 (2.3) 58 (3.1) 63 (2.2) Time for you to plan, individually and with colleagues 66 (2.3) 67 (3.0) 61 (2.2) Current state standards 76 (2.5) 71 (3.0) 59 (1.8) Time available for your professional development 63 (2.3) 57 (2.7) 56 (1.9) Students’ motivation, interest, and effort in mathematics 78 (2.2) 60 (3.2) 55 (2.3) Teacher evaluation policies 59 (2.5) 56 (2.6) 55 (2.0) Textbook/program selection policies 58 (2.6) 44 (3.1) 53 (2.0) Parent expectations and involvement 59 (2.8) 46 (2.9) 46 (2.1) District/Diocese testing/accountability policies 59 (2.6) 45 (2.9) 46 (2.3) Students’ reading abilities 60 (2.6) 53 (3.4) 44 (2.3) State testing/accountability policies 52 (2.6) 44 (3.0) 40 (1.9) Community views on mathematics instruction 48 (2.6) 38 (3.2) 39 (2.2)
† Includes those responding 4 or 5 on a 5-point scale ranging from 1 “inhibits effective instruction” to 5 “promotes effective instruction.”
Table 7.20 Factors Seen as Inhibiting† Effective Instruction
in the Randomly Selected Mathematics Class, by Grade Range Percent of Classes Elementary Middle High
Principal support 5 (1.1) 6 (1.9) 6 (1.0) District/Diocese curriculum frameworks 7 (1.2) 9 (1.7) 8 (1.1) District/Diocese/School pacing guides 13 (1.6) 17 (2.3) 10 (1.3) Time for you to plan, individually and with colleagues 18 (1.8) 17 (2.2) 21 (1.8) Current state standards 6 (1.1) 8 (1.4) 11 (1.1) Time available for your professional development 15 (1.7) 17 (2.4) 16 (1.5) Students’ motivation, interest, and effort in mathematics 9 (1.2) 22 (2.1) 26 (2.0) Teacher evaluation policies 9 (1.5) 11 (1.2) 12 (1.4) Textbook/program selection policies 14 (1.6) 21 (2.7) 13 (1.4) Parent expectations and involvement 15 (1.9) 25 (2.5) 25 (1.8) District/Diocese testing/accountability policies 14 (1.8) 26 (2.4) 18 (1.8) Students’ reading abilities 18 (2.2) 29 (3.3) 27 (2.1) State testing/accountability policies 19 (1.8) 27 (2.3) 25 (1.9) Community views on mathematics instruction 11 (1.5) 17 (2.1) 22 (1.9)
† Includes those responding 1 or 2 on a 5-point scale ranging from 1 “inhibits effective instruction” to 5 “promotes effective instruction.”
The teacher survey also included a series of items about technology-related issues. Teachers were asked to indicate how great a problem each posed for instruction in their randomly selected class. As shown in Tables 7.21 and 7.22, these resources are generally not seen as problematic. In science, the age of and access to computers is most likely to be seen as a problem in middle

Horizon Research, Inc. 122 February 2013
grades classes, compared to elementary and high school classes. Otherwise, few between-grades differences are apparent. In mathematics, age of and access to computers are more likely to be seen as problematic in elementary classes than in high school classes, but the percentages are generally quite low.
Table 7.21 Extent to Which Technology Quality is a Serious Problem
for Instruction in the Randomly Selected Science Class, by Grade Range Percent of Classes Elementary Middle High
Old age of computers 11 (1.7) 25 (3.1) 14 (1.7) Lack of access to computers 12 (1.5) 21 (2.9) 12 (1.6) Slow speed of the Internet connection 7 (1.3) 15 (2.7) 12 (1.5) Lack of availability of technology support 9 (1.4) 14 (2.0) 12 (1.5) Lack of availability of appropriate computer software 12 (1.8) 15 (2.3) 10 (1.6) Unreliability of the Internet connection 6 (1.2) 9 (2.0) 10 (1.5) Lack of access to the Internet 5 (1.1) 11 (2.4) 7 (1.4)
Table 7.22 Extent to Which Technology Quality is a Serious Problem
for Instruction in the Randomly Selected Mathematics Class, by Grade Range Percent of Classes Elementary Middle High
Old age of computers 18 (2.0) 13 (1.9) 9 (1.4) Lack of access to computers 13 (1.7) 9 (1.5) 8 (1.3) Slow speed of the Internet connection 10 (1.4) 7 (1.0) 6 (1.2) Lack of availability of technology support 11 (1.7) 8 (1.4) 8 (1.1) Lack of availability of appropriate computer software 10 (1.4) 11 (1.6) 11 (1.4) Unreliability of the Internet connection 6 (1.2) 6 (0.9) 5 (1.0) Lack of access to the Internet 6 (1.0) 4 (0.9) 3 (0.8)
Composites from these teacher questionnaire items were created to summarize the extent to which various factors support effective science and mathematics instruction. The means for each subject and grade range are shown in Table 7.23. Two patterns are apparent in the results. First, when differences exist between subjects, they tend to show greater support for mathematics instruction. For example, in elementary grades, the extent to which school support and the policy environment promote effective instruction is greater for mathematics than for science. (Interestingly, in high school, the perception of stakeholder support is reversed, with science being higher.) Second, within mathematics, the data suggest that the climate is generally more supportive in elementary classes than in middle and high school classes. Note, for example, the relatively high mean for the Stakeholder variable in elementary grades (a mean score of 71) compared to middle school (61) and high school (59).

Horizon Research, Inc. 123 February 2013
Table 7.23 Class Mean Scores on Factors Affecting Instruction Composites, by Grade Range
Mean Score Elementary Middle High
Science Extent to which School Support Promotes Effective Instruction 62 (1.6) 66 (2.5) 65 (1.5) Extent to which Stakeholders Promote Effective Instruction 69 (1.0) 63 (1.5) 65 (1.1) Extent to which the Policy Environment Promotes Effective
Instruction 65 (1.3) 64 (1.7) 62 (0.9) Extent to which IT Quality is Problematic for Instruction 21 (1.3) 30 (1.9) 25 (1.3)
Mathematics Extent to which School Support Promotes Effective Instruction 71 (1.4) 69 (1.7) 67 (1.1) Extent to which Stakeholders Promote Effective Instruction 71 (1.3) 61 (1.6) 59 (1.2) Extent to which the Policy Environment Promotes Effective
Instruction 72 (1.2) 65 (1.4) 66 (0.8) Extent to which IT Quality is Problematic for Instruction 24 (1.2) 21 (1.2) 18 (1.0)
The means for some of these factors vary substantially by equity factors. As shown in Tables 7.24 and 7.25, the mean for the Stakeholder composite is substantially higher when classes are composed of mostly high-achieving students, compared to classes with average/mixed or mostly low-achieving students. There is also a large gap for this variable with regard to poverty; classes in schools with a high percentage of students eligible for free/reduced-price lunch have lower scores than classes in schools with the lowest percentage of these students. In both instances, the data suggest that students already at some disadvantage are in classroom and school settings that are less supportive. Results in mathematics mirror those for science.

Horizon Research, Inc. 124 February 2013
Table 7.24 Class Mean Scores on Factors
Affecting Science Instruction Composites, by Equity Factors Mean Score
Extent to Which the Policy
Environment Promotes Effective
Instruction
Extent to Which Stakeholders
Promote Effective
Instruction
Extent to Which School Support
Promotes Effective
Instruction
Extent to Which IT Quality is
Problematic for Science
Instruction Prior Achievement Level of
Class Mostly High Achievers 67 (2.3) 76 (1.6) 70 (2.1) 22 (2.1) Average/Mixed Achievers 64 (0.7) 66 (0.9) 64 (1.2) 23 (1.0) Mostly Low Achievers 59 (2.6) 51 (2.0) 57 (4.0) 31 (3.5)
Percent of Non-Asian Minority Students in Class Lowest Quartile 61 (2.2) 68 (1.7) 63 (2.3) 22 (1.7) Second Quartile 65 (1.3) 70 (1.4) 65 (2.7) 24 (1.7) Third Quartile 64 (1.7) 66 (1.6) 63 (2.0) 22 (1.7) Highest Quartile 65 (1.3) 60 (1.3) 64 (1.9) 28 (2.2)
Percent of Students in School Eligible for FRL Lowest Quartile 66 (1.7) 75 (1.6) 67 (2.1) 25 (1.8) Second Quartile 62 (1.8) 66 (1.5) 61 (2.3) 23 (1.5) Third Quartile 64 (2.3) 61 (1.5) 64 (2.6) 23 (1.7) Highest Quartile 63 (1.4) 58 (1.5) 63 (2.2) 28 (2.4)
School Size Smallest Schools 64 (1.8) 66 (1.8) 59 (2.3) 24 (1.9) Second Group 63 (1.5) 66 (1.5) 65 (1.9) 23 (1.7) Third Group 66 (1.4) 66 (1.5) 65 (2.9) 23 (1.7) Largest Schools 62 (1.3) 66 (1.4) 66 (2.0) 27 (2.1)

Horizon Research, Inc. 125 February 2013
Table 7.25 Class Mean Scores on Factors
Affecting Mathematics Instruction Composites, by Equity Factors Mean Score
Extent to Which the Policy
Environment Promotes Effective
Instruction
Extent to Which Stakeholders
Promote Effective
Instruction
Extent to Which School Support
Promotes Effective
Instruction
Extent to Which IT Quality is
Problematic for Mathematics Instruction
Prior Achievement Level of Class Mostly High Achievers 68 (1.9) 76 (1.7) 72 (1.7) 17 (1.3) Average/Mixed Achievers 70 (0.8) 66 (1.1) 69 (1.0) 22 (0.9) Mostly Low Achievers 65 (1.6) 52 (1.6) 68 (2.4) 25 (1.7)
Percent of Non-Asian Minority Students in Class Lowest Quartile 71 (1.1) 66 (1.6) 66 (1.9) 20 (1.2) Second Quartile 69 (1.2) 70 (1.3) 69 (1.5) 19 (1.4) Third Quartile 68 (1.3) 63 (1.6) 69 (2.1) 22 (1.7) Highest Quartile 66 (1.6) 61 (1.8) 72 (2.0) 25 (1.4)
Percent of Students in School Eligible for FRL Lowest Quartile 70 (1.2) 72 (1.3) 70 (2.1) 19 (1.1) Second Quartile 69 (1.2) 65 (1.3) 70 (1.6) 23 (1.9) Third Quartile 69 (1.4) 63 (1.9) 68 (1.9) 23 (1.8) Highest Quartile 66 (1.8) 57 (2.1) 69 (2.1) 24 (1.4)
School Size Smallest Schools 70 (1.4) 63 (1.5) 65 (2.4) 23 (1.4) Second Group 69 (1.4) 62 (1.6) 68 (1.7) 20 (1.3) Third Group 69 (1.4) 66 (1.5) 71 (1.7) 21 (1.4) Largest Schools 66 (1.5) 68 (1.4) 73 (1.3) 24 (1.6)
Summary The 2012 National Survey data suggest that the use of special instructional arrangements—e.g., subject matter specialists or pull-out instruction for enrichment and/or remediation—is much more prevalent in mathematics than in science, perhaps because of accountability pressures associated with mathematics. The availability of federal funds for mathematics instruction probably also plays a role. In contrast, programs to encourage student interest in mathematics are strikingly uncommon. For example, less than one-third of schools offer mathematics clubs. Such practices are more common in science and tend to increase with grade range. Further, in both subjects, the opportunities are not distributed evenly across types of schools, as they are more likely to occur in large schools than small ones. In mathematics, the substantial influence of state standards is evident in multiple ways, among them school-wide efforts to discuss and align instruction with standards. And although science standards clearly exert their own influence, there is some evidence that standards play a larger role in mathematics instruction than in science, especially in the elementary grades. Across the data in this chapter, there is an overall finding that the climate for mathematics instruction is generally more supportive than that for science. For example, in 82 percent of
Horizon Research, Inc. 126 February 2013
schools, the importance that the school places on mathematics is seen as supporting instruction, compared to only 60 percent of schools for science. Lack of time and materials for science instruction, especially in the elementary grades, is particularly problematic.
Horizon Research, Inc. February 2013
APPENDIX A
Sample Design
Design Overview School Sample Target Population School Sampling Frame School Stratification School Sample Allocation School Sample Selection Replacement Schools Teacher Sample Target Population Teacher Sampling Frame Teacher Stratification Teacher Sample Selection Selection of Classes Weighting and Standard Errors School Weights Teacher Weights Imputation of Number of Classrooms Calculating Standard Errors

Horizon Research, Inc. A-1 February 2013
Sample Design Design Overview The sample design for the 2012 National Survey of Science and Mathematics Education is a national probability sample of schools and teachers in grades K–12 in the 50 states and the District of Columbia. The sample was designed to allow national estimates (totals and ratios of totals) of science and mathematics course offerings and enrollment, teacher background and preparation, textbook usage, instructional techniques, and availability and use of science and mathematics facilities and equipment. Every eligible school and teacher in the target population had a known, positive probability of being drawn into the sample. The sample design involved clustering and stratification. The first stage units consisted of elementary and secondary schools. Science and mathematics teachers constituted the second stage units. From the science and mathematics classes taught by sample teachers, a sample of one class was selected for each teacher. The target sample sizes were 2,000 schools and 10,000 teachers selected within sample schools. These sample sizes are large enough to allow sub-domain estimates such as for particular regions or types of community. The sampling frame for the school sample was constructed from constructed from the Common Core of Data (CCD) and Private School Survey (PSS) databases—programs of the U.S. Department of Education’s National Center for Education Statistics—that include school name and address and information about other characteristics needed for stratification and sample selection. The sampling frame for the teacher sample was constructed from lists provided by sample schools identifying active teachers and the specific science and mathematics subjects they were teaching. School Sample This section describes the sample design features of the school sample. It is organized as follows:
Target Population; School Sampling Frame; School Stratification; School Sample Allocation; School Sample Selection; and Replacement Schools.
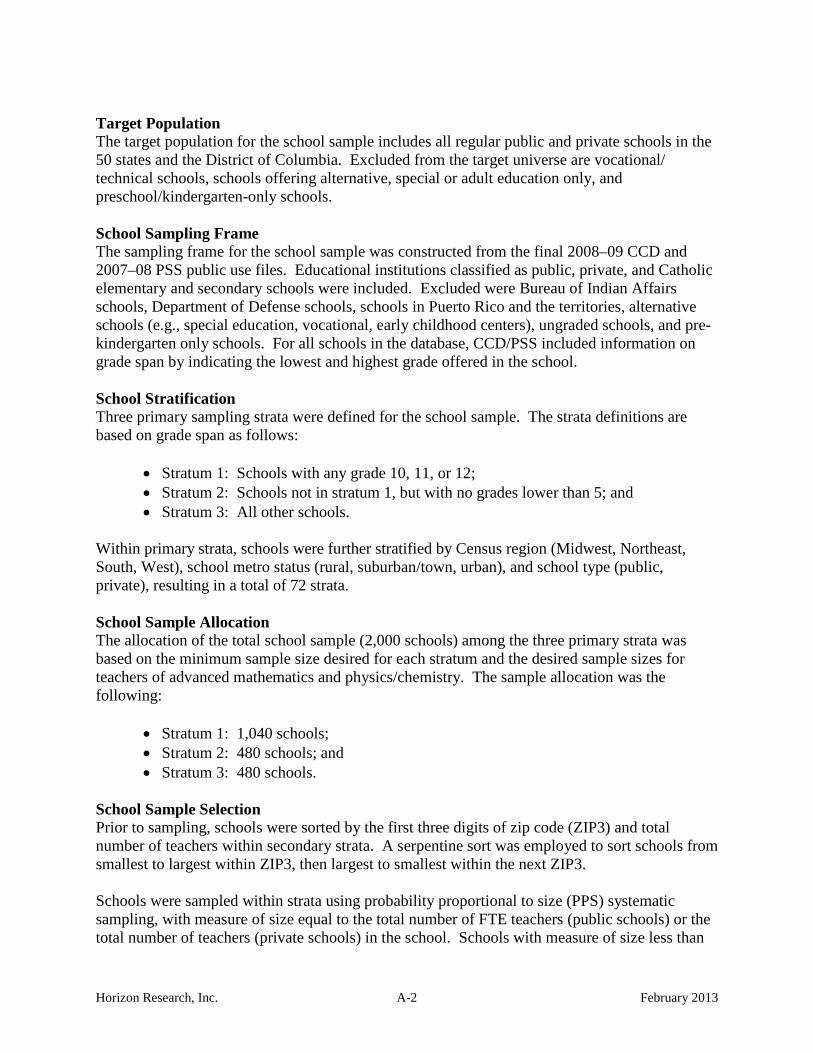
Horizon Research, Inc. A-2 February 2013
Target Population The target population for the school sample includes all regular public and private schools in the 50 states and the District of Columbia. Excluded from the target universe are vocational/ technical schools, schools offering alternative, special or adult education only, and preschool/kindergarten-only schools. School Sampling Frame The sampling frame for the school sample was constructed from the final 2008–09 CCD and 2007–08 PSS public use files. Educational institutions classified as public, private, and Catholic elementary and secondary schools were included. Excluded were Bureau of Indian Affairs schools, Department of Defense schools, schools in Puerto Rico and the territories, alternative schools (e.g., special education, vocational, early childhood centers), ungraded schools, and pre-kindergarten only schools. For all schools in the database, CCD/PSS included information on grade span by indicating the lowest and highest grade offered in the school. School Stratification Three primary sampling strata were defined for the school sample. The strata definitions are based on grade span as follows:
• Stratum 1: Schools with any grade 10, 11, or 12; • Stratum 2: Schools not in stratum 1, but with no grades lower than 5; and • Stratum 3: All other schools.
Within primary strata, schools were further stratified by Census region (Midwest, Northeast, South, West), school metro status (rural, suburban/town, urban), and school type (public, private), resulting in a total of 72 strata. School Sample Allocation The allocation of the total school sample (2,000 schools) among the three primary strata was based on the minimum sample size desired for each stratum and the desired sample sizes for teachers of advanced mathematics and physics/chemistry. The sample allocation was the following:
• Stratum 1: 1,040 schools; • Stratum 2: 480 schools; and • Stratum 3: 480 schools.
School Sample Selection Prior to sampling, schools were sorted by the first three digits of zip code (ZIP3) and total number of teachers within secondary strata. A serpentine sort was employed to sort schools from smallest to largest within ZIP3, then largest to smallest within the next ZIP3. Schools were sampled within strata using probability proportional to size (PPS) systematic sampling, with measure of size equal to the total number of FTE teachers (public schools) or the total number of teachers (private schools) in the school. Schools with measure of size less than

Horizon Research, Inc. A-3 February 2013
the 20th percentile for their stratum were assigned the 20th percentile as a measure of size to avoid large weights. In 1.1 percent of the schools, the total number of teachers was imputed using the average pupil-teacher ratio for the cells formed by the cross-classification of stratum (1-72), school locale (see Table A-1 for definition), school type (public, Catholic, non-Catholic religious, other private) and the school’s reported enrollment:
Total teachers = Total enrollment / average(pupil-teacher ratio).
Table A-1 Definition of School Locale Code, Based on School Address.
Locale Code Definition
11 City, Large Territory inside an urbanized area and inside a principal city with pop >= 250,000 12 City, Mid-size Territory inside an urbanized area and inside a principal city with pop < 250,000 and >= 100,000 13 City, Small Territory inside an urbanized area and inside a principal city with a population < 100,000 21 Suburban, Large Territory outside a principal city and inside an urbanized area with pop >= 250,000
22 Suburban, Mid-Size Territory outside a principal city and inside an urbanized area with a pop < 250,000 and >= 100,000
23 Suburb, Small Territory outside a principal city and inside an urbanized area with a pop < 100,000 31 Town, Fringe Territory inside an urban cluster <= 10 miles from an urbanized area 32 Town, Distant Territory inside an urban cluster > 10 miles and <= 35 miles from an urbanized area 33 Town, Remote Territory inside an urban cluster > 35 miles from an urbanized area
41 Rural, Fringe Census-defined rural territory <= 5 miles from an urban area; also rural territory <= 2.5 miles from an urban cluster
42 Rural, Distant Census-defined rural territory > 5 miles and <= 25 miles from an urbanized area; also rural territory > 2.5 miles and < 10 miles from an urban cluster
43 Rural, Remote Census-defined rural territory > 25 miles from an urbanized area and > 10 miles from an urban cluster
Replacement Schools Five replacement schools were designated for each sampled school in case of nonresponse for the originally sampled school. The fifth replacement school was intended for a pilot study and was not used in the main study. The five replacement schools were usually the two or three schools listed just before and after the sampled school on the frame, after sorting as described above. The replacement schools were ranked by similarity with the sampled school with respect to number of teachers and assigned an “order of use” number so that the closest matching school within the same stratum/ZIP3 would be used first. Table A-2 shows the distribution of the sample by primary and secondary stratum.

Horizon Research, Inc. A-4 February 2013
Table A-2 Distribution of Sample, by Stratum
Secondary Stratum Primary Stratum All
Grades Region Status Public/ Private
1 Grades 10–12
2 Grades 5–9
3 Other
1 Midwest Urban Public 47 20 25 92 2 Private 11 0 4 15 3 Suburban Public 92 56 41 189 4 Private 11 0 6 17 5 Rural Public 65 22 25 112 6 Private 4 0 2 6 7 Northeast Urban Public 40 20 23 83 8 Private 13 0 4 17 9 Suburban Public 102 59 45 206 10 Private 18 0 6 24 11 Rural Public 37 15 13 65 12 Private 4 0 1 5 13 South Urban Public 83 54 50 187 14 Private 27 0 5 32 15 Suburban Public 135 89 76 300 16 Private 26 0 5 31 17 Rural Public 125 58 53 236 18 Private 14 9 1 15 19 West Urban Public 62 31 33 126 20 Private 13 0 4 17 21 Suburban Public 72 40 44 152 22 Private 9 0 3 12 23 Rural Public 72 12 14 32 24 Private 3 0 0 3 TOTAL 1,045 476 479 2,000
Teacher Sample The following section describes the sample design features of the teacher sample. It is organized as follows:
Target Population; Teacher Sampling Frame; Teacher Stratification; Teacher Sample Selection; and Selection of Classes.
Target Population The target population for the teacher sample consists of teachers in eligible schools (see School Sample, Target Population) who teach science and/or mathematics. Science includes biology, chemistry, physics, earth science, and other science.

Horizon Research, Inc. A-5 February 2013
Teacher Sampling Frame The sampling frame for the teacher sample was constructed by requesting that coordinators in all sample schools provide a list of eligible teachers and identify the courses taught by each teacher. For schools in stratum 1, coordinators listed teachers in one of the following categories:
• High school physics or chemistry; • Other science; • High school calculus or advanced mathematics; and • Other mathematics.
For strata 2 and 3, the categories listed were:
• Science and • Mathematics
Teacher Stratification Based on the course information provided for teachers on the school list, each teacher was assigned to one of the following five teacher strata:
• Physics/chemistry with or without other science, no mathematics; • Advanced mathematics with or without other mathematics, no science; • Other science only; • Other mathematics only; and • Any combination of mathematics and science.
Teacher Sample Selection The goal was to sample about 10,000 teachers. Within each sampled school, seven teachers were sampled with probability proportional to a measure of size that was designed to oversample advanced math and physics/chemistry teachers at a rate of three. In schools with fewer than seven science/mathematics teachers, all teachers were selected. Prior to sampling, teachers were sorted by teacher stratum. The resulting sample sizes were:
• Primary Stratum 1: 5,561 teachers; • Primary Stratum 2: 2,435 teachers; and • Primary Stratum 3: 2,230 teachers.
The sampling fraction for teachers in teacher stratum l (l = 1 – 5) was computed as follows:
ll
l
nfN
=
where:
lf = Overall stratum sampling fraction in teacher stratum l

Horizon Research, Inc. A-6 February 2013
ln = Number of teachers sampled in stratum l lN = Number of listed teachers in stratum l
For each of the three school primary strata, Table A-3 shows the number of teachers selected in the cooperating schools and the overall sampling fraction in each teacher stratum.
Table A-3 Teachers Selected in Each School Stratum
Sample
Size (nl)
Sampling Fraction
(fl) School Stratum 1: Grades 10–12 1. Physics/chemistry with or without other science, no mathematics 2. Advanced mathematics with or without other mathematics, no science 3. Other science only 4. Other mathematics only 5. Any combination of science and mathematics
5,561 1,593 1,489
949 1,164
366
0.5147 0.5129 0.2216 0.2256 0.4164
School Stratum 2: Grades 5–9 1. Physics/chemistry with or without other science, no mathematics 2. Advanced mathematics with or without other mathematics, no science 3. Other science only 4. Other mathematics only 5. Any combination of science and mathematics
2,435 0 0
1,013 1,210
212
0 0 0.4922 0.4852 0.4371
School Stratum 3: Other 1. Physics/chemistry with or without other science, no mathematics 2. Advanced mathematics with or without other mathematics, no science 3. Other science only 4. Other mathematics only 5. Any combination of science and mathematics
2,230 0 0
113 259
1,858
0 0 0.3951 0.4060 0.3301
Selection of Classes As part of the sampling process, teachers in sub-stratum five in each stratum were randomly assigned to receive either a science or a mathematics questionnaire. This step represented an additional stage of sampling since only half of the sample teachers in this stratum were assigned to report on science and the other half on mathematics. This one-in-two sub-sampling must be reflected in producing science- or mathematics-specific estimates. Some of the items on the questionnaire apply to individual classes. Teachers with multiple science or mathematics classes each day were asked to report on only one of these classes. Teachers were asked to list all of their science and mathematics classes in order by class period. The web questionnaire used a pre-generated sampling table to make a selection from among the classes listed. The sampling table was randomly generated so that a random selection of classes would be achieved overall.
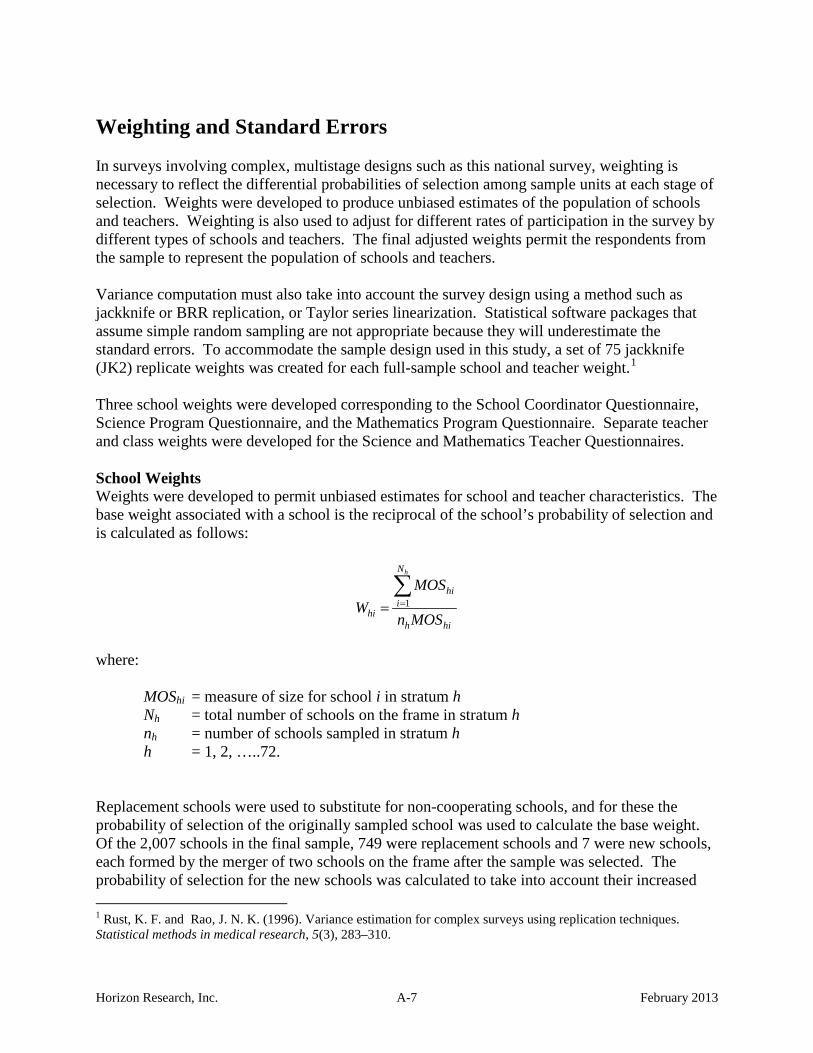
Horizon Research, Inc. A-7 February 2013
Weighting and Standard Errors In surveys involving complex, multistage designs such as this national survey, weighting is necessary to reflect the differential probabilities of selection among sample units at each stage of selection. Weights were developed to produce unbiased estimates of the population of schools and teachers. Weighting is also used to adjust for different rates of participation in the survey by different types of schools and teachers. The final adjusted weights permit the respondents from the sample to represent the population of schools and teachers. Variance computation must also take into account the survey design using a method such as jackknife or BRR replication, or Taylor series linearization. Statistical software packages that assume simple random sampling are not appropriate because they will underestimate the standard errors. To accommodate the sample design used in this study, a set of 75 jackknife (JK2) replicate weights was created for each full-sample school and teacher weight.1 Three school weights were developed corresponding to the School Coordinator Questionnaire, Science Program Questionnaire, and the Mathematics Program Questionnaire. Separate teacher and class weights were developed for the Science and Mathematics Teacher Questionnaires. School Weights Weights were developed to permit unbiased estimates for school and teacher characteristics. The base weight associated with a school is the reciprocal of the school’s probability of selection and is calculated as follows:
1
hN
hii
hih hi
MOSW
n MOS==∑
where:
MOShi = measure of size for school i in stratum h Nh = total number of schools on the frame in stratum h nh = number of schools sampled in stratum h h = 1, 2, …..72.
Replacement schools were used to substitute for non-cooperating schools, and for these the probability of selection of the originally sampled school was used to calculate the base weight. Of the 2,007 schools in the final sample, 749 were replacement schools and 7 were new schools, each formed by the merger of two schools on the frame after the sample was selected. The probability of selection for the new schools was calculated to take into account their increased 1 Rust, K. F. and Rao, J. N. K. (1996). Variance estimation for complex surveys using replication techniques. Statistical methods in medical research, 5(3), 283–310.

Horizon Research, Inc. A-8 February 2013
chance of selection. If the schools were from the same stratum, the probabilities of selection for the two schools that merged were summed. If they were from different strata, the probability of selection was calculated as 1 – (1-p(school 1))*(1-p(school 2)). To adjust for different rates of participation in the survey by different types of schools, school nonresponse adjustments were developed and applied to the base weight.2 In some schools, the school coordinator questionnaire may not have been completed. In addition, the person designated to answer questions about the school science or mathematics program may have failed to participate. Accordingly, three distinct school non-response adjustments were developed:
• NRA1: To produce school estimates from the school coordinator questionnaire • NRA2: To produce mathematics program level estimates • NRA3: To produce science program level estimates
For non-response adjustment cell c, the general form of the NRA is given by:
i elig in c
i resp in c
i
ci
wNRA
w∈
∈
=∑∑
where iw is the base weight of the ith school in cell c. The numerator of the three adjustment factors is the same—all eligible schools. The denominator (respondents) for NR1 includes all schools that completed the school coordinator questionnaire; respondents for NR2 and NR3 include only schools that completed a program questionnaire in science and mathematics, respectively. As the replacement schools already compensate for non-response, the weights for these schools are included in the denominators of the adjustments. Because nonresponse adjustment through weighting assumes that response patterns of non- respondents are similar to that of respondents, c corresponds to cells formed from school characteristics that were determined to be correlated with nonresponse. These characteristics were identified through a logistic regression model that predicted response propensity as a function of school characteristics. The characteristics identified by the model as correlated with response were school type (public, catholic, other private), primary stratum (grades 10–12, grades 5–9, other), high minority enrollment (> 25%), and metro status (urban, suburban, rural). 2 For a discussion of nonresponse adjustments, see:
Kalton, G. and Kasprzyk, D. (1986). The treatment of missing survey data. Survey Methodology, 12(1), 1–16. Brick, J.M. and Kalton, G. (1996). Handling missing data in survey research. Statistical Methods in Medical Research, 5(215), (http://smm.sagepub.com/cgi/content/abstract/5/3/215)
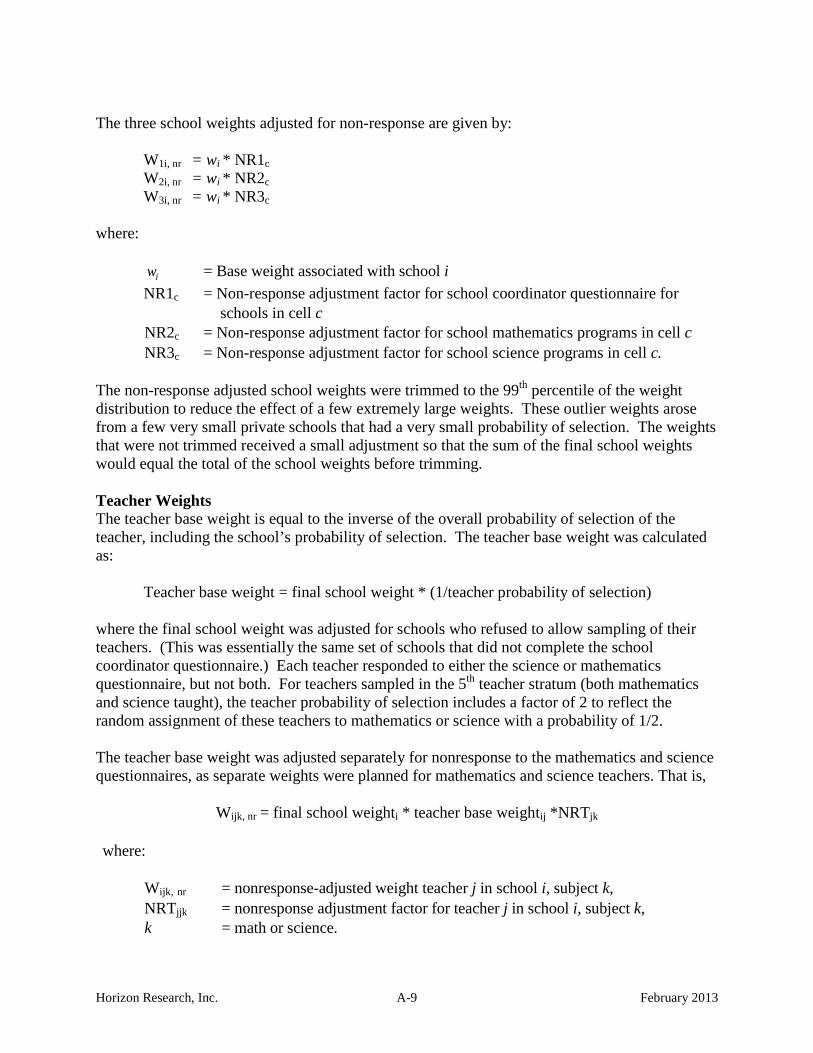
Horizon Research, Inc. A-9 February 2013
The three school weights adjusted for non-response are given by:
W1i, nr = wi * NR1c W2i, nr = wi * NR2c W3i, nr = wi * NR3c
where:
iw = Base weight associated with school i NR1c = Non-response adjustment factor for school coordinator questionnaire for
schools in cell c NR2c = Non-response adjustment factor for school mathematics programs in cell c NR3c = Non-response adjustment factor for school science programs in cell c.
The non-response adjusted school weights were trimmed to the 99th percentile of the weight distribution to reduce the effect of a few extremely large weights. These outlier weights arose from a few very small private schools that had a very small probability of selection. The weights that were not trimmed received a small adjustment so that the sum of the final school weights would equal the total of the school weights before trimming. Teacher Weights The teacher base weight is equal to the inverse of the overall probability of selection of the teacher, including the school’s probability of selection. The teacher base weight was calculated as:
Teacher base weight = final school weight * (1/teacher probability of selection) where the final school weight was adjusted for schools who refused to allow sampling of their teachers. (This was essentially the same set of schools that did not complete the school coordinator questionnaire.) Each teacher responded to either the science or mathematics questionnaire, but not both. For teachers sampled in the 5th teacher stratum (both mathematics and science taught), the teacher probability of selection includes a factor of 2 to reflect the random assignment of these teachers to mathematics or science with a probability of 1/2. The teacher base weight was adjusted separately for nonresponse to the mathematics and science questionnaires, as separate weights were planned for mathematics and science teachers. That is,
Wijk, nr = final school weighti * teacher base weightij *NRTjk
where:
Wijk, nr = nonresponse-adjusted weight teacher j in school i, subject k, NRTjjk = nonresponse adjustment factor for teacher j in school i, subject k, k = math or science.

Horizon Research, Inc. A-10 February 2013
NRTijk was calculated within adjustment cell c for each subject k as:
j elig in c
ijj resp in c
ij
c
wNRT
w∈
∈
=∑∑
where wij is the base weight for teacher j in school i. The nonresponse adjustment factor was calculated within adjustment cells formed using variables that were determined to be correlated with teacher nonresponse. These variables were identified using logistic regression models to predict response propensity to the mathematics and science teacher questionnaires as a function of school characteristics and teacher stratum. The variables identified by the model for both subjects were school level (grades 10–12, grades 5–9, other), school type (public, catholic, other private), high minority enrollment (>25%) and region (Northeast, Midwest, South, West). The unweighted response rate for both the mathematics and science questionnaires was 77 percent. Because a small number of secondary teachers incorrectly identified themselves on the questionnaire as self-contained teachers, a second set of teacher weights was calculated for nonresponse to the class schedule item. The nonresponse adjustment factor was calculated within cells formed by variables correlated with nonresponse to this item, given the teacher was a respondent to the mathematics or science questionnaire. These variables were identified from a logistic regression model as school level (grades 10–12, grades 5–9, other), school type (public, catholic, other private), school size (small, medium, large) and teacher stratum. The unweighted response rate for this item was 94 percent, given the teacher was a respondent to the mathematics or science questionnaire. The nonresponse-adjusted teacher weights were trimmed to a threshold of 4*average teacher weight to prevent extremely large weights, and the remaining teacher weights received a small adjustment factor to preserve the sum of the nonresponse-adjusted teacher weights prior to trimming. Five percent of the teacher weights were trimmed. Imputation of Number of Classrooms The number of classrooms taught was imputed when missing for teachers who responded to the mathematics or science questionnaires, including teachers who were deemed to have reported teaching only one self-contained classroom in error. The number of classrooms was imputed from another randomly selected teacher within the same teacher stratum and school, when possible, using the hot deck method.3 If such a teacher could not be found, a teacher from the same teacher stratum within another school in the same school stratum, size, and minority class was selected. The number of classrooms was imputed for five percent of teacher respondents. Nearly two-thirds of the imputed values came from a teacher within the same school.
3 Andridge, R. R. and Little, R. J. A. (2010). A Review of Hot Deck Imputation for Survey Non-response. International Statistical Review, 78(1), 40–64.

Horizon Research, Inc. A-11 February 2013
Calculating Standard Errors Estimates obtained from a sample of teachers will differ from the true population parameters because they are based on a randomly chosen subset of the population, rather than on a complete census of all mathematics and science teachers. This type of error is known as sampling error. The differences between the estimates and the true population values can also be caused by nonsampling error. Nonsampling errors can result from many causes, such as measurement error, nonresponse, sampling frame errors, and respondent error. The precision of an estimate is measured by the standard error (defined as the square root of the variance due to sampling). The calculation of the standard error must reflect the manner in which the sample was drawn. Otherwise, the standard errors can be misleading and result in incorrect confidence intervals and p-values in hypothesis testing. The study’s sampling involved stratification, clustering, and unequal probabilities of selection, all of which must be reflected in the standard error calculations. Replication methods such as the jackknife are commonly used to estimate variances for complex surveys involving multi-stage sampling. Replication methods work by dividing the sample into subsample replicates that mirror the design of the sample. A weight is calculated for each replicate using the same procedures as for the full-sample weight. This produces a set of replicate weights for each sampled school and teacher. To calculate the standard error of a survey estimate, the estimate is first calculated for each replicate using the replicate weight and the same form of estimator as for the full sample. The variation among the replicates is then used to estimate the variance for the full sample estimate, as given below in the formula for jackknife replicates formed with two variance units or pseudo-psus (primary sampling units) per stratum (JK2)4:
∑=
−=G
gg
1
2)( )ˆˆ()ˆvar( θθθ
where G is the total number of replicates and is the estimate of based on the observations included in the gth replicate. For the current study, a set of 75 jackknife replicate weights was created for each school and teacher weight for calculating standard errors for school and teacher estimates. These may be used with packages that accommodate replication methods, such as WesVar, SUDAAN, Stata, or the survey procs in SAS v9.
4 Rust, K. F. and Rao, J. N. K. (1996). Variance estimation for complex surveys using replication techniques. Statistical methods in medical research, 5(3), 283–310.
( )ˆ
gθ θ̂

Horizon Research, Inc. February 2013
APPENDIX B
Survey Questionnaires
Science Program Questionnaire
Mathematics Program Questionnaire
Science Teacher Questionnaire
Mathematics Teacher Questionnaire
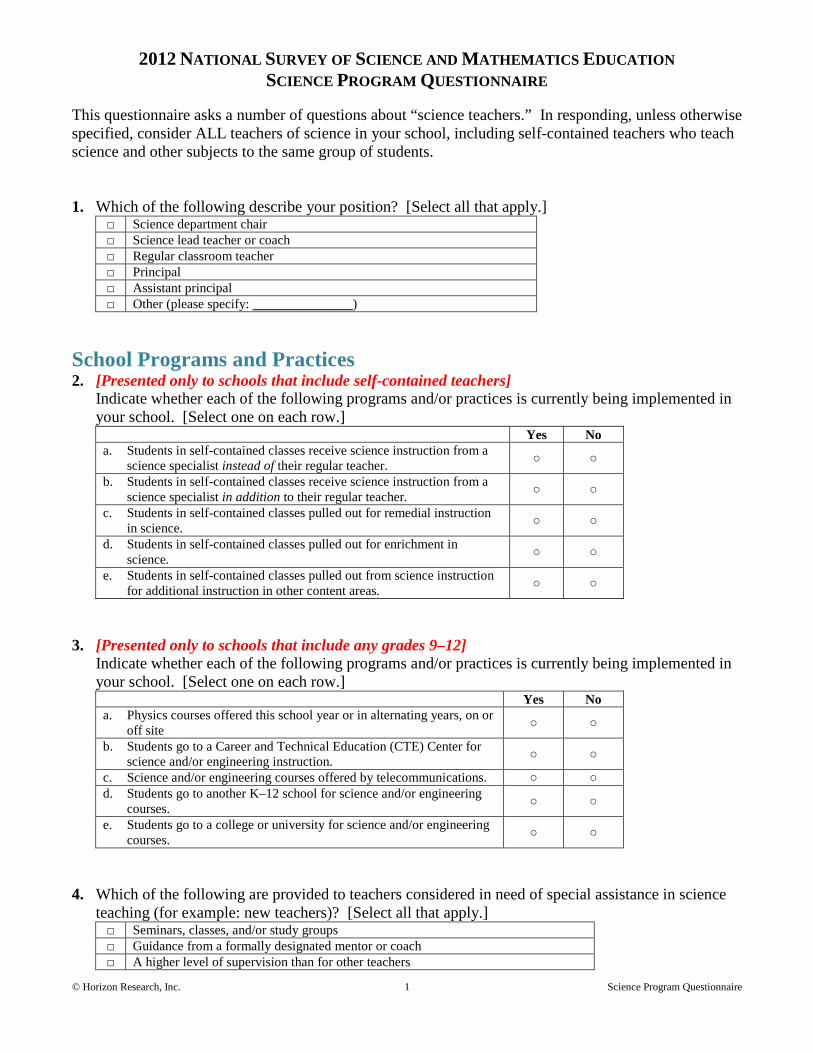
© Horizon Research, Inc. 1 Science Program Questionnaire
2012 NATIONAL SURVEY OF SCIENCE AND MATHEMATICS EDUCATION SCIENCE PROGRAM QUESTIONNAIRE
This questionnaire asks a number of questions about “science teachers.” In responding, unless otherwise specified, consider ALL teachers of science in your school, including self-contained teachers who teach science and other subjects to the same group of students. 1. Which of the following describe your position? [Select all that apply.]
□ Science department chair □ Science lead teacher or coach □ Regular classroom teacher □ Principal □ Assistant principal □ Other (please specify: _______________)
School Programs and Practices 2. [Presented only to schools that include self-contained teachers]
Indicate whether each of the following programs and/or practices is currently being implemented in your school. [Select one on each row.]
Yes No a. Students in self-contained classes receive science instruction from a
science specialist instead of their regular teacher. ○ ○
b. Students in self-contained classes receive science instruction from a science specialist in addition to their regular teacher. ○ ○
c. Students in self-contained classes pulled out for remedial instruction in science. ○ ○
d. Students in self-contained classes pulled out for enrichment in science. ○ ○
e. Students in self-contained classes pulled out from science instruction for additional instruction in other content areas. ○ ○
3. [Presented only to schools that include any grades 9–12]
Indicate whether each of the following programs and/or practices is currently being implemented in your school. [Select one on each row.]
Yes No a. Physics courses offered this school year or in alternating years, on or
off site ○ ○
b. Students go to a Career and Technical Education (CTE) Center for science and/or engineering instruction. ○ ○
c. Science and/or engineering courses offered by telecommunications. ○ ○ d. Students go to another K–12 school for science and/or engineering
courses. ○ ○
e. Students go to a college or university for science and/or engineering courses. ○ ○
4. Which of the following are provided to teachers considered in need of special assistance in science
teaching (for example: new teachers)? [Select all that apply.] □ Seminars, classes, and/or study groups □ Guidance from a formally designated mentor or coach □ A higher level of supervision than for other teachers

© Horizon Research, Inc. 2 Science Program Questionnaire
5. Indicate whether your school does each of the following to enhance students’ interest and/or
achievement in science and/or engineering. [Select one on each row.] Yes No
a. Holds family science and/or engineering nights ○ ○ b. Offers after-school help in science and/or engineering (for example:
tutoring) ○ ○
c. Offers formal after-school programs for enrichment in science and/or engineering ○ ○
d. Offers one or more science clubs ○ ○ e. Offers one or more engineering clubs ○ ○ f. Participates in a local or regional science and/or engineering fair ○ ○ g. Has one or more teams participating in science competitions (for
example: Science Olympiad) ○ ○
h. Has one or more teams participating in engineering competitions (for example: Robotics) ○ ○
i. Encourages students to participate in science and/or engineering summer programs or camps offered by community colleges, universities, museums, or science centers
○ ○
j. Sponsors visits to business, industry, and/or research sites related to science and/or engineering ○ ○
k. Sponsors meetings with adult mentors who work in science and/or engineering fields ○ ○
Your State Standards 6. Please provide your opinion about each of the following statements in regard to your current state
standards for science. [Select one on each row.] Strongly
Disagree Disagree No
Opinion Agree Strongly
Agree a. State science standards have been
thoroughly discussed by science teachers in this school
b. There is a school-wide effort to align science instruction with the state science standards
c. Most science teachers in this school teach to the state standards
d. Your district/diocese organizes science professional development based on state standards [Not presented to non-Catholic private schools]
Science Courses Offered in Your School 7. [Presented only to schools that include grade 6]
What types of science courses are offered to 6th grade classes in your school? ○ Single-discipline science courses (for example: life science) ○ Coordinated or Integrated science courses ○ Both single-discipline and coordinated or integrated science courses

© Horizon Research, Inc. 3 Science Program Questionnaire
8. [Presented only to schools that include grade 7] What types of science courses are offered to 7th grade classes in your school? ○ Single-discipline science courses (for example: life science) ○ Coordinated or Integrated science courses ○ Both single-discipline and coordinated or integrated science courses
9. [Presented only to schools that include grade 8]
What types of science courses are offered to 8th grade classes in your school? ○ Single-discipline science courses (for example: life science) ○ Coordinated or Integrated science courses ○ Both single-discipline and coordinated or integrated science courses
10. [Presented only to schools that include any grades 9–12]
Approximately how many grades 9–12 students in this school will not take a science course this year? [Enter your response as a whole number (for example: 1500); do not use a comma.] ____________________
Science Courses Offered in Your School [Questions 11–27 presented only to schools that include any grades 9–12; schools that do not include any of these grades skip to Q31]
This next set of questions asks about the number of sections and level of science courses offered in grades 9–12 in your school this year in each of the following categories:
• Coordinated or Integrated Science (including General Science and Physical Science) • Earth/Space Science • Life Sciences/Biology • Environmental Science/Ecology (as a separate course) • Chemistry • Physics • Engineering
11. Does your school offer one or more courses in Coordinated or Integrated science (including General Science and Physical Science) this school year in any of the grades 9–12? ○ Yes ○ No [Skip to Q13]
12. How many sections of Coordinated or Integrated science courses (including General Science and
Physical Science) are offered in your school this year at each of the following levels? [Enter each response as a whole number (for example: 15).]
a. Non-college prep ______ b. College prep, including honors ______

© Horizon Research, Inc. 4 Science Program Questionnaire
13. Does your school offer one or more courses in Earth/Space Science this school year in any of the grades 9–12? ○ Yes ○ No [Skip to Q15]
14. How many sections of Earth/Space Science courses are offered in your school this year at each of
the following levels? [Enter each response as a whole number (for example: 15).] a. Non-college prep ______ b. 1st year college prep, including honors ______ c. 2nd year advanced, including Advanced Placement, International Baccalaureate, and concurrent college and high
school credit/dual enrollment courses _____ 15. Does your school offer one or more courses in Life Science/Biology this school year in any of the
grades 9–12? ○ Yes ○ No [Skip to Q17]
16. How many sections of Life Science/Biology courses are offered in your school this year at each of
the following levels? [Enter each response as a whole number (for example: 15).] a. Non-college prep ______ b. 1st year college prep, including honors _____ c. 2nd year advanced, including Advanced Placement, International Baccalaureate, and concurrent college and high
school credit/dual enrollment courses _____ 17. Does your school offer one or more courses in Environmental Science/Ecology this school year in
any of the grades 9–12? ○ Yes ○ No [Skip to Q19]
18. How many sections of Environmental Science/Ecology courses are offered in your school this year
at each of the following levels? [Enter each response as a whole number (for example: 15).] a. Non-college prep ______ b. 1st year college prep, including honors ______ c. 2nd year advanced, including Advanced Placement, International Baccalaureate, and concurrent college and high
school credit/dual enrollment courses _____ 19. Does your school offer one or more courses in Chemistry this school year in any of the grades 9–12?
○ Yes ○ No [Skip to Q21]
20. How many sections of Chemistry courses are offered in your school this year at each of the
following levels? [Enter each response as a whole number (for example: 15).] a. Non-college prep ______ b. 1st year college prep, including honors ______ c. 2nd year advanced, including Advanced Placement, International Baccalaureate, and concurrent college and high
school credit/dual enrollment courses _____
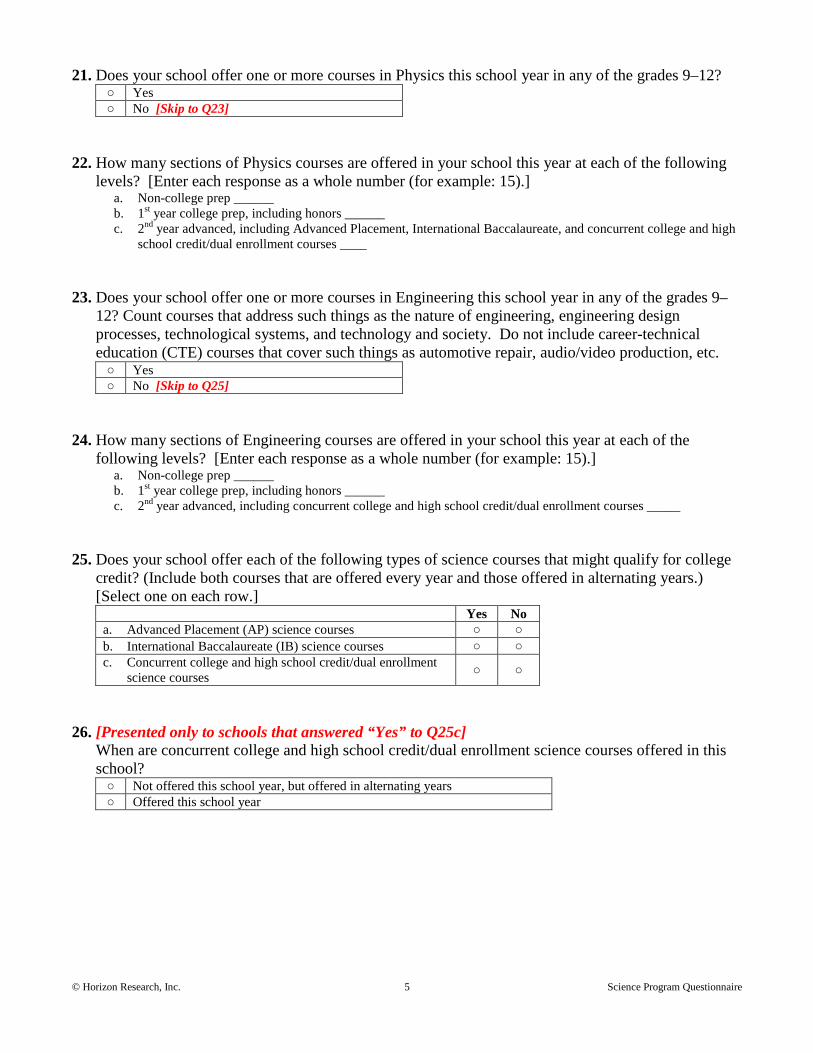
© Horizon Research, Inc. 5 Science Program Questionnaire
21. Does your school offer one or more courses in Physics this school year in any of the grades 9–12?
○ Yes ○ No [Skip to Q23]
22. How many sections of Physics courses are offered in your school this year at each of the following
levels? [Enter each response as a whole number (for example: 15).] a. Non-college prep ______ b. 1st year college prep, including honors ______ c. 2nd year advanced, including Advanced Placement, International Baccalaureate, and concurrent college and high
school credit/dual enrollment courses ____ 23. Does your school offer one or more courses in Engineering this school year in any of the grades 9–
12? Count courses that address such things as the nature of engineering, engineering design processes, technological systems, and technology and society. Do not include career-technical education (CTE) courses that cover such things as automotive repair, audio/video production, etc. ○ Yes ○ No [Skip to Q25]
24. How many sections of Engineering courses are offered in your school this year at each of the
following levels? [Enter each response as a whole number (for example: 15).] a. Non-college prep ______ b. 1st year college prep, including honors ______ c. 2nd year advanced, including concurrent college and high school credit/dual enrollment courses _____
25. Does your school offer each of the following types of science courses that might qualify for college
credit? (Include both courses that are offered every year and those offered in alternating years.) [Select one on each row.]
Yes No a. Advanced Placement (AP) science courses ○ ○ b. International Baccalaureate (IB) science courses ○ ○ c. Concurrent college and high school credit/dual enrollment
science courses ○ ○
26. [Presented only to schools that answered “Yes” to Q25c]
When are concurrent college and high school credit/dual enrollment science courses offered in this school? ○ Not offered this school year, but offered in alternating years ○ Offered this school year
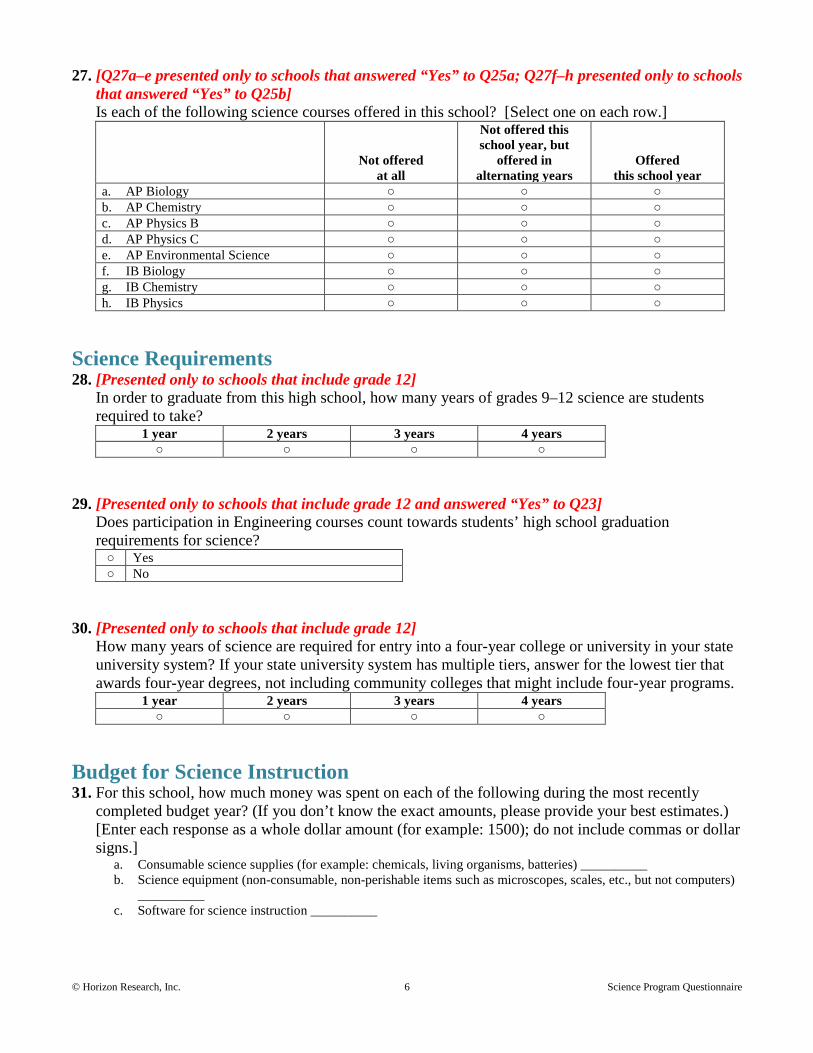
© Horizon Research, Inc. 6 Science Program Questionnaire
27. [Q27a–e presented only to schools that answered “Yes” to Q25a; Q27f–h presented only to schools
that answered “Yes” to Q25b] Is each of the following science courses offered in this school? [Select one on each row.]
Not offered at all
Not offered this school year, but
offered in alternating years
Offered this school year
a. AP Biology ○ ○ ○ b. AP Chemistry ○ ○ ○ c. AP Physics B ○ ○ ○ d. AP Physics C ○ ○ ○ e. AP Environmental Science ○ ○ ○ f. IB Biology ○ ○ ○ g. IB Chemistry ○ ○ ○ h. IB Physics ○ ○ ○
Science Requirements 28. [Presented only to schools that include grade 12]
In order to graduate from this high school, how many years of grades 9–12 science are students required to take?
1 year 2 years 3 years 4 years ○ ○ ○ ○
29. [Presented only to schools that include grade 12 and answered “Yes” to Q23]
Does participation in Engineering courses count towards students’ high school graduation requirements for science? ○ Yes ○ No
30. [Presented only to schools that include grade 12]
How many years of science are required for entry into a four-year college or university in your state university system? If your state university system has multiple tiers, answer for the lowest tier that awards four-year degrees, not including community colleges that might include four-year programs.
1 year 2 years 3 years 4 years ○ ○ ○ ○
Budget for Science Instruction 31. For this school, how much money was spent on each of the following during the most recently
completed budget year? (If you don’t know the exact amounts, please provide your best estimates.) [Enter each response as a whole dollar amount (for example: 1500); do not include commas or dollar signs.]
a. Consumable science supplies (for example: chemicals, living organisms, batteries) __________ b. Science equipment (non-consumable, non-perishable items such as microscopes, scales, etc., but not computers)
__________ c. Software for science instruction __________

© Horizon Research, Inc. 7 Science Program Questionnaire
Influences on Science Instruction 32. Please rate the effect of each of the following on the quality of science instruction in your school.
[Select one on each row.]
Inhibits effective instruction
Neutral or mixed
Promotes effective
instruction
N/A or Don’t Know
a. District/Diocese science professional development policies and practices [Not presented to non-Catholic private schools]
○
b. Time provided for teacher professional development in science
○
c. Importance that the school places on science ○
d. Public attitudes toward science instruction ○
e. Conflict between efforts to improve science instruction and other school and/or district/diocese initiatives
○
f. How science instructional resources are managed (for example: distributing and refurbishing materials)
○
33. In your opinion, how great a problem is each of the following for science instruction in your school
as a whole? [Select one on each row.] Not a
significant problem
Somewhat of a
problem Serious problem
a. Lack of science facilities (for example: lab tables, electric outlets, faucets and sinks in classrooms) ○ ○ ○
b. Inadequate funds for purchasing science equipment and supplies ○ ○ ○
c. Inadequate supply of science textbooks/modules ○ ○ ○ d. Inadequate materials for individualizing science
instruction ○ ○ ○
e. Low student interest in science ○ ○ ○ f. Low student reading abilities ○ ○ ○ g. Lack of teacher interest in science ○ ○ ○ h. Inadequate teacher preparation to teach science ○ ○ ○ i. Insufficient time to teach science ○ ○ ○ j. Lack of opportunities for science teachers to share
ideas ○ ○ ○
k. Inadequate science-related professional development opportunities ○ ○ ○
l. Interruptions for announcements, assemblies, and other school activities ○ ○ ○
m. Large class sizes ○ ○ ○ n. High student absenteeism ○ ○ ○ o. Inappropriate student behavior ○ ○ ○ p. Lack of parental support for science education ○ ○ ○ q. Community resistance to the teaching of
“controversial” issues in science (for example: evolution, climate change)
○ ○ ○
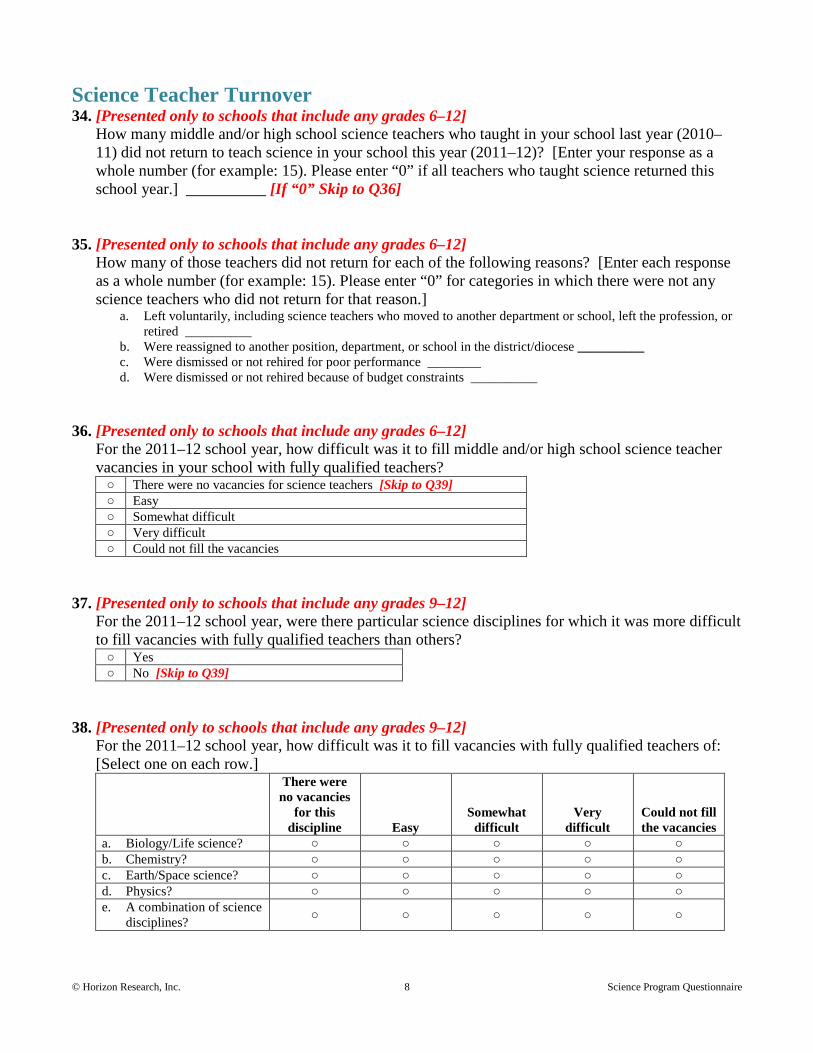
© Horizon Research, Inc. 8 Science Program Questionnaire
Science Teacher Turnover 34. [Presented only to schools that include any grades 6–12]
How many middle and/or high school science teachers who taught in your school last year (2010–11) did not return to teach science in your school this year (2011–12)? [Enter your response as a whole number (for example: 15). Please enter “0” if all teachers who taught science returned this school year.] __________ [If “0” Skip to Q36]
35. [Presented only to schools that include any grades 6–12]
How many of those teachers did not return for each of the following reasons? [Enter each response as a whole number (for example: 15). Please enter “0” for categories in which there were not any science teachers who did not return for that reason.]
a. Left voluntarily, including science teachers who moved to another department or school, left the profession, or retired __________
b. Were reassigned to another position, department, or school in the district/diocese __________ c. Were dismissed or not rehired for poor performance ________ d. Were dismissed or not rehired because of budget constraints __________
36. [Presented only to schools that include any grades 6–12]
For the 2011–12 school year, how difficult was it to fill middle and/or high school science teacher vacancies in your school with fully qualified teachers? ○ There were no vacancies for science teachers [Skip to Q39] ○ Easy ○ Somewhat difficult ○ Very difficult ○ Could not fill the vacancies
37. [Presented only to schools that include any grades 9–12]
For the 2011–12 school year, were there particular science disciplines for which it was more difficult to fill vacancies with fully qualified teachers than others? ○ Yes ○ No [Skip to Q39]
38. [Presented only to schools that include any grades 9–12]
For the 2011–12 school year, how difficult was it to fill vacancies with fully qualified teachers of: [Select one on each row.]
There were no vacancies
for this discipline Easy
Somewhat difficult
Very difficult
Could not fill the vacancies
a. Biology/Life science? ○ ○ ○ ○ ○ b. Chemistry? ○ ○ ○ ○ ○ c. Earth/Space science? ○ ○ ○ ○ ○ d. Physics? ○ ○ ○ ○ ○ e. A combination of science
disciplines? ○ ○ ○ ○ ○

© Horizon Research, Inc. 9 Science Program Questionnaire
Science Professional Development Opportunities 39. This question is about in-service (professional development) programs offered by your school and/or
district/diocese, possibly in conjunction with other organizations (for example: other school districts/dioceses, colleges or universities, museums, professional associations, commercial vendors). In the last three years, has your school and/or district/diocese offered in-service workshops specifically focused on science or science teaching? ○ Yes ○ No [Skip to Q41]
40. Please indicate the extent to which in-service workshops offered by your school and/or district/
diocese in the last three years addressed deepening teacher understanding of each of the following: [Select one on each row.]
Not at all Somewhat
To a great
extent a. Science content b. State science standards c. How to use particular science instructional
materials (for example: textbooks or modules)
d. How students think about various science ideas e. How to monitor student understanding during
science instruction
f. How to adapt science instruction to address student misconceptions
g. How to use technology in science instruction h. How to use investigation-oriented science
teaching strategies
i. How to teach science to students who are English language learners
j. How to provide alternative science learning experiences for students with special needs
41. In the last three years, has your school offered teacher study groups where teachers meet on a
regular basis to discuss teaching and learning of science, and possibly other content areas as well (sometimes referred to as Professional Learning Communities, PLCs, or lesson study)? ○ Yes ○ No [Skip to Q53]
42. [Presented only to schools that include any grades K–5]
Are teachers of grades K-5 science classes required to participate in these science-focused teacher study groups? ○ Yes ○ No

© Horizon Research, Inc. 10 Science Program Questionnaire
43. [Presented only to schools that include any grades 6–8] Are teachers of grades 6-8 science classes required to participate in these science-focused teacher study groups? ○ Yes ○ No
44. [Presented only to schools that include any grades 9–12]
Are teachers of grades 9-12 science classes required to participate in these science-focused teacher study groups? ○ Yes ○ No
45. Has your school specified a schedule for when these science-focused teacher study groups are
expected to meet? ○ Yes ○ No [Skip to Q48]
46. Over what period of time were these science-focused teacher study groups typically expected to
meet? ○ The entire school year ○ One semester ○ Less than one semester
47. How often have these science-focused teacher study groups typically been expected to meet?
○ Less than once a month ○ Once a month ○ Twice a month ○ More than twice a month
48. Which of the following describe the typical science-focused teacher study groups in this school?
[Select all that apply.] □ Organized by grade level □ Include teachers from multiple grade levels □ Limited to teachers from this school □ Include teachers from other schools in the district/diocese [Not presented to non-Catholic
private schools] □ Include teachers from other schools outside of your district/diocese □ Include school and/or district/diocese administrators □ Include parents/guardians or other community members □ Include higher education faculty or other “consultants”
49. Which of the following describe the typical science-focused teacher study groups in this school?
[Select all that apply.] □ Teachers engage in science investigations. □ Teachers plan science lessons together. □ Teachers analyze student science assessment results. □ Teachers analyze classroom artifacts (for example: student work samples). □ Teachers analyze science instructional materials (for example: textbooks or modules).

© Horizon Research, Inc. 11 Science Program Questionnaire
50. To what extent have these science-focused teacher study groups addressed deepening teacher
understanding of each of the following? [Select one on each row.]
Not at all Somewhat
To a great
extent a. Science content b. State science standards c. How to use particular science instructional
materials (for example: textbooks or modules)
d. How students think about various science ideas e. How to monitor student understanding during
science instruction
f. How to adapt science instruction to address student misconceptions
g. How to use technology in science instruction h. How to use investigation-oriented science
teaching strategies
i. How to teach science to students who are English language learners
j. How to provide alternative science learning experiences for students with special needs
51. Have there been designated leaders for these science-focused teacher study groups?
○ Yes ○ No [Skip to Q53]
52. The designated leaders of these science-focused teacher study groups were from: [Select all that
apply.] □ This school □ Elsewhere in this district/diocese [Not presented to non-Catholic private
schools] □ College or University □ External consultants □ Other (please specify: ___________________)
53. Thinking about last school year, which of the following were used to provide teachers in this school
with time for in-service (professional development) workshops/teacher study groups that included a focus on science content and/or science instruction, regardless of whether they were offered by your school and/or district/diocese? [Select all that apply.] □ Early dismissal and/or late start for students □ Professional days/teacher work days during the students' school year □ Professional days/teacher work days before and/or after the students' school year □ Common planning time for teachers □ Substitute teachers to cover teachers' classes while they attend professional development □ None of the above
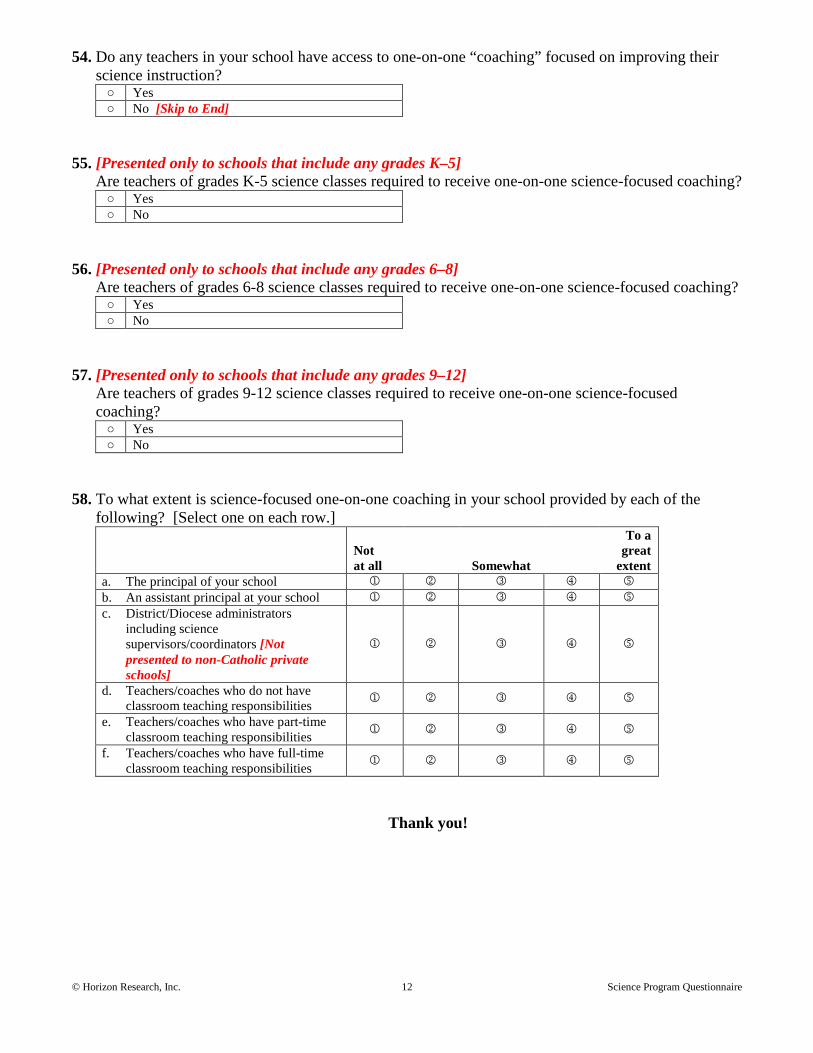
© Horizon Research, Inc. 12 Science Program Questionnaire
54. Do any teachers in your school have access to one-on-one “coaching” focused on improving their science instruction? ○ Yes ○ No [Skip to End]
55. [Presented only to schools that include any grades K–5]
Are teachers of grades K-5 science classes required to receive one-on-one science-focused coaching? ○ Yes ○ No
56. [Presented only to schools that include any grades 6–8]
Are teachers of grades 6-8 science classes required to receive one-on-one science-focused coaching? ○ Yes ○ No
57. [Presented only to schools that include any grades 9–12]
Are teachers of grades 9-12 science classes required to receive one-on-one science-focused coaching? ○ Yes ○ No
58. To what extent is science-focused one-on-one coaching in your school provided by each of the
following? [Select one on each row.]
Not at all Somewhat
To a great
extent a. The principal of your school b. An assistant principal at your school c. District/Diocese administrators
including science supervisors/coordinators [Not presented to non-Catholic private schools]
d. Teachers/coaches who do not have classroom teaching responsibilities
e. Teachers/coaches who have part-time classroom teaching responsibilities
f. Teachers/coaches who have full-time classroom teaching responsibilities
Thank you!

© Horizon Research, Inc. 1 Mathematics Program Questionnaire
2012 NATIONAL SURVEY OF SCIENCE AND MATHEMATICS EDUCATION MATHEMATICS PROGRAM QUESTIONNAIRE
This questionnaire asks a number of questions about “mathematics teachers.” In responding, unless otherwise specified, consider ALL teachers of mathematics in your school, including self-contained teachers who teach mathematics and other subjects to the same group of students. 1. Which of the following describe your position? [Select all that apply.]
□ Mathematics department chair □ Mathematics lead teacher or coach □ Regular classroom teacher □ Principal □ Assistant principal □ Other (please specify: _______________)
School Programs and Practices 2. [Presented only to schools that include self-contained teachers]
Indicate whether each of the following programs and/or practices is currently being implemented in your school. [Select one on each row.]
Yes No a. Students in self-contained classes receive mathematics instruction
from a mathematics specialist instead of their regular teacher. ○ ○
b. Students in self-contained classes receive mathematics instruction from a mathematics specialist in addition to their regular teacher. ○ ○
c. Students in self-contained classes pulled out for remedial instruction in mathematics. ○ ○
d. Students in self-contained classes pulled out for enrichment in mathematics. ○ ○
e. Students in self-contained classes pulled out from mathematics instruction for additional instruction in other content areas. ○ ○
3. [Presented only to schools that include any grades 9–12]
Indicate whether each of the following programs and/or practices is currently being implemented in your school. [Select one on each row.]
Yes No a. Algebra 1 course offered over two years or as two separate block
courses (for example: Algebra A and Algebra B) ○ ○
b. Calculus courses (beyond pre-Calculus) offered this school year or in alternating years, on or off site ○ ○
c. Students go to a Career and Technical Education (CTE) Center for mathematics instruction ○ ○
d. Mathematics courses offered by telecommunications ○ ○ e. Students go to another K–12 school for mathematics courses ○ ○ f. Students go to a college or university for mathematics courses ○ ○

© Horizon Research, Inc. 2 Mathematics Program Questionnaire
4. Which of the following are provided to teachers considered in need of special assistance in mathematics teaching (for example: new teachers)? [Select all that apply.] □ Seminars, classes, and/or study groups □ Guidance from a formally designated mentor or coach □ A higher level of supervision than for other teachers
5. Indicate whether your school does each of the following to enhance students’ interest and/or
achievement in mathematics. [Select one on each row.] Yes No
a. Holds family math nights ○ ○ b. Offers after-school help in mathematics (for example: tutoring) ○ ○ c. Offers formal after-school programs for enrichment in mathematics ○ ○ d. Offers one or more mathematics clubs ○ ○ e. Participates in a local or regional mathematics fair ○ ○ f. Has one or more teams participating in mathematics competitions
(for example: Math Counts) ○ ○
g. Encourages students to participate in mathematics summer programs or camps offered by community colleges, universities, museums or mathematics centers
○ ○
h. Sponsors visits to business, industry, and/or research sites related to mathematics ○ ○
i. Sponsors meetings with adult mentors who work in mathematics fields ○ ○
Your State Standards 6. Please provide your opinion about each of the following statements in regard to your current state
standards for mathematics. [Select one on each row.] Strongly
Disagree Disagree No
Opinion Agree Strongly
Agree a. State mathematics standards have been
thoroughly discussed by mathematics teachers in this school
b. There is a school-wide effort to align mathematics instruction with the state mathematics standards
c. Most mathematics teachers in this school teach to the state standards
d. Your district/diocese organizes mathematics professional development based on state standards [Not presented to non-Catholic private schools]
Student Enrollment in Mathematics Courses 7. [Presented only to schools that include grade 8]
Approximately how many of this year’s 8th grade students will have completed Algebra 1 prior to 9th grade? [Enter your response as a whole number (for example: 15).] _____________________

© Horizon Research, Inc. 3 Mathematics Program Questionnaire
8. [Presented only to schools that include grade 8] Approximately how many of this year’s 8th grade students will have completed Geometry prior to 9th grade? [Enter your response as a whole number (for example: 15).] _____________________
9. [Presented only to schools that include any grades 9–12]
Approximately how many grades 9-12 students in this school will not take a mathematics course this year? [Enter your response as a whole number (for example: 1500); do not use a comma.] ___________
Mathematics Courses Offered in Your School [Questions 10–16 presented only to schools that include any grades 9–12; schools that do not include any of these grades skip to Q19] 10. What types of mathematics courses are offered in your school this year? [Select all that apply.]
□ Single-subject mathematics courses (for example: Algebra, Geometry) □ Integrated mathematics courses
11. How many sections of courses in each of the following categories will be offered to grades 9-12
students in this school this year? [Enter each response as a whole number (for example: 15).] Number of
sections a. Non-college prep mathematics courses
Example courses: Developmental Math; High School Arithmetic; Remedial Math; General Math; Vocational Math; Consumer Math; Basic Math; Business Math; Career Math; Practical Math; Essential Math; Pre-Algebra; Introductory Algebra; Algebra 1 Part 1; Algebra 1A; Math A; Basic Geometry; Informal Geometry; Practical Geometry
b. Formal/College-prep Mathematics Level 1 courses Example courses: Algebra 1; Integrated Math 1; Unified Math I; Algebra 1 Part 2; Algebra 1B; Math B
c. Formal/College-prep Mathematics Level 2 courses Example courses: Geometry; Plane Geometry; Solid Geometry; Integrated Math 2; Unified Math II; Math C
d. Formal/College-prep Mathematics Level 3 courses Example courses: Algebra 2; Intermediate Algebra; Algebra and Trigonometry; Advanced Algebra; Integrated Math 3; Unified Math III
e. Formal/College-prep Mathematics Level 4 courses Example courses: Algebra 3; Trigonometry; Pre-Calculus; Analytic/Advanced Geometry; Elementary Functions; Integrated Math 4, Unified Math IV; Calculus (not including college level/AP); any other College Prep Senior Math with Algebra 2 as a prerequisite
f. Mathematics courses that might qualify for college credit Example courses: Advanced Placement Calculus (AB, BC); Advanced Placement Statistics; IB Mathematics standard level; IB Mathematics higher level; concurrent college and high school credit/dual enrollment
12. Does this school offer one or more courses focused specifically on probability and/or statistics?
(Include both courses that are offered every year and those offered in alternating years.) ○ Yes ○ No [Skip to Q14]
13. What probability and/or statistics courses does this school offer? [Select all that apply.]
□ Probability and Statistics combined □ Probability □ Statistics

© Horizon Research, Inc. 4 Mathematics Program Questionnaire
14. Does your school offer each of the following types of mathematics courses that might qualify for
college credit? (Include both courses that are offered every year and those offered in alternating years.) [Select one on each row.]
Yes No a. Advanced Placement (AP) mathematics courses ○ ○ b. International Baccalaureate (IB) mathematics courses ○ ○ c. Concurrent college and high school credit/dual enrollment
mathematics courses ○ ○
15. [Presented only to schools that answered “Yes” to Q14c]
When are concurrent college and high school credit/dual enrollment mathematics courses offered in this school? ○ Not offered this school year, but offered in alternating years ○ Offered this school year
16. [Q16a–c presented only to schools that answered “Yes” to Q14a; Q16d–g presented only to schools that answered “Yes” to Q14b] Is each of the following mathematics courses offered in this school? [Select one on each row.]
Not offered at all
Not offered this school year, but
offered in alternating years
Offered this school year
a. AP Calculus AB ○ ○ ○ b. AP Calculus BC ○ ○ ○ c. AP Statistics ○ ○ ○ d. IB Mathematical studies standard level ○ ○ ○ e. IB Mathematics standard level ○ ○ ○ f. IB Mathematics higher level ○ ○ ○ g. IB Further mathematics standard level ○ ○ ○
Mathematics Requirements 17. [Presented only to schools that include grade 12]
In order to graduate from this high school, how many years of grades 9–12 mathematics are students required to take?
1 year 2 years 3 years 4 years ○ ○ ○ ○
18. [Presented only to schools that include grade 12]
How many years of mathematics are required for entry into a four-year college or university in your state university system? If your state university system has multiple tiers, answer for the lowest tier that awards four-year degrees, not including community colleges that might include four-year programs.
1 year 2 years 3 years 4 years ○ ○ ○ ○

© Horizon Research, Inc. 5 Mathematics Program Questionnaire
Budget for Mathematics Instruction 19. For this school, how much money was spent on each of the following during the most recently
completed budget year? (If you don’t know the exact amount, please provide your best estimates.) [Enter each response as a whole dollar amount (for example: 1500); do not include commas or dollar signs.]
a. Consumable supplies for mathematics instruction (for example: graph paper) _____ b. Non-consumable items for mathematics instruction such as calculators, protractors, manipulatives, etc. (Do not
include computers) _____ c. Software specific to mathematics instruction (for example: dynamic geometry software) _____
Influences on Mathematics Instruction 20. Please rate the effect of each of the following on the quality of mathematics instruction in your
school. [Select one on each row.]
Inhibits effective instruction
Neutral or mixed
Promotes effective
instruction
N/A or Don’t Know
a. District/Diocese mathematics professional development policies and practices [Not presented to non-Catholic private schools]
○
b. Time provided for teacher professional development in mathematics
○
c. Importance that the school places on mathematics ○
d. Public attitudes toward mathematics instruction ○
e. Conflict between efforts to improve mathematics instruction and other school and/or district/diocese initiatives
○
f. Equipment and supplies and/or manipulatives for teaching mathematics (for example: materials for students to draw, cut and build in order to make sense of problems)
○
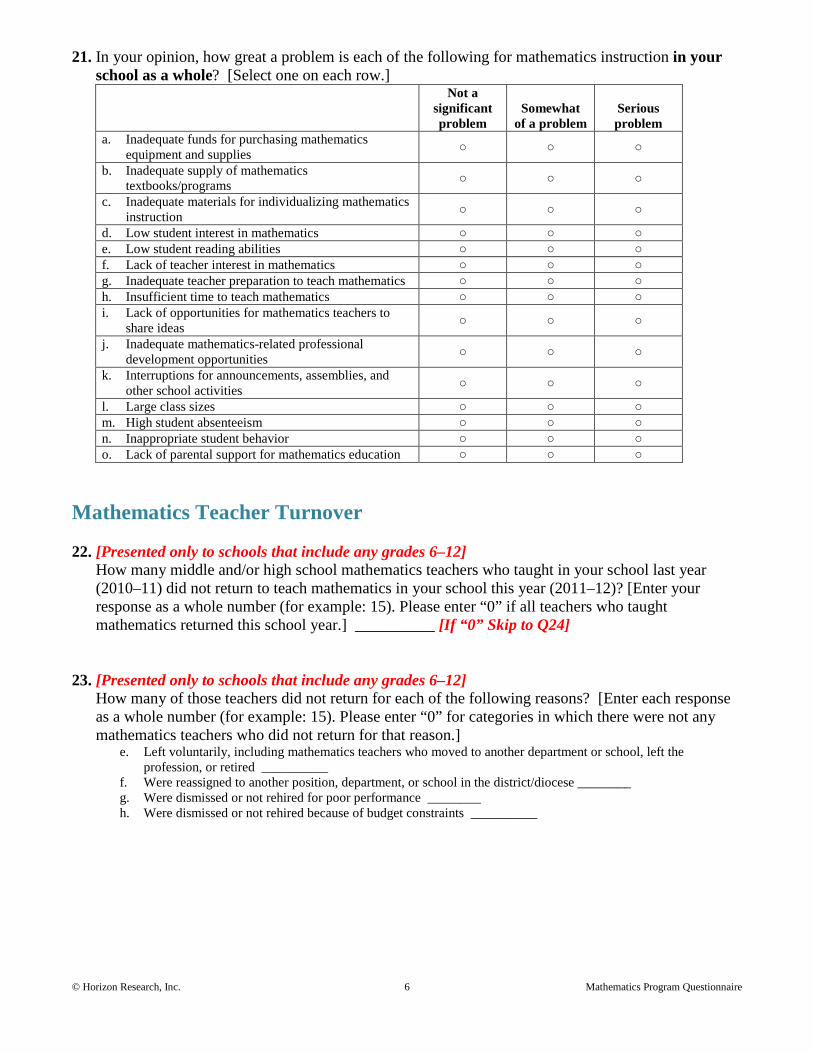
© Horizon Research, Inc. 6 Mathematics Program Questionnaire
21. In your opinion, how great a problem is each of the following for mathematics instruction in your school as a whole? [Select one on each row.]
Not a significant problem
Somewhat of a problem
Serious problem
a. Inadequate funds for purchasing mathematics equipment and supplies ○ ○ ○
b. Inadequate supply of mathematics textbooks/programs ○ ○ ○
c. Inadequate materials for individualizing mathematics instruction ○ ○ ○
d. Low student interest in mathematics ○ ○ ○ e. Low student reading abilities ○ ○ ○ f. Lack of teacher interest in mathematics ○ ○ ○ g. Inadequate teacher preparation to teach mathematics ○ ○ ○ h. Insufficient time to teach mathematics ○ ○ ○ i. Lack of opportunities for mathematics teachers to
share ideas ○ ○ ○
j. Inadequate mathematics-related professional development opportunities ○ ○ ○
k. Interruptions for announcements, assemblies, and other school activities ○ ○ ○
l. Large class sizes ○ ○ ○ m. High student absenteeism ○ ○ ○ n. Inappropriate student behavior ○ ○ ○ o. Lack of parental support for mathematics education ○ ○ ○
Mathematics Teacher Turnover 22. [Presented only to schools that include any grades 6–12]
How many middle and/or high school mathematics teachers who taught in your school last year (2010–11) did not return to teach mathematics in your school this year (2011–12)? [Enter your response as a whole number (for example: 15). Please enter “0” if all teachers who taught mathematics returned this school year.] __________ [If “0” Skip to Q24]
23. [Presented only to schools that include any grades 6–12]
How many of those teachers did not return for each of the following reasons? [Enter each response as a whole number (for example: 15). Please enter “0” for categories in which there were not any mathematics teachers who did not return for that reason.]
e. Left voluntarily, including mathematics teachers who moved to another department or school, left the profession, or retired __________
f. Were reassigned to another position, department, or school in the district/diocese ________ g. Were dismissed or not rehired for poor performance ________ h. Were dismissed or not rehired because of budget constraints __________

© Horizon Research, Inc. 7 Mathematics Program Questionnaire
24. [Presented only to schools that include any grades 6–12] For the 2011–12 school year, how difficult was it to fill middle and/or high school mathematics teacher vacancies in your school with fully qualified teachers? ○ There were no vacancies for mathematics teachers ○ Easy ○ Somewhat difficult ○ Very difficult ○ Could not fill the vacancies
Mathematics Professional Development Opportunities 25. This question is about in-service (professional development) programs offered by your school and/or
district/diocese, possibly in conjunction with other organizations (for example: other school districts/dioceses, colleges or universities, museums, professional associations, commercial vendors).
In the last three years, has your school and/or district/diocese offered in-service workshops specifically focused on mathematics or mathematics teaching? ○ Yes ○ No [Skip to Q27]
26. Please indicate the extent to which in-service workshops offered by your school and/or
district/diocese in the last three years addressed deepening teacher understanding of each of the following: [Select one on each row.]
Not at all Somewhat
To a great
extent a. Mathematics content b. State mathematics standards c. How to use particular mathematics instructional
materials (for example: textbooks or programs)
d. How students think about various mathematical ideas
e. How to monitor student understanding during mathematics instruction
f. How to adapt mathematics instruction to address student misconceptions
g. How to use technology in mathematics instruction
h. How to use investigation-oriented tasks in mathematics instruction
i. How to teach mathematics to students who are English language learners
j. How to provide alternative mathematics learning experiences for students with special needs
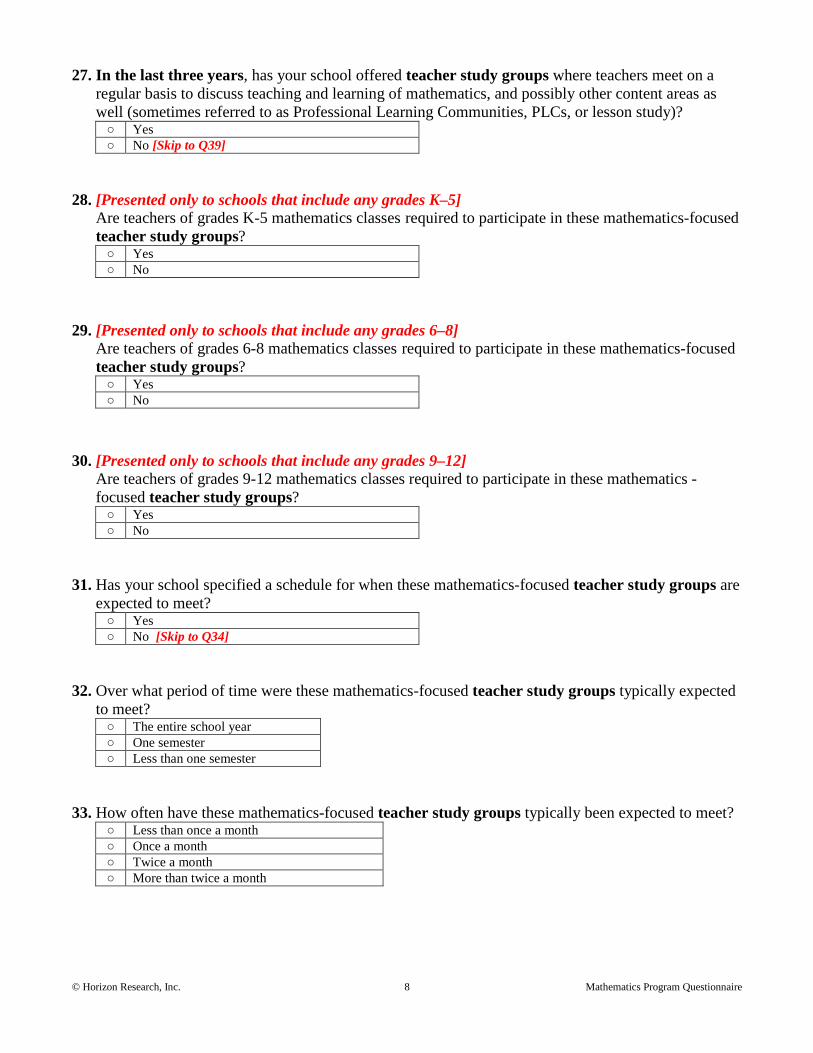
© Horizon Research, Inc. 8 Mathematics Program Questionnaire
27. In the last three years, has your school offered teacher study groups where teachers meet on a
regular basis to discuss teaching and learning of mathematics, and possibly other content areas as well (sometimes referred to as Professional Learning Communities, PLCs, or lesson study)? ○ Yes ○ No [Skip to Q39]
28. [Presented only to schools that include any grades K–5]
Are teachers of grades K-5 mathematics classes required to participate in these mathematics-focused teacher study groups? ○ Yes ○ No
29. [Presented only to schools that include any grades 6–8]
Are teachers of grades 6-8 mathematics classes required to participate in these mathematics-focused teacher study groups? ○ Yes ○ No
30. [Presented only to schools that include any grades 9–12]
Are teachers of grades 9-12 mathematics classes required to participate in these mathematics -focused teacher study groups? ○ Yes ○ No
31. Has your school specified a schedule for when these mathematics-focused teacher study groups are
expected to meet? ○ Yes ○ No [Skip to Q34]
32. Over what period of time were these mathematics-focused teacher study groups typically expected
to meet? ○ The entire school year ○ One semester ○ Less than one semester
33. How often have these mathematics-focused teacher study groups typically been expected to meet?
○ Less than once a month ○ Once a month ○ Twice a month ○ More than twice a month

© Horizon Research, Inc. 9 Mathematics Program Questionnaire
34. Which of the following describe the typical mathematics-focused teacher study groups in this school? [Select all that apply.] □ Organized by grade level □ Include teachers from multiple grade levels □ Limited to teachers from this school □ Include teachers from other schools in the district/diocese [Not presented to non-Catholic
private schools] □ Include teachers from other schools outside of your district/diocese □ Include school and/or district/diocese administrators □ Include parents/guardians or other community members □ Include higher education faculty or other “consultants”
35. Which of the following describe the typical mathematics-focused teacher study groups in this
school? [Select all that apply.] □ Teachers engage in mathematics investigations. □ Teachers plan mathematics lessons together. □ Teachers analyze student mathematics assessment results. □ Teachers analyze classroom artifacts (for example: student work samples). □ Teachers analyze mathematics instructional materials (for example: textbooks or programs).
36. To what extent have these mathematics-focused teacher study groups addressed deepening teacher
understanding of each of the following? [Select one on each row.]
Not at all Somewhat
To a great
extent a. Mathematics content b. State mathematics standards c. How to use particular mathematics instructional
materials (for example: textbooks or programs)
d. How students think about various mathematical ideas
e. How to monitor student understanding during mathematics instruction
f. How to adapt mathematics instruction to address student misconceptions
g. How to use technology in mathematics instruction
h. How to use investigation-oriented tasks in mathematics instruction
i. How to teach mathematics to students who are English language learners
j. How to provide alternative mathematics learning experiences for students with special needs
37. Have there been designated leaders for these mathematics-focused teacher study groups?
○ Yes ○ No [Skip to Q39]
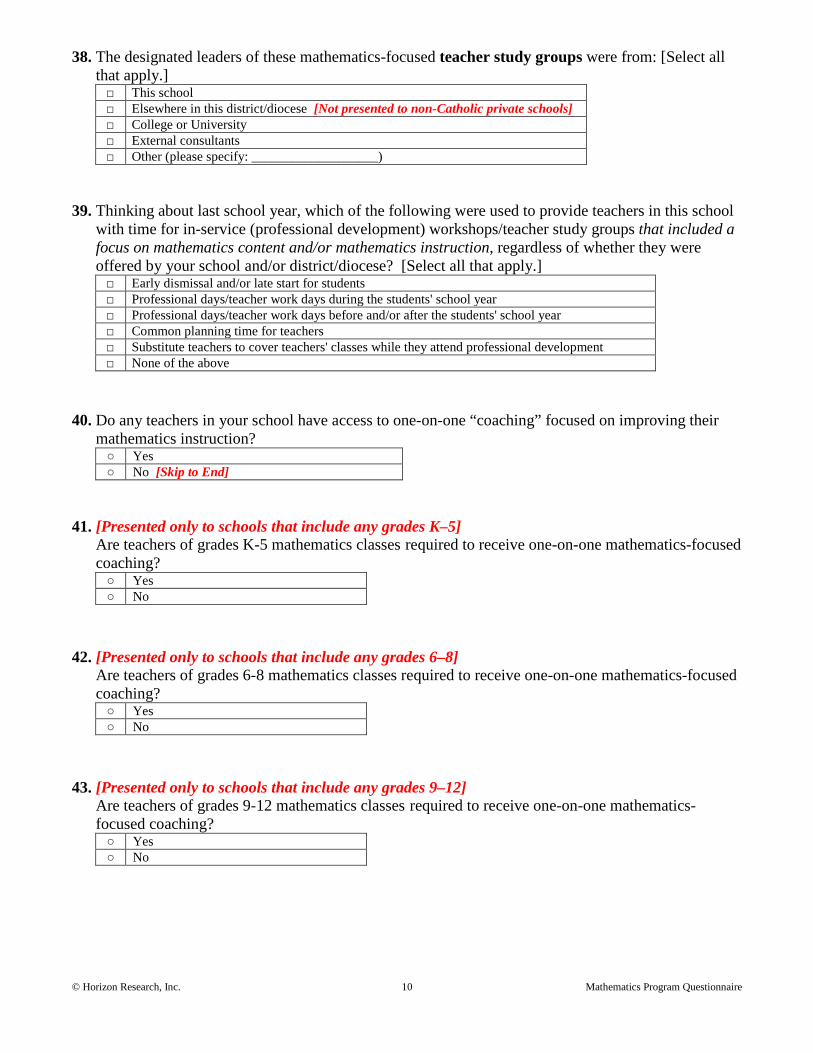
© Horizon Research, Inc. 10 Mathematics Program Questionnaire
38. The designated leaders of these mathematics-focused teacher study groups were from: [Select all that apply.] □ This school □ Elsewhere in this district/diocese [Not presented to non-Catholic private schools] □ College or University □ External consultants □ Other (please specify: ___________________)
39. Thinking about last school year, which of the following were used to provide teachers in this school with time for in-service (professional development) workshops/teacher study groups that included a focus on mathematics content and/or mathematics instruction, regardless of whether they were offered by your school and/or district/diocese? [Select all that apply.] □ Early dismissal and/or late start for students □ Professional days/teacher work days during the students' school year □ Professional days/teacher work days before and/or after the students' school year □ Common planning time for teachers □ Substitute teachers to cover teachers' classes while they attend professional development □ None of the above
40. Do any teachers in your school have access to one-on-one “coaching” focused on improving their
mathematics instruction? ○ Yes ○ No [Skip to End]
41. [Presented only to schools that include any grades K–5]
Are teachers of grades K-5 mathematics classes required to receive one-on-one mathematics-focused coaching? ○ Yes ○ No
42. [Presented only to schools that include any grades 6–8]
Are teachers of grades 6-8 mathematics classes required to receive one-on-one mathematics-focused coaching? ○ Yes ○ No
43. [Presented only to schools that include any grades 9–12]
Are teachers of grades 9-12 mathematics classes required to receive one-on-one mathematics-focused coaching? ○ Yes ○ No

© Horizon Research, Inc. 11 Mathematics Program Questionnaire
44. To what extent is one-on-one mathematics-focused coaching in your school provided by each of the following? [Select one on each row.]
Not at all Somewhat
To a great
extent a. The principal of your school b. An assistant principal at your school c. District/Diocese administrators
including mathematics supervisors/coordinators [Not presented to non-Catholic private schools]
d. Teachers/coaches who do not have classroom teaching responsibilities
e. Teachers/coaches who have part-time classroom teaching responsibilities
f. Teachers/coaches who have full-time classroom teaching responsibilities
Thank you!

© Horizon Research, Inc. 1 Science Teacher Questionnaire
2012 NATIONAL SURVEY OF SCIENCE AND MATHEMATICS EDUCATION SCIENCE TEACHER QUESTIONNAIRE
Section A. Teacher Background and Opinions 1. How many years have you taught prior to this school year: [Enter each response as a whole number
(for example: 15).] a. any subject at the K-12 level? _____ b. science at the K-12 level? _____ c. at this school, any subject? _____
2. At what grade levels do you currently teach science? [Select all that apply.]
□ K-5 □ 6-8 □ 9-12 □ You do not currently teach science
3. [Presented to self-contained teachers only]
Which best describes the science instruction provided to the entire class? • Do not consider pull-out instruction that some students may receive for remediation or
enrichment. • Do not consider instruction provided to individual or small groups of students, for example by an
English-language specialist, special educator, or teacher assistant. ○ This class receives science instruction only from you. [Presented only to teachers who answered in Q2 that they teach
science]
○ This class receives science instruction from you and another teacher (for example: a science specialist or a teacher you team with). [Presented only to teachers who answered in Q2 that they teach science]
4. [Presented to self-contained teachers only]
Which best describes your science teaching? ○ I teach science all or most days, every week of the year. ○ I teach science every week, but typically three or fewer days each week. ○ I teach science some weeks, but typically not every week. [Skip to Q6]
5. [Presented to self-contained teachers only]
In a typical week, how many days do you teach lessons on each of the following subjects and how many minutes per week are spent on each subject? [Enter each response as a whole number (for example: 5, 150).]
Number of days per week Total number of minutes per week a. Mathematics b. Science c. Social Studies d. Reading/Language Arts

© Horizon Research, Inc. 2 Science Teacher Questionnaire
6. [Presented to self-contained teachers only] In a typical year, how many weeks do you teach lessons on each of the following subjects and how many minutes per week are spent on each subject? [Enter each response as a whole number (for example: 36, 150).]
Number of weeks per year Average number of minutes per
week when taught a. Mathematics b. Science c. Social Studies d. Reading/Language Arts
7. [Presented to non-self-contained teachers only]
In a typical week, how many different classes of each of the following do you teach? • If you meet with the same class of students multiple times per week, count that class only once. • If you teach the same science or engineering course to multiple classes of students, count each
class separately. • Select one on each row.
0 1 2 3 4 5 6 7 8 9 10 Science (may include some engineering content) ○ ○ ○ ○ ○ ○ ○ ○ ○ ○ ○ Engineering (may include some science content) ○ ○ ○ ○ ○ ○ ○ ○ ○ ○ ○
8. [Presented to non-self-contained teachers only]
For each science class you teach, select the course type and enter the number of students enrolled. Enter the classes in the order that you teach them. For teachers on an alternating day block schedule, please order your classes starting with the first class you teach this week. [Select one course type on each row and enter the number of students as a whole number (for example: 25).]
Class Course Type Number of Students
Your 1st science class: Your 2nd science class: … Your Nth science class:
Course Type List 1 Science (Grades K - 5) 2 Life Science (Grades 6 - 8) 3 Earth Science (Grades 6 - 8) 4 Physical Science (Grades 6 - 8) 5 General or Integrated Science (Grades 6 - 8) 6 Coordinated or Integrated Science including General Science and Physical Science (Grades 9 - 12) 7 Earth/Space Science (Grades 9 - 12) 8 Life Science/Biology (Grades 9 - 12) 9 Environmental Science/Ecology (Grades 9 - 12) 10 Chemistry (Grades 9 - 12) 11 Physics (Grades 9 - 12)

© Horizon Research, Inc. 3 Science Teacher Questionnaire
9. [Presented to non-self-contained grades 9–12 teachers only] For each grades 9-12 science class you teach, select the level that best describes the content addressed in that class. • Use the descriptions below to help identify the level. • Select one on each row.
Level Description Non-college Prep A course that does not count towards the entrance requirements of a 4-year college. For
example: Life Science. 1st Year College Prep, Including Honors
The first course in a discipline that counts towards the entrance requirements of a 4-year college. For example: Biology, Chemistry I.
2nd Year Advanced A course typically taken after a 1st year college prep course. For example: Anatomy and Physiology, Advanced Chemistry, Physics II. Include Advanced Placement, International Baccalaureate, and concurrent college and high school credit/dual enrollment.
Class Course Type Non-college
Prep
1st Year College Prep, Including
Honors 2nd Year
Advanced Your 1st science class:
[course type(s) teacher selected in Q7] ○ ○ ○
Your 2nd science class:
○ ○ ○
… Your Nth science class:
○ ○ ○
10. [Presented to non-self-contained teachers only]
Later in this questionnaire, we will ask you questions about you’re your randomly selected science class, which you indicated was [level and course type teacher selected in Q8/9]. What is your school’s title for this course? _____________________________________
11. Have you been awarded one or more bachelor’s and/or graduate degrees in the following fields?
(With regard to bachelor’s degrees, count only areas in which you majored.) [Select one on each row.]
Yes No a. Education, including science education ○ ○ b. Natural Sciences and/or Engineering ○ ○ c. Other, please specify ______________________ ○ ○
12. [Presented only to teachers that answered “Yes” to Q11a]
What type of education degree do you have? (With regard to bachelor’s degrees, count only areas in which you majored.) [Select all that apply.] □ Elementary Education □ Mathematics Education □ Science Education □ Other Education, please specify. ____________

© Horizon Research, Inc. 4 Science Teacher Questionnaire
13. [Presented only to teachers that answered “Yes” to Q11b] What type of natural science and/or engineering degree do you have? (With regard to bachelor’s degrees, count only areas in which you majored.) [Select all that apply.] □ Biology/Life Science □ Chemistry □ Earth/Space Science □ Engineering □ Environmental Science/Ecology □ Physics □ Other natural science, please specify _________________
14. Did you complete any of the following types of biology/life science courses at the undergraduate or graduate level? [Select one on each row.]
15. [Presented only to teachers that answered “Yes” to Q14b]
Please indicate which of the following biology/life science courses you completed (beyond a general/introductory course) at the undergraduate or graduate level. [Select all that apply.] □ Anatomy/Physiology □ Biochemistry □ Botany □ Cell Biology □ Ecology □ Evolution □ Genetics □ Microbiology □ Zoology □ Other biology/life science beyond the general/introductory level
16. Did you complete any of the following types of chemistry courses at the undergraduate or graduate
level? [Select one on each row.]
17. [Presented only to teachers that answered “Yes” to Q16b]
Please indicate which of the following chemistry courses you completed (beyond a general/introductory course) at the undergraduate or graduate level. [Select all that apply.] □ Analytical Chemistry □ Biochemistry □ Inorganic Chemistry □ Organic Chemistry □ Physical Chemistry □ Quantum Chemistry □ Other chemistry beyond the general/introductory level
Yes No a. General/introductory biology/life science courses (for example: Biology I, Introduction to
Biology) ○ ○
b. Biology/life science courses beyond the general/introductory level ○ ○ c. Biology/life science education courses ○ ○
Yes No a. General/introductory chemistry courses (for example: Chemistry I, Introduction to Chemistry) ○ ○ b. Chemistry courses beyond the general/introductory level ○ ○ c. Chemistry education courses ○ ○
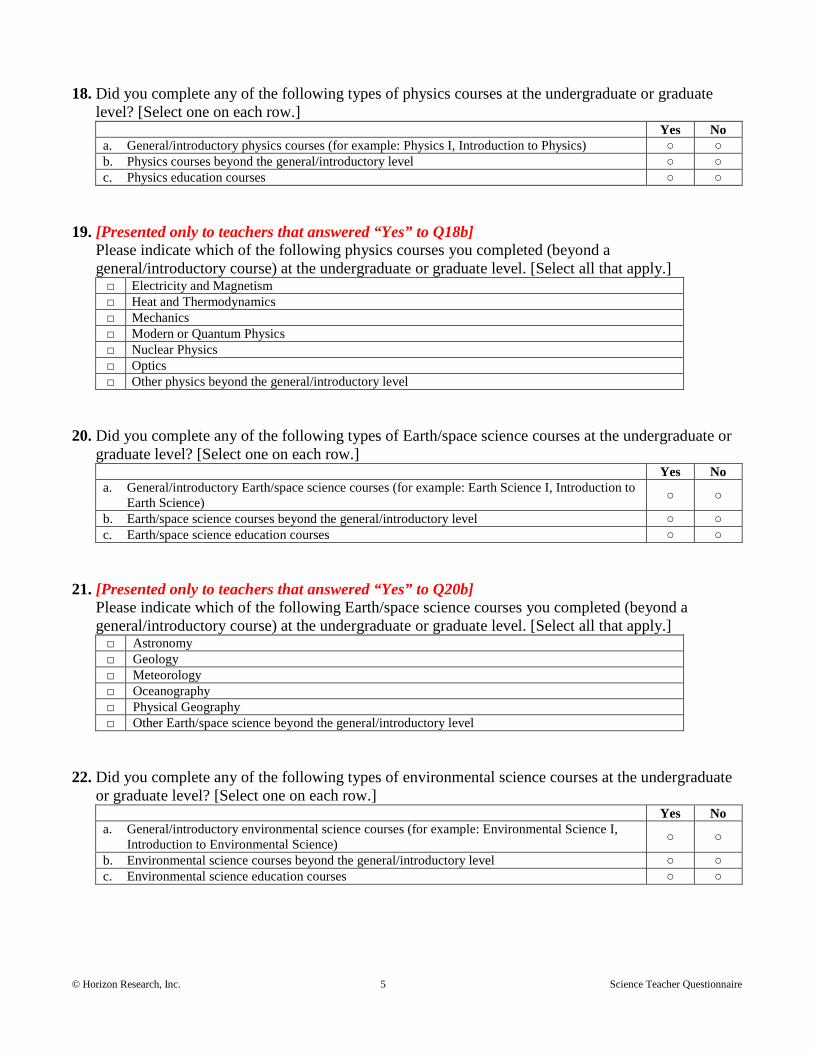
© Horizon Research, Inc. 5 Science Teacher Questionnaire
18. Did you complete any of the following types of physics courses at the undergraduate or graduate
level? [Select one on each row.]
19. [Presented only to teachers that answered “Yes” to Q18b]
Please indicate which of the following physics courses you completed (beyond a general/introductory course) at the undergraduate or graduate level. [Select all that apply.] □ Electricity and Magnetism □ Heat and Thermodynamics □ Mechanics □ Modern or Quantum Physics □ Nuclear Physics □ Optics □ Other physics beyond the general/introductory level
20. Did you complete any of the following types of Earth/space science courses at the undergraduate or
graduate level? [Select one on each row.]
21. [Presented only to teachers that answered “Yes” to Q20b]
Please indicate which of the following Earth/space science courses you completed (beyond a general/introductory course) at the undergraduate or graduate level. [Select all that apply.] □ Astronomy □ Geology □ Meteorology □ Oceanography □ Physical Geography □ Other Earth/space science beyond the general/introductory level
22. Did you complete any of the following types of environmental science courses at the undergraduate
or graduate level? [Select one on each row.]
Yes No a. General/introductory physics courses (for example: Physics I, Introduction to Physics) ○ ○ b. Physics courses beyond the general/introductory level ○ ○ c. Physics education courses ○ ○
Yes No a. General/introductory Earth/space science courses (for example: Earth Science I, Introduction to
Earth Science) ○ ○
b. Earth/space science courses beyond the general/introductory level ○ ○ c. Earth/space science education courses ○ ○
Yes No a. General/introductory environmental science courses (for example: Environmental Science I,
Introduction to Environmental Science) ○ ○
b. Environmental science courses beyond the general/introductory level ○ ○ c. Environmental science education courses ○ ○

© Horizon Research, Inc. 6 Science Teacher Questionnaire
23. [Presented only to teachers that answered “Yes” to Q22b] Please indicate which of the following environmental science courses you completed (beyond a general/introductory course) at the undergraduate or graduate level. [Select all that apply.] □ Conservation Biology □ Ecology □ Forestry □ Hydrology □ Oceanography □ Toxicology □ Other environmental science beyond the general/introductory level
24. Did you complete one or more engineering courses at the undergraduate or graduate level?
○ Yes ○ No
25. [Presented only to teachers that answered “Yes” to Q24b]
Please indicate which of the following types of engineering courses you completed at the undergraduate or graduate level. [Select all that apply.] □ Aerospace Engineering □ Bioengineering/Biomedical Engineering □ Chemical Engineering □ Civil Engineering □ Computer Engineering □ Electrical Engineering □ Industrial/Manufacturing Engineering □ Mechanical Engineering □ Other types of engineering courses
26. For each of the following areas, indicate the number of semester and/or quarter courses you
completed. • Count courses not credit hours. • Include courses taken at the graduate or undergraduate level, as well as courses for which you
received college credit while you were in high school. • Count each course taken in high school for college credit as a one semester college course. • Count courses that lasted multiple semesters or quarters as multiple courses. • If your transcripts are not available, provide your best estimates. • Enter your responses as whole numbers (for example: 3). You may either enter 0 (zero) or leave
the box empty wherever applicable. Number of
SEMESTER college courses
Number of QUARTER
college courses a. Interdisciplinary science (a single course that addresses content across
multiple science subjects, such as biology, chemistry, physics and/or Earth science)
b. Biology/Life science c. Chemistry d. Physics e. Earth/Space science f. Environmental science g. Engineering h. Mathematics

© Horizon Research, Inc. 7 Science Teacher Questionnaire
27. How many of the undergraduate and graduate level science courses you completed were taken at
each of the following types of institutions? (Please do not include science education courses.) [Enter each response as a whole number (for example: 15).] a. Two-year college, community college, and/or technical school _______ b. Four-year college and/or university _______
28. Which of the following best describes your teacher certification program?
○ An undergraduate program leading to a bachelor’s degree and a teaching credential ○ A post-baccalaureate credentialing program (no master’s degree awarded) ○ A master’s program that also awarded a teaching credential ○ You did not have any formal teacher preparation
29. When did you last participate in professional development (sometimes called in-service education)
focused on science or science teaching? (Include attendance at professional meetings, workshops, and conferences, as well as professional learning communities/lesson studies/teacher study groups. Do not include formal courses for which you received college credit or time you spent providing professional development for other teachers.) ○ In the last 3 years
}
○ 4–6 years ago Skip to 33 ○ 7–10 years ago
○ More than 10 years ago ○ Never
30. In the last 3 years have you… [Select one on each row.]
31. What is the total amount of time you have spent on professional development in science or science
teaching in the last 3 years? (Include attendance at professional meetings, workshops, and conferences, as well as professional learning communities/lesson studies/teacher study groups. Do not include formal courses for which you received college credit or time you spent providing professional development for other teachers.) ○ Less than 6 hours ○ 6-15 hours ○ 16-35 hours ○ More than 35 hours
Yes No a. attended a workshop on science or science teaching? ○ ○ b. attended a national, state, or regional science teacher association meeting? ○ ○ c. participated in a professional learning community/lesson study/teacher study group focused on
science or science teaching? ○ ○
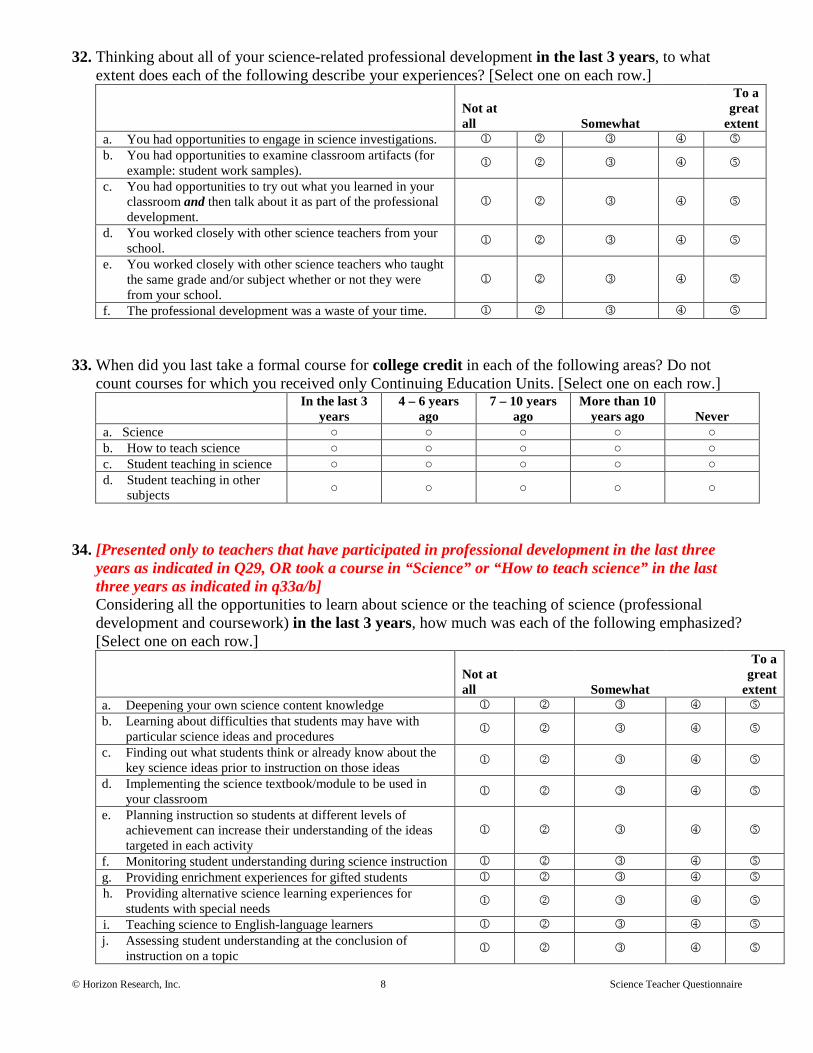
© Horizon Research, Inc. 8 Science Teacher Questionnaire
32. Thinking about all of your science-related professional development in the last 3 years, to what extent does each of the following describe your experiences? [Select one on each row.]
Not at all Somewhat
To a great
extent a. You had opportunities to engage in science investigations. b. You had opportunities to examine classroom artifacts (for
example: student work samples).
c. You had opportunities to try out what you learned in your classroom and then talk about it as part of the professional development.
d. You worked closely with other science teachers from your school.
e. You worked closely with other science teachers who taught the same grade and/or subject whether or not they were from your school.
f. The professional development was a waste of your time. 33. When did you last take a formal course for college credit in each of the following areas? Do not
count courses for which you received only Continuing Education Units. [Select one on each row.]
In the last 3
years 4 – 6 years
ago 7 – 10 years
ago More than 10
years ago Never a. Science ○ ○ ○ ○ ○ b. How to teach science ○ ○ ○ ○ ○ c. Student teaching in science ○ ○ ○ ○ ○ d. Student teaching in other
subjects ○ ○ ○ ○ ○
34. [Presented only to teachers that have participated in professional development in the last three
years as indicated in Q29, OR took a course in “Science” or “How to teach science” in the last three years as indicated in q33a/b] Considering all the opportunities to learn about science or the teaching of science (professional development and coursework) in the last 3 years, how much was each of the following emphasized? [Select one on each row.]
Not at all Somewhat
To a great
extent a. Deepening your own science content knowledge b. Learning about difficulties that students may have with
particular science ideas and procedures
c. Finding out what students think or already know about the key science ideas prior to instruction on those ideas
d. Implementing the science textbook/module to be used in your classroom
e. Planning instruction so students at different levels of achievement can increase their understanding of the ideas targeted in each activity
f. Monitoring student understanding during science instruction g. Providing enrichment experiences for gifted students h. Providing alternative science learning experiences for
students with special needs
i. Teaching science to English-language learners j. Assessing student understanding at the conclusion of
instruction on a topic
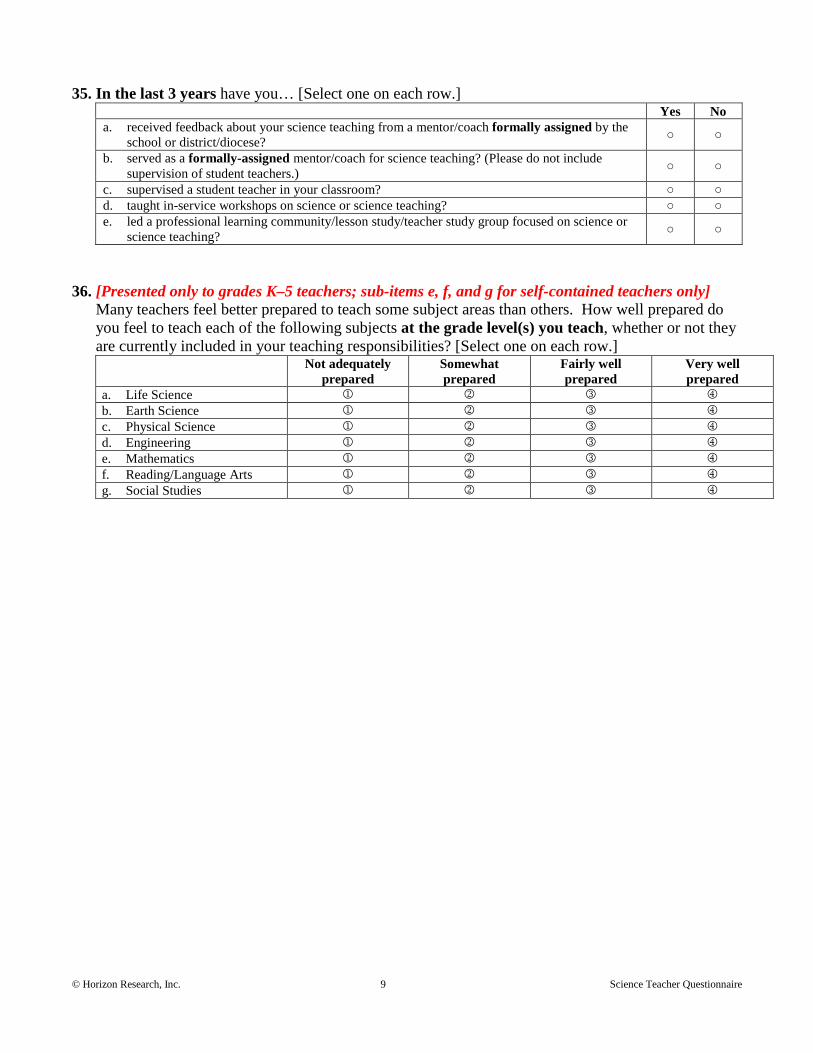
© Horizon Research, Inc. 9 Science Teacher Questionnaire
35. In the last 3 years have you… [Select one on each row.]
36. [Presented only to grades K–5 teachers; sub-items e, f, and g for self-contained teachers only]
Many teachers feel better prepared to teach some subject areas than others. How well prepared do you feel to teach each of the following subjects at the grade level(s) you teach, whether or not they are currently included in your teaching responsibilities? [Select one on each row.]
Not adequately
prepared Somewhat prepared
Fairly well prepared
Very well prepared
a. Life Science b. Earth Science c. Physical Science d. Engineering e. Mathematics f. Reading/Language Arts g. Social Studies
Yes No a. received feedback about your science teaching from a mentor/coach formally assigned by the
school or district/diocese? ○ ○
b. served as a formally-assigned mentor/coach for science teaching? (Please do not include supervision of student teachers.) ○ ○
c. supervised a student teacher in your classroom? ○ ○ d. taught in-service workshops on science or science teaching? ○ ○ e. led a professional learning community/lesson study/teacher study group focused on science or
science teaching? ○ ○

© Horizon Research, Inc. 10 Science Teacher Questionnaire
37. [Presented only to grades 6–12 teachers; non-self-contained teachers shown only topics related to their randomly selected class and engineering; self-contained teachers shown all topics] Within science many teachers feel better prepared to teach some topics than others. How well prepared do you feel to teach each of the following topics at the grade level(s) you teach, whether or not they are currently included in your teaching responsibilities? [Select one on each row.]
Not adequately
prepared Somewhat prepared
Fairly well prepared
Very well prepared
a. Earth/Space Science i. Earth’s features and physical processes
ii. The solar system and the universe iii. Climate and weather
b. Biology/Life Science i. Cell biology
ii. Structures and functions of organisms iii. Ecology/ecosystems iv. Genetics v. Evolution
c. Chemistry i. Atomic structure
ii. Chemical bonding, equations, nomenclature, and reactions
iii. Elements, compounds, and mixtures iv. The Periodic Table v. Properties of solutions
vi. States, classes, and properties of matter d. Physics
i. Forces and motion ii. Energy transfers, transformations, and
conservation
iii. Properties and behaviors of waves iv. Electricity and magnetism v. Modern physics (for example: special
relativity)
e. Engineering (for example: nature of engineering and technology, design processes, analyzing and improving technological systems, interactions between technology and society)
f. Environmental and resource issues (for example: land and water use, energy resources and consumption, sources and impacts of pollution)

© Horizon Research, Inc. 11 Science Teacher Questionnaire
38. How well prepared do you feel to do each of the following in your science instruction? [Select one on each row.]
Not adequately prepared
Somewhat prepared
Fairly well prepared
Very well prepared
a. Plan instruction so students at different levels of achievement can increase their understanding of the ideas targeted in each activity
b. Teach science to students who have learning disabilities c. Teach science to students who have physical disabilities d. Teach science to English-language learners e. Provide enrichment experiences for gifted students f. Encourage students’ interest in science and/or
engineering
g. Encourage participation of females in science and/or engineering
h. Encourage participation of racial or ethnic minorities in science and/or engineering
i. Encourage participation of students from low socioeconomic backgrounds in science and/or engineering
j. Manage classroom discipline 39. Please provide your opinion about each of the following statements. [Select one on each row.]
Strongly Disagree Disagree
No Opinion Agree
Strongly Agree
a. Students learn science best in classes with students of similar abilities.
b. Inadequacies in students’ science background can be overcome by effective teaching.
c. It is better for science instruction to focus on ideas in depth, even if that means covering fewer topics.
d. Students should be provided with the purpose for a lesson as it begins.
e. At the beginning of instruction on a science idea, students should be provided with definitions for new scientific vocabulary that will be used.
f. Teachers should explain an idea to students before having them consider evidence that relates to the idea.
g. Most class periods should include some review of previously covered ideas and skills.
h. Most class periods should provide opportunities for students to share their thinking and reasoning.
i. Hands-on/laboratory activities should be used primarily to reinforce a science idea that the students have already learned.
j. Students should be assigned homework most days.
k. Most class periods should conclude with a summary of the key ideas addressed.

© Horizon Research, Inc. 12 Science Teacher Questionnaire
Section B. Your Science Instruction The rest of this questionnaire is about your science instruction in this class.
40. [Presented to non-self-contained teachers only]
On average, how many minutes per week does this class meet? [Enter your response as a whole number (for example: 300).] _________
41. Enter the number of students for each grade represented in this class. [Enter each response as a whole number (for example: 15).]
Kindergarten 1st grade 2nd grade 3rd grade 4th grade 5th grade 6th grade 7th grade 8th grade 9th grade 10th grade 11th grade 12th grade
42. For the students in this class, indicate the number of males and females in this class in each of the
following categories of race/ethnicity. [Enter each response as a whole number (for example: 15).] Males Females a. American Indian or Alaska Native b. Asian c. Black or African American d. Hispanic/Latino e. Native Hawaiian or Other Pacific Islander f. White g. Two or more races
43. Which of the following best describes the prior science achievement levels of the students in this class relative to other students in this school? ○ Mostly low achievers ○ Mostly average achievers ○ Mostly high achievers ○ A mixture of levels

© Horizon Research, Inc. 13 Science Teacher Questionnaire
44. How much control do you have over each of the following aspects of science instruction in this class? [Select one on each row.]
No Control
Moderate Control
Strong
Control a. Determining course goals and objectives b. Selecting textbooks/modules c. Selecting content, topics, and skills to be taught d. Selecting teaching techniques e. Determining the amount of homework to be assigned f. Choosing criteria for grading student performance
45. Think about your plans for this class for the entire course/year. By the end of the course/year, how
much emphasis will each of the following student objectives receive? [Select one on each row.]
None Minimal emphasis
Moderate emphasis
Heavy emphasis
a. Memorizing science vocabulary and/or facts b. Understanding science concepts c. Learning science process skills (for example: observing,
measuring)
d. Learning about real-life applications of science e. Increasing students’ interest in science f. Preparing for further study in science g. Learning test taking skills/strategies
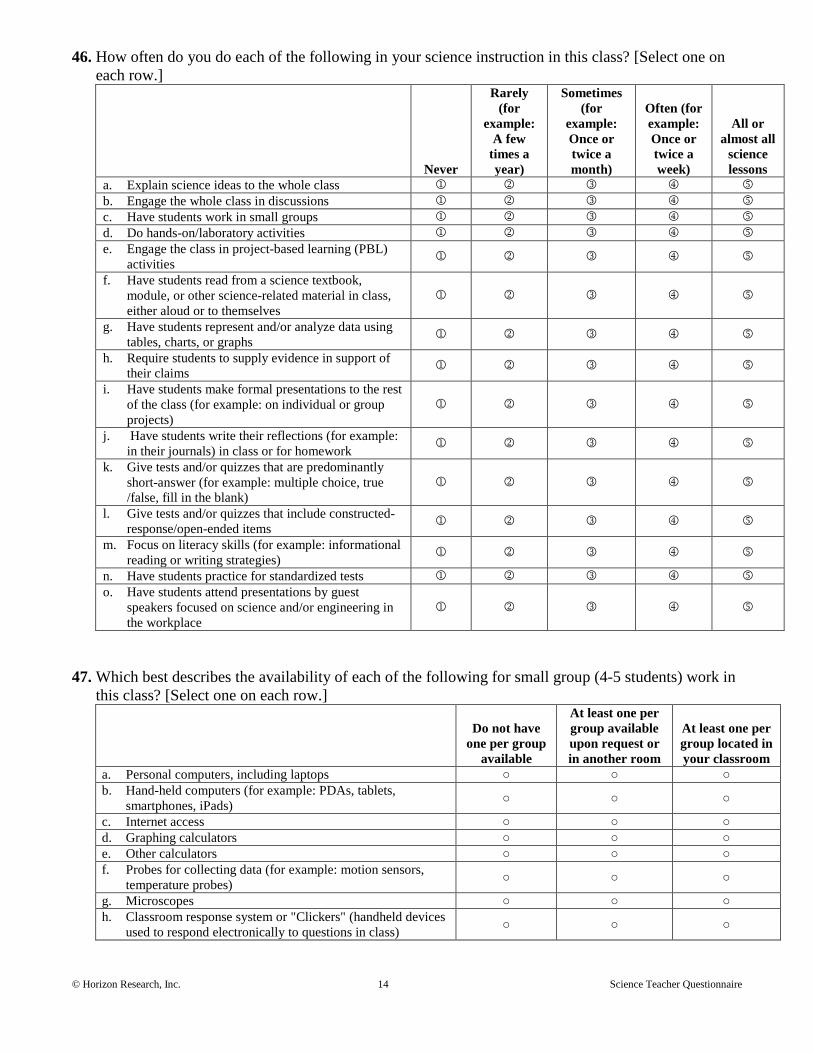
© Horizon Research, Inc. 14 Science Teacher Questionnaire
46. How often do you do each of the following in your science instruction in this class? [Select one on each row.]
Never
Rarely (for
example: A few
times a year)
Sometimes (for
example: Once or twice a month)
Often (for example: Once or twice a week)
All or almost all
science lessons
a. Explain science ideas to the whole class b. Engage the whole class in discussions c. Have students work in small groups d. Do hands-on/laboratory activities e. Engage the class in project-based learning (PBL)
activities
f. Have students read from a science textbook, module, or other science-related material in class, either aloud or to themselves
g. Have students represent and/or analyze data using tables, charts, or graphs
h. Require students to supply evidence in support of their claims
i. Have students make formal presentations to the rest of the class (for example: on individual or group projects)
j. Have students write their reflections (for example: in their journals) in class or for homework
k. Give tests and/or quizzes that are predominantly short-answer (for example: multiple choice, true /false, fill in the blank)
l. Give tests and/or quizzes that include constructed-response/open-ended items
m. Focus on literacy skills (for example: informational reading or writing strategies)
n. Have students practice for standardized tests o. Have students attend presentations by guest
speakers focused on science and/or engineering in the workplace
47. Which best describes the availability of each of the following for small group (4-5 students) work in
this class? [Select one on each row.]
Do not have one per group
available
At least one per group available upon request or in another room
At least one per group located in your classroom
a. Personal computers, including laptops ○ ○ ○ b. Hand-held computers (for example: PDAs, tablets,
smartphones, iPads) ○ ○ ○
c. Internet access ○ ○ ○ d. Graphing calculators ○ ○ ○ e. Other calculators ○ ○ ○ f. Probes for collecting data (for example: motion sensors,
temperature probes) ○ ○ ○
g. Microscopes ○ ○ ○ h. Classroom response system or "Clickers" (handheld devices
used to respond electronically to questions in class) ○ ○ ○
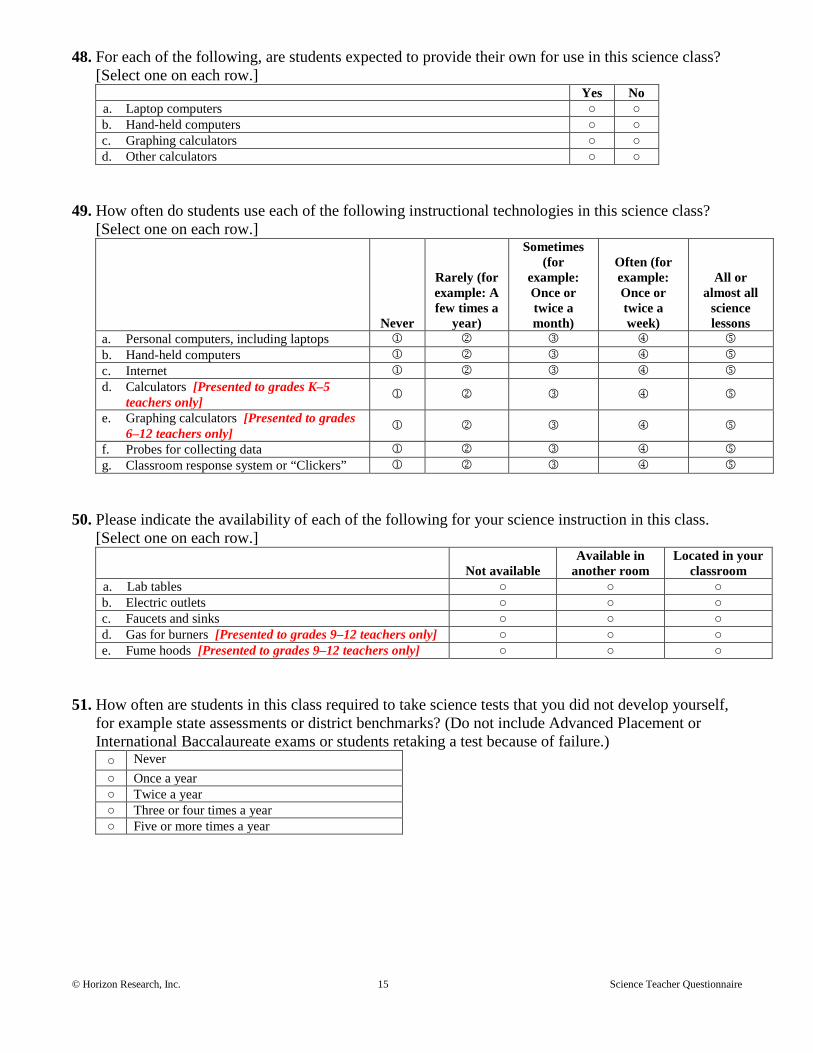
© Horizon Research, Inc. 15 Science Teacher Questionnaire
48. For each of the following, are students expected to provide their own for use in this science class? [Select one on each row.]
Yes No a. Laptop computers ○ ○ b. Hand-held computers ○ ○ c. Graphing calculators ○ ○ d. Other calculators ○ ○
49. How often do students use each of the following instructional technologies in this science class?
[Select one on each row.]
Never
Rarely (for example: A few times a
year)
Sometimes (for
example: Once or twice a month)
Often (for example: Once or twice a week)
All or almost all
science lessons
a. Personal computers, including laptops b. Hand-held computers c. Internet d. Calculators [Presented to grades K–5
teachers only]
e. Graphing calculators [Presented to grades 6–12 teachers only]
f. Probes for collecting data g. Classroom response system or “Clickers”
50. Please indicate the availability of each of the following for your science instruction in this class.
[Select one on each row.]
Not available Available in
another room Located in your
classroom a. Lab tables ○ ○ ○ b. Electric outlets ○ ○ ○ c. Faucets and sinks ○ ○ ○ d. Gas for burners [Presented to grades 9–12 teachers only] ○ ○ ○ e. Fume hoods [Presented to grades 9–12 teachers only] ○ ○ ○
51. How often are students in this class required to take science tests that you did not develop yourself, for example state assessments or district benchmarks? (Do not include Advanced Placement or International Baccalaureate exams or students retaking a test because of failure.) ○ Never ○ Once a year ○ Twice a year ○ Three or four times a year ○ Five or more times a year
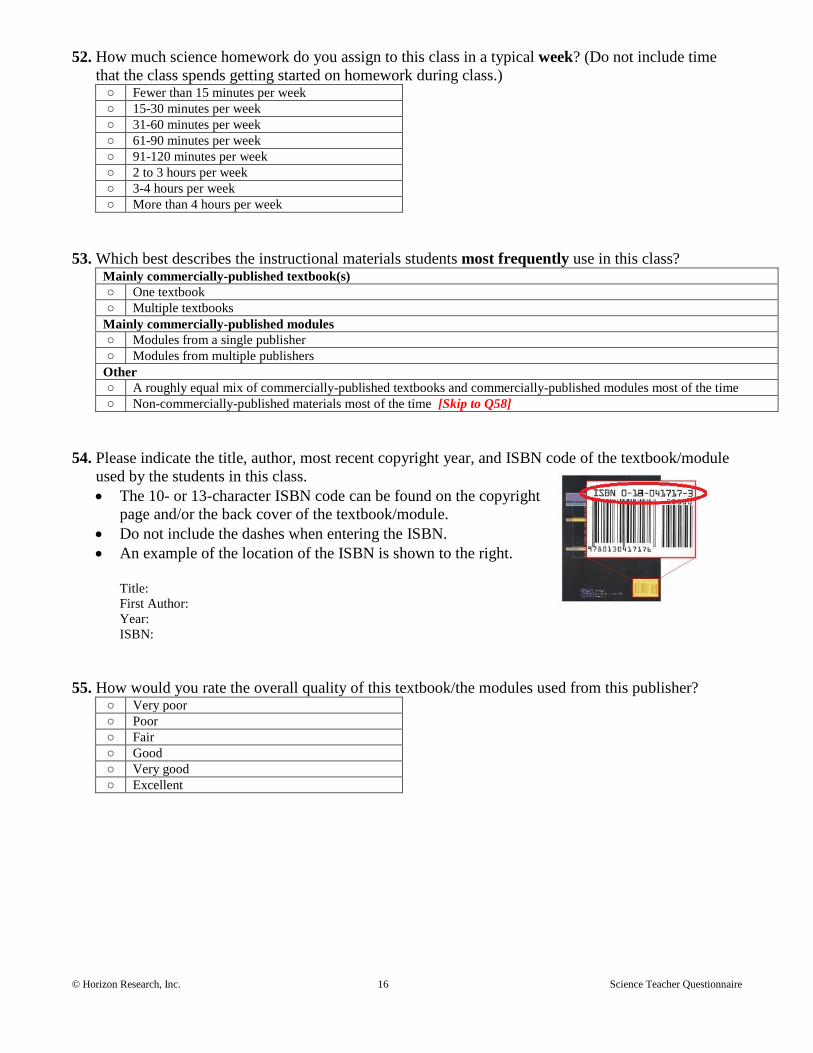
© Horizon Research, Inc. 16 Science Teacher Questionnaire
52. How much science homework do you assign to this class in a typical week? (Do not include time that the class spends getting started on homework during class.) ○ Fewer than 15 minutes per week ○ 15-30 minutes per week ○ 31-60 minutes per week ○ 61-90 minutes per week ○ 91-120 minutes per week ○ 2 to 3 hours per week ○ 3-4 hours per week ○ More than 4 hours per week
53. Which best describes the instructional materials students most frequently use in this class?
Mainly commercially-published textbook(s) ○ One textbook ○ Multiple textbooks
Mainly commercially-published modules ○ Modules from a single publisher ○ Modules from multiple publishers
Other ○ A roughly equal mix of commercially-published textbooks and commercially-published modules most of the time ○ Non-commercially-published materials most of the time [Skip to Q58]
54. Please indicate the title, author, most recent copyright year, and ISBN code of the textbook/module
used by the students in this class. • The 10- or 13-character ISBN code can be found on the copyright
page and/or the back cover of the textbook/module. • Do not include the dashes when entering the ISBN. • An example of the location of the ISBN is shown to the right.
Title:
First Author: Year:
ISBN: 55. How would you rate the overall quality of this textbook/the modules used from this publisher?
○ Very poor ○ Poor ○ Fair ○ Good ○ Very good ○ Excellent

© Horizon Research, Inc. 17 Science Teacher Questionnaire
56. [Presented only to teachers who indicated using one commercially-published textbook or modules from a single publisher in Q53] Over the course of the school year, approximately what percentage of the science instructional time will students in this class spend using this textbook/these modules? ○ Less than 25% ○ 25-49% ○ 50-74% ○ 75-90% ○ More than 90%
57. [Presented only to teachers who indicated using one commercially-published textbook in Q53]
Approximately what percentage of the chapters in this textbook will students in this class engage with during the school year? ○ Less than 25% ○ 25-49% ○ 50-74% ○ 75-90% ○ More than 90%
58. Science courses may benefit from the availability of particular kinds of equipment (for example:
microscopes, beakers, photogate timers, Bunsen burners). How adequate is the equipment you have available for teaching this science class? ○ Not adequate ○ ○ Somewhat adequate ○ ○ Adequate
59. Science courses may benefit from the availability of particular kinds of instructional technology (for
example: calculators, computers, probes/sensors). How adequate is the instructional technology you have available for teaching this science class? ○ Not adequate ○ ○ Somewhat adequate ○ ○ Adequate
60. Science courses may benefit from the availability of particular kinds of consumable supplies (for
example: chemicals, living organisms, batteries). How adequate are the consumable supplies you have available for teaching this science class? ○ Not adequate ○ ○ Somewhat adequate ○ ○ Adequate

© Horizon Research, Inc. 18 Science Teacher Questionnaire
61. Science courses may benefit from the availability of particular kinds of facilities (for example: lab tables, electric outlets, faucets and sinks). How adequate are the facilities you have available for teaching this science class? ○ Not adequate ○ ○ Somewhat adequate ○ ○ Adequate
62. In your opinion, how great a problem is each of the following for your science instruction in this
class? [Select one on each row.]
Not a significant problem
Somewhat of a
problem Serious problem
a. Lack of access to computers ○ ○ ○ b. Old age of computers ○ ○ ○ c. Lack of access to the Internet ○ ○ ○ d. Unreliability of the Internet connection ○ ○ ○ e. Slow speed of the Internet connection ○ ○ ○ f. Lack of availability of appropriate computer software ○ ○ ○ g. Lack of availability of technology support ○ ○ ○
63. Please rate the effect of each of the following on your science instruction in this class. [Select one on
each row.]
Inhibits effective instruction
Neutral or Mixed
Promotes effective
instruction
N/A or Don’t Know
a. Current state standards ○ b. District/Diocese curriculum frameworks
[Not presented to non-Catholic private schools]
○
c. District/Diocese and/or school pacing guides ○
d. State testing/accountability policies [Not presented to non-Catholic private schools]
○
e. District/Diocese testing/accountability policies [Not presented to non-Catholic private schools]
○
f. Textbook/module selection policies ○ g. Teacher evaluation policies ○ h. College entrance requirements
[Presented to grades 9–12 teachers only] ○
i. Students’ motivation, interest, and effort in science ○
j. Students’ reading abilities ○ k. Community views on science instruction ○ l. Parent expectations and involvement ○ m. Principal support ○ n. Time for you to plan, individually and
with colleagues ○
o. Time available for your professional development ○

© Horizon Research, Inc. 19 Science Teacher Questionnaire
Section C. Your Most Recently Completed Science Unit in this Class The questions in this section are about the most recently completed science unit in this class. • Depending on the structure of your class and the instructional materials you use, a unit may range
from a few to many class periods. • Do not be concerned if this unit was not typical of your instruction.
64. How many class periods were devoted to instruction on the most recently completed science unit?
[Enter your response as a whole number (for example: 15).] ___________________
65. Which of the following best describes the content of this unit?
○ Earth/Space Science ○ Life Science/Biology
○ Environmental Science/Ecology
○ Chemistry ○ Physics ○ Engineering
66. What science ideas and/or skills were addressed in this unit? 67. [Presented only to teachers who indicated using commercially-published textbooks/modules in
Q53] Was this unit based primarily on the commercially-published textbook/modules you described earlier as the one used most often in this class? ○ Yes [Skip to Q70] ○ No
68. Was this unit based on a commercially-published textbook/module?
○ Yes ○ No [Skip to Q74]
69. Please indicate the title, author, most recent copyright year, and ISBN code of that textbook/module.
• The 10- or 13-character ISBN code can be found on the copyright page and/or the back cover of the textbook/module.
• Do not include the dashes when entering the ISBN. • An example of the location of the ISBN is shown to the right.
Title:
First Author: Year: ISBN:
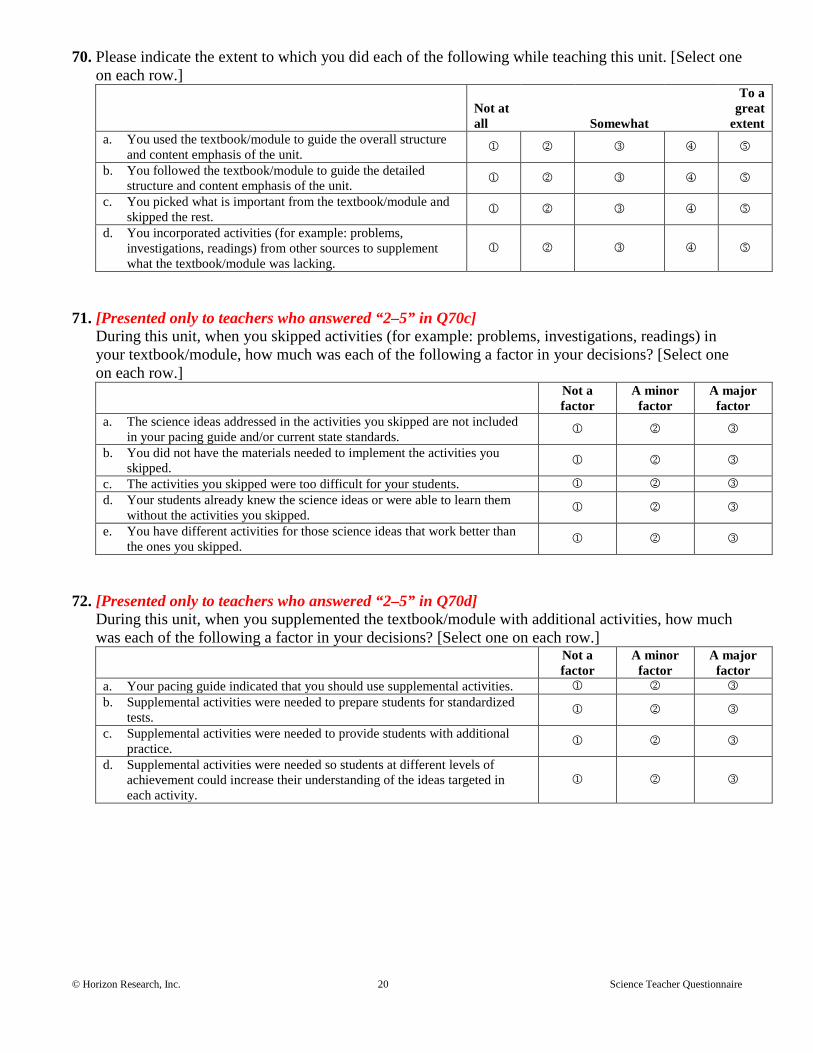
© Horizon Research, Inc. 20 Science Teacher Questionnaire
70. Please indicate the extent to which you did each of the following while teaching this unit. [Select one on each row.]
Not at all Somewhat
To a great
extent a. You used the textbook/module to guide the overall structure
and content emphasis of the unit.
b. You followed the textbook/module to guide the detailed structure and content emphasis of the unit.
c. You picked what is important from the textbook/module and skipped the rest.
d. You incorporated activities (for example: problems, investigations, readings) from other sources to supplement what the textbook/module was lacking.
71. [Presented only to teachers who answered “2–5” in Q70c]
During this unit, when you skipped activities (for example: problems, investigations, readings) in your textbook/module, how much was each of the following a factor in your decisions? [Select one on each row.]
Not a factor
A minor factor
A major factor
a. The science ideas addressed in the activities you skipped are not included in your pacing guide and/or current state standards.
b. You did not have the materials needed to implement the activities you skipped.
c. The activities you skipped were too difficult for your students. d. Your students already knew the science ideas or were able to learn them
without the activities you skipped.
e. You have different activities for those science ideas that work better than the ones you skipped.
72. [Presented only to teachers who answered “2–5” in Q70d]
During this unit, when you supplemented the textbook/module with additional activities, how much was each of the following a factor in your decisions? [Select one on each row.]
Not a factor
A minor factor
A major factor
a. Your pacing guide indicated that you should use supplemental activities. b. Supplemental activities were needed to prepare students for standardized
tests.
c. Supplemental activities were needed to provide students with additional practice.
d. Supplemental activities were needed so students at different levels of achievement could increase their understanding of the ideas targeted in each activity.

© Horizon Research, Inc. 21 Science Teacher Questionnaire
73. How well prepared did you feel to do each of the following as part of your instruction on this particular unit? [Select one on each row.]
Not adequately prepared
Somewhat prepared
Fairly well prepared
Very well prepared
a. Anticipate difficulties that students may have with particular science ideas and procedures in this unit
b. Find out what students thought or already knew about the key science ideas
c. Implement the science textbook/module to be used during this unit [Presented only to teachers who indicated using commercially-published textbooks/modules in Q67/68]
d. Monitor student understanding during this unit e. Assess student understanding at the conclusion of this unit
74. Which of the following did you do during this unit? [Select all that apply.]
□ Administered an assessment, task, or probe at the beginning of the unit to find out what students thought or already knew about the key science ideas
□ Questioned individual students during class activities to see if they were “getting it”
□ Used information from informal assessments of the entire class (for example: asking for a show of hands, thumbs up/thumbs down, clickers, exit tickets) to see if students were “getting it”
□ Reviewed student work (for example: homework, notebooks, journals, portfolios, projects) to see if they were “getting it”
□ Administered one or more quizzes and/or tests to see if students were “getting it” □ Had students use rubrics to examine their own or their classmates’ work □ Assigned grades to student work (for example: homework, notebooks, journals, portfolios, projects) □ Administered one or more quizzes and/or tests to assign grades □ Went over the correct answers to assignments, quizzes, and/or tests with the class as a whole
Section D. Your Most Recent Science Lesson in this Class The next three questions refer to the most recent science lesson in this class, whether or not that instruction was part of the unit you’ve just been describing. Do not be concerned if this lesson included activities and/or interruptions that are not typical (for example: a test, students working on projects, a fire drill).
75. How many minutes was that lesson? [Enter your response as a non-zero whole number (for
example: 50).] __________ 76. Of these minutes, how many were spent on the following: [Enter each response as a whole number
(for example: 15).] a. Non-instructional activities (for example: attendance taking, interruptions) ____ b. Whole class activities (for example: lectures, explanations, discussions)____ c. Small group work ___ d. Students working individually (for example: reading textbooks, completing worksheets, taking a test or quiz) ___
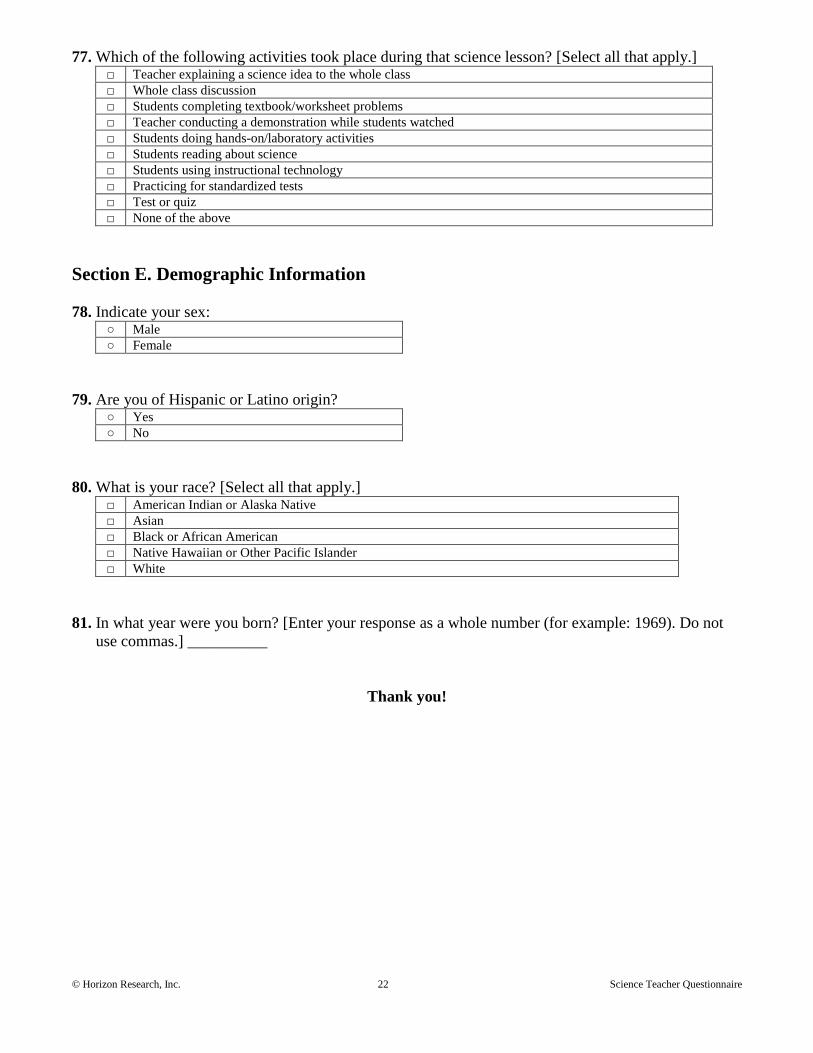
© Horizon Research, Inc. 22 Science Teacher Questionnaire
77. Which of the following activities took place during that science lesson? [Select all that apply.] □ Teacher explaining a science idea to the whole class □ Whole class discussion □ Students completing textbook/worksheet problems □ Teacher conducting a demonstration while students watched □ Students doing hands-on/laboratory activities □ Students reading about science □ Students using instructional technology □ Practicing for standardized tests □ Test or quiz □ None of the above
Section E. Demographic Information
78. Indicate your sex:
○ Male ○ Female
79. Are you of Hispanic or Latino origin?
○ Yes ○ No
80. What is your race? [Select all that apply.]
□ American Indian or Alaska Native □ Asian □ Black or African American □ Native Hawaiian or Other Pacific Islander □ White
81. In what year were you born? [Enter your response as a whole number (for example: 1969). Do not
use commas.] __________
Thank you!
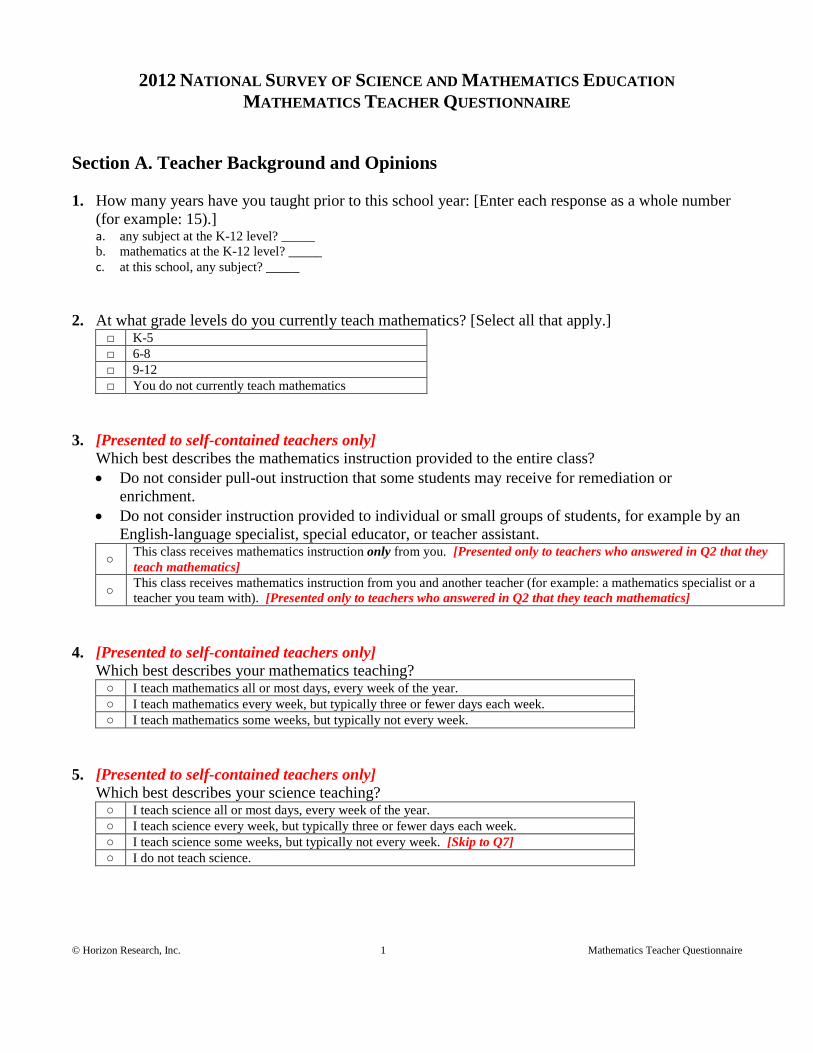
© Horizon Research, Inc. 1 Mathematics Teacher Questionnaire
2012 NATIONAL SURVEY OF SCIENCE AND MATHEMATICS EDUCATION
MATHEMATICS TEACHER QUESTIONNAIRE Section A. Teacher Background and Opinions 1. How many years have you taught prior to this school year: [Enter each response as a whole number
(for example: 15).] a. any subject at the K-12 level? _____ b. mathematics at the K-12 level? _____ c. at this school, any subject? _____
2. At what grade levels do you currently teach mathematics? [Select all that apply.]
□ K-5 □ 6-8 □ 9-12 □ You do not currently teach mathematics
3. [Presented to self-contained teachers only] Which best describes the mathematics instruction provided to the entire class? • Do not consider pull-out instruction that some students may receive for remediation or
enrichment. • Do not consider instruction provided to individual or small groups of students, for example by an
English-language specialist, special educator, or teacher assistant. ○ This class receives mathematics instruction only from you. [Presented only to teachers who answered in Q2 that they
teach mathematics]
○ This class receives mathematics instruction from you and another teacher (for example: a mathematics specialist or a teacher you team with). [Presented only to teachers who answered in Q2 that they teach mathematics]
4. [Presented to self-contained teachers only]
Which best describes your mathematics teaching? ○ I teach mathematics all or most days, every week of the year. ○ I teach mathematics every week, but typically three or fewer days each week. ○ I teach mathematics some weeks, but typically not every week.
5. [Presented to self-contained teachers only]
Which best describes your science teaching? ○ I teach science all or most days, every week of the year. ○ I teach science every week, but typically three or fewer days each week. ○ I teach science some weeks, but typically not every week. [Skip to Q7] ○ I do not teach science.
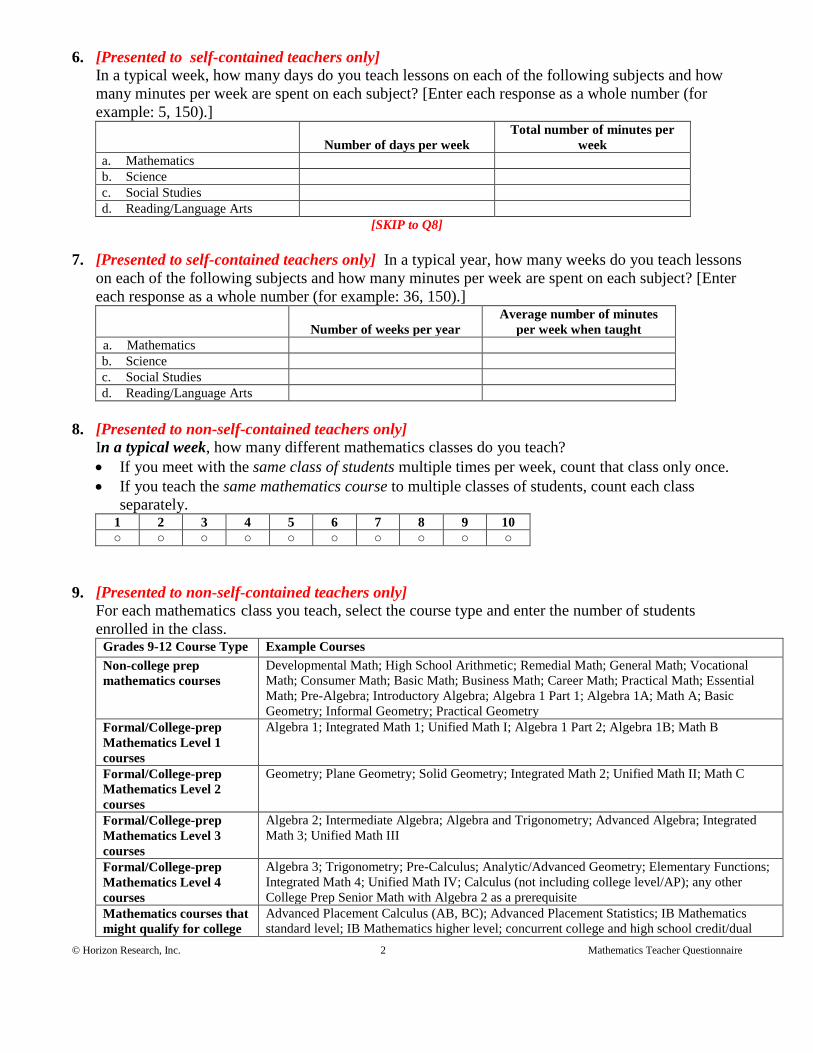
© Horizon Research, Inc. 2 Mathematics Teacher Questionnaire
6. [Presented to self-contained teachers only] In a typical week, how many days do you teach lessons on each of the following subjects and how many minutes per week are spent on each subject? [Enter each response as a whole number (for example: 5, 150).]
Number of days per week Total number of minutes per
week a. Mathematics b. Science c. Social Studies d. Reading/Language Arts
[SKIP to Q8] 7. [Presented to self-contained teachers only] In a typical year, how many weeks do you teach lessons
on each of the following subjects and how many minutes per week are spent on each subject? [Enter each response as a whole number (for example: 36, 150).]
Number of weeks per year Average number of minutes
per week when taught a. Mathematics b. Science c. Social Studies d. Reading/Language Arts
8. [Presented to non-self-contained teachers only]
In a typical week, how many different mathematics classes do you teach? • If you meet with the same class of students multiple times per week, count that class only once. • If you teach the same mathematics course to multiple classes of students, count each class
separately. 1 2 3 4 5 6 7 8 9 10 ○ ○ ○ ○ ○ ○ ○ ○ ○ ○
9. [Presented to non-self-contained teachers only]
For each mathematics class you teach, select the course type and enter the number of students enrolled in the class.
Grades 9-12 Course Type Example Courses Non-college prep mathematics courses
Developmental Math; High School Arithmetic; Remedial Math; General Math; Vocational Math; Consumer Math; Basic Math; Business Math; Career Math; Practical Math; Essential Math; Pre-Algebra; Introductory Algebra; Algebra 1 Part 1; Algebra 1A; Math A; Basic Geometry; Informal Geometry; Practical Geometry
Formal/College-prep Mathematics Level 1 courses
Algebra 1; Integrated Math 1; Unified Math I; Algebra 1 Part 2; Algebra 1B; Math B
Formal/College-prep Mathematics Level 2 courses
Geometry; Plane Geometry; Solid Geometry; Integrated Math 2; Unified Math II; Math C
Formal/College-prep Mathematics Level 3 courses
Algebra 2; Intermediate Algebra; Algebra and Trigonometry; Advanced Algebra; Integrated Math 3; Unified Math III
Formal/College-prep Mathematics Level 4 courses
Algebra 3; Trigonometry; Pre-Calculus; Analytic/Advanced Geometry; Elementary Functions; Integrated Math 4; Unified Math IV; Calculus (not including college level/AP); any other College Prep Senior Math with Algebra 2 as a prerequisite
Mathematics courses that might qualify for college
Advanced Placement Calculus (AB, BC); Advanced Placement Statistics; IB Mathematics standard level; IB Mathematics higher level; concurrent college and high school credit/dual

© Horizon Research, Inc. 3 Mathematics Teacher Questionnaire
credit enrollment
Class Course Type Number of Students
Your 1st mathematics class: Your 2nd mathematics class: … Your Nth mathematics class:
Course Type List
1 Mathematics (Grades K - 5) 2 Remedial Mathematics 6 3 Regular Mathematics 6 4 Accelerated/Pre-Algebra Mathematics 6 5 Remedial Mathematics 7 6 Regular Mathematics 7 7 Accelerated Mathematics 7 8 Remedial Mathematics 8 9 Regular Mathematics 8 10 Accelerated Mathematics 8 11 Algebra 1, Grade 7 or 8 12 Non-college prep mathematics course (Grades 9 - 12) 13 Formal/College-prep Mathematics Level 1 course (Grades 9 - 12) 14 Formal/College-prep Mathematics Level 2 course (Grades 9 - 12) 15 Formal/College-prep Mathematics Level 3 course (Grades 9 - 12) 16 Formal/College-prep Mathematics Level 4 course (Grades 9 - 12) 17 Mathematics course that might qualify for college credit (Grades 9 - 12)
10. [Presented to non-self-contained teachers only]
Later in this questionnaire, we will ask you questions about you’re your randomly selected mathematics class, which you indicated was [course type teacher selected in Q9]. What is your school’s title for this course?
11. Have you been awarded one or more bachelor’s and/or graduate degrees in the following fields?
(With regard to bachelor’s degrees, count only areas in which you majored.) [Select one on each row.]
Yes No a. Education, including mathematics education ○ ○ b. Mathematics ○ ○ c. Computer Science ○ ○ d. Engineering ○ ○ e. Other, please specify.____________ ○ ○
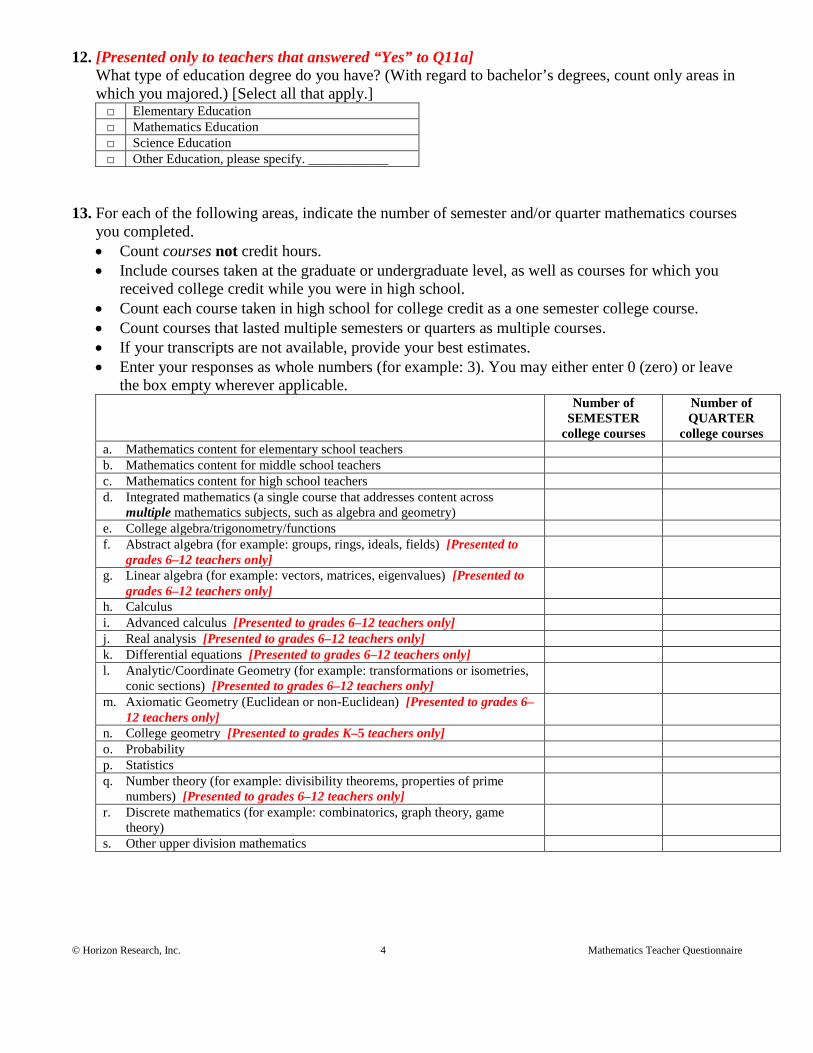
© Horizon Research, Inc. 4 Mathematics Teacher Questionnaire
12. [Presented only to teachers that answered “Yes” to Q11a] What type of education degree do you have? (With regard to bachelor’s degrees, count only areas in which you majored.) [Select all that apply.] □ Elementary Education □ Mathematics Education □ Science Education □ Other Education, please specify. ____________
13. For each of the following areas, indicate the number of semester and/or quarter mathematics courses
you completed. • Count courses not credit hours. • Include courses taken at the graduate or undergraduate level, as well as courses for which you
received college credit while you were in high school. • Count each course taken in high school for college credit as a one semester college course. • Count courses that lasted multiple semesters or quarters as multiple courses. • If your transcripts are not available, provide your best estimates. • Enter your responses as whole numbers (for example: 3). You may either enter 0 (zero) or leave
the box empty wherever applicable. Number of
SEMESTER college courses
Number of QUARTER
college courses a. Mathematics content for elementary school teachers b. Mathematics content for middle school teachers c. Mathematics content for high school teachers d. Integrated mathematics (a single course that addresses content across
multiple mathematics subjects, such as algebra and geometry)
e. College algebra/trigonometry/functions f. Abstract algebra (for example: groups, rings, ideals, fields) [Presented to
grades 6–12 teachers only]
g. Linear algebra (for example: vectors, matrices, eigenvalues) [Presented to grades 6–12 teachers only]
h. Calculus i. Advanced calculus [Presented to grades 6–12 teachers only] j. Real analysis [Presented to grades 6–12 teachers only] k. Differential equations [Presented to grades 6–12 teachers only] l. Analytic/Coordinate Geometry (for example: transformations or isometries,
conic sections) [Presented to grades 6–12 teachers only]
m. Axiomatic Geometry (Euclidean or non-Euclidean) [Presented to grades 6–12 teachers only]
n. College geometry [Presented to grades K–5 teachers only] o. Probability p. Statistics q. Number theory (for example: divisibility theorems, properties of prime
numbers) [Presented to grades 6–12 teachers only]
r. Discrete mathematics (for example: combinatorics, graph theory, game theory)
s. Other upper division mathematics

© Horizon Research, Inc. 5 Mathematics Teacher Questionnaire
14. For each of the following areas, indicate the number of semester and/or quarter courses you completed. • Count courses not credit hours. • Include courses taken at the graduate or undergraduate level, as well as courses for which you
received college credit while you were in high school. • Count each course taken in high school for college credit as a one semester college course. • Count courses that lasted multiple semesters or quarters as multiple courses. • If your transcripts are not available, provide your best estimates. • Enter your responses as whole numbers (for example: 3). You may either enter 0 (zero) or leave
the box empty wherever applicable. Number of SEMESTER
college courses Number of QUARTER
college courses a. Computer science b. Engineering c. Science
15. How many of the undergraduate and graduate level mathematics courses you completed were taken
at each of the following types of institutions? (Please do not include mathematics education courses.) [Enter each response as a whole number (for example: 15).] a. Two-year college, community college, and/or technical school _______ b. Four-year college and/or university _______
16. Which of the following best describes your teacher certification program?
○ An undergraduate program leading to a bachelor’s degree and a teaching credential ○ A post-baccalaureate credentialing program (no master’s degree awarded) ○ A master’s program that also awarded a teaching credential ○ You do not have any formal teacher preparation
17. When did you last participate in professional development (sometimes called in-service education)
focused on mathematics or mathematics teaching? (Include attendance at professional meetings, workshops, and conferences, as well as professional learning communities/lesson studies/teacher study groups. Do not include formal courses for which you received college credit or time spent providing professional development for other teachers.) ○ In the last 3 years
}
○ 4–6 years ago Skip to Q21 ○ 7–10 years ago
○ More than 10 years ago ○ Never
18. In the last 3 years have you… [Select one on each row.]
Yes No a. attended a workshop on mathematics or mathematics teaching? ○ ○ b. attended a national, state, or regional mathematics teacher association meeting? ○ ○ c. participated in a professional learning community/lesson study/teacher study group focused on
mathematics or mathematics teaching? ○ ○

© Horizon Research, Inc. 6 Mathematics Teacher Questionnaire
19. What is the total amount of time you have spent on professional development in mathematics or
mathematics teaching in the last 3 years? (Include attendance at professional meetings, workshops, and conferences, as well as professional learning communities/lesson studies/teacher study groups. Do not include formal courses for which you received college credit or time spent providing professional development for other teachers.) ○ Less than 6 hours ○ 6-15 hours ○ 16-35 hours ○ More than 35 hours
20. Thinking about all of your mathematics-related professional development in the last 3 years, to
what extent does each of the following describe your experiences? [Select one on each row.]
Not at all Somewhat
To a great
extent a. You had opportunities to engage in mathematics investigations. b. You had opportunities to examine classroom artifacts (for example:
student work samples).
c. You had opportunities to try out what you learned in your classroom and then talk about it as part of the professional development.
d. You worked closely with other mathematics teachers from your school.
e. You worked closely with other mathematics teachers who taught the same grade and/or subject whether or not they were from your school.
f. The professional development was a waste of your time. 21. When did you last take a formal course for college credit in each of the following areas? Do not
count courses for which you received only Continuing Education Units. [Select one on each row.] In the last 3
years 4 – 6 years
ago 7 – 10 years
ago More than 10
years ago Never a. Mathematics ○ ○ ○ ○ ○ b. How to teach
mathematics ○ ○ ○ ○ ○ c. Student teaching in
mathematics ○ ○ ○ ○ ○ d. Student teaching in other
subjects ○ ○ ○ ○ ○

© Horizon Research, Inc. 7 Mathematics Teacher Questionnaire
22. [Presented only to teachers that have participated in professional development in the last three years as indicated in Q17, OR took a course in “Mathematics” or “How to teach mathematics” in the last three years as indicated in q21a/b] Considering all the opportunities to learn about mathematics or the teaching of mathematics (professional development and coursework) in the last 3 years, how much was each of the following emphasized? [Select one on each row.]
Not at all Somewhat
To a great
extent a. Deepening your own mathematics content knowledge b. Learning how to use hands-on activities/manipulatives for
mathematics instruction
c. Learning about difficulties that students may have with particular mathematical ideas and procedures
d. Finding out what students think or already know about the key mathematical ideas prior to instruction on those ideas
e. Implementing the mathematics textbook/program to be used in your classroom
f. Planning instruction so students at different levels of achievement can increase their understanding of the ideas targeted in each activity
g. Monitoring student understanding during mathematics instruction h. Providing enrichment experiences for gifted students i. Providing alternative mathematics learning experiences for students
with special needs
j. Teaching mathematics to English-language learners k. Assessing student understanding at the conclusion of instruction on
a topic
23. In the last 3 years have you… [Select one on each row.]
Yes No a. received feedback about your mathematics teaching from a mentor/coach formally assigned by
the school or district/diocese? ○ ○
b. served as a formally assigned mentor/coach for mathematics teaching? (Please do not include supervision of student teachers.) ○ ○
c. supervised a student teacher in your classroom? ○ ○ d. taught in-service workshops on mathematics or mathematics teaching ? ○ ○ e. led a professional learning community/lesson study/teacher study group focused on mathematics
or mathematics teaching? ○ ○

© Horizon Research, Inc. 8 Mathematics Teacher Questionnaire
24. [Presented to self-contained teachers only] Many teachers feel better prepared to teach some subjects/topics than others. How well prepared do you feel to teach each of the following at the grade level(s) you teach, whether or not they are currently included in your teaching responsibilities? [Select one on each row.]
Not adequately
prepared Somewhat prepared
Fairly well prepared
Very well prepared
a. Number and Operations b. Early Algebra c. Geometry d. Measurement and Data
Representation
e. Science f. Reading/Language Arts g. Social Studies
25. [Presented to non-self-contained teachers only]
Within mathematics many teachers feel better prepared to teach some topics than others. How prepared do you feel to teach each of the following topics at the grade level(s) you teach, whether or not they are currently included in your curriculum? [Select one on each row.]
Not adequately prepared
Somewhat prepared
Fairly well prepared
Very well prepared
a. The number system and operations b. Algebraic thinking c. Functions d. Modeling e. Measurement f. Geometry g. Statistics and probability h. Discrete mathematics
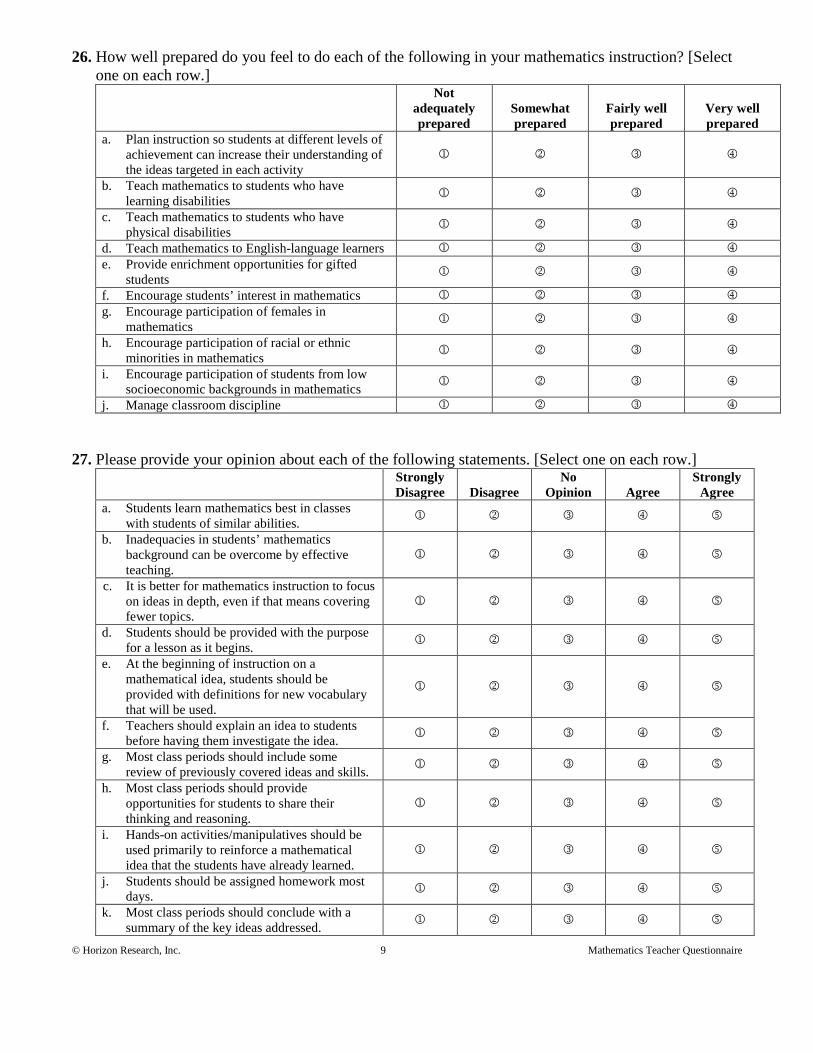
© Horizon Research, Inc. 9 Mathematics Teacher Questionnaire
26. How well prepared do you feel to do each of the following in your mathematics instruction? [Select one on each row.]
Not adequately prepared
Somewhat prepared
Fairly well prepared
Very well prepared
a. Plan instruction so students at different levels of achievement can increase their understanding of the ideas targeted in each activity
b. Teach mathematics to students who have learning disabilities
c. Teach mathematics to students who have physical disabilities
d. Teach mathematics to English-language learners e. Provide enrichment opportunities for gifted
students
f. Encourage students’ interest in mathematics g. Encourage participation of females in
mathematics
h. Encourage participation of racial or ethnic minorities in mathematics
i. Encourage participation of students from low socioeconomic backgrounds in mathematics
j. Manage classroom discipline 27. Please provide your opinion about each of the following statements. [Select one on each row.]
Strongly Disagree Disagree
No Opinion Agree
Strongly Agree
a. Students learn mathematics best in classes with students of similar abilities.
b. Inadequacies in students’ mathematics background can be overcome by effective teaching.
c. It is better for mathematics instruction to focus on ideas in depth, even if that means covering fewer topics.
d. Students should be provided with the purpose for a lesson as it begins.
e. At the beginning of instruction on a mathematical idea, students should be provided with definitions for new vocabulary that will be used.
f. Teachers should explain an idea to students before having them investigate the idea.
g. Most class periods should include some review of previously covered ideas and skills.
h. Most class periods should provide opportunities for students to share their thinking and reasoning.
i. Hands-on activities/manipulatives should be used primarily to reinforce a mathematical idea that the students have already learned.
j. Students should be assigned homework most days.
k. Most class periods should conclude with a summary of the key ideas addressed.

© Horizon Research, Inc. 10 Mathematics Teacher Questionnaire
Section B. Your Mathematics Instruction The rest of this questionnaire is about your mathematics instruction in this class. 28. [Presented to non-self-contained teachers only]
On average, how many minutes per week does this class meet? [Enter your response as a whole number (for example: 300).] _________
29. Enter the number of students for each grade represented in this class. [Enter each response as a
whole number (for example: 15).] Kindergarten 1st grade 2nd grade 3rd grade 4th grade 5th grade 6th grade 7th grade 8th grade 9th grade 10th grade 11th grade 12th grade
30. For the students in this class, indicate the number of males and females in each of the following
categories of race/ethnicity. [Enter each response as a whole number (for example: 15).] Males Females a. American Indian or Alaska Native b. Asian c. Black or African American d. Hispanic/Latino e. Native Hawaiian or Other Pacific Islander f. White g. Two or more races
31. Which of the following best describes the prior mathematics achievement levels of the students in
this class relative to other students in this school? ○ Mostly low achievers ○ Mostly average achievers ○ Mostly high achievers ○ A mixture of levels
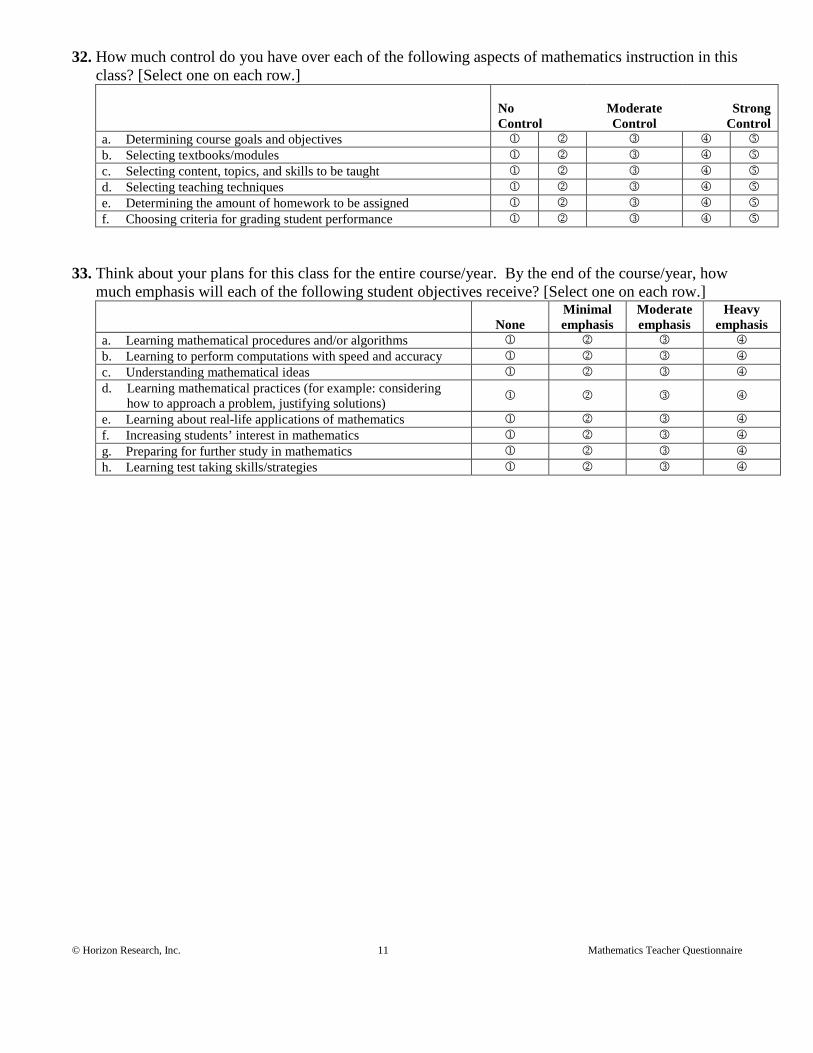
© Horizon Research, Inc. 11 Mathematics Teacher Questionnaire
32. How much control do you have over each of the following aspects of mathematics instruction in this class? [Select one on each row.]
No Control
Moderate Control
Strong
Control a. Determining course goals and objectives b. Selecting textbooks/modules c. Selecting content, topics, and skills to be taught d. Selecting teaching techniques e. Determining the amount of homework to be assigned f. Choosing criteria for grading student performance
33. Think about your plans for this class for the entire course/year. By the end of the course/year, how
much emphasis will each of the following student objectives receive? [Select one on each row.]
None Minimal emphasis
Moderate emphasis
Heavy emphasis
a. Learning mathematical procedures and/or algorithms b. Learning to perform computations with speed and accuracy c. Understanding mathematical ideas d. Learning mathematical practices (for example: considering
how to approach a problem, justifying solutions)
e. Learning about real-life applications of mathematics f. Increasing students’ interest in mathematics g. Preparing for further study in mathematics h. Learning test taking skills/strategies

© Horizon Research, Inc. 12 Mathematics Teacher Questionnaire
34. How often do you do each of the following in your mathematics instruction in this class? [Select one on each row.]
Never
Rarely (for example: a few times a
year)
Sometimes (for example: once or twice
a month)
Often (for example: once or twice a week)
All or almost all
mathematics lessons
a. Explain mathematical ideas to the whole class
b. Engage the whole class in discussions c. Have students work in small groups d. Provide manipulatives for students to use
in problem-solving/investigations
e. Have students read from a mathematics textbook/program or other mathematics-related material in class, either aloud or to themselves
f. Have students consider multiple representations in solving a problem (for example: numbers, tables, graphs, pictures)
g. Have students explain and justify their method for solving a problem
h. Have students compare and contrast different methods for solving a problem
i. Have students develop mathematical proofs
j. Have students present their solution strategies to the rest of the class
k. Have students write their reflections (for example: in their journals) in class or for homework
l. Give tests and/or quizzes that are predominantly short-answer (for example: multiple choice, true/false, fill in the blank)
m. Give tests and/or quizzes that include constructed-response/open-ended items
n. Focus on literacy skills (for example: informational reading or writing strategies)
o. Have students practice for standardized tests
p. Have students attend presentations by guest speakers focused on mathematics in the workplace

© Horizon Research, Inc. 13 Mathematics Teacher Questionnaire
35. Which best describes the availability of each of the following for small group (4-5 students) work in this class? [Select one on each row.]
Do not have one per group
available
At least one per group available
upon request or in another room
At least one per group located in
your classroom
a. Personal computers, including laptops ○ ○ ○ b. Hand-held computers (for example: PDAs, tablets,
smartphones, iPads) ○ ○ ○
c. Internet access ○ ○ ○ d. Four-function calculators ○ ○ ○ e. Scientific calculators ○ ○ ○ f. Graphing calculators ○ ○ ○ g. Probes for collecting data (for example: motion sensors,
temperature probes) ○ ○ ○
h. Classroom response system or "Clickers" (handheld devices used to respond electronically to questions in class) ○ ○ ○
36. For each of the following, are students expected to provide their own for use in this mathematics
class? [Select one on each row.] Yes No a. Laptop computers ○ ○ b. Hand-held computers ○ ○ c. Four-function calculators ○ ○ d. Scientific calculators ○ ○ e. Graphing calculators ○ ○
37. How often do students use each of the following instructional technologies in this mathematics
class? [Select one on each row.]
Never
Rarely (for example: A few times a
year)
Sometimes (for example: once or twice
a month)
Often (for example:
once or twice a week)
All or almost all
mathematics lessons
a. Personal computers, including laptops b. Hand-held computers c. Internet d. Four-function calculators e. Scientific calculators f. Graphing calculators g. Probes for collecting data h. Classroom response system or
“Clickers”

© Horizon Research, Inc. 14 Mathematics Teacher Questionnaire
38. How often are students in this class required to take mathematics tests that you did not develop yourself, for example state assessments or district benchmarks? Do not include Advanced Placement or International Baccalaureate exams or students retaking a test because of failure. ○ Never ○ Once a year ○ Twice a year ○ Three or four times a year ○ Five or more times a year
39. How much mathematics homework do you assign to this class in a typical week? (Do not include time that the class spends getting started on homework during class.) ○ Fewer than 15 minutes per week ○ 15-30 minutes per week ○ 31-60 minutes per week ○ 61-90 minutes per week ○ 91-120 minutes per week ○ 2 to 3 hours per week ○ 3-4 hours per week ○ More than 4 hours per week
40. Which best describes the instructional materials students most frequently use in this class?
○ One commercially-published textbook or program most of the time ○ Multiple commercially-published textbooks/programs most of the time [Skip to Q42] ○ Non-commercially-published instructional materials most of the time [Skip to Q46]
41. Please indicate the title, author, most recent copyright year, and ISBN code of the textbook/program used by the students in this class. • The 10- or 13-character ISBN code can be found on the copyright
page and/or the back cover of your textbook/program. • Do not include the dashes when entering the ISBN. • An example of the location of the ISBN is shown to the right.
Title: First Author: Year: ISBN:
[Skip to Q43]

© Horizon Research, Inc. 15 Mathematics Teacher Questionnaire
42. Please indicate the title, author, most recent copyright year, and ISBN code of the commercially-published textbook/program used most often by the students in this class. • The 10- or 13-character ISBN code can be found on the copyright page and/or the back cover of
your textbook/program. • Do not include the dashes when entering the ISBN. • An example of the location of the ISBN is shown to the right.
Title: First Author: Year: ISBN:
43. How would you rate the overall quality of this textbook/program?
○ Very poor ○ Poor ○ Fair ○ Good ○ Very good ○ Excellent
44. [Presented only to teachers who indicated using one commercially-published textbook/program in
Q40] Over the course of the school year, approximately what percentage of the mathematics instructional time will students in this class spend using this textbook/program? ○ Less than 25% ○ 25-49% ○ 50-74% ○ 75-90% ○ More than 90%
45. [Presented only to teachers who indicated using one commercially-published textbook/program in
Q40] Approximately what percentage of the chapters/units in this textbook/program will students in this class engage with during the school year? ○ Less than 25% ○ 25-49% ○ 50-74% ○ 75-90% ○ More than 90%

© Horizon Research, Inc. 16 Mathematics Teacher Questionnaire
46. Mathematics courses may benefit from the availability of particular resources. Considering what you have available, how adequate is each of the following for teaching this mathematics class? [Select one on each row.]
Not Adequate
Somewhat Adequate Adequate
a. Instructional technology (for example: calculators, computers, probes/sensors)
b. Measurement tools (for example: protractors, rulers)
c. Manipulatives (for example: pattern blocks, algebra tiles)
d. Consumable supplies (for example: graphing paper, batteries)
47. In your opinion, how great a problem is each of the following for your mathematics instruction in
this class? [Select one on each row.]
Not a significant problem
Somewhat of a problem
Serious problem
a. Lack of access to computers ○ ○ ○ b. Old age of computers ○ ○ ○ c. Lack of access to the Internet ○ ○ ○ d. Unreliability of the Internet connection ○ ○ ○ e. Slow speed of the Internet connection ○ ○ ○ f. Lack of availability of appropriate computer software ○ ○ ○ g. Lack of availability of technology support ○ ○ ○
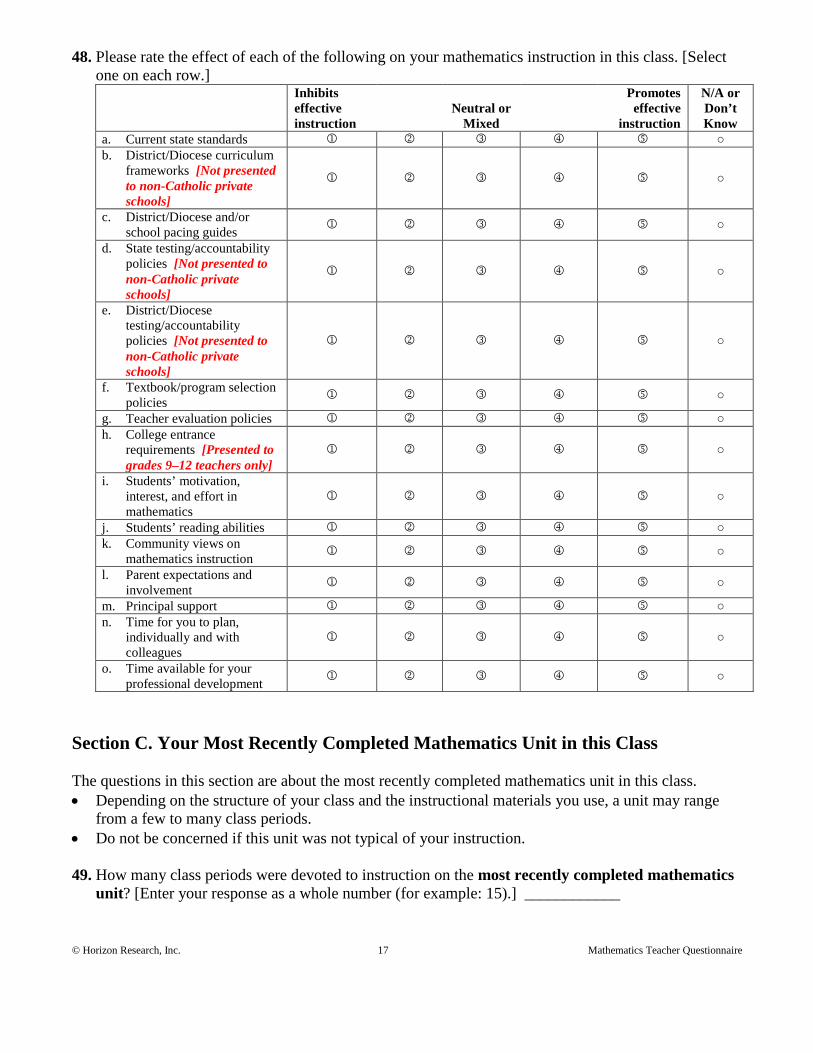
© Horizon Research, Inc. 17 Mathematics Teacher Questionnaire
48. Please rate the effect of each of the following on your mathematics instruction in this class. [Select one on each row.]
Inhibits effective instruction
Neutral or Mixed
Promotes effective
instruction
N/A or Don’t Know
a. Current state standards ○ b. District/Diocese curriculum
frameworks [Not presented to non-Catholic private schools]
○
c. District/Diocese and/or school pacing guides ○
d. State testing/accountability policies [Not presented to non-Catholic private schools]
○
e. District/Diocese testing/accountability policies [Not presented to non-Catholic private schools]
○
f. Textbook/program selection policies ○
g. Teacher evaluation policies ○ h. College entrance
requirements [Presented to grades 9–12 teachers only]
○
i. Students’ motivation, interest, and effort in mathematics
○
j. Students’ reading abilities ○ k. Community views on
mathematics instruction ○
l. Parent expectations and involvement ○
m. Principal support ○ n. Time for you to plan,
individually and with colleagues
○
o. Time available for your professional development ○
Section C. Your Most Recently Completed Mathematics Unit in this Class The questions in this section are about the most recently completed mathematics unit in this class. • Depending on the structure of your class and the instructional materials you use, a unit may range
from a few to many class periods. • Do not be concerned if this unit was not typical of your instruction. 49. How many class periods were devoted to instruction on the most recently completed mathematics
unit? [Enter your response as a whole number (for example: 15).] ____________

© Horizon Research, Inc. 18 Mathematics Teacher Questionnaire
50. Which of the following best describes the content focus of this unit? ○ Number and Operations ○ Measurement and Data
Representation ○ Algebra ○ Geometry ○ Probability ○ Statistics ○ Trigonometry ○ Calculus
51. What mathematical ideas and/or skills were addressed in this unit?
52. [Presented only to teachers who indicated using commercially-published textbooks/programs in
Q40] Was this unit based primarily on the commercially-published textbook/program you described earlier as the one most used in this class? ○ Yes [Skip to Q55] ○ No
53. Was this unit based on a commercially-published textbook/program?
○ Yes ○ No [Skip to Q59]
54. Please indicate the title, author, most recent copyright year, and ISBN code of that textbook/
program. • The 10- or 13-character ISBN code can be found on the copyright
page and/or the back cover of the textbook/module. • Do not include the dashes when entering the ISBN. • An example of the location of the ISBN is shown to the right.
Title:
First Author: Year: ISBN:

© Horizon Research, Inc. 19 Mathematics Teacher Questionnaire
55. Please indicate the extent to which you did each of the following while teaching this unit. [Select one on each row.]
Not at all Somewhat
To a great
extent a. You used the textbook/program to guide the
overall structure and content emphasis of the unit.
b. You followed the textbook/program to guide the detailed structure and content emphasis of the unit.
c. You picked what is important from the textbook/program and skipped the rest.
d. You incorporated activities (for example: problems, investigations, readings) from other sources to supplement what the textbook/program was lacking.
56. [Presented only to teachers who answered “2–5” in Q55c]
During this unit, when you skipped activities (for example: problems, investigations, readings) in your textbook/program, how much was each of the following a factor in your decisions? [Select one on each row.]
Not a factor
A minor factor
A major factor
a. The mathematical ideas addressed in the activities you skipped are not included in your pacing guide and/or current state standards.
b. You did not have the materials needed to implement the activities you skipped.
c. The activities you skipped were too difficult for your students. d. Your students already knew the mathematical ideas or were able to
learn them without the activities you skipped.
e. You have different activities for those mathematical ideas that work better than the ones you skipped.
57. [Presented only to teachers who answered “2–5” in Q55d] During this unit, when you supplemented the textbook/program with additional activities, how much was each of the following a factor in your decisions? [Select one on each row.]
Not a factor
A minor factor
A major factor
a. Your pacing guide indicated that you should use supplemental activities.
b. Supplemental activities were needed to prepare students for standardized tests.
c. Supplemental activities were needed to provide students with additional practice.
d. Supplemental activities were needed so students at different levels of achievement could increase their understanding of the ideas targeted in each activity.
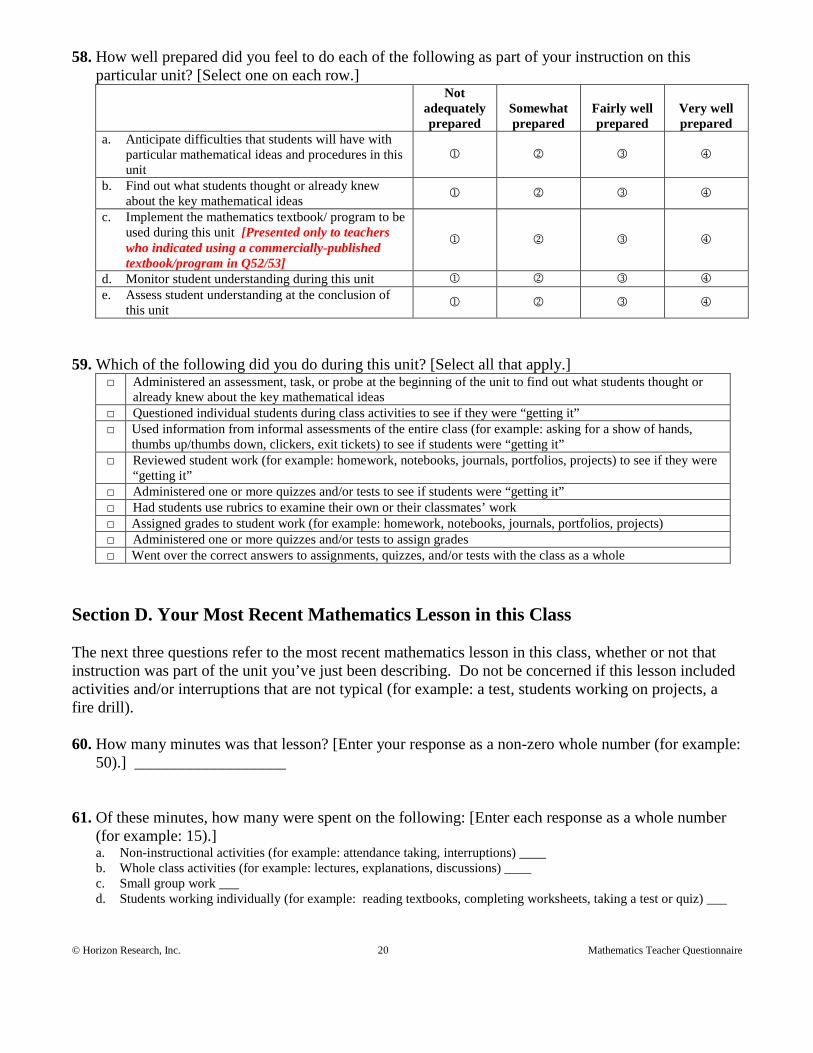
© Horizon Research, Inc. 20 Mathematics Teacher Questionnaire
58. How well prepared did you feel to do each of the following as part of your instruction on this particular unit? [Select one on each row.]
Not adequately prepared
Somewhat prepared
Fairly well prepared
Very well prepared
a. Anticipate difficulties that students will have with particular mathematical ideas and procedures in this unit
b. Find out what students thought or already knew about the key mathematical ideas
c. Implement the mathematics textbook/ program to be used during this unit [Presented only to teachers who indicated using a commercially-published textbook/program in Q52/53]
d. Monitor student understanding during this unit e. Assess student understanding at the conclusion of
this unit
59. Which of the following did you do during this unit? [Select all that apply.] □ Administered an assessment, task, or probe at the beginning of the unit to find out what students thought or
already knew about the key mathematical ideas □ Questioned individual students during class activities to see if they were “getting it” □ Used information from informal assessments of the entire class (for example: asking for a show of hands,
thumbs up/thumbs down, clickers, exit tickets) to see if students were “getting it” □ Reviewed student work (for example: homework, notebooks, journals, portfolios, projects) to see if they were
“getting it” □ Administered one or more quizzes and/or tests to see if students were “getting it” □ Had students use rubrics to examine their own or their classmates’ work □ Assigned grades to student work (for example: homework, notebooks, journals, portfolios, projects) □ Administered one or more quizzes and/or tests to assign grades □ Went over the correct answers to assignments, quizzes, and/or tests with the class as a whole
Section D. Your Most Recent Mathematics Lesson in this Class The next three questions refer to the most recent mathematics lesson in this class, whether or not that instruction was part of the unit you’ve just been describing. Do not be concerned if this lesson included activities and/or interruptions that are not typical (for example: a test, students working on projects, a fire drill).
60. How many minutes was that lesson? [Enter your response as a non-zero whole number (for example:
50).] ___________________
61. Of these minutes, how many were spent on the following: [Enter each response as a whole number
(for example: 15).] a. Non-instructional activities (for example: attendance taking, interruptions) ____ b. Whole class activities (for example: lectures, explanations, discussions) ____ c. Small group work ___ d. Students working individually (for example: reading textbooks, completing worksheets, taking a test or quiz) ___
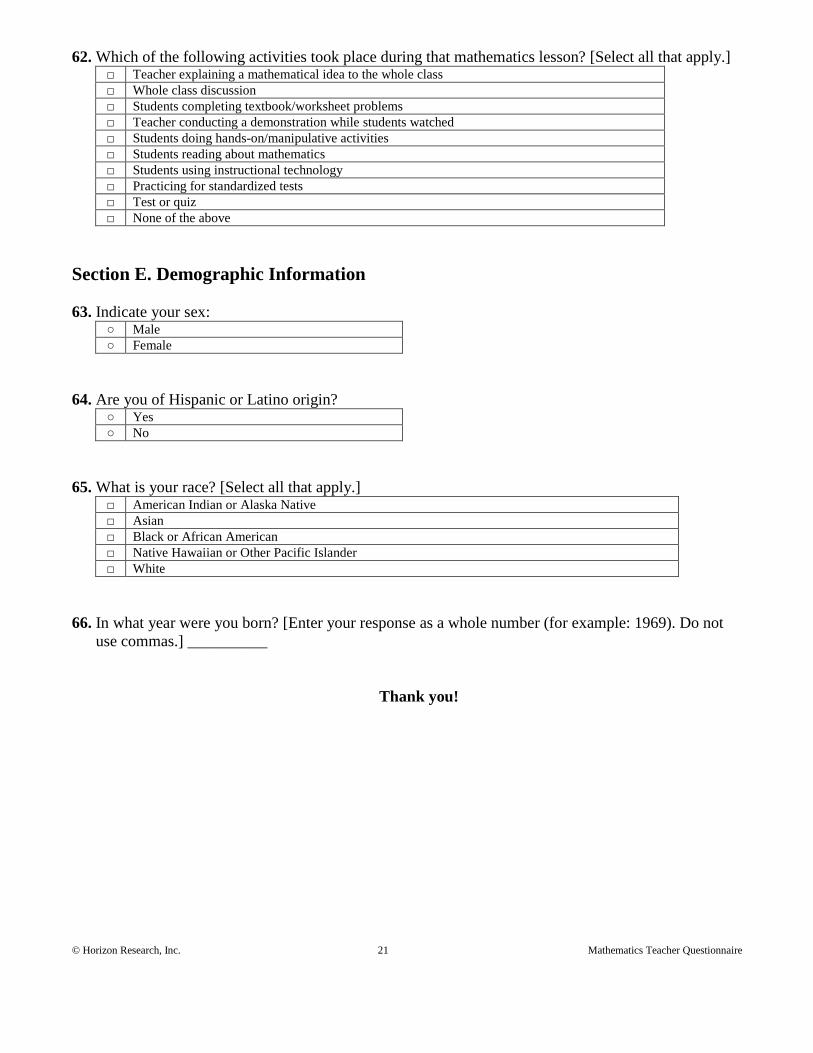
© Horizon Research, Inc. 21 Mathematics Teacher Questionnaire
62. Which of the following activities took place during that mathematics lesson? [Select all that apply.] □ Teacher explaining a mathematical idea to the whole class □ Whole class discussion □ Students completing textbook/worksheet problems □ Teacher conducting a demonstration while students watched □ Students doing hands-on/manipulative activities □ Students reading about mathematics □ Students using instructional technology □ Practicing for standardized tests □ Test or quiz □ None of the above
Section E. Demographic Information 63. Indicate your sex:
○ Male ○ Female
64. Are you of Hispanic or Latino origin?
○ Yes ○ No
65. What is your race? [Select all that apply.]
□ American Indian or Alaska Native □ Asian □ Black or African American □ Native Hawaiian or Other Pacific Islander □ White
66. In what year were you born? [Enter your response as a whole number (for example: 1969). Do not
use commas.] __________
Thank you!

Horizon Research, Inc. February 2013
Horizon Research, Inc. February 2013
APPENDIX C
Pre-Data Collection Communication
State Chief Letter
District Superintendent Letter
Principal Letter
Study Description
How to Designate a School Coordinator
E-mail Message to School Coordinator
Teacher Listing Form
Teacher Listing Form Instructions
School Coordinator Questionnaire
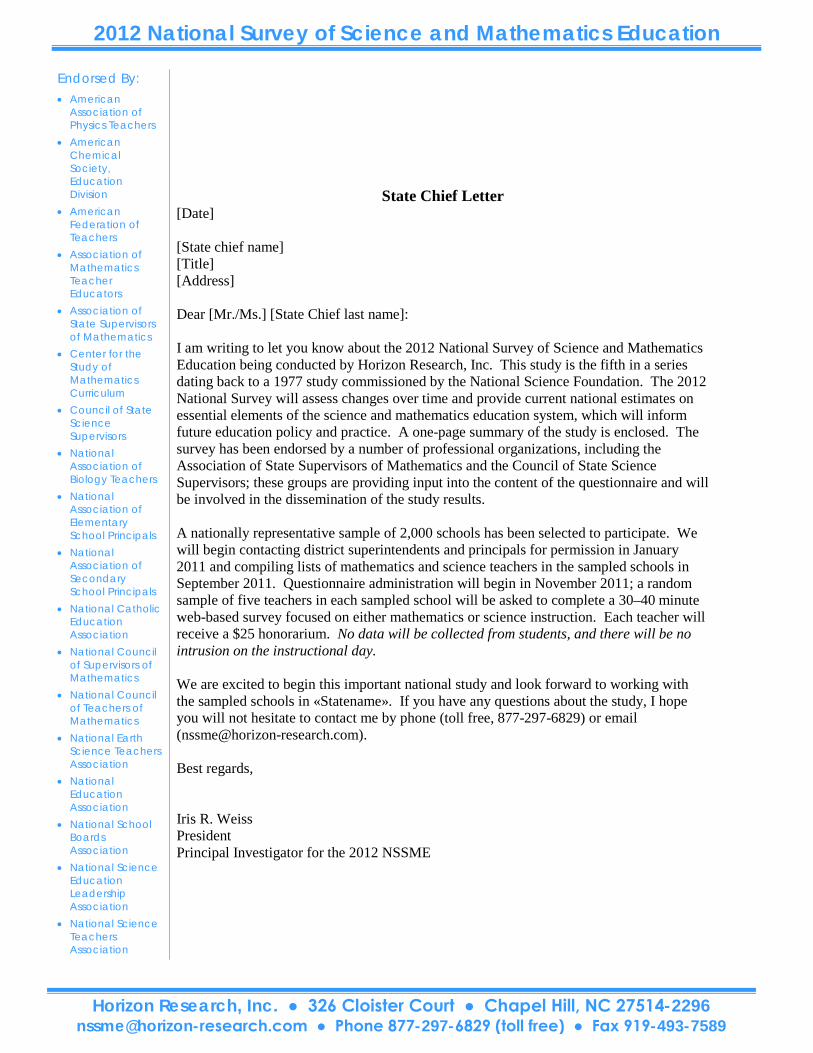
Horizon Research, Inc. ● 326 Cloister Court ● Chapel Hill, NC 27514-2296 [email protected] ● Phone 877-297-6829 (toll free) ● Fax 919-493-7589
2012 National Survey of Science and Mathematics Education State Chief Letter
Endorsed By:
• American Association of Physics Teachers
• American Chemical Society, Education Division
• American Federation of Teachers
• Association of Mathematics Teacher Educators
• Association of State Supervisors of Mathematics
• Center for the Study of Mathematics Curriculum
• Council of State Science Supervisors
• National Association of Biology Teachers
• National Association of Elementary School Principals
• National Association of Secondary School Principals
• National Catholic Education Association
• National Council of Supervisors of Mathematics
• National Council of Teachers of Mathematics
• National Earth Science Teachers Association
• National Education Association
• National School Boards Association
• National Science Education Leadership Association
• National Science Teachers Association
State Chief Letter
[Date] [State chief name] [Title] [Address] Dear [Mr./Ms.] [State Chief last name]: I am writing to let you know about the 2012 National Survey of Science and Mathematics Education being conducted by Horizon Research, Inc. This study is the fifth in a series dating back to a 1977 study commissioned by the National Science Foundation. The 2012 National Survey will assess changes over time and provide current national estimates on essential elements of the science and mathematics education system, which will inform future education policy and practice. A one-page summary of the study is enclosed. The survey has been endorsed by a number of professional organizations, including the Association of State Supervisors of Mathematics and the Council of State Science Supervisors; these groups are providing input into the content of the questionnaire and will be involved in the dissemination of the study results. A nationally representative sample of 2,000 schools has been selected to participate. We will begin contacting district superintendents and principals for permission in January 2011 and compiling lists of mathematics and science teachers in the sampled schools in September 2011. Questionnaire administration will begin in November 2011; a random sample of five teachers in each sampled school will be asked to complete a 30–40 minute web-based survey focused on either mathematics or science instruction. Each teacher will receive a $25 honorarium. No data will be collected from students, and there will be no intrusion on the instructional day. We are excited to begin this important national study and look forward to working with the sampled schools in «Statename». If you have any questions about the study, I hope you will not hesitate to contact me by phone (toll free, 877-297-6829) or email ([email protected]). Best regards, Iris R. Weiss President Principal Investigator for the 2012 NSSME

Horizon Research, Inc. ● 326 Cloister Court ● Chapel Hill, NC 27514-2296 [email protected] ● Phone 877-297-6829 (toll free) ● Fax 919-493-7589
2012 National Survey of Science and Mathematics Education
District Superintendent LetterEndorsed By:
• American Association of Physics Teachers
• American Chemical Society, Education Division
• American Federation of Teachers
• Association of Mathematics Teacher Educators
• Association of State Supervisors of Mathematics
• Center for the Study of Mathematics Curriculum
• Council of State Science Supervisors
• National Association of Biology Teachers
• National Association of Elementary School Principals
• National Association of Secondary School Principals
• National Catholic Education Association
• National Council of Supervisors of Mathematics
• National Council of Teachers of Mathematics
• National Earth Science Teachers Association
• National Education Association
• National School Boards Association
• National Science Education Leadership Association
• National Science Teachers Association
District Superintendent Letter [Date] [Superintendent name] [Professional Title] [District name] [District address] Dear [Mr./Ms.] [principal last name] (or current Superintendent): I am writing to inform you about the 2012 National Survey of Science and Mathematics Education being conducted by Horizon Research, Inc. This study is the fifth in a series dating back to a 1977 study commissioned by the National Science Foundation. The 2012 National Survey will assess change over time and provide current data on essential elements of the science and mathematics education system, which will inform future education policy and practice. A one-page summary of the study is enclosed. A nationally representative sample of approximately 2,000 schools has been selected to participate, including the school(s) in [District Name] listed on the enclosed page. We plan to begin contacting school principals in the coming weeks and compiling lists of mathematics and science teachers in the sampled schools in September 2011. We will randomly sample approximately five teachers from each school. Data collection with teachers will begin in December 2011. We want to assure you that no data will be collected from students, and there will be no intrusion on the instructional day. Each teacher will receive a $25 honorarium for completing the questionnaire. We are excited to begin this important national study and look forward to working with the sampled schools in [District Name]. If you have any questions about the study, please call [Staff Assigned] (toll free, 877-297-6829) or email ([email protected]). Best regards, Kiira Campbell Research Associate 2012 National Survey of Science and Mathematics Education

Horizon Research, Inc. ● 326 Cloister Court ● Chapel Hill, NC 27514-2296 [email protected] ● Phone 877-297-6829 (toll free) ● Fax 919-493-7589
Principal Letter
Endorsed By:
• American Association of Physics Teachers
• American Chemical Society, Education Division
• American Federation of Teachers
• Association of Mathematics Teacher Educators
• Association of State Supervisors of Mathematics
• Center for the Study of Mathematics Curriculum
• Council of State Science Supervisors
• National Association of Biology Teachers
• National Association of Elementary School Principals
• National Association of Secondary School Principals
• National Catholic Education Association
• National Council of Supervisors of Mathematics
• National Council of Teachers of Mathematics
• National Earth Science Teachers Association
• National Education Association
• National School Boards Association
• National Science Education Leadership Association
• National Science Teachers Association
Principal Letter [Date] [principal name] Principal [school name] [school address] Dear [Mr./Ms.] [principal last name] (or current Principal): I am writing to let you know that [school name] has been randomly selected to participate in the 2012 National Survey of Science and Mathematics Education (NSSME). A total of 2,000 public and private schools and 10,000 K–12 teachers throughout the United States will be involved in the study. The 2012 NSSME is the fifth in a series of surveys dating back to a 1977 study commissioned by the National Science Foundation. The 2012 NSSME, conducted by Horizon Research, Inc. under the direction of Dr. Iris Weiss, will assess changes over time and provide current data on essential elements of the science and mathematics education system. A one-page summary of the study is enclosed. We have designed the study to strictly avoid intrusions on the instructional day and to place minimal burden on principals and teachers. In addition, no data will be collected from students. Approximately five teachers per school will be asked to complete a web-based questionnaire, which we anticipate will take 30–40 minutes. (Teachers will have the option of requesting a paper-and-pencil version of the questionnaire.) Each teacher will receive a $25 honorarium for completing the survey. At this time, we are asking you to designate a school coordinator, who will receive a stipend of up to $200 to provide a list of science and mathematics teachers and facilitate communication with sampled teachers during the data collection phase of the study. (See instructions for designating a coordinator on the enclosed page.) In September 2011, we will ask the coordinator to list all teachers at the school whose assignment includes mathematics or science. Using this list, we will randomly select teachers to complete the questionnaire. In November 2011, we will begin administering the web-based questionnaires. Your participation is voluntary, but very important and greatly appreciated. If you have any questions about the study, please call me (toll free, 877-297-6829) or email ([email protected]). Sincerely, Kiira Campbell Research Associate Enc.
2012 National Survey of Science and Mathematics Education

2012 National Survey of Science and Mathematics Education Study Description
In response to numerous requests for information regarding the status of science and mathematics education in the United States, Horizon Research, Inc. is conducting the 2012 National Survey of Science and Mathematics Education (NSSME). This study is the fifth in a series of surveys dating back to a 1977 study commissioned by the National Science Foundation. The 2012 NSSME will assess changes over time and provide current data on essential elements of the science and mathematics education system that will inform future education policy and practice. Focus of the Study The study will address the following research questions:
1. To what extent do science and mathematics instruction and ongoing assessment mirror current understanding of learning?
2. What influences teachers’ decisions about content and pedagogy? 3. What are the characteristics of the mathematics/science teaching force in terms of race, gender,
age, content background, beliefs about teaching and learning, and perceptions of preparedness? 4. What are the most commonly used textbooks/programs, and how are they used? 5. What formal and informal opportunities do mathematics/science teachers have for ongoing
development of their knowledge and skills? 6. How are resources for mathematics/science education, including well-prepared teachers and
course offerings, distributed among schools in different types of communities and different socioeconomic levels?
In order to answer these questions, the study will collect survey information on teacher content background and demographics, textbook/program usage; science and mathematics course offerings and enrollments, instructional strategies, formative assessment, and the influences of particular policies such as the No Child Left Behind legislation on science and mathematics education. No information that would identify a teacher, school, district, or state will be released or reported. Minimal Burden on Principals and Teachers We have designed the study to avoid intrusions on the instructional day and to place minimal burden on principals and teachers; no data will be collected from students. Principals will designate a school coordinator, who will receive a stipend of up to $200 to provide lists of teachers, facilitate communication during the data collection phase of the study, and identify individuals to complete program-level questionnaires for science and mathematics. Teachers (approximately five per school) will be asked to fill out a web-based questionnaire, which we anticipate will take most teachers 30–40 minutes to complete. They will have the option of requesting a paper-and-pencil version of the questionnaire. Each teacher will receive a $25 stipend for completing the survey. Timeline Contact with schools will begin in February 2011, and teacher data collection will take place from September 2011 to May 2012. Benefit to Science and Mathematics Education The 2012 NSSME will help monitor trends in key areas, collect data on emerging policy issues, determine how science and mathematics teachers compare to teachers overall, and delve deeper in selected areas such as the nature of instruction. The results of the study will inform policy, programmatic decisions, and future education research. In order to reach a broad audience, survey findings will be disseminated through technical reports, research journals, and publications aimed at education practitioners and policy makers.
How to Designate a School Coordinator [school name]
After you have designated a school coordinator for the 2012 National Survey of Science and Mathematics Education (NSSME) and confirmed his or her willingness to serve in this capacity, please visit the following website to provide the individual’s contact information:
www.nssme.org The site will prompt you for a username and password.
Username: [username] Password: [password]
If you have problems accessing the site or completing the form, please call me (toll free, 877-297-6829 ext.) or email ([email protected]). Thank you for participating in the 2012 National Survey of Science and Mathematics Education!
E-mail Message to School Coordinator Dear [title] [lastname]: As you may recall, [school name] was selected to participate in the 2012 National Survey of Science and Mathematics Education (NSSME). You can read about the study at www.horizon-research.com/2012nssme. Please print this email message and keep it handy, as it includes several important details about the study. According to our records, you were designated as the school coordinator for the study. Coordinators will receive up to $200 for providing information about the school and for facilitating communication with teachers. This honorarium will come to you in several installments. Within the next two weeks, we ask that you do three things: 1) provide a list of all the teachers in your school who teach mathematics, science, and/or engineering (We will use this list to randomly sample approximately five teachers to complete the teacher questionnaire later in the school year.); 2) designate individuals to complete the Mathematics Program Questionnaire and the Science Program Questionnaire; and 3) complete a brief questionnaire about the school. We will send you a check for $100 (the first installment of your honorarium) within four weeks of completing these three tasks. The form for providing this information is online. To access this form and instructions for completing it, please click the link below or copy and paste it into your web browser. Please make note of your user name and password (password is case-sensitive). www.nssme.org user name: [username] password: [password] Sampled teachers will receive a $25 honorarium for completing the teacher questionnaire. We will ask you to communicate with teachers and encourage them to respond to the questionnaire. At the conclusion of data collection, you will receive $10 for each completed teacher questionnaire. Individuals who complete the Mathematics and/or Science Program Questionnaires will receive a $15 honorarium, and you will receive an additional $10 for each of these completed questionnaires. I hope you will not hesitate to contact me by email [staff email address] or by phone Monday through Friday between 8:30 AM and 5:00 PM EST (toll free, 877-297-6829). I look forward to working with you on this important national study. [staff name]
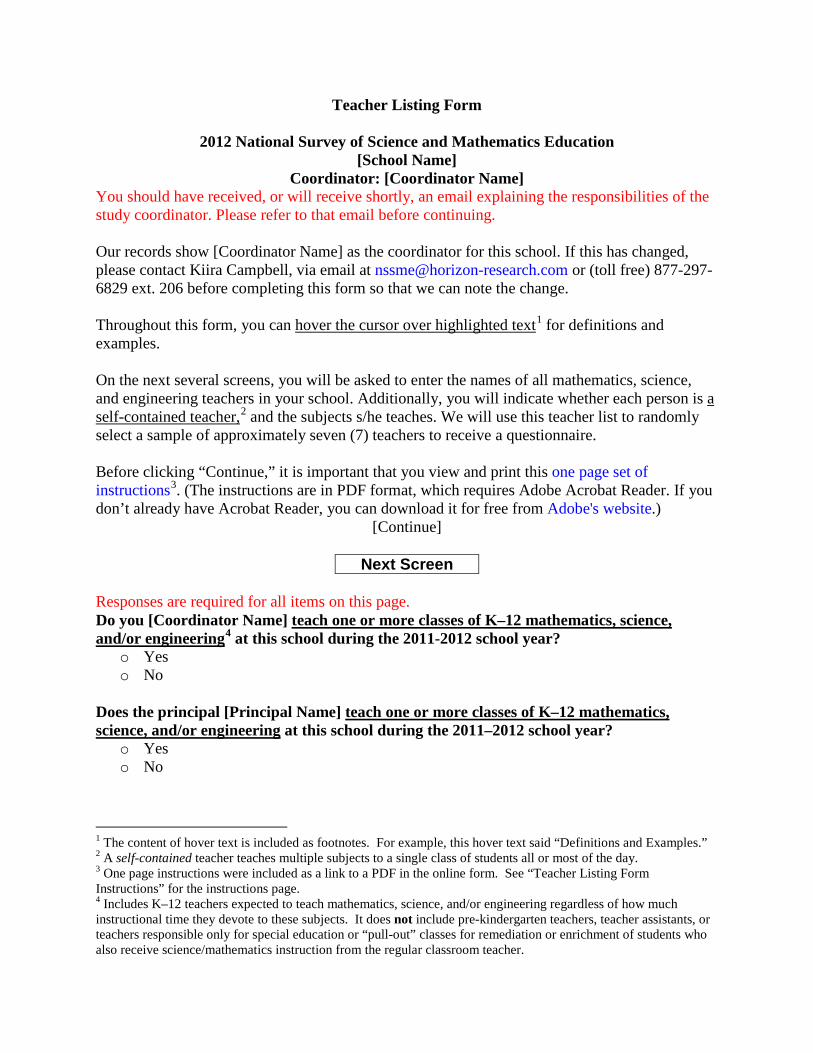
Teacher Listing Form
2012 National Survey of Science and Mathematics Education [School Name]
Coordinator: [Coordinator Name] You should have received, or will receive shortly, an email explaining the responsibilities of the study coordinator. Please refer to that email before continuing. Our records show [Coordinator Name] as the coordinator for this school. If this has changed, please contact Kiira Campbell, via email at [email protected] or (toll free) 877-297-6829 ext. 206 before completing this form so that we can note the change. Throughout this form, you can hover the cursor over highlighted text1 for definitions and examples. On the next several screens, you will be asked to enter the names of all mathematics, science, and engineering teachers in your school. Additionally, you will indicate whether each person is a self-contained teacher,2 and the subjects s/he teaches. We will use this teacher list to randomly select a sample of approximately seven (7) teachers to receive a questionnaire. Before clicking “Continue,” it is important that you view and print this one page set of instructions3. (The instructions are in PDF format, which requires Adobe Acrobat Reader. If you don’t already have Acrobat Reader, you can download it for free from Adobe's website.)
[Continue]
Next Screen
Responses are required for all items on this page. Do you [Coordinator Name] teach one or more classes of K–12 mathematics, science, and/or engineering4 at this school during the 2011-2012 school year?
o Yes o No
Does the principal [Principal Name] teach one or more classes of K–12 mathematics, science, and/or engineering at this school during the 2011–2012 school year?
o Yes o No
1 The content of hover text is included as footnotes. For example, this hover text said “Definitions and Examples.” 2 A self-contained teacher teaches multiple subjects to a single class of students all or most of the day. 3 One page instructions were included as a link to a PDF in the online form. See “Teacher Listing Form Instructions” for the instructions page. 4 Includes K–12 teachers expected to teach mathematics, science, and/or engineering regardless of how much instructional time they devote to these subjects. It does not include pre-kindergarten teachers, teacher assistants, or teachers responsible only for special education or “pull-out” classes for remediation or enrichment of students who also receive science/mathematics instruction from the regular classroom teacher.
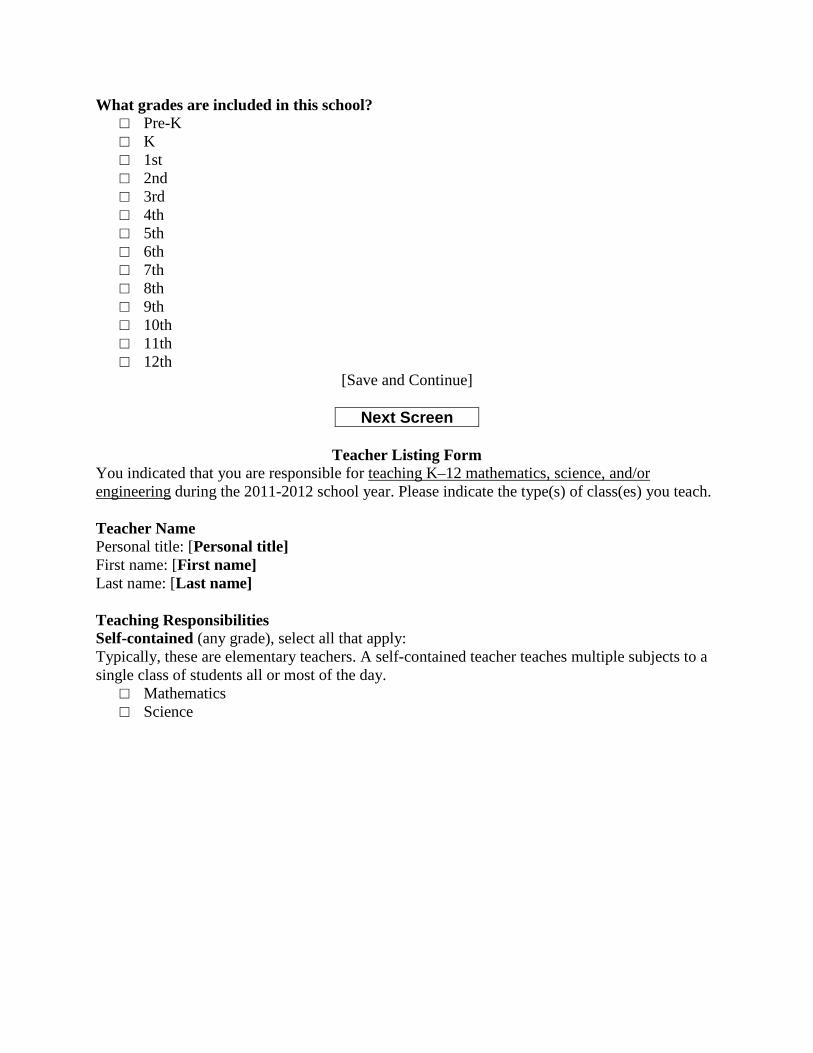
What grades are included in this school? □ Pre-K □ K □ 1st □ 2nd □ 3rd □ 4th □ 5th □ 6th □ 7th □ 8th □ 9th □ 10th □ 11th □ 12th
[Save and Continue]
Next Screen
Teacher Listing Form You indicated that you are responsible for teaching K–12 mathematics, science, and/or engineering during the 2011-2012 school year. Please indicate the type(s) of class(es) you teach. Teacher Name Personal title: [Personal title] First name: [First name] Last name: [Last name] Teaching Responsibilities Self-contained (any grade), select all that apply: Typically, these are elementary teachers. A self-contained teacher teaches multiple subjects to a single class of students all or most of the day.
□ Mathematics □ Science
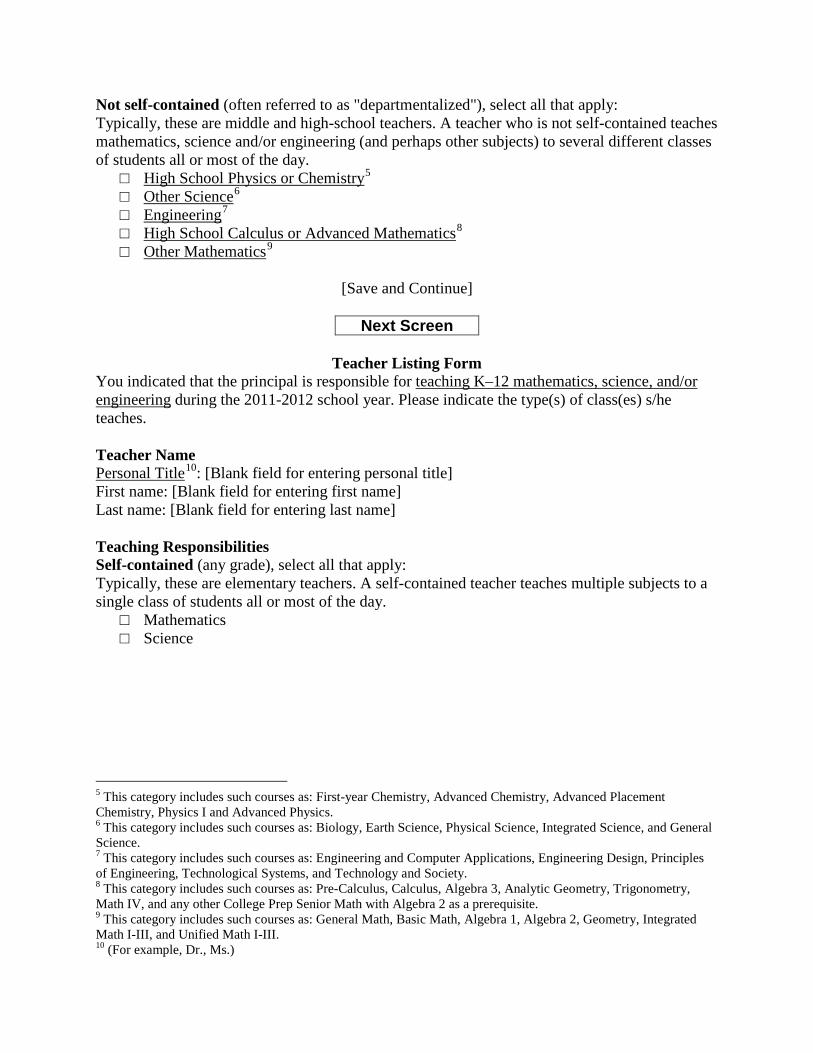
Not self-contained (often referred to as "departmentalized"), select all that apply: Typically, these are middle and high-school teachers. A teacher who is not self-contained teaches mathematics, science and/or engineering (and perhaps other subjects) to several different classes of students all or most of the day.
□ High School Physics or Chemistry5 □ Other Science6 □ Engineering7 □ High School Calculus or Advanced Mathematics8 □ Other Mathematics9
[Save and Continue]
Next Screen
Teacher Listing Form
You indicated that the principal is responsible for teaching K–12 mathematics, science, and/or engineering during the 2011-2012 school year. Please indicate the type(s) of class(es) s/he teaches. Teacher Name Personal Title10: [Blank field for entering personal title] First name: [Blank field for entering first name] Last name: [Blank field for entering last name] Teaching Responsibilities Self-contained (any grade), select all that apply: Typically, these are elementary teachers. A self-contained teacher teaches multiple subjects to a single class of students all or most of the day.
□ Mathematics □ Science
5 This category includes such courses as: First-year Chemistry, Advanced Chemistry, Advanced Placement Chemistry, Physics I and Advanced Physics. 6 This category includes such courses as: Biology, Earth Science, Physical Science, Integrated Science, and General Science. 7 This category includes such courses as: Engineering and Computer Applications, Engineering Design, Principles of Engineering, Technological Systems, and Technology and Society. 8 This category includes such courses as: Pre-Calculus, Calculus, Algebra 3, Analytic Geometry, Trigonometry, Math IV, and any other College Prep Senior Math with Algebra 2 as a prerequisite. 9 This category includes such courses as: General Math, Basic Math, Algebra 1, Algebra 2, Geometry, Integrated Math I-III, and Unified Math I-III. 10 (For example, Dr., Ms.)
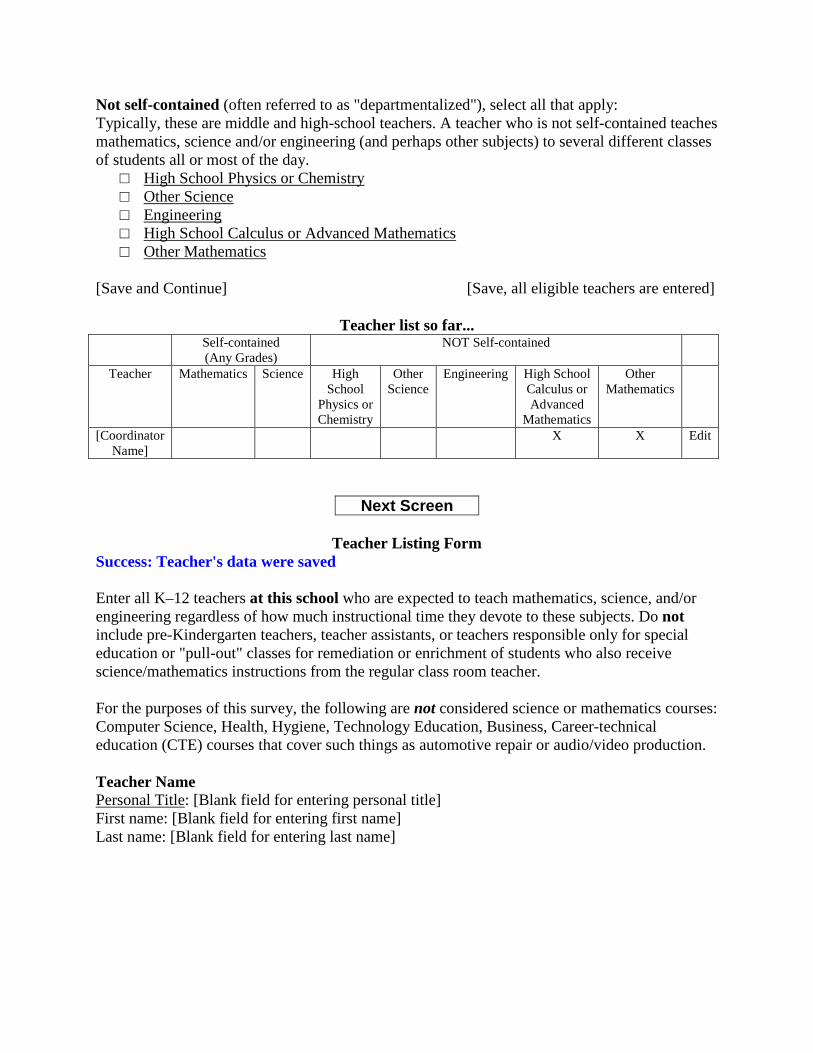
Not self-contained (often referred to as "departmentalized"), select all that apply: Typically, these are middle and high-school teachers. A teacher who is not self-contained teaches mathematics, science and/or engineering (and perhaps other subjects) to several different classes of students all or most of the day.
□ High School Physics or Chemistry □ Other Science □ Engineering □ High School Calculus or Advanced Mathematics □ Other Mathematics
[Save and Continue] [Save, all eligible teachers are entered]
Teacher list so far... Self-contained
(Any Grades) NOT Self-contained
Teacher Mathematics Science High School
Physics or Chemistry
Other Science
Engineering High School Calculus or Advanced
Mathematics
Other Mathematics
[Coordinator Name]
X X Edit
Next Screen
Teacher Listing Form Success: Teacher's data were saved Enter all K–12 teachers at this school who are expected to teach mathematics, science, and/or engineering regardless of how much instructional time they devote to these subjects. Do not include pre-Kindergarten teachers, teacher assistants, or teachers responsible only for special education or "pull-out" classes for remediation or enrichment of students who also receive science/mathematics instructions from the regular class room teacher. For the purposes of this survey, the following are not considered science or mathematics courses: Computer Science, Health, Hygiene, Technology Education, Business, Career-technical education (CTE) courses that cover such things as automotive repair or audio/video production. Teacher Name Personal Title: [Blank field for entering personal title] First name: [Blank field for entering first name] Last name: [Blank field for entering last name]

Teaching Responsibilities Self-contained (any grade), select all that apply: Typically, these are elementary teachers. A self-contained teacher teaches multiple subjects to a single class of students all or most of the day.
□ Mathematics □ Science
Not self-contained (often referred to as "departmentalized"), select all that apply: Typically, these are middle and high-school teachers. A teacher who is not self-contained teaches mathematics, science and/or engineering (and perhaps other subjects) to several different classes of students all or most of the day.
□ High School Physics or Chemistry □ Other Science □ Engineering □ High School Calculus or Advanced Mathematics □ Other Mathematics
[Save and Continue] [Save, all eligible teachers are entered]
Teacher list so far... Self-contained
(Any Grades) NOT Self-contained
Teacher Mathematics Science High School
Physics or Chemistry
Other Science
Engineering High School Calculus or Advanced
Mathematics
Other Mathematics
[Coordinator Name]
X X Edit
[Principal Name]
X X Edit
Next Screen
Teacher Listing Form Review and Confirm You provided information for [Number of teachers] teacher(s) including yourself. Please review. If the list is correct and complete, click "List is correct. Continue." If you need to make corrections, click "Make corrections".

Self-contained (Any Grades)
NOT Self-contained
Teacher Mathematics Science High School
Physics or Chemistry
Other Science
Engineering High School Calculus or Advanced
Mathematics
Other Mathematics
[Coordinator Name]
X X Edit
[Principal Name]
X X Edit
[Teacher 1] X Edit Delete [Teacher 2] X X Edit Delete
[Make Corrections] [List is correct. Continue.]
Mathematics Program Questionnaire Please designate someone to complete the Mathematics Program Questionnaire. If possible, this questionnaire should be completed by the mathematics department chair or a mathematics lead teacher. The person completing this questionnaire should have a broad understanding of mathematics instruction within your school. You may select someone from the list below, or select "other" and enter a new name. Response required. MATHEMATICS Program Questionnaire Designee:
o [Coordinator Name] o [Principal Name] o [Teacher 1] o [Teacher 2] o Other (please specify below):
First name: [Blank field for entering first name] Last name: [Blank field for entering last name]
[Save and Continue]
Next Screen
Science Program Questionnaire Success: Mathematics Program Questionnaire designation saved. Please designate someone to complete the Science Program Questionnaire. If possible, this questionnaire should be completed by the science department chair or a science lead teacher. The person completing this questionnaire should have a broad understanding of science instruction within your school. You may select someone from the list below, or select "other" and enter a new name. Response required.
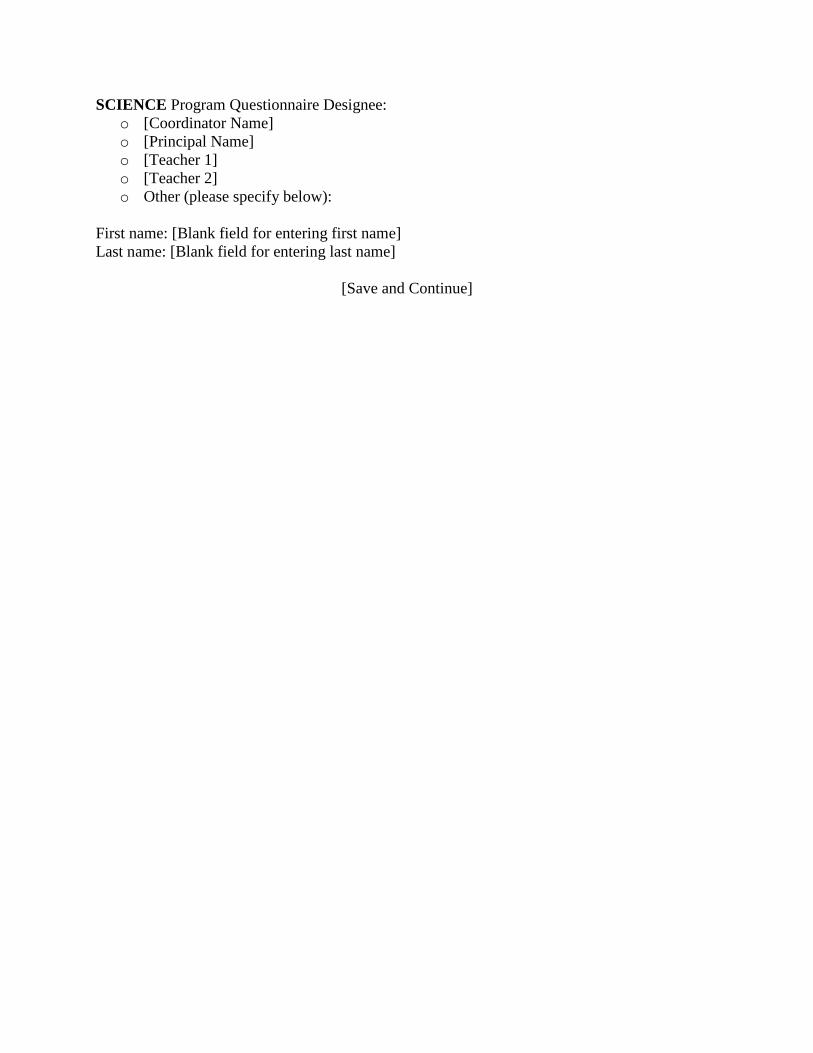
SCIENCE Program Questionnaire Designee: o [Coordinator Name] o [Principal Name] o [Teacher 1] o [Teacher 2] o Other (please specify below):
First name: [Blank field for entering first name] Last name: [Blank field for entering last name]
[Save and Continue]
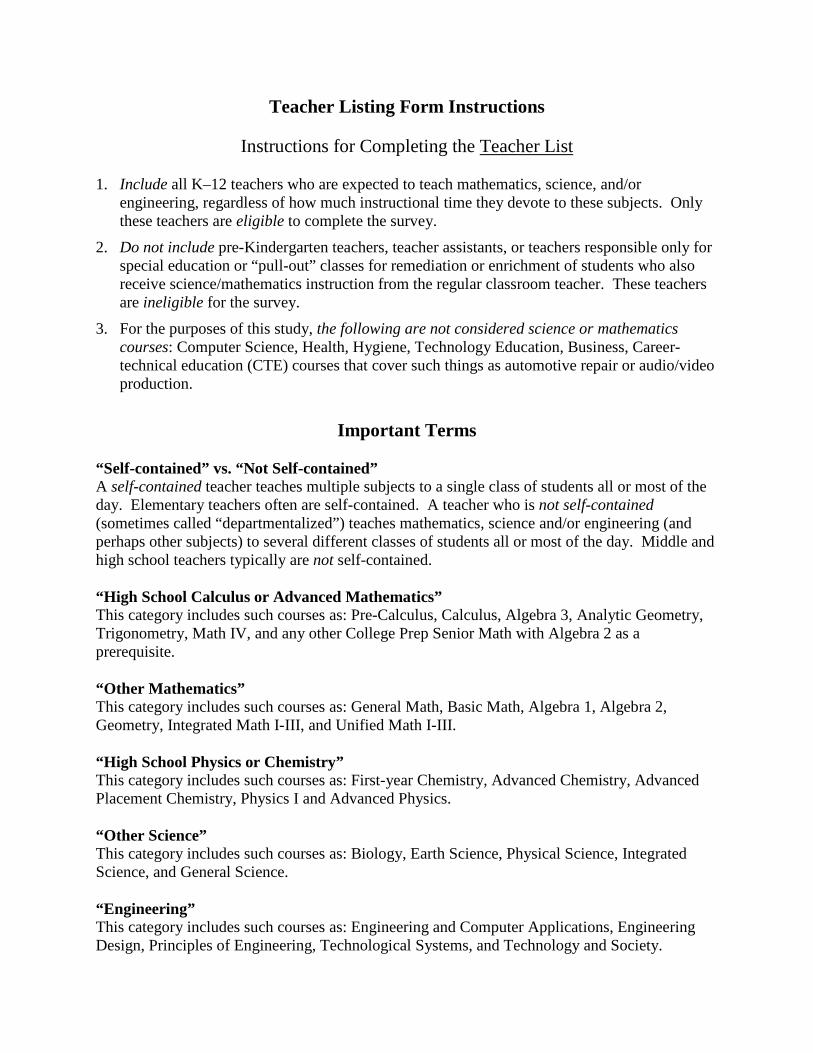
Teacher Listing Form Instructions
Instructions for Completing the Teacher List
1. Include all K–12 teachers who are expected to teach mathematics, science, and/or engineering, regardless of how much instructional time they devote to these subjects. Only these teachers are eligible to complete the survey.
2. Do not include pre-Kindergarten teachers, teacher assistants, or teachers responsible only for special education or “pull-out” classes for remediation or enrichment of students who also receive science/mathematics instruction from the regular classroom teacher. These teachers are ineligible for the survey.
3. For the purposes of this study, the following are not considered science or mathematics courses: Computer Science, Health, Hygiene, Technology Education, Business, Career-technical education (CTE) courses that cover such things as automotive repair or audio/video production.
Important Terms
“Self-contained” vs. “Not Self-contained” A self-contained teacher teaches multiple subjects to a single class of students all or most of the day. Elementary teachers often are self-contained. A teacher who is not self-contained (sometimes called “departmentalized”) teaches mathematics, science and/or engineering (and perhaps other subjects) to several different classes of students all or most of the day. Middle and high school teachers typically are not self-contained. “High School Calculus or Advanced Mathematics” This category includes such courses as: Pre-Calculus, Calculus, Algebra 3, Analytic Geometry, Trigonometry, Math IV, and any other College Prep Senior Math with Algebra 2 as a prerequisite. “Other Mathematics” This category includes such courses as: General Math, Basic Math, Algebra 1, Algebra 2, Geometry, Integrated Math I-III, and Unified Math I-III. “High School Physics or Chemistry” This category includes such courses as: First-year Chemistry, Advanced Chemistry, Advanced Placement Chemistry, Physics I and Advanced Physics. “Other Science” This category includes such courses as: Biology, Earth Science, Physical Science, Integrated Science, and General Science. “Engineering” This category includes such courses as: Engineering and Computer Applications, Engineering Design, Principles of Engineering, Technological Systems, and Technology and Society.

© Horizon Research, Inc. 1 School Coordinator Questionnaire
School Coordinator Questionnaire PREVIEW VERSION
If you make a mistake while completing the web-based questionnaire and are unable to correct it, please email Kiira Campbell at [email protected] or call her toll-free at 877-297-6829. 1. How many students are currently enrolled in each of the following grades in your
school? Number of Students Pre-Kindergarten Kindergarten 1st grade 2nd grade 3rd grade 4th grade 5th grade 6th grade 7th grade 8th grade 9th grade 10th grade 11th grade 12th grade Ungraded
2. Please indicate the number of students in this school in each of the following categories:
(Please count each student only once.) Number of Students
American Indian or Alaska Native Asian Black or African American Hispanic/Latino Native Hawaiian or Other Pacific Islander White Two or more races
3. How many…
Number a. students in your school are eligible for free or reduced-price lunch? b. students in this school have an Individualized Education Plan (IEP)? c. students in your school receive special education services for learning
disabilities?
d. students in your school are classified as English-language learners? e. languages other than English are spoken by families of students in this school?
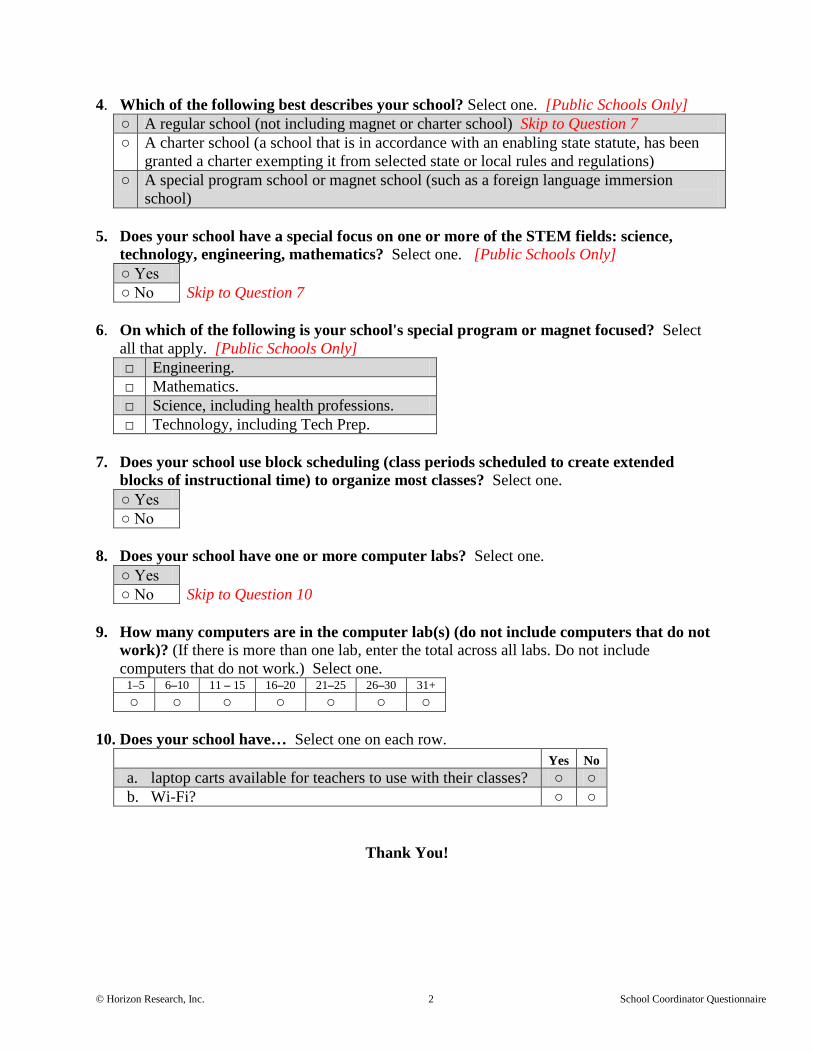
© Horizon Research, Inc. 2 School Coordinator Questionnaire
4. Which of the following best describes your school? Select one. [Public Schools Only] ○ A regular school (not including magnet or charter school) Skip to Question 7 ○ A charter school (a school that is in accordance with an enabling state statute, has been
granted a charter exempting it from selected state or local rules and regulations) ○ A special program school or magnet school (such as a foreign language immersion
school) 5. Does your school have a special focus on one or more of the STEM fields: science,
technology, engineering, mathematics? Select one. [Public Schools Only] ○ Yes ○ No Skip to Question 7
6. On which of the following is your school's special program or magnet focused? Select
all that apply. [Public Schools Only] □ Engineering. □ Mathematics. □ Science, including health professions. □ Technology, including Tech Prep.
7. Does your school use block scheduling (class periods scheduled to create extended
blocks of instructional time) to organize most classes? Select one. ○ Yes ○ No
8. Does your school have one or more computer labs? Select one.
○ Yes ○ No Skip to Question 10
9. How many computers are in the computer lab(s) (do not include computers that do not
work)? (If there is more than one lab, enter the total across all labs. Do not include computers that do not work.) Select one. 1–5 6–10 11 – 15 16–20 21–25 26–30 31+ ○ ○ ○ ○ ○ ○ ○
10. Does your school have… Select one on each row.
Yes No a. laptop carts available for teachers to use with their classes? ○ ○ b. Wi-Fi? ○ ○
Thank You!

Horizon Research, Inc. February 2013

Horizon Research, Inc. February 2013
APPENDIX D
Description of Data Collection
Study Endorsements Advance Notification School Recruitment Teacher and Program Surveys Prompting Respondents Response Rates Data Retrieval Data Cleaning

Horizon Research, Inc. D-1 February 2013
Description of Data Collection Study Endorsements Prior to school recruitment, study endorsements were solicited from many national professional organizations in an effort to encourage participation. In the fall of 2010, each organization was sent a letter briefly describing the study and asking for input on the survey instruments. The letter included a link to a website where representatives could view the surveys. The following organizations provided letters of endorsement, and their names were included on the study stationery.
American Association of Physics Teachers National Association of Secondary School Principals American Chemical Society, Education Division National Catholic Education Association American Federation of Teachers National Council of Supervisors of Mathematics Association of Mathematics Teacher Educators National Council of Teachers of Mathematics Association of State Supervisors of Mathematics National Earth Science Teachers Association Center for the Study of Mathematics Curriculum National Education Association Council of State Science Supervisors National School Boards Association National Association of Biology Teachers National Science Education Leadership Association National Association of Elementary School Principals National Science Teachers Association
Advance Notification In January 2011, notification letters were mailed to the Chief State School Officers, advising them of the format and schedule of the study. Three weeks later, similar information letters were mailed to superintendents of districts in which sampled public schools were located. District officials were asked to contact HRI if they had any questions or concerns. HRI identified 154 school districts in the sample that had a formal research approval process. HRI prepared and submitted research applications according to each district’s requirements and then followed up with research coordinators throughout the approval process. Of the 154 districts, 114 approved the study. Those that declined cited lack of time and misalignment with the district’s own research priorities as reasons. School Recruitment In February 2011, a pre-survey packet was sent to the principal of each sampled school that had not refused participation at the district level. The pre-survey packet consisted of a cover letter from HRI describing the school’s involvement, a one-page summary of the study, and instructions for logging on to the study website and designating a school contact person or “school coordinator.” The school coordinator designation page was designed to confirm the principal’s contact information as well as to obtain the name, title, phone number, and email address of the coordinator. As an incentive, school coordinators were offered an honorarium of

Horizon Research, Inc. D-2 February 2013
up to $200 ($100 for completing a teacher list and school questionnaire, $15 for completing each program questionnaire (optional), and $10 for each completed teacher questionnaire). Teachers were offered a $25 honorarium for completing the teacher questionnaire. A small percentage of schools responded to the letter by going to the study website and designating a coordinator. Anticipating the lack of response, HRI contracted with a telephone call center to follow up with non-responding schools. If a principal had not responded within two weeks of receiving the letter, the call center began calling the school. Generally, a series of telephone calls was needed to determine whether anyone had received the letter, to whom the task had been delegated, and whether or not that person was planning to complete it. In many cases, schools requested a re-mailing of the survey materials. A few school officials directly refused to participate at this stage, generally citing competing priorities and overburdened teachers. When this occurred, telephone prompters attempted to change the principal’s mind. Although this method was effective in some cases, most direct refusers did not change their mind. Once a principal agreed to participate and designated a school coordinator, the coordinator was sent an automated email indicating that s/he had been designated by their principal as the survey contact and detailing the coordinator role in the study. Beginning in September 2011, each coordinator was asked to complete three initial tasks online: (1) submit a list of science and mathematics teachers; (2) designate individuals to complete program-level questionnaires; and (3) respond to the School Coordinator Questionnaire (a brief survey asking about school demographics). Coordinators were asked to complete these tasks within a two-week period and were sent the first installment of their honorarium ($100) within four weeks of completion. Non-responding coordinators received an email reminder three weeks after the initial email was sent. Following an additional week of non-response, coordinators were contacted by phone and prompted to complete the three tasks. After a series of eight reminder phone calls, a second reminder email was sent to each coordinator. One week later, if a coordinator had still not responded, the school principal was contacted and asked either to encourage the current coordinator to respond or to consider designating someone new to serve in this capacity. Table D-1 summarizes the school participation rates by stratum. A total of 35 schools were identified as ineligible; due to either being closed or merged with another school to create a new school. In total, 1,504 schools chose to participate for the remaining 1,965 slots, an overall response rate of 77 percent.

Horizon Research, Inc. D-3 February 2013
Table D-1 School Participation, by Stratum
Stratum 1 Stratum 2 Stratum 3 TOTAL Response Rate 80% 76% 70% 77% Participated 819 359 326 1,504 Non-Response 207 111 143 461 Ineligible 19 6 10 35 TOTAL 1,045 476 479 2,000
The school coordinator questionnaire was programmed to check for the accuracy of certain information as it was submitted. For instance, the survey checked whether student enrollment overall matched student enrollment by race/ethnicity. Coordinators were asked to correct any mismatches before proceeding with the survey. The teacher lists resulted in a file of 27,888 teachers. From this frame, a sample of 10,226 science and mathematics teachers was drawn. Seven teachers were sampled from each list, unless the list contained fewer than seven, in which case all were selected. The number of teachers sampled per school ranged from 1 to 7, with a mean of 6.8 teachers and a median of 7. Teachers were sampled on a rolling basis so that late responders to the pre-survey would not delay the main data collection effort. Teacher and Program Surveys In January 2012, HRI staff mailed program and teacher questionnaire invitations by first class mail to 30 schools in the sample. This first small group served as a “soft launch” to test survey administration procedures and the functionality of the data collection website. After three weeks, additional mailings were sent to batches of 300–500 schools each week until the sample was exhausted. The packets contained:
• A personalized cover letter from HRI; and • A “how to” page explaining how to access the online survey using unique login
information. Many of the individuals designated to respond for the program questionnaires were teachers and, consequently, had been randomly sampled to complete the teacher questionnaire as well. These individuals received both the teacher questionnaire invitation and the program questionnaire packet (mailed in separate envelopes). Because the program questionnaire requested information that the respondent was not likely to know, the mailing included a paper copy of the survey, so that respondents could gather data before completing the on-line version.

Horizon Research, Inc. D-4 February 2013
Prompting Respondents A series of steps was taken to increase the response rate, primarily through email follow-up with school coordinators. Reminder emails were sent to coordinators at schools with less than 100 percent response at three, five, seven, and nine weeks following the survey invitation mailing. Five weeks after the initial mailing, schools with no respondents received a phone call in addition to the reminder email. At seven weeks, any school with less than 50 percent completion received a phone call in addition to the reminder email. In some instances, schools indicated that they had not received survey invitations, in which case materials were re-mailed or re-sent via email. During the survey administration phase, school coordinators were given access to a real-time “completion status report,” which summarized survey response for their school. The report listed the surveys to be completed at the school, the name of the person designated and/or sampled to complete each one, and whether the survey was “not started,” “started,” or “completed.” Coordinators were asked to use the report to follow up with non-respondents to encourage them to complete their questionnaires. Response Rates A total of 2,505 completed program questionnaires were received out of the 3,008 possible, for a response rate of 83 percent. A total of 7,752 out of 10,012 eligible teachers1 took part in the survey, for a response rate of 77 percent. Tables D-2 and D-3 provide response rate breakdowns for program heads and teachers, respectively.
Table D-2 Results of Program Questionnaires, by Stratum and Subject
Sampled Non-Response Completed
Response Rate (Percent)
Stratum 1 1,638 290 1,348 82 Science 819 144 675 82 Mathematics 819 146 673 82
Stratum 2 718 134 584 81 Science 359 56 303 84 Mathematics 359 78 281 78
Stratum 3 652 79 573 88 Science 326 42 284 87 Mathematics 326 37 289 89
TOTAL 3,008 503 2,505 83
1 During data collection, it was determined that a small number of teachers were not eligible to participate in the study (e.g., after the school submitted its teacher list, the teacher retired, went on maternity leave, changed teaching assignment). These teachers are not included in the denominator when calculating response rates.

Horizon Research, Inc. D-5 February 2013
Table D-3 Results of Teacher Questionnaires, by Stratum and Subject
Sampled Non-Response Ineligible Completed
Response Rate (Percent)
Stratum 1 5,545 1,271 100 4,174 77 Science 2,719 638 55 2,026 76 Mathematics 2,826 633 45 2,148 77
Stratum 2 2,435 572 44 1,819 76 Science 1,120 239 20 861 78 Mathematics 1,315 333 24 958 74
Stratum 3 2,230 417 54 1,759 81 Science 1,038 196 28 814 81 Mathematics 1,192 221 26 945 81
TOTAL 10,210 2,260 198 7,752 77 Data Retrieval The web-based format minimized the need for data retrieval. Critical items were identified during questionnaire development, and the surveys were programmed such that respondents could not proceed without answering these questions. In addition, the surveys were programmed with a number of “soft checks” for potentially incorrect responses. For example, on the School Coordinator Questionnaire, if the number of students in the various demographic categories did not sum to the total enrollment reported, the survey prompted coordinators to double check their numbers. Data Cleaning Questionnaire responses were captured through the data collection website. Data were screened by researchers for missing data, out-of-range answers, and logical inconsistencies. After data-cleaning decisions regarding these issues were made, the data were updated to reflect the decisions. Additional variables needed for analysis were created using data from survey answers and other sources. The data about instructional materials used (e.g., titles, ISBNs) were used to mine additional information about textbooks (e.g., the publisher, whether NSF funded the development of the materials) and to resolve inconsistencies in title and author information.

Horizon Research, Inc. February 2013
APPENDIX E
Description of Reporting Variables
Region
Type of Community
Percent of Students in School Eligible for Free/Reduced-Price Lunch (FRL)
School Size
Grade Range
Percent of Non-Asian Minority Students in Class
Overview of Composites
Definitions of Teacher Composites
Teacher Background and Opinions Quality of Professional Development
Extent to Which Professional Development/Coursework Focused on Student-Centered
Instruction
Perceptions of Content Preparedness: Science
Perceptions of Content Preparedness: Mathematics
Perceptions of Preparedness to Teach Diverse Learners
Perceptions of Preparedness to Encourage Students
Perceptions of Preparedness to Implement Instruction in Particular Unit
Decision-Making Autonomy Curriculum Control
Pedagogical Control
Instructional Objectives Reform-Oriented Instructional Objectives
Teaching Practices Use of Reform-Oriented Teaching Practices: Science
Use of Reform-Oriented Teaching Practices: Mathematics
Use of Instructional Technology
Influences on Instruction Adequacy of Resources for Instruction: Science
Adequacy of Resources for Instruction: Mathematics
Extent to Which the Quality of Instructional Technology Is Problematic for Instruction
Extent to Which the Policy Environment Promotes Effective Instruction
Extent to Which Stakeholders Promote Effective Instruction
Extent to Which School Support Promotes Effective Instruction
Definitions of Program Composites
State Standards for Science and Mathematics Education Focus on State Science/Mathematics Standards
Factors Affecting Instruction Supportive Context for Science/Mathematics Instruction
Extent to Which a Lack of Materials and Supplies Is Problematic
Extent to Which Student Issues Are Problematic
Extent to Which Teacher Issues Are Problematic
Extent to Which a Lack of Time Is Problematic
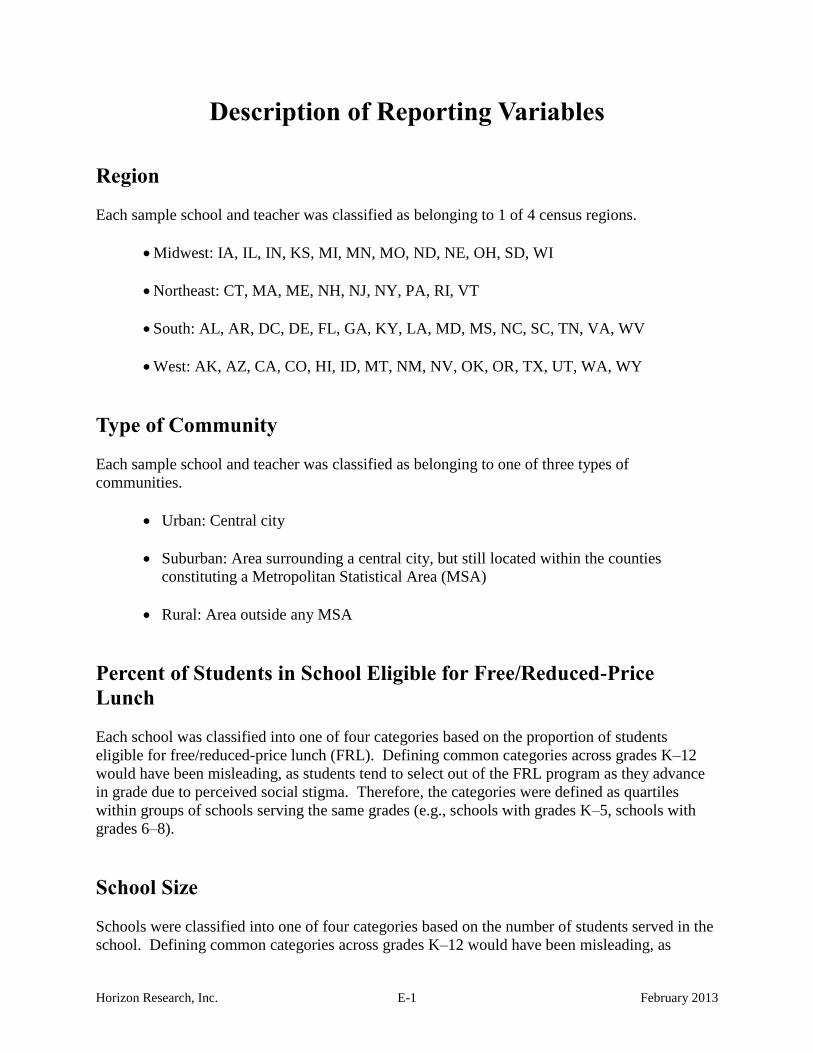
Horizon Research, Inc. E-1 February 2013
Description of Reporting Variables
Region
Each sample school and teacher was classified as belonging to 1 of 4 census regions.
Midwest: IA, IL, IN, KS, MI, MN, MO, ND, NE, OH, SD, WI
Northeast: CT, MA, ME, NH, NJ, NY, PA, RI, VT
South: AL, AR, DC, DE, FL, GA, KY, LA, MD, MS, NC, SC, TN, VA, WV
West: AK, AZ, CA, CO, HI, ID, MT, NM, NV, OK, OR, TX, UT, WA, WY
Type of Community
Each sample school and teacher was classified as belonging to one of three types of
communities.
Urban: Central city
Suburban: Area surrounding a central city, but still located within the counties
constituting a Metropolitan Statistical Area (MSA)
Rural: Area outside any MSA
Percent of Students in School Eligible for Free/Reduced-Price
Lunch
Each school was classified into one of four categories based on the proportion of students
eligible for free/reduced-price lunch (FRL). Defining common categories across grades K–12
would have been misleading, as students tend to select out of the FRL program as they advance
in grade due to perceived social stigma. Therefore, the categories were defined as quartiles
within groups of schools serving the same grades (e.g., schools with grades K–5, schools with
grades 6–8).
School Size
Schools were classified into one of four categories based on the number of students served in the
school. Defining common categories across grades K–12 would have been misleading, as

Horizon Research, Inc. E-2 February 2013
average school size tends to increase from elementary to middle to high school. Therefore, the
categories were defined as quartiles within groups of schools serving the same grades (e.g.,
schools with grades K–5, schools with grades 6–8).
Grade Range
Teachers were classified by grade range according to the information they provided about their
teaching schedule. Most of the analyses in this report used elementary, middle, and high with
teachers and classes being categorized based on the grade range information provided by the
teacher. Elementary was defined as grades K–5 plus 6th
grade self-contained; middle was
defined as 6th
grade non-self-contained and grades 7–8; high was defined as grades 9–12.
Percent of Non-Asian Minority Students in Class
Each randomly selected class was classified into one of four categories based on the proportion
of students in the class identified as non-Asian minorities. As this proportion is similar in
schools regardless of grades served, the categories were defined as quartiles across all classes.
Overview of Composites
To facilitate the reporting of large amounts of survey data, and because individual questionnaire
items are potentially unreliable, HRI used factor analysis to identify survey questions that could
be combined into “composites.” Each composite represents an important construct related to
mathematics or science education. Composites were calculated for both the science and
mathematics versions of the teacher questionnaire and for the program questionnaire completed
by each responding school in the sample.
Each composite is calculated by summing the responses to the items associated with that
composite and then dividing by the total points possible. In order for the composites to be on a
100-point scale, the lowest response option on each scale was set to 0 and the others were
adjusted accordingly; so for example, an item with a scale ranging from 1 to 4 was re-coded to
have a scale of 0 to 3. By doing this, someone who marks the lowest point on every item in a
composite receives a composite score of 0 rather than some positive number. It also assures that
50 is the true mid-point. The denominator for each composite is determined by computing the
maximum possible sum of responses for a series of items and dividing by 100; e.g., a 9-item
composite where each item is on a scale of 0–3 would have a denominator of 0.27. Composites
values were not computed for participants who respond to fewer than two-thirds of the items that
form the composite.
The composites were derived through a multi-stage process. As a first step, to test whether the
items intended to target the same underlying construct indeed showed similar response patterns,
an exploratory factor analysis was conducted on a subset of the data. (The complete dataset was

Horizon Research, Inc. E-3 February 2013
split randomly into two subsets to allow for independent exploratory and confirmatory factor
analyses.) Using Mplus version 6 and applying the appropriate weights (teacher, class, or school
weights), several different factor solutions were produced and scree plots, eigenvalues, and
factor patterns were examined. Based on item fit and conceptual coherence, preliminary
composite definitions were created. Next, the preliminary composite definitions were applied to
a different subset of the data and a confirmatory factor analysis was performed, again using
Mplus. When analyzing data from a complex sample design, Mplus provides only two fit
indices to evaluate the model: the root mean square error of approximation (RMSEA), and the
standardized root mean square residual (SRMR). The psychometric literature provides multiple
criteria for judging acceptable model fit using these indices, ranging from 0.05–0.10 for both the
RMSEA and SRMR.1 The obtained values from final models
2 are presented in the tables,
allowing the reader to apply his or her preferred criteria for evaluating fit. Lastly, to further aid
in the assessment of the composites, Cronbach’s coefficient alpha, a common measure of
reliability, was calculated and is presented in the tables. An alpha of 0.6–0.8 is evidence of
moderate reliability and a value over 0.8 is considered evidence of strong reliability.
Definitions of Teacher Composites
Composite definitions for the science and mathematics teacher questionnaire are presented below
along with the item numbers from the respective questionnaires. Composites that are identical
for the two subjects are presented in the same table; composites unique to a subject are presented
in separate tables.
1 Browne, M.W., & Cudeck, R. (1992). Alternative ways of assessing model fit. Sociological Methods & Research, 21, 230–258.
Hu, L., & Bentler, P.M. (1999). Cutoff criteria for fi t indexes in covariance structure analysis: Conventional criteria versus new
alternatives. Structural Equation Modeling, 6, 1–55.
Marsh, H.W., Wen, Z., & Hau, K-T. (2004). Structural equation models of latent interactions: Evaluation of alternative
estimation strategies and indicator construction. Psychological Methods, 9, 275–300.
2 Final models were occasionally adjusted to allow for correlated errors among individual items, typically when the items were
worded similarly and the modification indices suggested that the proposed correlations would lead to substantially better fit.
Multi-factor models were used in situations when a single-factor specification would result in an over-identified model.
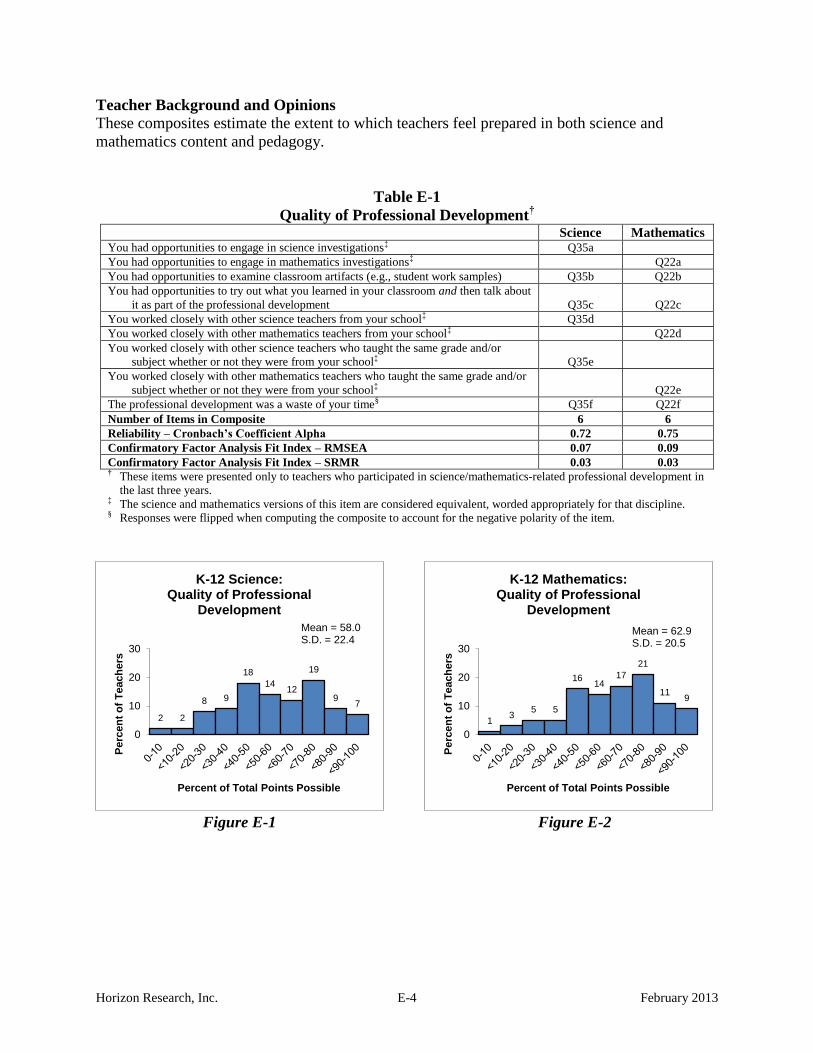
Horizon Research, Inc. E-4 February 2013
Teacher Background and Opinions
These composites estimate the extent to which teachers feel prepared in both science and
mathematics content and pedagogy.
Table E-1
Quality of Professional Development†
Science Mathematics You had opportunities to engage in science investigations‡ Q35a
You had opportunities to engage in mathematics investigations‡ Q22a
You had opportunities to examine classroom artifacts (e.g., student work samples) Q35b Q22b
You had opportunities to try out what you learned in your classroom and then talk about
it as part of the professional development Q35c Q22c
You worked closely with other science teachers from your school‡ Q35d
You worked closely with other mathematics teachers from your school‡ Q22d
You worked closely with other science teachers who taught the same grade and/or
subject whether or not they were from your school‡ Q35e
You worked closely with other mathematics teachers who taught the same grade and/or
subject whether or not they were from your school‡ Q22e
The professional development was a waste of your time§ Q35f Q22f
Number of Items in Composite 6 6
Reliability – Cronbach’s Coefficient Alpha 0.72 0.75
Confirmatory Factor Analysis Fit Index – RMSEA 0.07 0.09
Confirmatory Factor Analysis Fit Index – SRMR 0.03 0.03 † These items were presented only to teachers who participated in science/mathematics-related professional development in
the last three years. ‡ The science and mathematics versions of this item are considered equivalent, worded appropriately for that discipline. § Responses were flipped when computing the composite to account for the negative polarity of the item.
Figure E-1 Figure E-2
2 2
8 9
18
14 12
19
9 7
0
10
20
30
Perc
en
t o
f T
each
ers
Percent of Total Points Possible
K-12 Science: Quality of Professional
Development Mean = 58.0
S.D. = 22.4
1 3
5 5
16 14
17
21
11 9
0
10
20
30
Perc
en
t o
f T
each
ers
Percent of Total Points Possible
K-12 Mathematics: Quality of Professional
Development Mean = 62.9
S.D. = 20.5

Horizon Research, Inc. E-5 February 2013
Table E-2
Extent to Which Professional
Development/Coursework Focused on Student-Centered Instruction†
Science Mathematics Finding out what students think or already know about the key science ideas prior to
instruction on those ideas‡ Q37c
Finding out what students think or already know about the key mathematical ideas prior
to instruction on those ideas‡ Q24d
Planning instruction so students at different levels of achievement can increase their
understanding of the ideas targeted in each activity Q37e Q24f
Monitoring student understanding during science instruction‡ Q37f
Monitoring student understanding during mathematics instruction‡ Q24g
Assessing student understanding at the conclusion of instruction on a topic Q37j Q24k
Number of Items in Composite 4 4
Reliability – Cronbach’s Coefficient Alpha 0.86 0.82
Confirmatory Factor Analysis Fit Index – RMSEA 0.07 0.01
Confirmatory Factor Analysis Fit Index – SRMR 0.01 0.01 † These items were presented only to teachers who participated in science/mathematics-related professional development or
coursework within the last three years. ‡ The science and mathematics versions of this item are considered equivalent, worded appropriately for that discipline.
Figure E-3 Figure E-4
4 3 6 8
18
9
19
12 10 10
0
10
20
30
Perc
en
t o
f T
each
ers
Percent of Total Points Possible
K-12 Science: Extent to which Professional
Development/Coursework Focused on Student-Centered
Instruction Mean = 59.0
S.D. = 24.5
2 3 4
16
23
12
21
7 9 5
0
10
20
30
Perc
en
t o
f T
each
ers
Percent of Total Points Possible
K-12 Mathematics: Extent to which Professional
Development/Coursework Focused on Student-Centered
Instruction Mean = 55.5
S.D. = 20.5

Horizon Research, Inc. E-6 February 2013
Table E-3S
Perceptions of Content Preparedness: Science†
Biology/
Life
Science Chemistry
Earth
Science
Integrated/
General
Science
Physical
Science Physics Earth’s features and physical
processes
Q40ai Q40ai
The solar system and the universe Q40aii Q40aii
Climate and weather Q40aiii Q40aiii
Cell biology Q40bi Q40bi
Structures and functions of
organisms
Q40bii Q40bii
Ecology/ecosystems Q40biii Q40biii
Genetics Q40biv Q40biv
Evolution Q40bv Q40bv
Atomic structure Q40ci Q40ci Q40ci
Chemical bonding, equations,
nomenclature, and reactions Q40cii Q40cii Q40cii
Elements, compounds, and
mixtures Q40ciii Q40ciii Q40ciii
The Periodic Table Q40civ Q40civ Q40civ
Properties of solutions Q40cv Q40cv Q40cv
States, classes, and properties of
matter Q40cvi Q40cvi Q40cvi
Forces and motion Q40di Q40di Q40di
Energy transfers, transformations,
and conservation Q40dii Q40dii Q40dii
Properties and behaviors of waves Q40diii Q40diii Q40diii
Electricity and magnetism Q40div Q40div Q40div
Modern physics (e.g., special
relativity) Q40dv Q40dv Q40dv
Environmental and resource
issues (e.g., land and water
use, energy resources and
consumption, sources and
impacts of pollution)
Q40f
Number of Items in Composite 5 6 3 20 11 5
Reliability – Cronbach’s
Coefficient Alpha 0.89 0.95 0.83 0.90 0.92 0.88
Confirmatory Factor Analysis
Fit Index – RMSEA 0.08 0.08 0.08 0.16 0.15 0.08
Confirmatory Factor Analysis
Fit Index – SRMR 0.06 0.06 0.06 0.13 0.10 0.06 † Items in these composites were presented only to non-self-contained teachers.

Horizon Research, Inc. E-7 February 2013
Figure E-5 Figure E-6
Figure E-7 Figure E-8
Figure E-9 Figure E-10
3 1 3 3 5
11 9
15 13
37
0
10
20
30
40
50
Perc
en
t o
f T
each
ers
Percent of Total Points Possible
Perceptions of Content Preparedness:
Biology/Life Science
Mean = 75.5 S.D. = 24.8
3 1 2 8
4 5
14 9 10
44
0
10
20
30
40
50
Perc
en
t o
f T
each
ers
Percent of Total Points Possible
Perceptions of Content Preparedness:
Chemistry
Mean = 76.4 S.D. = 26.6
2 2 2 5 6
9
18 12
19 25
0
10
20
30
40
50
Perc
en
t o
f T
each
ers
Percent of Total Points Possible
Perceptions of Content Preparedness:
Earth Science
Mean = 72.8 S.D. = 25.4
1 1 3 2
12
20 14
28
11 9
0
10
20
30
40
50
Perc
en
t o
f T
each
ers
Percent of Total Points Possible
Perceptions of Content Preparedness:
Integrated/General Science
Mean = 66.0 S.D. = 18.1
2 2 2 8
11 12
19 13
17 14
0
10
20
30
40
50
Perc
en
t o
f T
each
ers
Percent of Total Points Possible
Perceptions of Content Preparedness:
Physical Science
Mean = 65.2 S.D. = 22.5
3 2 5 7
12
19
12 16
8
16
0
10
20
30
40
50
Perc
en
t o
f T
each
ers
Percent of Total Points Possible
Perceptions of Content Preparedness:
Physics
Mean = 62.5 S.D. = 24.8

Horizon Research, Inc. E-8 February 2013
Table E-3M
Perceptions of Content Preparedness: Mathematics†
Mathematics The number system and operations Q27a
Algebraic thinking Q27b
Functions Q27c
Modeling Q27d
Measurement Q27e
Geometry Q27f
Statistics and probability Q27g
Discrete mathematics Q27h
Number of Items in Composite 8
Reliability – Cronbach’s Coefficient Alpha 0.79
Confirmatory Factor Analysis Fit Index – RMSEA 0.09
Confirmatory Factor Analysis Fit Index – SRMR 0.04 † These items were presented only to non-self-contained teachers.
Figure E-11
0 0 0 1 3 5 9
22 23
36
0
10
20
30
40
Perc
en
t o
f T
each
ers
Percent of Total Points Possible
Perceptions of Content Preparedness:
Mathematics Mean = 81.6
S.D. = 15.2

Horizon Research, Inc. E-9 February 2013
Table E-4
Perceptions of Preparedness to Teach Diverse Learners Science Mathematics
Plan instruction so students at different levels of achievement can increase their
understanding of the ideas targeted in each activity Q41a Q28a
Teach science to students who have learning disabilities‡ Q41b
Teach mathematics to students who have learning disabilities‡ Q28b
Teach science to students who have physical disabilities‡ Q41c
Teach mathematics to students who have physical disabilities‡ Q28c
Teach science to English-language learners‡ Q41d
Teach mathematics to English-language learners‡ Q28d
Provide enrichment experiences for gifted students Q41e Q28e
Number of Items in Composite 5 5
Reliability – Cronbach’s Coefficient Alpha 0.80 0.76
Confirmatory Factor Analysis Fit Index – RMSEA 0.05 0.12
Confirmatory Factor Analysis Fit Index – SRMR 0.02 0.03 ‡ The science and mathematics versions of this item are considered equivalent, worded appropriately for that discipline.
Figure E-12 Figure E-13
4 3
11 8
18 20
12 11
5
9
0
10
20
30
Perc
en
t o
f T
each
ers
Percent of Total Points Possible
K-12 Science: Perceptions of Preparedness to
Teach Diverse Learners
Mean = 53.5 S.D. = 24.7
2 2
6 7
19
23
11
16
6 9
0
10
20
30
Perc
en
t o
f T
each
ers
Percent of Total Points Possible
K-12 Mathematics: Perceptions of Preparedness to
Teach Diverse Learners
Mean = 58.8 S.D. = 22.3

Horizon Research, Inc. E-10 February 2013
Table E-5
Perceptions of Preparedness to Encourage Students‡
Science Mathematics Encourage students’ interest in science and/or engineering Q41f
Encourage students’ interest in mathematics Q28f
Encourage participation of females in science and/or engineering Q41g
Encourage participation of females in mathematics Q28g
Encourage participation of racial or ethnic minorities in science and/or engineering Q41h
Encourage participation of racial or ethnic minorities in mathematics Q28h
Encourage participation of students from low socioeconomic backgrounds in science and/or
engineering
Q41i
Encourage participation of students from low socioeconomic backgrounds in mathematics Q28i
Number of Items in Composite 4 4
Reliability – Cronbach’s Coefficient Alpha 0.92 0.89
Confirmatory Factor Analysis Fit Index – RMSEA 0.12 0.24
Confirmatory Factor Analysis Fit Index – SRMR 0.01 0.03 ‡ The science and mathematics versions of these items are considered equivalent, worded appropriately for that discipline.
Figure E-14 Figure E-15
5 2 2
10 9 8
27
4 4
30
0
10
20
30
40
Perc
en
t o
f T
each
ers
Percent of Total Points Possible
K-12 Science: Perceptions of Preparedness to Encourage Students in Science
and/or Engineering Mean = 65.9
S.D. = 28.2
1 1 2 4 7 6
23
5 6
47
0
10
20
30
40
50
Perc
en
t o
f T
each
ers
Percent of Total Points Possible
K-12 Mathematics: Perceptions of Preparedness to
Encourage Students in Mathematics
Mean = 78.1 S.D. = 22.8

Horizon Research, Inc. E-11 February 2013
Table E-6
Perceptions of Preparedness to Implement Instruction in Particular Unit Science Mathematics
Anticipate difficulties that students will have with particular science ideas and
procedures in this unit‡ Q78a
Anticipate difficulties that students will have with particular mathematical ideas and
procedures in this unit‡
Q61a
Find out what students thought or already knew about the key science ideas‡ Q78b
Find out what students thought or already knew about the key mathematical ideas‡ Q61b
Implement the science textbook/ module to be used during this unit‡ Q78c
Implement the mathematics textbook/ program to be used during this unit‡ Q61c
Monitor student understanding during this unit Q78d Q61d
Assess student understanding at the conclusion of this unit Q78e Q61e
Number of Items in Composite 5 5
Reliability – Cronbach’s Coefficient Alpha 0.88 0.84
Confirmatory Factor Analysis Fit Index – RMSEA <0.01 0.04
Confirmatory Factor Analysis Fit Index – SRMR <0.01 0.01 ‡ The science and mathematics versions of this item are considered equivalent, worded appropriately for that discipline.
Figure E-16 Figure E-17
0 0 1 3 4 9
23
12 11
37
0
10
20
30
40
50
Perc
en
t o
f C
lasses
Percent of Total Points Possible
K-12 Science: Perceptions of Preparedness to
Implement Instruction in Unit
Mean = 77.9 S.D. = 19.3
0 0 0 1 3 6
16 14 13
47
0
10
20
30
40
50
Perc
en
t o
f C
lasses
Percent of Total Points Possible
K-12 Mathematics: Perceptions of Preparedness to
Implement Instruction in Unit
Mean = 84.1 S.D. = 16.2
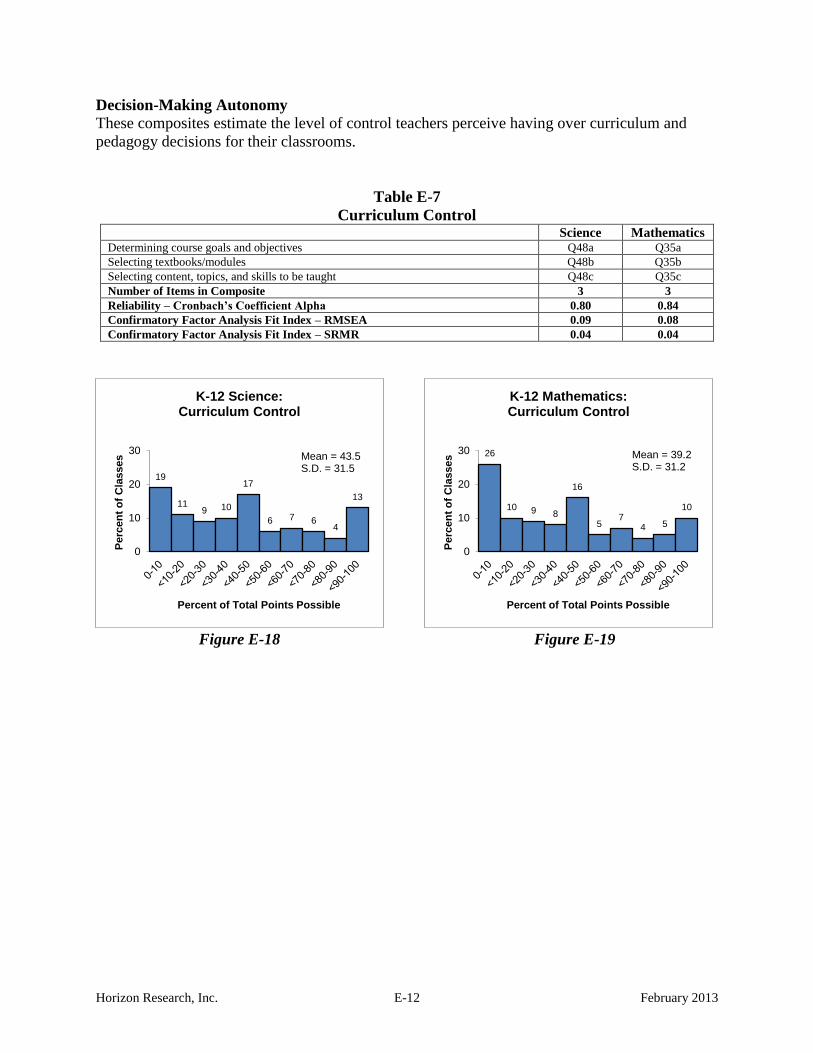
Horizon Research, Inc. E-12 February 2013
Decision-Making Autonomy
These composites estimate the level of control teachers perceive having over curriculum and
pedagogy decisions for their classrooms.
Table E-7
Curriculum Control Science Mathematics
Determining course goals and objectives Q48a Q35a
Selecting textbooks/modules Q48b Q35b
Selecting content, topics, and skills to be taught Q48c Q35c
Number of Items in Composite 3 3
Reliability – Cronbach’s Coefficient Alpha 0.80 0.84
Confirmatory Factor Analysis Fit Index – RMSEA 0.09 0.08
Confirmatory Factor Analysis Fit Index – SRMR 0.04 0.04
Figure E-18 Figure E-19
19
11 9 10
17
6 7 6 4
13
0
10
20
30
Perc
en
t o
f C
lasses
Percent of Total Points Possible
K-12 Science: Curriculum Control
Mean = 43.5 S.D. = 31.5
26
10 9 8
16
5 7
4 5
10
0
10
20
30P
erc
en
t o
f C
lasses
Percent of Total Points Possible
K-12 Mathematics: Curriculum Control
Mean = 39.2 S.D. = 31.2

Horizon Research, Inc. E-13 February 2013
Table E-8
Pedagogical Control Science Mathematics
Selecting teaching techniques Q48d Q35d
Determining the amount of homework to be assigned Q48e Q35e
Choosing criteria for grading student performance Q48f Q35f
Number of Items in Composite 3 3
Reliability – Cronbach’s Coefficient Alpha 0.73 0.71
Confirmatory Factor Analysis Fit Index – RMSEA 0.09 0.08
Confirmatory Factor Analysis Fit Index – SRMR 0.04 0.04
Figure E-20 Figure E-21
0 0 1 1 6 4
8 13 11
56
0
10
20
30
40
50
60
Perc
en
t o
f C
lasses
Percent of Total Points Possible
K-12 Science: Pedagogical Control
Mean = 85.1 S.D. = 17.8
1 1 1 2 8
5 10
15 12
47
0
10
20
30
40
50
60
Perc
en
t o
f C
lasses
Percent of Total Points Possible
K-12 Mathematics: Pedagogical Control
Mean = 81.2 S.D. = 20.4

Horizon Research, Inc. E-14 February 2013
Instructional Objectives
These composites estimate the amount of emphasis teachers place on reform-oriented
instructional objectives.
Table E-9
Reform-Oriented Instructional Objectives Science Mathematics
Understanding science concepts‡ Q49b
Understanding mathematical ideas‡ Q36c
Learning science process skills (e.g., observing, measuring) ‡ Q49c
Learning mathematical practices (e.g., considering how to approach a problem,
justifying solutions) ‡
Q36d
Learning about real-life applications of science‡ Q49d
Learning about real-life applications of mathematics‡ Q36e
Increasing students’ interest in science‡ Q49e
Increasing students’ interest in mathematics‡ Q36f
Preparing for further study in science‡ Q49f
Preparing for further study in mathematics‡ Q36g
Number of Items in Composite 5 5
Reliability – Cronbach’s Coefficient Alpha 0.72 0.71
Confirmatory Factor Analysis Fit Index – RMSEA 0.07 0.11
Confirmatory Factor Analysis Fit Index – SRMR 0.02 0.03 ‡ The science and mathematics versions of this item are considered equivalent, worded appropriately for that discipline.
Figure E-22 Figure E-23
0 0 0 1 3 7
13
26
16
34
0
10
20
30
40
Perc
en
t o
f C
lasses
Percent of Total Points Possible
K-12 Science: Reform-Oriented Instructional
Objectives
Mean = 81.2 S.D. = 15.3
0 0 0 0 3
10 13
28
15
31
0
10
20
30
40
Perc
en
t o
f C
lasses
Percent of Total Points Possible
K-12 Mathematics: Reform-Oriented Instructional
Objectives
Mean = 80.3 S.D. = 15.1
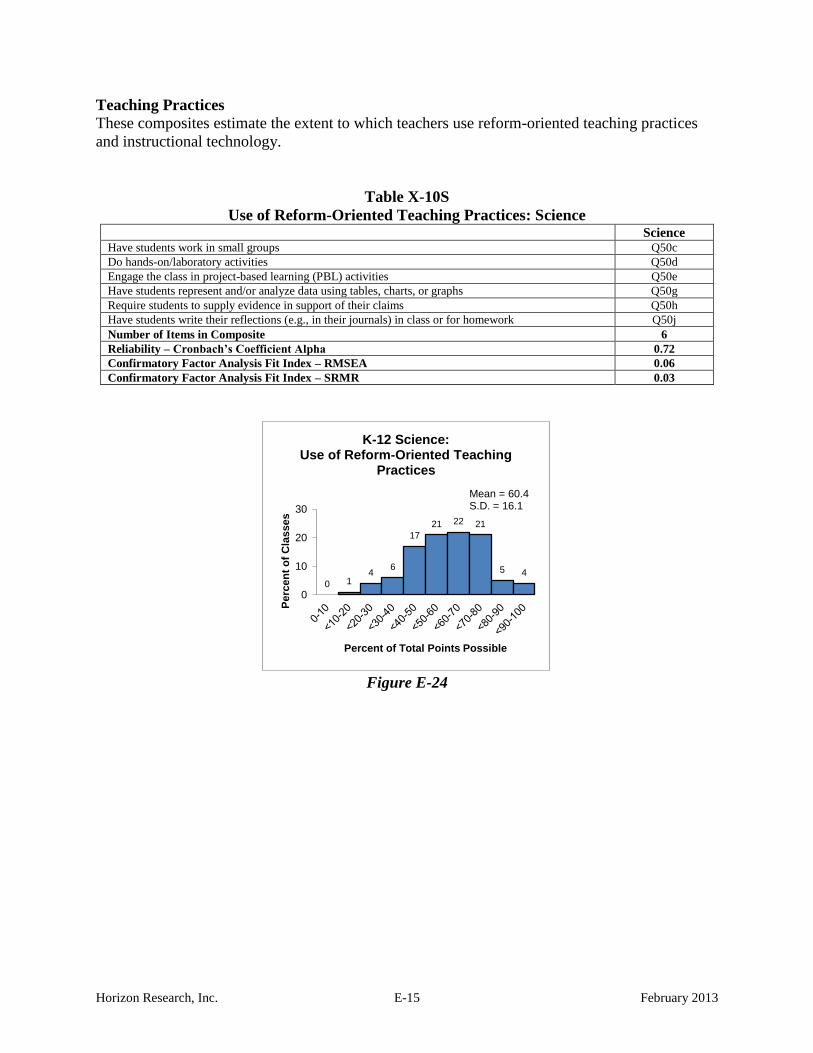
Horizon Research, Inc. E-15 February 2013
Teaching Practices
These composites estimate the extent to which teachers use reform-oriented teaching practices
and instructional technology.
Table X-10S
Use of Reform-Oriented Teaching Practices: Science Science
Have students work in small groups Q50c
Do hands-on/laboratory activities Q50d
Engage the class in project-based learning (PBL) activities Q50e
Have students represent and/or analyze data using tables, charts, or graphs Q50g
Require students to supply evidence in support of their claims Q50h
Have students write their reflections (e.g., in their journals) in class or for homework Q50j
Number of Items in Composite 6
Reliability – Cronbach’s Coefficient Alpha 0.72
Confirmatory Factor Analysis Fit Index – RMSEA 0.06
Confirmatory Factor Analysis Fit Index – SRMR 0.03
Figure E-24
0 1 4
6
17
21 22 21
5 4
0
10
20
30
Perc
en
t o
f C
lasses
Percent of Total Points Possible
K-12 Science: Use of Reform-Oriented Teaching
Practices
Mean = 60.4 S.D. = 16.1
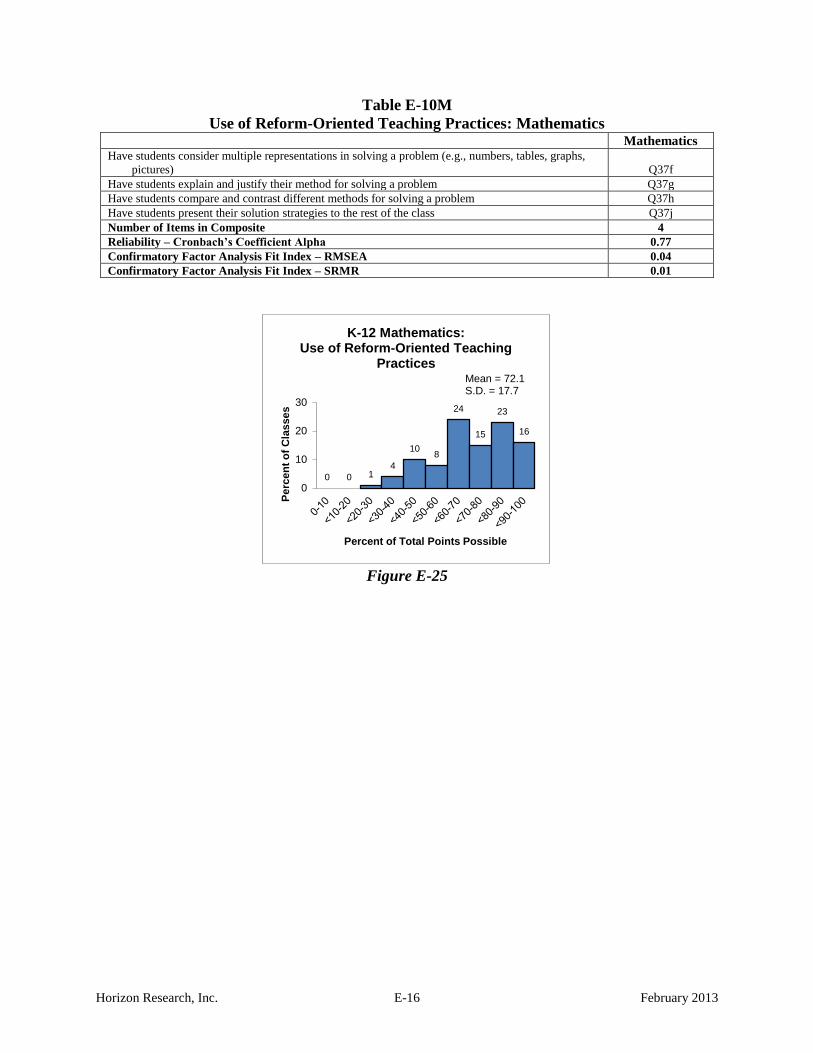
Horizon Research, Inc. E-16 February 2013
Table E-10M
Use of Reform-Oriented Teaching Practices: Mathematics Mathematics
Have students consider multiple representations in solving a problem (e.g., numbers, tables, graphs,
pictures) Q37f
Have students explain and justify their method for solving a problem Q37g
Have students compare and contrast different methods for solving a problem Q37h
Have students present their solution strategies to the rest of the class Q37j
Number of Items in Composite 4
Reliability – Cronbach’s Coefficient Alpha 0.77
Confirmatory Factor Analysis Fit Index – RMSEA 0.04
Confirmatory Factor Analysis Fit Index – SRMR 0.01
Figure E-25
0 0 1 4
10 8
24
15
23
16
0
10
20
30
Perc
en
t o
f C
lasses
Percent of Total Points Possible
K-12 Mathematics: Use of Reform-Oriented Teaching
Practices Mean = 72.1
S.D. = 17.7

Horizon Research, Inc. E-17 February 2013
Table E-11
Use of Instructional Technology Science Mathematics
Personal computers, including laptops Q53a Q40a
Hand-held computers Q53b Q40b
Internet Q53c Q40c
Calculators/Graphing Calculators† Q53d/e —
Probes for collecting data Q53f —
Number of Items in Composite 5 3
Reliability – Cronbach’s Coefficient Alpha 0.70 0.70
Confirmatory Factor Analysis Fit Index – RMSEA 0.04 0.07
Confirmatory Factor Analysis Fit Index – SRMR 0.05 0.05 † Elementary teachers were asked about their use of “calculators,” middle and high school teachers were asked about their
use of “graphing calculators.”
Figure E-26 Figure E-27
21 22
9
28
11
5 3
1 0 0
0
10
20
30
Perc
en
t o
f C
lasses
Percent of Total Points Possible
K-12 Science: Use of Instructional Technology
Mean = 27.6 S.D. = 17.7
29
14 11
15
21
4 4 2 1 1
0
10
20
30
Perc
en
t o
f C
lasses
Percent of Total Points Possible
K-12 Mathematics: Use of Instructional Technology
Mean = 28.4 S.D. = 22.4

Horizon Research, Inc. E-18 February 2013
Influences on Instruction
These composites estimate the extent to which teachers perceive various factors as promoting/
inhibiting effective instruction.
Table E-12S
Adequacy of Resources for Instruction: Science Science
Science courses may benefit from the availability of particular kinds of equipment (e.g., microscopes,
beakers, photogate timers, Bunsen burners). How adequate is the equipment you have available
for teaching this science class? Q63
Science courses may benefit from the availability of particular kinds of instructional technology (e.g.,
calculators, computers, probes/sensors). How adequate is the instructional technology you have
available for teaching this science class? Q64
Science courses may benefit from the availability of particular kinds of consumable supplies (e.g.,
chemicals, living organisms, batteries). How adequate are the consumable supplies you have
available for teaching this science class? Q65
Science courses may benefit from the availability of particular kinds of facilities (e.g., lab tables,
electric outlets, faucets and sinks). How adequate are the facilities you have available for teaching
this science class? Q66
Number of Items in Composite 4
Reliability – Cronbach’s Coefficient Alpha 0.84
Confirmatory Factor Analysis Fit Index – RMSEA 0.03
Confirmatory Factor Analysis Fit Index – SRMR 0.01
Figure E-28
6 7 6
10
15
7
16
8
12 13
0
10
20
Perc
en
t o
f C
lasses
Percent of Total Points Possible
K-12 Science: Adequacy of Resources for
Instruction Mean = 56.6
S.D. = 27.9

Horizon Research, Inc. E-19 February 2013
Table E-12M
Adequacy of Resources for Instruction: Mathematics Mathematics
Instructional technology (e.g., calculators, computers, probes/sensors) Q49a
Measurement tools (e.g., protractors, rulers) Q49b
Manipulatives (e.g., pattern blocks, algebra tiles) Q49c
Consumable supplies (e.g., graphing paper, batteries) Q49d
Number of Items in Composite 4
Reliability – Cronbach’s Coefficient Alpha 0.74
Confirmatory Factor Analysis Fit Index – RMSEA 0.14
Confirmatory Factor Analysis Fit Index – SRMR 0.03
Figure E-29
1 2 2
6
13
7
14 12
19
24
0
10
20
30
Perc
en
t o
f C
lasses
Percent of Total Points Possible
K-12 Mathematics: Adequacy of Resources for
Instruction
Mean = 70.5 S.D. = 23.9

Horizon Research, Inc. E-20 February 2013
Table E-13
Extent to Which the Quality of Instructional Technology Is Problematic for Instruction Science Mathematics
Lack of access to computers Q67a Q50a
Old age of computers Q67b Q50b
Lack of access to the Internet Q67c Q50c
Unreliability of the Internet connection Q67d Q50d
Slow speed of the Internet connection Q67e Q50e
Lack of availability of appropriate computer software Q67f Q50f
Lack of availability of technology support Q67g Q50g
Number of Items in Composite 7 7
Reliability – Cronbach’s Coefficient Alpha 0.86 0.87
Confirmatory Factor Analysis Fit Index – RMSEA 0.10 0.11
Confirmatory Factor Analysis Fit Index – SRMR 0.03 0.03
Figure E-30 Figure E-31
39
13 18
5 11
3 3 4 1 3
0
10
20
30
40
50
Perc
en
t o
f C
lasses
Percent of Total Points Possible
K-12 Science: Extent to Which Quality of IT Is
Problematic for Instruction
Mean = 24.3 S.D. = 25.3
45
11 17
6 11
3 2 3 1 2
0
10
20
30
40
50
Perc
en
t o
f C
lasses
Percent of Total Points Possible
K-12 Mathematics: Extent to Which Quality of IT Is
Problematic for Instruction
Mean = 21.7 S.D. = 24.0

Horizon Research, Inc. E-21 February 2013
Table E-14
Extent to Which the Policy Environment Promotes Effective Instruction Science Mathematics
Current state standards Q68a Q51a
District/Diocese curriculum frameworks† Q68b Q51b
School/District/Diocese pacing guides Q68c Q51c
State testing/accountability policies† Q68d Q51d
District/Diocese testing/accountability policies† Q68e Q51e
Textbook/module selection policies‡ Q68f
Textbook/program selection policies‡ Q51f
Teacher evaluation policies Q68g Q51g
Number of Items in Composite 7 7
Reliability – Cronbach’s Coefficient Alpha 0.88 0.89
Confirmatory Factor Analysis Fit Index – RMSEA 0.08 0.08
Confirmatory Factor Analysis Fit Index – SRMR 0.05 0.04 † This item was presented only to teachers in public and Catholic schools. ‡ The science and mathematics versions of this item are considered equivalent, worded appropriately for that discipline.
Figure E-32 Figure E-33
1 2 4
8
17 13
16 16
10
15
0
10
20
30
Perc
en
t o
f C
lasses
Percent of Total Points Possible
K-12 Science: Extent to Which the Policy
Environment Promotes Effective Instruction
Mean = 64.1 S.D. = 22.0
1 1 4 5
13 9
15 18
14
20
0
10
20
30
Perc
en
t o
f C
lasses
Percent of Total Points Possible
K-12 Mathematics: Extent to Which the Policy
Environment Promotes Effective Instruction
Mean = 68.5 S.D. = 22.9

Horizon Research, Inc. E-22 February 2013
Table E-15
Extent to Which Stakeholders Promote Effective Instruction Science Mathematics
Students’ motivation, interest, and effort in science‡ Q68i
Students’ motivation, interest, and effort in mathematics‡ Q51i
Students’ reading abilities Q68j Q51j
Community views on science instruction‡ Q68k
Community views on mathematics instruction‡ Q51k
Parent expectations and involvement Q68l Q51l
Number of Items in Composite 4 4
Reliability – Cronbach’s Coefficient Alpha 0.84 0.87
Confirmatory Factor Analysis Fit Index – RMSEA 0.08 0.08
Confirmatory Factor Analysis Fit Index – SRMR 0.05 0.04 ‡ The science and mathematics versions of this item are considered equivalent, worded appropriately for that discipline.
Figure E-34 Figure E-35
1 2 4
10
15
7
18
10
15
19
0
10
20
30
Perc
en
t o
f C
lasses
Percent of Total Points Possible
K-12 Science: Extent to Which Stakeholders Promote Effective Instruction
Mean = 66.1 S.D. = 24.1
3 4 4
9
15
7
14
10
15
20
0
10
20
30
Perc
en
t o
f C
lasses
Percent of Total Points Possible
K-12 Mathematics: Extent to Which Stakeholders Promote Effective Instruction
Mean = 64.8 S.D. = 26.0

Horizon Research, Inc. E-23 February 2013
Table E-16
Extent to Which School Support Promotes Effective Instruction Science Mathematics
Time for you to plan, individually and with colleagues Q68n Q51n
Time available for your professional development Q68o Q51o
Number of Items in Composite 2 2
Reliability – Cronbach’s Coefficient Alpha 0.85 0.86
Confirmatory Factor Analysis Fit Index – RMSEA 0.08 0.08
Confirmatory Factor Analysis Fit Index – SRMR 0.05 0.04
Figure E-36 Figure E-37
6 3
12
5
16
0
7
18
7
27
0
10
20
30
40
Perc
en
t o
f C
lasses
Percent of Total Points Possible
K-12 Science: Extent to Which School Support Promotes Effective Instruction
Mean = 63.8 S.D. = 31.3
4 2
8 5
15
0
8
17
9
32
0
10
20
30
40
Perc
en
t o
f C
lasses
Percent of Total Points Possible
K-12 Mathematics: Extent to Which School Support Promotes Effective Instruction
Mean = 69.2 S.D. = 29.5
Horizon Research, Inc. E-24 February 2013
Definitions of Program Composites
Composite definitions for the science and mathematics program questionnaire are presented
below along with the item numbers from the respective questionnaires. Composites that are
identical for the two subjects are presented in the same table; composites unique to a subject are
presented in separate tables.
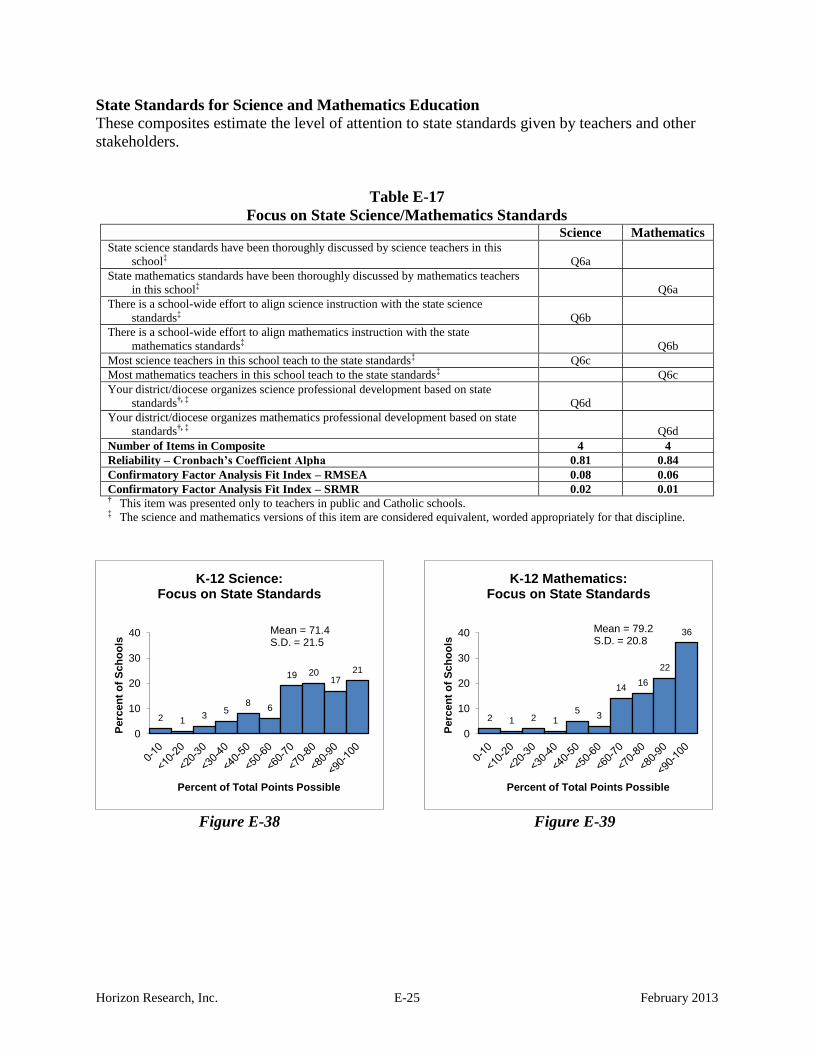
Horizon Research, Inc. E-25 February 2013
State Standards for Science and Mathematics Education
These composites estimate the level of attention to state standards given by teachers and other
stakeholders.
Table E-17
Focus on State Science/Mathematics Standards Science Mathematics
State science standards have been thoroughly discussed by science teachers in this
school‡ Q6a
State mathematics standards have been thoroughly discussed by mathematics teachers
in this school‡ Q6a
There is a school-wide effort to align science instruction with the state science
standards‡ Q6b
There is a school-wide effort to align mathematics instruction with the state
mathematics standards‡ Q6b
Most science teachers in this school teach to the state standards‡ Q6c
Most mathematics teachers in this school teach to the state standards‡ Q6c
Your district/diocese organizes science professional development based on state
standards†, ‡ Q6d
Your district/diocese organizes mathematics professional development based on state
standards†, ‡ Q6d
Number of Items in Composite 4 4
Reliability – Cronbach’s Coefficient Alpha 0.81 0.84
Confirmatory Factor Analysis Fit Index – RMSEA 0.08 0.06
Confirmatory Factor Analysis Fit Index – SRMR 0.02 0.01 † This item was presented only to teachers in public and Catholic schools. ‡ The science and mathematics versions of this item are considered equivalent, worded appropriately for that discipline.
Figure E-38 Figure E-39
2 1 3
5 8
6
19 20 17
21
0
10
20
30
40
Perc
en
t o
f S
ch
oo
ls
Percent of Total Points Possible
K-12 Science: Focus on State Standards
Mean = 71.4 S.D. = 21.5
2 1 2 1 5
3
14 16
22
36
0
10
20
30
40
Perc
en
t o
f S
ch
oo
ls
Percent of Total Points Possible
K-12 Mathematics: Focus on State Standards
Mean = 79.2 S.D. = 20.8

Horizon Research, Inc. E-26 February 2013
Factors Affecting Instruction
These composites estimate the extent to which various factors impact science/mathematics
instruction in schools.
Table E-18
Supportive Context for Science/Mathematics Instruction Science Mathematics
District/Diocese science professional development policies and practices†, ‡ Q32a
District/Diocese mathematics professional development policies and practices†, ‡ Q20a
Time provided for teacher professional development in science‡ Q32b
Time provided for teacher professional development in mathematics‡ Q20b
Importance that the school places on science‡ Q32c
Importance that the school places on mathematics‡ Q20c
Public attitudes toward science instruction‡ Q32d
Public attitudes toward mathematics instruction‡ Q20d
Conflict between efforts to improve science instruction and other school and/or
district/diocese initiatives‡ Q32e
Conflict between efforts to improve mathematics instruction and other school and/or
district/diocese initiatives‡ Q20e
How science instructional resources are managed (e.g., distributing and refurbishing
materials) Q32f
Equipment and supplies and/or manipulatives for teaching mathematics (e.g., materials
for students to draw, cut and build in order to make sense of problems) Q20f
Number of Items in Composite 6 6
Reliability – Cronbach’s Coefficient Alpha 0.78 0.75
Confirmatory Factor Analysis Fit Index – RMSEA 0.10 0.06
Confirmatory Factor Analysis Fit Index – SRMR 0.03 0.02 † This item was presented only to teachers in public and Catholic schools. ‡ The science and mathematics versions of this item are considered equivalent, worded appropriately for that discipline.
Figure E-40 Figure E-41
3 1
4
8
16 14 15
17
12 9
0
10
20
30
Perc
en
t o
f S
ch
oo
ls
Percent of Total Points Possible
K-12 Science: Supportive Context for Science
Instruction
Mean = 61.6 S.D. = 22.4
0 1 2 5
12 11 13
24
15 18
0
10
20
30
Perc
en
t o
f S
ch
oo
ls
Percent of Total Points Possible
K-12 Mathematics: Supportive Context for
Mathematics Instruction
Mean = 70.2 S.D. = 19.8
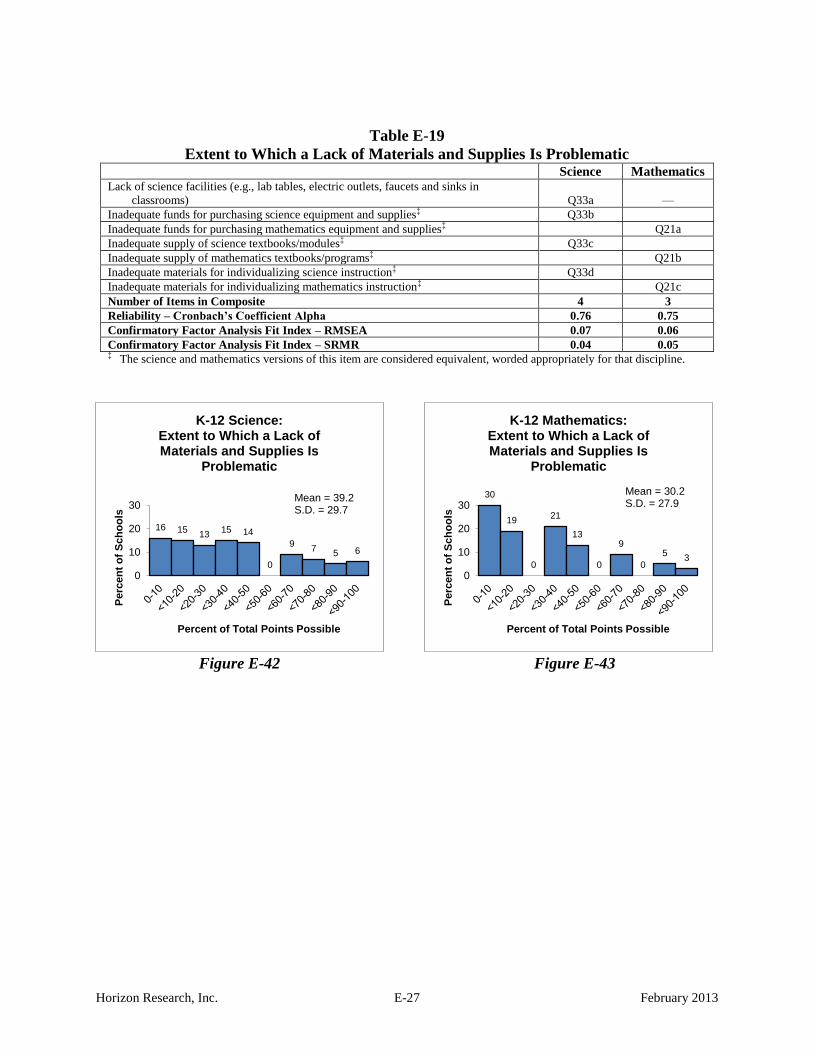
Horizon Research, Inc. E-27 February 2013
Table E-19
Extent to Which a Lack of Materials and Supplies Is Problematic Science Mathematics
Lack of science facilities (e.g., lab tables, electric outlets, faucets and sinks in
classrooms) Q33a —
Inadequate funds for purchasing science equipment and supplies‡ Q33b
Inadequate funds for purchasing mathematics equipment and supplies‡ Q21a
Inadequate supply of science textbooks/modules‡ Q33c
Inadequate supply of mathematics textbooks/programs‡ Q21b
Inadequate materials for individualizing science instruction‡ Q33d
Inadequate materials for individualizing mathematics instruction‡ Q21c
Number of Items in Composite 4 3
Reliability – Cronbach’s Coefficient Alpha 0.76 0.75
Confirmatory Factor Analysis Fit Index – RMSEA 0.07 0.06
Confirmatory Factor Analysis Fit Index – SRMR 0.04 0.05 ‡ The science and mathematics versions of this item are considered equivalent, worded appropriately for that discipline.
Figure E-42 Figure E-43
16 15 13
15 14
0
9 7
5 6
0
10
20
30
Perc
en
t o
f S
ch
oo
ls
Percent of Total Points Possible
K-12 Science: Extent to Which a Lack of Materials and Supplies Is
Problematic
Mean = 39.2 S.D. = 29.7
30
19
0
21
13
0
9
0
5 3
0
10
20
30
Perc
en
t o
f S
ch
oo
ls
Percent of Total Points Possible
K-12 Mathematics: Extent to Which a Lack of Materials and Supplies Is
Problematic
Mean = 30.2 S.D. = 27.9

Horizon Research, Inc. E-28 February 2013
Table E-20
Extent to Which Student Issues Are Problematic Science Mathematics
Low student interest in science‡ Q33e
Low student interest in mathematics‡ Q21d
Low student reading abilities Q33f Q21e
Large class sizes Q33m Q21l
High student absenteeism Q33n Q21m
Inappropriate student behavior Q33o Q21n
Number of Items in Composite 5 5
Reliability – Cronbach’s Coefficient Alpha 0.76 0.78
Confirmatory Factor Analysis Fit Index – RMSEA 0.07 0.06
Confirmatory Factor Analysis Fit Index – SRMR 0.04 0.05 ‡ The science and mathematics versions of this item are considered equivalent, worded appropriately for that discipline.
Figure E-44 Figure E-45
18
32
12 11 11 6 5 4
1 1
0
10
20
30
40
Perc
en
t o
f S
ch
oo
ls
Percent of Total Points Possible
K-12 Science: Extent to Which Student Issues
Are Problematic
Mean = 29.9 S.D. = 24.8
10
29
11 13 12 8 8
4 3 2
0
10
20
30
40
Perc
en
t o
f S
ch
oo
ls
Percent of Total Points Possible
K-12 Mathematics: Extent to Which Student Issues
Are Problematic
Mean = 37.0 S.D. = 25.8

Horizon Research, Inc. E-29 February 2013
Table E-21
Extent to Which Teacher Issues Are Problematic Science Mathematics
Lack of teacher interest in science‡ Q33g
Lack of teacher interest in mathematics‡ Q21f
Inadequate teacher preparation to teach science‡ Q33h
Inadequate teacher preparation to teach mathematics‡ Q21g
Number of Items in Composite 2 2
Reliability – Cronbach’s Coefficient Alpha 0.75 0.70
Confirmatory Factor Analysis Fit Index – RMSEA 0.07 0.06
Confirmatory Factor Analysis Fit Index – SRMR 0.04 0.05 ‡ The science and mathematics versions of this item are considered equivalent, worded appropriately for that discipline.
Figure E-46 Figure E-47
54
0
18
0
20
0 0 5
0 3
010203040506070
Perc
en
t o
f S
ch
oo
ls
Percent of Total Points Possible
K-12 Science: Extent to Which Teacher Issues
Are Problematic
Mean = 21.3 S.D. = 27.4
67
0
18
0
12
0 0 3 0 1
010203040506070
Perc
en
t o
f S
ch
oo
ls
Percent of Total Points Possible
K-12 Mathematics: Extent to Which Teacher Issues
Are Problematic
Mean = 13.5 S.D. = 22.1
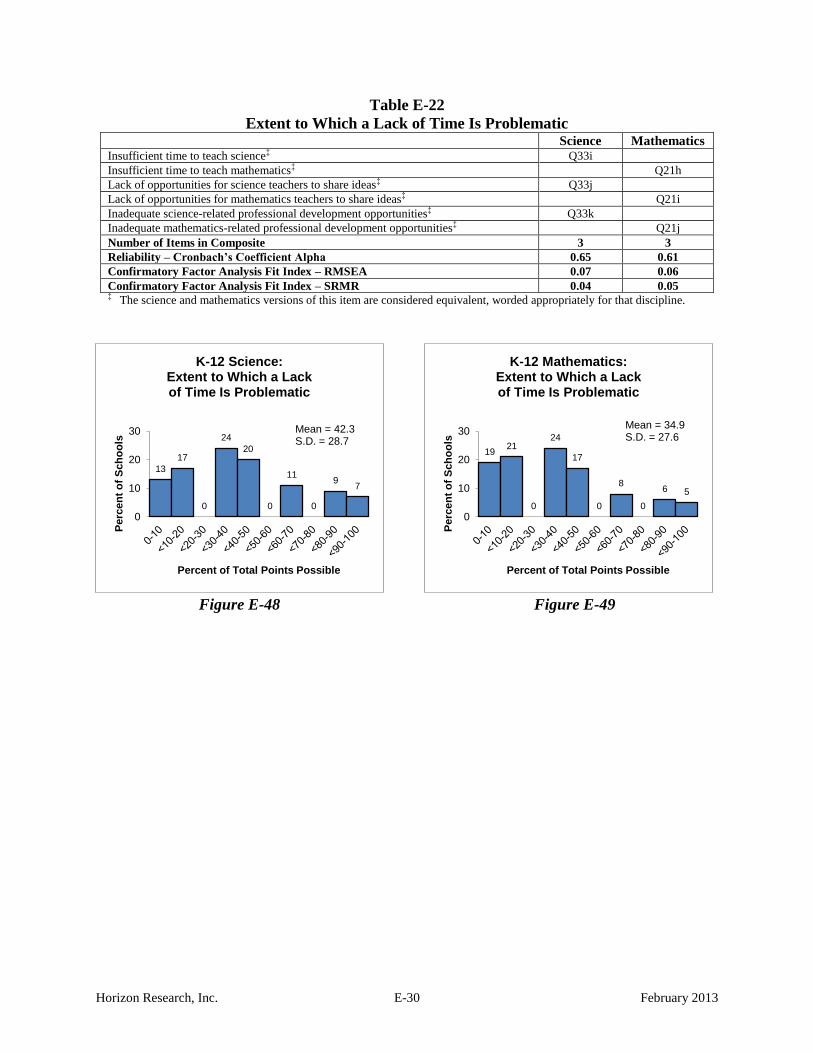
Horizon Research, Inc. E-30 February 2013
Table E-22
Extent to Which a Lack of Time Is Problematic Science Mathematics
Insufficient time to teach science‡ Q33i
Insufficient time to teach mathematics‡ Q21h
Lack of opportunities for science teachers to share ideas‡ Q33j
Lack of opportunities for mathematics teachers to share ideas‡ Q21i
Inadequate science-related professional development opportunities‡ Q33k
Inadequate mathematics-related professional development opportunities‡ Q21j
Number of Items in Composite 3 3
Reliability – Cronbach’s Coefficient Alpha 0.65 0.61
Confirmatory Factor Analysis Fit Index – RMSEA 0.07 0.06
Confirmatory Factor Analysis Fit Index – SRMR 0.04 0.05 ‡ The science and mathematics versions of this item are considered equivalent, worded appropriately for that discipline.
Figure E-48 Figure E-49
13
17
0
24
20
0
11
0
9 7
0
10
20
30
Perc
en
t o
f S
ch
oo
ls
Percent of Total Points Possible
K-12 Science: Extent to Which a Lack of Time Is Problematic
Mean = 42.3 S.D. = 28.7
19 21
0
24
17
0
8
0
6 5
0
10
20
30
Perc
en
t o
f S
ch
oo
ls
Percent of Total Points Possible
K-12 Mathematics: Extent to Which a Lack of Time Is Problematic
Mean = 34.9 S.D. = 27.6

Horizon Research, Inc. E-31 February 2013

Horizon Research, Inc. February 2013
APPENDIX F
Additional Equity Cross-tabulations

Horizon Research, Inc. F-1 February 2013
Additional Equity Cross-tabulations Chapters 2–7 report data on several key indicators, disaggregated by one or more equity factors: the prior achievement level of students in the class, the percentage of non-Asian minority students in the class, the percentage of students in the school eligible for free/reduced-price lunch, school size, community type, and region. This appendix includes data on each of these indicators by all relevant equity factors. Each table title includes a reference to the related table in the body of the report.
Table F-1 (Table 2.3 – Science) Science Classes Taught by Teachers with
Varying Experience Teaching Science, by Equity Factors Percent of Classes
0–2 years 3–5 years 6–10 years 11–20 years ≥ 21 years Prior Achievement Level of Class
Mostly High Achievers 12 (1.7) 13 (1.5) 24 (2.7) 31 (3.1) 21 (2.4) Average/Mixed Achievers 15 (1.1) 17 (1.4) 23 (1.2) 29 (1.3) 16 (1.2) Mostly Low Achievers 18 (2.8) 17 (2.7) 27 (4.2) 27 (3.7) 11 (1.8)
Percent of Non-Asian Minority Students in Class Lowest Quartile 14 (1.9) 15 (1.9) 20 (2.2) 32 (2.6) 19 (2.1) Second Quartile 12 (1.5) 14 (1.8) 22 (2.6) 31 (2.2) 21 (2.6) Third Quartile 12 (1.3) 15 (1.9) 26 (2.2) 32 (2.5) 15 (1.6) Highest Quartile 21 (2.3) 19 (2.2) 24 (1.9) 24 (2.0) 11 (1.2)
Percent of Students in School Eligible for FRL Lowest Quartile 10 (1.3) 15 (1.8) 26 (2.3) 34 (2.5) 15 (1.6) Second Quartile 11 (1.4) 16 (2.0) 23 (2.0) 30 (1.9) 20 (2.2) Third Quartile 16 (1.7) 16 (1.7) 21 (2.0) 30 (2.0) 17 (1.6) Highest Quartile 23 (2.6) 22 (2.5) 23 (2.1) 21 (2.2) 11 (1.4)
School Size Smallest Schools 14 (1.6) 17 (1.6) 24 (2.7) 29 (2.0) 16 (1.7) Second Group 16 (1.9) 17 (2.2) 23 (2.3) 29 (1.7) 16 (1.8) Third Group 15 (1.5) 17 (1.8) 23 (1.9) 26 (1.7) 18 (2.0) Largest Schools 14 (2.0) 16 (1.5) 23 (2.0) 32 (2.6) 14 (1.5)
Community Type Rural 13 (1.1) 16 (1.5) 22 (1.8) 34 (2.2) 16 (1.7) Suburban 15 (1.3) 16 (1.5) 25 (1.4) 28 (1.6) 16 (1.3) Urban 16 (1.9) 18 (1.7) 23 (2.1) 27 (2.0) 16 (1.6)
Region Midwest 12 (1.4) 14 (1.4) 21 (1.9) 33 (2.3) 19 (1.7) Northeast 14 (2.4) 19 (3.1) 23 (2.9) 29 (2.1) 15 (2.1) South 18 (1.5) 17 (1.4) 24 (1.4) 26 (1.8) 15 (1.2) West 11 (1.7) 18 (1.9) 24 (2.6) 31 (2.2) 16 (1.9)

Horizon Research, Inc. F-2 February 2013
Table F-2 (Table 2.3 – Mathematics) Mathematics Classes Taught by Teachers with
Varying Experience Teaching Mathematics, by Equity Factors Percent of Classes
0–2 years 3–5 years 6–10 years 11–20 years ≥ 21 years Prior Achievement Level of
Class Mostly High Achievers 8 (1.5) 12 (1.5) 22 (2.4) 32 (2.3) 26 (1.9) Average/Mixed Achievers 13 (1.0) 16 (1.0) 23 (1.1) 29 (1.2) 18 (1.1) Mostly Low Achievers 15 (2.0) 14 (1.8) 22 (2.1) 33 (2.4) 16 (2.0)
Percent of Non-Asian Minority Students in Class Lowest Quartile 12 (1.6) 11 (1.3) 20 (1.9) 32 (2.2) 24 (2.1) Second Quartile 8 (1.2) 14 (1.4) 24 (1.8) 34 (2.0) 20 (1.6) Third Quartile 15 (1.8) 16 (1.6) 21 (1.6) 27 (1.9) 21 (1.8) Highest Quartile 14 (1.8) 16 (1.5) 25 (1.8) 32 (2.1) 13 (1.4)
Percent of Students in School Eligible for FRL Lowest Quartile 12 (2.2) 13 (1.4) 24 (1.9) 30 (2.1) 22 (2.0) Second Quartile 12 (1.0) 13 (1.4) 24 (1.7) 32 (2.0) 19 (1.5) Third Quartile 12 (1.4) 16 (1.8) 22 (1.8) 30 (1.8) 21 (1.6) Highest Quartile 14 (1.6) 19 (1.9) 21 (1.7) 31 (2.1) 15 (1.6)
School Size Smallest Schools 16 (1.9) 14 (1.4) 21 (1.8) 30 (2.0) 20 (1.9) Second Group 11 (1.1) 17 (1.8) 21 (1.4) 30 (1.8) 22 (1.7) Third Group 11 (1.4) 15 (1.6) 24 (1.6) 31 (1.8) 18 (1.6) Largest Schools 13 (1.7) 14 (1.4) 24 (1.8) 32 (2.0) 17 (2.0)
Community Type Rural 13 (1.6) 15 (1.6) 21 (1.6) 31 (2.1) 20 (1.7) Suburban 12 (1.2) 14 (1.0) 24 (1.1) 31 (1.4) 19 (1.3) Urban 14 (1.2) 16 (1.7) 21 (1.6) 29 (1.8) 19 (1.7)
Region Midwest 12 (1.5) 15 (1.9) 21 (2.0) 30 (1.9) 22 (1.8) Northeast 10 (1.6) 15 (1.7) 22 (1.9) 33 (2.2) 20 (2.4) South 16 (1.5) 16 (1.2) 23 (1.2) 28 (1.5) 17 (1.3) West 8 (1.0) 13 (1.5) 25 (2.0) 36 (2.5) 19 (1.7)

Horizon Research, Inc. F-3 February 2013
Table F-3 (Table 2.6) Secondary Teachers with a Degree in Discipline, by Equity Factors
Percent of Classes Science Mathematics
Prior Achievement Level of Class Mostly High Achievers 76 (2.7) 61 (2.8) Average/Mixed Achievers 60 (1.9) 53 (2.2) Mostly Low Achievers 50 (4.5) 49 (2.9)
Percent of Non-Asian Minority Students in Class Lowest Quartile 68 (3.6) 64 (3.1) Second Quartile 65 (3.7) 57 (3.0) Third Quartile 62 (3.1) 54 (2.8) Highest Quartile 58 (3.6) 44 (3.1)
Percent of Students in School Eligible for FRL Lowest Quartile 68 (3.1) 56 (3.5) Second Quartile 57 (3.3) 53 (2.8) Third Quartile 62 (3.7) 54 (3.1) Highest Quartile 58 (3.9) 51 (3.7)
School Size Smallest Schools 60 (3.3) 53 (2.9) Second Group 64 (3.5) 55 (3.3) Third Group 63 (3.1) 56 (2.4) Largest Schools 62 (3.9) 53 (3.4)
Community Type Rural 59 (2.8) 55 (3.2) Suburban 63 (2.3) 55 (2.2) Urban 63 (3.8) 52 (2.7)
Region Midwest 61 (3.9) 63 (3.4) Northeast 68 (3.2) 61 (3.2) South 62 (2.4) 51 (2.2) West 60 (3.4) 43 (3.7)

Horizon Research, Inc. F-4 February 2013
Table F-4 (Table 2.19) Secondary Science Classes Taught by Teachers with
Substantial Background† in Subject of Selected Class, by Equity Factors Percent of Classes Prior Achievement Level of Class
Mostly High Achievers 69 (2.9) Average/Mixed Achievers 64 (2.1) Mostly Low Achievers 57 (6.4)
Percent of Non-Asian Minority Students in Class Lowest Quartile 63 (4.1) Second Quartile 69 (3.0) Third Quartile 63 (2.9) Highest Quartile 62 (3.6)
Percent of Students in School Eligible for FRL Lowest Quartile 67 (2.5) Second Quartile 67 (3.1) Third Quartile 61 (4.1) Highest Quartile 65 (4.4)
School Size Smallest Schools 61 (3.5) Second Group 70 (3.1) Third Group 65 (3.1) Largest Schools 61 (3.3)
Community Type Rural 66 (3.8) Suburban 65 (2.3) Urban 61 (2.7)
Region Midwest 70 (3.4) Northeast 74 (3.1) South 58 (2.3) West 60 (4.5)
† Defined as having either a degree or at least three advanced courses in the subject of their selected class.

Horizon Research, Inc. F-5 February 2013
Table F-5 (Table 2.35) Class Mean Scores for Science Teacher
Perceptions of Preparedness Composites, by Equity Factors Mean Score
Teach Students from Diverse Backgrounds
Encourage Students’ Interest in
Science
Teach Science
Content†
Implement Instruction in
Particular Unit Prior Achievement Level of Class
Mostly High Achievers 57 (1.8) 80 (1.3) 83 (1.1) 84 (1.0) Average/Mixed Achievers 56 (1.0) 69 (1.2) 79 (0.8) 77 (0.5) Mostly Low Achievers 51 (2.5) 65 (2.8) 73 (3.7) 75 (1.1)
Percent of Non-Asian Minority Students in Class Lowest Quartile 54 (1.8) 72 (1.8) 79 (1.6) 80 (1.0) Second Quartile 54 (1.6) 70 (1.7) 81 (1.0) 79 (0.9) Third Quartile 57 (1.4) 72 (1.5) 80 (1.1) 79 (0.9) Highest Quartile 55 (1.4) 65 (2.4) 79 (1.7) 76 (1.0)
Percent of Students in School Eligible for FRL Lowest Quartile 60 (2.0) 74 (1.9) 81 (1.0) 79 (1.0) Second Quartile 57 (1.5) 70 (1.8) 80 (1.1) 80 (0.6) Third Quartile 54 (1.4) 67 (2.8) 79 (1.3) 76 (0.9) Highest Quartile 54 (1.7) 68 (1.6) 80 (1.7) 76 (1.1)
School Size Smallest Schools 55 (1.6) 70 (1.7) 77 (2.0) 78 (0.9) Second Group 53 (1.7) 68 (2.1) 81 (1.1) 77 (1.1) Third Group 59 (1.3) 73 (1.6) 80 (1.1) 79 (0.9) Largest Schools 56 (1.2) 69 (2.4) 81 (1.8) 78 (0.9)
Community Type Rural 54 (1.4) 69 (1.8) 79 (1.0) 79 (0.9) Suburban 57 (1.3) 71 (1.4) 80 (1.0) 79 (0.6) Urban 55 (1.3) 70 (2.3) 79 (2.1) 76 (1.1)
Region Midwest 54 (1.4) 69 (1.7) 80 (1.4) 77 (1.1) Northeast 56 (2.4) 73 (2.6) 81 (1.3) 79 (1.2) South 56 (1.1) 68 (1.4) 79 (1.1) 78 (0.6) West 57 (1.7) 73 (2.0) 79 (2.5) 77 (0.9)
† Perceptions of Preparedness to Teach Science Content score was computed only for non-self-contained classes and is based on content in the randomly selected class.

Horizon Research, Inc. F-6 February 2013
Table F-6 (Table 2.38) Class Mean Scores for Mathematics Teacher
Perceptions of Preparedness Composites, by Equity Factors Mean Score
Teach Students from Diverse Backgrounds
Encourage Students’ Interest in
Mathematics
Teach Mathematics
Content†
Implement Instruction in
Particular Unit Prior Achievement Level of Class
Mostly High Achievers 59 (1.4) 79 (1.3) 86 (0.5) 88 (0.7) Average/Mixed Achievers 58 (0.8) 78 (0.8) 81 (0.6) 83 (0.5) Mostly Low Achievers 58 (1.5) 75 (1.5) 80 (0.8) 83 (0.8)
Percent of Non-Asian Minority Students in Class Lowest Quartile 55 (1.5) 75 (1.4) 82 (1.0) 85 (0.7) Second Quartile 57 (1.2) 78 (1.2) 85 (0.6) 85 (0.7) Third Quartile 59 (1.2) 78 (1.2) 82 (0.8) 84 (0.7) Highest Quartile 61 (1.4) 79 (1.3) 81 (0.9) 83 (0.8)
Percent of Students in School Eligible for FRL Lowest Quartile 58 (1.4) 76 (1.5) 85 (0.6) 86 (0.7) Second Quartile 60 (1.3) 79 (1.3) 82 (0.9) 85 (0.6) Third Quartile 57 (1.2) 77 (1.2) 82 (1.0) 84 (0.7) Highest Quartile 61 (1.6) 79 (1.5) 81 (1.0) 82 (0.8)
School Size Smallest Schools 53 (1.1) 75 (1.4) 80 (0.9) 84 (0.8) Second Group 57 (1.1) 78 (1.0) 82 (0.8) 84 (0.6) Third Group 61 (1.2) 78 (1.2) 84 (0.7) 84 (0.6) Largest Schools 62 (1.5) 80 (1.4) 83 (0.7) 85 (0.7)
Community Type Rural 57 (1.3) 77 (1.2) 82 (0.8) 84 (0.7) Suburban 59 (1.0) 78 (0.9) 83 (0.5) 85 (0.4) Urban 59 (1.2) 78 (1.3) 81 (0.8) 83 (0.7)
Region Midwest 55 (1.6) 76 (1.3) 83 (0.9) 83 (0.8) Northeast 59 (1.3) 77 (1.6) 84 (1.1) 86 (0.7) South 59 (1.0) 79 (0.9) 82 (0.6) 84 (0.6) West 61 (1.6) 77 (1.6) 81 (1.0) 83 (0.7)
† Perceptions of Preparedness to Teach Mathematics Content score was computed only for non-self-contained classes.
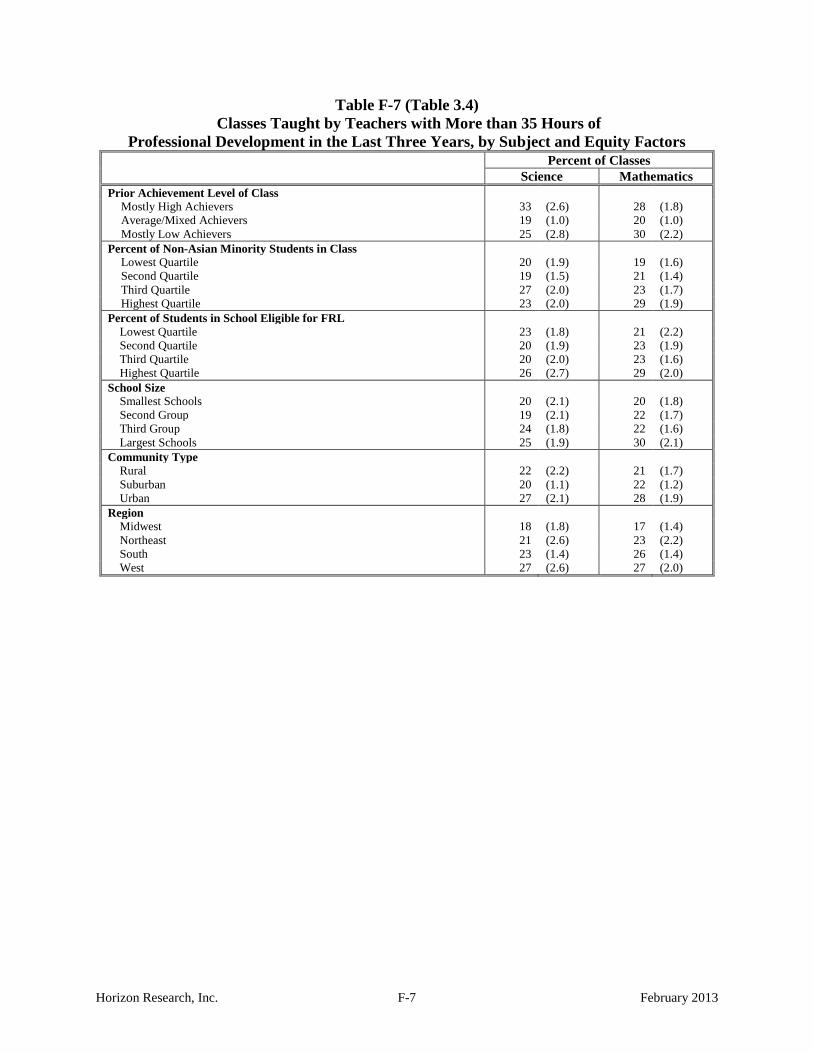
Horizon Research, Inc. F-7 February 2013
Table F-7 (Table 3.4) Classes Taught by Teachers with More than 35 Hours of
Professional Development in the Last Three Years, by Subject and Equity Factors Percent of Classes
Science Mathematics Prior Achievement Level of Class
Mostly High Achievers 33 (2.6) 28 (1.8) Average/Mixed Achievers 19 (1.0) 20 (1.0) Mostly Low Achievers 25 (2.8) 30 (2.2)
Percent of Non-Asian Minority Students in Class Lowest Quartile 20 (1.9) 19 (1.6) Second Quartile 19 (1.5) 21 (1.4) Third Quartile 27 (2.0) 23 (1.7) Highest Quartile 23 (2.0) 29 (1.9)
Percent of Students in School Eligible for FRL Lowest Quartile 23 (1.8) 21 (2.2) Second Quartile 20 (1.9) 23 (1.9) Third Quartile 20 (2.0) 23 (1.6) Highest Quartile 26 (2.7) 29 (2.0)
School Size Smallest Schools 20 (2.1) 20 (1.8) Second Group 19 (2.1) 22 (1.7) Third Group 24 (1.8) 22 (1.6) Largest Schools 25 (1.9) 30 (2.1)
Community Type Rural 22 (2.2) 21 (1.7) Suburban 20 (1.1) 22 (1.2) Urban 27 (2.1) 28 (1.9)
Region Midwest 18 (1.8) 17 (1.4) Northeast 21 (2.6) 23 (2.2) South 23 (1.4) 26 (1.4) West 27 (2.6) 27 (2.0)
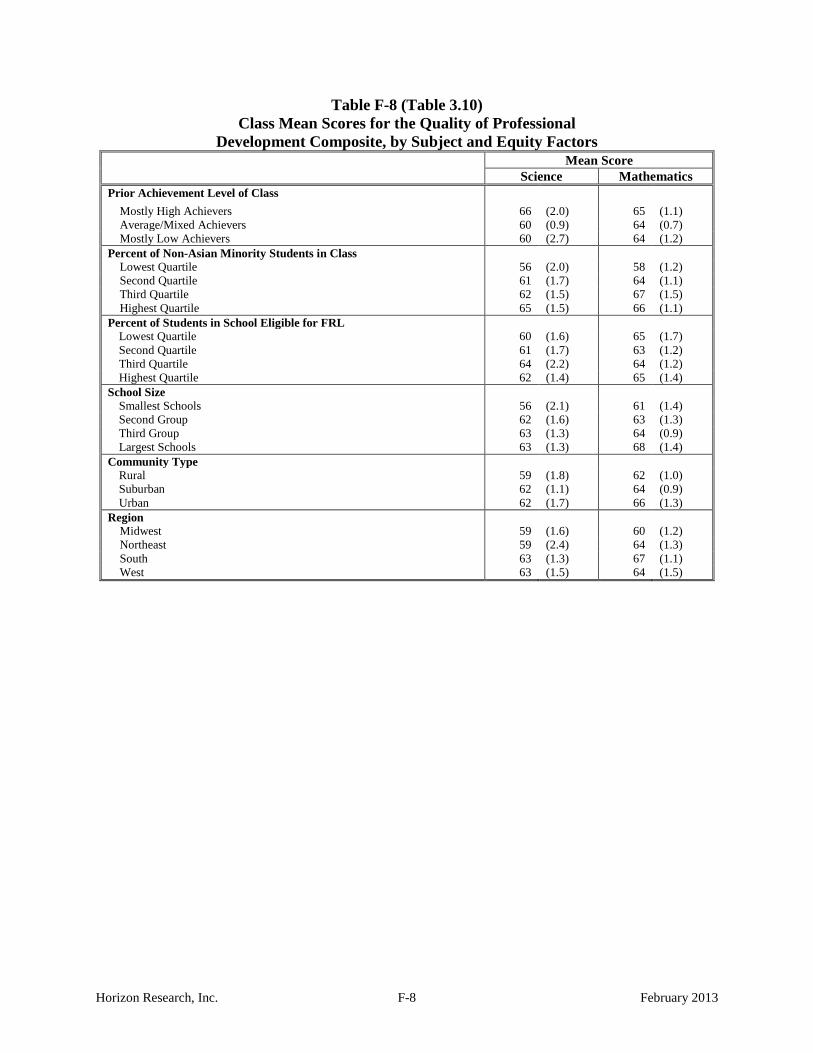
Horizon Research, Inc. F-8 February 2013
Table F-8 (Table 3.10) Class Mean Scores for the Quality of Professional
Development Composite, by Subject and Equity Factors Mean Score
Science Mathematics Prior Achievement Level of Class
Mostly High Achievers 66 (2.0) 65 (1.1) Average/Mixed Achievers 60 (0.9) 64 (0.7) Mostly Low Achievers 60 (2.7) 64 (1.2)
Percent of Non-Asian Minority Students in Class Lowest Quartile 56 (2.0) 58 (1.2) Second Quartile 61 (1.7) 64 (1.1) Third Quartile 62 (1.5) 67 (1.5) Highest Quartile 65 (1.5) 66 (1.1)
Percent of Students in School Eligible for FRL Lowest Quartile 60 (1.6) 65 (1.7) Second Quartile 61 (1.7) 63 (1.2) Third Quartile 64 (2.2) 64 (1.2) Highest Quartile 62 (1.4) 65 (1.4)
School Size Smallest Schools 56 (2.1) 61 (1.4) Second Group 62 (1.6) 63 (1.3) Third Group 63 (1.3) 64 (0.9) Largest Schools 63 (1.3) 68 (1.4)
Community Type Rural 59 (1.8) 62 (1.0) Suburban 62 (1.1) 64 (0.9) Urban 62 (1.7) 66 (1.3)
Region Midwest 59 (1.6) 60 (1.2) Northeast 59 (2.4) 64 (1.3) South 63 (1.3) 67 (1.1) West 63 (1.5) 64 (1.5)

Horizon Research, Inc. F-9 February 2013
Table F-9 (Table 3.16) Class Mean Scores on the Extent to Which Professional Development/Coursework
Focused on Student-Centered Instruction Composite, by Subject and Equity Factors Mean Score
Science Mathematics Prior Achievement Level of Class
Mostly High Achievers 59 (2.3) 45 (1.9) Average/Mixed Achievers 48 (1.3) 48 (1.2) Mostly Low Achievers 51 (3.8) 51 (1.5)
Percent of Non-Asian Minority Students in Class Lowest Quartile 45 (2.1) 42 (1.8) Second Quartile 49 (2.1) 44 (1.7) Third Quartile 51 (2.8) 50 (1.5) Highest Quartile 53 (2.6) 55 (1.7)
Percent of Students in School Eligible for FRL Lowest Quartile 53 (2.4) 48 (1.7) Second Quartile 47 (2.0) 49 (1.9) Third Quartile 47 (2.9) 48 (1.6) Highest Quartile 53 (2.6) 51 (1.8)
School Size Smallest Schools 49 (2.2) 41 (2.0) Second Group 46 (2.6) 47 (1.3) Third Group 49 (2.3) 50 (1.6) Largest Schools 55 (2.9) 53 (1.9)
Community Type Rural 49 (2.2) 45 (1.9) Suburban 48 (1.6) 49 (1.1) Urban 54 (2.5) 49 (1.6)
Region Midwest 43 (2.3) 40 (1.9) Northeast 49 (2.7) 48 (1.8) South 56 (1.7) 54 (1.1) West 44 (2.9) 45 (1.8)

Horizon Research, Inc. F-10 February 2013
Table F-10 (Table 3.33) Schools Providing Various Services to Science Teachers, by Equity Factors
Percent of Schools
Science-Focused Study Groups
One-on-One Science-Focused
Coaching
Assistance to Science Teachers
in Need† Percent of Students in School Eligible for FRL
Lowest Quartile 34 (4.7) 16 (3.1) 81 (4.0) Second Quartile 34 (4.1) 17 (3.9) 78 (3.3) Third Quartile 49 (4.0) 18 (2.6) 79 (3.6) Highest Quartile 40 (4.2) 28 (3.8) 86 (3.0)
School Size Smallest Schools 35 (4.6) 14 (2.4) 82 (2.8) Second Group 41 (4.2) 21 (3.0) 80 (3.3) Third Group 41 (4.1) 24 (3.1) 83 (3.5) Largest Schools 49 (3.9) 30 (4.1) 81 (3.8)
Community Type Rural 42 (4.4) 11 (2.2) 80 (3.1) Suburban 38 (3.2) 20 (2.1) 83 (2.3) Urban 38 (4.0) 30 (2.8) 80 (3.7)
Region Midwest 39 (5.3) 11 (2.0) 76 (4.1) Northeast 34 (4.6) 28 (5.0) 88 (3.0) South 43 (3.8) 24 (2.3) 85 (2.2) West 39 (4.5) 18 (3.5) 76 (4.1)
† Assistance defined as guidance from a formally designated mentor or coach; seminars, classes, and/or study groups; or a higher level of supervision than for other teachers.
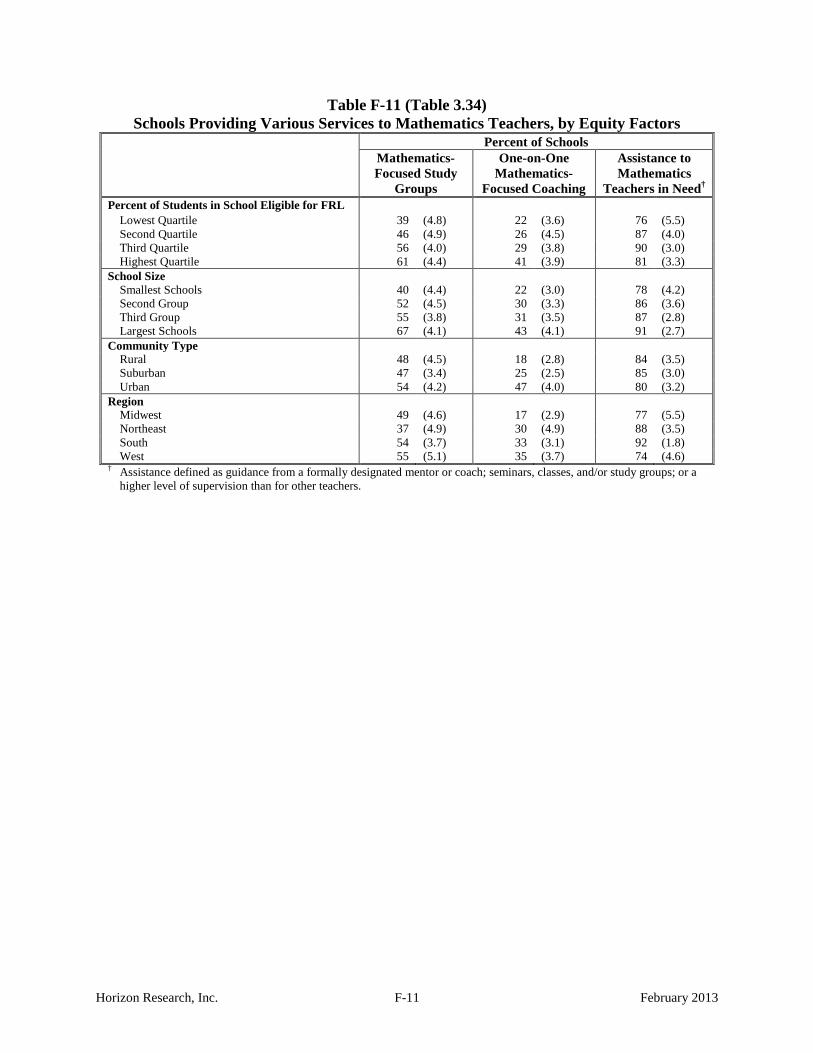
Horizon Research, Inc. F-11 February 2013
Table F-11 (Table 3.34) Schools Providing Various Services to Mathematics Teachers, by Equity Factors
Percent of Schools Mathematics-Focused Study
Groups
One-on-One Mathematics-
Focused Coaching
Assistance to Mathematics
Teachers in Need† Percent of Students in School Eligible for FRL
Lowest Quartile 39 (4.8) 22 (3.6) 76 (5.5) Second Quartile 46 (4.9) 26 (4.5) 87 (4.0) Third Quartile 56 (4.0) 29 (3.8) 90 (3.0) Highest Quartile 61 (4.4) 41 (3.9) 81 (3.3)
School Size Smallest Schools 40 (4.4) 22 (3.0) 78 (4.2) Second Group 52 (4.5) 30 (3.3) 86 (3.6) Third Group 55 (3.8) 31 (3.5) 87 (2.8) Largest Schools 67 (4.1) 43 (4.1) 91 (2.7)
Community Type Rural 48 (4.5) 18 (2.8) 84 (3.5) Suburban 47 (3.4) 25 (2.5) 85 (3.0) Urban 54 (4.2) 47 (4.0) 80 (3.2)
Region Midwest 49 (4.6) 17 (2.9) 77 (5.5) Northeast 37 (4.9) 30 (4.9) 88 (3.5) South 54 (3.7) 33 (3.1) 92 (1.8) West 55 (5.1) 35 (3.7) 74 (4.6)
† Assistance defined as guidance from a formally designated mentor or coach; seminars, classes, and/or study groups; or a higher level of supervision than for other teachers.

Horizon Research, Inc. F-12 February 2013
Table F-12 (Table 4.7) Average Number of AP Science Courses
Offered at High Schools, by Equity Factors Average Number of Courses Percent of Students in School Eligible for FRL
Lowest Quartile 2.0 (0.2) Second Quartile 1.5 (0.3) Third Quartile 1.1 (0.2) Highest Quartile 1.1 (0.2)
School Size Smallest Schools 0.7 (0.1) Second Group 1.2 (0.2) Third Group 2.1 (0.2) Largest Schools 2.8 (0.2)
Community Type Rural 0.7 (0.1) Suburban 1.7 (0.2) Urban 1.7 (0.3)
Region Midwest 0.8 (0.1) Northeast 1.9 (0.2) South 1.3 (0.1) West 1.4 (0.2)

Horizon Research, Inc. F-13 February 2013
Table F-13 (Table 4.10) Average Percentage of 8th Graders Completing
Algebra I and Geometry Prior to 9th Grade, by Equity Factors Percent of 8th Grade Students
Algebra 1 Geometry Percent of Students in School Eligible for FRL
Lowest Quartile 46 (6.1) 13 (3.4) Second Quartile 26 (4.5) 2 (0.6) Third Quartile 31 (5.9) 2 (0.8) Highest Quartile 28 (3.9) 6 (1.9)
School Size Smallest Schools 33 (4.6) 4 (1.4) Second Group 34 (4.1) 7 (2.3) Third Group 39 (4.0) 5 (1.8) Largest Schools 42 (3.1) 5 (0.7)
Community Type Rural 27 (4.4) 3 (1.7) Suburban 38 (3.2) 5 (1.5) Urban 42 (4.7) 7 (1.9)
Region Midwest 31 (4.4) 4 (1.5) Northeast 42 (6.2) 7 (2.9) South 27 (3.4) 4 (1.4) West 46 (6.3) 6 (2.2)

Horizon Research, Inc. F-14 February 2013
Table F-14 (Table 4.14) Average Number of AP Mathematics
Courses Offered at High Schools, by Equity Factors Average Number of Courses Percent of Students in School Eligible for FRL
Lowest Quartile 1.4 (0.2) Second Quartile 1.1 (0.2) Third Quartile 0.8 (0.1) Highest Quartile 0.7 (0.1)
School Size Smallest Schools 0.6 (0.1) Second Group 0.9 (0.1) Third Group 1.6 (0.1) Largest Schools 2.1 (0.1)
Community Type Rural 0.6 (0.1) Suburban 1.2 (0.1) Urban 1.3 (0.2)
Region Midwest 0.8 (0.1) Northeast 1.3 (0.2) South 1.0 (0.1) West 1.0 (0.1)
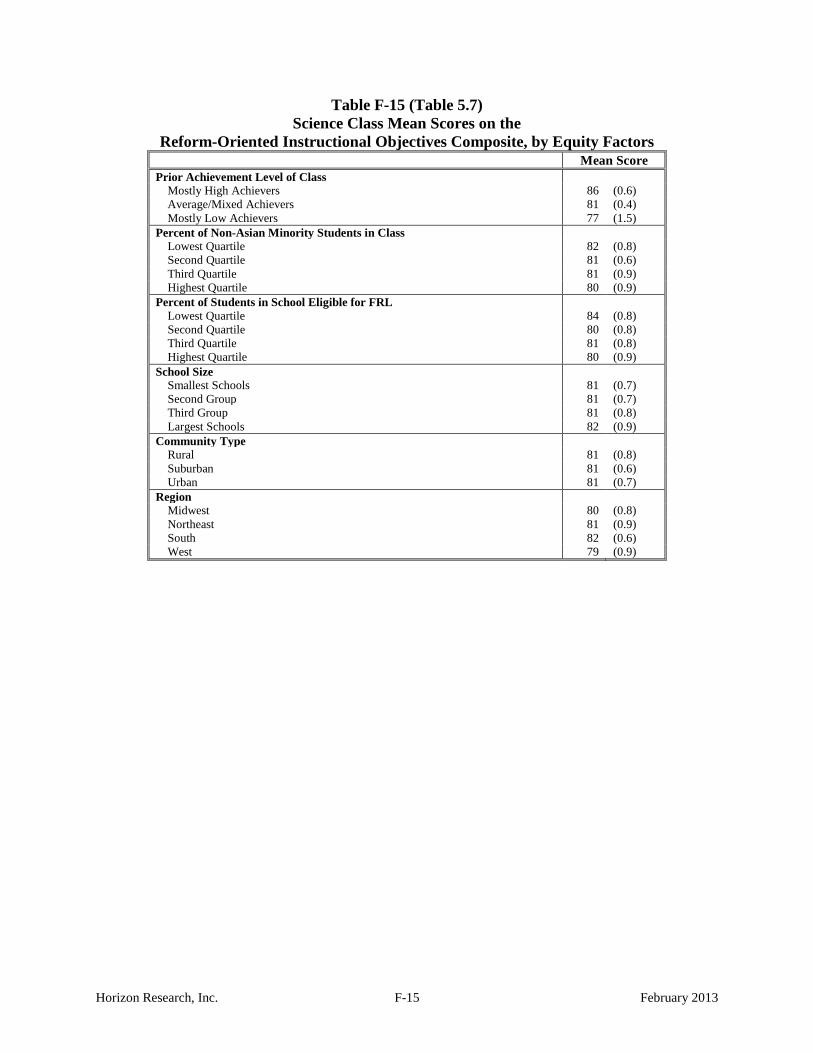
Horizon Research, Inc. F-15 February 2013
Table F-15 (Table 5.7) Science Class Mean Scores on the
Reform-Oriented Instructional Objectives Composite, by Equity Factors Mean Score Prior Achievement Level of Class
Mostly High Achievers 86 (0.6) Average/Mixed Achievers 81 (0.4) Mostly Low Achievers 77 (1.5)
Percent of Non-Asian Minority Students in Class Lowest Quartile 82 (0.8) Second Quartile 81 (0.6) Third Quartile 81 (0.9) Highest Quartile 80 (0.9)
Percent of Students in School Eligible for FRL Lowest Quartile 84 (0.8) Second Quartile 80 (0.8) Third Quartile 81 (0.8) Highest Quartile 80 (0.9)
School Size Smallest Schools 81 (0.7) Second Group 81 (0.7) Third Group 81 (0.8) Largest Schools 82 (0.9)
Community Type Rural 81 (0.8) Suburban 81 (0.6) Urban 81 (0.7)
Region Midwest 80 (0.8) Northeast 81 (0.9) South 82 (0.6) West 79 (0.9)

Horizon Research, Inc. F-16 February 2013
Table F-16 (Table 5.10) Mathematics Class Mean Scores on the
Reform-Oriented Instructional Objectives Composite, by Equity Factors Mean Score Prior Achievement Level of Class
Mostly High Achievers 85 (0.6) Average/Mixed Achievers 80 (0.4) Mostly Low Achievers 77 (0.7)
Percent of Non-Asian Minority Students in Class Lowest Quartile 80 (0.7) Second Quartile 80 (0.5) Third Quartile 80 (0.6) Highest Quartile 81 (0.6)
Percent of Students in School Eligible for FRL Lowest Quartile 82 (0.8) Second Quartile 79 (0.6) Third Quartile 80 (0.6) Highest Quartile 80 (0.8)
School Size Smallest Schools 79 (0.8) Second Group 79 (0.6) Third Group 81 (0.6) Largest Schools 82 (0.7)
Community Type Rural 80 (0.7) Suburban 80 (0.4) Urban 81 (0.7)
Region Midwest 79 (0.6) Northeast 80 (0.6) South 83 (0.5) West 77 (0.7)

Horizon Research, Inc. F-17 February 2013
Table F-17 (Table 5.16) Class Mean Scores on Science Teaching Practice Composites, by Equity Factors
Mean Score Use of Reform-
Oriented Teaching Practices
Use of Instructional Technology
Prior Achievement Level of Class Mostly High Achievers 63 (0.8) 33 (1.6) Average/Mixed Achievers 60 (0.4) 27 (0.8) Mostly Low Achievers 59 (1.1) 25 (1.7)
Percent of Non-Asian Minority Students in Class Lowest Quartile 60 (0.6) 28 (1.2) Second Quartile 60 (0.9) 28 (1.2) Third Quartile 59 (0.8) 27 (1.1) Highest Quartile 61 (0.8) 25 (1.4)
Percent of Students in School Eligible for FRL Lowest Quartile 63 (0.8) 29 (1.0) Second Quartile 60 (0.9) 28 (1.3) Third Quartile 60 (0.6) 27 (1.4) Highest Quartile 60 (0.9) 26 (1.2)
School Size Smallest Schools 59 (0.9) 30 (1.1) Second Group 60 (0.7) 25 (1.1) Third Group 61 (0.7) 28 (1.2) Largest Schools 61 (0.8) 27 (1.3)
Community Type Rural 59 (0.7) 28 (1.1) Suburban 60 (0.7) 27 (0.8) Urban 62 (0.7) 27 (1.3)
Region Midwest 58 (0.7) 27 (1.0) Northeast 61 (1.1) 27 (1.5) South 61 (0.6) 28 (1.1) West 61 (1.0) 27 (1.5)

Horizon Research, Inc. F-18 February 2013
Table F-18 (Table 5.24) Class Mean Scores on Mathematics Teaching Practice Composites, by Equity Factors
Mean Score Use of Reform-
Oriented Teaching Practices
Use of Instructional Technology
Prior Achievement Level of Class Mostly High Achievers 74 (0.7) 27 (1.3) Average/Mixed Achievers 72 (0.5) 28 (0.9) Mostly Low Achievers 70 (0.9) 30 (1.1)
Percent of Non-Asian Minority Students in Class Lowest Quartile 71 (0.8) 27 (1.2) Second Quartile 72 (0.7) 27 (1.4) Third Quartile 72 (0.7) 30 (1.4) Highest Quartile 73 (0.7) 29 (1.4)
Percent of Students in School Eligible for FRL Lowest Quartile 74 (0.8) 27 (1.4) Second Quartile 71 (0.8) 29 (1.6) Third Quartile 73 (0.6) 29 (1.5) Highest Quartile 72 (0.9) 31 (1.9)
School Size Smallest Schools 72 (0.9) 31 (1.4) Second Group 71 (0.9) 29 (1.5) Third Group 72 (0.6) 28 (1.4) Largest Schools 73 (0.9) 26 (1.7)
Community Type Rural 71 (0.8) 29 (1.5) Suburban 72 (0.5) 28 (0.9) Urban 73 (0.8) 28 (1.5)
Region Midwest 69 (0.7) 28 (1.5) Northeast 75 (0.7) 28 (1.8) South 74 (0.6) 31 (1.2) West 68 (0.9) 23 (1.4)

Horizon Research, Inc. F-19 February 2013
Table F-19 (Table 5.31) Classes Required to Take External Assessments Two
or More Times per Year, by Subject and Equity Factors Percent of Classes Science Mathematics Prior Achievement Level of Class
Mostly High Achievers 36 (3.1) 60 (2.6) Average/Mixed Achievers 36 (1.7) 71 (1.4) Mostly Low Achievers 53 (3.6) 76 (2.2)
Percent of Non-Asian Minority Students in Class Lowest Quartile 26 (2.4) 56 (2.4) Second Quartile 30 (2.6) 65 (2.0) Third Quartile 38 (3.3) 71 (2.1) Highest Quartile 52 (2.4) 83 (1.5)
Percent of Students in School Eligible for FRL Lowest Quartile 33 (2.9) 66 (2.4) Second Quartile 35 (2.4) 73 (1.9) Third Quartile 45 (3.5) 75 (1.9) Highest Quartile 50 (3.0) 81 (1.7)
School Size Smallest Schools 30 (3.0) 61 (2.7) Second Group 36 (3.0) 68 (2.2) Third Group 39 (3.3) 75 (1.8) Largest Schools 47 (2.6) 75 (1.9)
Community Type Rural 34 (2.6) 69 (2.0) Suburban 39 (2.0) 68 (1.7) Urban 40 (2.9) 74 (2.0)
Region Midwest 33 (2.2) 65 (2.1) Northeast 21 (3.0) 60 (3.3) South 50 (2.7) 75 (1.7) West 33 (3.4) 72 (2.2)
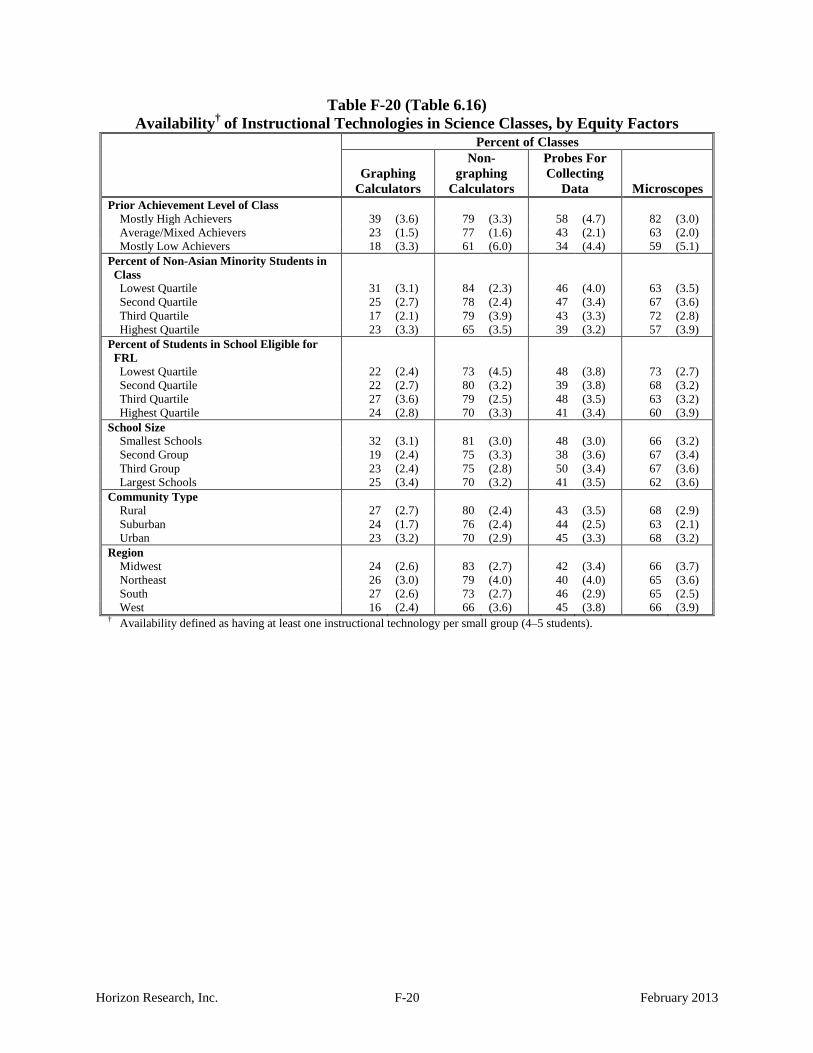
Horizon Research, Inc. F-20 February 2013
Table F-20 (Table 6.16) Availability† of Instructional Technologies in Science Classes, by Equity Factors
Percent of Classes
Graphing Calculators
Non-graphing
Calculators
Probes For Collecting
Data Microscopes Prior Achievement Level of Class
Mostly High Achievers 39 (3.6) 79 (3.3) 58 (4.7) 82 (3.0) Average/Mixed Achievers 23 (1.5) 77 (1.6) 43 (2.1) 63 (2.0) Mostly Low Achievers 18 (3.3) 61 (6.0) 34 (4.4) 59 (5.1)
Percent of Non-Asian Minority Students in Class
Lowest Quartile 31 (3.1) 84 (2.3) 46 (4.0) 63 (3.5) Second Quartile 25 (2.7) 78 (2.4) 47 (3.4) 67 (3.6) Third Quartile 17 (2.1) 79 (3.9) 43 (3.3) 72 (2.8) Highest Quartile 23 (3.3) 65 (3.5) 39 (3.2) 57 (3.9)
Percent of Students in School Eligible for FRL
Lowest Quartile 22 (2.4) 73 (4.5) 48 (3.8) 73 (2.7) Second Quartile 22 (2.7) 80 (3.2) 39 (3.8) 68 (3.2) Third Quartile 27 (3.6) 79 (2.5) 48 (3.5) 63 (3.2) Highest Quartile 24 (2.8) 70 (3.3) 41 (3.4) 60 (3.9)
School Size Smallest Schools 32 (3.1) 81 (3.0) 48 (3.0) 66 (3.2) Second Group 19 (2.4) 75 (3.3) 38 (3.6) 67 (3.4) Third Group 23 (2.4) 75 (2.8) 50 (3.4) 67 (3.6) Largest Schools 25 (3.4) 70 (3.2) 41 (3.5) 62 (3.6)
Community Type Rural 27 (2.7) 80 (2.4) 43 (3.5) 68 (2.9) Suburban 24 (1.7) 76 (2.4) 44 (2.5) 63 (2.1) Urban 23 (3.2) 70 (2.9) 45 (3.3) 68 (3.2)
Region Midwest 24 (2.6) 83 (2.7) 42 (3.4) 66 (3.7) Northeast 26 (3.0) 79 (4.0) 40 (4.0) 65 (3.6) South 27 (2.6) 73 (2.7) 46 (2.9) 65 (2.5) West 16 (2.4) 66 (3.6) 45 (3.8) 66 (3.9)
† Availability defined as having at least one instructional technology per small group (4–5 students).
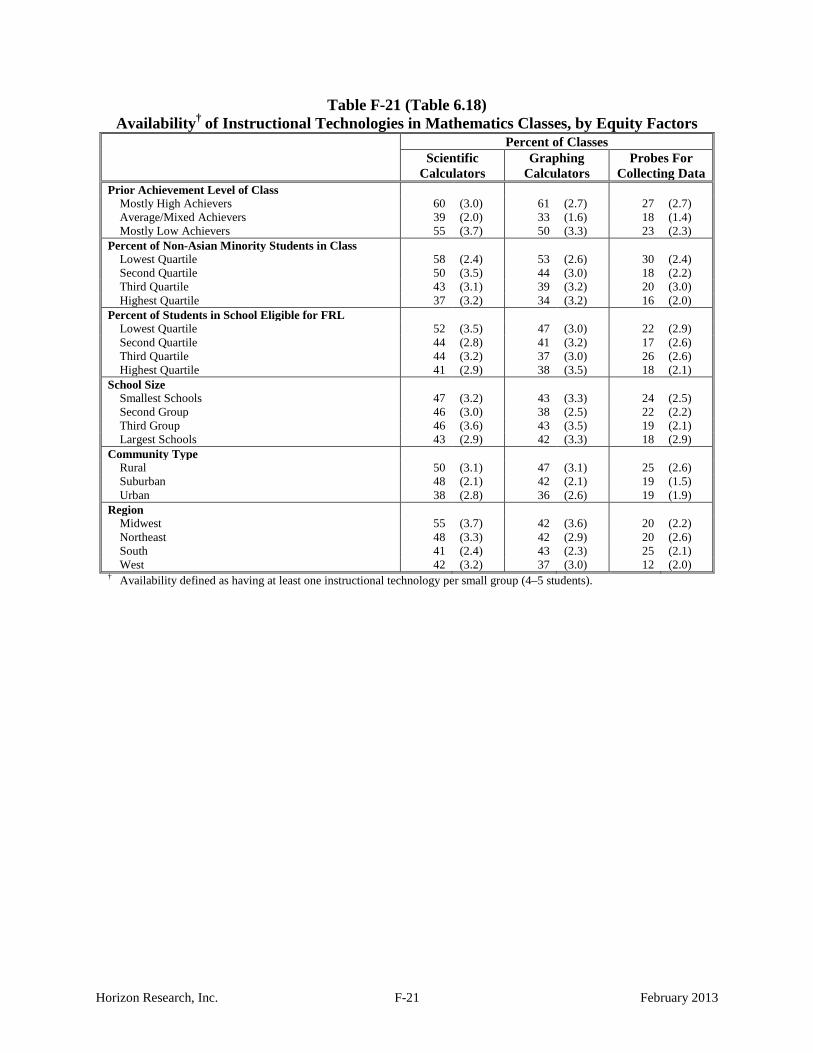
Horizon Research, Inc. F-21 February 2013
Table F-21 (Table 6.18) Availability† of Instructional Technologies in Mathematics Classes, by Equity Factors
Percent of Classes Scientific
Calculators Graphing
Calculators Probes For
Collecting Data Prior Achievement Level of Class
Mostly High Achievers 60 (3.0) 61 (2.7) 27 (2.7) Average/Mixed Achievers 39 (2.0) 33 (1.6) 18 (1.4) Mostly Low Achievers 55 (3.7) 50 (3.3) 23 (2.3)
Percent of Non-Asian Minority Students in Class Lowest Quartile 58 (2.4) 53 (2.6) 30 (2.4) Second Quartile 50 (3.5) 44 (3.0) 18 (2.2) Third Quartile 43 (3.1) 39 (3.2) 20 (3.0) Highest Quartile 37 (3.2) 34 (3.2) 16 (2.0)
Percent of Students in School Eligible for FRL Lowest Quartile 52 (3.5) 47 (3.0) 22 (2.9) Second Quartile 44 (2.8) 41 (3.2) 17 (2.6) Third Quartile 44 (3.2) 37 (3.0) 26 (2.6) Highest Quartile 41 (2.9) 38 (3.5) 18 (2.1)
School Size Smallest Schools 47 (3.2) 43 (3.3) 24 (2.5) Second Group 46 (3.0) 38 (2.5) 22 (2.2) Third Group 46 (3.6) 43 (3.5) 19 (2.1) Largest Schools 43 (2.9) 42 (3.3) 18 (2.9)
Community Type Rural 50 (3.1) 47 (3.1) 25 (2.6) Suburban 48 (2.1) 42 (2.1) 19 (1.5) Urban 38 (2.8) 36 (2.6) 19 (1.9)
Region Midwest 55 (3.7) 42 (3.6) 20 (2.2) Northeast 48 (3.3) 42 (2.9) 20 (2.6) South 41 (2.4) 43 (2.3) 25 (2.1) West 42 (3.2) 37 (3.0) 12 (2.0)
† Availability defined as having at least one instructional technology per small group (4–5 students).
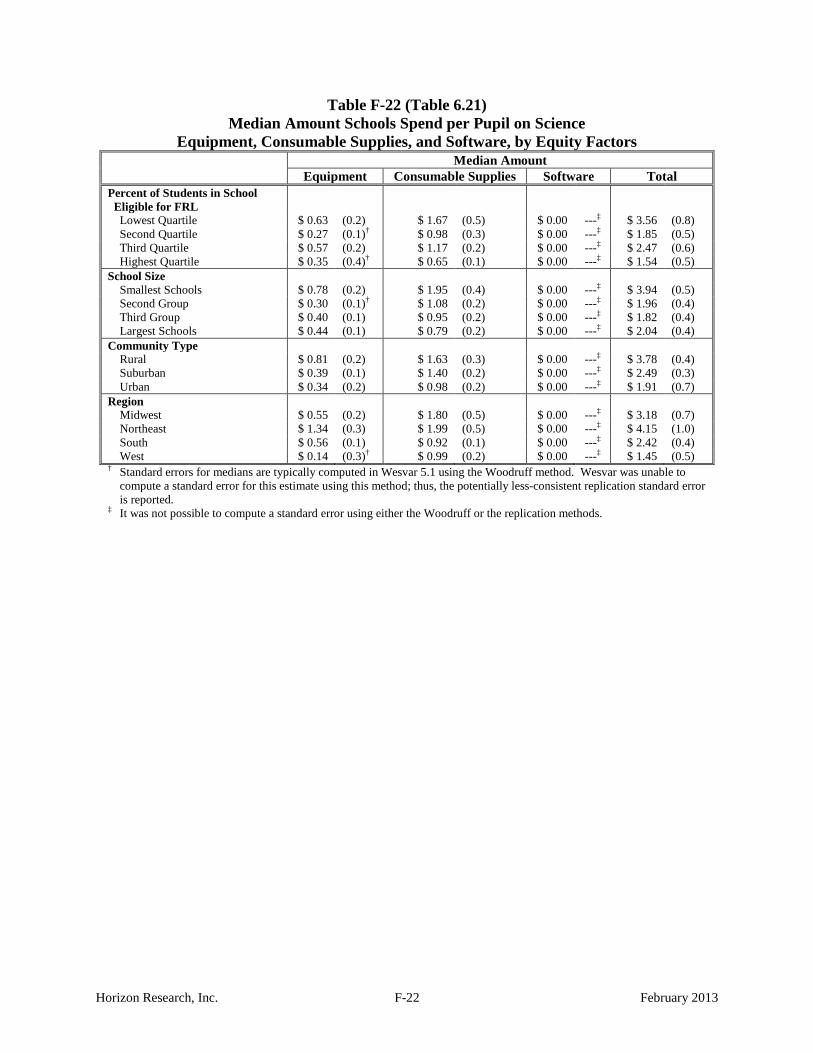
Horizon Research, Inc. F-22 February 2013
Table F-22 (Table 6.21) Median Amount Schools Spend per Pupil on Science
Equipment, Consumable Supplies, and Software, by Equity Factors Median Amount
Equipment Consumable Supplies Software Total Percent of Students in School
Eligible for FRL Lowest Quartile $ 0.63 (0.2) $ 1.67 (0.5) $ 0.00 ---‡ $ 3.56 (0.8) Second Quartile $ 0.27 (0.1)† $ 0.98 (0.3) $ 0.00 ---‡ $ 1.85 (0.5) Third Quartile $ 0.57 (0.2) $ 1.17 (0.2) $ 0.00 ---‡ $ 2.47 (0.6) Highest Quartile $ 0.35 (0.4)† $ 0.65 (0.1) $ 0.00 ---‡ $ 1.54 (0.5)
School Size Smallest Schools $ 0.78 (0.2) $ 1.95 (0.4) $ 0.00 ---‡ $ 3.94 (0.5) Second Group $ 0.30 (0.1)† $ 1.08 (0.2) $ 0.00 ---‡ $ 1.96 (0.4) Third Group $ 0.40 (0.1) $ 0.95 (0.2) $ 0.00 ---‡ $ 1.82 (0.4) Largest Schools $ 0.44 (0.1) $ 0.79 (0.2) $ 0.00 ---‡ $ 2.04 (0.4)
Community Type Rural $ 0.81 (0.2) $ 1.63 (0.3) $ 0.00 ---‡ $ 3.78 (0.4) Suburban $ 0.39 (0.1) $ 1.40 (0.2) $ 0.00 ---‡ $ 2.49 (0.3) Urban $ 0.34 (0.2) $ 0.98 (0.2) $ 0.00 ---‡ $ 1.91 (0.7)
Region Midwest $ 0.55 (0.2) $ 1.80 (0.5) $ 0.00 ---‡ $ 3.18 (0.7) Northeast $ 1.34 (0.3) $ 1.99 (0.5) $ 0.00 ---‡ $ 4.15 (1.0) South $ 0.56 (0.1) $ 0.92 (0.1) $ 0.00 ---‡ $ 2.42 (0.4) West $ 0.14 (0.3)† $ 0.99 (0.2) $ 0.00 ---‡ $ 1.45 (0.5)
† Standard errors for medians are typically computed in Wesvar 5.1 using the Woodruff method. Wesvar was unable to compute a standard error for this estimate using this method; thus, the potentially less-consistent replication standard error is reported.
‡ It was not possible to compute a standard error using either the Woodruff or the replication methods.

Horizon Research, Inc. F-23 February 2013
Table F-23 (Table 6.22) Median Amount Schools Spend per Pupil on Mathematics
Equipment, Consumable Supplies, and Software, by Equity Factors Median Amount
Equipment Consumable Supplies Software Total Percent of Students in School
Eligible for FRL Lowest Quartile $ 0.93 (0.2) $ 1.06 (0.3) $ 0.00 ---‡ $ 3.60 (0.8) Second Quartile $ 0.82 (0.2) $ 0.66 (0.1) $ 0.00 ---‡ $ 2.75 (0.4) Third Quartile $ 1.02 (0.2) $ 0.99 (0.2) $ 0.00 ---‡ $ 3.69 (0.6) Highest Quartile $ 0.92 (0.1) $ 0.65 (0.2) $ 0.00 ---‡ $ 3.37 (1.0)
School Size Smallest Schools $ 1.11 (0.2) $ 0.86 (0.2) $ 0.00 ---‡ $ 3.93 (0.8) Second Group $ 0.82 (0.2) $ 0.68 (0.2) $ 0.00 ---‡ $ 3.44 (0.5) Third Group $ 0.66 (0.1) $ 0.92 (0.2) $ 0.09 (0.4)† $ 2.75 (0.4) Largest Schools $ 0.68 (0.2) $ 0.61 (0.1) $ 0.00 ---‡ $ 2.06 (0.5)
Community Type Rural $ 1.29 (0.3) $ 1.01 (0.2) $ 0.00 ---‡ $ 4.58 (0.7) Suburban $ 0.81 (0.1) $ 0.89 (0.1) $ 0.00 ---‡ $ 2.98 (0.5) Urban $ 0.58 (0.1) $ 0.49 (0.1) $ 0.00 ---‡ $ 2.45 (0.5)
Region Midwest $ 0.72 (0.2) $ 0.70 (0.2) $ 0.00 ---‡ $ 3.25 (0.6) Northeast $ 2.22 (0.5) $ 1.11 (0.4) $ 0.00 ---‡ $ 5.18 (1.4) South $ 0.89 (0.2) $ 0.64 (0.1) $ 0.00 ---‡ $ 2.93 (0.5) West $ 0.72 (0.2) $ 0.91 (0.2) $ 0.00 ---‡ $ 2.19 (0.7)
† Standard errors for medians are typically computed in Wesvar 5.1 using the Woodruff method. Wesvar was unable to compute a standard error for this estimate using this method; thus, the potentially less-consistent replication standard error is reported.
‡ It was not possible to compute a standard error using either the Woodruff or the replication methods.

Horizon Research, Inc. F-24 February 2013
Table F-24 (Table 6.26) Class Mean Scores on the Adequacy of
Resources for Instruction Composite, by Equity Factors Mean Score
Science Mathematics Prior Achievement Level of Class
Mostly High Achievers 69 (1.6) 74 (0.9) Average/Mixed Achievers 56 (0.9) 70 (0.7) Mostly Low Achievers 47 (2.4) 68 (1.4)
Percent of Non-Asian Minority Students in Class Lowest Quartile 60 (1.5) 73 (0.9) Second Quartile 59 (1.5) 71 (1.1) Third Quartile 58 (1.3) 70 (1.0) Highest Quartile 50 (1.7) 69 (1.3)
Percent of Students in School Eligible for FRL Lowest Quartile 64 (1.7) 73 (1.3) Second Quartile 55 (1.4) 71 (1.0) Third Quartile 54 (1.5) 69 (1.1) Highest Quartile 50 (1.7) 68 (1.4)
School Size Smallest Schools 55 (1.8) 71 (1.3) Second Group 57 (1.5) 71 (1.1) Third Group 57 (1.6) 70 (1.1) Largest Schools 57 (1.7) 70 (1.1)
Community Type Rural 54 (1.5) 71 (1.2) Suburban 58 (1.1) 71 (0.8) Urban 57 (1.7) 70 (0.9)
Region Midwest 59 (1.5) 72 (1.0) Northeast 60 (2.1) 72 (1.2) South 55 (1.1) 71 (1.0) West 55 (2.2) 65 (1.2)
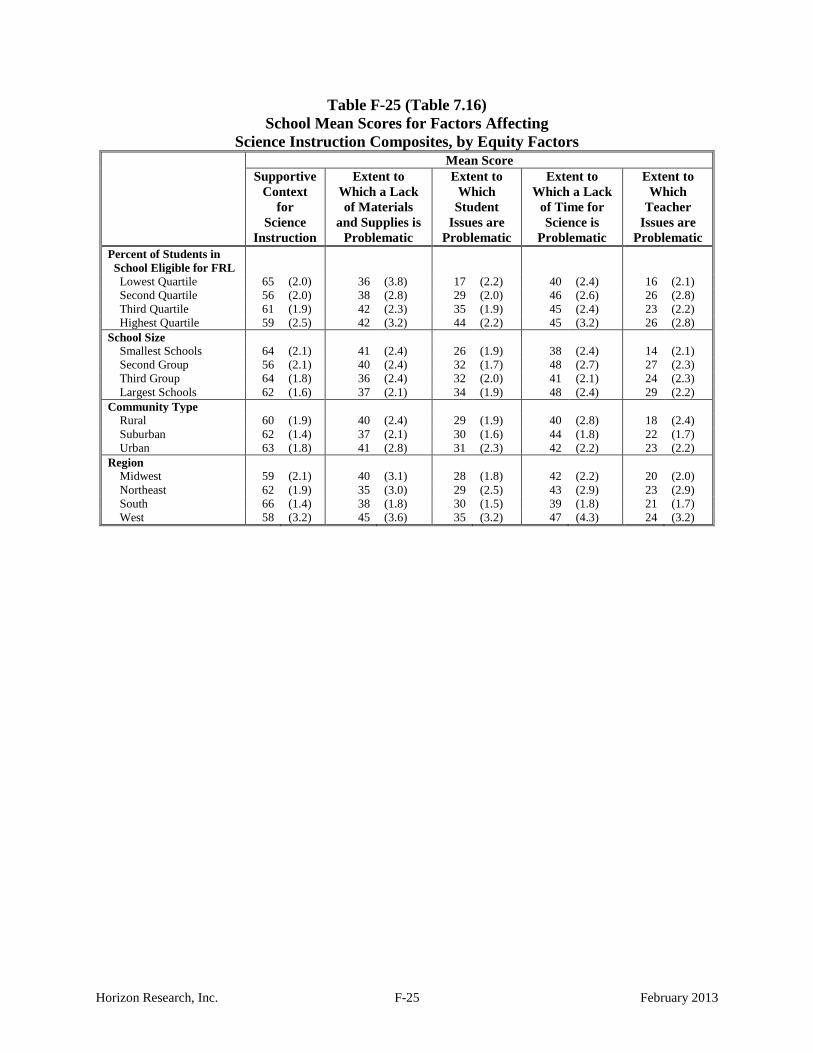
Horizon Research, Inc. F-25 February 2013
Table F-25 (Table 7.16) School Mean Scores for Factors Affecting
Science Instruction Composites, by Equity Factors Mean Score
Supportive Context
for Science
Instruction
Extent to Which a Lack of Materials
and Supplies is Problematic
Extent to Which
Student Issues are
Problematic
Extent to Which a Lack
of Time for Science is
Problematic
Extent to Which
Teacher Issues are
Problematic Percent of Students in
School Eligible for FRL Lowest Quartile 65 (2.0) 36 (3.8) 17 (2.2) 40 (2.4) 16 (2.1) Second Quartile 56 (2.0) 38 (2.8) 29 (2.0) 46 (2.6) 26 (2.8) Third Quartile 61 (1.9) 42 (2.3) 35 (1.9) 45 (2.4) 23 (2.2) Highest Quartile 59 (2.5) 42 (3.2) 44 (2.2) 45 (3.2) 26 (2.8)
School Size Smallest Schools 64 (2.1) 41 (2.4) 26 (1.9) 38 (2.4) 14 (2.1) Second Group 56 (2.1) 40 (2.4) 32 (1.7) 48 (2.7) 27 (2.3) Third Group 64 (1.8) 36 (2.4) 32 (2.0) 41 (2.1) 24 (2.3) Largest Schools 62 (1.6) 37 (2.1) 34 (1.9) 48 (2.4) 29 (2.2)
Community Type Rural 60 (1.9) 40 (2.4) 29 (1.9) 40 (2.8) 18 (2.4) Suburban 62 (1.4) 37 (2.1) 30 (1.6) 44 (1.8) 22 (1.7) Urban 63 (1.8) 41 (2.8) 31 (2.3) 42 (2.2) 23 (2.2)
Region Midwest 59 (2.1) 40 (3.1) 28 (1.8) 42 (2.2) 20 (2.0) Northeast 62 (1.9) 35 (3.0) 29 (2.5) 43 (2.9) 23 (2.9) South 66 (1.4) 38 (1.8) 30 (1.5) 39 (1.8) 21 (1.7) West 58 (3.2) 45 (3.6) 35 (3.2) 47 (4.3) 24 (3.2)

Horizon Research, Inc. F-26 February 2013
Table F-26 (Table 7.17) School Mean Scores for Factors Affecting
Mathematics Instruction Composites, by Equity Factors Mean Score
Supportive Context
for Mathematics Instruction
Extent to Which a Lack of Materials
and Supplies is Problematic
Extent to Which
Student Issues are
Problematic
Extent to Which a Lack
of Time for Mathematics is
Problematic
Extent to Which
Teacher Issues are
Problematic Percent of Students in
School Eligible for FRL Lowest Quartile 74 (2.4) 26 (2.9) 20 (2.1) 31 (2.0) 9 (1.2) Second Quartile 70 (2.0) 31 (2.8) 39 (2.3) 37 (3.1) 15 (2.3) Third Quartile 70 (1.7) 29 (2.6) 44 (2.2) 35 (2.0) 13 (1.8) Highest Quartile 68 (1.8) 35 (2.8) 50 (1.8) 37 (2.4) 19 (1.8)
School Size Smallest Schools 70 (1.9) 31 (2.6) 33 (2.0) 34 (2.5) 11 (1.6) Second Group 68 (2.0) 30 (2.3) 39 (2.1) 35 (2.4) 13 (1.6) Third Group 71 (1.6) 31 (2.2) 41 (1.7) 36 (2.1) 16 (1.9) Largest Schools 74 (1.7) 27 (2.6) 41 (2.0) 36 (2.8) 18 (2.4)
Community Type Rural 71 (1.7) 32 (2.7) 34 (2.1) 35 (2.7) 11 (1.2) Suburban 70 (1.5) 30 (2.1) 37 (1.6) 33 (1.8) 14 (1.6) Urban 69 (1.6) 29 (2.7) 41 (2.2) 38 (2.6) 15 (2.0)
Region Midwest 69 (2.5) 29 (3.0) 31 (1.9) 39 (2.9) 13 (2.0) Northeast 67 (2.2) 28 (2.9) 38 (2.7) 32 (3.1) 13 (2.6) South 74 (1.4) 32 (1.9) 39 (1.6) 31 (1.6) 13 (1.1) West 68 (2.2) 32 (3.1) 42 (2.7) 39 (2.9) 15 (2.1)

Horizon Research, Inc. F-27 February 2013
Table F-27 (Table 7.24) Class Mean Scores on Factors Affecting
Science Instruction Composites, by Equity Factors Mean Score
Extent to Which the Policy
Environment Promotes Effective
Instruction
Extent to Which Stakeholders
Promote Effective
Instruction
Extent to Which School Support
Promotes Effective
Instruction
Extent to Which IT Quality is
Problematic for Science
Instruction Prior Achievement Level of
Class Mostly High Achievers 67 (2.3) 76 (1.6) 70 (2.1) 22 (2.1) Average/Mixed Achievers 64 (0.7) 66 (0.9) 64 (1.2) 23 (1.0) Mostly Low Achievers 59 (2.6) 51 (2.0) 57 (4.0) 31 (3.5)
Percent of Non-Asian Minority Students in Class Lowest Quartile 61 (2.2) 68 (1.7) 63 (2.3) 22 (1.7) Second Quartile 65 (1.3) 70 (1.4) 65 (2.7) 24 (1.7) Third Quartile 64 (1.7) 66 (1.6) 63 (2.0) 22 (1.7) Highest Quartile 65 (1.3) 60 (1.3) 64 (1.9) 28 (2.2)
Percent of Students in School Eligible for FRL Lowest Quartile 66 (1.7) 75 (1.6) 67 (2.1) 25 (1.8) Second Quartile 62 (1.8) 66 (1.5) 61 (2.3) 23 (1.5) Third Quartile 64 (2.3) 61 (1.5) 64 (2.6) 23 (1.7) Highest Quartile 63 (1.4) 58 (1.5) 63 (2.2) 28 (2.4)
School Size Smallest Schools 64 (1.8) 66 (1.8) 59 (2.3) 24 (1.9) Second Group 63 (1.5) 66 (1.5) 65 (1.9) 23 (1.7) Third Group 66 (1.4) 66 (1.5) 65 (2.9) 23 (1.7) Largest Schools 62 (1.3) 66 (1.4) 66 (2.0) 27 (2.1)
Community Type Rural 64 (1.8) 64 (1.6) 61 (2.1) 24 (1.6) Suburban 64 (0.8) 65 (1.0) 65 (1.4) 24 (1.1) Urban 65 (1.8) 69 (1.2) 65 (2.6) 25 (2.3)
Region Midwest 63 (1.1) 67 (1.5) 61 (1.8) 24 (1.9) Northeast 62 (2.5) 67 (2.4) 66 (2.7) 23 (1.8) South 66 (1.3) 65 (1.1) 65 (2.1) 23 (1.4) West 62 (1.5) 66 (1.6) 63 (3.1) 31 (2.5)

Horizon Research, Inc. F-28 February 2013
Table F-28 (Table 7.25) Class Mean Scores on Factors Affecting
Mathematics Instruction Composites, by Equity Factors Mean Score
Extent to which the Policy
Environment Promotes Effective
Instruction
Extent to which Stakeholders
Promote Effective
Instruction
Extent to which School Support
Promotes Effective
Instruction
Extent to Which IT Quality is
Problematic for Mathematics Instruction
Prior Achievement Level of Class Mostly High Achievers 68 (1.9) 76 (1.7) 72 (1.7) 17 (1.3) Average/Mixed Achievers 70 (0.8) 66 (1.1) 69 (1.0) 22 (0.9) Mostly Low Achievers 65 (1.6) 52 (1.6) 68 (2.4) 25 (1.7)
Percent of Non-Asian Minority Students in Class Lowest Quartile 71 (1.1) 66 (1.6) 66 (1.9) 20 (1.2) Second Quartile 69 (1.2) 70 (1.3) 69 (1.5) 19 (1.4) Third Quartile 68 (1.3) 63 (1.6) 69 (2.1) 22 (1.7) Highest Quartile 66 (1.6) 61 (1.8) 72 (2.0) 25 (1.4)
Percent of Students in School Eligible for FRL Lowest Quartile 70 (1.2) 72 (1.3) 70 (2.1) 19 (1.1) Second Quartile 69 (1.2) 65 (1.3) 70 (1.6) 23 (1.9) Third Quartile 69 (1.4) 63 (1.9) 68 (1.9) 23 (1.8) Highest Quartile 66 (1.8) 57 (2.1) 69 (2.1) 24 (1.4)
School Size Smallest Schools 70 (1.4) 63 (1.5) 65 (2.4) 23 (1.4) Second Group 69 (1.4) 62 (1.6) 68 (1.7) 20 (1.3) Third Group 69 (1.4) 66 (1.5) 71 (1.7) 21 (1.4) Largest Schools 66 (1.5) 68 (1.4) 73 (1.3) 24 (1.6)
Community Type Rural 71 (1.1) 63 (1.2) 69 (1.5) 19 (1.4) Suburban 68 (0.9) 65 (1.3) 68 (1.5) 21 (1.0) Urban 67 (1.8) 65 (1.7) 71 (1.5) 25 (1.6)
Region Midwest 70 (1.4) 64 (1.6) 66 (1.6) 21 (1.3) Northeast 68 (1.9) 65 (2.1) 69 (2.1) 21 (2.0) South 69 (1.1) 66 (1.2) 71 (1.3) 22 (1.2) West 65 (1.8) 64 (2.1) 68 (1.8) 23 (1.6)
Top Related