


Languages
Pages
Legal

Analysis
2011 Financial Analysis Executive Summary
Income Statement Financial Standards Measures
Crop sales 710,578 Liquidity Beg End
Crop inventory change -91,599 Current ratio 2.15 4.46
Gross crop income 618,979 Working capital 314,354 427,899
Livestock sales 100,470 Working capital to gross revenues 34.3 % 46.7 %
Livestock inventory change 33,492
Gross livestock income 133,962 Solvency (market) Beg End
Government payments 30,420 Debt to asset ratio 56 % 47 %
Other cash farm income 127,764 Debt to equity ratio 1.26 0.88
Change in accounts receivable -
Gain or loss on hedging accts - Profitability Cost Market
Change in other assets - Net farm income 199,435 246,024
Gain or loss on breeding lvst 5,500 Rate of return on assets 9.5 % 12.1 %
Gross farm income 916,626 Rate of return on equity 17.7 % 22.8 %
Operating profit margin 17.7 % 22.8 %
Cash operating expense 694,961
Change in prepaid exp and supplies -28,500 Repayment Capacity
Change in growing crops 1,940 Term debt coverage ratio (farm only) n/a
Change in accounts payable - Replacement margin coverage ratio n/a
Depreciation 32,500
Total operating expense 700,901 Efficiency Cost Market
Interest paid 16,290 Asset turnover rate 53.6 % 52.9 %
Change in accrued interest - Operating expense ratio 72.9 %
Total interest expense 16,290 Depreciation expense ratio 3.5 %
Total expenses 717,191 Interest expense ratio 1.8 %
Net farm income ratio 21.8 %
Net farm income 199,435
Other
Term debt coverage (farm+personal) n/a
Other Measures Term debt to EBITDA 2.72
Total crop acres 1,789
Cow-Calf Cows 163 Information AccuracyBackgnd Beef sold or transferred out 129
Finish Hogs, Custom Feeding sold or t 1,546 Cash discrepancy 300
Liability discrepancy 0
Change in earned net worth 156,254 15 % Cash discrepancy to gross revenue 0 %
Change in market value net worth 202,843 21 %
FINPACK © Center For Farm Financial Management
University of Minnesota
Battle Creek Farms2011

Page 2
Income Statement
Income Quantity Price Amount Expense Amount
Corn, 0221 114,633 bu. 4.57/bu. 523,676 Seed 112,368
Soybeans, 0291 15,317 bu. 11.49 /bu. 175,915 Fertilizer 69,086
W. Wheat, 0181 1,657 bu. 6.63/bu. 10,987 Crop chemicals 78,207
Finish Beef, 6160 101 head 137.48 /cwt. 100,470 Crop insurance 22,897
Cull breeding livestock 28,799 Drying expense 1,528
Direct, CCP & ACRE pymts 21,255 Crop Miscellaneous 8,350
Other government payments 9,165 Purchased feed 13,124
Patronage dividends, cash 3,182 Veterinary 1,240
Insurance income 93,327 Supplies 12,216
Other farm income 2,456 Livestock Marketing 6,845
Interest 16,290
Fuel & oil 61,336
Repairs 149,992
Custom hire 20,351
Hired labor 7,642
Land rent 95,471
Real estate taxes 9,064
Farm insurance 3,306
Utilities 15,456
Miscellaneous 6,482
Gross cash income 969,232 Total cash expense 711,251
Net cash income 257,981
Beginning Ending Inventory
Inventory Changes Inventory Purchases Sales Inventory Change
Prepaids and supplies 3,000 31,500 28,500
Growing crops 5,940 4,000 -1,940
Crops and feed 478,096 386,497 -91,599
Market livestock 97,545 131,037 33,492
Breeding livestock 129,900 - - 135,400 5,500
Other assets 26,000 - - 26,000 -
Total inventory change -26,046
Net operating profit 231,935
Beginning Ending
Depreciation Inventory Purchases Sales Inventory Depreciation
Machinery and equipment 325,000 83,900 8,250 368,150 -32,500
Titled vehicles 24,500 - - 24,500 -
Buildings and improvement 90,900 - - 90,900 -
Total depreciation -32,500
Net farm income 199,435
FINPACK © Center For Farm Financial Management
University of Minnesota

Page 3
Profitability Measures Cost Market Statement of Owner's Equity
(A) Net farm income from operations 199,435 246,024 (a) Beginning net worth 757,355
Rate of return on assets (E/F) 9.5 % 12.1 %
Rate of return on equity (G/H) 17.7 % 22.8 % Net farm income 199,435
Operating profit margin (E/I) 17.7 % 22.8 % Personal income (+) -
Asset turnover rate (I/F) 53.6 % 52.9 % Family living expense (-) 58,994
EBITDA 248,225 294,814 Income taxes accrued (-) -
Change in personal assets (+) 15,813(B) Change in market valuation - 46,589 Change in nonfarm accounts payable (+) -(C) Interest expense 16,290 16,290 (b) Total change in retained earnings (=) 156,254(D) Value of unpaid oper labor & mgmt 56,110 56,110(E) Return on farm assets (A+C-D) 159,615 206,204 Change in market value of capital assets 46,589(F) Average farm assets 1,684,874 1,708,169 (d) Total change in market valuation = 46,589(G) Return on farm equity (A-D) 143,325 189,914(H) Average farm net worth 808,462 831,757 (e) Total change in net worth (b+d) 202,843(I) Value of farm production 903,502 903,502
Ending net worth calculated (a+e) 960,197
Ending net worth reported 920,159
Liquidity Measures Begin End Discrepancy 40,039
(J) Current assets 587,302 551,722(K) Current liabilities 272,948 123,823 Statement of Cash Flows
Current ratio (J/K) 2.15 4.46 (f) Beginning cash balance (farm & personal) 2,721
Working capital (J-K) 314,354 427,899
Working capital to gross revenues 34.3 % 46.7 % Gross cash farm income 969,232
Cash farm expenses (-) 711,251(g) Cash provided by operating activities (=) 257,981
Solvency Measures (Market) Begin EndSale of machinery and equipment (+) 8,250
(L) Total assets 1,705,209 1,725,129 Sale of personal assets (+) 18,379(M) Total liabilities 947,854 804,970 Purchase of machinery and equipment (-) 83,900
Net worth (L-M) 757,355 920,159 Purchase of personal assets (-) 2,566
Net worth change 162,804 (h) Cash provided by investing activities (=) -59,837
Current debt to assets (K/J) 46 % 22 % Money borrowed 531,200
Intermediate debt to assets 94 % 90 % Principal payments (-) 674,084
Long term debt to assets 33 % 29 % Personal income (+) -
Total debt to assets ratio (M/L) 56 % 47 % Family living expense (-) 58,994
Income taxes paid (-) -(i) Cash provided by financing activities (=) -201,878
Repayment CapacityNet change in cash (g+h+i) -3,734
Net farm income from operations 199,435 Ending cash balance (farm and personal) -1,313
Depreciation (+) 32,500 Discrepancy 300
Personal income (+) -
Family living expense (-) 58,994
Income taxes accrued (-) -
Interest on term debt (+) -64,423(N) Capital debt repayment capacity (=) 108,518(O) Scheduled term debt payments -(P) Capital debt repayment margin (N-O) 108,518(Q) Cash replacement allowance -
Replacement margin (P-Q) 108,518
Term debt coverage ratio (N/O) n/a
Replacement coverage ratio (N/O+Q) n/a
FINPACK © Center For Farm Financial Management
University of Minnesota
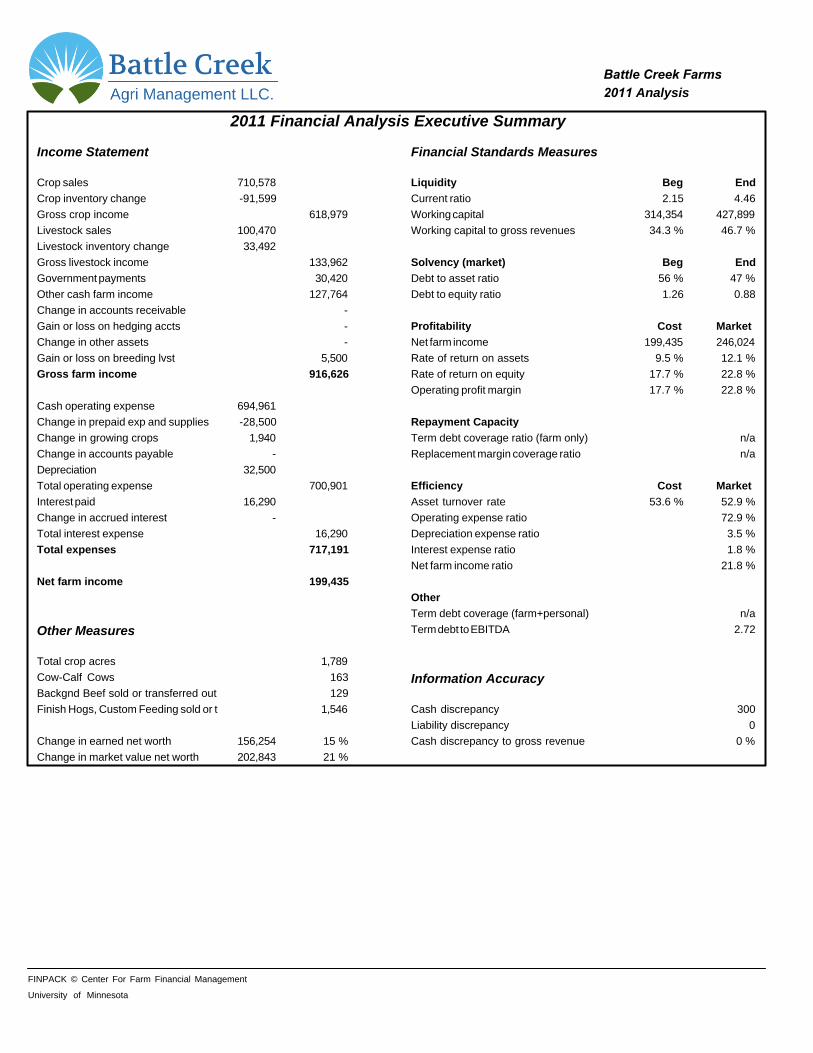
Page 4
Crop Summary Livestock Summary
Total acres owned 728 Cow-Calf Cows
Total crop acres 1,789 Number of cows 163.0
Crop acres owned 488 Pregnancy percentage 87.4
Crop acres cash rented 929 Calving percentage 87.4
Crop acres share rented 372 Weaning percentage 68.8
Percent crop acres owned 27 % Calves sold per cow 0.89
Pasture acres 601 Average weaning weight 550
Lb. weaned/exposed female 379
Machinery investment/crop acre (cost) 207 Avg wgt/ Beef Calves sold 276
Machinery investment/crop acre (market) 209 Avg price / cwt. 175.14
Crop Yields Acres Yield Backgnd Beef
Number sold or trans out 129
Pasture 601.0 1.4 aum Avg wgt / Backgnd Beef sold 754
Hay, Grass 24.0 0.2 ton Avg sales price / cwt. 136.31
Hay, Alfalfa 137.7 3.3 ton
Corn 671.1 114.7 bu.
Fallow 204.7 - Finish Hogs, Custom Feeding
Wheat, Winter 72.1 32.1 bu. Number sold or trans out 1,546
Soybeans 637.3 28.7 bu.
CRP 42.2 - $
FINPACK © Center For Farm Financial Management
University of Minnesota
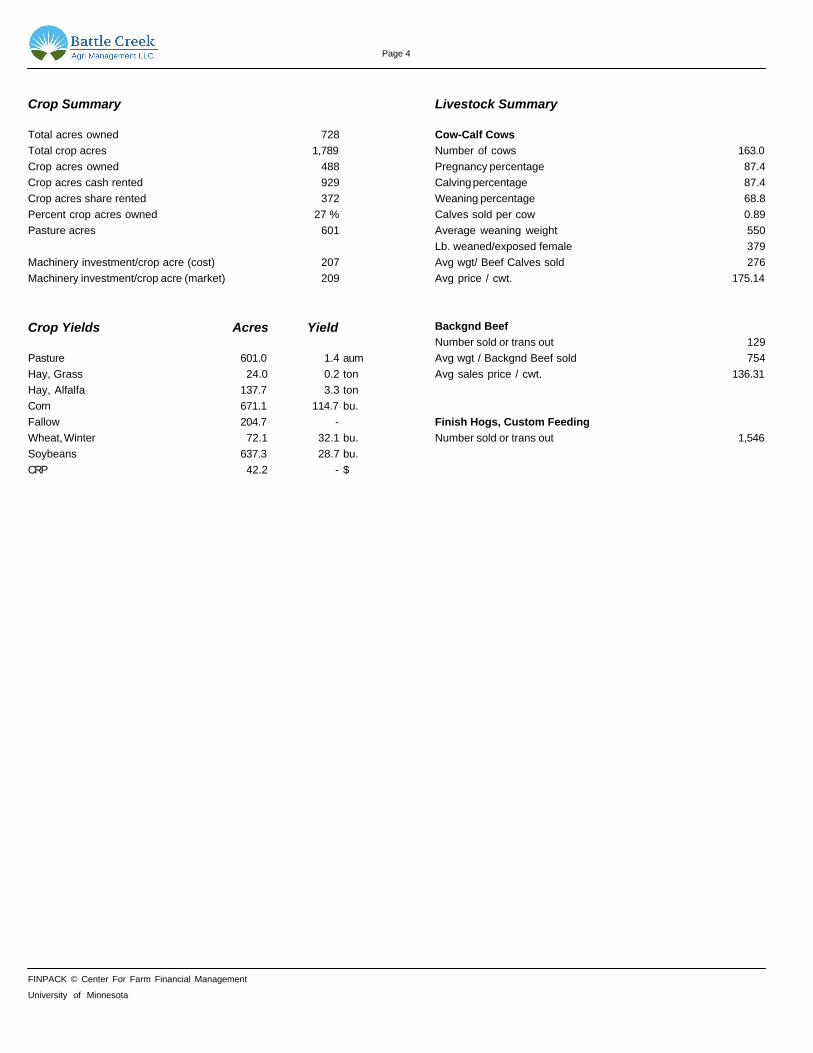
Page 5
Crop Enterprise Analysis
Pasture Pasture Pasture Pasture Pasture Pasture Pasture
Leon's Dan's River Dan's Eug Dan's Koth Opals Radels Elsie's
Cash Rented Cash Rented Cash Rented Cash Rented Cash Rented Cash Rented Owned
Returns
Acres 45.00 78.00 28.00 64.10 80.00 87.90 70.00
Unit aum aum aum aum aum aum aum
Yield per acre 3.69 1.23 - 2.26 - 2.62 -
Share of production (%) 100.00 100.00 100.00 100.00 100.00 100.00 100.00
Value per unit 32.00 32.00 32.00 32.00 32.00 32.00 32.00
Total product value 118.04 39.38 - 72.39 - 83.73 -
Other crop income 8.80 - 75.00 - 53.10 - 13.89
Gross return per acre 126.84 39.38 75.00 72.39 53.10 83.73 13.89
Direct Expenses
Seed - - - - - - -
Fertilizer - - - - - - -
Crop chemicals 17.78 17.95 20.00 20.00 20.00 20.02 23.00
Crop insurance 0.40 0.40 0.39 0.41 0.40 0.40 0.40
Land rent 30.00 27.00 27.00 27.00 27.00 30.00 -
Fuel & oil 3.15 3.15 3.15 3.15 3.15 3.15 3.15
Repairs 8.67 8.67 8.67 8.67 8.67 8.67 8.67
Operating interest 0.57 0.57 0.57 0.57 0.57 0.57 0.57
Total direct expenses 60.57 57.74 59.79 59.80 59.79 62.81 35.79
Return over direct expenses 66.27 -18.35 15.21 12.58 -6.69 20.92 -21.91
Overhead Expenses
Hired labor 0.39 0.39 0.39 0.39 0.39 0.39 0.39
Real estate taxes - - - - - - 1.98
Farm insurance 0.17 0.17 0.17 0.17 0.17 0.17 0.17
Utilities 0.79 0.79 0.79 0.79 0.79 0.79 0.79
Interest on interm. debt 0.04 0.04 0.04 0.04 0.04 0.04 0.04
Interest on lng term debt - - - - - - 1.25
Machinery depreciation 1.67 1.67 1.67 1.67 1.67 1.67 1.67
Miscellaneous 0.33 0.33 0.33 0.33 0.33 0.33 0.33
Total overhead expenses 3.40 3.40 3.40 3.40 3.40 3.40 6.64
Total dir & ovhd expenses 63.97 61.14 63.19 63.20 63.19 66.22 42.43
Net return per acre 62.87 -21.76 11.81 9.18 -10.09 17.52 -28.54
Government payments - - - - - - -
Net return with govt pmts 62.87 -21.76 11.81 9.18 -10.09 17.52 -28.54
Labor & management charge 2.88 2.88 2.88 2.88 2.88 2.88 2.88
Net return over lbr & mgt 59.99 -24.64 8.93 6.30 -12.98 14.63 -31.43
Cost of Production Per Unit
Total direct expenses 16.42 46.91 n/a 26.44 n/a 24.01 n/a
Total dir & ovhd expenses 17.34 49.68 n/a 27.94 n/a 25.31 n/a
Less govt & other income 14.96 49.68 n/a 27.94 n/a 25.31 n/a
With labor & management 15.74 52.02 n/a 29.22 n/a 26.41 n/a
Net value per unit 32.00 32.00 n/a 32.00 n/a 32.00 n/a
Machinery cost per acre 13.54 13.54 13.54 13.54 13.54 13.54 13.54
Est. labor hours per acre - - - - - - -
FINPACK © Center For Farm Financial Management
University of Minnesota

Page 6
CROP ENTERPRISE ANALYSIS (continued)
Pasture Grass Hay Alfalfa Hay Alfalfa Hay Corn Alfalfa Hay Fallow
Steve's Hay in Hoels Ken's Ours/ Luella Ours 27 Annete's SE 40
Owned Cash Rented Cash Rented Owned Owned Owned Owned
Returns
Acres 148.00 24.00 30.30 70.00 77.40 37.40 39.40
Unit aum ton ton ton bu. ton
Yield per acre 1.48 0.167 4.36 2.20 107.48 4.44 -
Share of production (%) 100.00 100.00 100.00 100.00 100.00 100.00 100.00
Value per unit 32.00 60.00 85.00 85.00 6.15 85.00 -
Total product value 47.35 10.00 370.30 187.00 661.01 377.27 -
Other crop income - - 13.07 - 16.28 - -
Gross return per acre 47.35 10.00 383.37 187.00 677.28 377.27 -
Direct Expenses
Seed - - - - 80.00 - -
Fertilizer - - 49.67 50.00 120.00 50.00 -
Crop chemicals 17.57 - - - 22.80 - 14.01
Crop insurance 0.40 0.42 4.13 4.14 16.80 5.43 16.80
Land rent - 50.00 90.00 - - - -
Fuel & oil 3.15 25.22 37.83 37.83 34.68 37.83 -
Repairs 8.67 69.39 104.09 104.09 95.41 104.09 -
Operating interest 0.57 4.53 6.80 6.80 6.23 6.80 -
Total direct expenses 30.36 149.56 292.51 202.86 375.92 204.14 30.81
Return over direct expenses 16.99 -139.56 90.85 -15.86 301.36 173.13 -30.81
Overhead Expenses
Hired labor 0.39 3.14 4.71 4.71 4.32 4.71 -
Real estate taxes 1.98 - - 23.82 21.83 23.82 -
Farm insurance 0.17 1.36 2.04 2.04 1.87 2.04 -
Utilities 0.79 6.36 9.53 9.53 8.74 9.53 -
Interest on interm. debt 0.04 0.32 0.49 0.49 0.44 0.49 -
Interest on lng term debt 1.25 - - 15.00 13.75 15.00 -
Machinery depreciation 1.67 13.36 20.05 20.05 18.38 20.05 -
Miscellaneous 0.33 2.67 4.00 4.00 3.67 4.00 -
Total overhead expenses 6.64 27.21 40.82 79.64 73.00 79.64 -
Total dir & ovhd expenses 37.00 176.77 333.33 282.50 448.93 283.78 30.81
Net return per acre 10.36 -166.77 50.04 -95.50 228.36 93.49 -30.81
Government payments - - - - - - -
Net return with govt pmts 10.36 -166.77 50.04 -95.50 228.36 93.49 -30.81
Labor & management charge 2.88 23.07 34.61 34.61 31.73 34.61 -
Net return over lbr & mgt 7.47 -189.85 15.42 -130.11 196.63 58.88 -30.81
Cost of Production Per Unit
Total direct expenses 20.52 897.37 67.14 92.21 3.50 45.99 n/a
Total dir & ovhd expenses 25.00 1060.64 76.51 128.41 4.18 63.94 n/a
Less govt & other income 25.00 1060.64 73.51 128.41 4.03 63.94 n/a
With labor & management 26.95 1199.08 81.46 144.14 4.32 71.73 n/a
Net value per unit 32.00 60.00 85.00 85.00 6.15 85.00 n/a
Machinery cost per acre 13.54 108.30 162.45 162.45 148.92 162.45 -
Est. labor hours per acre - - - - - - -
FINPACK © Center For Farm Financial Management
University of Minnesota
Page 7
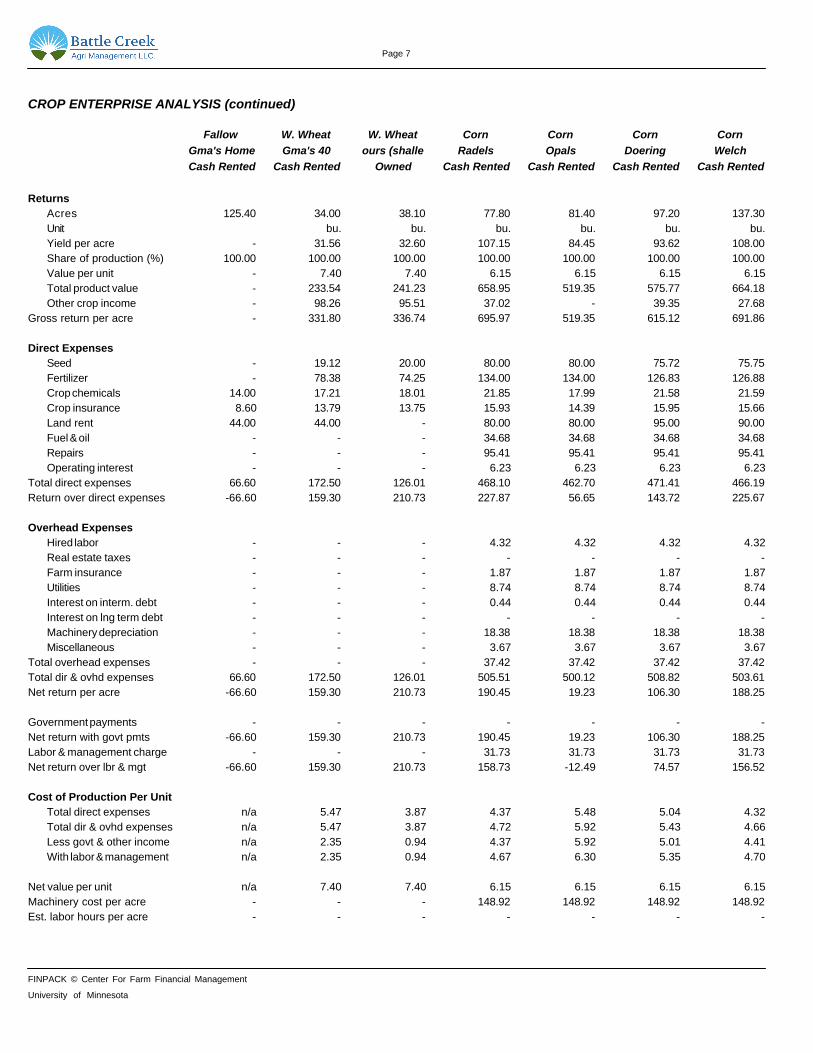
CROP ENTERPRISE ANALYSIS (continued)
Fallow W. Wheat W. Wheat Corn Corn Corn Corn
Gma's Home Gma's 40 ours (shalle Radels Opals Doering Welch
Cash Rented Cash Rented Owned Cash Rented Cash Rented Cash Rented Cash Rented
Returns
Acres 125.40 34.00 38.10 77.80 81.40 97.20 137.30
Unit bu. bu. bu. bu. bu. bu.
Yield per acre - 31.56 32.60 107.15 84.45 93.62 108.00
Share of production (%) 100.00 100.00 100.00 100.00 100.00 100.00 100.00
Value per unit - 7.40 7.40 6.15 6.15 6.15 6.15
Total product value - 233.54 241.23 658.95 519.35 575.77 664.18
Other crop income - 98.26 95.51 37.02 - 39.35 27.68
Gross return per acre - 331.80 336.74 695.97 519.35 615.12 691.86
Direct Expenses
Seed - 19.12 20.00 80.00 80.00 75.72 75.75
Fertilizer - 78.38 74.25 134.00 134.00 126.83 126.88
Crop chemicals 14.00 17.21 18.01 21.85 17.99 21.58 21.59
Crop insurance 8.60 13.79 13.75 15.93 14.39 15.95 15.66
Land rent 44.00 44.00 - 80.00 80.00 95.00 90.00
Fuel & oil - - - 34.68 34.68 34.68 34.68
Repairs - - - 95.41 95.41 95.41 95.41
Operating interest - - - 6.23 6.23 6.23 6.23
Total direct expenses 66.60 172.50 126.01 468.10 462.70 471.41 466.19
Return over direct expenses -66.60 159.30 210.73 227.87 56.65 143.72 225.67
Overhead Expenses
Hired labor - - - 4.32 4.32 4.32 4.32
Real estate taxes - - - - - - -
Farm insurance - - - 1.87 1.87 1.87 1.87
Utilities - - - 8.74 8.74 8.74 8.74
Interest on interm. debt - - - 0.44 0.44 0.44 0.44
Interest on lng term debt - - - - - - -
Machinery depreciation - - - 18.38 18.38 18.38 18.38
Miscellaneous - - - 3.67 3.67 3.67 3.67
Total overhead expenses - - - 37.42 37.42 37.42 37.42
Total dir & ovhd expenses 66.60 172.50 126.01 505.51 500.12 508.82 503.61
Net return per acre -66.60 159.30 210.73 190.45 19.23 106.30 188.25
Government payments - - - - - - -
Net return with govt pmts -66.60 159.30 210.73 190.45 19.23 106.30 188.25
Labor & management charge - - - 31.73 31.73 31.73 31.73
Net return over lbr & mgt -66.60 159.30 210.73 158.73 -12.49 74.57 156.52
Cost of Production Per Unit
Total direct expenses n/a 5.47 3.87 4.37 5.48 5.04 4.32
Total dir & ovhd expenses n/a 5.47 3.87 4.72 5.92 5.43 4.66
Less govt & other income n/a 2.35 0.94 4.37 5.92 5.01 4.41
With labor & management n/a 2.35 0.94 4.67 6.30 5.35 4.70
Net value per unit n/a 7.40 7.40 6.15 6.15 6.15 6.15
Machinery cost per acre - - - 148.92 148.92 148.92 148.92
Est. labor hours per acre - - - - - - -
FINPACK © Center For Farm Financial Management
University of Minnesota

Page 8
CROP ENTERPRISE ANALYSIS (continued)
Corn Corn Corn Soybeans Soybeans Soybeans Soybeans
Bartel's Eug Bartel's Kie Ron's 80 Ken's Elsie's Steve's Radel's
Share Rented Share Rented Share Rented Cash Rented Owned Owned Cash Rented
Returns
Acres 25.00 97.10 77.90 40.10 81.30 46.60 32.00
Unit bu. bu. bu. bu. bu. bu. bu.
Yield per acre 189.01 177.75 138.43 26.26 29.63 31.55 29.09
Share of production (%) 67.00 67.00 67.00 100.00 100.00 100.00 100.00
Value per unit 6.15 6.15 6.15 11.75 11.75 11.75 11.75
Total product value 778.84 732.43 570.39 308.55 348.16 370.65 341.85
Other crop income - - - - - 25.21 -
Gross return per acre 778.84 732.43 570.39 308.55 348.16 395.87 341.85
Direct Expenses
Seed - - - 60.00 60.00 60.00 60.00
Fertilizer 134.00 134.00 97.54 11.70 11.70 11.70 11.69
Crop chemicals 22.80 22.80 16.60 21.85 21.85 41.01 38.00
Crop insurance - - - 14.09 13.68 14.46 16.13
Land rent - - - 87.51 - - 80.00
Fuel & oil 34.68 34.68 34.68 28.38 28.38 28.38 28.38
Repairs 95.41 95.41 95.41 78.06 78.06 78.06 78.06
Operating interest 6.23 6.23 6.23 5.10 5.10 5.10 5.10
Total direct expenses 293.12 293.12 250.46 306.68 218.76 238.71 317.35
Return over direct expenses 485.71 439.31 319.94 1.87 129.41 157.16 24.50
Overhead Expenses
Hired labor 4.32 4.32 4.32 3.54 3.54 3.54 3.54
Real estate taxes - - - - 17.86 17.86 -
Farm insurance 1.87 1.87 1.87 1.53 1.53 1.53 1.53
Utilities 8.74 8.74 8.74 7.15 7.15 7.15 7.15
Interest on interm. debt 0.44 0.44 0.44 0.36 0.36 0.36 0.36
Interest on lng term debt - - - - 11.25 11.25 -
Machinery depreciation 18.38 18.38 18.38 15.04 15.04 15.04 15.04
Miscellaneous 3.67 3.67 3.67 3.00 3.00 3.00 3.00
Total overhead expenses 37.42 37.42 37.42 30.61 59.73 59.73 30.61
Total dir & ovhd expenses 330.54 330.54 287.87 337.29 278.49 298.43 347.96
Net return per acre 448.30 401.89 282.52 -28.74 69.68 97.44 -6.11
Government payments - - - - - - -
Net return with govt pmts 448.30 401.89 282.52 -28.74 69.68 97.44 -6.11
Labor & management charge 31.73 31.73 31.73 25.96 25.96 25.96 25.96
Net return over lbr & mgt 416.57 370.16 250.79 -54.70 43.72 71.48 -32.07
Cost of Production Per Unit
Total direct expenses 2.31 2.46 2.70 11.68 7.38 7.57 10.91
Total dir & ovhd expenses 2.61 2.78 3.10 12.84 9.40 9.46 11.96
Less govt & other income 2.61 2.78 3.10 12.84 9.40 8.66 11.96
With labor & management 2.86 3.04 3.45 13.83 10.27 9.48 12.85
Net value per unit 6.15 6.15 6.15 11.75 11.75 11.75 11.75
Machinery cost per acre 148.92 148.92 148.92 121.84 121.84 121.84 121.84
Est. labor hours per acre - - - - - - -
FINPACK © Center For Farm Financial Management
University of Minnesota

Page 9
CROP ENTERPRISE ANALYSIS (continued)
Soybeans Soybeans Soybeans Soybeans Soybeans Soybeans Fallow
Doering's Welch's Ours 27 Bartel's Eug Bartel's Kei Ours- Lyle LuElla's
Cash Rented Cash Rented Owned Share Rented Share Rented Owned Owned
Returns
Acres 98.50 151.10 8.00 88.00 83.70 8.00 39.90
Unit bu. bu. bu. bu. bu. bu.
Yield per acre 25.40 24.26 35.00 30.85 39.94 37.50 -
Share of production (%) 100.00 100.00 100.00 67.00 67.00 100.00 100.00
Value per unit 11.75 11.75 11.75 11.75 11.75 11.75 -
Total product value 298.46 285.08 411.25 242.88 314.46 440.63 -
Other crop income 29.95 - - - - - -
Gross return per acre 328.41 285.08 411.25 242.88 314.46 440.63 -
Direct Expenses
Seed 56.04 57.97 60.00 - - 60.00 -
Fertilizer 10.92 11.30 11.75 9.70 11.04 11.75 -
Crop chemicals 35.49 37.97 38.00 34.55 37.68 38.00 22.01
Crop insurance 14.35 14.18 15.00 - - 15.25 15.81
Land rent 95.01 95.00 - - - - -
Fuel & oil 28.38 28.38 28.38 28.38 28.38 28.38 -
Repairs 78.06 78.06 78.06 78.06 78.06 78.06 -
Operating interest 5.10 5.10 5.10 5.10 5.10 5.10 -
Total direct expenses 323.34 327.97 236.29 155.79 160.26 236.54 37.82
Return over direct expenses 5.07 -42.89 174.96 87.09 154.20 204.09 -37.82
Overhead Expenses
Hired labor 3.54 3.54 3.54 3.54 3.54 3.54 -
Real estate taxes - - 17.86 - - 17.86 -
Farm insurance 1.53 1.53 1.53 1.53 1.53 1.53 -
Utilities 7.15 7.15 7.15 7.15 7.15 7.15 -
Interest on interm. debt 0.36 0.36 0.36 0.36 0.36 0.36 -
Interest on lng term debt - - 11.25 - - 11.25 -
Machinery depreciation 15.04 15.04 15.04 15.04 15.04 15.04 -
Miscellaneous 3.00 3.00 3.00 3.00 3.00 3.00 -
Total overhead expenses 30.61 30.61 59.73 30.61 30.61 59.73 -
Total dir & ovhd expenses 353.96 358.58 296.02 186.40 190.87 296.27 37.82
Net return per acre -25.55 -73.50 115.23 56.48 123.58 144.36 -37.82
Government payments - - - - - - -
Net return with govt pmts -25.55 -73.50 115.23 56.48 123.58 144.36 -37.82
Labor & management charge 25.96 25.96 25.96 25.96 25.96 25.96 -
Net return over lbr & mgt -51.51 -99.46 89.28 30.52 97.63 118.40 -37.82
Cost of Production Per Unit
Total direct expenses 12.73 13.52 6.75 7.54 5.99 6.31 n/a
Total dir & ovhd expenses 13.93 14.78 8.46 9.02 7.13 7.90 n/a
Less govt & other income 12.76 14.78 8.46 9.02 7.13 7.90 n/a
With labor & management 13.78 15.85 9.20 10.27 8.10 8.59 n/a
Net value per unit 11.75 11.75 11.75 11.75 11.75 11.75 n/a
Machinery cost per acre 121.84 121.84 121.84 121.84 121.84 121.84 -
Est. labor hours per acre - - - - - - -
FINPACK © Center For Farm Financial Management
University of Minnesota
Page 10
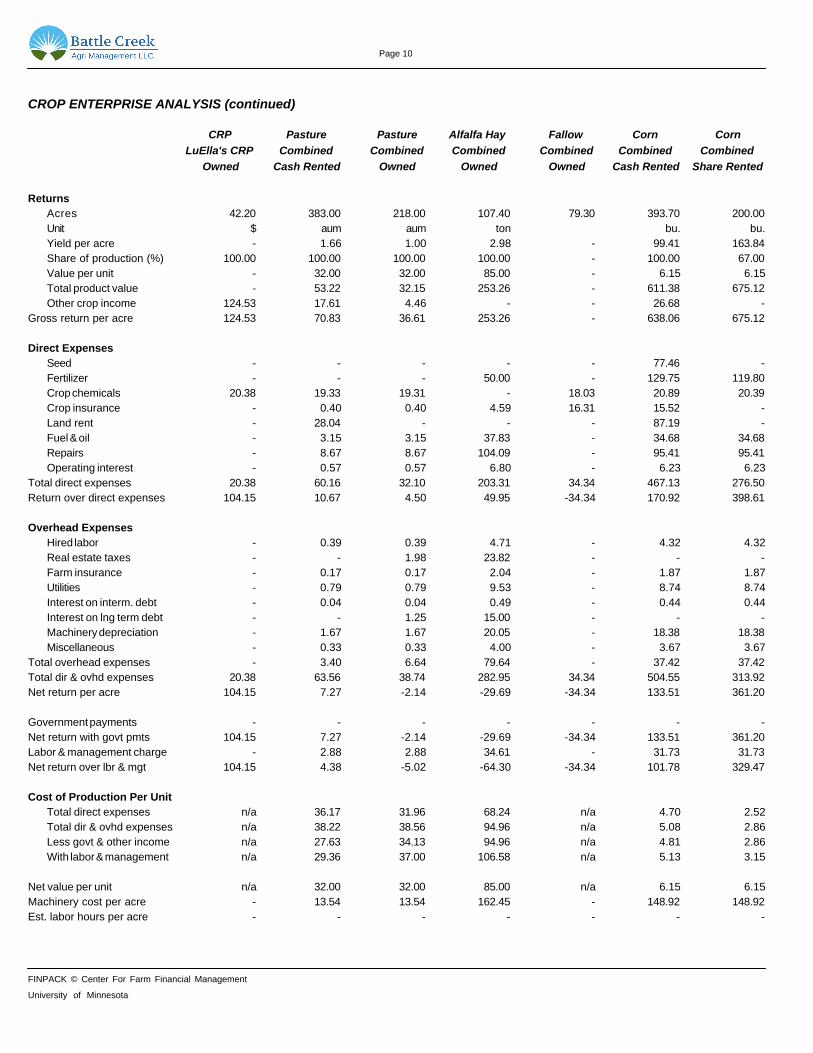
CROP ENTERPRISE ANALYSIS (continued)
CRP Pasture Pasture Alfalfa Hay Fallow Corn Corn
LuElla's CRP Combined Combined Combined Combined Combined Combined
Owned Cash Rented Owned Owned Owned Cash Rented Share Rented
Returns
Acres 42.20 383.00 218.00 107.40 79.30 393.70 200.00
Unit $ aum aum ton bu. bu.
Yield per acre - 1.66 1.00 2.98 - 99.41 163.84
Share of production (%) 100.00 100.00 100.00 100.00 - 100.00 67.00
Value per unit - 32.00 32.00 85.00 - 6.15 6.15
Total product value - 53.22 32.15 253.26 - 611.38 675.12
Other crop income 124.53 17.61 4.46 - - 26.68 -
Gross return per acre 124.53 70.83 36.61 253.26 - 638.06 675.12
Direct Expenses
Seed - - - - - 77.46 -
Fertilizer - - - 50.00 - 129.75 119.80
Crop chemicals 20.38 19.33 19.31 - 18.03 20.89 20.39
Crop insurance - 0.40 0.40 4.59 16.31 15.52 -
Land rent - 28.04 - - - 87.19 -
Fuel & oil - 3.15 3.15 37.83 - 34.68 34.68
Repairs - 8.67 8.67 104.09 - 95.41 95.41
Operating interest - 0.57 0.57 6.80 - 6.23 6.23
Total direct expenses 20.38 60.16 32.10 203.31 34.34 467.13 276.50
Return over direct expenses 104.15 10.67 4.50 49.95 -34.34 170.92 398.61
Overhead Expenses
Hired labor - 0.39 0.39 4.71 - 4.32 4.32
Real estate taxes - - 1.98 23.82 - - -
Farm insurance - 0.17 0.17 2.04 - 1.87 1.87
Utilities - 0.79 0.79 9.53 - 8.74 8.74
Interest on interm. debt - 0.04 0.04 0.49 - 0.44 0.44
Interest on lng term debt - - 1.25 15.00 - - -
Machinery depreciation - 1.67 1.67 20.05 - 18.38 18.38
Miscellaneous - 0.33 0.33 4.00 - 3.67 3.67
Total overhead expenses - 3.40 6.64 79.64 - 37.42 37.42
Total dir & ovhd expenses 20.38 63.56 38.74 282.95 34.34 504.55 313.92
Net return per acre 104.15 7.27 -2.14 -29.69 -34.34 133.51 361.20
Government payments - - - - - - -
Net return with govt pmts 104.15 7.27 -2.14 -29.69 -34.34 133.51 361.20
Labor & management charge - 2.88 2.88 34.61 - 31.73 31.73
Net return over lbr & mgt 104.15 4.38 -5.02 -64.30 -34.34 101.78 329.47
Cost of Production Per Unit
Total direct expenses n/a 36.17 31.96 68.24 n/a 4.70 2.52
Total dir & ovhd expenses n/a 38.22 38.56 94.96 n/a 5.08 2.86
Less govt & other income n/a 27.63 34.13 94.96 n/a 4.81 2.86
With labor & management n/a 29.36 37.00 106.58 n/a 5.13 3.15
Net value per unit n/a 32.00 32.00 85.00 n/a 6.15 6.15
Machinery cost per acre - 13.54 13.54 162.45 - 148.92 148.92
Est. labor hours per acre - - - - - - -
FINPACK © Center For Farm Financial Management
University of Minnesota

Page 11
CROP ENTERPRISE ANALYSIS (continued)
Soybeans Soybeans Soybeans
Combined Combined Combined
Cash Rented Owned Share Rented
Returns
Acres 321.70 143.90 171.70
Unit bu. bu. bu.
Yield per acre 25.34 30.99 35.28
Share of production (%) 100.00 100.00 67.00
Value per unit 11.75 11.75 11.75
Total product value 297.75 364.09 277.77
Other crop income 9.17 8.17 -
Gross return per acre 306.92 372.26 277.77
Direct Expenses
Seed 57.84 60.00 -
Fertilizer 11.27 11.70 10.36
Crop chemicals 35.21 29.85 36.07
Crop insurance 14.41 14.09 -
Land rent 92.58 - -
Fuel & oil 28.38 28.38 28.38
Repairs 78.06 78.06 78.06
Operating interest 5.10 5.10 5.10
Total direct expenses 322.84 227.18 157.97
Return over direct expenses -15.92 145.08 119.80
Overhead Expenses
Hired labor 3.54 3.54 3.54
Real estate taxes - 17.86 -
Farm insurance 1.53 1.53 1.53
Utilities 7.15 7.15 7.15
Interest on interm. debt 0.36 0.36 0.36
Interest on lng term debt - 11.25 -
Machinery depreciation 15.04 15.04 15.04
Miscellaneous 3.00 3.00 3.00
Total overhead expenses 30.61 59.73 30.61
Total dir & ovhd expenses 353.46 286.91 188.58
Net return per acre -46.54 85.35 89.19
Government payments - - -
Net return with govt pmts -46.54 85.35 89.19
Labor & management charge 25.96 25.96 25.96
Net return over lbr & mgt -72.50 59.39 63.23
Cost of Production Per Unit
Total direct expenses 12.74 7.33 6.68
Total dir & ovhd expenses 13.95 9.26 7.98
Less govt & other income 13.59 9.00 7.98
With labor & management 14.61 9.83 9.08
Net value per unit 11.75 11.75 11.75
Machinery cost per acre 121.84 121.84 121.84
Est. labor hours per acre - - -
FINPACK © Center For Farm Financial Management
University of Minnesota
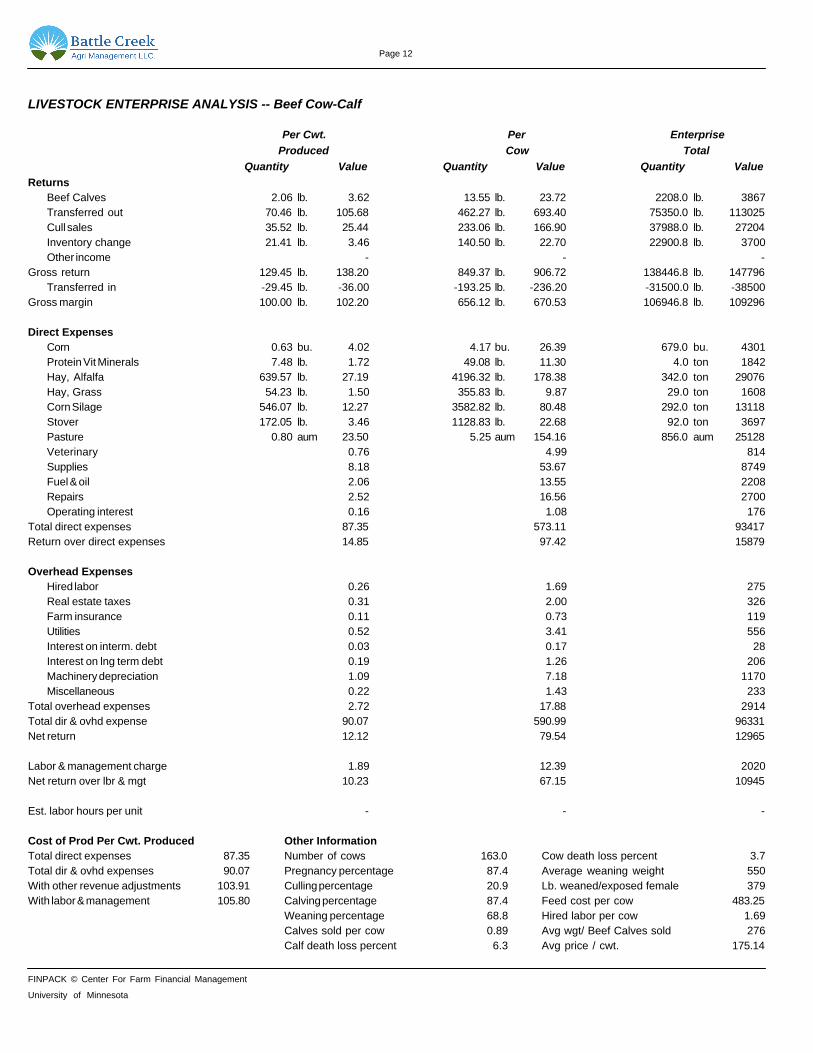
Page 12
LIVESTOCK ENTERPRISE ANALYSIS -- Beef Cow-Calf
Per Cwt. Per Enterprise
Produced Cow Total
Quantity Value Quantity Value Quantity Value
Returns
Beef Calves 2.06 lb. 3.62 13.55 lb. 23.72 2208.0 lb. 3867
Transferred out 70.46 lb. 105.68 462.27 lb. 693.40 75350.0 lb. 113025
Cull sales 35.52 lb. 25.44 233.06 lb. 166.90 37988.0 lb. 27204
Inventory change 21.41 lb. 3.46 140.50 lb. 22.70 22900.8 lb. 3700
Other income - - -
Gross return 129.45 lb. 138.20 849.37 lb. 906.72 138446.8 lb. 147796
Transferred in -29.45 lb. -36.00 -193.25 lb. -236.20 -31500.0 lb. -38500
Gross margin 100.00 lb. 102.20 656.12 lb. 670.53 106946.8 lb. 109296
Direct Expenses
Corn 0.63 bu. 4.02 4.17 bu. 26.39 679.0 bu. 4301
Protein Vit Minerals 7.48 lb. 1.72 49.08 lb. 11.30 4.0 ton 1842
Hay, Alfalfa 639.57 lb. 27.19 4196.32 lb. 178.38 342.0 ton 29076
Hay, Grass 54.23 lb. 1.50 355.83 lb. 9.87 29.0 ton 1608
Corn Silage 546.07 lb. 12.27 3582.82 lb. 80.48 292.0 ton 13118
Stover 172.05 lb. 3.46 1128.83 lb. 22.68 92.0 ton 3697
Pasture 0.80 aum 23.50 5.25 aum 154.16 856.0 aum 25128
Veterinary 0.76 4.99 814
Supplies 8.18 53.67 8749
Fuel & oil 2.06 13.55 2208
Repairs 2.52 16.56 2700
Operating interest 0.16 1.08 176
Total direct expenses 87.35 573.11 93417
Return over direct expenses 14.85 97.42 15879
Overhead Expenses
Hired labor 0.26 1.69 275
Real estate taxes 0.31 2.00 326
Farm insurance 0.11 0.73 119
Utilities 0.52 3.41 556
Interest on interm. debt 0.03 0.17 28
Interest on lng term debt 0.19 1.26 206
Machinery depreciation 1.09 7.18 1170
Miscellaneous 0.22 1.43 233
Total overhead expenses 2.72 17.88 2914
Total dir & ovhd expense 90.07 590.99 96331
Net return 12.12 79.54 12965
Labor & management charge 1.89 12.39 2020
Net return over lbr & mgt 10.23 67.15 10945
Est. labor hours per unit - - -
Cost of Prod Per Cwt. Produced Other Information
Total direct expenses 87.35 Number of cows 163.0 Cow death loss percent 3.7
Total dir & ovhd expenses 90.07 Pregnancy percentage 87.4 Average weaning weight 550
With other revenue adjustments 103.91 Culling percentage 20.9 Lb. weaned/exposed female 379
With labor & management 105.80 Calving percentage 87.4 Feed cost per cow 483.25
Weaning percentage 68.8 Hired labor per cow 1.69
Calves sold per cow 0.89 Avg wgt/ Beef Calves sold 276
Calf death loss percent 6.3 Avg price / cwt. 175.14
FINPACK © Center For Farm Financial Management
University of Minnesota
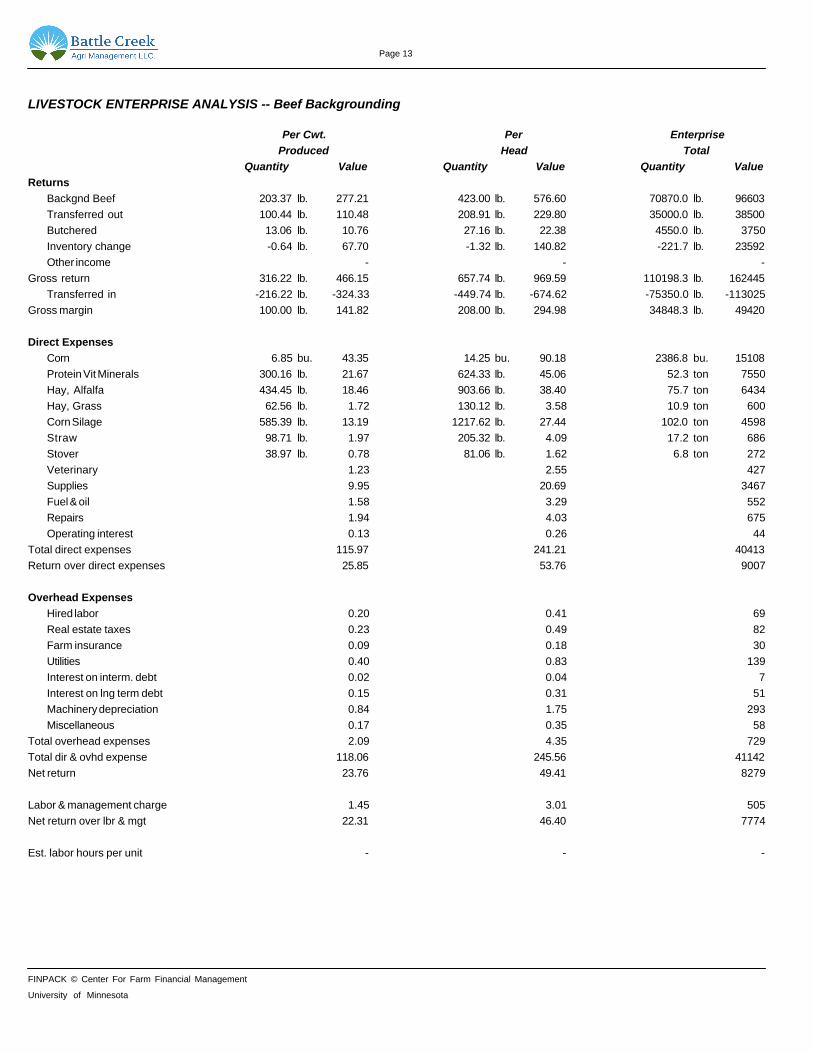
Page 13
LIVESTOCK ENTERPRISE ANALYSIS -- Beef Backgrounding
Per Cwt. Per Enterprise
Produced Head Total
Quantity Value Quantity Value Quantity Value
Returns
Backgnd Beef 203.37 lb. 277.21 423.00 lb. 576.60 70870.0 lb. 96603
Transferred out 100.44 lb. 110.48 208.91 lb. 229.80 35000.0 lb. 38500
Butchered 13.06 lb. 10.76 27.16 lb. 22.38 4550.0 lb. 3750
Inventory change -0.64 lb. 67.70 -1.32 lb. 140.82 -221.7 lb. 23592
Other income - - -
Gross return 316.22 lb. 466.15 657.74 lb. 969.59 110198.3 lb. 162445
Transferred in -216.22 lb. -324.33 -449.74 lb. -674.62 -75350.0 lb. -113025
Gross margin 100.00 lb. 141.82 208.00 lb. 294.98 34848.3 lb. 49420
Direct Expenses
Corn 6.85 bu. 43.35 14.25 bu. 90.18 2386.8 bu. 15108
Protein Vit Minerals 300.16 lb. 21.67 624.33 lb. 45.06 52.3 ton 7550
Hay, Alfalfa 434.45 lb. 18.46 903.66 lb. 38.40 75.7 ton 6434
Hay, Grass 62.56 lb. 1.72 130.12 lb. 3.58 10.9 ton 600
Corn Silage 585.39 lb. 13.19 1217.62 lb. 27.44 102.0 ton 4598
Straw 98.71 lb. 1.97 205.32 lb. 4.09 17.2 ton 686
Stover 38.97 lb. 0.78 81.06 lb. 1.62 6.8 ton 272
Veterinary 1.23 2.55 427
Supplies 9.95 20.69 3467
Fuel & oil 1.58 3.29 552
Repairs 1.94 4.03 675
Operating interest 0.13 0.26 44
Total direct expenses 115.97 241.21 40413
Return over direct expenses 25.85 53.76 9007
Overhead Expenses
Hired labor 0.20 0.41 69
Real estate taxes 0.23 0.49 82
Farm insurance 0.09 0.18 30
Utilities 0.40 0.83 139
Interest on interm. debt 0.02 0.04 7
Interest on lng term debt 0.15 0.31 51
Machinery depreciation 0.84 1.75 293
Miscellaneous 0.17 0.35 58
Total overhead expenses 2.09 4.35 729
Total dir & ovhd expense 118.06 245.56 41142
Net return 23.76 49.41 8279
Labor & management charge 1.45 3.01 505
Net return over lbr & mgt 22.31 46.40 7774
Est. labor hours per unit - - -
FINPACK © Center For Farm Financial Management
University of Minnesota
Page 14
LIVESTOCK ENTERPRISE ANALYSIS -- Beef Backgrounding (continued)
Cost of Prod Per Cwt. Sold/Trans Other Information
Total direct expenses 119.10 No. purchased or trans in 137 Feed cost per head 210.39
Total dir & ovhd expenses 119.79 Number sold or trans out 129 Hired labor per head 0.41
With other revenue adjustments 119.79 Percentage death loss 0.4 Average trans in weight 550
With labor & management 120.27 Avg. daily gain (lb.) 1.91 Avg wgt / Backgnd Beef sold 754
Lb. of conc / lb. of gain 6.84 Avg trans in value / cwt. 150.00
Lb. of feed / lb. of gain 15.04 Avg sales price / cwt. 136.31
Feed cost per cwt. of gain 101.15
FINPACK © Center For Farm Financial Management
University of Minnesota

Page 15
LIVESTOCK ENTERPRISE ANALYSIS -- Beef Cow-Calf combined
Per Cwt. Per Enterprise
Produced Cow Total
Quantity Value Quantity Value Quantity Value
Returns
Beef Calves 1.56 lb. 2.73 13.55 lb. 23.72 2208.0 lb. 3867
Backgnd Beef 49.98 lb. 68.13 434.79 lb. 592.66 70870.0 lb. 96603
Cull sales 26.79 lb. 19.19 233.06 lb. 166.90 37988.0 lb. 27204
Butchered 3.21 lb. 2.64 27.91 lb. 23.01 4550.0 lb. 3750
Inventory change 15.99 lb. 19.25 139.14 lb. 167.44 22679.1 lb. 27292
Other income - - -
Gross return 100.00 lb. 111.93 869.91 lb. 973.72 141795.1 lb. 158716
Gross margin 100.00 lb. 111.93 869.91 lb. 973.72 141795.1 lb. 158716
Direct Expenses
Corn 2.16 13.69 18.81 119.07 3065.8 19409
Protein Vit Minerals 79.41 lb. 6.62 690.80 lb. 57.62 56.3 9392
Hay, Alfalfa 589.16 lb. 25.04 5125.15 lb. 217.85 417.7 35510
Hay, Grass 56.28 lb. 1.56 489.57 lb. 13.55 39.9 2208
Corn Silage 555.73 lb. 12.49 4834.36 lb. 108.69 394.0 17716
Straw 24.26 lb. 0.48 211.04 lb. 4.21 17.2 686
Stover 139.34 lb. 2.80 1212.15 lb. 24.35 98.8 3969
Pasture 0.60 17.72 5.25 154.16 856.0 25128
Veterinary 0.88 7.61 1241
Supplies 8.62 74.94 12216
Fuel & oil 1.95 16.93 2760
Repairs 2.38 20.70 3375
Operating interest 0.16 1.35 220
Total direct expenses 94.38 821.04 133830
Return over direct expenses 17.55 152.68 24886
Overhead Expenses
Hired labor 0.24 2.11 344
Real estate taxes 0.29 2.50 408
Farm insurance 0.10 0.91 149
Utilities 0.49 4.27 696
Interest on interm. debt 0.02 0.22 35
Interest on lng term debt 0.18 1.58 257
Machinery depreciation 1.03 8.97 1463
Miscellaneous 0.21 1.79 292
Total overhead expenses 2.57 22.35 3643
Total dir & ovhd expense 96.95 843.39 137473
Net return 14.98 130.33 21244
Labor & management charge 1.78 15.49 2525
Net return over lbr & mgt 13.20 114.84 18719
Est. labor hours per unit - - -
Cost of Prod Per Cwt. Produced Other Information
Total direct expenses 94.38 Number of cows 163.0 Average weaning weight 550
Total dir & ovhd expenses 96.95 Pregnancy percentage 87.4 Lb. weaned/exposed female 379
With other revenue adjustments 80.23 Culling percentage 20.9 Feed cost per cow 699.50
With labor & management 82.02 Calving percentage 87.4 Hired labor per cow 2.11
Weaning percentage 68.8 Avg wgt/ Beef Calves sold 276
Calves sold per cow 0.89 Avg price / cwt. 175.14
Calf death loss percent 6.3 Avg wgt/Backgnd Beef sold 754
Cow death loss percent 3.7 Avg price / cwt. 136.31
FINPACK © Center For Farm Financial Management
University of Minnesota

Page 16
LIVESTOCK ENTERPRISE ANALYSIS -- Hogs, Finish Feeder Pigs Custom Feeding
Per Enterprise
Head Total
Quantity Value Quantity Value
Returns
Other income - -
Gross return 267.51 lb. - 377590.0 lb. -
Gross margin 200.00 lb. - 282300.0 lb. -
Direct Expenses
Total direct expenses - -
Return over direct expenses - -
Overhead Expenses
Total overhead expenses - -
Total dir & ovhd expense - -
Net return - -
Labor & management charge - -
Net return over lbr & mgt - -
Est. labor hours per unit - -
Cost of Prod Other Information
Total direct expenses - No. purchased or trans in 1,701 Avg. daily gain (lb.) 1.66
Total dir & ovhd expenses - Number sold or trans out 1,546 Average carcass weight 148
With other revenue adjustments - Percentage death loss 1.7 Average price / cwt. carcass 67.57
With labor & management -
FINPACK © Center For Farm Financial Management
University of Minnesota
Page 17
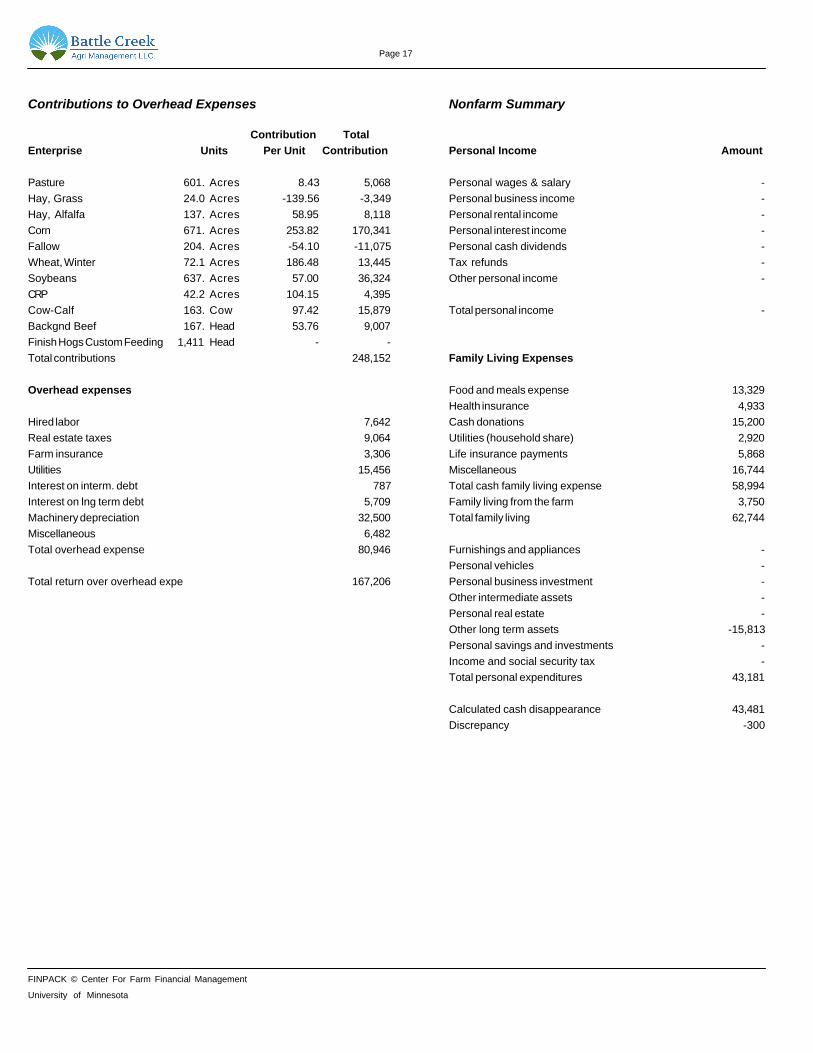
Contributions to Overhead Expenses Nonfarm Summary
Contribution Total
Enterprise Units Per Unit Contribution Personal Income Amount
Pasture 601. Acres 8.43 5,068 Personal wages & salary -
Hay, Grass 24.0 Acres -139.56 -3,349 Personal business income -
Hay, Alfalfa 137. Acres 58.95 8,118 Personal rental income -
Corn 671. Acres 253.82 170,341 Personal interest income -
Fallow 204. Acres -54.10 -11,075 Personal cash dividends -
Wheat, Winter 72.1 Acres 186.48 13,445 Tax refunds -
Soybeans 637. Acres 57.00 36,324 Other personal income -
CRP 42.2 Acres 104.15 4,395
Cow-Calf 163. Cow 97.42 15,879 Total personal income -
Backgnd Beef 167. Head 53.76 9,007
Finish Hogs Custom Feeding 1,411 Head - -
Total contributions 248,152 Family Living Expenses
Overhead expenses Food and meals expense 13,329
Health insurance 4,933
Hired labor 7,642 Cash donations 15,200
Real estate taxes 9,064 Utilities (household share) 2,920
Farm insurance 3,306 Life insurance payments 5,868
Utilities 15,456 Miscellaneous 16,744
Interest on interm. debt 787 Total cash family living expense 58,994
Interest on lng term debt 5,709 Family living from the farm 3,750
Machinery depreciation 32,500 Total family living 62,744
Miscellaneous 6,482
Total overhead expense 80,946 Furnishings and appliances -
Personal vehicles -
Total return over overhead expe 167,206 Personal business investment -
Other intermediate assets -
Personal real estate -
Other long term assets -15,813
Personal savings and investments -
Income and social security tax -
Total personal expenditures 43,181
Calculated cash disappearance 43,481
Discrepancy -300
FINPACK © Center For Farm Financial Management
University of Minnesota

Page 18
Cash Accuracy Check
Beginning cash balance 2,721 Ending cash balance -1,313
Gross cash farm income 969,232 Total cash farm expense 711,251
Personal income - Family living expense 58,994
Capital sales 26,629 Capital purchases 86,466
Money borrowed 531,200 Principal payments 674,084
Gifts and inheritances - Gifts given -
Beginning personal savings - Ending personal savings -
Income taxes -
Total inflows 1,529,782 Total outflows 1,529,482
Discrepancy (inflows - outflows) 300
Liabilities Check
Beginning liabilities 947,854
Money borrowed (+) 531,200
Principal payments (-) 674,084
Change in accounts payable (+) -
Ending liabilities calculated (=) 804,970
Ending liabilities reported (-) 804,970
Discrepancy (=) 0
Crop & Feed Check
Crop Corn Soybeans W. Wheat All Hay Corn Silage Pasture Fallow
Beginning inventory 99,043 429 350 948 394 - -
Produced 69,412 16,670 2,315 456 - 856 -
Purchased - - - - - - -
Total sources 168,455 17,099 2,665 1,404 394 856 -
Sold 114,633 15,317 1,657 - - - -
Fed 3,066 - - 532 394 856 -
Ending inventory 50,756 1,782 1,008 872 - - -
Total uses 168,455 17,099 2,665 1,404 394 856 -
Discrepancy 0 0 0 0 0 0 0
FINPACK © Center For Farm Financial Management
University of Minnesota

Page 19
Crop & Feed Check (continued)
Crop CRP Straw
Beginning inventory - -
Produced - -
Purchased - -
Total sources - -
Sold - -
Fed - 17
Ending inventory - -
Total uses - 17
Discrepancy 0 -17
FINPACK © Center For Farm Financial Management
University of Minnesota
Page 20
Notes
FINPACK © Center For Farm Financial Management
University of Minnesota

Page 21
Current Ratio
2010 2011
5
4
3
2
1
0
FINBIN My Farm
Current RatioThe extent to which current farm assets, if liquidated, would cover
current farm liabilities.
Total current farm assets divided by total current farm liabilities.
Strong Greater than 2Caution 2 to 1.3Vulnerable Less than 1.3
Working Capital to Gross Revenues
2010 2011
50
40
30
20
10
0
FINBIN My Farm
Working Capital to Gross RevenuesMeasures operating capital available against the size of the
business.
Working capital divided by gross revenues.
Strong Greater than 30Caution 30 to 10Vulnerable Less than 10
Debt to Asset Ratio (mkt)
2010 2011
60
50
40
30
20
10
0
FINBIN My Farm
Debt to Asset Ratio (mkt)The proportion of total farm assets owed to creditors.
Total farm debt divided by total farm assets.
Strong Less than 30%Caution 30% to 60%Vulnerable Greater than 60%
Debt to Equity Ratio (mkt)
2010 2011
1.4
1.2
1
0.8
0.6
0.4
0.2
0
FINBIN My Farm
Debt to Equity Ratio (mkt)The relative amount of money borrowed as a percentage of equity
capital.
Farm debt divided by equity.
Strong Less than 0.43Caution 0.43 to 1.5Vulnerable Greater than 1.5
FINPACK © Center For Farm Financial Management
University of Minnesota

Page 22
Rate of Return on Assets-cost
2010 2011
15
10
5
0
FINBIN My Farm
Rate of Return on Assets-costThe rate earned on the total business investment, equity and
borrowed capital.
Net farm income + interest - value oper labor & mgmt divided by
average farm assets.
Strong Greater than 8%Caution 8% to 4%Vulnerable Less than 4%
Rate of Return on Equity-cost
2010 2011
35
30
25
20
15
10
5
0
FINBIN My Farm
Rate of Return on Equity-costThe rate earned on equity capital invested in the business.
Net farm income - value oper labor & mgmt divided by average farm
net worth.
Strong Greater than 10%Caution 10% to 3%Vulnerable Less than 3%
Operating Profit Margin (cost)
2010 2011
35
30
25
20
15
10
5
0
FINBIN My Farm
Operating Profit Margin (cost)Measures the operating efficiency of the business in terms of
return as a percentage of gross income.
Net farm income + interest - value of labor & mgmt divided by the
value of farm production.
Strong Greater than 25%Caution 25% to 15%Vulnerable Less than 15%
Net Farm Income (cost)
2010 2011
300,000
250,000
200,000
150,000
100,000
50,000
0
FINBIN My Farm
Net Farm Income (cost)The net income from the farm that is available for owner
withdrawals, income taxes and equity growth.
Cash income - cash expense + inventory change - depreciation.
FINPACK © Center For Farm Financial Management
University of Minnesota

Page 23
Term Debt Coverage Ratio
2010 2011
4
2
0
-2
-4
-6
-8
-10
FINBIN My Farm
Term Debt Coverage RatioThe ability of the business to generate enough income to cover all
scheduled intermediate and long term debt payments.
Net farm oper income + net nonfarm income + interest on term debt -
fam liv & taxes / term debt prin & int.
Strong Greater than 1.75Caution 1.75 to 1.25Vulnerable Less than 1.25
Replacement Margin Coverage Ra
2010 2011
4
2
0
-2
-4
-6
-8
-10
FINBIN My Farm
Replacement Margin Coverage RaA ratio below 1.0 indicates you did not generate enough income to
cover term debt payments and unfunded capital purchases.
Strong Greater than 1.5Caution 1.5 to 1.1Vulnerable Less than 1.1
Asset Turnover Rate (cost)
2010 2011
60
50
40
30
20
10
0
FINBIN My Farm
Asset Turnover Rate (cost)Measures efficiency of capital invested in the business in terms of
the gross revenue generated by each dollar of investment.
Value of farm production divided by average farm assets.
Strong Greater than 45%Caution 45% to 30%Vulnerable Less than 30%
Operating Expense Ratio
2010 2011
80
70
60
50
40
30
20
10
0
FINBIN My Farm
Operating Expense RatioThe portion of gross revenue used to pay operating expenses.
Farm operating expense - interest expense divided by gross income.
Strong Less than 60%Caution 60% to 80%Vulnerable Greater than 80%
FINPACK © Center For Farm Financial Management
University of Minnesota

Page 24
Comparative Balance Sheets (cost)
2009 2010 2011
Current Assets
Cash and checking -16,818 2,721 -1,313
Prepaid exp. & supplies 2,700 3,000 31,500
Growing crops - 5,940 4,000
Crop inventory 332,331 478,096 386,497
Livestock held for sale 97,990 97,545 131,037
Total Current Assets 416,203 587,302 551,722
Intermediate Assets
Breeding livestock 124,950 129,900 135,400
Machinery and equipment 290,465 325,000 368,150
Titled vehicles 25,300 24,500 24,500
Other intermediate assets 26,000 26,000 26,000
Total Intermediate Assets 466,715 505,400 554,050
Long Term Assets
Land 514,607 514,607 474,868
Buildings and improvements 95,700 90,900 90,900
Total Long Term Assets 610,307 605,507 565,768
Total Farm Assets 1,493,225 1,698,209 1,671,540
Total Personal Assets 7,000 7,000 7,000
Total All Assets 1,500,225 1,705,209 1,678,540
Current Liabillities
Total Current Loans 212,000 208,525 59,400
Principal due on term loans 60,200 64,423 64,423
Total Current Liabilities 272,200 272,948 123,823
Total Intermediate Loans 478,675 477,545 507,076
Total Long Term Loans 207,687 197,361 174,071
Total Farm Liabilities 958,562 947,854 804,970
Total Personal Liabilities 0 0 0
Total All Liabilities 958,562 947,854 804,970
Equity
Retained earnings 541,663 757,355 873,570
Retained earnings chg 0 215,691 116,215
FINPACK © Center For Farm Financial Management
University of Minnesota
Page 25
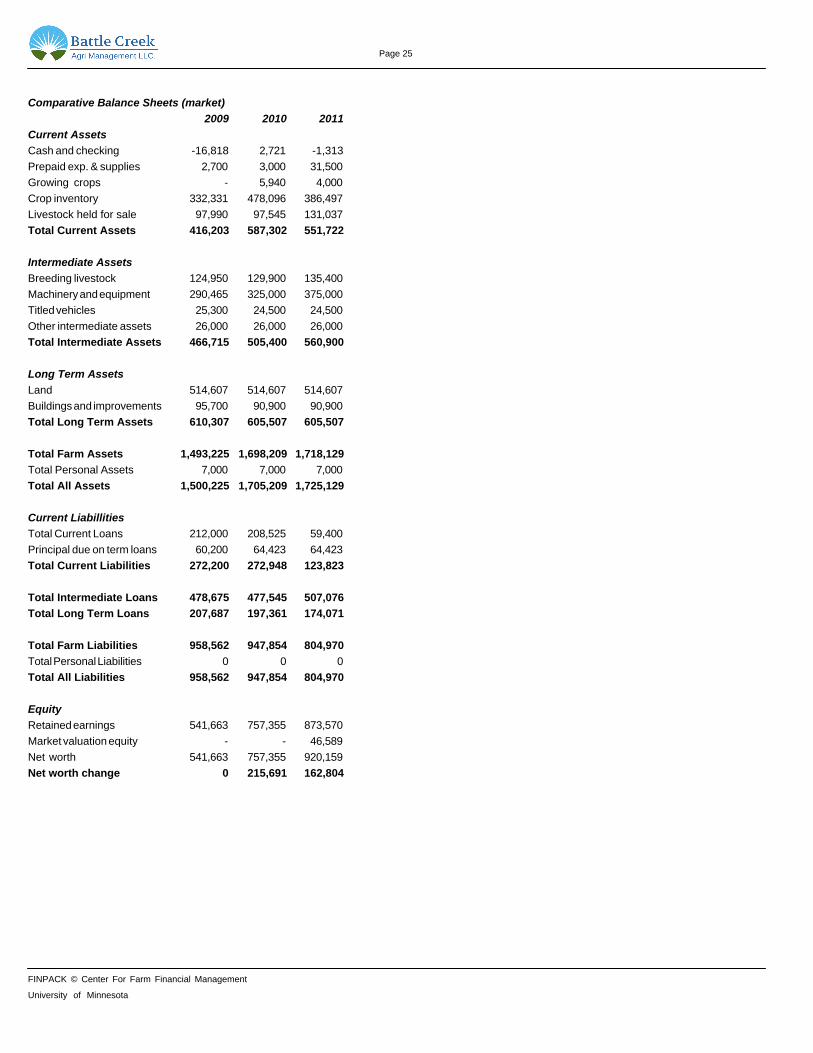
Comparative Balance Sheets (market)
2009 2010 2011
Current Assets
Cash and checking -16,818 2,721 -1,313
Prepaid exp. & supplies 2,700 3,000 31,500
Growing crops - 5,940 4,000
Crop inventory 332,331 478,096 386,497
Livestock held for sale 97,990 97,545 131,037
Total Current Assets 416,203 587,302 551,722
Intermediate Assets
Breeding livestock 124,950 129,900 135,400
Machinery and equipment 290,465 325,000 375,000
Titled vehicles 25,300 24,500 24,500
Other intermediate assets 26,000 26,000 26,000
Total Intermediate Assets 466,715 505,400 560,900
Long Term Assets
Land 514,607 514,607 514,607
Buildings and improvements 95,700 90,900 90,900
Total Long Term Assets 610,307 605,507 605,507
Total Farm Assets 1,493,225 1,698,209 1,718,129
Total Personal Assets 7,000 7,000 7,000
Total All Assets 1,500,225 1,705,209 1,725,129
Current Liabillities
Total Current Loans 212,000 208,525 59,400
Principal due on term loans 60,200 64,423 64,423
Total Current Liabilities 272,200 272,948 123,823
Total Intermediate Loans 478,675 477,545 507,076
Total Long Term Loans 207,687 197,361 174,071
Total Farm Liabilities 958,562 947,854 804,970
Total Personal Liabilities 0 0 0
Total All Liabilities 958,562 947,854 804,970
Equity
Retained earnings 541,663 757,355 873,570
Market valuation equity - - 46,589
Net worth 541,663 757,355 920,159
Net worth change 0 215,691 162,804
FINPACK © Center For Farm Financial Management
University of Minnesota
Page 26
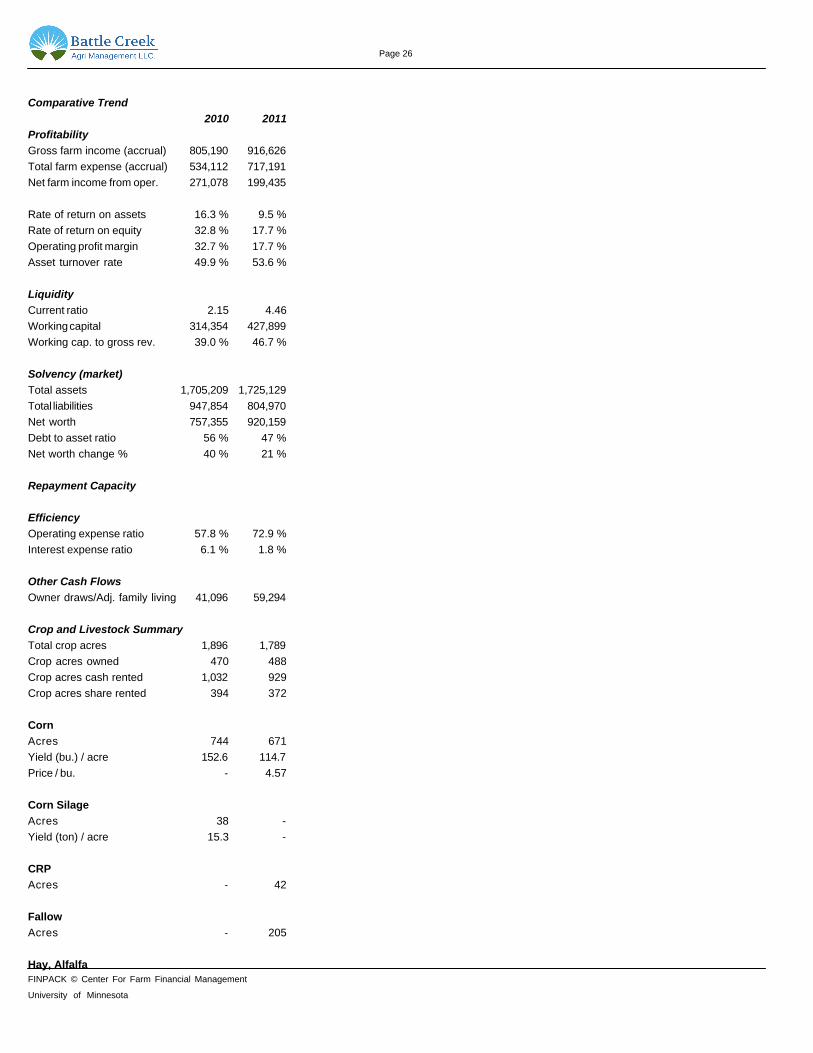
Comparative Trend
2010 2011
Profitability
Gross farm income (accrual) 805,190 916,626
Total farm expense (accrual) 534,112 717,191
Net farm income from oper. 271,078 199,435
Rate of return on assets 16.3 % 9.5 %
Rate of return on equity 32.8 % 17.7 %
Operating profit margin 32.7 % 17.7 %
Asset turnover rate 49.9 % 53.6 %
Liquidity
Current ratio 2.15 4.46
Working capital 314,354 427,899
Working cap. to gross rev. 39.0 % 46.7 %
Solvency (market)
Total assets 1,705,209 1,725,129
Total liabilities 947,854 804,970
Net worth 757,355 920,159
Debt to asset ratio 56 % 47 %
Net worth change % 40 % 21 %
Repayment Capacity
Efficiency
Operating expense ratio 57.8 % 72.9 %
Interest expense ratio 6.1 % 1.8 %
Other Cash Flows
Owner draws/Adj. family living 41,096 59,294
Crop and Livestock Summary
Total crop acres 1,896 1,789
Crop acres owned 470 488
Crop acres cash rented 1,032 929
Crop acres share rented 394 372
Corn
Acres 744 671
Yield (bu.) / acre 152.6 114.7
Price / bu. - 4.57
Corn Silage
Acres 38 -
Yield (ton) / acre 15.3 -
CRP
Acres - 42
Fallow
Acres - 205
Hay, Alfalfa
FINPACK © Center For Farm Financial Management
University of Minnesota
Page 27
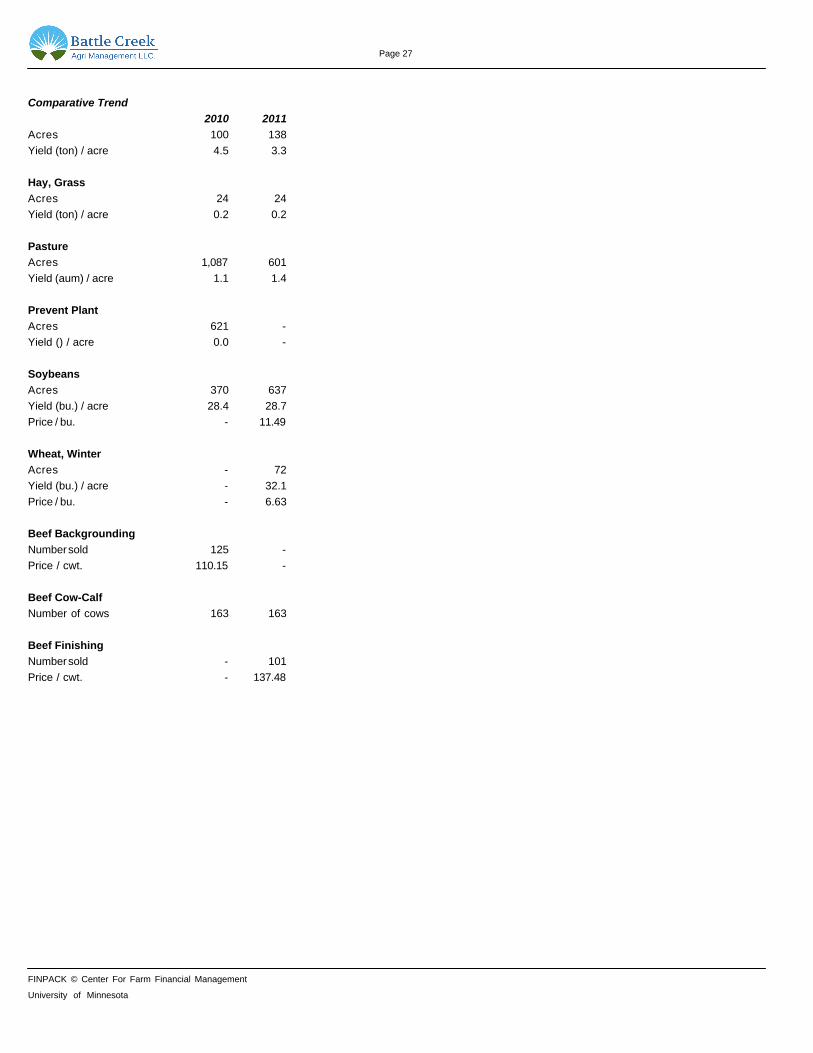
Comparative Trend
2010 2011
Acres 100 138
Yield (ton) / acre 4.5 3.3
Hay, Grass
Acres 24 24
Yield (ton) / acre 0.2 0.2
Pasture
Acres 1,087 601
Yield (aum) / acre 1.1 1.4
Prevent Plant
Acres 621 -
Yield () / acre 0.0 -
Soybeans
Acres 370 637
Yield (bu.) / acre 28.4 28.7
Price / bu. - 11.49
Wheat, Winter
Acres - 72
Yield (bu.) / acre - 32.1
Price / bu. - 6.63
Beef Backgrounding
Number sold 125 -
Price / cwt. 110.15 -
Beef Cow-Calf
Number of cows 163 163
Beef Finishing
Number sold - 101
Price / cwt. - 137.48
FINPACK © Center For Farm Financial Management
University of Minnesota
Top Related