


Languages
Pages
Legal

Pharmaceutics 2010, 2, 30-49; doi:10.3390/pharmaceutics2010030
pharmaceuticsISSN 1999-4923
www.mdpi.com/journal/pharmaceutics
Article
Quantification of Process Induced Disorder in Milled Samples Using Different Analytical Techniques
Ulrike Zimper 1, Jaakko Aaltonen 1,2, Cushla M. McGoverin 3, Keith C. Gordon 3,
Karen Krauel-Goellner 4 and Thomas Rades 1,*
1 School of Pharmacy, University of Otago, 18 Frederick Street, 9016 Dunedin, New Zealand;
E-Mail: [email protected] (U.Z.) 2 School of Pharmacy, Faculty of Health Sciences, University of Eastern Finland,
Yliopistonranta 1 C, 70210 Kuopio, Finland; E-Mail: [email protected] (J.A.) 3 Department of Chemistry, MacDiarmid Institute for Advanced Materials and Nanotechnology,
University of Otago, Union Place West, 9016 Dunedin, New Zealand;
E-Mails: [email protected] (C.M.M.); [email protected] (K.C.G.) 4 Institute of Food, Nutrition and Human Health, Massey University, 63 Wallace Street,
6021 Wellington, New Zealand; E-Mail: [email protected] (K.K.-G.)
* Author to whom correspondence should be addressed; E-Mail: [email protected];
Tel.: +64-3-479-5410; Fax: +64-3-479-7034.
Received: 10 December 2010; in revised form: 4 February 2010 / Accepted: 12 February 2010 /
Published: 16 February 2010
Abstract: The aim of this study was to compare three different analytical methods to detect
and quantify the amount of crystalline disorder/ amorphousness in two milled model drugs.
X-ray powder diffraction (XRPD), differential scanning calorimetry (DSC) and Raman
spectroscopy were used as analytical methods and indomethacin and simvastatin were
chosen as the model compounds. These compounds partly converted from crystalline to
disordered forms by milling. Partial least squares regression (PLS) was used to create
calibration models for the XRPD and Raman data, which were subsequently used to
quantify the milling-induced crystalline disorder/ amorphousness under different process
conditions. In the DSC measurements the change in heat capacity at the glass transition was
used for quantification. Differently prepared amorphous indomethacin standards (prepared
by either melt quench cooling or cryo milling) were compared by principal component
OPEN ACCESS
Pharmaceutics 2010, 2
31
analysis (PCA) to account for the fact that the choice of standard ultimately influences the
quantification outcome. Finally, the calibration models were built using binary mixtures of
crystalline and quench cooled amorphous drug materials. The results imply that the outcome
with respect to crystalline disorder for milled drugs depends on the analytical method used
and the calibration standard chosen as well as on the drug itself. From the data presented
here, it appears that XRPD tends to give a higher percentage of crystalline disorder than
Raman spectroscopy and DSC for the same samples. For the samples milled under the
harshest milling conditions applied (60 min, sixty 4 mm balls, 25 Hz) a crystalline disorder /
amorphous content of 44.0% (XRPD), 10.8% (Raman spectroscopy) and 17.8% (DSC) were
detected for indomethacin. For simvastatin 18.3% (XRPD), 15.5% (Raman spectroscopy)
and 0% (DSC, no glass transition) crystalline disorder/ amorphousness were detected.
Keywords: indomethacin, simvastatin; amorphous; process induced disorder; ball milling;
DSC; XRPD; Raman spectroscopy; multivariate analysis; principal component analysis
(PCA); partial least squares regression (PLS)
1. Introduction
Milling is a common unit operation in the pharmaceutical industry to diminish the particle size of
powders and/ or to achieve narrower size distributions for better mixing or for other reasons, such as
the use of powders in pulmonary drug delivery and for dissolution rate improvement of poorly water
soluble drugs [1]. New active pharmaceutical ingredients (API) are often very poorly water soluble,
and improvement of the dissolution rate of such APIs is one of the most important topics of research in
the field of pharmaceutics and dosage form development. According to the Noyes-Whitney equation
the dissolution rate is directly proportional to the surface area and solubility of a particle [2]. Reducing
the particle size is a simple and commercially and technically feasible approach to improve the
dissolution rate by increasing the overall surface area of a powder [3]. However, particle size is often
not the only property of a solid particle that is affected by milling. During the milling process the
materials are put under mechanical stress that can cause solid state transformations including
polymorphic conversion, introduction of crystalline disorder or the formation of amorphous domains
[4-6]. Since different solid state forms of a given API often have different physical properties such as
differences in flowability, hygroscopicity and chemical and physical stability but also different
solubilities and dissolution rates (and hence possibly different bioavailability), it is necessary to
monitor solid state changes during a milling operation.
There are many analytical tools that may be used for the quantification of crystalline disorder or
amorphous content of APIs [7]. Among these, X-ray powder diffraction (XRPD), differential scanning
calorimetry (DSC) and Raman spectroscopy are all established analytical methods, but they probe the
solid state at different levels (particulate versus molecular level) [8]. Therefore the information gained
by these methods may be used in a complementary way.
Pharmaceutics 2010, 2
32
XRPD is a diffraction technique that probes lattice properties of crystalline solids. The resulting
XRPD diffractograms show the presence or lack of crystal planes in the sample. As XRPD essentially
measures a crystalline property, a reduction in the peak heights and areas and the appearance of a
“halo” in the diffractogram is linked to a reduction in crystallinity, which may then be interpreted as
increase in crystalline disorder or amorphousness. However, particle size reduction during milling may
also cause a similar change in the diffractogram (i.e., a reduction in peak heights and peak areas) [9].
DSC is a thermal method that measures heat capacity changes within the sample and therefore is
capable of detecting phase transitions such as the glass transition of an amorphous drug. In contrast to
XRPD measurements the change in heat capacity (∆cp) at the glass transition temperature (Tg) can be
used as direct measurement of amorphous material rather than as a sum of truly amorphous and
otherwise disordered material
Raman spectroscopy, as a vibrational spectroscopic method, probes properties of the molecule
itself, and changes in the solid state properties of an API are inferred from changes in the molecular
conformation and molecular environment due to different packing conditions of the molecules in the
different solid forms. These changes become apparent as subtle changes in the peak positions and
intensities in the Raman spectra.
All three methods mentioned above can be used for qualitative as well as quantitative solid state
analysis. The response of each of these analytical techniques to increased crystalline disorder induced
by milling and the complementarities and agreement between DSC, XRPD and Raman spectroscopy in
the quantification of disorder within milled indomethacin and simvastatin was investigated in this
study. Analysis of whole spectra and diffractograms can be facilitated by multivariate analytical
methods such as principal component analysis (PCA) and partial least squares regression (PLS)
analysis [10]. Therefore, these tools have been applied in the current study.
Melting followed by quench cooling is regularly applied to convert a crystalline drug into an
amorphous form [11-13]. However, milling (especially under cryogenic conditions) as preparation
method to achieve fully amorphous compounds also appears possible and has been performed in
several studies [5,14-17]. This process though requires longer milling times and different process
parameters (e.g., number and size of milling balls used in a ball milling operation) than applied in
milling processes where the objective is to reduce the particle size. Therefore, melt quench cooled
amorphous and cryo milled amorphous indomethacin have been compared with regard to their
suitability as an amorphous standard in this study.
The aim of this work was to address the problem that different results with respect to reduced
crystallinity (increased crystalline disorder and/ or amorphousness) of milled APIs may be detected
when using different analytical methods. Besides fully crystalline material and completely amorphous
material, different forms of the solids with increasing disorder may be formed during a milling
operation. The problem thus arises that different techniques may detect these disordered solid forms
differently, thus potentially leading to different results in the determination of the degree of
crystallinity of a given sample.
Furthermore, the problem of finding a suitable calibration standard for an amorphous/ crystalline
mixture is discussed. It is an inherent problem that independently of the preparation method chosen for
the amorphous standard, the resulting calibration standard may only be an approximation of the actual
induced crystalline disorder in the milling process.
Pharmaceutics 2010, 2
33
In summary, for the quantification of crystalline disorder in milled samples three aspects have been
considered: analytical method and the calibration standard used and the drug itself.
2. Experimental Section
2.1. Materials
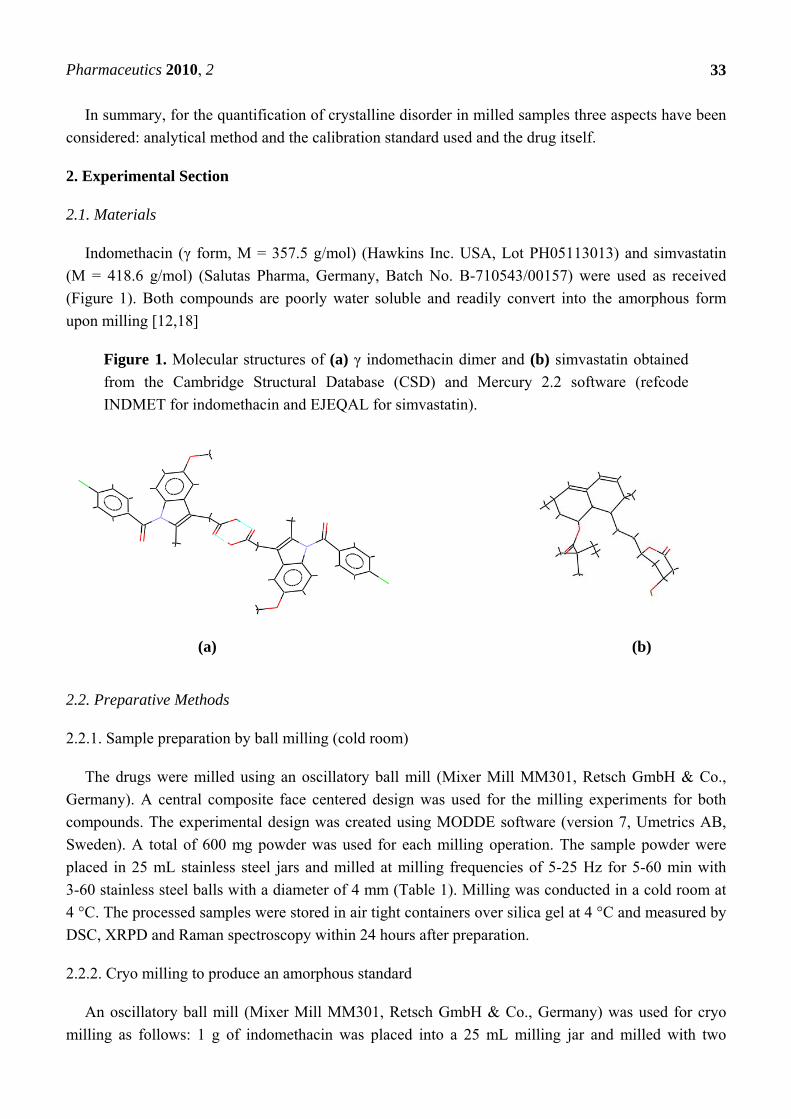
Indomethacin (γ form, M = 357.5 g/mol) (Hawkins Inc. USA, Lot PH05113013) and simvastatin
(M = 418.6 g/mol) (Salutas Pharma, Germany, Batch No. B-710543/00157) were used as received
(Figure 1). Both compounds are poorly water soluble and readily convert into the amorphous form
upon milling [12,18]
Figure 1. Molecular structures of (a) γ indomethacin dimer and (b) simvastatin obtained
from the Cambridge Structural Database (CSD) and Mercury 2.2 software (refcode
INDMET for indomethacin and EJEQAL for simvastatin).
(a) (b)
2.2. Preparative Methods
2.2.1. Sample preparation by ball milling (cold room)
The drugs were milled using an oscillatory ball mill (Mixer Mill MM301, Retsch GmbH & Co.,
Germany). A central composite face centered design was used for the milling experiments for both
compounds. The experimental design was created using MODDE software (version 7, Umetrics AB,
Sweden). A total of 600 mg powder was used for each milling operation. The sample powder were
placed in 25 mL stainless steel jars and milled at milling frequencies of 5-25 Hz for 5-60 min with
3-60 stainless steel balls with a diameter of 4 mm (Table 1). Milling was conducted in a cold room at
4 °C. The processed samples were stored in air tight containers over silica gel at 4 °C and measured by
DSC, XRPD and Raman spectroscopy within 24 hours after preparation.
2.2.2. Cryo milling to produce an amorphous standard
An oscillatory ball mill (Mixer Mill MM301, Retsch GmbH & Co., Germany) was used for cryo
milling as follows: 1 g of indomethacin was placed into a 25 mL milling jar and milled with two
Pharmaceutics 2010, 2
34
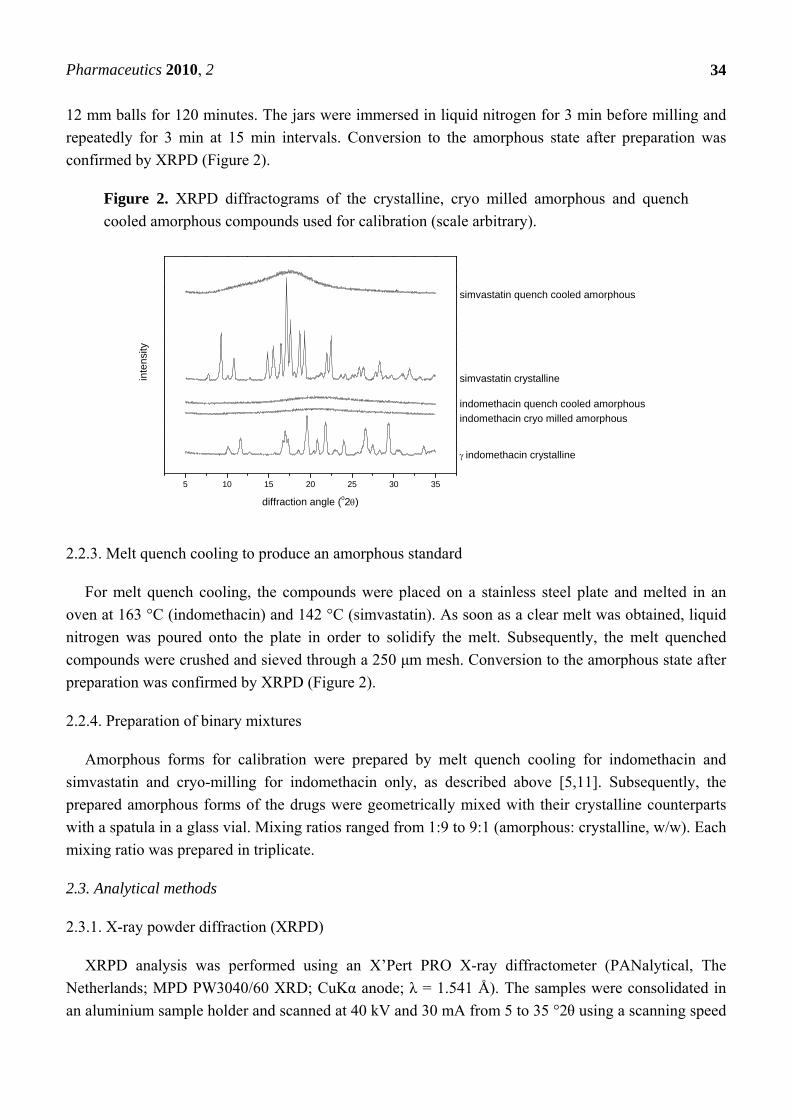
12 mm balls for 120 minutes. The jars were immersed in liquid nitrogen for 3 min before milling and
repeatedly for 3 min at 15 min intervals. Conversion to the amorphous state after preparation was
confirmed by XRPD (Figure 2).
Figure 2. XRPD diffractograms of the crystalline, cryo milled amorphous and quench
cooled amorphous compounds used for calibration (scale arbitrary).
5 10 15 20 25 30 35
inte
nsi
ty
diffraction angle (o2)
indomethacin crystalline
indomethacin cryo milled amorphous
indomethacin quench cooled amorphous
simvastatin crystalline
simvastatin quench cooled amorphous
2.2.3. Melt quench cooling to produce an amorphous standard
For melt quench cooling, the compounds were placed on a stainless steel plate and melted in an
oven at 163 °C (indomethacin) and 142 °C (simvastatin). As soon as a clear melt was obtained, liquid
nitrogen was poured onto the plate in order to solidify the melt. Subsequently, the melt quenched
compounds were crushed and sieved through a 250 μm mesh. Conversion to the amorphous state after
preparation was confirmed by XRPD (Figure 2).
2.2.4. Preparation of binary mixtures
Amorphous forms for calibration were prepared by melt quench cooling for indomethacin and
simvastatin and cryo-milling for indomethacin only, as described above [5,11]. Subsequently, the
prepared amorphous forms of the drugs were geometrically mixed with their crystalline counterparts
with a spatula in a glass vial. Mixing ratios ranged from 1:9 to 9:1 (amorphous: crystalline, w/w). Each
mixing ratio was prepared in triplicate.
2.3. Analytical methods
2.3.1. X-ray powder diffraction (XRPD)
XRPD analysis was performed using an X’Pert PRO X-ray diffractometer (PANalytical, The
Netherlands; MPD PW3040/60 XRD; CuKα anode; λ = 1.541 Å). The samples were consolidated in
an aluminium sample holder and scanned at 40 kV and 30 mA from 5 to 35 °2θ using a scanning speed

Pharmaceutics 2010, 2
35
of 0.1285 °2θ /min and a step size of 0.0084 °2θ. The diffractograms were collected using X’Pert High
Score software (version 2.2.0) and plotted using OriginPro 7.0 (OriginLab Corporation, USA).
2.3.2. Differential scanning calorimetry (DSC)
DSC thermograms (DSC Q100 V8.2 Build 268, TA Instruments, USA) were obtained under a
nitrogen gas flow of 50 mL/min. Calibration of the DSC instrument was carried out using indium (for
temperature and enthalpy) and sapphire (for heat capacity) as standards. Sample powders
(approximately 3 mg, accurately weighed) were crimped in aluminium pans with sealed lids and
heated at a scanning rate of 20 K/min from -10 to 200 °C. The heat capacity change (∆cp) at the glass
transition temperature Tg (midpoint) was determined using TA Universal Analysis 2000 software
(TA Instruments, USA).
2.3.3. FT-Raman-spectroscopy
FT-Raman spectra were obtained using a Bruker IFS 55 FT-Raman interferometer fitted with a
Bruker FRA 106 S FT-Raman accessory (Bruker Optik GmbH, Germany). The instrument used a
D418-T Ge diode detector and a Coherent Compass 1064-500N laser (Coherent Inc., USA). Analysis
was carried out at room temperature with the wavelength of the Nd:YAG laser set at 1064 nm and the
laser power set at 120 mW. Samples were packed in glass sample holders and spectra were collected at
a resolution of 4 cm-1. The number of scans obtained per spectrum was 32. Sulphur was used as
reference standard to monitor wave number accuracy. Data were collected using OPUSTM-software
(Bruker Optik GmbH, Germany).
2.3.4. HPLC
The HPLC system used consisted of a Shimadzu LC-10ATvp pump and a Shimadzu SPD-10Avp
UV-vis detector (Shimadzu Corp., Kyoto, Japan) for both compounds. The analysis for indomethacin
was performed following the method reported by Hess et al. [19] using a Phenosphere-NEXT 5μ C18
column (150mm x 4.6mm; Phenomenex, USA). The mobile phase consisted of 75% methanol and
25% of 0.2% phosphoric acid and was used at a flow rate of 1 mL/min. The injection volume was
100 μL. The UV-vis detector was set at 320 nm. The peak area correlated linearly with concentration
in the range of 0.0125-0.25 mg/mL (r2 = 0.997), hence measurements were undertaken for drug
concentrations of 0.025 mg/mL. The retention time of indomethacin was 7.1 min. For simvastatin the
mobile phase consisted of 65 v/v% Acetonitrile/ 35 v/v% Milli-Q-water. The flow rate was 1 mL/min.
The method applied was adapted from Meng et al. [20]. The UV-vis detector was set at 238 nm. The
retention time for simvastatin was 12.2 min. Linearity of the standard curve was given in the range of
0.0012 mg/mL-0.024 mg/mL (r2 = 0.997), hence measurements were undertaken for drug
concentrations of 0.012 mg/mL. All measurements were performed in triplicate.
2.3.5. Multivariate Analysis
Principal component analysis (PCA) and partial least squares regression (PLS) (SIMCA-P 11
software, Umetrics AB, Sweden) were used to analyse the XRPD diffractograms and the Raman
Pharmaceutics 2010, 2
36
spectra. Whole diffractograms (ranging from 5 to 35 o2θ) and spectra (ranging from 500 to 3500 cm-1)
were used for the analysis. Cross validation was used to determine the optimal number of principal
components (PCs) as well as PLS factors for the models, with Q2 (goodness of fit) as the criterion for
the number of components/ factors used and R2 being the correlation coefficient. For the PLS models,
cross validation was also used for the validation of the prediction and the root mean square error of
estimation (RMSEE) was used as the criterion for the model performance. For Raman spectroscopic
data, standard normal variate transformation (SNV) was applied as a preprocessing method and the
spectra were mean centered prior to PCA and PLS modeling. XRPD data were neither preprocessed
nor scaled prior to PCA modeling. PLS models for the XRPD data were computed using orthogonal
signal correction (OSC) and mean centering as preprocessing and scaling methods.
2.3.6. Statistical Analysis
One way analysis of variance (ANOVA) was performed with Minitab software (Minitab, State
College PA, USA).
2.3.7. Cambridge Structural Database (CSD)
Molecular structures were obtained from the CSD [21] using Mercury 2.2 software (refcodes
INDMET and EJEQUAL, respectively).
3. Results and Discussion
3.1. Chemical stability
Using HPLC, it could be shown for both compounds that chemical degradation even under the
harshest milling conditions applied (600 mg of compound milled for 60 min with sixty 4 mm balls at
25 Hz) was less than 3% (w/w). Previous studies also showed that chemical degradation was
negligible for these compounds when subjected to quench cooling and cryo milling [5,11]. Therefore,
it could be concluded that chemical degradation did not significantly affect the results obtained using
the different analytical techniques and that the results obtained are due to reduction in crystallinity
(milling induced crystalline disorder and/ or true amorphousness) and particle size reduction.
3.2. Influence of the calibration standard on the quantification outcome for process induced disorder
As shown in other studies, multivariate analysis is a powerful tool that can be used in form of PCA
to characterize the solid state qualitatively [5,22]. In this study, PCA has been utilized in order to find
a suitable calibration standard for the amorphous compounds. For this purpose, melt quench cooled
amorphous/ crystalline and cryo milled amorphous/ crystalline binary mixtures of indomethacin were
compared.
3.2.1. PCA for Raman spectra of the binary mixtures of indomethacin
The Raman spectra of the two differently prepared binary mixture sets and the unprocessed
(crystalline) and milled samples were subjected to PCA.

Pharmaceutics 2010, 2
37
Three PCs explained 97.6% of the variance in the data. The score plot showed that Raman
spectroscopy combined with PCA differentiates between cryo milled amorphous/ crystalline and
quench cooled amorphous/ crystalline binary mixtures as well as the crystalline and milled samples
(Figure 3). The milled samples cluster around the unprocessed crystalline samples and show a similar
distance to either of the binary mixtures (cryo milled amorphous/ crystalline and quench cooled
amorphous/ crystalline).
Figure 3. PCA scores plot of the Raman spectroscopic data of pure (unprocessed
crystalline and ball milled) indomethacin forms and binary crystalline/ amorphous
mixtures at different ratios. Displayed are the scores of cold room milled samples and
unprocessed (crystalline) samples (hidden within the scores of the cold room milled
samples) and quench cooled amorphous/ crystalline binary mixtures and cryo milled
amorphous/crystalline binary mixtures. The PCs explain 94.1%, 1.9% and 1.6% of the
spectral variance, respectively.
-30-20-1001020
-4
-2
0
2
4
-4
-2
0
2
4
cryo milledmilledcrystallinequench cooled
PC
2 (1
.9%
)
PC1 (94.1%)
PC3 (1.6%)
3 PC
R2=0.977
Q2=0.976
100% quench cooled
100% cryo milled
3.2.2. PCA for XRPD data of the binary mixtures of indomethacin
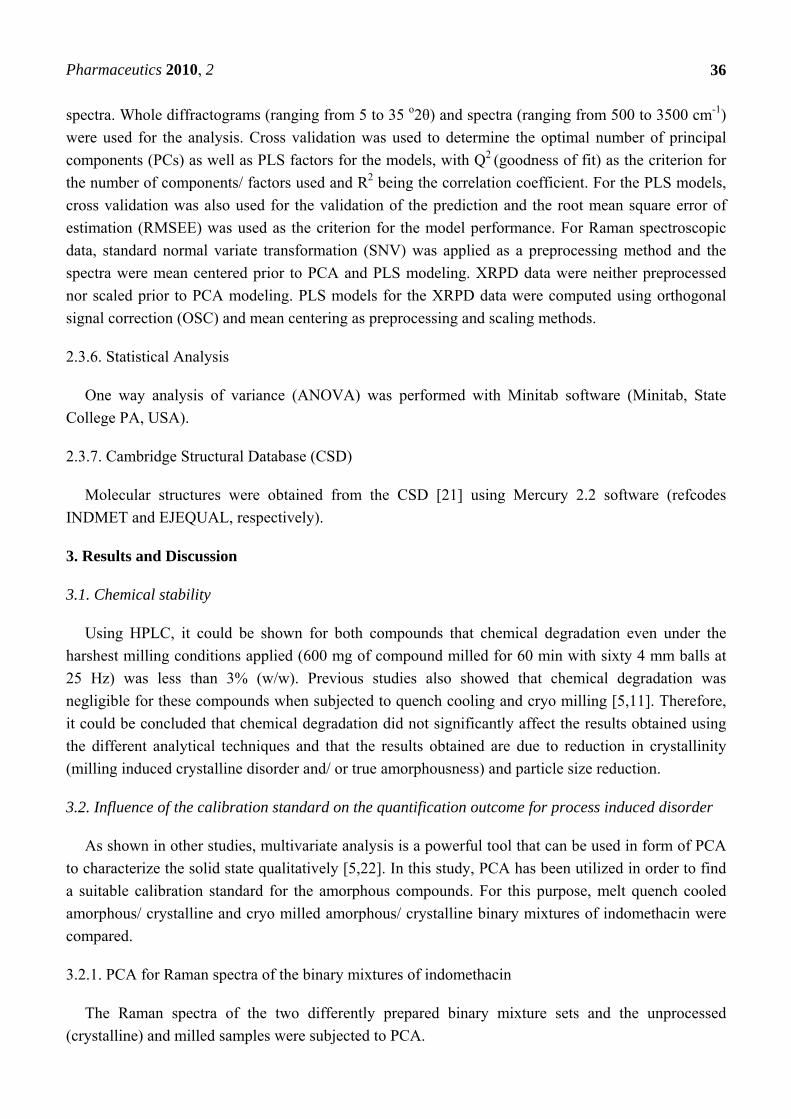
The diffractograms of the same indomethacin samples were also analysed using PCA, however,
there was no clear distinction between cryo-milled/ crystalline and quench cooled/ crystalline binary
mixtures. In the PCA scores plot the milled samples are placed in between the binary mixtures and
again show a similar distance to either of the binary mixtures. Two PCs explained 93.7% of the
variance in the data (Figure 4). No form α indomethacin could be detected by XRPD during the course
of the experiments.
Overall, PCA revealed that neither of the binary mixture types (prepared using either melt quench
cooled amorphous or cryo milled amorphous indomethacin) mimicked the process induced crystalline
disorder of the cold room milling more than the other. Although cold room and cryo milling are both
Pharmaceutics 2010, 2
38
milling processes, they differ significantly as cold room milling is likely to favor recrystallisation,
whereas cryo milling favors amorphisation [4]. Therefore melt quench cooling was chosen as
preparative method to prepare an amorphous standard for the calibration as it has been shown earlier to
be more stable than the cryo milled amorphous form [11,12]. Since the stability of the milled samples
has to be taken into consideration as well, storing times after sample preparation have been kept to a
minimum and all samples were measured by all three methods within 24 hours after preparation,
starting with DSC and followed by XRPD and Raman spectroscopy.
Figure 4. PCA scores plot of the XRPD data of pure indomethacin forms and binary
crystalline/ amorphous mixtures at different ratios. The pure indomethacin samples
(unprocessed crystalline and ball milled) are located between the binary cryo milled
amorphous/ crystalline and quench cooled amorphous/ crystalline mixtures. The PCs
explain 88.4% and 5.3% of the diffractive variance, respectively.
milledcrystallinecryo milled quench cooled
PC
2 (5
.3%
)
PC1 (88.4%)
2 PC
R2=0.937
Q2=0.934
100% quench cooled
100% cryo milled
crystallinity increases
3.2.3. Thermal analysis of quench cooled amorphous and cryo milled amorphous indomethacin
Thermodynamic differences in the amorphous state could be confirmed by DSC, as the
thermograms of the quench cooled amorphous and cryo milled amorphous indomethacin were distinct
from each other (Figure 5).
The glass transition temperature (Tg) could be detected at 43.2 oC (+1.1) for quench cooled
indomethacin and at 39.7 oC (+2.9) for cryo milled indomethacin, which was significantly lower
(α = 0.05, P = 0.004; n = 3). No significant difference could be detected for the heat capacity change
∆cp at the glass transition though, with ∆cp = 0.45 J/goC (+0.06) for quench cooled indomethacin and
∆cp = 0.49 J/goC (+0.11) for cryo milled indomethacin (α = 0.05, P = 0.337; n = 3).
The thermograms of quench cooled and cryo milled indomethacin also showed differences in the
exothermic recrystallisation events before melting and the endothermic melting event itself. Whereas
quench cooled indomethacin showed only one exothermic event (the recrystallisation peak), cryo
milled indomethacin showed first an exothermic event (at a lower recrystallisation temperature)
Pharmaceutics 2010, 2
39
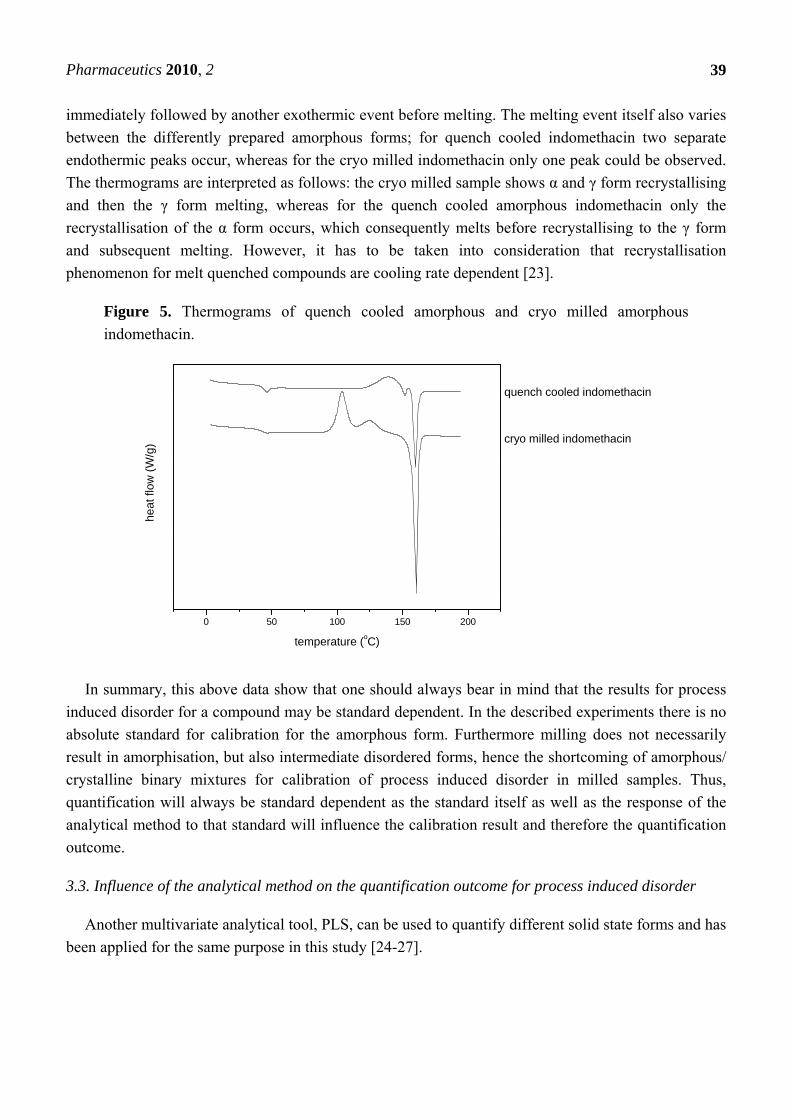
immediately followed by another exothermic event before melting. The melting event itself also varies
between the differently prepared amorphous forms; for quench cooled indomethacin two separate
endothermic peaks occur, whereas for the cryo milled indomethacin only one peak could be observed.
The thermograms are interpreted as follows: the cryo milled sample shows α and γ form recrystallising
and then the γ form melting, whereas for the quench cooled amorphous indomethacin only the
recrystallisation of the α form occurs, which consequently melts before recrystallising to the γ form
and subsequent melting. However, it has to be taken into consideration that recrystallisation
phenomenon for melt quenched compounds are cooling rate dependent [23].
Figure 5. Thermograms of quench cooled amorphous and cryo milled amorphous
indomethacin.
0 50 100 150 200
heat
flow
(W
/g)
temperature (oC)
cryo milled indomethacin
quench cooled indomethacin
In summary, this above data show that one should always bear in mind that the results for process
induced disorder for a compound may be standard dependent. In the described experiments there is no
absolute standard for calibration for the amorphous form. Furthermore milling does not necessarily
result in amorphisation, but also intermediate disordered forms, hence the shortcoming of amorphous/
crystalline binary mixtures for calibration of process induced disorder in milled samples. Thus,
quantification will always be standard dependent as the standard itself as well as the response of the
analytical method to that standard will influence the calibration result and therefore the quantification
outcome.
3.3. Influence of the analytical method on the quantification outcome for process induced disorder
Another multivariate analytical tool, PLS, can be used to quantify different solid state forms and has
been applied for the same purpose in this study [24-27].
Pharmaceutics 2010, 2
40
3.3.1. PLS modeling of Raman spectroscopic data of quench cooled amorphous/ crystalline binary
mixtures of indomethacin and simvastatin
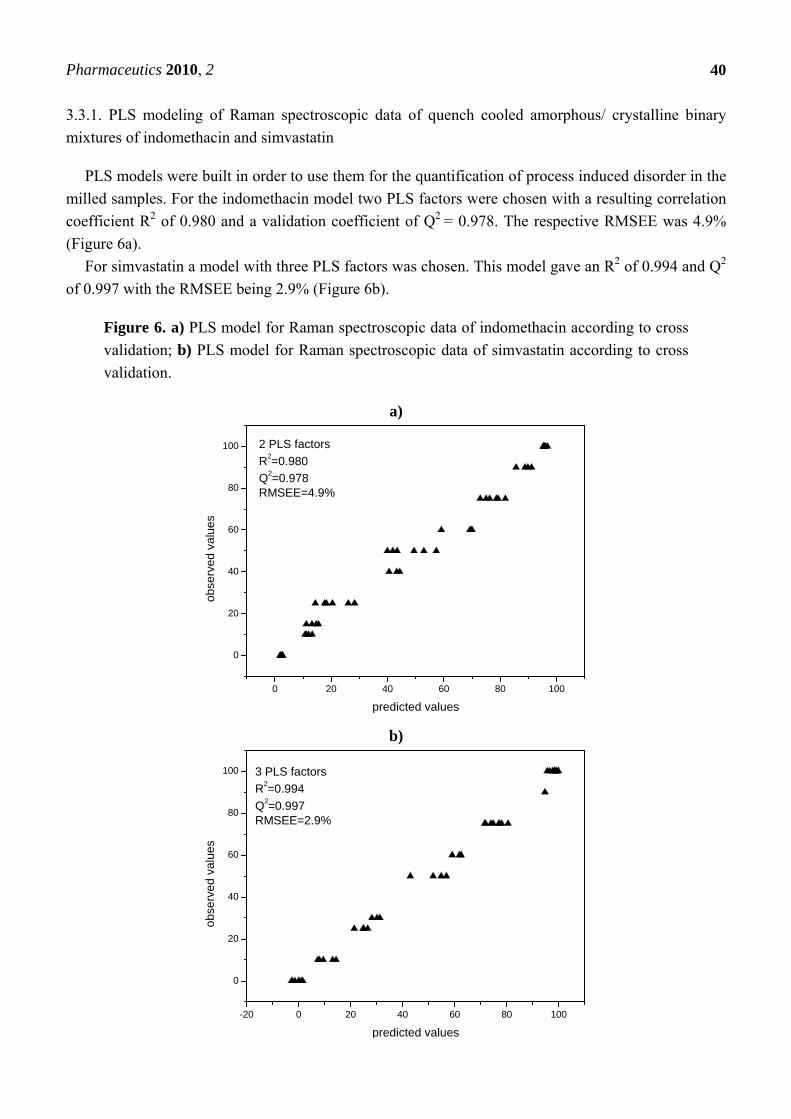
PLS models were built in order to use them for the quantification of process induced disorder in the
milled samples. For the indomethacin model two PLS factors were chosen with a resulting correlation
coefficient R2 of 0.980 and a validation coefficient of Q2 = 0.978. The respective RMSEE was 4.9%
(Figure 6a).
For simvastatin a model with three PLS factors was chosen. This model gave an R2 of 0.994 and Q2
of 0.997 with the RMSEE being 2.9% (Figure 6b).
Figure 6. a) PLS model for Raman spectroscopic data of indomethacin according to cross
validation; b) PLS model for Raman spectroscopic data of simvastatin according to cross
validation.
a)
0 20 40 60 80 100
0
20
40
60
80
100
obse
rved
val
ues
predicted values
2 PLS factors
R2=0.980
Q2=0.978RMSEE=4.9%
b)
-20 0 20 40 60 80 100
0
20
40
60
80
100
obse
rved
val
ues
predicted values
3 PLS factors
R2=0.994
Q2=0.997RMSEE=2.9%
Pharmaceutics 2010, 2
41
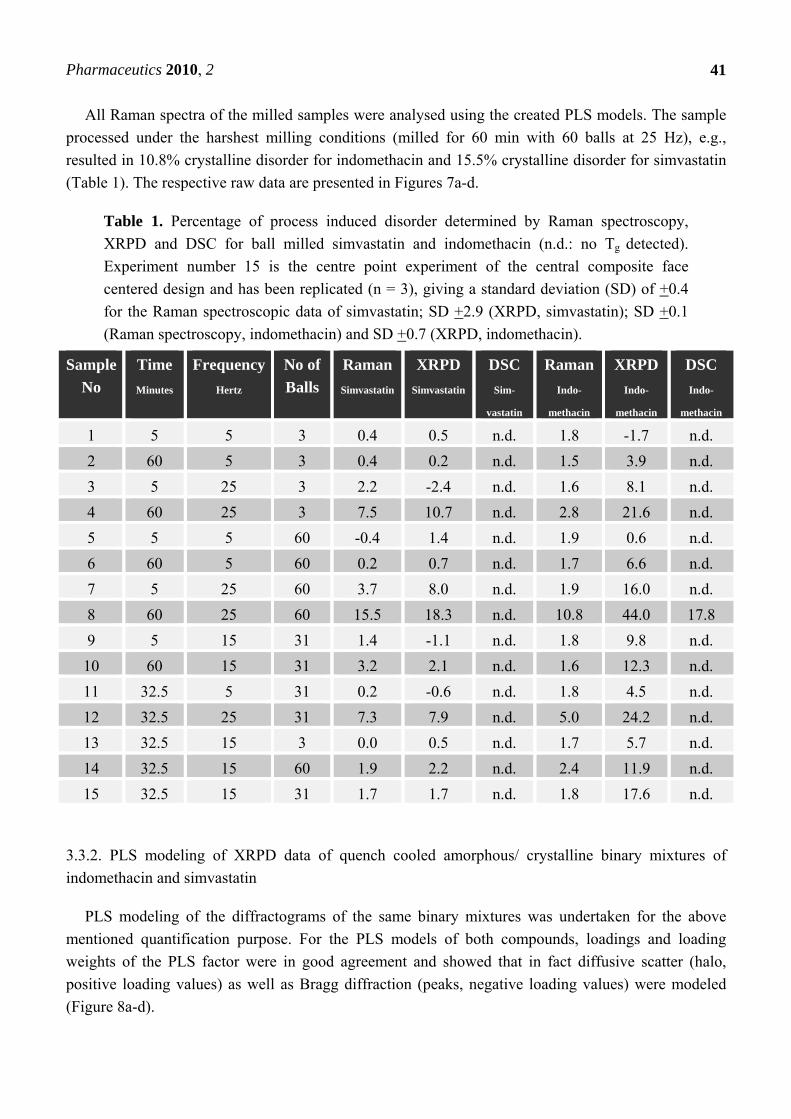
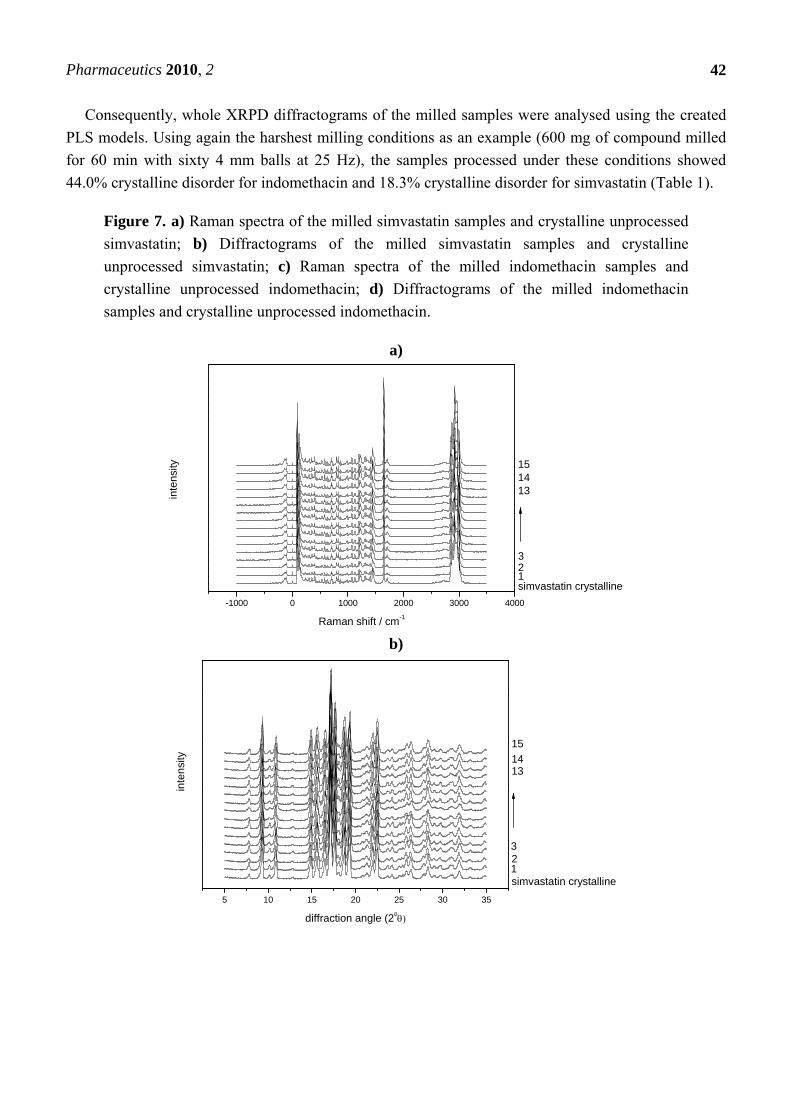
All Raman spectra of the milled samples were analysed using the created PLS models. The sample
processed under the harshest milling conditions (milled for 60 min with 60 balls at 25 Hz), e.g.,
resulted in 10.8% crystalline disorder for indomethacin and 15.5% crystalline disorder for simvastatin
(Table 1). The respective raw data are presented in Figures 7a-d.
Table 1. Percentage of process induced disorder determined by Raman spectroscopy,
XRPD and DSC for ball milled simvastatin and indomethacin (n.d.: no Tg detected).
Experiment number 15 is the centre point experiment of the central composite face
centered design and has been replicated (n = 3), giving a standard deviation (SD) of +0.4
for the Raman spectroscopic data of simvastatin; SD +2.9 (XRPD, simvastatin); SD +0.1
(Raman spectroscopy, indomethacin) and SD +0.7 (XRPD, indomethacin).
Sample
No
Time
Minutes
Frequency
Hertz
No of
Balls
Raman
Simvastatin
XRPD
Simvastatin
DSC
Sim-
vastatin
Raman
Indo-
methacin
XRPD
Indo-
methacin
DSC
Indo-
methacin
1 5 5 3 0.4 0.5 n.d. 1.8 -1.7 n.d.
2 60 5 3 0.4 0.2 n.d. 1.5 3.9 n.d.
3 5 25 3 2.2 -2.4 n.d. 1.6 8.1 n.d.
4 60 25 3 7.5 10.7 n.d. 2.8 21.6 n.d.
5 5 5 60 -0.4 1.4 n.d. 1.9 0.6 n.d.
6 60 5 60 0.2 0.7 n.d. 1.7 6.6 n.d.
7 5 25 60 3.7 8.0 n.d. 1.9 16.0 n.d.
8 60 25 60 15.5 18.3 n.d. 10.8 44.0 17.8
9 5 15 31 1.4 -1.1 n.d. 1.8 9.8 n.d.
10 60 15 31 3.2 2.1 n.d. 1.6 12.3 n.d.
11 32.5 5 31 0.2 -0.6 n.d. 1.8 4.5 n.d.
12 32.5 25 31 7.3 7.9 n.d. 5.0 24.2 n.d.
13 32.5 15 3 0.0 0.5 n.d. 1.7 5.7 n.d.
14 32.5 15 60 1.9 2.2 n.d. 2.4 11.9 n.d.
15 32.5 15 31 1.7 1.7 n.d. 1.8 17.6 n.d.
3.3.2. PLS modeling of XRPD data of quench cooled amorphous/ crystalline binary mixtures of
indomethacin and simvastatin
PLS modeling of the diffractograms of the same binary mixtures was undertaken for the above
mentioned quantification purpose. For the PLS models of both compounds, loadings and loading
weights of the PLS factor were in good agreement and showed that in fact diffusive scatter (halo,
positive loading values) as well as Bragg diffraction (peaks, negative loading values) were modeled
(Figure 8a-d).
Pharmaceutics 2010, 2
42
Consequently, whole XRPD diffractograms of the milled samples were analysed using the created
PLS models. Using again the harshest milling conditions as an example (600 mg of compound milled
for 60 min with sixty 4 mm balls at 25 Hz), the samples processed under these conditions showed
44.0% crystalline disorder for indomethacin and 18.3% crystalline disorder for simvastatin (Table 1).
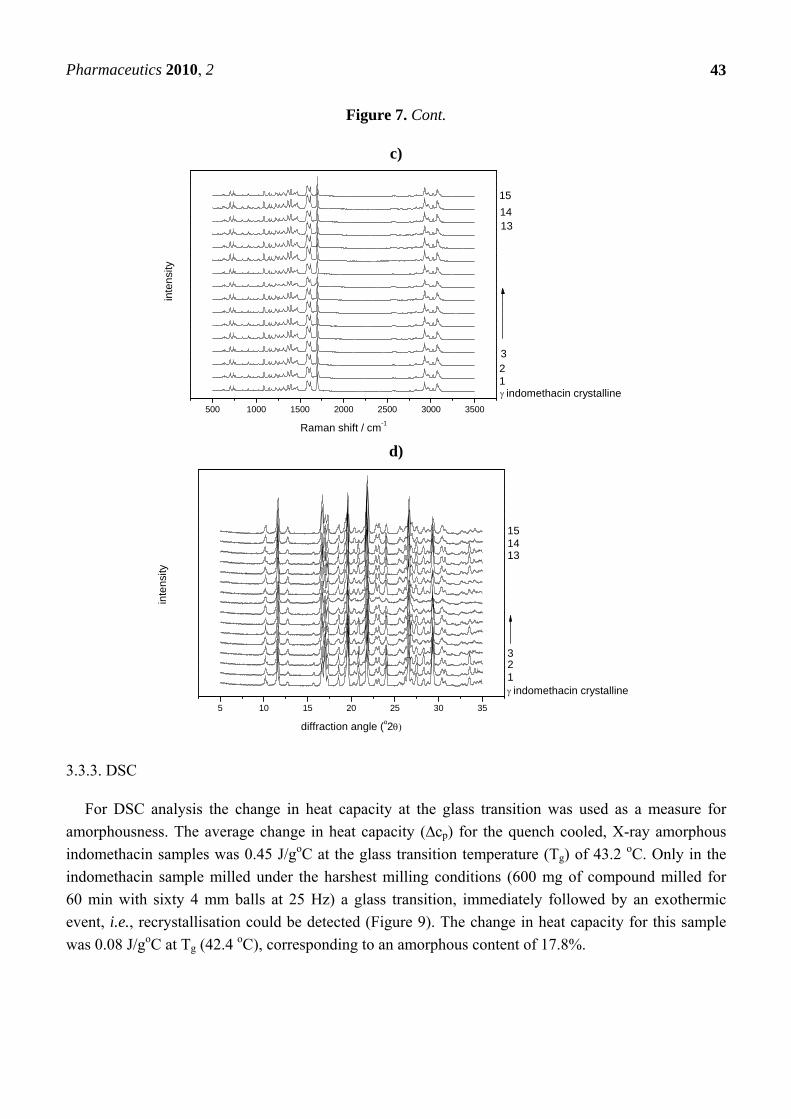
Figure 7. a) Raman spectra of the milled simvastatin samples and crystalline unprocessed
simvastatin; b) Diffractograms of the milled simvastatin samples and crystalline
unprocessed simvastatin; c) Raman spectra of the milled indomethacin samples and
crystalline unprocessed indomethacin; d) Diffractograms of the milled indomethacin
samples and crystalline unprocessed indomethacin.
a)
-1000 0 1000 2000 3000 4000
inte
nsity
Raman shift / cm-1
simvastatin crystalline 1 2 3
15 14 13
b)
5 10 15 20 25 30 35
inte
nsi
ty
diffraction angle (2o
simvastatin crystalline 1 2 3
15
14 13
Pharmaceutics 2010, 2
43
Figure 7. Cont.
c)
500 1000 1500 2000 2500 3000 3500
inte
nsi
ty
Raman shift / cm-1
indomethacin crystalline 1 2 3
15
14 13
d)
5 10 15 20 25 30 35
inte
nsity
diffraction angle (o2
indomethacin crystalline 1 2 3
15 14 13
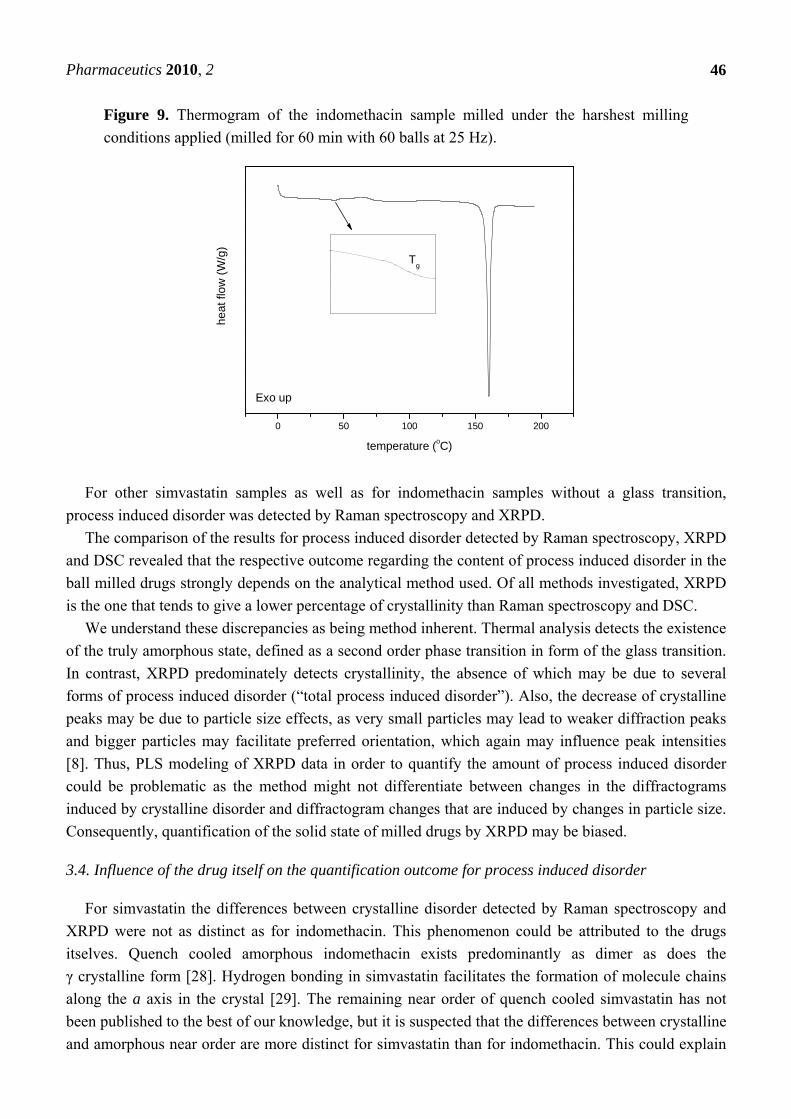
3.3.3. DSC
For DSC analysis the change in heat capacity at the glass transition was used as a measure for
amorphousness. The average change in heat capacity (∆cp) for the quench cooled, X-ray amorphous
indomethacin samples was 0.45 J/goC at the glass transition temperature (Tg) of 43.2 oC. Only in the
indomethacin sample milled under the harshest milling conditions (600 mg of compound milled for
60 min with sixty 4 mm balls at 25 Hz) a glass transition, immediately followed by an exothermic
event, i.e., recrystallisation could be detected (Figure 9). The change in heat capacity for this sample
was 0.08 J/goC at Tg (42.4 oC), corresponding to an amorphous content of 17.8%.
Pharmaceutics 2010, 2
44
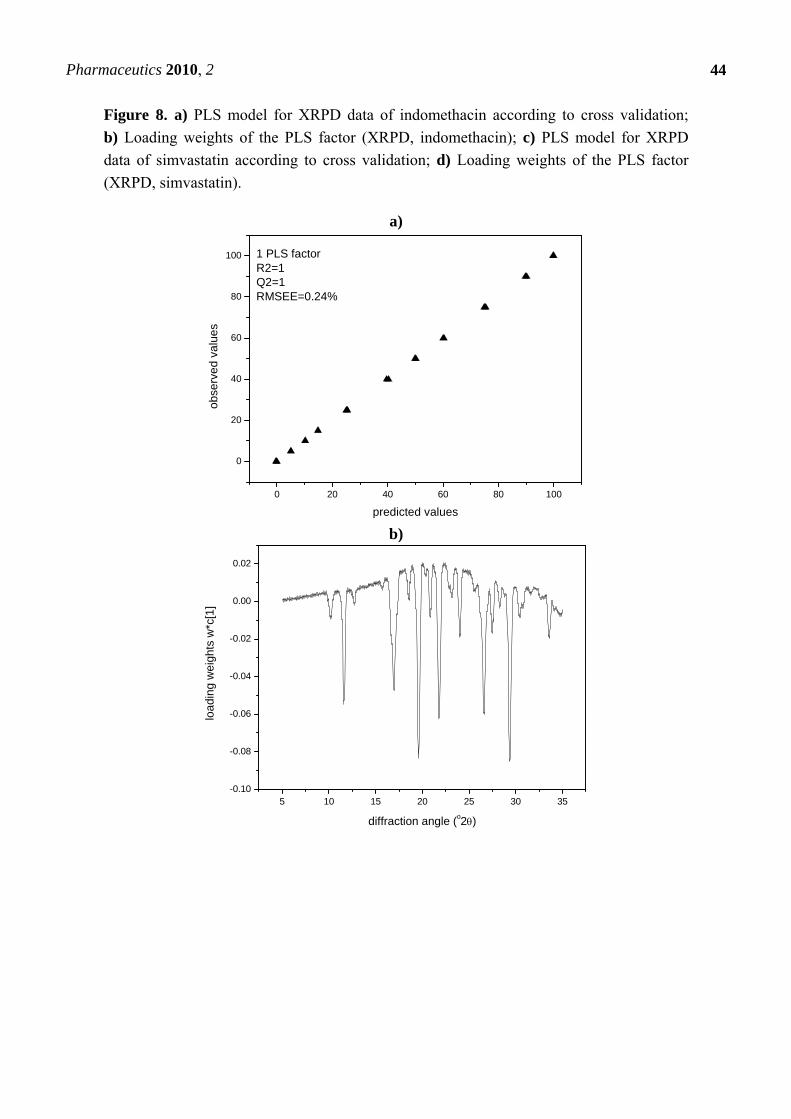
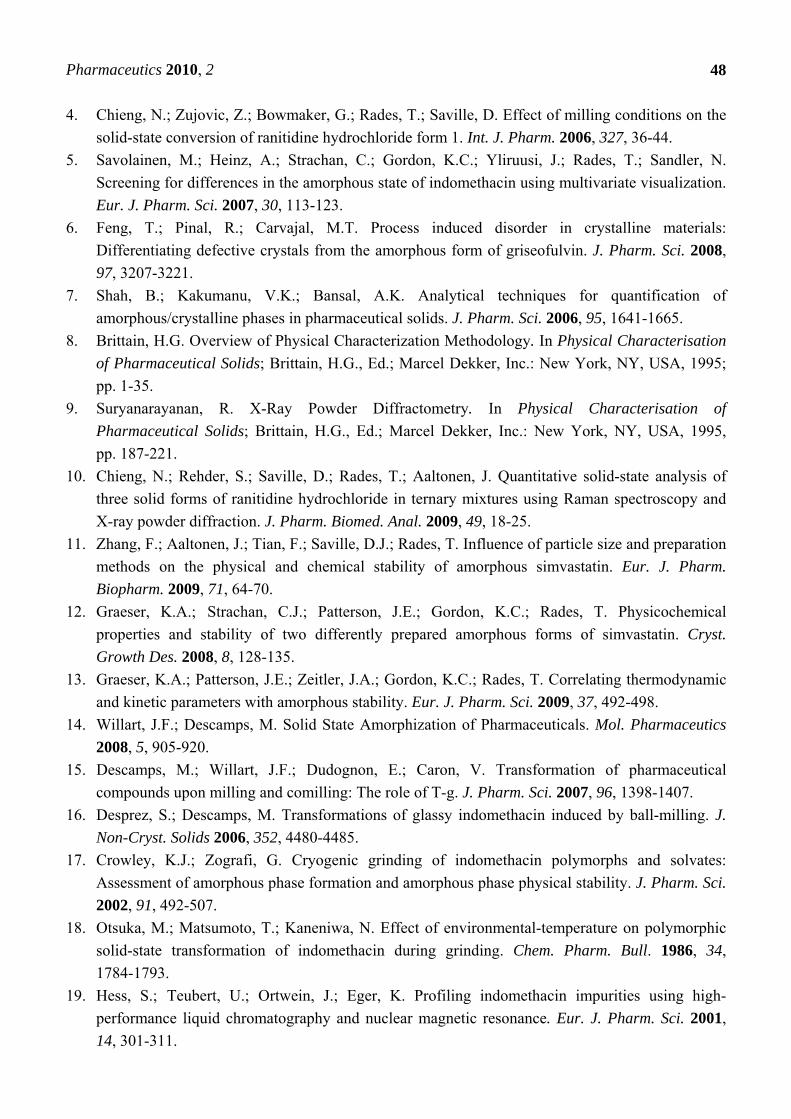
Figure 8. a) PLS model for XRPD data of indomethacin according to cross validation;
b) Loading weights of the PLS factor (XRPD, indomethacin); c) PLS model for XRPD
data of simvastatin according to cross validation; d) Loading weights of the PLS factor
(XRPD, simvastatin).
a)
0 20 40 60 80 100
0
20
40
60
80
100
obs
erv
ed
valu
es
predicted values
1 PLS factorR2=1Q2=1RMSEE=0.24%
b)
5 10 15 20 25 30 35-0.10
-0.08
-0.06
-0.04
-0.02
0.00
0.02
loa
din
g w
eig
hts
w*c
[1]
diffraction angle (o2)

Pharmaceutics 2010, 2
45
Figure 8. Cont.
c)
0 20 40 60 80 100 120
0
20
40
60
80
100
obs
erve
d va
lue
s
predicted values
1 PLS factor
R2=0.999
Q2=0.998RMSEE=1.33%
d)
5 10 15 20 25 30 35
-0.12
-0.10
-0.08
-0.06
-0.04
-0.02
0.00
0.02
0.04
load
ing
wei
ghts
w*c
[1]
diffraction angle (o2)
For the quench cooled, X-ray amorphous simvastatin ∆cp was 0.49 J/goC (+0.01) at a Tg of 30.3 oC
(+0.9). For the entire set of milled simvastatin samples no glass transition could be detected, indicating
that process induced changes in the ball milled samples did not lead to amorphisation. Only for the
sample milled under the harshest milling conditions (milled for 60 min with 60 balls at 25 Hz) an
exothermic recrystallisation event could be observed at 49.5 °C. Although no glass transition could be
detected for the milled simvastatin samples, the one recrystallisation event in the sample with the
harshest milling conditions can be interpreted as recrystallisation of a disordered form and therefore
points to some kind of crystalline disorder. This finding was confirmed by Raman spectroscopy and
XRPD (Table 1).
Pharmaceutics 2010, 2
46
Figure 9. Thermogram of the indomethacin sample milled under the harshest milling
conditions applied (milled for 60 min with 60 balls at 25 Hz).
0 50 100 150 200
he
at fl
ow
(W
/g)
temperature (oC)
Exo up
Tg
For other simvastatin samples as well as for indomethacin samples without a glass transition,
process induced disorder was detected by Raman spectroscopy and XRPD.
The comparison of the results for process induced disorder detected by Raman spectroscopy, XRPD
and DSC revealed that the respective outcome regarding the content of process induced disorder in the
ball milled drugs strongly depends on the analytical method used. Of all methods investigated, XRPD
is the one that tends to give a lower percentage of crystallinity than Raman spectroscopy and DSC.
We understand these discrepancies as being method inherent. Thermal analysis detects the existence
of the truly amorphous state, defined as a second order phase transition in form of the glass transition.
In contrast, XRPD predominately detects crystallinity, the absence of which may be due to several
forms of process induced disorder (“total process induced disorder”). Also, the decrease of crystalline
peaks may be due to particle size effects, as very small particles may lead to weaker diffraction peaks
and bigger particles may facilitate preferred orientation, which again may influence peak intensities
[8]. Thus, PLS modeling of XRPD data in order to quantify the amount of process induced disorder
could be problematic as the method might not differentiate between changes in the diffractograms
induced by crystalline disorder and diffractogram changes that are induced by changes in particle size.
Consequently, quantification of the solid state of milled drugs by XRPD may be biased.
3.4. Influence of the drug itself on the quantification outcome for process induced disorder
For simvastatin the differences between crystalline disorder detected by Raman spectroscopy and
XRPD were not as distinct as for indomethacin. This phenomenon could be attributed to the drugs
itselves. Quench cooled amorphous indomethacin exists predominantly as dimer as does the
γ crystalline form [28]. Hydrogen bonding in simvastatin facilitates the formation of molecule chains
along the a axis in the crystal [29]. The remaining near order of quench cooled simvastatin has not
been published to the best of our knowledge, but it is suspected that the differences between crystalline
and amorphous near order are more distinct for simvastatin than for indomethacin. This could explain

Pharmaceutics 2010, 2
47
the more consistent Raman and XRPD results for simvastatin, as Raman spectroscopy being a near
order analytical method might not easily pick up on disordered states, where the near order of
amorphous and crystalline form are very similar.
Taken together, our findings suggest the presence of different disordered states in the milling
process. On the basis of the different results obtained by the different analytical methods, existence of
pre-amorphous (without exhibition of a glass transition) and amorphous (with glass transition)
disordered states are assumed.
4. Conclusions
This study has compared three different techniques, namely XRPD, DSC and Raman spectroscopy,
with respect to the quantification of the content of processed induced crystalline disorder in a milling
process. Care must be taken when interpreting the results obtained with these three methods. Within
XRPD the assignment of changes in the diffractogram due to “total process induced disorder” (i.e.,
amorphous content and other forms of crystalline disorder) and particle size effects appears to be
problematic. However, XRPD is the method of choice for the detection of remaining crystallinity. For
the detection of the truly amorphous state, defined by a glass transition, DSC is the method of choice.
Raman spectroscopy combined with multivariate analysis detects and quantifies crystalline disorder
before the compound can be described as DSC amorphous as well as thereafter. However, Raman
spectroscopy as a molecular level technique is sensitive to the near order of solid materials and
therefore could ‘underestimate’ the degree of disorder if the material remains near range ordered to a
certain extent (i.e., exists as a dimer) in the amorphous state. Thus, for the quantification purpose of
milled drugs Raman spectroscopy combined with multivariate analysis appears to be advantageous for
drugs with significant differences in the near order of the crystalline and amorphous form as particle
size effects are not as apparent and the whole range of crystalline disorder is covered. However, to
understand the investigated system fully, all methods need to be used complementary.
Acknowledgements
We like to thank Damian Walls (Department of Geology, University of Otago) for help with the
XRPD measurements and Katharina Paulsen for help in data acquisition. The University of Otago is
acknowledged for providing a scholarship for U.Z. The Academy of Finland, Finnish Cultural
Foundation and Finnish Pharmaceutical Society are also acknowledged for funding (J.A.).
References and Notes
1. Fisher, E.S. Milling of Active Pharmaceutical Ingredients. In Encyclopedia of Pharmaceutical
Technology, 3rd ed.; Swarbrick, J., Ed.; informa healthcare: New York, NY, USA; London, UK,
2006; Vol. 4, pp. 2339-2351.
2. Noyes, A.A.; Whitney, W.R. The rate of solution of solid substances in their own solutions.
J. Am. Chem. Soc. 1897, 19, 930-934.
3. Date, A.A.; Patravale, V.B. Current strategies for engineering drug nanoparticles. Curr. Opin.
Colloid Interface Sci. 2004, 9, 222-235.
Pharmaceutics 2010, 2
48
4. Chieng, N.; Zujovic, Z.; Bowmaker, G.; Rades, T.; Saville, D. Effect of milling conditions on the
solid-state conversion of ranitidine hydrochloride form 1. Int. J. Pharm. 2006, 327, 36-44.
5. Savolainen, M.; Heinz, A.; Strachan, C.; Gordon, K.C.; Yliruusi, J.; Rades, T.; Sandler, N.
Screening for differences in the amorphous state of indomethacin using multivariate visualization.
Eur. J. Pharm. Sci. 2007, 30, 113-123.
6. Feng, T.; Pinal, R.; Carvajal, M.T. Process induced disorder in crystalline materials:
Differentiating defective crystals from the amorphous form of griseofulvin. J. Pharm. Sci. 2008,
97, 3207-3221.
7. Shah, B.; Kakumanu, V.K.; Bansal, A.K. Analytical techniques for quantification of
amorphous/crystalline phases in pharmaceutical solids. J. Pharm. Sci. 2006, 95, 1641-1665.
8. Brittain, H.G. Overview of Physical Characterization Methodology. In Physical Characterisation
of Pharmaceutical Solids; Brittain, H.G., Ed.; Marcel Dekker, Inc.: New York, NY, USA, 1995;
pp. 1-35.
9. Suryanarayanan, R. X-Ray Powder Diffractometry. In Physical Characterisation of
Pharmaceutical Solids; Brittain, H.G., Ed.; Marcel Dekker, Inc.: New York, NY, USA, 1995,
pp. 187-221.
10. Chieng, N.; Rehder, S.; Saville, D.; Rades, T.; Aaltonen, J. Quantitative solid-state analysis of
three solid forms of ranitidine hydrochloride in ternary mixtures using Raman spectroscopy and
X-ray powder diffraction. J. Pharm. Biomed. Anal. 2009, 49, 18-25.
11. Zhang, F.; Aaltonen, J.; Tian, F.; Saville, D.J.; Rades, T. Influence of particle size and preparation
methods on the physical and chemical stability of amorphous simvastatin. Eur. J. Pharm.
Biopharm. 2009, 71, 64-70.
12. Graeser, K.A.; Strachan, C.J.; Patterson, J.E.; Gordon, K.C.; Rades, T. Physicochemical
properties and stability of two differently prepared amorphous forms of simvastatin. Cryst.
Growth Des. 2008, 8, 128-135.
13. Graeser, K.A.; Patterson, J.E.; Zeitler, J.A.; Gordon, K.C.; Rades, T. Correlating thermodynamic
and kinetic parameters with amorphous stability. Eur. J. Pharm. Sci. 2009, 37, 492-498.
14. Willart, J.F.; Descamps, M. Solid State Amorphization of Pharmaceuticals. Mol. Pharmaceutics
2008, 5, 905-920.
15. Descamps, M.; Willart, J.F.; Dudognon, E.; Caron, V. Transformation of pharmaceutical
compounds upon milling and comilling: The role of T-g. J. Pharm. Sci. 2007, 96, 1398-1407.
16. Desprez, S.; Descamps, M. Transformations of glassy indomethacin induced by ball-milling. J.
Non-Cryst. Solids 2006, 352, 4480-4485.
17. Crowley, K.J.; Zografi, G. Cryogenic grinding of indomethacin polymorphs and solvates:
Assessment of amorphous phase formation and amorphous phase physical stability. J. Pharm. Sci.
2002, 91, 492-507.
18. Otsuka, M.; Matsumoto, T.; Kaneniwa, N. Effect of environmental-temperature on polymorphic
solid-state transformation of indomethacin during grinding. Chem. Pharm. Bull. 1986, 34,
1784-1793.
19. Hess, S.; Teubert, U.; Ortwein, J.; Eger, K. Profiling indomethacin impurities using high-
performance liquid chromatography and nuclear magnetic resonance. Eur. J. Pharm. Sci. 2001,
14, 301-311.
Pharmaceutics 2010, 2
49
20. Meng, J.; Zheng, L.Y. Application of mixture experimental design to simvastatin apparent
solubility predictions in the microemulsifion formed by self-microemulsifying. Drug Dev. Ind.
Pharm. 2007, 33, 927-931.
21. Allen, F.H. The Cambridge Structural Database: a quarter of a million crystal structures and
rising. Acta Crystallogr., Sect. B: Struct. Sci. 2002, 58, 380-388.
22. Aaltonen, J.; Rantanen, J.; Siiria, S.; Karjalainen, M.; Jorgensen, A.; Laitinen, N.; Savolainen, M.;
Seitavuopio, P.; Louhi-Kultanen, M.; Yliruusi, J. Polymorph screening using near-infrared
spectroscopy. Anal. Chem. 2003, 75, 5267-5273.
23. Qi, S.; Avalle, P.; Saklatvala, R.; Craig, D.Q.M. An investigation into the effects of thermal
history on the crystallisation behaviour of amorphous paracetamol. Eur. J. Pharm. Biopharm.
2008, 69, 364-371.
24. Moore, M.D.; Cogdill, R.P.; Wildfong, P.L.D. Evaluation of chemometric algorithms in
quantitative X-ray powder diffraction (XRPD) of intact multi-component consolidated samples.
J. Pharm. Biomed. Anal. 2009, 49, 619-626.
25. Artursson, T.; Hagman, A.; Bjork, S.; Trygg, J.; Wold, S.; Jacobsson, S.P. Study of preprocessing
methods for the determination of crystalline phases in binary mixtures of drug substances by
X-ray powder diffraction and multivariate calibration. Appl. Spectrosc. 2000, 54, 1222-1230.
26. Wold, S.; Antti, H.; Lindgren, F.; Ohman, J. Orthogonal signal correction of near-infrared spectra.
Chemom. Intell. Lab. Syst. 1998, 44, 175-185.
27. McGoverin, C.M.; Rades, T.; Gordon, K.C. Recent Pharmaceutical Applications of Raman and
Terahertz Spectroscopies. J. Pharm. Sci. 2008, 97, 4598-4621.
28. Strachan, C.J.; Rades, T.; Gordon, K.C. A theoretical and spectroscopic study of gamma-
crystalline and amorphous indometacin. J. Pharm. Pharmacol. 2007, 59, 261-269.
29. Cejka, J., Kratochvil, B., Cisarova, I., Jegorov, A. Simvastatin. Acta Crystallogr., Sect. C: Cryst.
Struct. Commun. 2003, 59, 428-430.
© 2010 by the authors; licensee Molecular Diversity Preservation International, Basel, Switzerland.
This article is an Open Access article distributed under the terms and conditions of the Creative
Commons Attribution license (http://creativecommons.org/licenses/by/3.0/).
Top Related