


Languages
Pages
Legal

8/3/2019 1204 Anglo Platinum
http://slidepdf.com/reader/full/1204-anglo-platinum 1/39
8/3/2019 1204 Anglo Platinum
http://slidepdf.com/reader/full/1204-anglo-platinum 2/39
2 Site Visit April 12th 2010
Agenda
• Welcome and Introduction
• Overview of Platinum industry and Anglo Platinum
– Neville Nicolau, CEO
• Presentation on Mogalakwena Mine
– Ted Muhajir, General Manager
• Question and Answer session
8/3/2019 1204 Anglo Platinum
http://slidepdf.com/reader/full/1204-anglo-platinum 3/39
3 Site Visit April 12th 2010
MARKET OVERVIEW
8/3/2019 1204 Anglo Platinum
http://slidepdf.com/reader/full/1204-anglo-platinum 4/39
4 Site Visit April 12th 2010
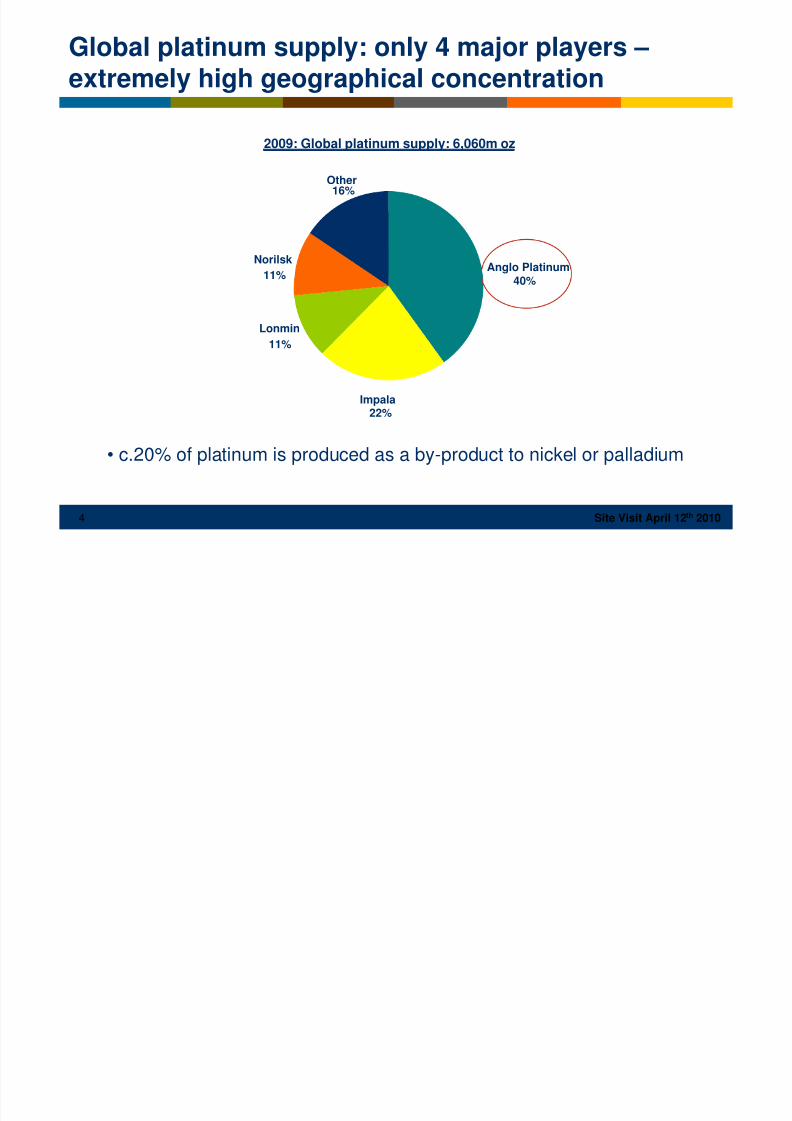
2009: Global platinum supply: 6,060m oz
Anglo Platinum40%
Impala22%
Lonmin
11%
Norilsk
11%
Other
16%
Global platinum supply: only 4 major players –extremely high geographical concentration
• c.20% of platinum is produced as a by-product to nickel or palladium
8/3/2019 1204 Anglo Platinum
http://slidepdf.com/reader/full/1204-anglo-platinum 5/39
5 Site Visit April 12th 2010
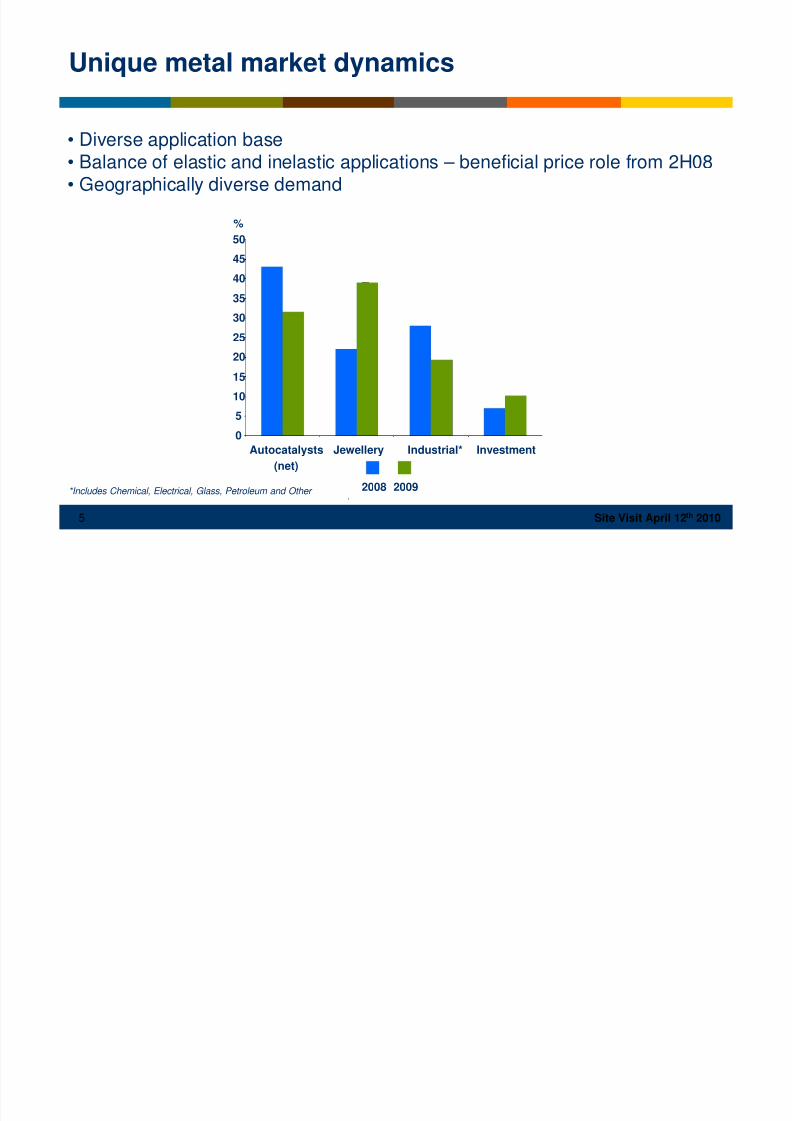
• Diverse application base• Balance of elastic and inelastic applications – beneficial price role from 2H08• Geographically diverse demand
*Includes Chemical, Electrical, Glass, Petroleum and Other
Unique metal market dynamics
0
5
10
15
20
25
30
35
40
45
50
Autocatalysts
(net)
Jewellery Industrial* Investment
%
2008 2009
8/3/2019 1204 Anglo Platinum
http://slidepdf.com/reader/full/1204-anglo-platinum 6/39
6 Site Visit April 12th 2010
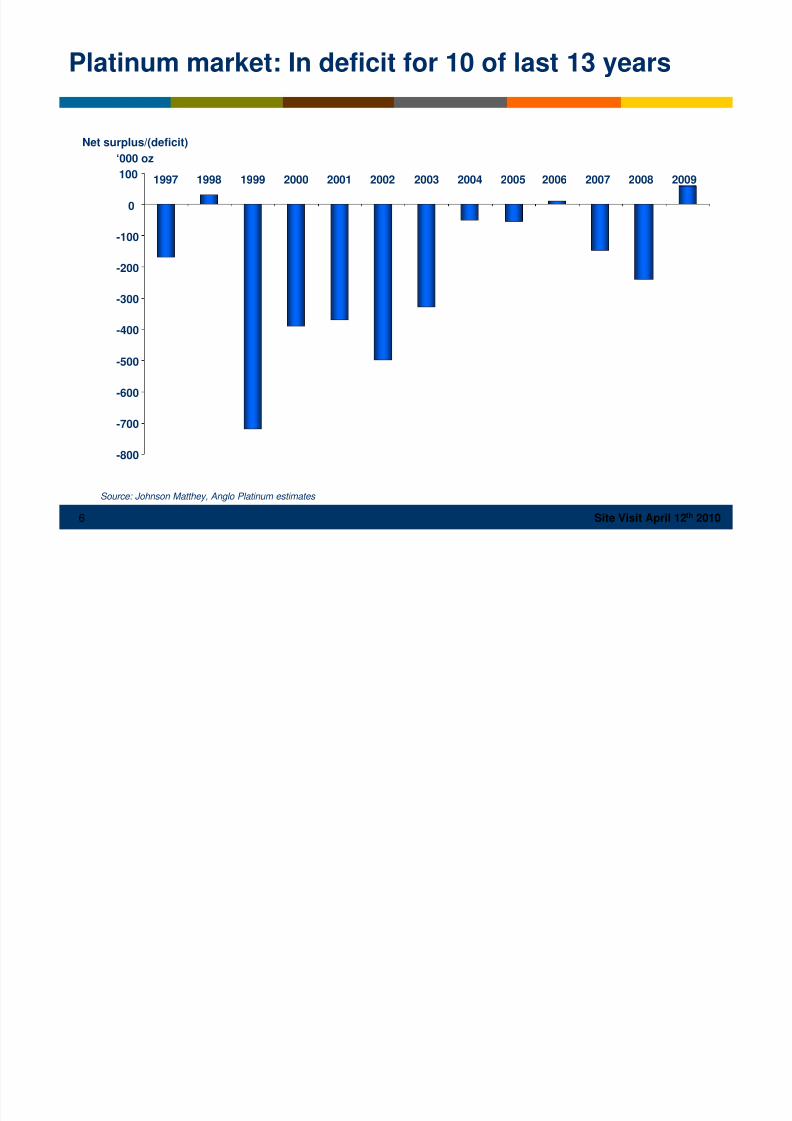
Platinum market: In deficit for 10 of last 13 years
-800
-700
-600
-500
-400
-300
-200
-100
0
100 1997 1998 1999 2000 2001 2002 2003 2004 2005 2006 2007 2008 2009
Net surplus/(deficit)
‘000 oz
Source: Johnson Matthey, Anglo Platinum estimates
8/3/2019 1204 Anglo Platinum
http://slidepdf.com/reader/full/1204-anglo-platinum 7/39
7 Site Visit April 12th 2010
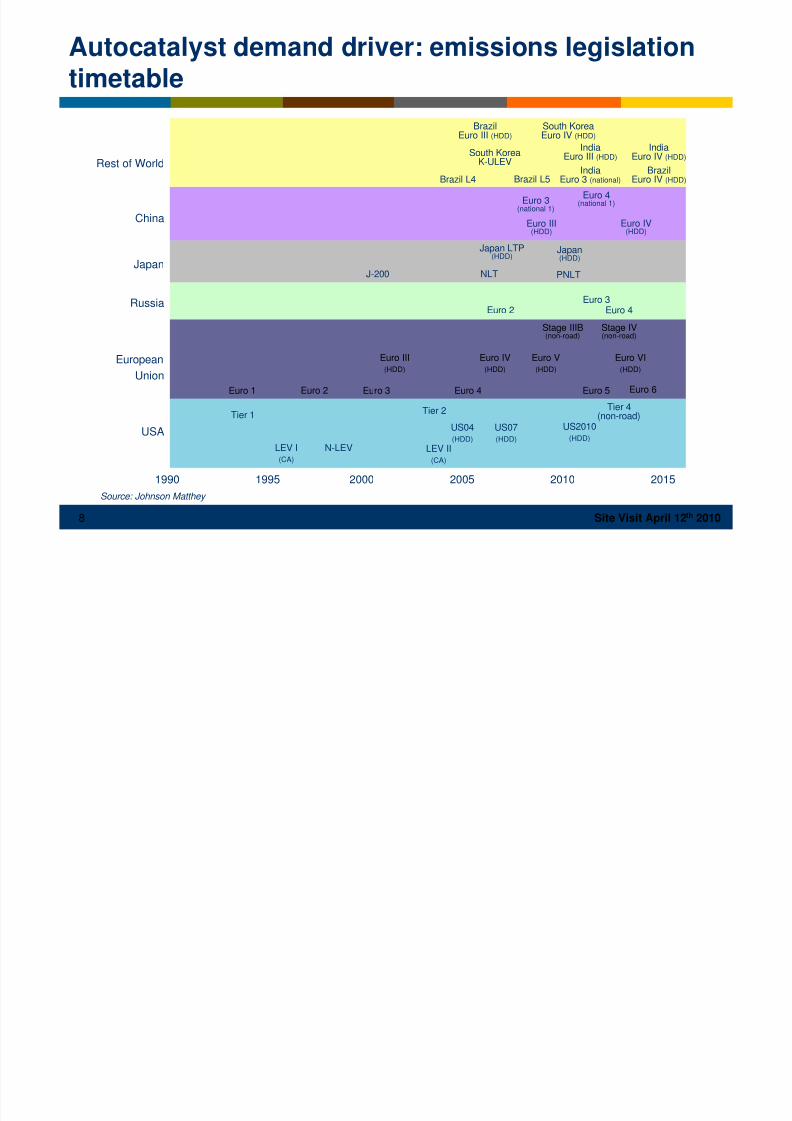
• Continued tighter legislation - Euro V 2011
• Continued increase in diesel car popularity – cost and emissions efficiency
• Early voluntary particulate filter fitment
• Heavy duty vehicle retrofitting - high loadings
• Vehicle volume growth in China
Autocatalyst demand driver: emissions legislation
8/3/2019 1204 Anglo Platinum
http://slidepdf.com/reader/full/1204-anglo-platinum 8/39
8 Site Visit April 12th 2010
Autocatalyst demand driver: emissions legislationtimetable
Source: Johnson Matthey
Rest of World
China
Russia
Japan
European
Union
USA
1990 1995 2000 2005 2010 2015
Tier 1
LEV I(CA)
N-LEV
Tier 2
LEV II(CA)
US04(HDD)
US07(HDD)
US2010(HDD)
Tier 4(non-road)
Euro 1 Euro 2 Euro 3 Euro 4 Euro 5 Euro 6
Euro III(HDD)
Euro IV(HDD)
Euro V(HDD)
Euro VI(HDD)
Stage IIIB(non-road)
Stage IV(non-road)
Euro 2Euro 3
Euro 4
J-200 NLT
Japan LTP(HDD)
Japan(HDD)
PNLT
Euro 3(national 1)
Euro III(HDD)
Euro 4(national 1)
Euro IV(HDD)
Brazil L4
South KoreaK-ULEV
BrazilEuro III (HDD)
South KoreaEuro IV (HDD)
IndiaEuro III (HDD)
IndiaEuro 3 (national)Brazil L5
IndiaEuro IV (HDD)
BrazilEuro IV (HDD)
8/3/2019 1204 Anglo Platinum
http://slidepdf.com/reader/full/1204-anglo-platinum 9/39
9 2009 Financial Results
2010
• Vehicle production forecast to increase to match sales
• Diesel share in Europe re-established through fleet purchases
2009
• Vehicle stock adjustments
exacerbated poor production
performance in mature markets
• Stimulus schemes boosted small
car sales favouring palladium
• Chinese vehicle production growth
exceptional
Autocatalyst demand rebuilding
8/3/2019 1204 Anglo Platinum
http://slidepdf.com/reader/full/1204-anglo-platinum 10/39
8/3/2019 1204 Anglo Platinum
http://slidepdf.com/reader/full/1204-anglo-platinum 11/39
11 Site Visit April 12th 2010
Platinum jewellery: unique source of price support
Shock-absorber effect at differing price levels
• Jewellery demand: price elastic vs. Industrial demand: price inelastic
• Demand balance results in lower price volatility
Price tension (upward pressure on price):
• Strong consumer demand
• Sophisticated marketing: PGI focus on niche and new markets
• High brand awareness
• Well-established bridal support
• Consumer has adjusted to higher prices over time
China is different….
• Platinum jewellery sales in China increased by over 600,000 ounces 1H09 vs. 1H08• Unique market characteristics
• Majority of purchases are self-purchase or non-bridal gift
• Over 70% metal-only pieces (< $300)
• Unsaturated market – retail store growth
8/3/2019 1204 Anglo Platinum
http://slidepdf.com/reader/full/1204-anglo-platinum 12/39
12 Site Visit April 12th 2010
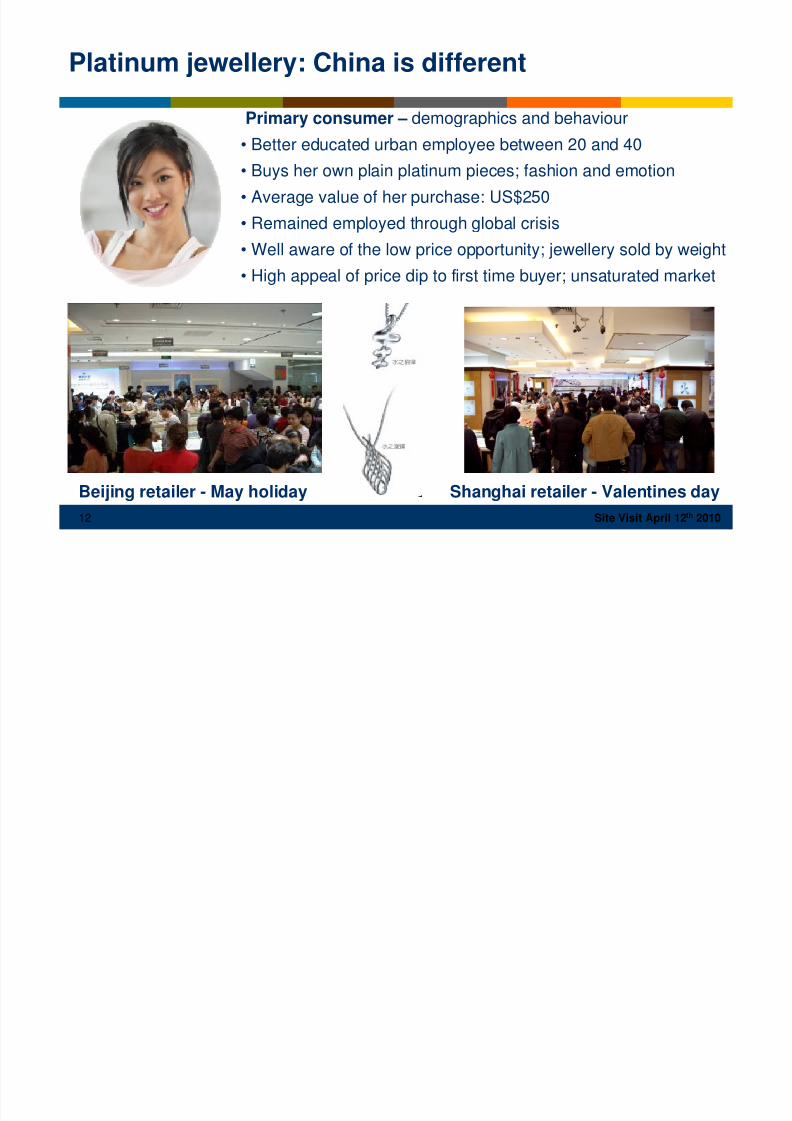
Platinum jewellery: China is different
Primary consumer – demographics and behaviour
• Better educated urban employee between 20 and 40
• Buys her own plain platinum pieces; fashion and emotion
• Average value of her purchase: US$250• Remained employed through global crisis
• Well aware of the low price opportunity; jewellery sold by weight
• High appeal of price dip to first time buyer; unsaturated market
Beijing retailer - May holiday Shanghai retailer - Valentines day
8/3/2019 1204 Anglo Platinum
http://slidepdf.com/reader/full/1204-anglo-platinum 13/39
13 Site Visit April 12th 2010
0
200,000
400,000
600,000
800,000
1,000,000
1,200,000
1,400,000
1,600,000
1,800,000
2007/04/20
P a l l a d i u m E
T F o u n c e s
150
200
250
300
350
400
450
500
550
600
650
P r i c e ( U S $ / o z )
ETC ZKB US ETC US$/oz
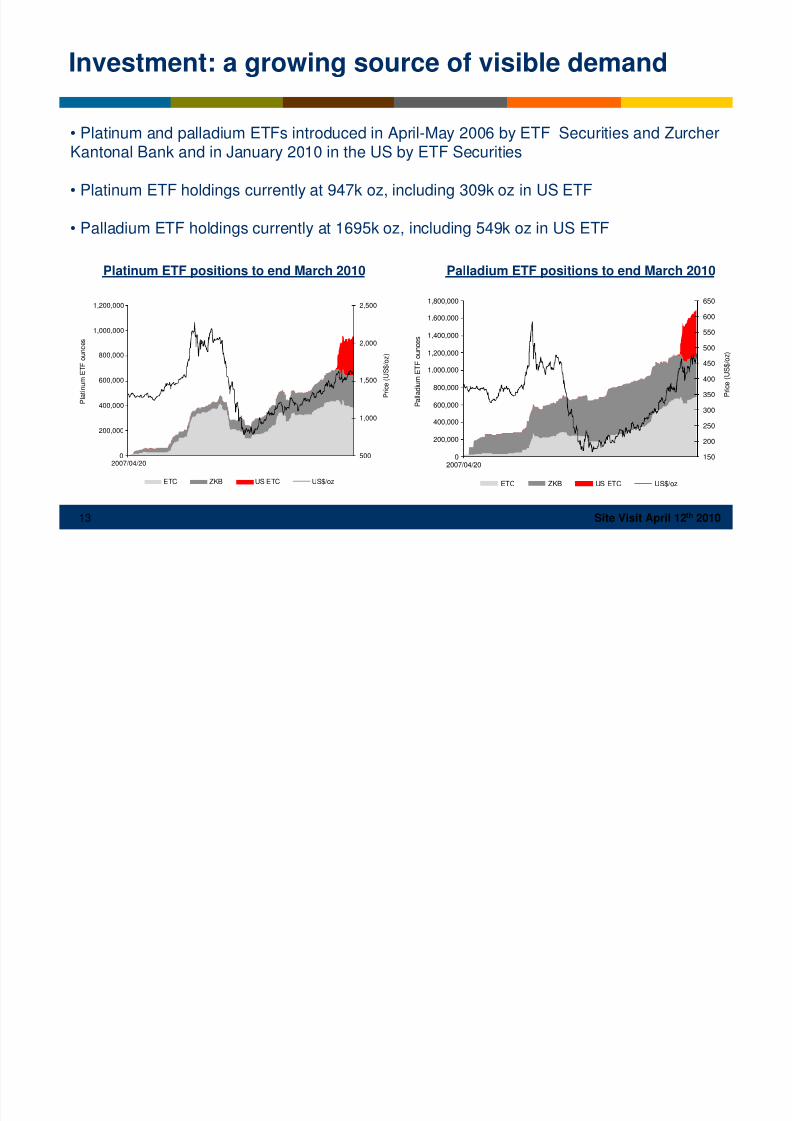
• Platinum and palladium ETFs introduced in April-May 2006 by ETF Securities and ZurcherKantonal Bank and in January 2010 in the US by ETF Securities
• Platinum ETF holdings currently at 947k oz, including 309k oz in US ETF
• Palladium ETF holdings currently at 1695k oz, including 549k oz in US ETF
Platinum ETF positions to end March 2010 Palladium ETF positions to end March 2010
Investment: a growing source of visible demand
0
200,000
400,000
600,000
800,000
1,000,000
1,200,000
2007/04/20
P l a t i n u m E
T F o u n c e s
500
1,000
1,500
2,000
2,500
P r
i c e ( U S $ / o z )
ETC ZKB US ETC US$/oz
8/3/2019 1204 Anglo Platinum
http://slidepdf.com/reader/full/1204-anglo-platinum 14/39
14 Site Visit April 12th 2010
• Increasing autocatalyst demand from BRIC car production and sales
• Palladium use in diesel catalysts: 25-30% of PGM loadings medium to
longer-term
• Investment activity and Exchange Traded Funds continue to increase
• Potential for further jewellery development
• Overhang of Russian stockpiles remains for now
• Potential to move into a sustained production deficit once Russian
stockpiles deplete
Palladium: Moving into a sustained production deficit

8/3/2019 1204 Anglo Platinum
http://slidepdf.com/reader/full/1204-anglo-platinum 15/39
15 Site Visit April 12th 2010
COMPANY OVERVIEW
8/3/2019 1204 Anglo Platinum
http://slidepdf.com/reader/full/1204-anglo-platinum 16/39
16 Site Visit April 12th 2010
Safe, Profitable Platinum
Our strategy is to maximise value by understanding and developing the market
for platinum group metals, to expand our production into that opportunity and
to conduct our business safely, cost-effectively and competitively
Our Strategy
8/3/2019 1204 Anglo Platinum
http://slidepdf.com/reader/full/1204-anglo-platinum 17/39
17 Site Visit April 12th 2010
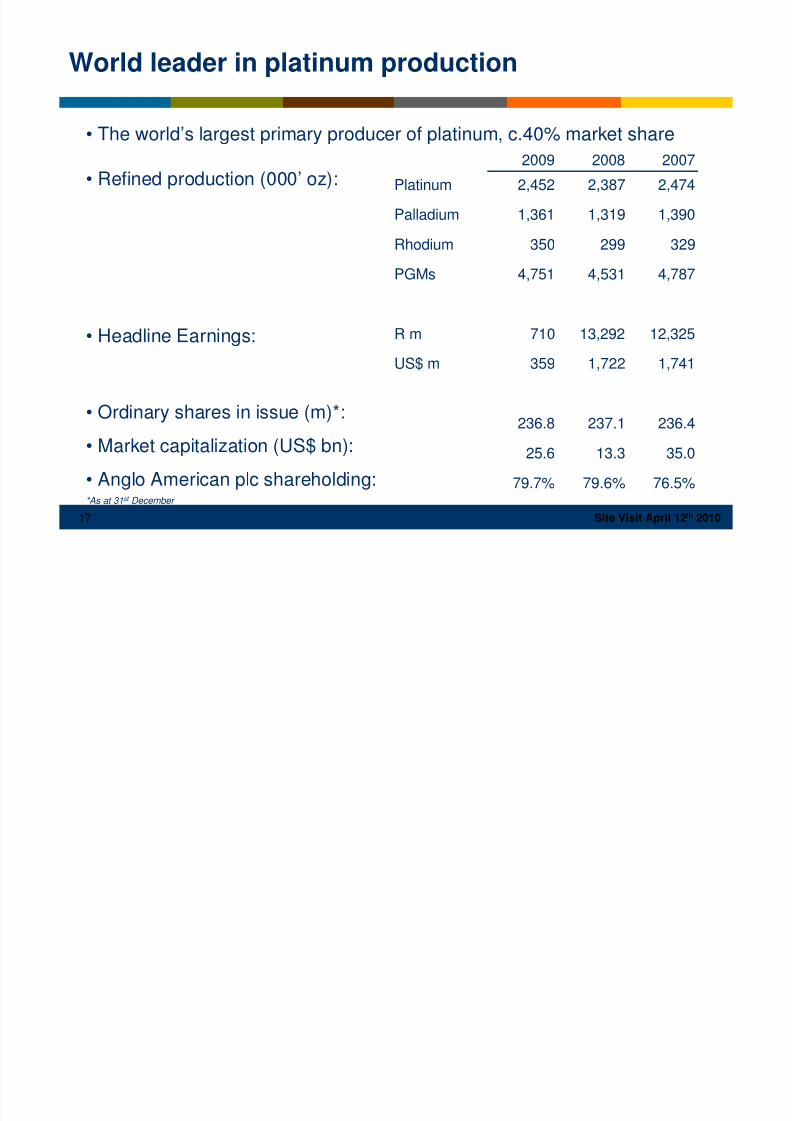
• The world’s largest primary producer of platinum, c.40% market share
• Refined production (000’ oz):
• Headline Earnings:
• Ordinary shares in issue (m)*:
• Market capitalization (US$ bn):
• Anglo American plc shareholding: 76.5%79.6%79.7%
35.013.325.6
236.4237.1236.8
1,7411,722359US$ m
12,32513,292710R m
PGMs
Rhodium
Palladium
Platinum
4,7874,5314,751
329299350
1,3901,3191,361
2,4742,3872,452
200720082009
World leader in platinum production
*As at 31st December
8/3/2019 1204 Anglo Platinum
http://slidepdf.com/reader/full/1204-anglo-platinum 18/39
18 Site Visit April 12th 2010
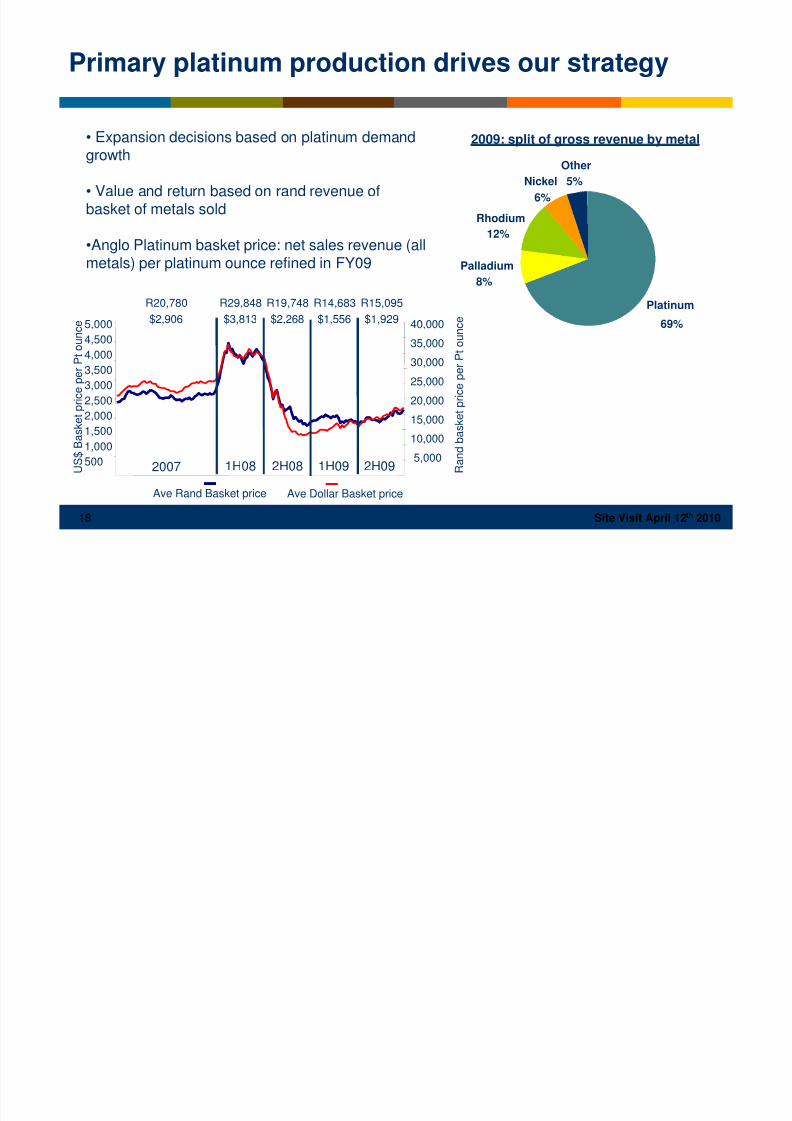
• Expansion decisions based on platinum demandgrowth
• Value and return based on rand revenue ofbasket of metals sold
•Anglo Platinum basket price: net sales revenue (allmetals) per platinum ounce refined in FY09
2009: split of gross revenue by metal
Primary platinum production drives our strategy
Platinum
69%
Palladium
8%
Rhodium
12%
Nickel
6%
Other
5%
5,000
10,000
15,000
20,000
25,000
30,000
35,000
40,000
R a n d b a s k e t p r i c
e p e r P t o u n c e
500
1,000
1,500
2,000
2,500
3,000
3,500
4,000
4,500
5,000
U S $ B a s k e t p r i c e p e r P t o u n c e
Ave Rand Basket price Ave Dollar Basket price
R20,780
$2,906
R19,748
$2,268
R14,683
$1,556
R15,095
$1,929
R29,848
$3,813
2007 1H08 2H08 1H09 2H09
8/3/2019 1204 Anglo Platinum
http://slidepdf.com/reader/full/1204-anglo-platinum 19/39
19 Site Visit April 12th 2010
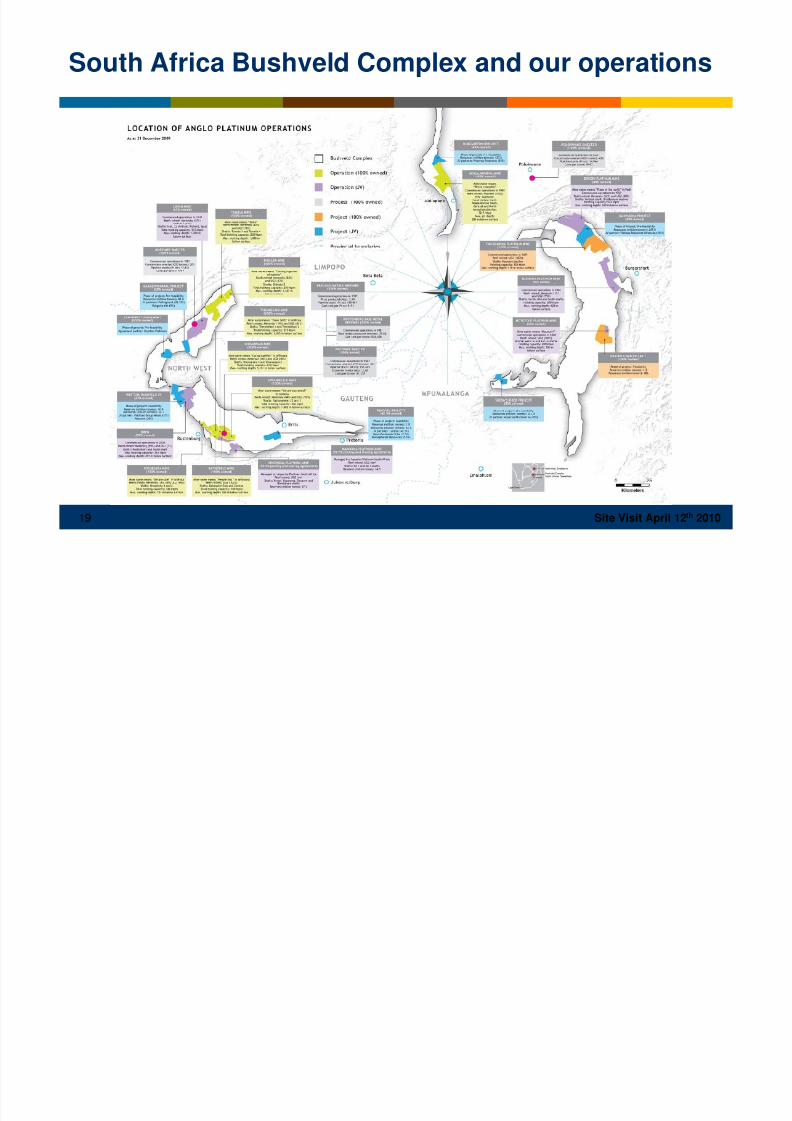
South Africa Bushveld Complex and our operations
8/3/2019 1204 Anglo Platinum
http://slidepdf.com/reader/full/1204-anglo-platinum 20/39
20 Site Visit April 12th 2010
• Proved and probable reserves of 1,315 Mt @ 4.03 g/t: 170.5m oz (4E)
– Implied life of mines: c.55 years
• Measure and Indicated resource: 2,406 Mt @ 3.95 g/t: 305m oz (4E)
– Implied life of mines: c.50 years
• Total implied life of mines (reserves and resources): +100 years
• c.60% of South Africa’s Pt and 4E reserves
Extensive high quality ore reserves and resources

8/3/2019 1204 Anglo Platinum
http://slidepdf.com/reader/full/1204-anglo-platinum 21/39
8/3/2019 1204 Anglo Platinum
http://slidepdf.com/reader/full/1204-anglo-platinum 22/39
22 Site Visit April 12th 2010
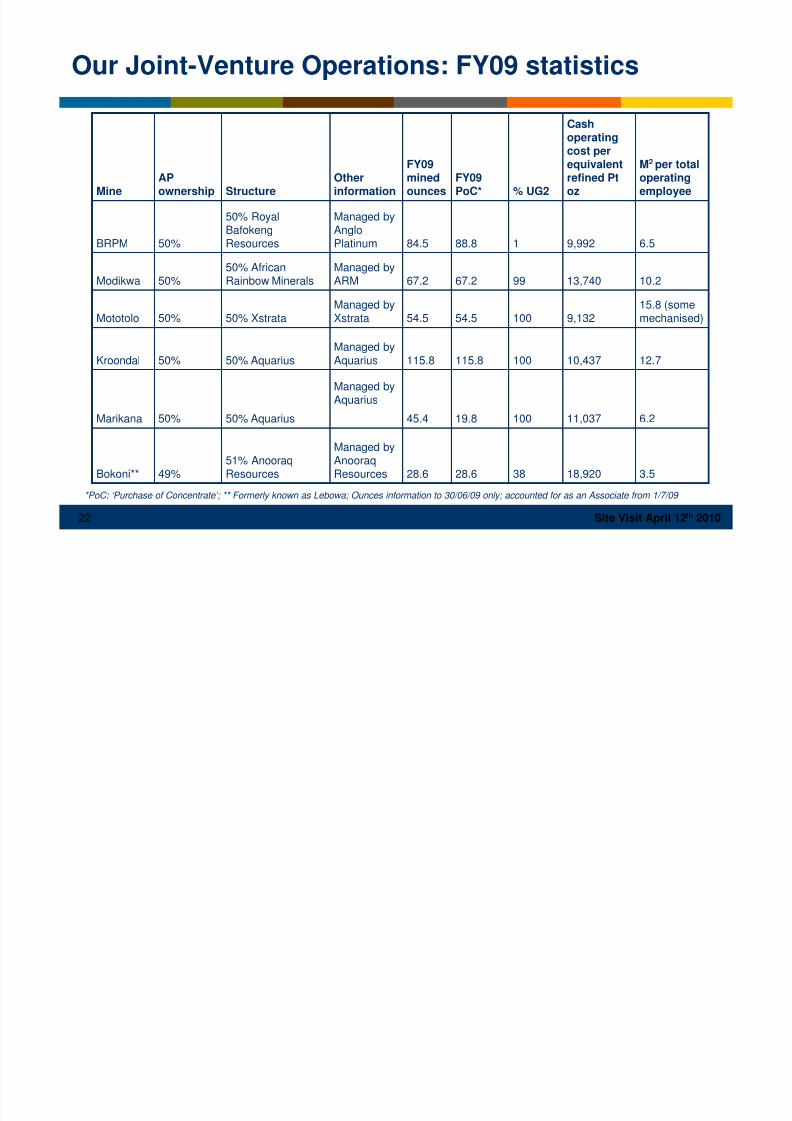
Our Joint-Venture Operations: FY09 statistics
Managed byAnooraqResources
Managed byAquarius
Managed byAquarius
Managed byXstrata
Managed byARM
Managed byAngloPlatinum
Otherinformation
28.6
19.8
115.8
54.5
67.2
88.8
FY09PoC*
51% AnooraqResources
50% Aquarius
50% Aquarius
50% Xstrata
50% AfricanRainbow Minerals
50% RoyalBafokengResources
Structure
3.518,9203828.649%Bokoni**
6.211,03710045.450%Marikana
12.7
15.8 (somemechanised)
10.2
6.5
M2 per totaloperatingemployee
10,437
9,132
13,740
9,992
Cashoperatingcost perequivalentrefined Ptoz
100115.850%Kroondal
10054.550%Mototolo
9967.250%Modikwa
184.550%BRPM
% UG2
FY09minedounces
APownershipMine
*PoC: ‘Purchase of Concentrate’; ** Formerly known as Lebowa; Ounces information to 30/06/09 only; accounted for as an Associate from 1/7/09
8/3/2019 1204 Anglo Platinum
http://slidepdf.com/reader/full/1204-anglo-platinum 23/39
23 Site Visit April 12th 2010
• Extensive high quality ore reserves
• Building flexibility into portfolio of long-life assets
• Superior market intelligence
• Extensive HDSA JV experience
• Conversion of all mining rights granted, including at project level
Unique competitive advantages

8/3/2019 1204 Anglo Platinum
http://slidepdf.com/reader/full/1204-anglo-platinum 24/39
24 Site Visit April 12th 2010
Latest financial results: 2009 highlights
• Safety: continued progress
– 4 month fatality-free record as at 20 January 2010
• Financial results:
– Headline Earnings down 95% to R710 million due to the metal price decline
• Strong recovery in PGM prices since 2H09 and continued positive market outlook
• Operational improvement targets met:
– Production of 2.4 million ounces of platinum, as planned
– Employee complement reduction of 15,752 since January 2009
– Cash operating costs per equivalent refined platinum ounce kept essentially flat at R11,236
– Mining productivity average 6.33m2 per operating employee during year, 13% improvement yr/yr
– Capital expenditure of R9.7 billion
• Balance Sheet restructured:
– Rights Offer of R12.5 billion now concluded, 2.8x over-subscribed by minority shareholders
– Future financial and operational flexibility secured and capacity for growth created
8/3/2019 1204 Anglo Platinum
http://slidepdf.com/reader/full/1204-anglo-platinum 25/39
25 Site Visit April 12th 2010
Safety:
Cost management:
Declining grade and recovery:
Project pipeline management:
Balance sheet management:
– Focus on achieving zero harm
– Targeting unit costs to remain flat until 2011
– Three-stage process of (i) reducing employee numbersand improving productivity, (ii) reducing overhead andallocated costs; (iii) improving efficiency of infrastructure
– Increased UG2 and quality of Merensky
– Production of metal to meet market demand
– Reduction in capex: R8 bn per annum for next two
years
– Successful R12.5 billion Rights Issue – Resumption of dividend payments
Key opportunities and issues for Anglo Platinum
8/3/2019 1204 Anglo Platinum
http://slidepdf.com/reader/full/1204-anglo-platinum 26/39
26 Site Visit April 12th 2010
Safety is our first value
Zero is possible
Safety
8/3/2019 1204 Anglo Platinum
http://slidepdf.com/reader/full/1204-anglo-platinum 27/39
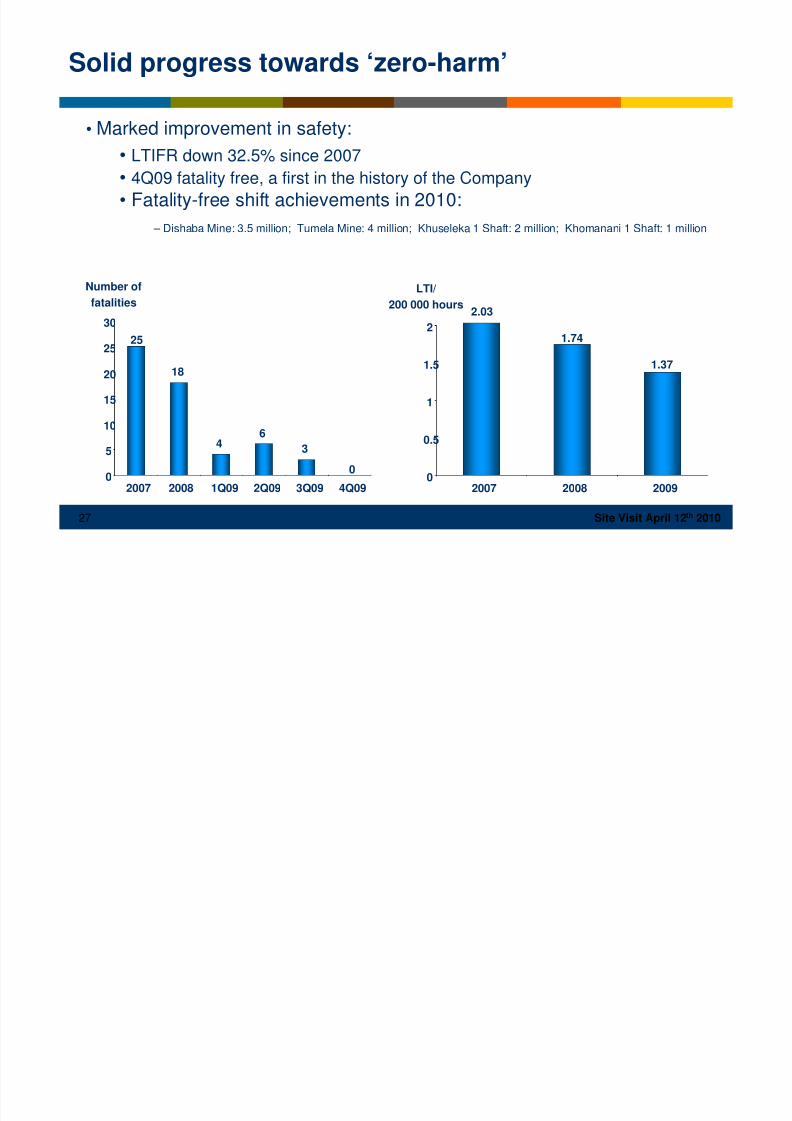
27 Site Visit April 12th 2010
• Marked improvement in safety:
• LTIFR down 32.5% since 2007
• 4Q09 fatality free, a first in the history of the Company
• Fatality-free shift achievements in 2010: – Dishaba Mine: 3.5 million; Tumela Mine: 4 million; Khuseleka 1 Shaft: 2 million; Khomanani 1 Shaft: 1 million
Solid progress towards ‘zero-harm’
LTI/
200 000 hours
0
0.5
1
1.5
2
2007 2008 2009
2.03
1.74
1.37
Number of
fatalities
25
18
46
3
00
5
10
15
20
25
30
2007 2008 1Q09 2Q09 3Q09 4Q09
8/3/2019 1204 Anglo Platinum
http://slidepdf.com/reader/full/1204-anglo-platinum 28/39
28 Site Visit April 12th 2010
• Restructuring of our largest mines into smaller, more manageable units
• Introducing a matrix management structure at Head Office
• Instilling cost management into our corporate culture
• Matching our capex spend to our production profile
• Solid progress on road to ‘zero harm’
Turning Anglo Platinum around: some key actionstaken
8/3/2019 1204 Anglo Platinum
http://slidepdf.com/reader/full/1204-anglo-platinum 29/39
29 Site Visit April 12th 2010
Cost management being instilled across the group
Target: flat nominal cash operating costs per equivalent refined platinumounce FY09-FY11
A three-step process to reinforce cost management:
1. Employee complement reduction and productivity improvements
2. Correct allocation of costs across mines; reduction of overhead costsand removal of overheads from shafts on ‘care and maintenance’
3. Improving efficiency of infrastructure
…in a high inflation environment
8/3/2019 1204 Anglo Platinum
http://slidepdf.com/reader/full/1204-anglo-platinum 30/39
30 Site Visit April 12th 2010
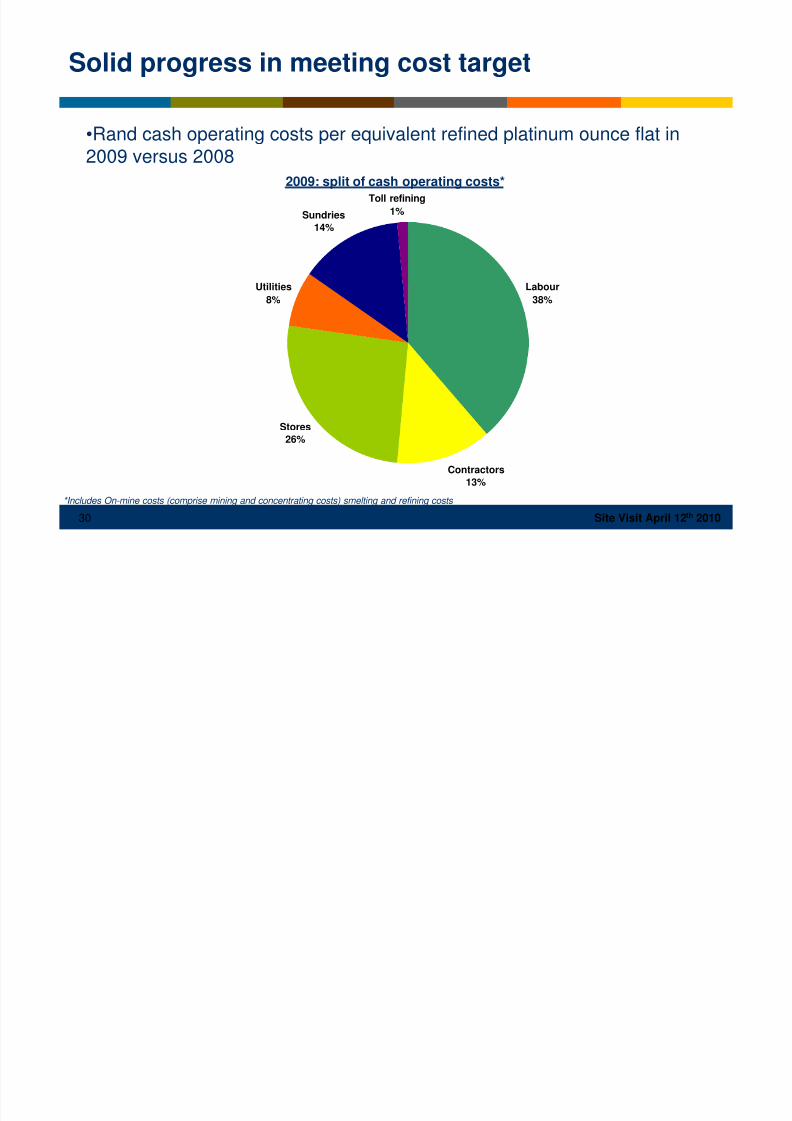
•Rand cash operating costs per equivalent refined platinum ounce flat in2009 versus 2008
2009: split of cash operating costs*
*Includes On-mine costs (comprise mining and concentrating costs) smelting and refining costs
Solid progress in meeting cost target
Labour
38%
Contractors
13%
Stores
26%
Utilities
8%
Sundries
14%
Toll refining1%
8/3/2019 1204 Anglo Platinum
http://slidepdf.com/reader/full/1204-anglo-platinum 31/39
31 Site Visit April 12th 2010
• Cash operating unit costs essentially flat year-on-year
– Cash operating costs per equivalent refined platinum ounce of R11,236 vs. R11,096 in 2008, a
c.6% reduction in real terms
– Cash operating cost per tonne milled decreased 5% to R453 in nominal terms
• Employee complement reduction:
– Reduction of 724 positions in corporate and regional offices in 2009; total reduction of 1,150
since July 2008
– 15,752 reduction in total complement since January 2009, against initial expectation of 10,000;
reduction of 18,786 since October 2008
• Asset Optimisation and Supply Chain
– Asset Optimisation operating profit benefit: R2,731 million
– Supply Chain savings: R821 million
FY09 saw a turning point in cost management
8/3/2019 1204 Anglo Platinum
http://slidepdf.com/reader/full/1204-anglo-platinum 32/39
32 Site Visit April 12th 2010
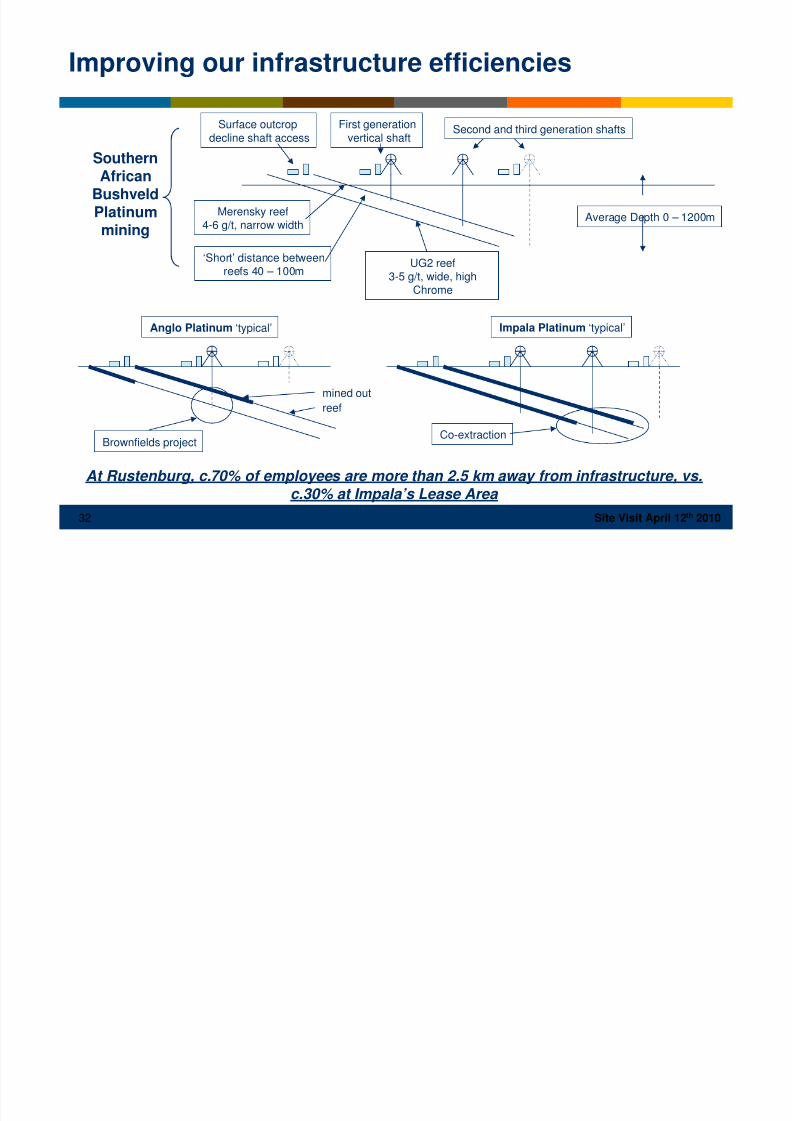
Surface outcropdecline shaft access
First generationvertical shaft
Second and third generation shafts
Merensky reef4-6 g/t, narrow width
‘Short’ distance betweenreefs 40 – 100m
UG2 reef3-5 g/t, wide, high
Chrome
Anglo Platinum ‘typical’ Impala Platinum ‘typical’
Brownfields projectCo-extraction
Average Depth 0 – 1200m
mined outreef
Improving our infrastructure efficiencies
At Rustenburg, c.70% of employees are more than 2.5 km away from infrastructure, vs.
c.30% at Impala’s Lease Area
SouthernAfrican
BushveldPlatinummining
8/3/2019 1204 Anglo Platinum
http://slidepdf.com/reader/full/1204-anglo-platinum 33/39
33 Site Visit April 12th 2010
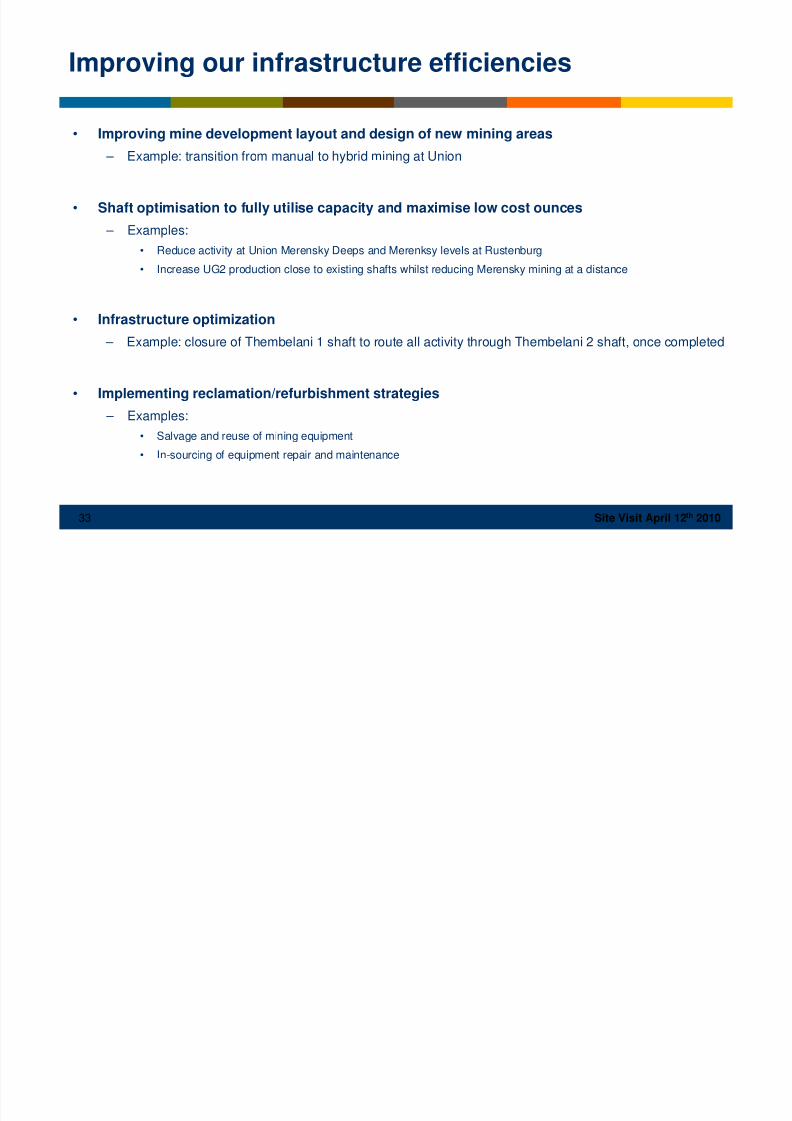
Improving our infrastructure efficiencies
• Improving mine development layout and design of new mining areas
– Example: transition from manual to hybrid mining at Union
• Shaft optimisation to fully utilise capacity and maximise low cost ounces
– Examples:
• Reduce activity at Union Merensky Deeps and Merenksy levels at Rustenburg
• Increase UG2 production close to existing shafts whilst reducing Merensky mining at a distance
• Infrastructure optimization
– Example: closure of Thembelani 1 shaft to route all activity through Thembelani 2 shaft, once completed
• Implementing reclamation/refurbishment strategies – Examples:
• Salvage and reuse of mining equipment
• In-sourcing of equipment repair and maintenance
8/3/2019 1204 Anglo Platinum
http://slidepdf.com/reader/full/1204-anglo-platinum 34/39
34 Site Visit April 12th 2010
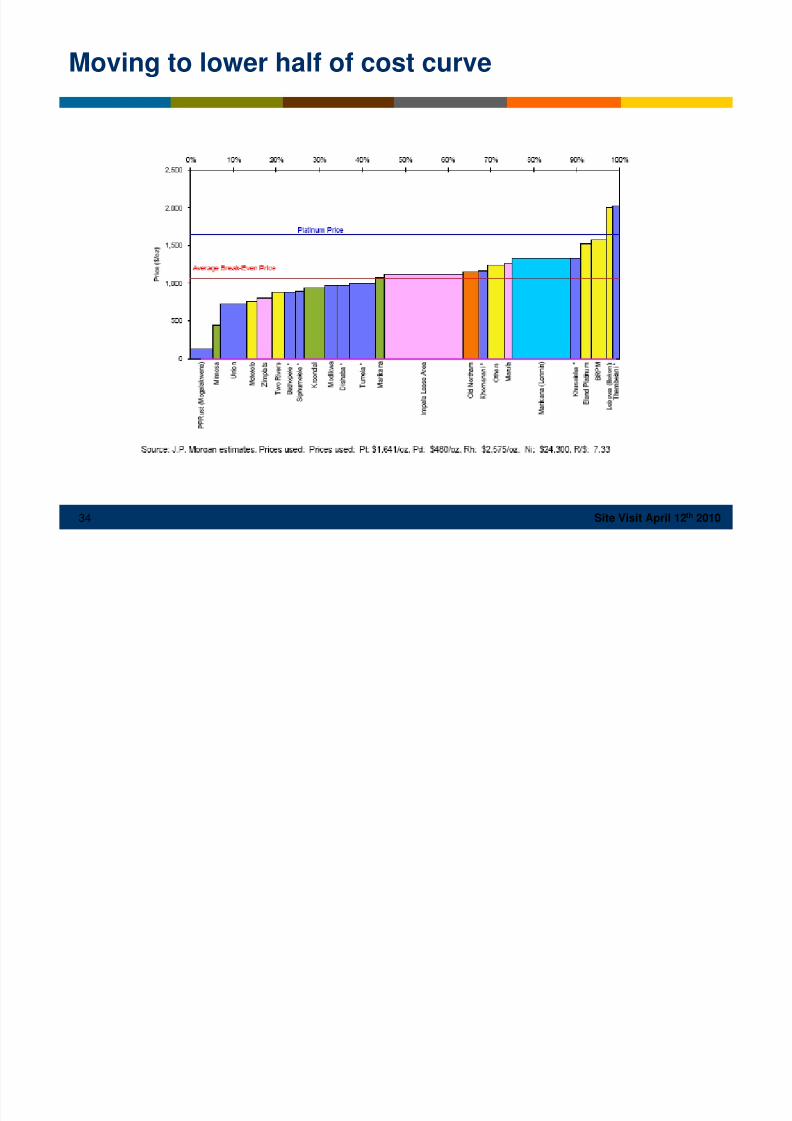
Moving to lower half of cost curve
8/3/2019 1204 Anglo Platinum
http://slidepdf.com/reader/full/1204-anglo-platinum 35/39
35 Site Visit April 12th 2010
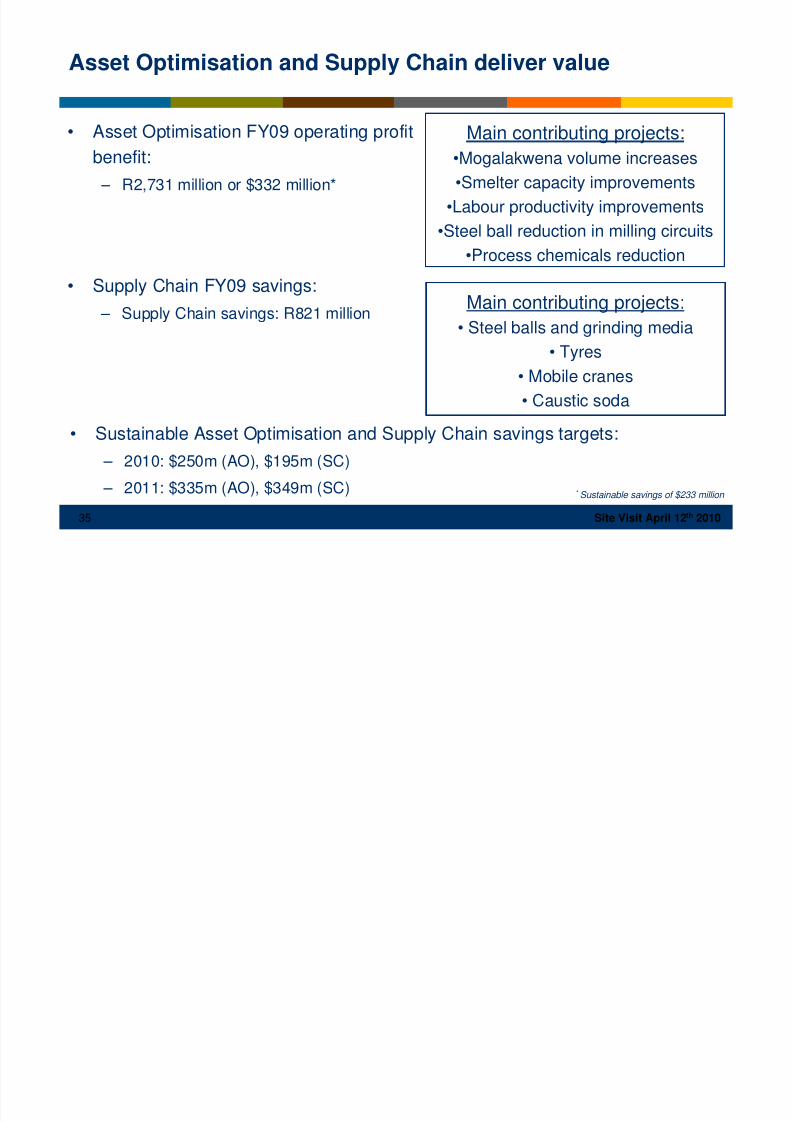
Asset Optimisation and Supply Chain deliver value
• Asset Optimisation FY09 operating profit
benefit:
– R2,731 million or $332 million*
• Supply Chain FY09 savings:
– Supply Chain savings: R821 million
Main contributing projects:
•Mogalakwena volume increases
•Smelter capacity improvements
•Labour productivity improvements•Steel ball reduction in milling circuits
•Process chemicals reduction
Main contributing projects:• Steel balls and grinding media
• Tyres
• Mobile cranes
• Caustic soda
• Sustainable Asset Optimisation and Supply Chain savings targets:
– 2010: $250m (AO), $195m (SC)
– 2011: $335m (AO), $349m (SC) * Sustainable savings of $233 million
8/3/2019 1204 Anglo Platinum
http://slidepdf.com/reader/full/1204-anglo-platinum 36/39
36 Site Visit April 12th 2010
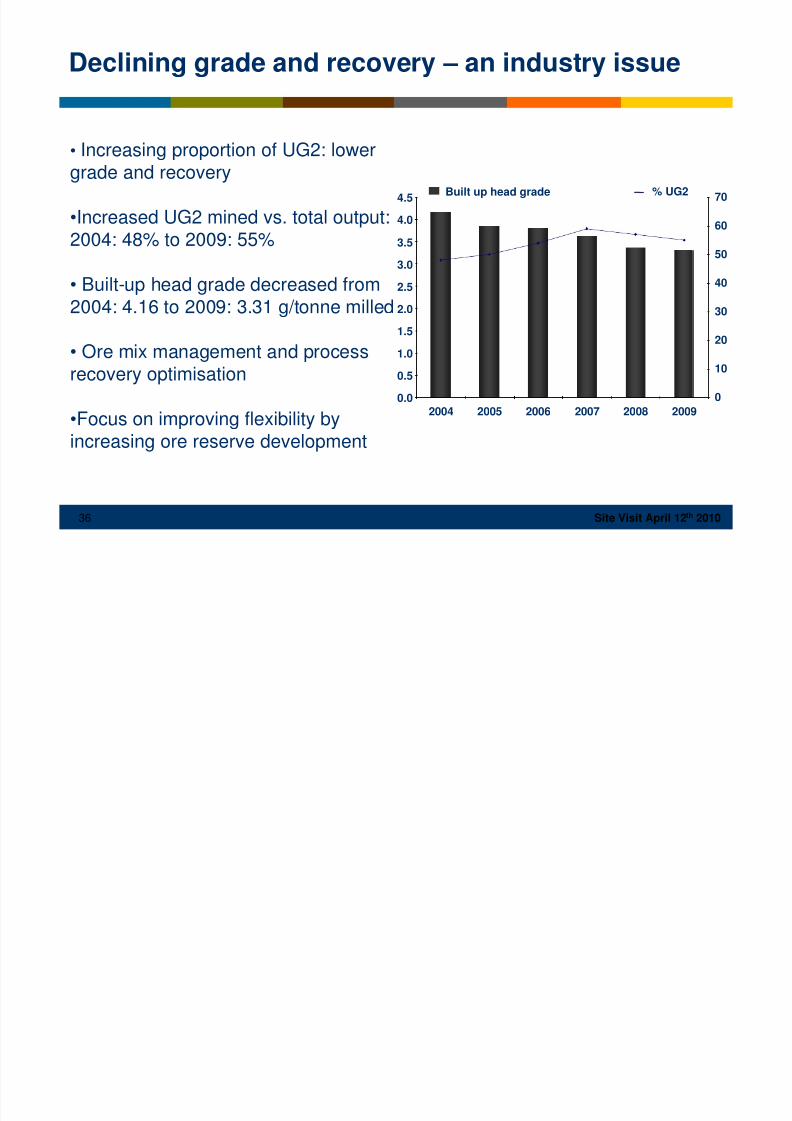
• Increasing proportion of UG2: lowergrade and recovery
•Increased UG2 mined vs. total output:2004: 48% to 2009: 55%
• Built-up head grade decreased from
2004: 4.16 to 2009: 3.31 g/tonne milled
• Ore mix management and processrecovery optimisation
•Focus on improving flexibility byincreasing ore reserve development
Built up head grade
Declining grade and recovery – an industry issue
% UG2
0.0
0.5
1.0
1.5
2.0
2.5
3.0
3.5
4.04.5
2004 2005 2006 2007 2008 20090
10
20
30
40
50
60
70
Project pipeline management: rigorous capital
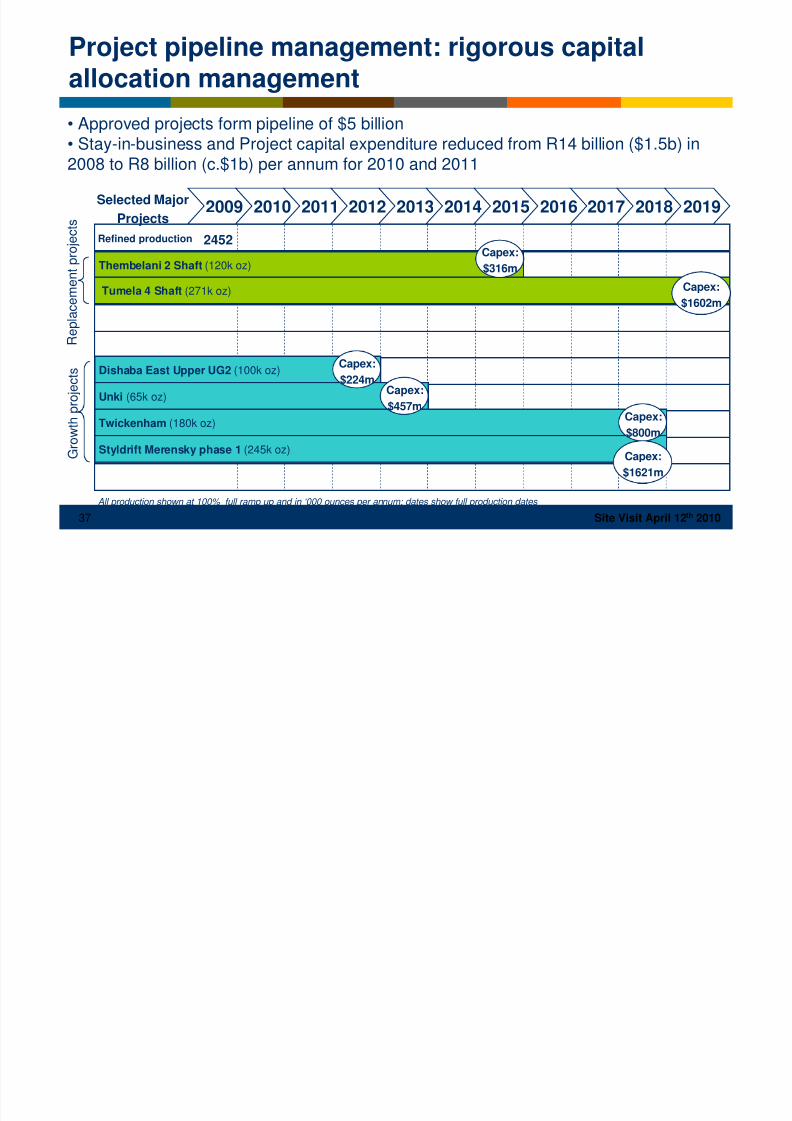
8/3/2019 1204 Anglo Platinum
http://slidepdf.com/reader/full/1204-anglo-platinum 37/39
37 Site Visit April 12th 2010
R e p l a c e
m e n t p r o j e c t s
• Approved projects form pipeline of $5 billion• Stay-in-business and Project capital expenditure reduced from R14 billion ($1.5b) in2008 to R8 billion (c.$1b) per annum for 2010 and 2011
2009 2010 2011 20172012 2013 2014 2015 2016 2018 2019
All production shown at 100% full ramp up and in ‘000 ounces per annum; dates show full production dates
Selected MajorProjects
2452Refined production
Thembelani 2 Shaft (120k oz)
Tumela 4 Shaft (271k oz)
G r o w t h p r o
j e c t s Dishaba East Upper UG2 (100k oz)
Twickenham (180k oz)
Styldrift Merensky phase 1 (245k oz)
Capex:
$316m
Capex:
$1602m
Capex:
$800m
Capex:
$1621m
Project pipeline management: rigorous capitalallocation management
Unki (65k oz)Capex:
$457m
Capex:
$224m
Balance sheet management: Successful
8/3/2019 1204 Anglo Platinum
http://slidepdf.com/reader/full/1204-anglo-platinum 38/39
38 Site Visit April 12th 2010
• R12.5 billion, equating to 24,891,473 million shares
• Issue price of R502.18, set at 25% discount to Theoretical Ex-RightsPrice (5 February 2010)
• Anglo American followed its rights (79.72%) and fully underwrote thebalance of the offering
• Pro-forma net debt post Rights Issue: R6.8 billion
• Reduction in pro-forma interest charge expected to be c. R800 million
• Dividend payments to be resumed when market conditions and the
operating environment permit
Balance sheet management: SuccessfulR12.5 billion Rights Issue
8/3/2019 1204 Anglo Platinum
http://slidepdf.com/reader/full/1204-anglo-platinum 39/39
39 Site Visit April 12th 2010
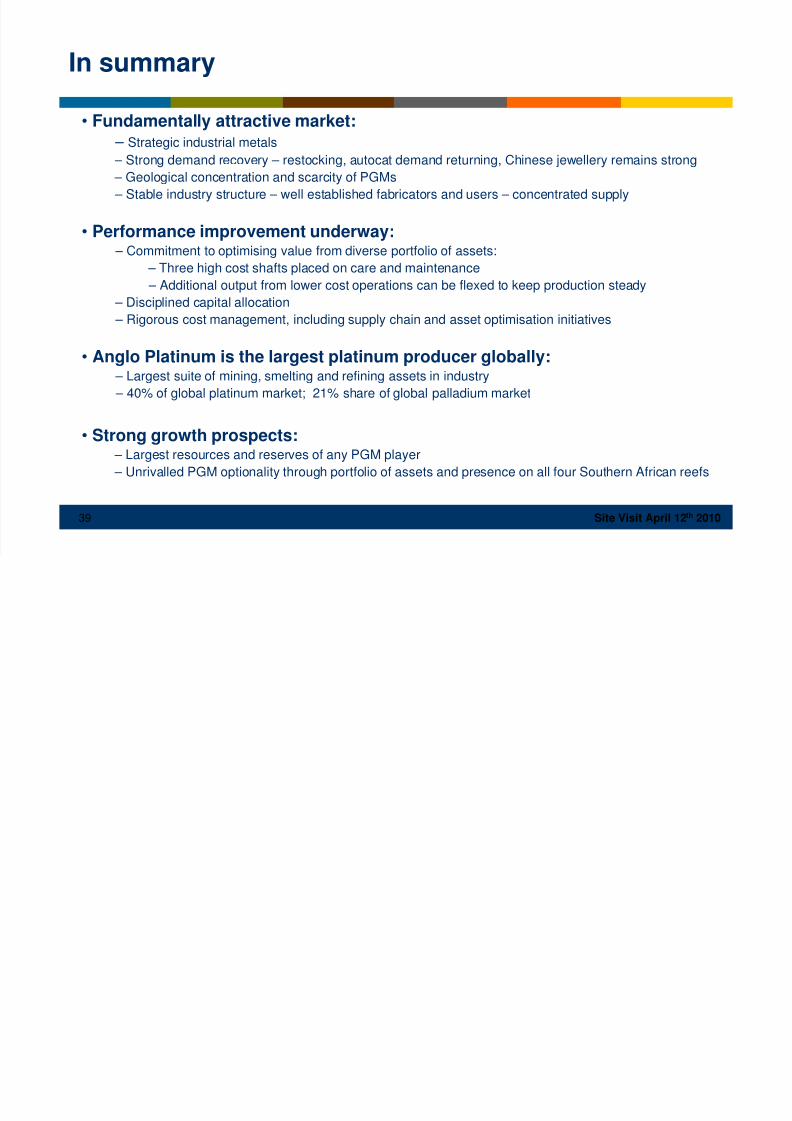
In summary
• Fundamentally attractive market: – Strategic industrial metals
– Strong demand recovery – restocking, autocat demand returning, Chinese jewellery remains strong
– Geological concentration and scarcity of PGMs
– Stable industry structure – well established fabricators and users – concentrated supply
• Performance improvement underway: – Commitment to optimising value from diverse portfolio of assets:
– Three high cost shafts placed on care and maintenance
– Additional output from lower cost operations can be flexed to keep production steady
– Disciplined capital allocation – Rigorous cost management, including supply chain and asset optimisation initiatives
• Anglo Platinum is the largest platinum producer globally: – Largest suite of mining, smelting and refining assets in industry
– 40% of global platinum market; 21% share of global palladium market
• Strong growth prospects: – Largest resources and reserves of any PGM player
– Unrivalled PGM optionality through portfolio of assets and presence on all four Southern African reefs
Top Related