


![Business Model and Introduction to Digital Metricspalmeida/Balanceamento_Jogos_15_16/Farley_Aula2_BMC.pdf · Agenda [1/2] Recap Business model Business model canvas Lean Canvas Introduction](https://static.fdocuments.in/doc/165x107/5c5fb10209d3f26c398b466c/business-model-and-introduction-to-digital-palmeidabalanceamentojogos1516farleyaula2bmcpdf.jpg)

Languages
Pages
Legal

C
a
p
i
t
a
l
M
a
r
k
e
t
s
D
a
y
2
0
1
4
Capital Markets Day
Introduction &
strategic recap
CEO Terje Mjøs
1
11 June 2014

Overall agenda CMD
Introduction
2
Capital Markets Day 2014
08:30 – 09:00
09:00 – 09:30
09:30 – 10:00
10:00 – 10:30
10:30 – 10:45
10:45 – 11:15
11:15 – 11:45
11:45 – 12:15
12:15 – 13:00
13:00 – 14:00
14:00
| Registration & breakfast
| Welcome & introduction, Terje Mjøs, CEO
| Market dynamics, Terje Mjøs, CEO and Stig Mjølsnes, IT-advisor
| Financial services growth, Wiljar Nesse, EVP Financial Services
| Coffee break
| Selected Industries growth,
Anne-Cecilie Fagerlie, EVP Industries Norway and Niclas Ekblad, EVP EVRY Sweden
| SME Regions growth, Kurt Helland, EVP Regions Norway
| Managed Services growth, Lars Ringvold, SVP Future Proof and Robin Blomquist, SVP EVRY Mobility
| Lunch
| Financials and guiding, Terje Mjøs, CEO and Morten Frogner, acting CFO
| Q&A

Long-standing frame agreement is renewed
SpareBank 1 agreement
3
Capital Markets Day 2014
TCV NOK 2.0 bn• 4 years from 1.1 2015
• Option for further 2+2 years
• SpareBank 1 will migrate to EVRY`s next generation banking platform
Ready to launch next generation core bank and payment solutions• SpareBank 1 will be our first customer
• Significant Nordic growth potential

EVRY – the most local IT company in the Nordics
Introduction
4
Capital Markets Day 2014
# 1 Total market share 31%
# 1 Bank & finance 56%
# 1 SME segment 22%
# 1 Outsourcing 37%
# 1 Consulting 20%
# 4 Total market share 7.5%
# 1 SME segment 17%
# 5 Outsourcing 6%
# 3 Consulting 7.5%
Finland: SME-focus
Denmark: SAP-focus
Latvia: Nearshore Help Desk
India: Offshore Operations & AD/AM
Ukraine: Offshore AD/AM
Global sourcingNorway
Sweden

5
Capital Markets Day 2014
A part of everyday life for millions of Nordic citizens
Introduction
When you
• receive a package notification via SMS from the Post
• withdraw cash from an ATM in Norway or Sweden
• are being credit evaluated
• receive the tax assessment from the Norwegian tax authority
• pass a toll road station
• do a lookup in the national register of motor vehicles
• use your credit card or mobile banking services
• pick up an e-prescription at an Norwegian pharmacy
• buy a ticket with the Swedish railways

EVRY`s organisation and executive management
Introduction
6
Capital Markets Day 2014
*) Global Sourcing managed from Corporate Development, reported in Norway segment
Norway SwedenFinancial
Services
Reporting
segment
Business Area
Nordic Operations
Financial
Services
Global Sourcing*
Regions/ SME
Norway
Industries
Norway
Industries
Sweden
Regions/ SME
Sweden

EVRY Financial Services content and figures
Segment introduction
7
Capital Markets Day 2014
Revenue distribution
MarketshareKey figures
3 554 MNOK1 490 Employees 9 Offices
24%
75%
UK
Nordic
Norway
13%
26%58%
4%
OperationsBanking services
Card servicesCustom solutions
0
10
20
30
40
50
60
Total market Banking
0
5
10
15
20
Banking
SwedenNorway
1.000
1.500
2.000
2.500
3.000
3.500
4.000
7%
1Q
2013
1Q
2014
1Q
2012
1Q
2011
Revenue LTM
(MNOK) YoY average
Total market
Source: Gartner & IDC
Revenue distribution
Marketshare
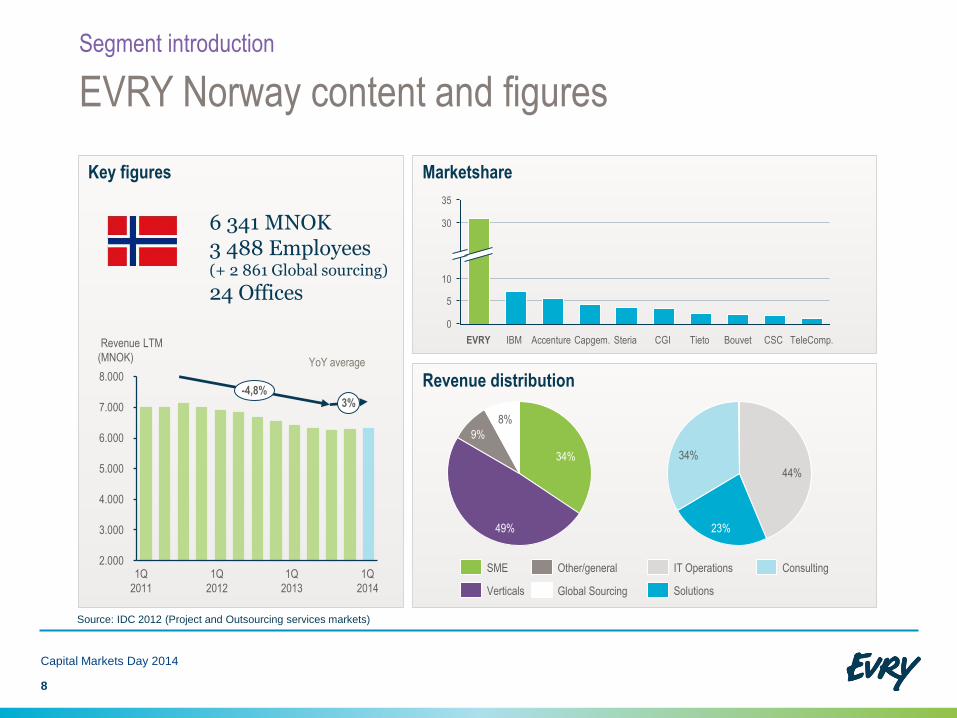
EVRY Norway content and figures
Segment introduction
8
Capital Markets Day 2014
Key figures
8%
9%
49%
34%
44%
34%
23%
5
0
10
30
35
TeleComp.CSCBouvetTietoCGISteriaCapgem.AccentureIBMEVRY
6 341 MNOK3 488 Employees(+ 2 861 Global sourcing)
24 Offices
2.000
3.000
4.000
5.000
6.000
7.000
8.000-4,8%
3%
1Q
2013
1Q
2014
1Q
2011
1Q
2012
YoY average
Source: IDC 2012 (Project and Outsourcing services markets)
Other/general
Verticals
SME
Solutions
ConsultingIT Operations
Global Sourcing
Revenue LTM
(MNOK)
Key figures
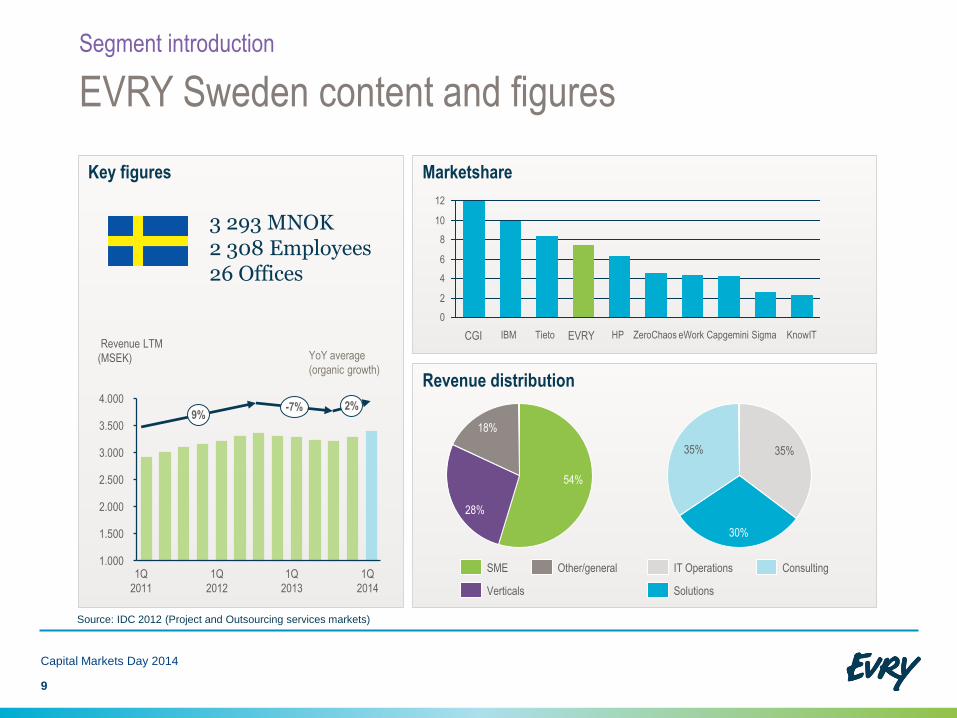
EVRY Sweden content and figures
Segment introduction
9
Capital Markets Day 2014
Revenue distribution
Marketshare
3 293 MNOK2 308 Employees 26 Offices
Source: IDC 2012 (Project and Outsourcing services markets)
Other/general
Verticals
SME
Solutions
ConsultingIT Operations
18%
28%
54%
30%
35%35%
0
2
4
6
8
10
12
KnowITSigmaCapgeminieWorkZeroChaosHPEVRYTietoIBMCGI
1.000
1.500
2.000
2.500
3.000
3.500
4.0002%-7%
9%
YoY average
(organic growth)
1Q
2013
1Q
2014
1Q
2011
1Q
2012
Revenue LTM
(MSEK)
C
a
p
i
t
a
l
M
a
r
k
e
t
s
D
a
y
2
0
1
4
Strategic recap
EVRY
1
0

A majority of our business grows faster than the market
Strategic recap
11
Capital Markets Day 2014
Sweden geography Financial Services
SME IT-Operations
5
2
3
1
0
4
+4%
+8%
2013201220112010
SEK billion
0,5
1,0
1,5
0,02010 2011 20132012
NOK billion
+9%
3,0
1,5
0,5
0,0
1,0
2,5
2,0
NOK billion
2010
+4%
2011 20132012
CAGR
CAGR
CAGR

Structured approaches to quality
Action taken – major quality improvement
for core bank clients
Strategic recap
12
Capital Markets Day 2014
Critical incidents significantly reduced
18
36
124
161
Target
2014
2011
-89%
20132012
LEAN
Renovated coreinfrastructure
“Customer HSE”(implemented safety measures
from oil&gas industry)

Improved EBITA and changed business mix & risk
Strategic recap
13
Capital Markets Day 2014
* Global oriented enterprise (single engagements ) as part of Group revenue
EBITA improvements and enhanced cost control
Better business mix & reduced exposure
Q1
2011
Q1
2014
Q1
2013
Q1
2012
21,0%17,0% 14,0%
7,0%
2016 est.201320102008
EBITA
(LTM)
IT Operations Enterprise customers
• Synergies according to plan
• Procurement effects
• Pension liabilities
• Reduced overhead
• New HQ effects
• Reduced dependency of global oriented enterprise customer
• SME & Solutions share of revenue increasing
• Reduced exposure through issues resolved (eg ERV, City of Oslo, Pension conflict)
753749733714680685671690681663
555
481501
400
500
600
700
800
+272

14
Capital Markets Day 2014
Transition completed - ready to accelerate growth
Strategic recap
Cost base
Working capital
Quality
Business mix
Reduced risk
.......
Growth

Market dynamics
CEO Terje Mjøs and IT-advisor Stig Mjølsnes
11 June 2014
C
a
p
i
t
a
l
M
a
r
k
e
t
s
D
a
y
2
0
1
4
1
5

16
Capital Markets Day 2014
The World is Changing… …and it’s changing fast
Market dynamics
Disruptive forces in play
IT-services eats products
IT a major growth driver

17
Capital Markets Day 2014
Unprecedented growth rates with new technologies
Disruptive forces

18
Capital Markets Day 2014
The World is Changing… …and it’s changing fast
Market dynamics
Disruptive forces in play
IT-services eats products
IT a major growth driver
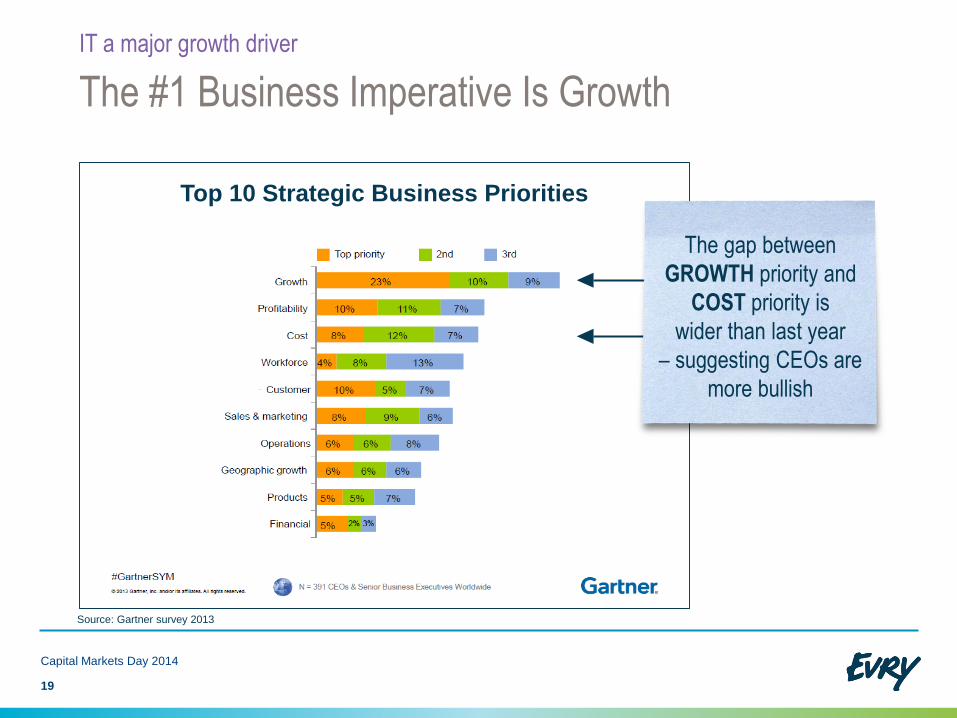
The #1 Business Imperative Is Growth
Top 10 Strategic Business Priorities
IT a major growth driver
19
Capital Markets Day 2014
Source: Gartner survey 2013
The gap between
GROWTH priority and
COST priority is
wider than last year
– suggesting CEOs are
more bullish

20
Capital Markets Day 2014
Technology is shaping the future of the enterprise
IT a major growth driver
Source: IBM survey
Also supported by
World Economic Forum:
“There is a strong
correlation between
companies’
competitiveness and
their ability to adopt
technologies”

CIO focus:
60% of CIO’s intend to
increase level of sourcing
Renovate the Core
Cost optimizing to
stay competitive
70
30
New functions Run & Manage
• Business requirements
• Operational stability
• Security & compliance
21
Capital Markets Day 2014
IT is strategic and critical to any business
IT a major growth driver
Line of Business focus: Exploit new Technologies
Setting the
digital agenda
IT spend outside IT org.
• Business growth
• Strategic positioning
against competition
Source: Gartner, IDC

22
Capital Markets Day 2014
The World is Changing… …and it’s changing fast
Market dynamics
Disruptive forces in play
IT-services eats products
IT a major growth driver
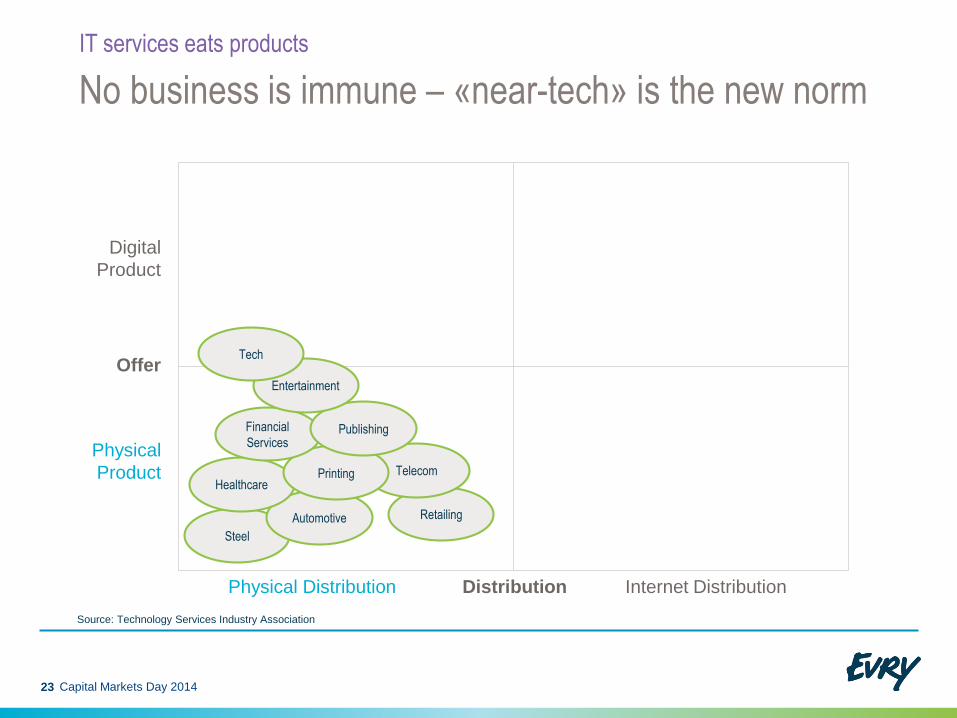
No business is immune – «near-tech» is the new norm
IT services eats products
23 Capital Markets Day 2014
Source: Technology Services Industry Association
Physical
Product
Physical Distribution
Offer
Digital
Product
Distribution Internet Distribution
Retailing
Steel
Automotive
HealthcareTelecomPrinting
Financial
ServicesPublishing
Entertainment
Tech

No business is immune – «near-tech» is the new norm
IT services eats products
24
Source: Technology Services Industry Association
Physical
Product
Physical Distribution
Offer
Digital
Product
Distribution Internet Distribution
Retailing
Steel
Automotive
Healthcare
Telecom
Printing
Financial
Services
Publishing
EntertainmentTech
Capital Markets Day 2014
EMRs and
Home Health Care
Online Banking/Trading
Software-Driven Trading
Tablets
Replacing
Paper
S/W Functionality
Web Shopping
Web Shopping
SaaS/
Cloud
Streaming
VoIP
E-Books
Self-Publishing

• Stable industries
• Predictable competition
• Price and quality
• IT challenging High tech
• New technologies and business models
• New competition
• Time to market
• Internet of Things
25
Capital Markets Day 2014
No business is immune – «near-tech» is the new norm
IT services eats products
Source: Technology Services Industry Association

Line of Business expecting
specialised solutions for increased business value
IT departments embracing
industrialised production for cost efficiency
26
Capital Markets Day 2014
IT-spending increasing but focus is shifting
Market dynamics conclusions
Source: IDC
2 - 4% CAGR
Traditional IT
Next
generation ITMobile devices and Apps
PC and Internet
Manfraime and Terminal
27
Capital Markets Day 2014
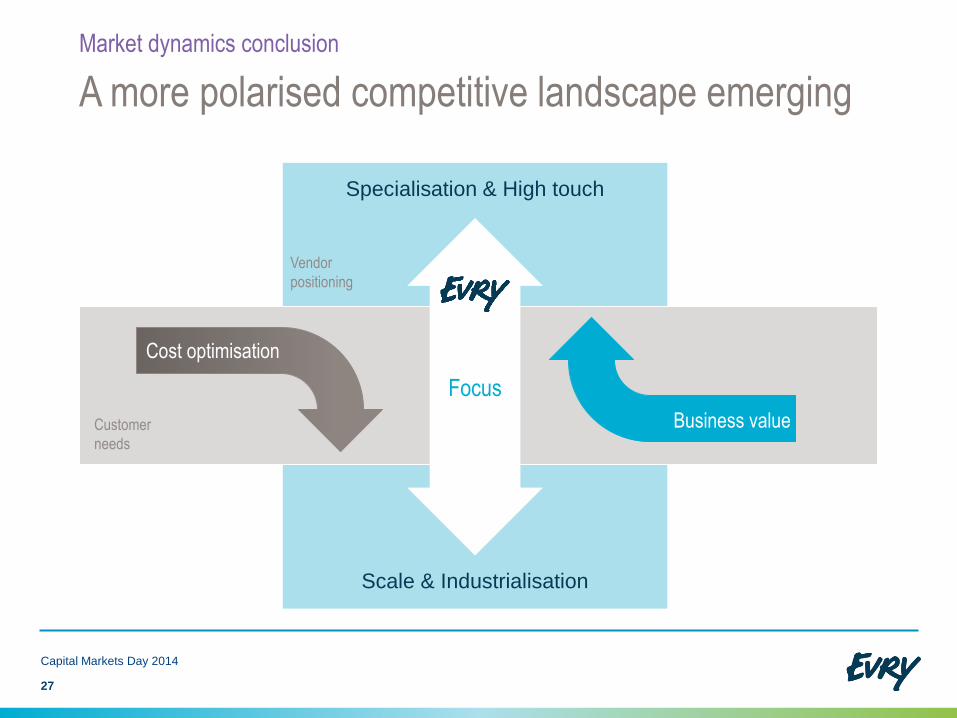
A more polarised competitive landscape emerging
Market dynamics conclusion
Scale & Industrialisation
Specialisation & High touch
Focus
Business value
Cost optimisation
Vendor
positioning
Customer
needs

Streamline Operations –
transforming the business
Adapting to changing market conditions
EVRY’s strategic priorities
Drive business towards vertical
and industry-specific solutions
Focus on
verticals
Reduce
complexity
Reinforce local footprint
and grow regional business
Local
footprint
28
SME/Regions• Business lines
• Packaged services
Financial Services• Nordic expansion
• Core renewal
Selected industries• Gather around industries
• Build true verticals
Managed services• Future Proof
• Cloud & Mobility
• Standard platform
Capital Markets Day 2014
Divest non-core
C
a
p
i
t
a
l
M
a
r
k
e
t
s
D
a
y
2
0
1
4
Financial Services growth
EVP Financial Services, Wiljar Nesse
2
9
11 June 2014

IT spending Norway vs Sweden (Banking)
Opportunity
Nordic Banking IT Services market
Market size IT services Nordic
Banking is the largest vertical market in the Nordic
Financial Services market
30
8,9
5,9
3,1
4,5
84% 16%
Sweden FinlandNorway Denmark
Banking
140 NOK billion
22,7 NOK billion
Market segments Nordics
57%
43%
IT services In-house
SwedenNorway
38%
62%
Tier 1
Tier 2
Source: Gartner, Radar & IDC, internal analysis
Capital Markets Day 2014

• Move to mobile solutions
• Large Nordic banks increase use of services
• Industrialisation of services
31
Capital Markets Day 2014
Market drivers and customer agenda
Market dynamics
• End customer driven innovation
• Regulatory demands
• Industry convergence
Sources: Gartner, IDC, Radar
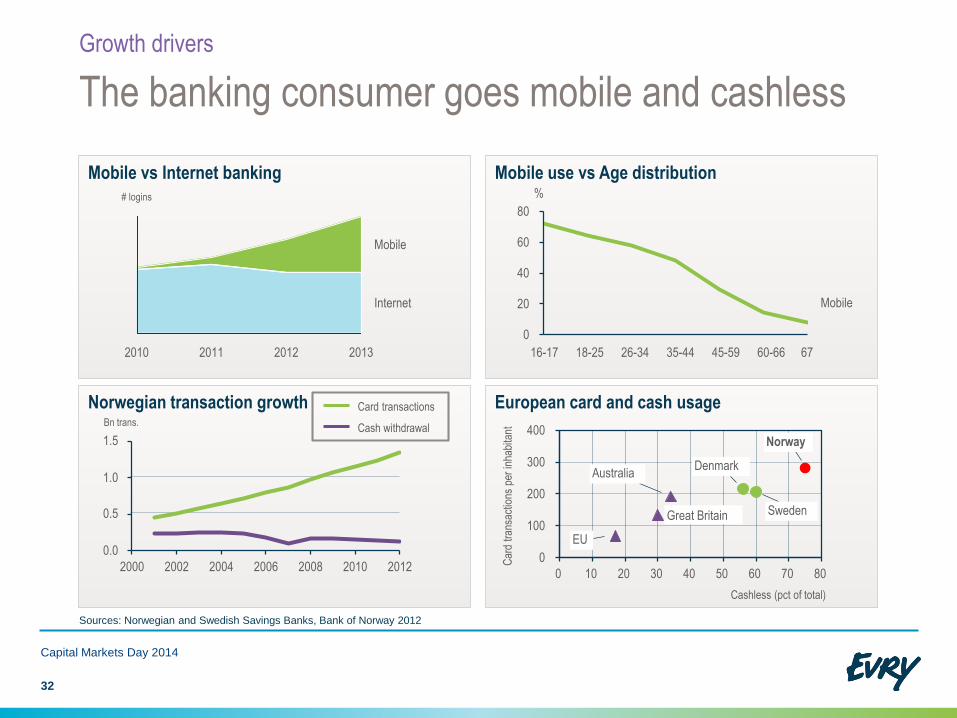
Mobile vs Internet banking
The banking consumer goes mobile and cashless
Growth drivers
Capital Markets Day 2014
Mobile use vs Age distribution
0
20
40
60
80
Mobile
6760-6645-5935-4426-3418-2516-17
European card and cash usageNorwegian transaction growth
2000 2002 2004 2006 2008 2010 2012
1.5
1.0
0.5
0.0
Cash withdrawal
Card transactions
0
100
200
300
400
0 10 20 30 40 50 60 70 80
Car
d tr
ansa
ctio
ns p
er in
habi
tant
Norway
Australia
Sweden
EU
Great Britain
Cashless (pct of total)
Denmark
20112010
# logins
2013
Internet
Mobile
2012
Sources: Norwegian and Swedish Savings Banks, Bank of Norway 2012
32
%
Bn trans.

33
Capital Markets Day 2014
Portfolio of offerings
EVRY capabilities
Revenue mix
Focus areas
32%
24%
42%
Customer Interfaces
Cards
Banking Services
Mobility
Card
Loan services and daily banking
ATM
Core & Payment
*) Banking Services Europe 2012, Gartner 2013
Marketshare Europe*
BT
TC
S
EY
Del
oitte
Info
sys
Cog
niza
nt
EV
RY
HP
CG
I
Sop
ra
Ato
s
Acc
entu
re
Other
Services
Nordic
Champion
Delivery models
Software as a Service
Asset based appl.
Software package delivery
Extended Lifecycle
Management
Business Process
Outsourcing
Basic IT Operations Outsourcing
Application Operations Outsourcing

Next generation of core systems a global phenomenon
Financial Services growth
A core bank system
• Is the heart of the bank’s systems
• Enables an accurate and clear picture of a customer’s total commitment
• Is the basis for regulatory reporting
Strategy to bring together
• Banks
• Vendors
Focus
• Standards
• Service-oriented architecture
Core systems
Internet bank
Mobile bank
Reporting
Payment
Loan/ Credit
Branch systems
Capital Markets Day 2014
34
EVRY to host
international BIAN
conference in Oslo
June 24-27, 2014

35
Capital Markets Day 2014
Nordic core renewal
Financial Services growth
EVRY development principles for
next generation core system
• An evolutionary approach with phased implementation
• Based on BIAN architecture
• Modular approach
• Master data is key component
• Platform independence
• Development work done by Financial Services centre in India
Next generation core system addresses
• Time to market to meet new customer demands
• Reduced complexity
• Increasing regulatory requirements
• Cost optimisation
• Operational performance
• Reduced migration risk
• Nordic expansion
Agreement includes renewal of core and payment modules

36
Capital Markets Day 2014
Case studies
EVRY capabilities
Cost effective
outsourcing based on a
proven solution
ATM management
delivered as a
service
State of the art cash
pooling solution for
corporate clients
Cash Pool solution
for corporate
Banking
An improved payment
experience
Contactless
cards

Recent achievements
• Renewal of large banking services contracts,2/3 of the banking platform portfolio
• Acquired TAG Systems establishing presence in Finland and the Baltics
• Signed Swedbank for a 5-year contract for asset based delivery
• Next generation banking services
• Financial Services global development teams
Roadmap 2016 priorities
• Nordic expansion growing banking services in Sweden and Finland
• Card expansion Sweden/Finland/Baltics/UK
• Address new emerging opportunities within payment and card (Industry convergence)
37
Capital Markets Day 2014
Enforce leadership position in Nordic banking
EVRY priorities and ambitions
Nordic services expansion and
niche solutions globally
Differentiated EVRY capabilities
Nordic
banking
Software as
a Service
Innovative
digital user
interaction
Full card
services
value chain
EVRY portfolio of clients and offerings
Shaping trends
C
a
p
i
t
a
l
M
a
r
k
e
t
s
D
a
y
2
0
1
4
Card services growth
3
8
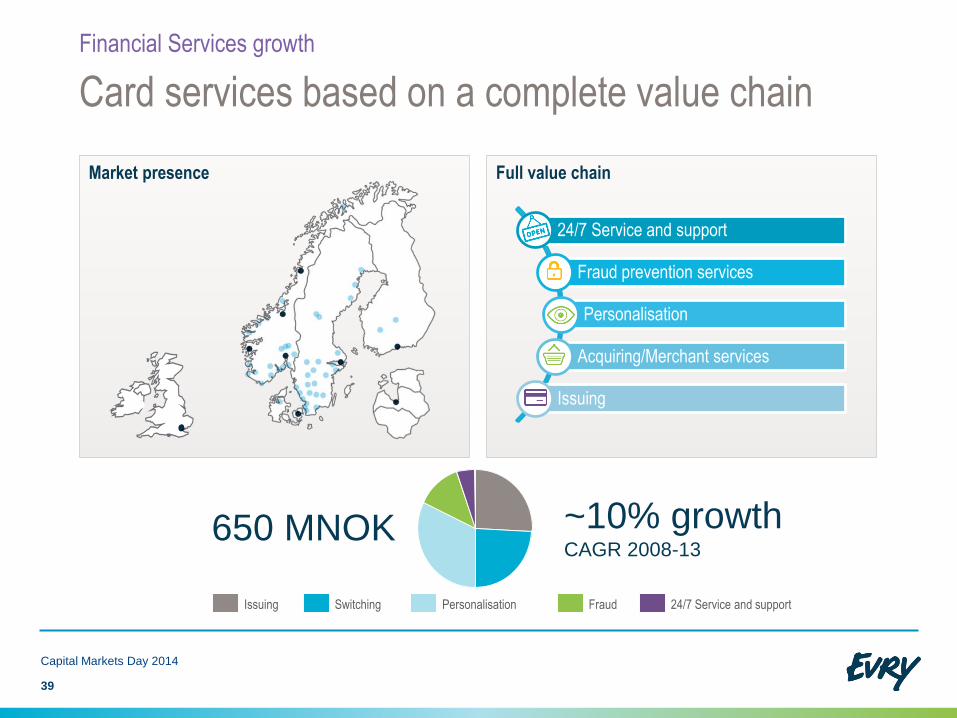
Full value chainMarket presence
Card services based on a complete value chain
Financial Services growth
24/7 Service and support
Fraud prevention services
Personalisation
Acquiring/Merchant services
Issuing
FraudPersonalisationIssuing Switching 24/7 Service and support
650 MNOK ~10% growthCAGR 2008-13
Capital Markets Day 2014
39

40
Capital Markets Day 2014
EVRY in the changing card market
Financial Services growth
Structural
changes
Partnerships
for innovation
Fraud
increase
Technology
shifts
70%
EVRYreduces
fraud up to

• Volume growth and new services to existing customers
• Expansion in Finland and the Baltics
• Full value chain deliveries
• Emerging technologies and opportunities
o Industry convergence
o Contactless
o Context relevant banking services
41
Capital Markets Day 2014
Technology and consumerisation drive growth with Card
Financial Services growth
0
50
100
150
200
250
300
350
New customers/
New markets
Expansion existing
customers
2016 Ambition
MNOK

C
a
p
i
t
a
l
M
a
r
k
e
t
s
D
a
y
2
0
1
4
Summary
4
2

43
Growing from a solid foundation of offerings and customers
Financial Services ambitions
Banking expertise
close to the
customer
Integrated use of
global sourcing
capabilities
• Market dynamics and industry convergence drive demand for banking specific know-how and solutions
• Mobility is a key to attract and retain banking customers
• Delivery models suited for different customer requirements
• A customer drive for service deliveries versus traditional IT projects
Capital Markets Day 2014
0
100
200
300
400
500
600
CardCustomer
Interfaces
MNOK
2016
Ambition
Banking
Services
C
a
p
i
t
a
l
M
a
r
k
e
t
s
D
a
y
2
0
1
4
Selected Industries growth
EVP Industries Norway, Anne-Cecilie Fagerlie and EVP EVRY Sweden, Niclas Ekblad
4
4
11 June 2014
Cloud services shares
Market size IT services (Nor+Swe)
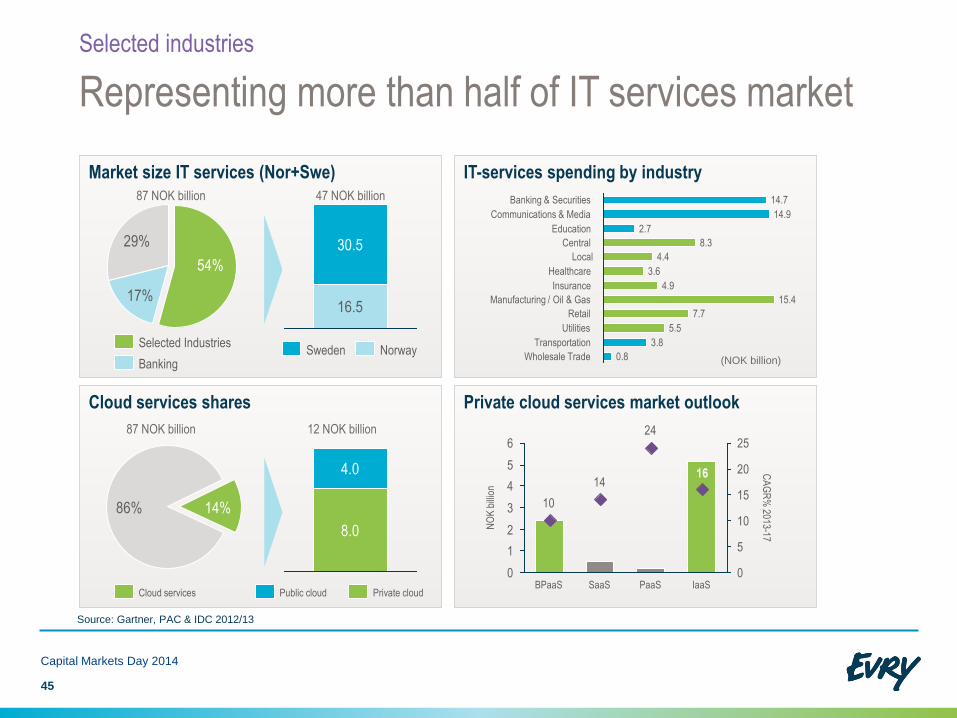
Representing more than half of IT services market
Selected industries
45
IT-services spending by industry
Private cloud services market outlook
30.5
16.5
29%
54%
17%
NorwaySweden
Local
Manufacturing / Oil & Gas 15.4
Retail
Insurance
3.6Healthcare
7.7
4.9
14.7Banking & Securities
4.4
Central 8.3
Education
Communications & Media 14.9
2.7
Transportation
5.5Utilities
0.8
3.8
Wholesale TradeBanking
Selected Industries
87 NOK billion
(NOK billion)
47 NOK billion
8.0
4.0
86% 14%
Private cloudPublic cloudCloud services
87 NOK billion 12 NOK billion 24
14
10
16
0
5
10
15
20
25
2
3
4
5
6
1
0
NO
K b
illio
n
CA
GR
% 2013
-17
PaaS IaaSSaaSBPaaS
Source: Gartner, PAC & IDC 2012/13
Capital Markets Day 2014
46
Capital Markets Day 2014
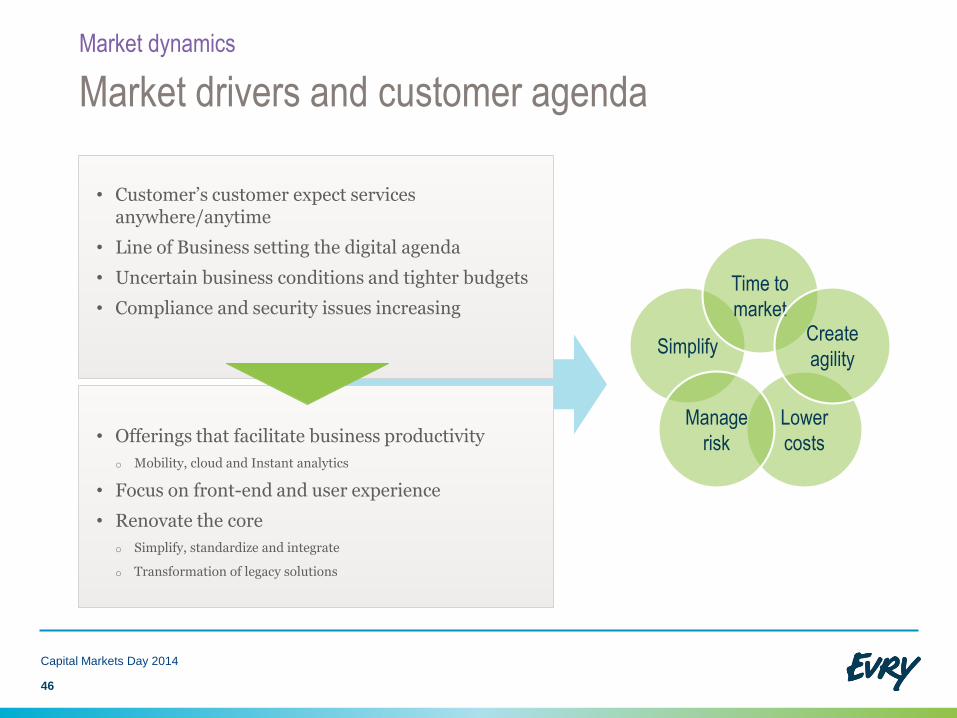
Market drivers and customer agenda
Market dynamics
Simplify
Time to
market
Lower
costs
Manage
risk
Create
agility
• Customer’s customer expect services anywhere/anytime
• Line of Business setting the digital agenda
• Uncertain business conditions and tighter budgets
• Compliance and security issues increasing
• Offerings that facilitate business productivity
o Mobility, cloud and Instant analytics
• Focus on front-end and user experience
• Renovate the core
o Simplify, standardize and integrate
o Transformation of legacy solutions

47
Capital Markets Day 2014
Broad portfolio of offerings and customers
EVRY capabilities
Market shares
Revenue mix Revenue distribution*
Selected customers
25%
14%
36%
25%Infrastructure services
Application Services
Sector solutions
Consulting
Trade & Industry
Oil & Gas
Insurance
Health
Local Gvmt
Central Gvmt
Telecom
Logistic
Retail & Utility
0
5
10
30
35
CS
CB
ouvetT
ieto
CG
I
Steria
Capgem
iniA
ccentureIB
M
EV
RY
TeleC
omp.
0
2
4
6
8
10
12
Sigm
a
EV
RY
Tieto
IBM
CG
I
Know
IT
Capgem
ini
eWork
ZeroC
haos
HP
Norway Sweden
*) Bank & Finance not included
Source: IDC (Nordic Outsourcing and Project Services markets)

Strategies for growth
Established positions
Different strategies exploring attractive opportunities
EVRY capabilities
48
Capital Markets Day 2014
Mature solutions
portfolio,
+300 customers
Core solutions
and domain
expertise
Comprehensive
engagements and
customer insight
Consulting & Services
Operations
Solutions
86%
14%
Outsourced
Increase
IT services
Central govmt
Expand and
cross-sellSol. Sol.
Take footholds
with strategic
consulting
Invest in clinical
suite across
Nordics
Sol.Partnerships for
core solutions
Cons.Develop domain &
process skills
Cons.Renovate and
transformOper.
Public sector InsuranceHealthcare
Source: Radar

Bilde
49
Capital Markets Day 2014
Case studies
EVRY capabilities
«Paperless, flexible, stable,
safe, secure, effective.
70% share of volumes and
increasing»
«EVRY is a strategic partner for
our 2014-17 IT investment
plan»
Providing a realtime
solution to monitor user
experiences on the net
«A decisive step to offer the
best net-shopping experience in
our industry»
Comprehensive
engagements operating
and managing core
systems
Streamlining and secure
the processes related to
prescriptions

Recent achievements
• Organisation aligned for enforced customer focus
• Double digit growth in Healthcare
• Key customer engagements reconfirmed
• Recruited top industry experts in key positions
• Launched Oil & Gas vertical
Roadmap 2016 priorities
• Healthcare Nordic expansion
• Positioning for Public sector sourcing engagements
• Oil & Gas targeted approach
• Retail targeted approach with Financial Services
50
Capital Markets Day 2014
Taking a position in selected industries
EVRY priorities and ambitions
Recognised leader with revenue
growth above market
Differentiated EVRY capabilities
Full service
portfolio with
lifecycle
commitment
We know the
challenges
and
opportunities
facing Nordic
CIO’s
Skills and
methods to
drive trans-
formation
EVRY portfolio of clients and offerings
Shaping trends

Healthcare growth
EVRY
C
a
p
i
t
a
l
M
a
r
k
e
t
s
D
a
y
2
0
1
4
5
1

IT spending profileMarket size Total IT spending
Healthcare – a large and dynamic regional market
Selected industries growth
Personal
health
Tech trendsMobility, Internet of things
Productivity+ compliance & security
Cost pressure10% GDP
Common set
of challenges
and priorities
cross Nordic
National eHealthinitiatives
System
Consolidation
37%
22% 21%
20%
20 NOK billion
14%
30%36%
38%35%
22% 15%
10%Healthcare Government
Internal IT spend
HW/SW
Outsourcing
Projects
Sweden
Norway
Finland
Denmark
Capital Markets Day 2014
Source: Gartner, Radar and EVRY Internal analysis
52

53
Capital Markets Day 2014
Strong growth…
Metavision
High end
solution
“E-resept”Only private
alternative
Norway
…delivering critical solutions to society
450 MNOK2013
+18% growth2013/2012
Administrative
Personal healthClinical
Managed services
ORBIT
50,000
users
“Journalen
på nätet”
Clinic
solution
suite
Sweden
Selected industries growth
EVRY health care capabilities and performance

54
Capital Markets Day 2014
Aging population/health spend affecting
Nordic health strategy…
Selected industries growth
E-health opportunities for EVRYChallenges
Cost reductions / “Warm hands”
• Outourcing
• Standardized systems & processes
New health care services & settings
• Based on BIG DataNordics in 2030 will have almost as large a percent of people over 65 as Japan has today.
Delivering service experiences
• Personal health services
• New services based on CRM, BI, mobility etc
Satisfied customers cost less to serve
• Designed memorable serviceSteady increased number of health alternatives – from patient to customer

• Ability to grow in an immature outsourcing market and need for growth in Cloud services
• Solutions driven by standardized processes and consolidation
• Clinical suite consisting of own IPR and partnerships aligned for growth cross Nordic
• Vast volumes of stored data to be transformed to knowledge
55
Strong market trends in Healthcare support ambitious target
Selected industries growth
0
100
500
400
200
300
600
Clinical solutionsManaged services Administrative
solutions
2016
MNOK
Capital Markets Day 2014

C
a
p
i
t
a
l
M
a
r
k
e
t
s
D
a
y
2
0
1
4
Summary
5
6

0
100
200
300
400
500
600
700
• Market growth in attractive industriesdrive demand for IT services
• Mobility key enabler for customers to grow business
• Future Proof address customer’simperative need for transformation to next generation managed services
• Implementation of Business Lines cater for increased cross-sales
57
Capital Markets Day 2014
Growth initiatives contribution to segments
Selected industries ambitions and summary
Oil & GasHealthcare Public sector 2016
Ambition
MNOK
50%50%
Norway
Sweden
C
a
p
i
t
a
l
M
a
r
k
e
t
s
D
a
y
2
0
1
4
SME Regions growth
EVP Regions Norway, Kurt Helland
5
8
11 June 2014
Market size IT services (Nor+Swe)
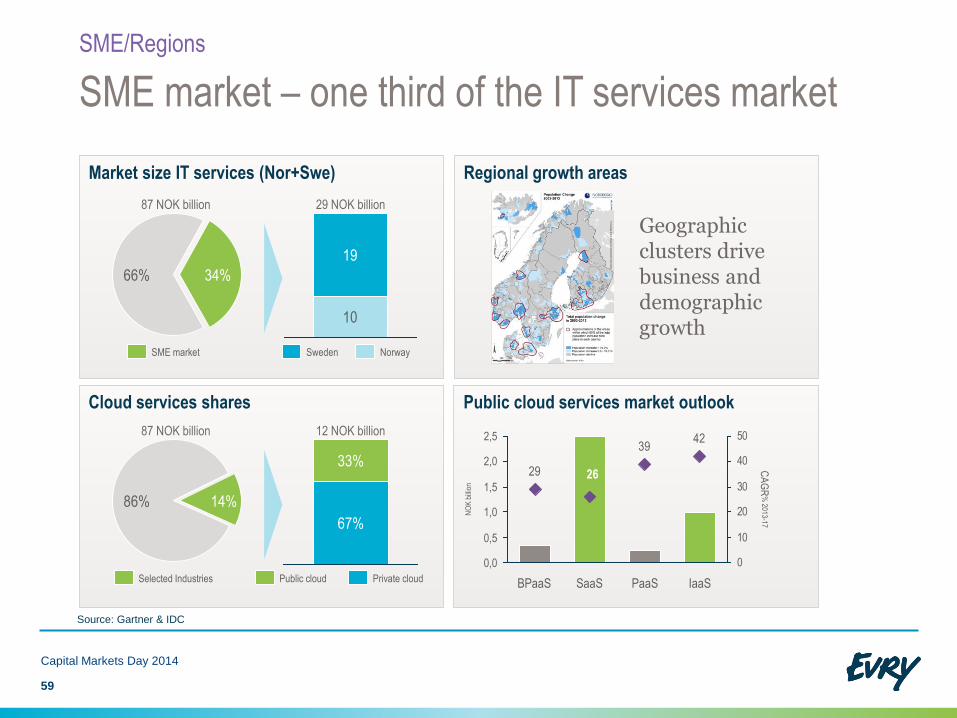
SME market – one third of the IT services market
SME/Regions
59
Capital Markets Day 2014
Regional growth areas
19
10
66% 34%
NorwaySwedenSME market
87 NOK billion 29 NOK billion
Cloud services shares Public cloud services market outlook
67%
33%
14%86%
Public cloud Private cloudSelected Industries
87 NOK billion 12 NOK billion
Geographicclusters drive business and demographicgrowth
Source: Gartner & IDC
4239
29 26
0
10
20
30
40
50
0,0
0,5
2,0
1,0
1,5
2,5
PaaSSaaS IaaSBPaaS
NO
K b
illio
n
CA
GR
% 2013-17

• More for less
• Packaged services supporting business
• Single point of contact
60
Capital Markets Day 2014
Market drivers and customer agenda
Market dynamics Regional market
• Standardized, optimized and dynamic offerings
• Business value
• Line of business own an increased share of total IT spend
Local
footprint
Business
PortfolioOne voice
Revenue mix New offerings
Market share & competition* Market share & competition*
61
Capital Markets Day 2014
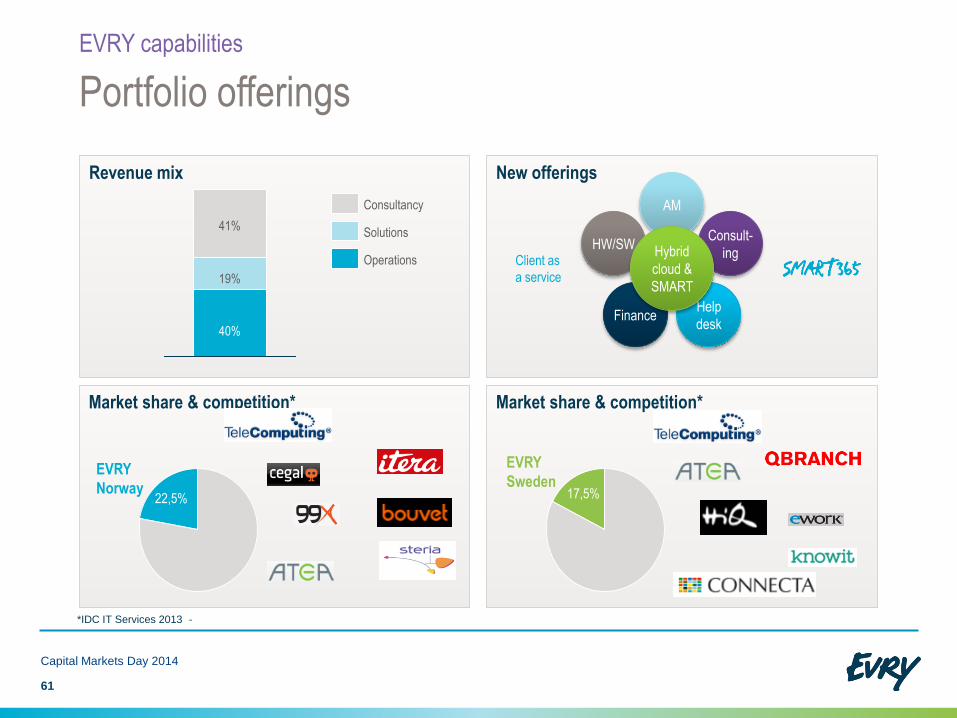
Portfolio offerings
EVRY capabilities
17,5%
40%
19%
41%Solutions
Consultancy
Operations
22,5%
EVRY
Norway
EVRY
Sweden
*IDC IT Services 2013 -
Client as
a service
AM
Finance
HW/SW
Help
desk
Consult-
ingHybrid
cloud &
SMART

Market opportunities includes 4,000 customers
White space
Exploiting the broad portfolio of solutions and customers
EVRY capabilities
62
Capital Markets Day 2014
Packaged offerings Cross & up-selling
• NEW Packaged services will be able to address a potential of 4,000 existing customers
• Untapped potential addressing NEW customers
• High hit rate within existing customer base
• High customer satisfaction and good reference base.
60%
15%
25%
40%
85%
75%
Consulting
Solutions
Operations

Bilde
63
Capital Markets Day 2014
Case studies
EVRY capabilities
“EVRY is supporting our
continued growth in
many markets”
“EVRY is handling operation
of our IT services with high
predictability of client services
and costs”
Develop IT-solution to
stream line work
process in services.
Enable customers to be
connected - as a single point
of contact for all clients
Increase control and
steering with quick
payback for corporate
finance
“We expect EVRY to
reduce the invoicing time
on standard service jobs
by an automated flow ”

Recent achievements
• Strong pipeline development
• Business line development
• Strong presence in the cloud service market
• Winning large deals based on one stop shopping
Roadmap 2016 priorities
• Develop packaged services based on cloud principles/next generation services
• Implement business lines across Nordics, build structural capital
• Single point of contact
• Outsourcing leadership
64
Capital Markets Day 2014
Enforcing unique positions
EVRY priorities and ambitions
Regional champion
Differentiated EVRY capabilities
Unique local
presence
and
customer
base
One stop
shopping
Life cycle
commitment
EVRY portfolio of clients and offerings
Shaping trends
Business lines

C
a
p
i
t
a
l
M
a
r
k
e
t
s
D
a
y
2
0
1
4
Business lines growth
6
5
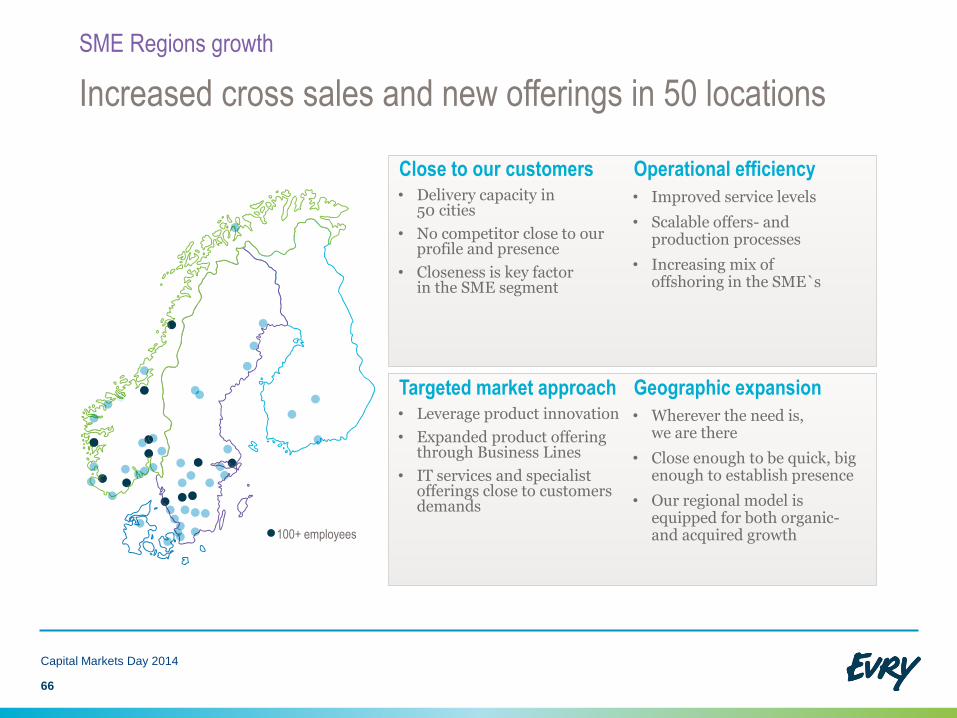
Increased cross sales and new offerings in 50 locations
66
Close to our customers• Delivery capacity in
50 cities
• No competitor close to our profile and presence
• Closeness is key factor in the SME segment
Operational efficiency
• Improved service levels
• Scalable offers- andproduction processes
• Increasing mix of offshoring in the SME`s
Targeted market approach• Leverage product innovation
• Expanded product offering through Business Lines
• IT services and specialist offerings close to customers demands
Geographic expansion
• Wherever the need is, we are there
• Close enough to be quick, big enough to establish presence
• Our regional model is equipped for both organic-and acquired growth
SME Regions growth
Capital Markets Day 2014
100+ employees

67
Capital Markets Day 2014
Growing from the core – stretching into adjacencies
SME Regions growth
A B C D
Geography Geography Geography Geography
Dedicated resources in customer channel
Sal
es &
cus
tom
er d
evel
opm
ent
Line organization (channel) Business lines
Business Line & Network
Mobility
Collaboration
Business Management
Operations/Cloud
IT/Infrastructure
Application Management
Building
structural
capital

68
Capital Markets Day 2014
Business Lines value propositions
SME Regions growth
E-Commerce IT-operations/
Cloud/PaaS - SME
Mobility
• We transform business by combining
digital expertise, business sense
and customer insight
• A secure and self serviced
IT platform for the future.
• Transforming business combining
connectivity, efficiency, intelligence
and innovation.
Application management/SaaS
• AM together with our operation and
cloud services gives our customers a
possibility to focus fully on their own
needs with 100 % IT back up.
Business
Intelligence
• By using our deep knowledge about
both BIG and small data we combine
our business knowledge and
business intelligence to help out
customers to predict the future
IT Infrastructure
• Companies often has a legacy in IT-
infrastucture we specialize in helping
them get rid of the legacy and focus
on their own business.

• Cloud & Operations growth platform for new packaged services.
• Mobility high growth based on capabilities and market expectations
69
Capital Markets Day 2014
Growth ambitions with Business lines
SME Regions growth
0
50
100
150
200
250
300
350
Collaboration Business
management
Mobility IT Infra-
structure
Application
Management
Operations
/ Cloud
2016
Ambition
MNOK
70
Capital Markets Day 2014
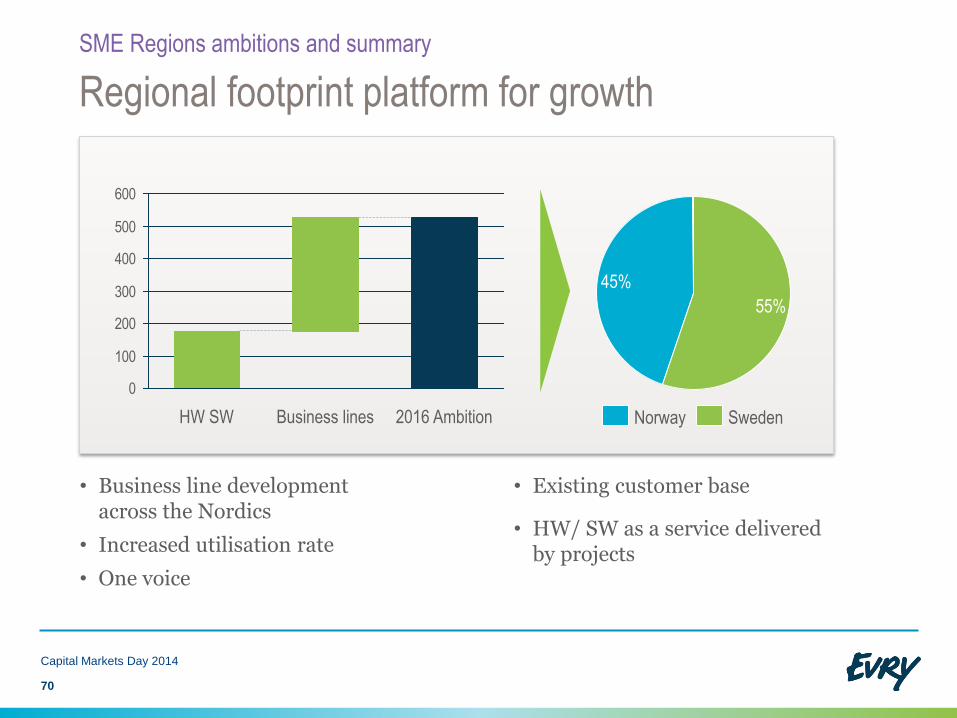
Regional footprint platform for growth
SME Regions ambitions and summary
• Business line development across the Nordics
• Increased utilisation rate
• One voice
• Existing customer base
• HW/ SW as a service delivered by projects
0
100
200
300
400
500
600
HW SW 2016 AmbitionBusiness lines
45%
55%
SwedenNorway

C
a
p
i
t
a
l
M
a
r
k
e
t
s
D
a
y
2
0
1
4
Managed services growth
SVP Future Proof, Lars Ringvold and SVP EVRY Mobility, Robin Blomquist
7
1
11 June 2014
Management
72
Capital Markets Day 2014
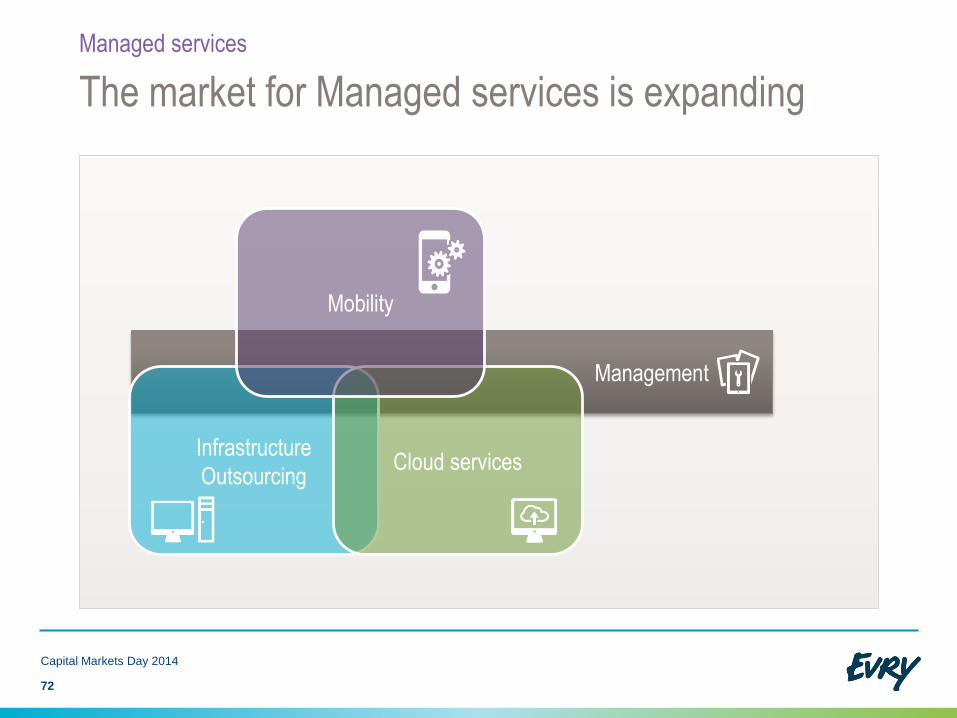
The market for Managed services is expanding
Managed services
Infrastructure
OutsourcingCloud services
Mobility

Transforming EVRY and the operations offerings
Managed services
73
Capital Markets Day 2014
2013 2014 2016
Applications
Operation
LegacyDedi-cated
Private Cloud
Public Cloud

Cloud services distribution
Market size IT services (Nor+Swe)
Addressing more than half of the IT services market
Managed services
74
Capital Markets Day 2014
Size & growth rates sub-segments
Sourcing in Nordic
19
31
58%
42%
NorwaySwedenOutsourcing services
87 NOK billion 50 NOK billion
1,5
10
0
5
10
15
20
25
30
0
5
10
35
40
45
NO
K b
illio
n
Managed
mobile
Managed
cloud
Traditional
outsourcing
CA
GR
% 2013-17
35%
50%
15%
In-houseMixed modelOutsourced
51%
27%
13%
Sourcing plans 2014Current sourcing
8.0
4.0
14%86%
Public cloud Private cloudCloud services
87 NOK billion 12 NOK billion
Source: Gartner, PAC & IDC
75
Capital Markets Day 2014
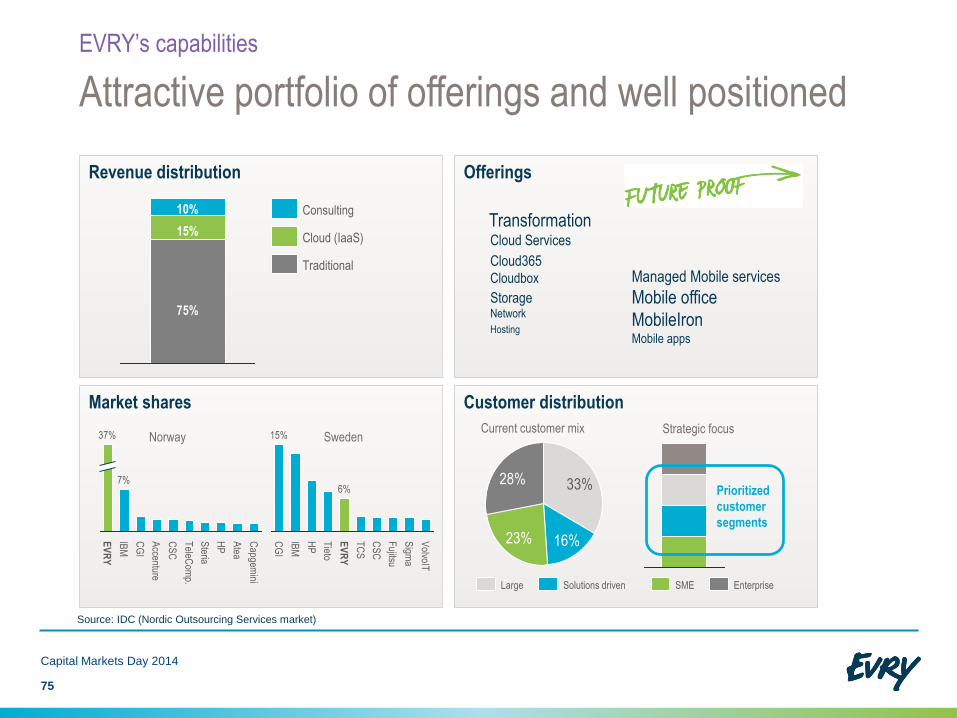
Attractive portfolio of offerings and well positioned
EVRY’s capabilities
Market shares
Revenue distribution Offerings
Customer distribution
10%
75%
15%
Traditional
Cloud (IaaS)
Consulting
37%
7%
Steria
HP
EV
RY
Atea
CS
C
CG
I
IBM
TeleC
omp.
Accenture
Capgem
ini
CG
I
IBM
TC
S
Fujitsu
Tieto
VolvoIT
15%
EV
RY
HP
Sigm
a
CS
C
6%
Cloud365
Cloud Services
Managed Mobile services
Mobile office
MobileIronMobile apps
Cloudbox
Transformation
Norway Sweden
16%
28%
23%
33%
EnterpriseSMESolutions drivenLarge
Hosting
StorageNetwork
Prioritized
customer
segments
Current customer mix Strategic focus
Source: IDC (Nordic Outsourcing Services market)

Bilde Bilde Bilde
76
Capital Markets Day 2014
Case studies
EVRY’s capabilities
Using IaaS and PaaS to maintain
better control and reduced costA mobile office that increase
the resources efficiency and
quality of work
A secure and self serviced
IT platform for the future
Transformation and
update of business
critical systems
and services
Mobile and hybrid
client with PC and
tablet functionality
Managed
infrastructure
flexibility, from
legacy to cloud

Business model is evolving
Potential in top end of prioritised segment
Increasing EVRY’s value creation
Evolution and opportunities
77
Capital Markets Day 2014
Legacy
infra-
structure
operation
Consulting
“Commodity” pricing
T&M pricing
Customer
dedicated
Legacy
Consulting
projects
Cloud
services
Value pricing
Customer specific pricing
Pay pr use pricing
76%
16%
24%
84%
Norway Sweden
Share top 50*
PotentialNew
customers
New
business
Potential for all
services
Future Proof
Transformation
Managed mobility
*) Largest customers in prioritized segment (Global Enterprises excluded)
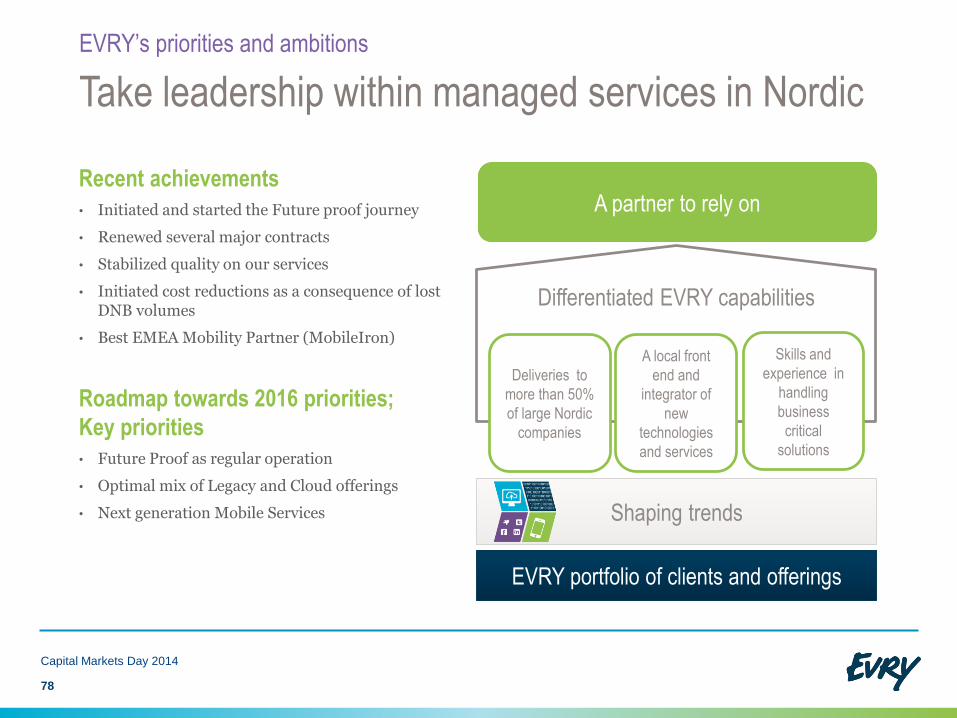
Recent achievements
• Initiated and started the Future proof journey
• Renewed several major contracts
• Stabilized quality on our services
• Initiated cost reductions as a consequence of lost DNB volumes
• Best EMEA Mobility Partner (MobileIron)
Roadmap towards 2016 priorities;
Key priorities
• Future Proof as regular operation
• Optimal mix of Legacy and Cloud offerings
• Next generation Mobile Services
78
Capital Markets Day 2014
Take leadership within managed services in Nordic
EVRY’s priorities and ambitions
A partner to rely on
Differentiated EVRY capabilities
Deliveries to
more than 50%
of large Nordic
companies
A local front
end and
integrator of
new
technologies
and services
Skills and
experience in
handling
business
critical
solutions
EVRY portfolio of clients and offerings
Shaping trends

C
a
p
i
t
a
l
M
a
r
k
e
t
s
D
a
y
2
0
1
4
Future Proof growth
Managed services
7
9

Going to market with standardized suite of services
• Agile and ScalablePlatform
• Productive CollaborationWorkspace
• Compliance and Risk MitigationSecurity
• Modernize and IntegrateTransformation
In partnerships with:
Future Proof program
Capital Markets Day 2014
80
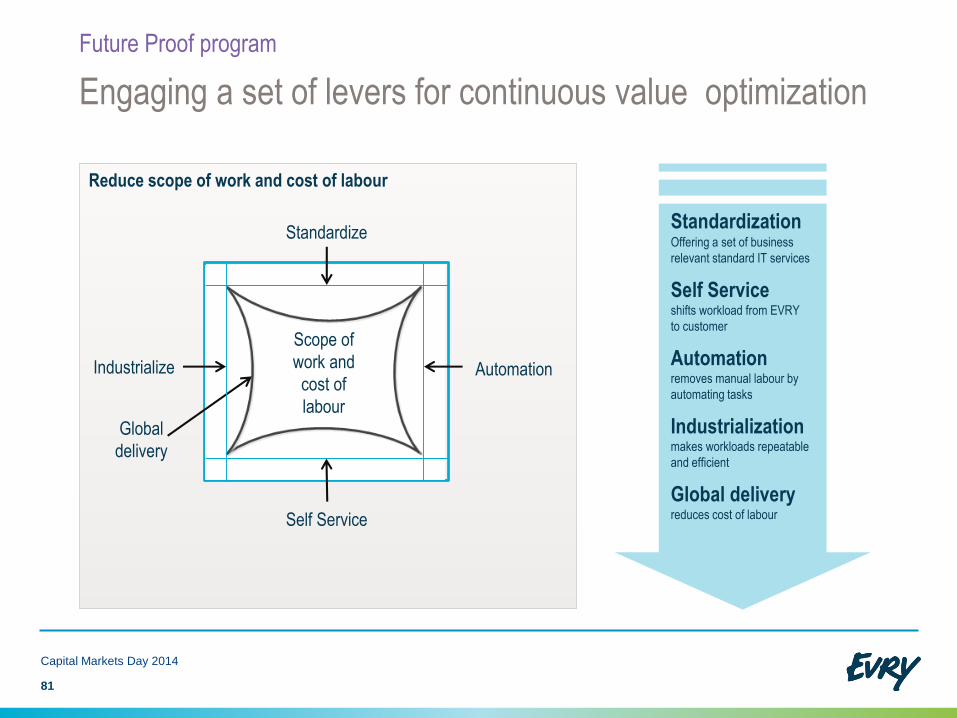
Reduce scope of work and cost of labour
Engaging a set of levers for continuous value optimization
Future Proof program
81
Capital Markets Day 2014
StandardizationOffering a set of business
relevant standard IT services
Self Service shifts workload from EVRY
to customer
Automation removes manual labour by
automating tasks
Industrialization makes workloads repeatable
and efficient
Global deliveryreduces cost of labourSelf Service
Standardize
Industrialize Automation
Scope of
work and
cost of
labour
Global
delivery
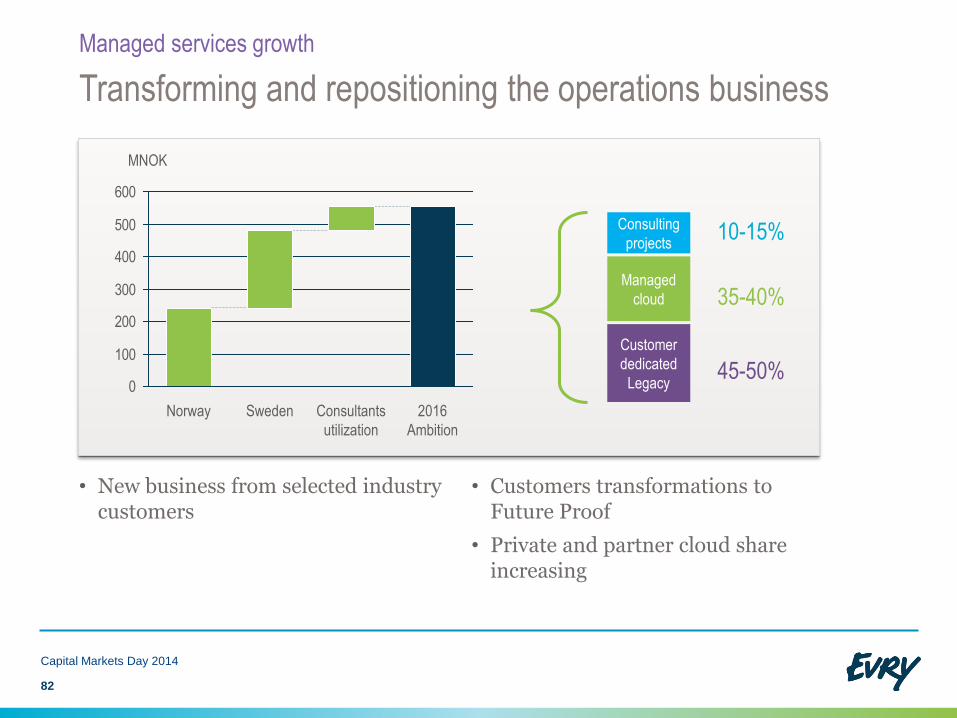
• New business from selected industry customers
• Customers transformations to Future Proof
• Private and partner cloud share increasing
82
Transforming and repositioning the operations business
Managed services growth
0
100
200
300
400
500
600
Sweden 2016
Ambition
MNOK
Norway Consultants
utilization
Customer
dedicated
Legacy
Consulting
projects
Managed
cloud
10-15%
35-40%
45-50%
Capital Markets Day 2014

Mobility growth
C
a
p
i
t
a
l
M
a
r
k
e
t
s
D
a
y
2
0
1
4
8
3

450+Mobile Apps
100K+Ticket resolved in
the last 12 months
400+Global Delivery
Mobility Developers
250+MDM
deployments
5K+
Devices
deployed
per month
400K+devicesdeployed
63%+projected sales
by 2016
Global
Capabilities
2011 – Partner of the year (EMEA)
2012 – Partner of the year (EMEA)
2013 – Partner of the year (EMEA)
2014 – Outstanding Engineer (EMEA)
2014 – Top Performance (EMEA)
2014 – EMEA Partner Awards – Excellence in Marketing
Best in
class
260+Local
Mobility Experts
EVRY Enterprise Mobility in the Nordics
Managed services growth
84
Capital Markets Day 2014
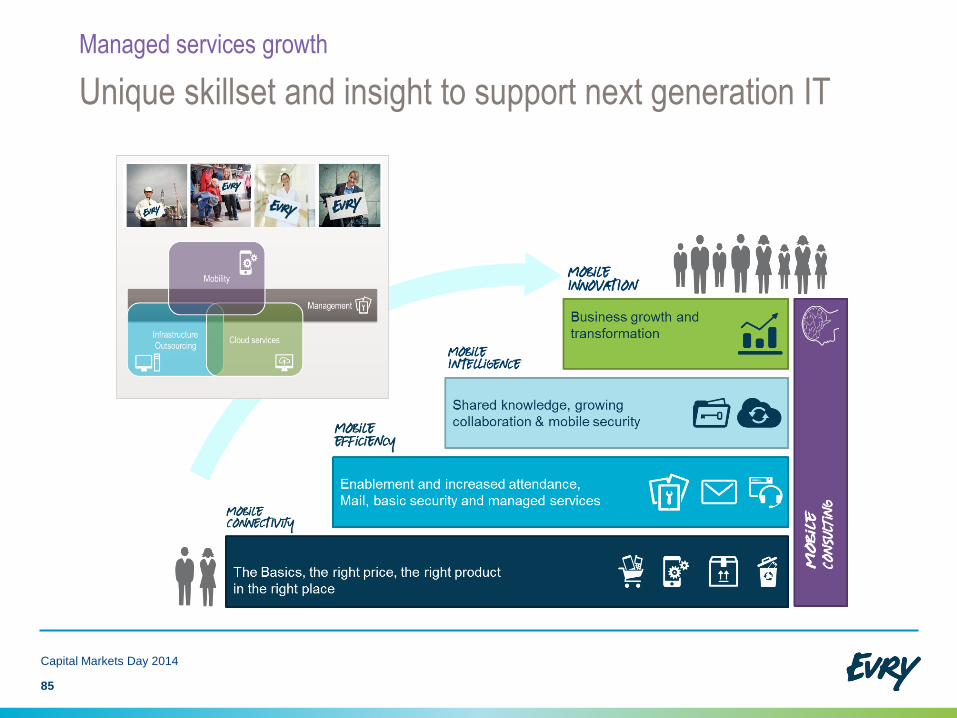
Unique skillset and insight to support next generation IT
85
Managed services growth
Capital Markets Day 2014

Mobile collaboration drive innovation
Managed services growth
Mobile App
Internet of Things
Managed Services
Mobility
One stop shop
Next Generation
IT
“If we wait with mobility, it’s a loss of opportunity,
we can never keep up with competition later on”
“Smart device solutions is a game changer”
Capital Markets Day 2014
86
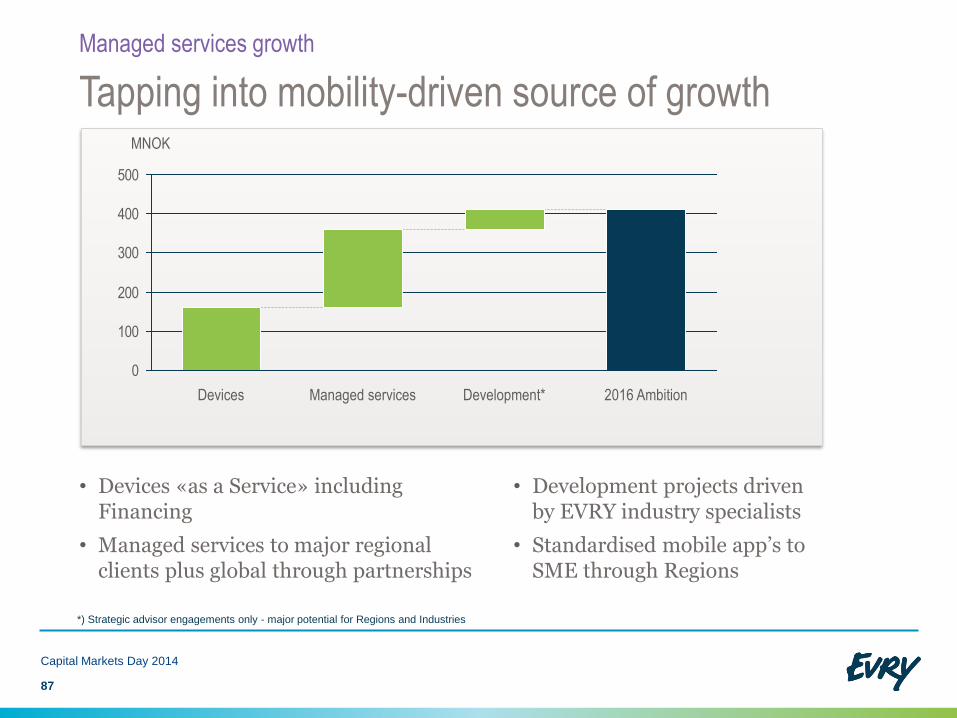
• Devices «as a Service» includingFinancing
• Managed services to major regional clients plus global through partnerships
• Development projects driven by EVRY industry specialists
• Standardised mobile app’s to SME through Regions
87
Capital Markets Day 2014
Tapping into mobility-driven source of growth
Managed services growth
*) Strategic advisor engagements only - major potential for Regions and Industries
0
100
200
300
400
500
2016 AmbitionDevelopment*Managed servicesDevices
MNOK
C
a
p
i
t
a
l
M
a
r
k
e
t
s
D
a
y
2
0
1
4
Summary
8
8
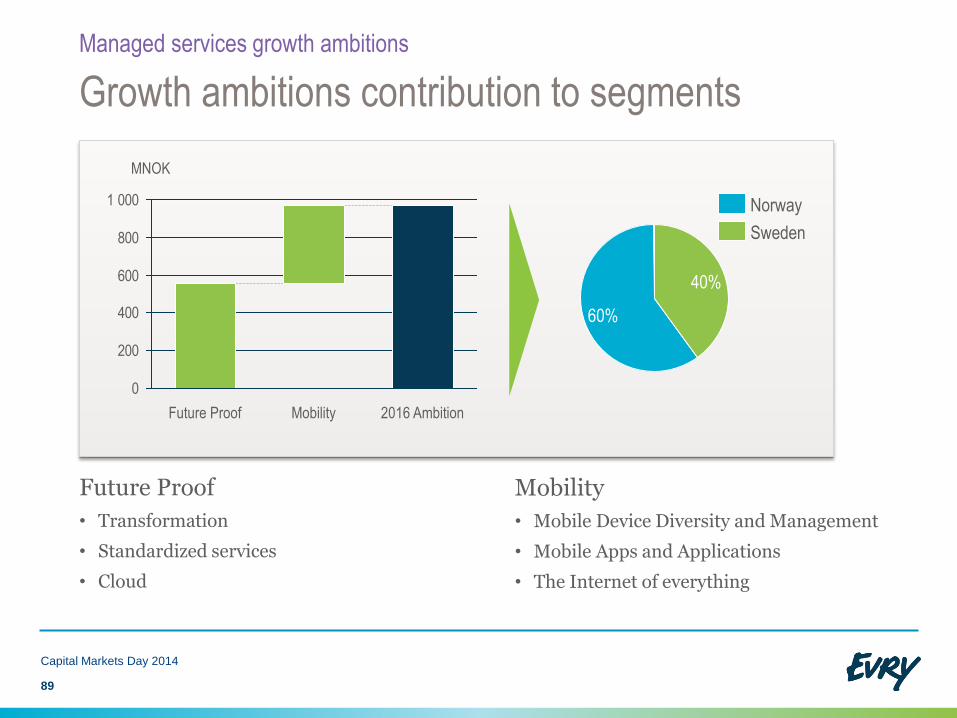
Future Proof
• Transformation
• Standardized services
• Cloud
Mobility
• Mobile Device Diversity and Management
• Mobile Apps and Applications
• The Internet of everything
89
Capital Markets Day 2014
Growth ambitions contribution to segments
Managed services growth ambitions
0
200
400
600
800
1 000
Future Proof 2016 AmbitionMobility
MNOK
60%
40%
Norway
Sweden

Financials & guiding
CEO Terje Mjøs and acting CFO Morten Frogner
11 June 2014
C
a
p
i
t
a
l
M
a
r
k
e
t
s
D
a
y
2
0
1
4
9
0

C
a
p
i
t
a
l
M
a
r
k
e
t
s
D
a
y
2
0
1
4
Next phase: Accelerate growth
9
1

Capital Markets Day 2014
Projected growth in the Nordic market for IT services
Revenue growth
IT services market growth
0
1
2
3
4
5
2010 2011 2012 2013 2014 2015 2016
Outsourcing services Project services
Driven primarily by next generation IT
• Volatile situation 2010 – 2013 affected by stalling global economy
• IT services growth tracking above GDP growth
• Higher spread (between analysts) for growth projections going forward, next generation IT growth less predictable
Source: Nordic IT Services Analysis IDC, May 2013
92
2-4%
CAGR

Initiatives drive topline growth
Capital Markets Day 2014
EVRY has ambitious targets driven by growth initiatives
Revenue growth
2013 adjusted
baseline*
2016 TargetBase revenue
growth
Managed
Services
Financial
Services
Selected
Industries
Regions SME
Above market growth
• Global
sourcing
• Other
businesses
• Future
Proof
• Mobility
• Next
generation
Core and
Payment
solutions
• Nordic
expansion
• Card
services
• Targeting
industries
• Cross
selling
• Packaged
services
• Building
structural
capital
Key drivers
12.5
11.5
13.0
12.0
11.0
DNB
2013
NOK billion
*) Baseline adjusted for lost DNB revenues
93

C
a
p
i
t
a
l
M
a
r
k
e
t
s
D
a
y
2
0
1
4
Profitability improvement continues
9
4

Capital Markets Day 2014
Lifting margins to the next level
Improving profitability
Historic EBITA
Improvements from
strong cost discipline
Baseline
EBITA margin
5,9%
Target
margin 2016
95
Future EBITA
Margin improvements facilitated by GROWTH
and continued cost discipline
GROW400
450
500
550
600
650
700
750
800
481
Q2
2011
753
+272MNOK
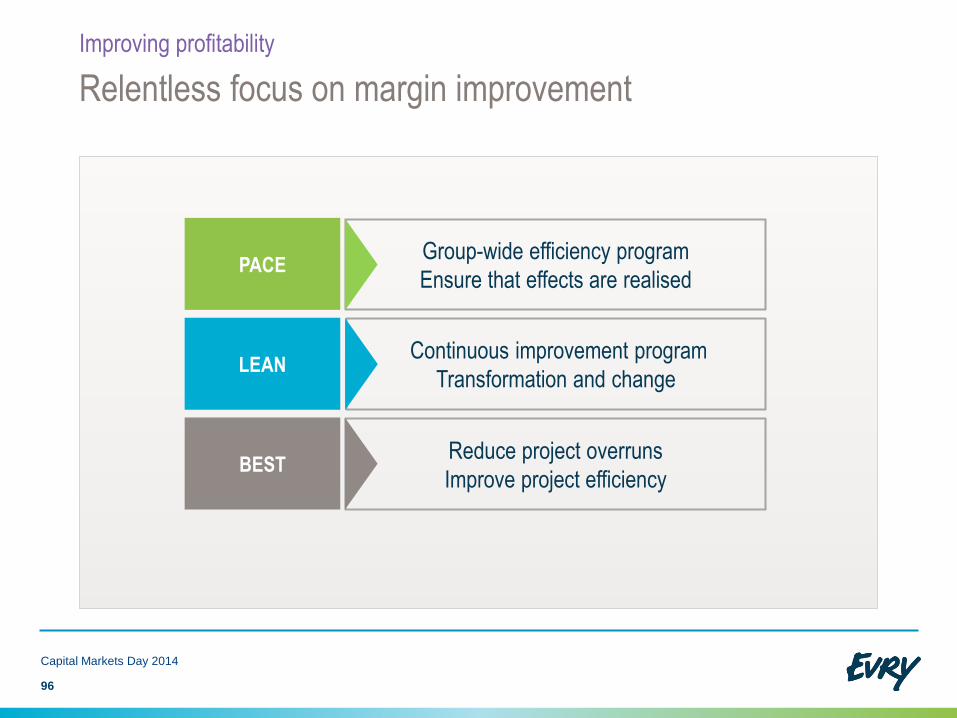
Relentless focus on margin improvement
Improving profitability
Group-wide efficiency program
Ensure that effects are realised
Reduce project overruns
Improve project efficiency
Continuous improvement program
Transformation and changeLEAN
PACE
BEST
96
Capital Markets Day 2014

Program approach
• Align projects and monitor interdependencies
• Ensure that effects are realised
Capital Markets Day 2014
PACE – Ensure corporate efficiency
Improving profitability
Program scope
• Restructuring to fit scope (DNB, Posten)
• Restructuring of low performing units
• Optimize banking value chain
• Industrialize and standardize operations – execute the cost side of Future Proof
• Streamlining staff and support functions
• Reduction of 400 FTEs in 2014/2015, restructuring costs of NOK 140 million(previously announced)
97
PACE
Capital Markets Day 2014
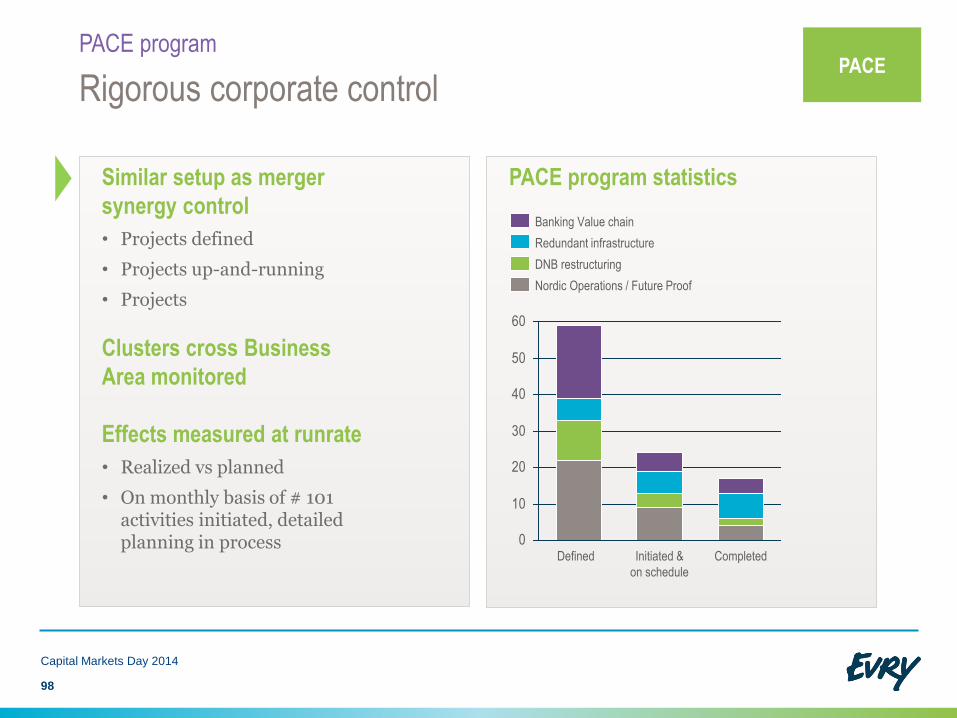
Rigorous corporate control
PACE program
PACE program statistics
0
10
20
30
40
50
60
Defined Initiated &
on schedule
Completed
DNB restructuring
Banking Value chain
Redundant infrastructure
Nordic Operations / Future Proof
98
Similar setup as merger
synergy control
• Projects defined
• Projects up-and-running
• Projects
Clusters cross Business
Area monitored
Effects measured at runrate
• Realized vs planned
• On monthly basis of # 101 activities initiated, detailed planning in process
PACE
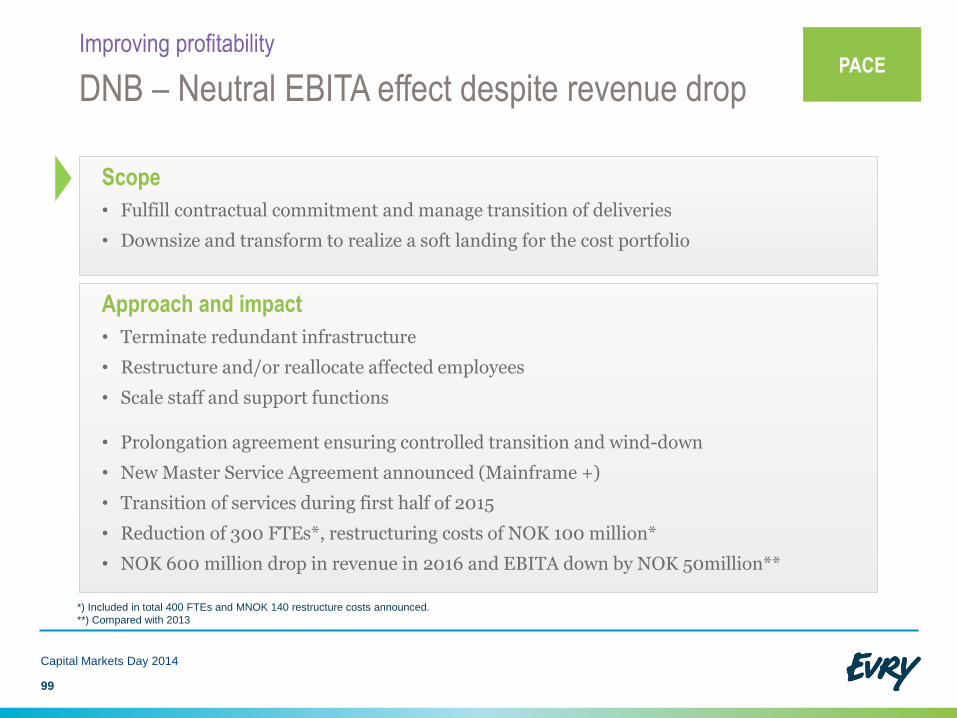
Scope
• Fulfill contractual commitment and manage transition of deliveries
• Downsize and transform to realize a soft landing for the cost portfolio
Approach and impact
• Terminate redundant infrastructure
• Restructure and/or reallocate affected employees
• Scale staff and support functions
• Prolongation agreement ensuring controlled transition and wind-down
• New Master Service Agreement announced (Mainframe +)
• Transition of services during first half of 2015
• Reduction of 300 FTEs*, restructuring costs of NOK 100 million*
• NOK 600 million drop in revenue in 2016 and EBITA down by NOK 50million**
DNB – Neutral EBITA effect despite revenue drop
Improving profitability
*) Included in total 400 FTEs and MNOK 140 restructure costs announced.
**) Compared with 2013
Capital Markets Day 2014
99
PACE

Future Proof Program scope
• Develop new portfolio of services
• Implement standardized production platforms
• Transition & transformation to upgraded platforms (services & customers)
Approach and effects
• SW consolidation and cost reduction from standardization
• Shut-down of obsolete infrastructure (HW/SW)
• Change of workforce
• Headcount reductions from greater use of automation and self service
• Increase offshore ratio for infrastructure operation, large customers, from 25% (2013) to 60% (2017)
• Reduce hired consultants with 100 FTEs
• Change of competencies
• Datacenter consolidation
Capital Markets Day 2014
Future Proof – Realize effects from industrialization
Improving profitability
100
PACE
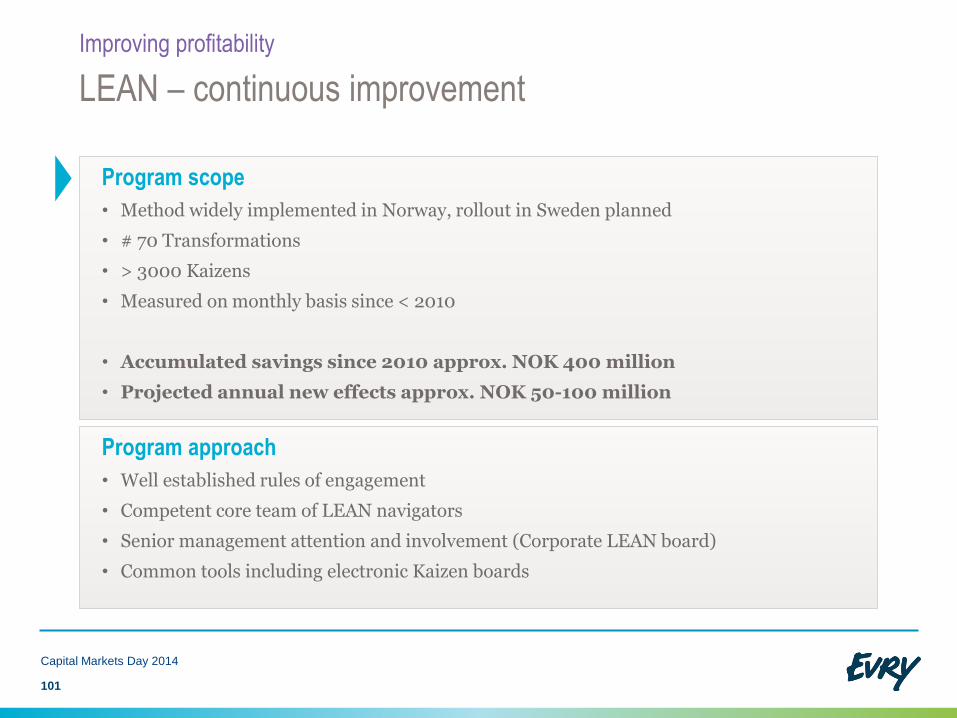
Program approach
• Well established rules of engagement
• Competent core team of LEAN navigators
• Senior management attention and involvement (Corporate LEAN board)
• Common tools including electronic Kaizen boards
Capital Markets Day 2014
LEAN – continuous improvement
Improving profitability
Program scope
• Method widely implemented in Norway, rollout in Sweden planned
• # 70 Transformations
• > 3000 Kaizens
• Measured on monthly basis since < 2010
• Accumulated savings since 2010 approx. NOK 400 million
• Projected annual new effects approx. NOK 50-100 million
101

Program approach
• Project Management Office (PMO) structure in Corporate and Business Areas
• Transparent reporting at all management levels
• Consistent KPI-measurements and monitoring
• Formal certification (PMI/P3M3)
• Common toolbox and methodologies
Capital Markets Day 2014
BEST – Reduce project overruns
Improving profitability
Program scope
• Corporate program since 2H 2013
• Leverage resources and competencies
• Streamline deliveries throughout the value chain from sales to production
• Portfolio of +140 large projects (NOK 1 – 1.4 billion)
• Reduce project overruns and improve efficiency in projects
102

8% EBITA margin target in 2016
5,9%
Target
margin 2016
Baseline
EBITA margin
> 8.0%
Future EBITA
Margin improvements facilitated by GROWTH
and continued cost discipline
Capital Markets Day 2014
Improving profitability
Other• Quality
cost
• Utilisation
BESTLEANPACEGROW
103
Historic EBITA
Improvements from
strong cost discipline
400
450
500
550
600
650
700
750
800
481
Q2
2011
753
+272MNOK

C
a
p
i
t
a
l
M
a
r
k
e
t
s
D
a
y
2
0
1
4
Value creation through
strong focus on cash flow
EVRY
1
0
4

Capital Markets Day 2014
Historic performance
Financials & guiding
Cash flow last four quarters*
EBITA last four quarters* Order backlog
Dividend per share
*) Comparable, restated figures
105
753749733714680685671690681663
555
481501
400
500
600
700
800
Q2
11
Q1
11
Q4
12
Q3
12
Q2
12
Q1
12
Q4
11
Q3
11
MNOK
Q1
14
Q4
13
Q3
13
Q2
13
Q1
13
10
12
14
16
18
Q3
13
MNOK
Q2
14
Q1
14
16,5
Q4
13
16,6
Q4
11
16,1
Q3
11
16,8
Q2
11
17,1
Q1
11
17,7
Q4
10
17,8
14,2
Q2
13
15,1
Q1
13
15,3
Q4
12
15,3
Q3
12
15,0
Q2
12
15,3
Q1
12
15,5
1 065
1 0991 049
1 011957
807721
801808
597
322250
375
200
400
600
800
1 000
1 200
MNOK
Q1
11
Q2
11
Q2
13
Q3
13
Q4
13
Q1
13
Q1
14
Q3
12
Q4
11
Q4
12
Q1
12
Q3
11
Q2
12
0,0
0,1
0,2
0,3
0,4
NOK
201420132012

375
250 322
597
808 801 721
807
957 1.011
1.049 1.099 1.065
328
160
(175)
97
204 156
86
207
366
461 469 405 409
0
1
2
3
4
5
6
7
Q3 11 Q4 12Q3 12Q4 11 Q1 14Q1 13 Q2 13Q1 12 Q4 13Q3 13Q2 12Q2 11Q1 11
Operational Cash Flow
Working Capital (% of rev)
Free Cash Flow
Capital Markets Day 2014
Managing cashflow pays off
MNOK
Cash flow focus
• Cash conversion improved• Working capital reductions realized• CAPEX discipline
• Future EBITDA increase, smaller increase in tax payable, will add to cash flow
106
% of revenue

C
a
p
i
t
a
l
M
a
r
k
e
t
s
D
a
y
2
0
1
4
Segment guiding
EVRY
1
0
7

Growth contribution from initiatives Corridor, status and target
• Nordic expansion for banking solutions
• Cost initiatives ensure soft landing from loss of DNB contract
• Investment in core banking and payment services builds a platform for further growth in banking from 2016
• Cards continue to deliver better than average margins and outperform market growth
Capital Markets Day 2014
Margin corridor of 9-12% maintained
EVRY Financial Services
108
2 000
2 200
2 400
2 600
2 800
3 000
3 200
3 400
3 600
Target 2016
(range)
CardBanking
MNOK
Adjusted
baseline
2013
8
9
10
11
12
13
EBITA%
2016
2013
9,2%

Growth contribution from initiatives
3 000
3 200
3 400
3 600
3 800
4 000
4 200
MNOK
Selected
industries
SME
Regions
Target
2016
(range)
Baseline
2013
Managed
Services
Corridor, status and target
Margin corridor of 8-10% maintained
EVRY Sweden
• Restructuring of low performing units has been initiated
• Better utilization rates and slight increase in hourly prices are expected
• Growth in high margin products and services through focus on business lines and cross selling
• Competitive mobility offer drives growth in managed services
Capital Markets Day 2014
109
6
7
8
9
10
11
EBITA%
2016
2013
6,4%

Growth contribution from initiatives Corridor, status and target
Capital Markets Day 2014
Margin corridor of 7-9% maintained
EVRY Norway
• Anticipated exit from non-core, high margin businesses will reduce margins to some extent
• Several comprehensive cost initiatives benefit this segment. The comprehensive program of work in the Future Proof program is expected to lower costs and secure new growth through increased competitiveness
• Increased profitability through operational efficiency, e.g. improvements in utilization rates
110
6 000
6 200
6 400
6 600
6 800
7 000
7 200
7 400
MNOK
SME
Regions
Managed
Services
Selected
industries
Baseline
2013
Target
2016
(range) 5
6
7
8
9
10
EBITA%
2013
5,5%
2016

Managing CAPEX in line with guidance
0
1
2
3
4
5
6
0
200
400
600
800
Capital Markets Day 2014
CAPEX within target corridor
Finance & guiding
Managing CAPEX in line with guidance
• Presently CAPEX is at the higher end of the target corridor, mainly driven by investments related to Future Proof
• Software developed in-house will increase due to core banking renewal and payment projects, and will keep investments above the mid range also in 2015
• High growth units driving investment spending
• Sale of non-core assets will reduce net CAPEX in the short term
20122011
% of revenueMNOK
20162013 Q1
2014
Percentage
Ordinary capex
Own developed software
Target
corridor
111

Capital Markets Day 2014
Key ratios and sensitivities
Financials & guiding
Hourly rates
Target:
Slight yearly increase in hourly ratesSensitivity:
NOK 30 million/year for every NOK 10 per hour
Offshore ratio in Future Proof program
Target:
60% offshore ratio in 2017, up from 25%Sensitivity:
Savings per 100 FTEs exceed NOK 50 million
Utilisation rates
Target:
2-4 percentage point improvementSensitivity:
EBITA effect of NOK 40 million/year for every percentage point
Working days
Sensitivity:
Norway: NOK 7 million/daySweden: NOK 6 million/day
112
*) Within infrastructure operations large customers

Capital Markets Day 2014
Value creation and financial flexibility
Financial & guiding
• Increased EBITA through growth and cost control
• Investment level within corridor
• Further improvement in working capital
Targets
PolicyStrengthened financial position
Dividend
Equity ratio > 40 %
Gearing ratio < 2,0
Dividend 20-50%
Growth Debt reduction
113

C
a
p
i
t
a
l
M
a
r
k
e
t
s
D
a
y
2
0
1
4
Summary
1
1
4

Ready and able to grow
• Ready for next phase – Growth- Key Projects in strategic areas established
• Continued focus on Cost competitiveness- Corporate Programs up & running
• IT market expected to grow faster than GDP- 2-4% CAGR
Targets• Grow more than the market*
• Deliver EBITA margin > 8% in 2016
Financials & guiding
115
Capital Markets Day 2014
*) Baseline adjusted for DNB

C
a
p
i
t
a
l
M
a
r
k
e
t
s
D
a
y
2
0
1
4
1
1
6
Top Related