


![[Osman bakar] classification_of_knowledge_in_islam](https://static.fdocuments.in/doc/165x107/58f308c11a28ab89718b4591/osman-bakar-classificationofknowledgeinislam.jpg)


Languages
Pages
Legal


1
Sustainable Livelihood approach for assessing community’s resilience to climate variability and
change /A case study from Sudan
ByDr.Balgis Osman ElashaPI AIACC-AF 14 ProjectThe Higher Council for Environment & Natural Resources (HCENR) Sudan & Stockholm Environment Institute – Boston Center (SEI_B)
Second International Conference
on Climate
Impacts Assessment (SICCIA)
June 28-July 2, 2004Grainau, Germany
2
Overview
Why SL? Sustainable livelihood (SL)
– conceptual framework– Basic definitions – SL assessment– Connection to adaptation
SL and Environmental management measures An example from Sudan case studies conducted by
AIACC –AF14 project.

3
Why talk about Sustainable Livelihoods?
Urgent adaptation needs of most vulnerable groups
Existence of local coping strategies
Hard-won lessons from other (non-climate) disciplines (e.g. disaster mitigation, natural resource management)
No-regrets options Lack of connection between
community needs and the policy process

4
Basic Definitions
2. Sustainable Livelihood The Brundtland Commission in 1987:Intrdoduced SL
in terms of resources ownership, access to basic needs and livelihood security
The IISD: “SL concerned with people's capacities to generate & maintain their means of living, enhance their well- being, and that of future generations.
The definition used by the UK's (DFID): A livelihood comprises the capabilities, assets & activities required for a means of living .
1.Livelihoods are the ways people make a living, including how they distribute their productive resources and the types of activities in which they are engaged

5
Basic definitions (Cont.):
Resilience – The capacity of a population to adapt to environmental change such as extreme climatic events and climate variability.
Adaptation: is the ability to respond and adjust to actual or potential impacts of changing climate conditions in ways that moderates harm or takes advantage of positive opportunities
Coping Strategies – The short-term responses to periodic stress, such as the use of famine foods in drought.
Adaptive Strategies –Strategies that require people to reorganize their livelihood systems in response to long-term changes and challenges.
Security: The state of a community that can provide safeguards for itself against social, economic and environmental change
6
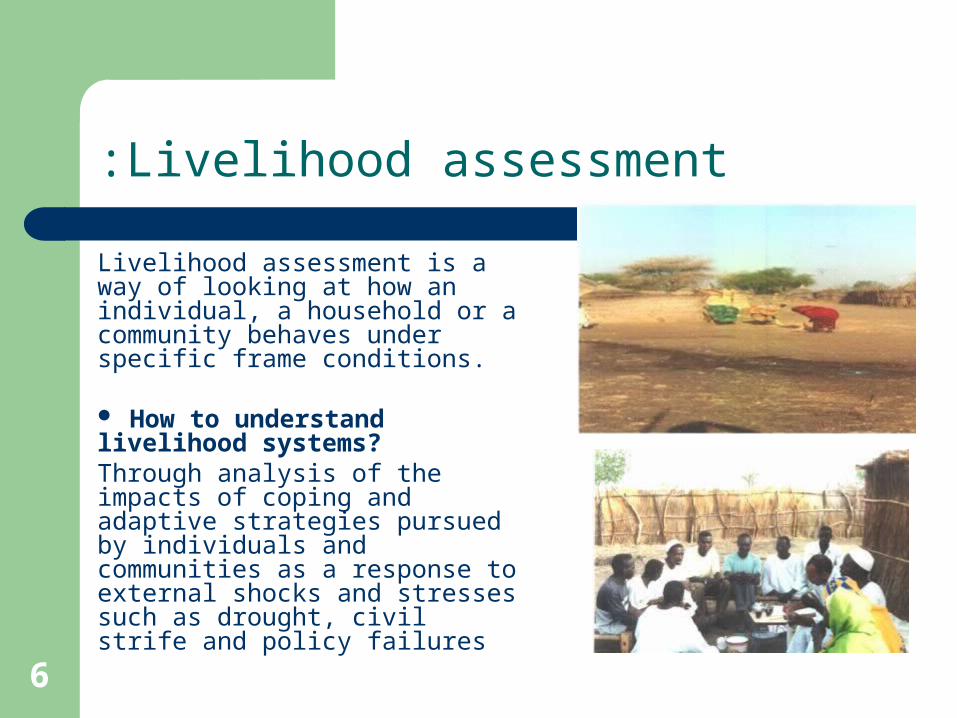
Livelihood assessment:
Livelihood assessment is a way of looking at how an individual, a household or a community behaves under specific frame conditions.
How to understand livelihood systems?Through analysis of the impacts of coping and adaptive strategies pursued by individuals and communities as a response to external shocks and stresses such as drought, civil strife and policy failures

7
Connection to Adaptation-How?
The SL approach helps researchers to: Focus on most vulnerable people Assess their vulnerabilities and strengths Tap existing knowledge & ongoing efforts to
determine what works Enable community-driven strategies and actions;
ensure buy-in and longevity Ultimately… fortify against future climate-related
shocks

8
What types of measures are we considering?
SL/Environmental Management Measures (SL/EM): like rangelands management, micro-catchments restoration, soil management, etc., each of which involves an array of specific measures (e.g., water harvesting, intercropping, livestock diversification, windbreak construction, reforestation

9
Sudan’s Project:
Sudan AIACC Project “Environmental Strategies for Increasing Human Resilience in Sudan: Lessons for Climate Change Adaptation in North and East African”
Goal: to prove that certain SL/EM measures increase the resilience of
communities to climate related shocks establish that these measures are effective and should be
considered as climate change adaptation options that could be included in the planning of national adaptation strategies.
to explore what enables them to be effective – i.e., what factors (participatory implementation, local governance, macro-economic policies, etc.) made it possible for the measures to be successful

10
Case Studies were employed to explore example where local knowledge (e.g. traditional, indigenous autonomous and informal) and/ or external knowledge (formal, technical, directed) has been applied within a target community in the form of SL/NRM strategy to enable the community to cope with or adapt to climate–related stress. Each Case study will also provide an assessment of the local and national policies and conditions that support or inhibit the measures
How??

11
Sources of information:
community groups, local, regional and
international NGOs; government agencies; university departments
and; bilateral and multilateral
development agencies,
12
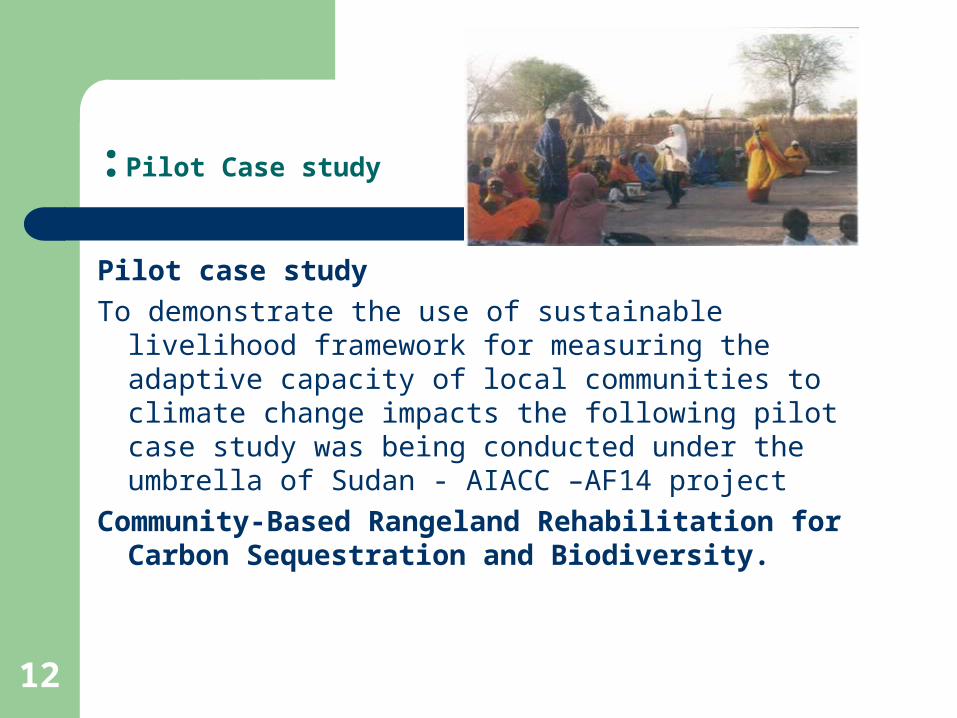
Pilot Case study:
Pilot case study
To demonstrate the use of sustainable livelihood framework for measuring the adaptive capacity of local communities to climate change impacts the following pilot case study was being conducted under the umbrella of Sudan - AIACC –AF14 project
Community-Based Rangeland Rehabilitation for Carbon Sequestration and Biodiversity.

13
Objectives:
Twofold:
a) to sequester carbon through the implementation of a sustainable, local-level natural resources management system that prevents degradation, rehabilitates or improves rangelands; and
b) to reduce the risks of production failure in a drought-prone area by providing alternatives for sustainable production, so that out-migration will decrease and population will stabilize”

14
Pilot CS Cont.
Context: Villages in the drought-prone area of Western Sudan
Approach: Community-Based Rangeland Rehabilitation
Key Actors: Villages within Gireigikh rural council, pilot project
Funding: UNDP/GEF

15
What happened? A group of villages undertook a package of
SL measures, designed to regenerate and conserve the degraded rangelands upon which their community depends.
Community Organization Alternative Livestock and Livestock
Management Rural Energy Management Replanting Stabilization of sand dunes Creation of windbreaks Micro-lending for supplemental income generation
16
What are the outcome of the pilot project (results from evaluation report)
Community institutional structure created land-use master plans; oversight and mobilization structures
Rangeland rehabilitation measures implemented 5 km of sand dunes re-vegetated 195 km of windbreaks sheltering 130 farms Approximately 700 ha improved Livestock restocking
Community development underway 2 revolving funds 5 pastoral women’s groups focused on livestock
value-adding activities 5 new irrigated gardens and wells Grain storage and seed credit program

17
: Primary Assessment tool
The primary tool employed in this assessment is the sustainable livelihood impact assessment methods for assessing project impacts on target communities.
Objective: To measure the impact of the project intervention on the community coping/adaptive capacity through the employment of a range of data collection methods, a combination of quantitative and qualitative indicators.
Community’s coping and adaptive capacities in the face of climatic variability and extremes is used as proxy for its level of coping and adaptive capacity for future climate change

18
Use of DFID SL model and notion of the five capitals (natural, physical, human, social and financial:
Within the SL framework the project employed the Livelihood Assets Tracking (LAST) system to measure changes in coping and adaptive capacity.
Use of word pictures by household to assess their own vulnerability ,coping and adaptive capacity to a climate-related impact.
Consultation with communities to develop indicators of community resilience and construct word pictures.
Use of stratified sampling methods to ensure representation of a range of individuals and household circumstances
Methods used
19
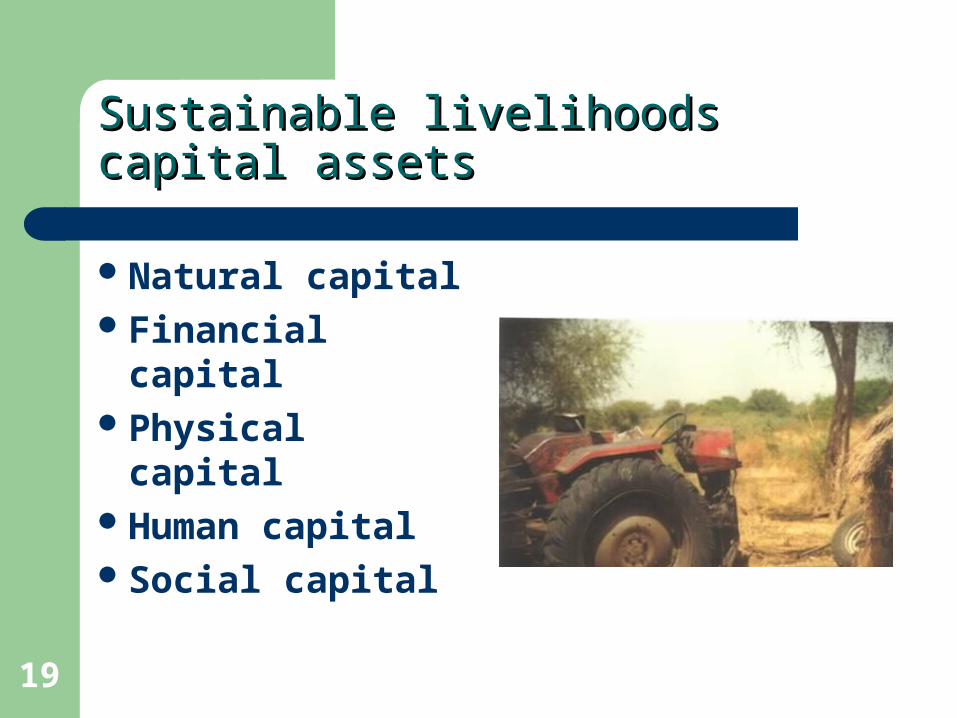
Sustainable livelihoods capital assetsSustainable livelihoods capital assets
Natural capitalFinancial capitalPhysical capitalHuman capitalSocial capital

20
Word pictures:
are descriptions of HH circumstances developed in a participatory manner with the community in question.
-Best case”
“worse case” snapshot.

21
Development of indicators
Two types of indicators were identified:1- Short-term indicators include:- economic - e.g., crop productivity, livestock
productivity, local grain reserves; - ecological - e.g., biomass, soil water balance; and - Social - e.g., household wealth and dislocation.
2- Longer-term resilience indicators which are more qualitative, aimed at capturing intangibles such as the level of economic, ecological and social stability within a system or community

22
Preliminary list of generic indicators includes:
Land degradation (slowed or reversed); Condition of the vegetation cover (stabilized or
improved); Soil and/or crop productivity (stabilized or increased); Water supply (stabilized or increased); Average income levels (stabilized or increased); Food stores (stabilized or increased); Out-migration (slowed, stabilized, or reversed);

23
Outline of qualitative & quantitative indicators for the SL
Natural Assets Rangeland productivity Rangeland carrying capacity Plant species composition Water sources, quality and use Access to Natural resources by marginal
community groups ( women, minority tribes, poor)

24
Productivity of Natural Assets
Average production per unit area of rangeland
No. of animals per unit area of rangeland Yield from main crops
Production of vegetables and fruits from women gardens

25
Physical assets
Management of water wells Maintenance of water pumps
Grain stores (capacity and accessibility) Grain mills (capacity and accessibility) Energy conservation techniques (improved
stoves) Effectiveness of management systems applied to
pasture, water, livestock etc…Availability of spare parts

26
Financial Assets
Income generating activities Income levels and stability Revolving funds /amount of credit granted to
individuals Savings Accessibility of vulnerable groups to credit
(women, poor and Kawahla

27
Human (household) Assets
Ownership of assets Skilled labors Housing type Access of marginal groups to education,
training and extension services

28
Social Assets indicators
Organizational set-up (local village committees)
Role of village committees in the decision making process.
Membership to organizations Sharing of responsibility

29
Access to services
Extension Health Education Training Veterinary services

30
Policies and Institutions
Government institutions and polices in relation to:
Taxes Market prices Incentives Land tenure Local level institutions NGOs

31
Risks
Changing government policies Out-migration by skilled people Encroachment by other tribes into the
project area Pressures on rangelands by intruding
nomads

32
Development of criteria and indicators around the capital assets
Development of criteria and indicators around the capital assets: Around each capital asset a set of criteria and indicators are developed as tabulated below:
Capital assets
Dimension Criteria Indicators
Productivity 1.Rangeland productivity 2.Carrying capacity 3.Forage production
Area of improved / rehabilitated rangeland -Animal units per average ha -Average ton of dry matter /ha per year
- Equity Access of marginal groups
to grazing allotments % of minorities (Kawahla) tribes with access to grazing allotments
Sustainability -Rangeland management -Sustainability of range land -Rangeland quality
-Effectiveness of management practices -% of agric. land been transferred into rangeland, Abundance of desirable plant species
Natural capital
Risks -Pressures on rangeland Frequency of nomads from other areas encroachment into the project RL.

33
Collecting data with WPsCollecting data with WPsApproach to survey/interviews:Approach to survey/interviews:
Use household circumstances during signal event as basis of
comparison; compare with circumstances during recent or hypothetical
event
Use assessment sheets (one for each capital) as basis of interview
questions. For example:“During the signal event (e.g., 1984 drought), what level of food stores did you have (in months)? Were they sufficient? If not, how great was the deficit (in months)?During the recent drought (post-SL activity) , what level of food stores did you have (in months)? Were they sufficient? If not, how great was the deficit (in months)?
On assessment sheet, record number associated with interviewee
responses to questions
From these responses, assemble word pictures for each interview

34
Resulting Word PicturesResulting Word PicturesResulting Word PicturesResulting Word Pictures
Pre-SL ActivityPost-SL Activity
• Little or no land; one or two month's food available from own land; quality of land is poor, having red soil with low fertility; land is located on a slope in such a position that rain water washes away the seed sown and the top soil and hence reduces its fertility; use of traditional seeds; some have given away land as collateral; no source of irrigation; no land for growing fodder for livestock; owns one or two livestock; no milk produced; low access to forest produce;
More of black fertile soil; more land; grows one's own fodder on one's own land; fertile land with more moisture retention power; more produce from land; grows and sells cash crops; grows vegetables; grows high yielding variety seeds; lends seeds to others; irrigation facilities available round the year; land is near the forest; access to forest produce; some have government permit to grow opium; has many fruit trees; availability of home grown food throughout the year; many livestock, high returns from livestock;
Adapted from Bond and Mukherjee (2002)
A word picture of household’s access to natural resources (natural A word picture of household’s access to natural resources (natural capital)capital)

35
Preparation of a livelihood assets status framework matrix:CASE STUDY ASSESSMENT SHEET: Natural Capital
Criteria IndicatorsWorst caseModerateBest case
Productivity: Rangelands
productivity
) Area of improved/ rehabilitated
rangelands
90% Degraded
Excellent >90%
rehabilitated
Carrying capacity
AU/ha/year 5-10 AU/ha/year
10 to 15 AU/ha/year
15 to 20 AU/ha/yea
r
>20
AU/ha/year

36
Productivity:Natural capital:
Sample of the results in graph form :
0
20
40
60
80
100
rehabilitatedland
carryingcapacity
forageproduction
Indicators
Sit
ua
tio
n o
f ea
ch i
nd
ica
tor
(%
)
Before After

37
Financial Capital
0
20
40
60
80
100
amount ofcredit grantedto individuals
incomesources
incomestability
incomesufficiency
Indicators
Sit
ua
tio
n
of
each
in
dic
ato
r (%
)
Before After

38
Human Capital
0
20
40
60
80
100
no. oftrainedCAHW
capacityof vet.
services
state ofeducation
state ofhealth
state oftraining
state ofextension
Indicators
Sit
uat
ion
of
each
In
dic
ator
(%
)
Before After

39
Physical Capital
0
20
40
60
80
100
no. ofestablishedgrain mills
no. ofestablishedgrain stores
no. of waterpumps
Indicators
Sit
ua
tio
n o
f ea
ch i
nd
ica
tor
(%)
Before After
40
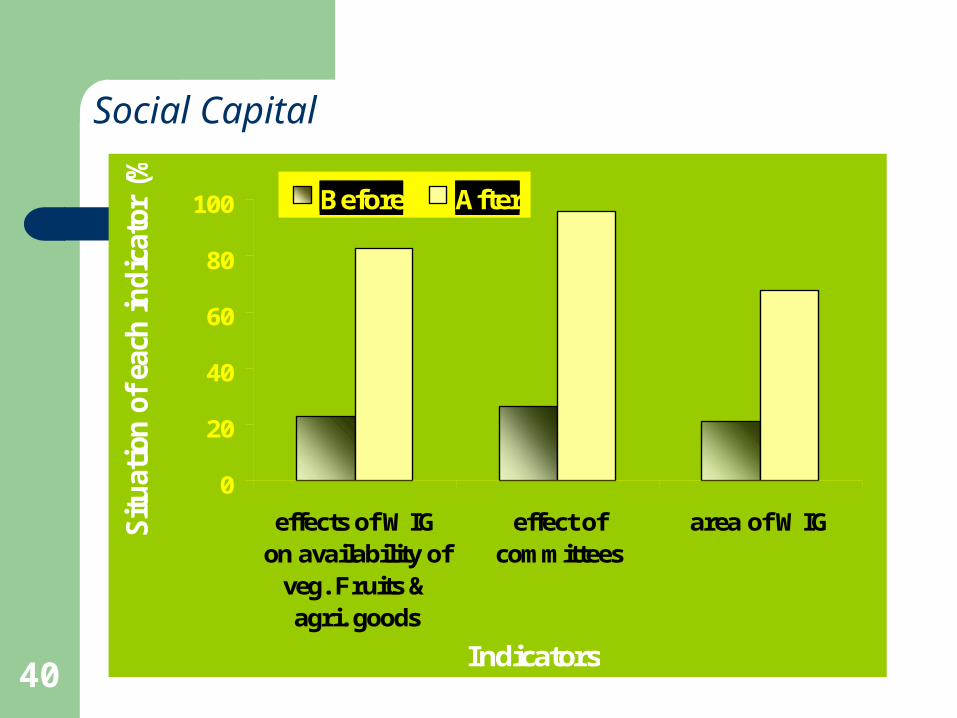
Social Capital
0
20
40
60
80
100
effects of WIGon availability of
veg. Fruits &agri. goods
effect ofcommittees
area of WIG
Indicators
Sit
uat
ion
of
each
in
dic
ator
(%
)
Before After

41
Sustainability:Natural Capital
0
20
40
60
80
100
transition fromagri. land tograzing land
application ofsustainable
grazing system
quality ofanimal
production
range landquality
Indicators
Situ
atio
n of
eac
h y
indi
cato
r (%
)
Before After

42
Financial Capital
0
20
40
60
80
100
availabilityof
information
suitability oflocal
institutions
effectivenessof credit
repayment
support ofcredit
systems
support ofgovernment
policy
Indicators
Sit
uat
ion
of
each
ind
icat
or (
%)
BeforeAfter

43
Human Capital
0
20
40
60
80
100
rate ofutilization of
improvedcharcoal stoves
% of farmerswho completely
abandonedcrop production
rate ofadoption of
building mudwalled houses
availability ofdrugs (human,
animals)
Indicators
Situ
atio
n of
eac
h in
dica
tor
(%)
Before After

44
Physical Capital
0
20
40
60
80
100
effectivemanagement
system applied towater wells
no. of peopletrained on
maintenance forwater pumps
availability of sparparts
Indicators
Sit
uat
ion
of
each
ind
icat
or
(%)
Before After

45
Social Capital
0
20
40
60
80
100
use of mudwalledpublic
building
governmentsupport to
localinstitutions
relationbetween
committees& local
governmentinstitutions
capacity ofcommitteesto perform
its task
Indicators
Sit
uat
ion
of
each
ind
icat
or
(%)
BeforeAfter

46
Equity
Chances of marginalized groups (women, poor, kawahla tribe) increased significantly particularly with regard to:
access to grazing land access to credit access to social services access to training participation in decision-making

47
Overall change in the resilience of the five capitals
Before After Change %Change Natural 36 76 40 75 Physical 30 66 36 65 Financial 22 72 50 71 Human 24 72 48 71 Social 32 74 42 73
Total 29 72 43 8
48
Policies and institutions
The micro-policies in the project area were influenced by the following bodies:
(a) Committees- Sustainability of activities (b) NGOs (SECS &CARE International)-Awareness (C) Traditional leaders: The Traditional
administration played major role in natural resources management for very long period in different parts of Sudan particularly in traditional areas (Social security , Nafir etc..)

49
Conclusions
Tapping the SL Approach: What can it do for adaptation?
Using this as a tool in adaptation assessment can help to: Enable national planning processes to effectively consider
the most vulnerable groups; articulate unique local vulnerabilities
Identify locally-relevant resilience-building options Build understanding of micro- and macro-level enabling
conditions for adaptation Build local adaptation awareness and engage local NGOs
(potential adaptation project implementers

50
Thanks for your patience