


Languages
Pages
Legal


1 May 2010
Unconventional Gas- Shale gas, tight gas and coal seam gas
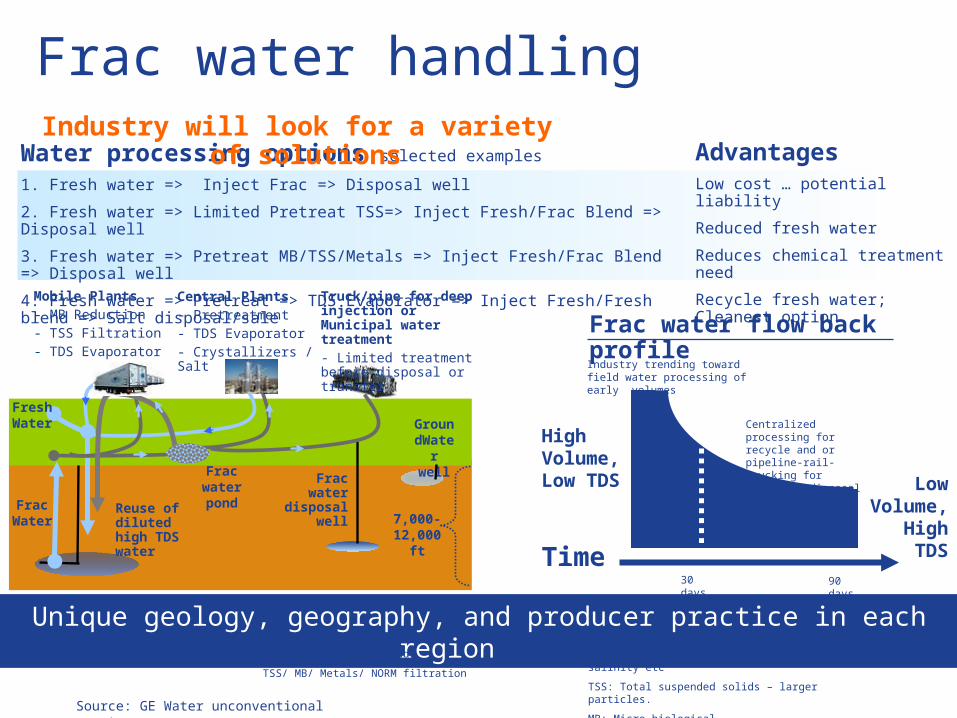
Frac water handling
Unique geology, geography, and producer practice in each region
Source: GE Water unconventional gas team
Water processing options selected examples
1. Fresh water => Inject Frac => Disposal well
2. Fresh water => Limited Pretreat TSS=> Inject Fresh/Frac Blend => Disposal well
3. Fresh water => Pretreat MB/TSS/Metals => Inject Fresh/Frac Blend => Disposal well
4. Fresh water => Pretreat => TDS Evaporator => Inject Fresh/Fresh blend => Salt disposal/sale
7,000-12,000
ft
Frac Water
Frac water pond
Fresh Water
Central Plants - Pretreatment- TDS Evaporator- Crystallizers / Salt
Mobile Plants - MB Reduction- TSS Filtration- TDS Evaporator
Reuse of diluted high TDS water
Frac water
disposal well
Truck/pipe for deep injection or Municipal water treatment- Limited treatment before disposal or transfer
High Volume, Low TDS
Low Volume
, High TDSTime
AdvantagesLow cost … potential liability
Reduced fresh water
Reduces chemical treatment need
Recycle fresh water; Cleanest option
GroundWat
erwell
Frac water flow back profile
TDS: Total dissolved solids – salinity etc
TSS: Total suspended solids – larger particles.
MB: Micro biological
Pretreatment can include
TSS/ MB/ Metals/ NORM filtration
Industry trending toward field water processing of early volumes
Centralized processing for recycle and or pipeline-rail- trucking for injection disposal
Industry will look for a variety of solutions
30 days
90 days
3 May 2010
Source Water Filtration- Mobile Ultrafiltration
4
Benefits to Filtration
Effectively removes TSS, Iron, Mn and organics including SRB’s and APB’s.
Reduces or eliminates the need for toxic biocides in source water for hydraulic fracturing. May reduce other chemicals as well.
Potential for a better frac job given the cleaner water.

5
Identified Need:•TSS Reduction
•Elimination/Minimization of Chemicals
•Mobile
•4200 GPM
Conventional Pretreatment
0.02-0.1 μm SRB/APB Range
6
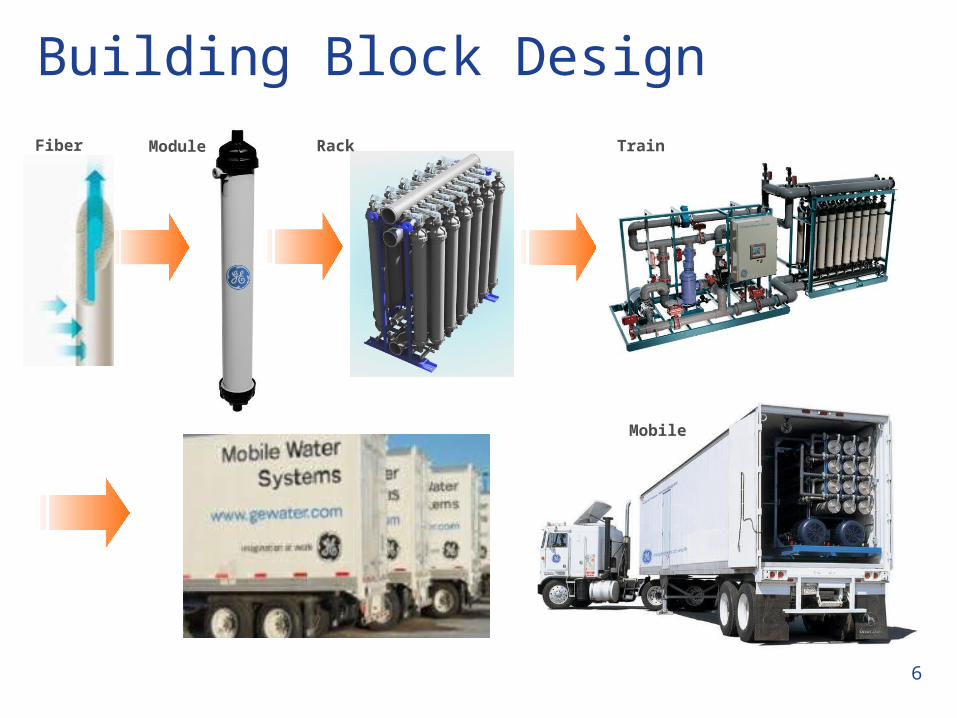
Building Block DesignFiber Module Rack Train
Mobile
7
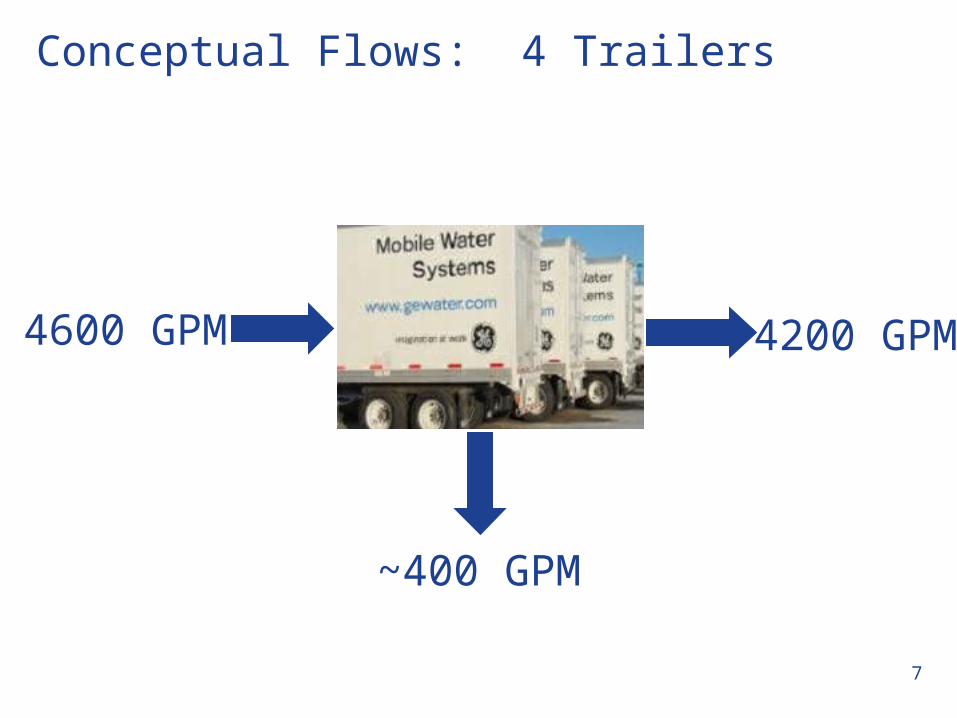
Conceptual Flows: 4 Trailers
4600 GPM 4200 GPM
~400 GPM
8
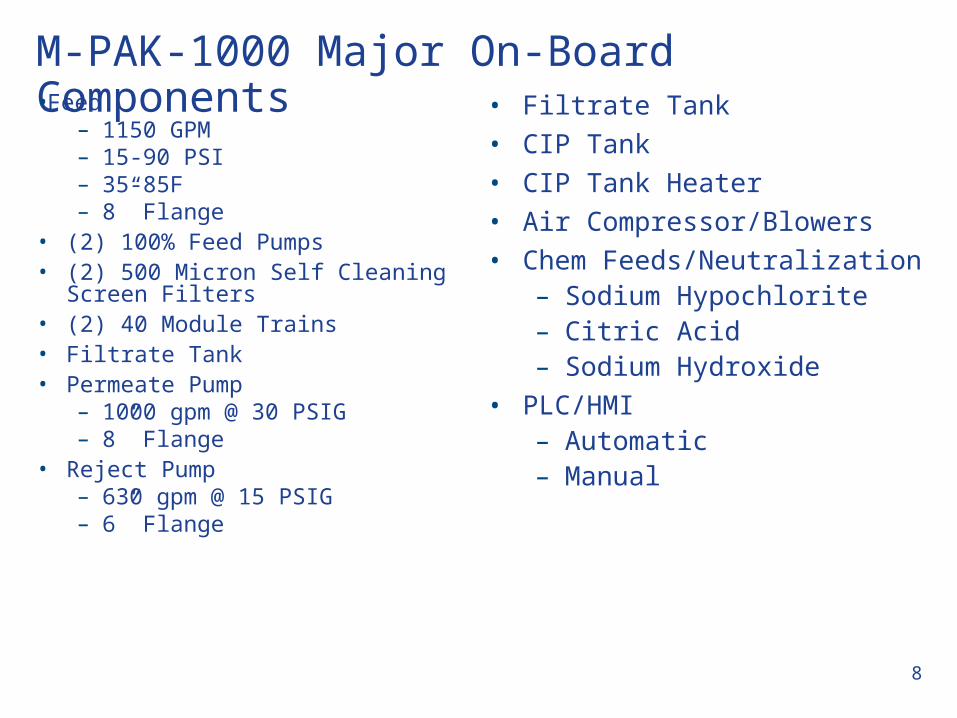
M-PAK-1000 Major On-Board Components•Feed:
– 1150 GPM– 15-90 PSI– 35-85F– 8” Flange
• (2) 100% Feed Pumps• (2) 500 Micron Self Cleaning
Screen Filters• (2) 40 Module Trains• Filtrate Tank• Permeate Pump
– 1000 gpm @ 30 PSIG– 8” Flange
• Reject Pump– 630 gpm @ 15 PSIG– 6” Flange
• Filtrate Tank• CIP Tank• CIP Tank Heater• Air Compressor/Blowers• Chem Feeds/Neutralization
– Sodium Hypochlorite– Citric Acid– Sodium Hydroxide
• PLC/HMI– Automatic– Manual
9 May 2010
Produced water recycling- Mobile Evaporation

10 GE Water & Process Technologies Confidential
August 2010
Marcellus
Haynesville
FayettevilleBarnett
what drives water processing choice?
Fayetteville ShaleFrac Water Volumes: 0.5MM-2 MM GallonsWater Flowback Rates: 30% initial30 days, balance over 5 Yr @ 800gal-80gal/dayWater Quality: 13,000 (mg/l TDS)CTWT: Truck/pipeline to Texas for deep well injection disposal
Barnett ShaleFrac Water Volumes: 0.8MM-12 MM GallonsWater Flowback Rates: 50% initial 30 days balance over 6 Yr @ 1200gal-80gal/dayWater Quality: 82,000 (mg/l TDS and climbingCTWT: Deep well injection disposal
Haynesville ShaleFrac Water Volumes: 3MM-8MM GallonsWater Flowback Rates: 30%-50% first 30 days, balance >1Yr @ 1200gal/dayWater Quality: 100,000 (mg/l TDS)CTWT: Truck/ pipeline to Texas for deep well injection disposal
Marcellus ShaleFrac Water Volumes: 0.5MM-12 MM GallonsWater Flowback Rates: 20%-40% first 25 days balance >1 Yr 1200gal-70gal/dayWater Quality: 125,000 (mg/l TDS)CTWT: Options of dilution or deep well injection disposal determined by regulation and cost. Recycle options needed.
CTWT: Current Typical Water Treatment Source: GE Water Unconventional Gas Team
• Availability of fresh water• Quality of flowback water• Proximity-availability of disposal wells/sites• Environmental sensitivity of region
Multiple key factors in shale playsWater characteristics
of key shales

11 GE Water & Process Technologies Confidential
August 2010
water quality to design basis(SW Marcellus)
High Volume, Low TDS
Low Volume, High TDS
Frac water flow back profile
30 days 90 days
GE analysis utilized volume weighted averages of individual wells and regions

12 GE Water & Process Technologies Confidential
August 2010
determine design basis
The specific objectives of the Marcellus test program involved four areas:
1. Develop process design basis
2. Evaluate feed pretreatment requirements
3. Identify optimum evaporator design parameterso
Maximum concentration factor (CF)
o Boiling point rise (BPR)o Tendencies for foaming,
fouling, scalingo Distillate composition
4. Evaluate Crystallizer Designs & Performanceo Boiling point rise (BPR)o Foaming, foulingo Salt purification /
separation
13 GE Water & Process Technologies Confidential
August 2010
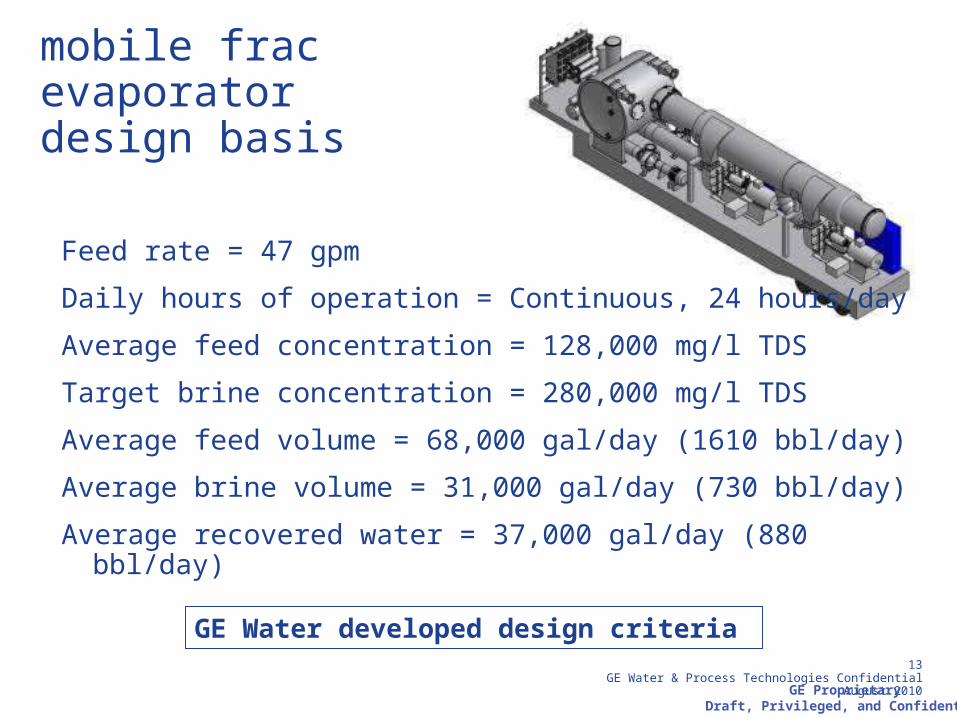
mobile frac evaporator design basis
Feed rate = 47 gpm
Daily hours of operation = Continuous, 24 hours/day
Average feed concentration = 128,000 mg/l TDS
Target brine concentration = 280,000 mg/l TDS
Average feed volume = 68,000 gal/day (1610 bbl/day)
Average brine volume = 31,000 gal/day (730 bbl/day)
Average recovered water = 37,000 gal/day (880 bbl/day)
GE Water developed design criteria
GE ProprietaryDraft, Privileged, and Confidential
14 GE Water & Process Technologies Confidential
August 2010
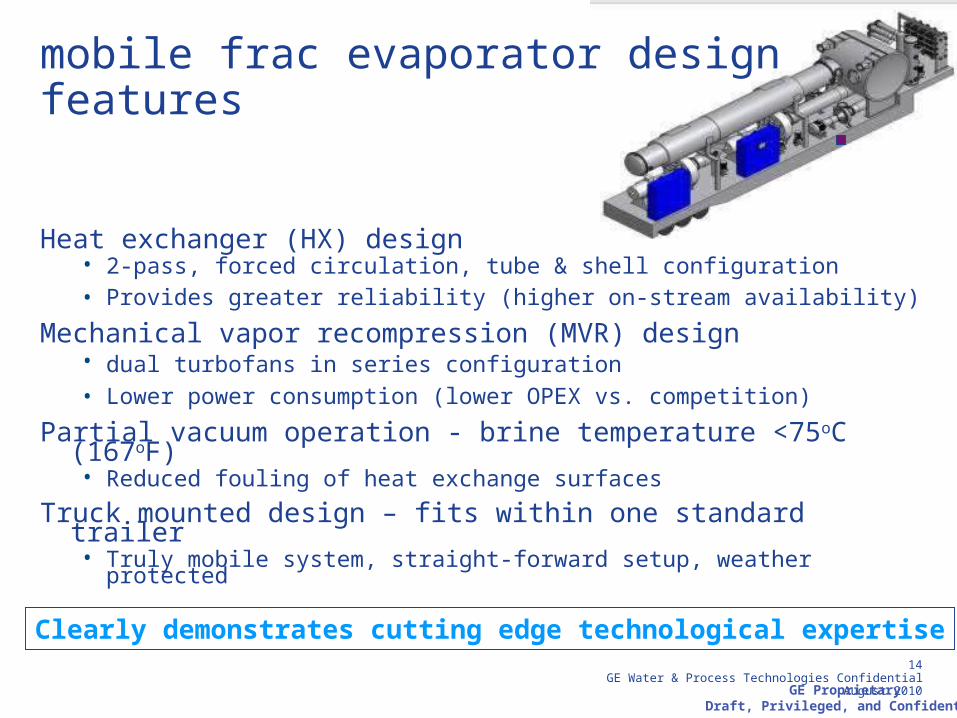
mobile frac evaporator design features
Heat exchanger (HX) design • 2-pass, forced circulation, tube & shell configuration• Provides greater reliability (higher on-stream availability)
Mechanical vapor recompression (MVR) design • dual turbofans in series configuration • Lower power consumption (lower OPEX vs. competition)
Partial vacuum operation - brine temperature <75oC (167oF)• Reduced fouling of heat exchange surfaces
Truck mounted design – fits within one standard trailer• Truly mobile system, straight-forward setup, weather protected
Clearly demonstrates cutting edge technological expertise
GE ProprietaryDraft, Privileged, and Confidential
15 May 2010
Disposal Well Filtration- One Pass Filter

16GE Customer Presentation
04/19/23
Membrane Technology
Spiral wound/tubular: best suited to NF/RO
Hollow fiber: best suited for
MF/UF
Sand filtrationSand filtration
MicrofiltrationMicrofiltration
UltrafiltrationUltrafiltration
NanofiltrationNanofiltration
Reverse OsmosisReverse Osmosis
0.0001 0.001 0.01 0.1 1 10 100mm
Flat plate
Reverse Osmosis
Increasing pressure requirements
One Pass
17 May 2010
GE Water & Process TechnologySalt Water Disposal Optimization
• Benefits Include• Minimizes Cost of tank
cleaning and maintenance due to the accumulation of solids in the tanks.
• Minimizes Erosion due to pumping high TSS waters.
• Maximizes Performance and life expectancy of the disposal well.
• Reduced Chemical Demand• Minimizes Overall Operating
Cost
Combines Physical Separation & Chemistry Optimization to reduce the Total Operating Cost of Salt Water Disposal Well Operations:
18GE Customer Presentation
04/19/23
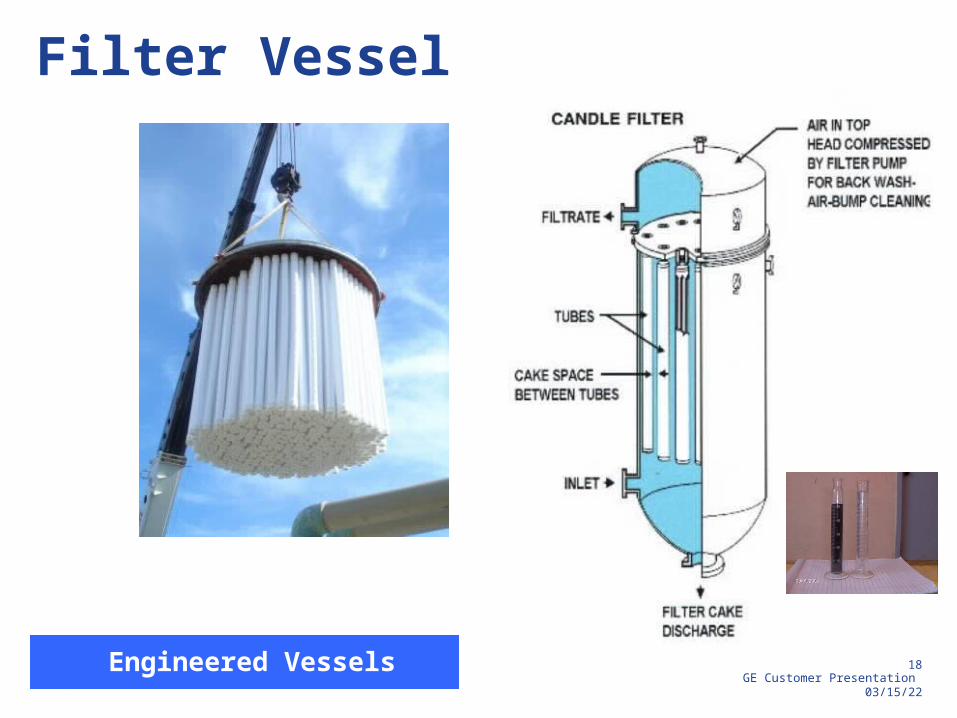
Filter Vessel
Engineered Vessels
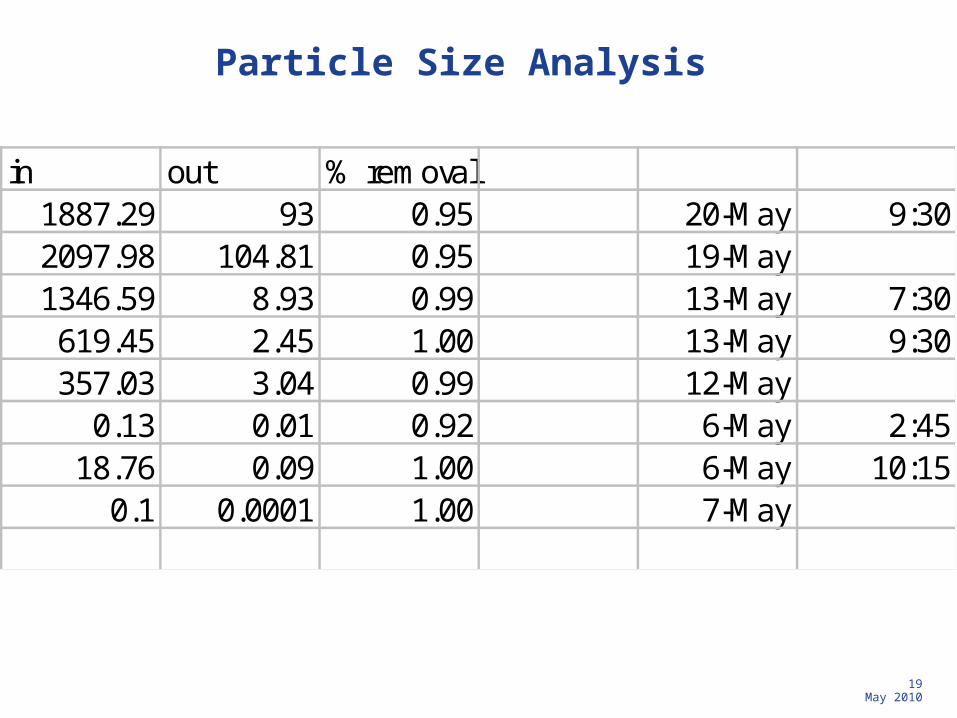
19 May 2010
in out % removal1887.29 93 0.95 20-May 9:302097.98 104.81 0.95 19-May1346.59 8.93 0.99 13-May 7:30619.45 2.45 1.00 13-May 9:30357.03 3.04 0.99 12-May
0.13 0.01 0.92 6-May 2:4518.76 0.09 1.00 6-May 10:15
0.1 0.0001 1.00 7-May
Particle Size Analysis

20 May 2010
Date Location SRB APB
5/5/2009 Tk Inlet 4 45/6/2009 Tk Inlet 4 4
Filter in 4 4Filter out 0 1
5/7/2009 Non AR inlet 4 4AR inlet 4 4Filter Out 0 1Inlet SWD 4 4
5/8/2009 Tk Inlet 2 8AR inlet 8 8SWD inlet 4 4
5/9/2009 SWD in 8 75/12/2009 AR inlet 4 5
Filter inlet 2 5Filter out 0 1SWD inlet 4 7
5/13/2009 AR inlet 2 2Filter inlet 2 2Filter out 0 2
5/14/2009 M-1 test 0 25/19/2009 Gun Barrel in 1 7
Filter in 2 2Filter out 0 2SWD in 1 8
5/21/2009 Tk inlet 0 5
Microbiological Testing
Top Related