


Languages
Pages
Legal


1
For: Greater Yakima Chamber of Commerce
Donald W. MeseckRegional Labor Economist
February 9, 2015
Yakima County Economy – 2014 in Review

2
Unemployment rates and labor force trends in Yakima County through 2014
Slides 3-6
Quarterly Census of Employment and Wage (QCEW) summaries for Yakima County in 2013
Slides 7-11
Nonfarm employment trends through 2014 Slides 12-18
Employment projections for Yakima County Slides 19-20
Summary and Questions Slides 21-22
Today’s presentation

3
Annual Average Unemployment Rates in Yakima County and in Washington
from 2005-2014
4
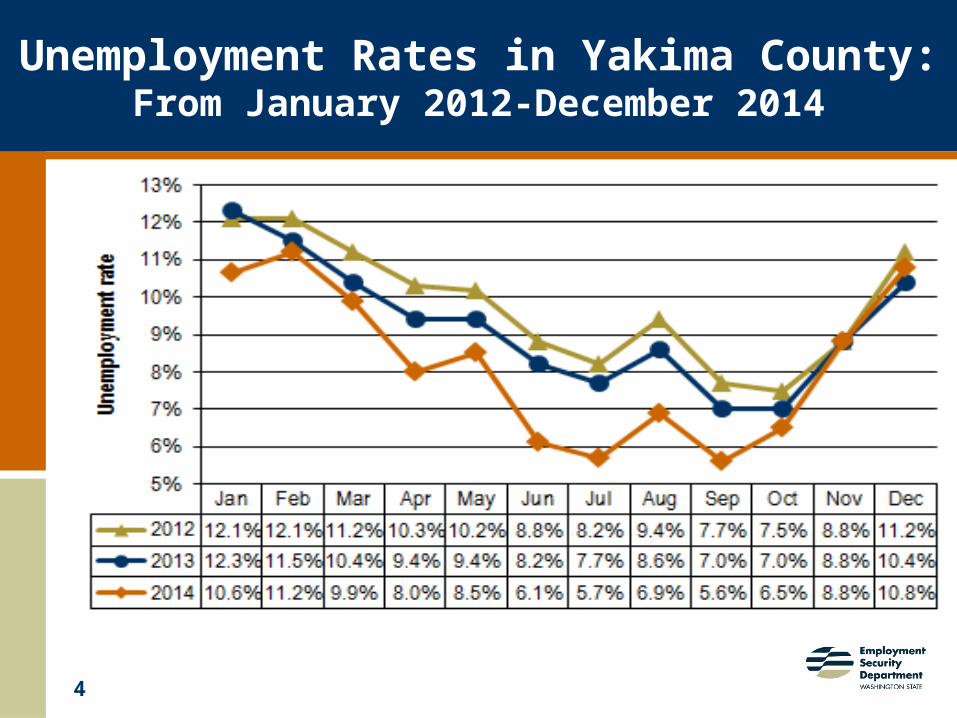
Unemployment Rates in Yakima County:From January 2012-December 2014
5
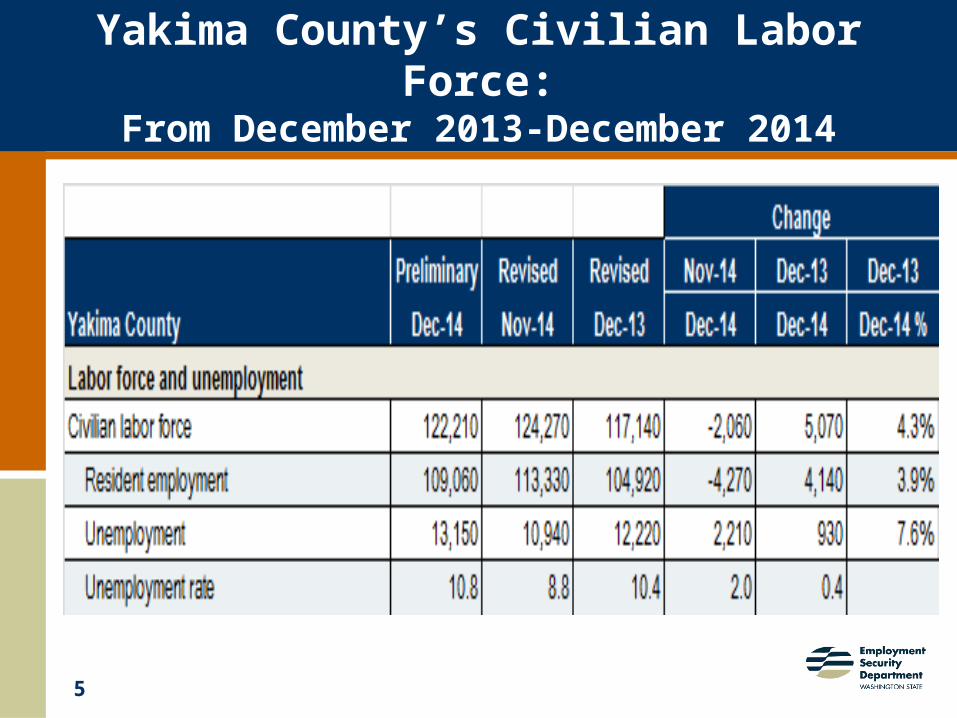
Yakima County’s Civilian Labor Force:From December 2013-December 2014

6
Labor Force Changes in Yakima County and Washington in the last twelve months

7
Analyzed county-level QCEW data for 22 industries/sectors
19 private-industry sectors Three government sectors
NAICS 11 (Agriculture, forestry and fishing) Federal government
NAICS 21 (Mining) State government
NAICS 22 (Utilities) Local government
NAICS 23 (Construction)
NAICS 31-33 (Manufacturing) * North American Industry Classification System (NAICS)
NAICS 42 (Wholesale trade)
NAICS 44-45 (Retail trade)
NAICS 48-49 (Transportation and warehousing)
NAICS 51 (Information)
NAICS 52 (Finance and insurance)
NAICS 53 (Real estate and rentals)
NAICS 54 (Professional and business services)
NAICS 55 (Management of companies)
NAICS 56 (Administrative and waste services)
NAICS 61 (Private education services)
NAICS 62 (Health services)
NAICS 71 (Arts, entertainment and recreation)
NAICS 72 (Accommodation and food services) QCEW is the Quarterly Census of Employment and Wages, a
NAICS 81 (Other services) U.S. Bureau of Labor Statistics data set.

8
Yakima County: Total covered employment from 2004-2013
Source: QCEW Data

9
Yakima County: Top 5 industries by employment in 2013
Source: QCEW Data

10
Yakima County: Top 5 industries by wages in 2013
Source: QCEW Data

11
Yakima County in 2013: Summary of “Top 5” industries
Total covered wages = $3.50 billion
Average annual employment = 103,585
Average annual wage = $33,767
(Washington state average annual wage = $53,030)
Industry Percent of jobs(in Yakima County)
Percent of wages(in Yakima County)
Agriculture 26.1 19.4
Health services 12.4 15.8
Local government 12.4 15.2
Retail trade 9.8 7.8
Manufacturing 7.9 9.7

12
Yakima County: Total nonfarm employment from 2005-2014
Source: CES Data, LMPA, ESD

13
Yakima County and Washington: Nonfarm employment changes
during the last 20 quarters (i.e., 2010-2014)

14
Yakima County and Washington: Nonfarm employment changes
during the last 10 years (i.e., 2005-2014)
15
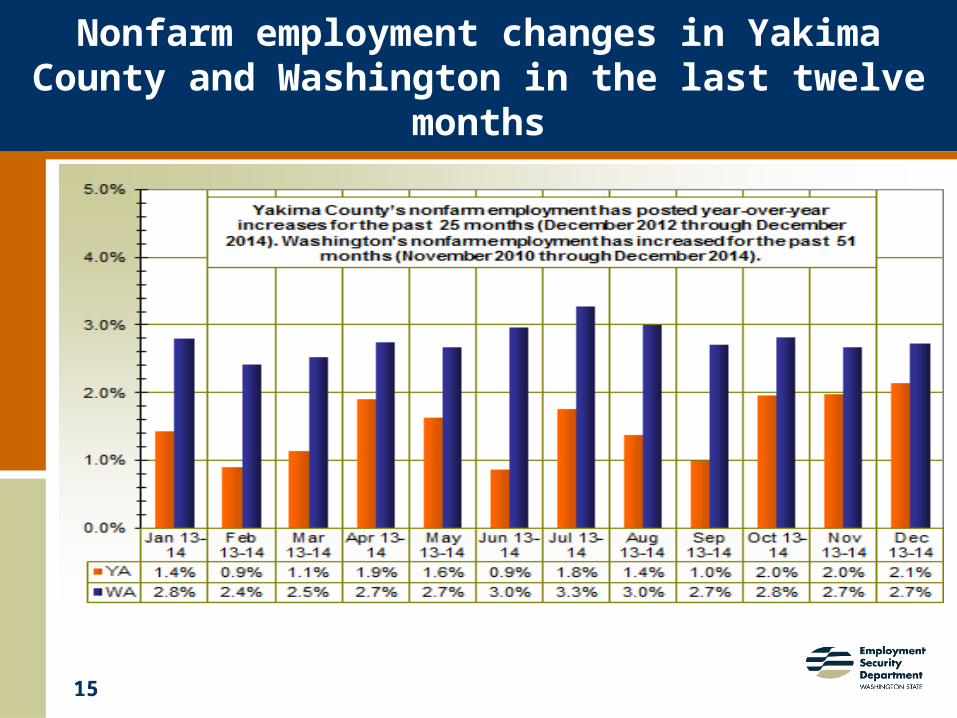
Nonfarm employment changes in Yakima County and Washington in the last twelve months

16
Yakima County - Nonfarm job growth in major industries from 2013 to 2014
17
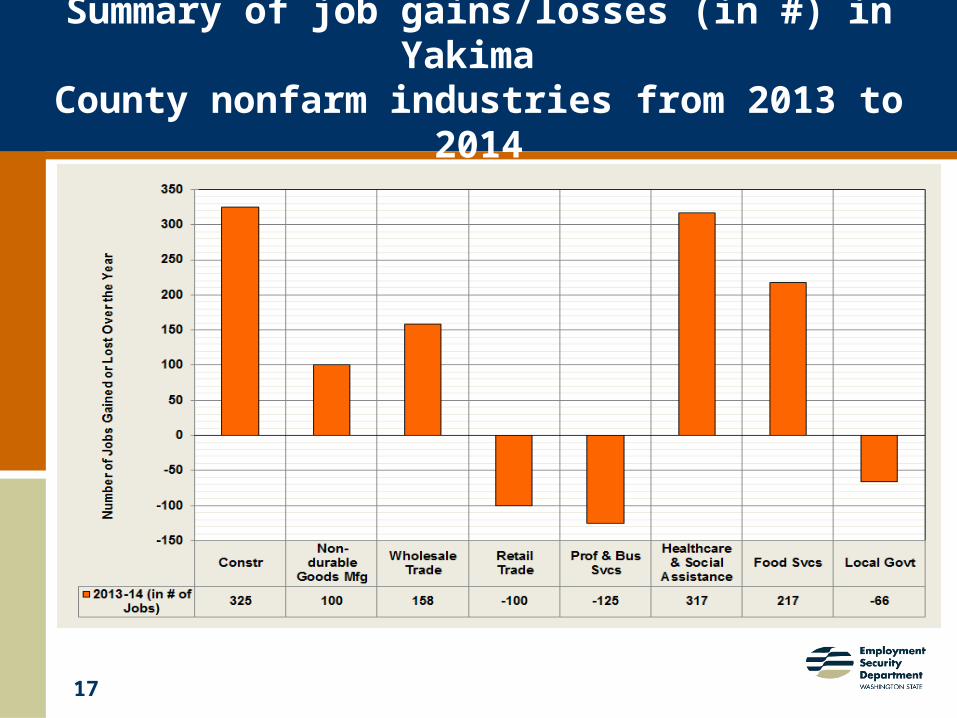
Summary of job gains/losses (in #) in Yakima County nonfarm industries from 2013 to 2014

18
Summary of job gains/losses (in %) in Yakima County nonfarm industries from 2013 to 2014

19
Projected versus actual nonfarm job growth in Yakima County from 1st-4th Quarters 2014

20
Projected nonfarm job growth in Yakima County for 1st-4th Quarters 2015

21
• The not seasonally adjusted unemployment rate declined from 9.2 in 2013 to 8.1 percent in 2014.
• Yakima County’s Civilian Labor Force (CLF) stabilized at 124,360 residents in 2013 and 2014. (The CLF contracted 1.1 percent between 2012 and 2013.)
• Nonfarm employment averaged 80,800 in 2014; adding 1,200 jobs since 2013, a 1.5 percent increase.
• Construction, healthcare, wholesale trade, and food services accounted for approximately 80 percent of the 1,200-job increase countywide during 2014.
Nonfarm job growth in Yakima County during 2014 was the best since 2006

22
Yakima County – 2014 in Review Questions?
Donald W. MeseckRegional Labor Economist for Adams, Chelan, Douglas, Grant, Kittitas, Okanogan, and Yakima Counties
Labor Market and Performance Analysis (LMPA)Employment Security Department
Address: 306 Division Street, Yakima, WA 98902Phone: (509) 573-4564
Email: [email protected]: https://fortress.wa.gov/esd/employment
Top Related